Yup'ik 1 or more Vehicles in Household
COMPARE
Yup'ik
Select to Compare
1 or more Vehicles in Household
Yup'ik 1 or more Vehicles in Household
58.4%
1+ VEHICLES AVAILABLE
0.0/ 100
METRIC RATING
347th/ 347
METRIC RANK
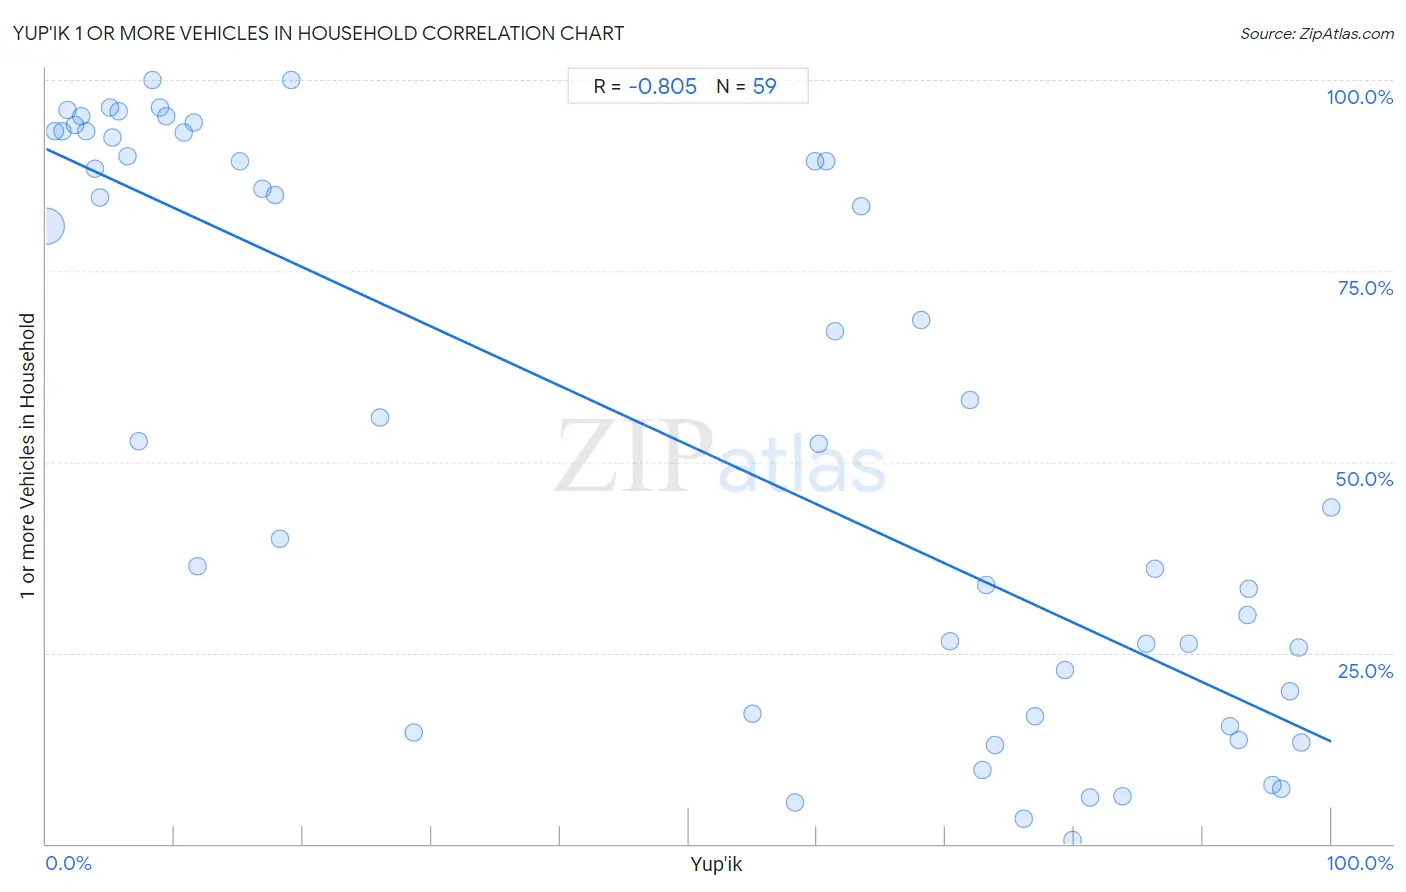
Yup'ik 1 or more Vehicles in Household Correlation Chart
The statistical analysis conducted on geographies consisting of 39,949,066 people shows a very strong negative correlation between the proportion of Yup'ik and percentage of households with 1 or more vehicles available in the United States with a correlation coefficient (R) of -0.805 and weighted average of 58.4%. On average, for every 1% (one percent) increase in Yup'ik within a typical geography, there is a decrease of 0.78% in percentage of households with 1 or more vehicles available.
It is essential to understand that the correlation between the percentage of Yup'ik and percentage of households with 1 or more vehicles available does not imply a direct cause-and-effect relationship. It remains uncertain whether the presence of Yup'ik influences an upward or downward trend in the level of percentage of households with 1 or more vehicles available within an area, or if Yup'ik simply ended up residing in those areas with higher or lower levels of percentage of households with 1 or more vehicles available due to other factors.
Demographics Similar to Yup'ik by 1 or more Vehicles in Household
In terms of 1 or more vehicles in household, the demographic groups most similar to Yup'ik are Immigrants from Grenada (62.7%, a difference of 7.2%), Immigrants from St. Vincent and the Grenadines (64.7%, a difference of 10.7%), Immigrants from Dominican Republic (68.6%, a difference of 17.4%), British West Indian (70.4%, a difference of 20.4%), and Immigrants from Guyana (70.6%, a difference of 20.7%).
| Demographics | Rating | Rank | 1 or more Vehicles in Household |
| Immigrants from Ecuador | 0.0 /100 | #333 | Tragic 76.2% |
| Immigrants from Bangladesh | 0.0 /100 | #334 | Tragic 74.3% |
| Barbadians | 0.0 /100 | #335 | Tragic 74.0% |
| Vietnamese | 0.0 /100 | #336 | Tragic 73.8% |
| Immigrants from Uzbekistan | 0.0 /100 | #337 | Tragic 73.4% |
| Inupiat | 0.0 /100 | #338 | Tragic 71.5% |
| Guyanese | 0.0 /100 | #339 | Tragic 70.8% |
| Dominicans | 0.0 /100 | #340 | Tragic 70.7% |
| Immigrants from Barbados | 0.0 /100 | #341 | Tragic 70.6% |
| Immigrants from Guyana | 0.0 /100 | #342 | Tragic 70.6% |
| British West Indians | 0.0 /100 | #343 | Tragic 70.4% |
| Immigrants from Dominican Republic | 0.0 /100 | #344 | Tragic 68.6% |
| Immigrants from St. Vincent and the Grenadines | 0.0 /100 | #345 | Tragic 64.7% |
| Immigrants from Grenada | 0.0 /100 | #346 | Tragic 62.7% |
| Yup'ik | 0.0 /100 | #347 | Tragic 58.4% |
Yup'ik 1 or more Vehicles in Household Correlation Summary
| Measurement | Yup'ik Data | 1 or more Vehicles in Household Data |
| Minimum | 0.022% | 0.41% |
| Maximum | 100.0% | 100.0% |
| Range | 100.0% | 99.6% |
| Mean | 47.3% | 54.2% |
| Median | 59.8% | 52.7% |
| Interquartile 25% (IQ1) | 8.3% | 17.0% |
| Interquartile 75% (IQ3) | 81.2% | 92.4% |
| Interquartile Range (IQR) | 72.9% | 75.4% |
| Standard Deviation (Sample) | 37.0% | 35.7% |
| Standard Deviation (Population) | 36.7% | 35.4% |
Correlation Details
| Yup'ik Percentile | Sample Size | 1 or more Vehicles in Household |
[ 0.0% - 0.5% ] 0.022% | 38,685,806 | 80.8% |
[ 0.5% - 1.0% ] 0.66% | 261,223 | 93.4% |
[ 1.0% - 1.5% ] 1.22% | 183,190 | 93.2% |
[ 1.5% - 2.0% ] 1.66% | 92,710 | 96.0% |
[ 2.0% - 2.5% ] 2.28% | 95,408 | 94.1% |
[ 2.5% - 3.0% ] 2.77% | 56,885 | 95.2% |
[ 3.0% - 3.5% ] 3.10% | 321,211 | 93.3% |
[ 3.5% - 4.0% ] 3.76% | 24,258 | 88.4% |
[ 4.0% - 4.5% ] 4.16% | 27,469 | 84.7% |
[ 4.5% - 5.0% ] 4.95% | 31,565 | 96.5% |
[ 5.0% - 5.5% ] 5.12% | 59,649 | 92.4% |
[ 5.5% - 6.0% ] 5.67% | 3,087 | 95.9% |
[ 6.0% - 6.5% ] 6.33% | 38,793 | 90.0% |
[ 7.0% - 7.5% ] 7.18% | 1,588 | 52.7% |
[ 8.0% - 8.5% ] 8.26% | 109 | 100.0% |
[ 8.5% - 9.0% ] 8.88% | 439 | 96.3% |
[ 9.0% - 9.5% ] 9.31% | 1,707 | 95.2% |
[ 10.5% - 11.0% ] 10.71% | 2,027 | 93.2% |
[ 11.0% - 11.5% ] 11.49% | 383 | 94.4% |
[ 11.5% - 12.0% ] 11.76% | 51 | 36.4% |
[ 15.0% - 15.5% ] 15.07% | 836 | 89.4% |
[ 16.5% - 17.0% ] 16.84% | 95 | 85.7% |
[ 17.5% - 18.0% ] 17.78% | 90 | 85.0% |
[ 18.0% - 18.5% ] 18.20% | 912 | 40.0% |
[ 19.0% - 19.5% ] 19.11% | 450 | 100.0% |
[ 25.5% - 26.0% ] 25.96% | 235 | 55.8% |
[ 28.5% - 29.0% ] 28.57% | 630 | 14.5% |
[ 54.5% - 55.0% ] 54.98% | 1,768 | 17.0% |
[ 58.0% - 58.5% ] 58.30% | 1,602 | 5.3% |
[ 59.5% - 60.0% ] 59.78% | 92 | 89.3% |
[ 60.0% - 60.5% ] 60.14% | 715 | 52.4% |
[ 60.5% - 61.0% ] 60.74% | 2,175 | 89.3% |
[ 61.0% - 61.5% ] 61.34% | 551 | 67.1% |
[ 63.0% - 63.5% ] 63.45% | 2,577 | 83.4% |
[ 68.0% - 68.5% ] 68.12% | 6,312 | 68.5% |
[ 70.0% - 70.5% ] 70.36% | 830 | 26.5% |
[ 71.5% - 72.0% ] 71.84% | 8,157 | 58.1% |
[ 72.5% - 73.0% ] 72.89% | 760 | 9.6% |
[ 73.0% - 73.5% ] 73.15% | 596 | 33.8% |
[ 73.5% - 74.0% ] 73.79% | 1,442 | 12.9% |
[ 76.0% - 76.5% ] 76.04% | 1,828 | 3.3% |
[ 76.5% - 77.0% ] 76.99% | 843 | 16.7% |
[ 79.0% - 79.5% ] 79.27% | 2,316 | 22.8% |
[ 79.5% - 80.0% ] 79.87% | 2,544 | 0.41% |
[ 81.0% - 81.5% ] 81.19% | 1,308 | 6.1% |
[ 83.5% - 84.0% ] 83.77% | 616 | 6.2% |
[ 85.5% - 86.0% ] 85.63% | 5,358 | 26.2% |
[ 86.0% - 86.5% ] 86.29% | 992 | 36.0% |
[ 88.5% - 89.0% ] 88.91% | 3,389 | 26.2% |
[ 92.0% - 92.5% ] 92.11% | 190 | 15.4% |
[ 92.5% - 93.0% ] 92.76% | 4,614 | 13.6% |
[ 93.0% - 93.5% ] 93.49% | 614 | 29.9% |
[ 93.5% - 94.0% ] 93.59% | 234 | 33.3% |
[ 95.0% - 95.5% ] 95.40% | 3,128 | 7.7% |
[ 96.0% - 96.5% ] 96.15% | 1,144 | 7.2% |
[ 96.5% - 97.0% ] 96.77% | 62 | 20.0% |
[ 97.0% - 97.5% ] 97.43% | 778 | 25.7% |
[ 97.5% - 98.0% ] 97.67% | 430 | 13.3% |
[ 99.5% - 100.0% ] 100.00% | 295 | 44.0% |