Sallisaw, OK Map & Demographics
Sallisaw Map
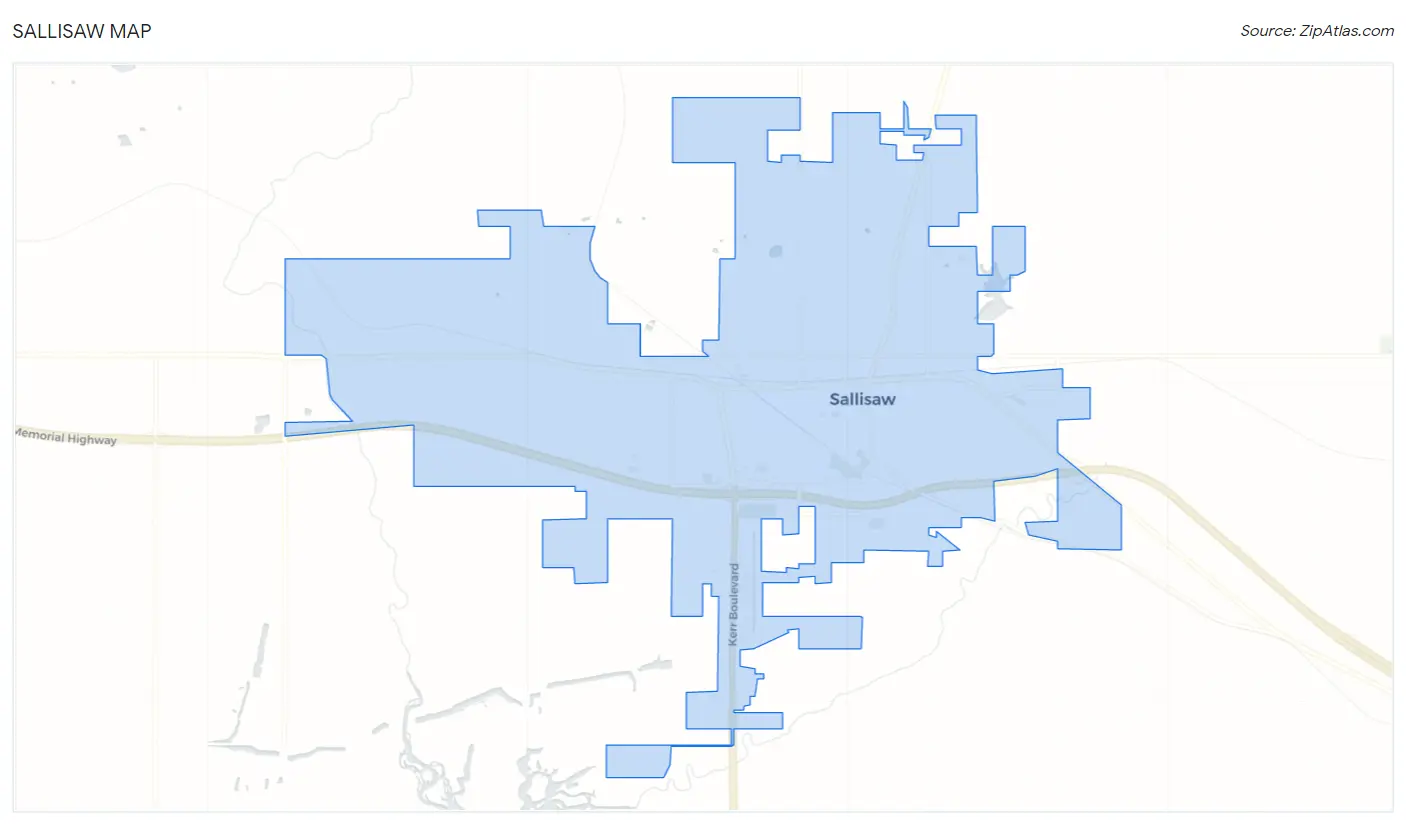
Sallisaw Overview
$21,330
PER CAPITA INCOME
$57,669
AVG FAMILY INCOME
$44,310
AVG HOUSEHOLD INCOME
42.3%
WAGE / INCOME GAP [ % ]
57.7¢/ $1
WAGE / INCOME GAP [ $ ]
$11,044
FAMILY INCOME DEFICIT
0.47
INEQUALITY / GINI INDEX
8,524
TOTAL POPULATION
4,091
MALE POPULATION
4,433
FEMALE POPULATION
92.29
MALES / 100 FEMALES
108.36
FEMALES / 100 MALES
35.1
MEDIAN AGE
3.4
AVG FAMILY SIZE
2.7
AVG HOUSEHOLD SIZE
3,274
LABOR FORCE [ PEOPLE ]
52.5%
PERCENT IN LABOR FORCE
6.4%
UNEMPLOYMENT RATE
Sallisaw Zip Codes
Sallisaw Area Codes
Income in Sallisaw
Income Overview in Sallisaw
Per Capita Income in Sallisaw is $21,330, while median incomes of families and households are $57,669 and $44,310 respectively.
| Characteristic | Number | Measure |
| Per Capita Income | 8,524 | $21,330 |
| Median Family Income | 1,991 | $57,669 |
| Mean Family Income | 1,991 | $65,772 |
| Median Household Income | 3,132 | $44,310 |
| Mean Household Income | 3,132 | $57,215 |
| Income Deficit | 1,991 | $11,044 |
| Wage / Income Gap (%) | 8,524 | 42.27% |
| Wage / Income Gap ($) | 8,524 | 57.73¢ per $1 |
| Gini / Inequality Index | 8,524 | 0.47 |
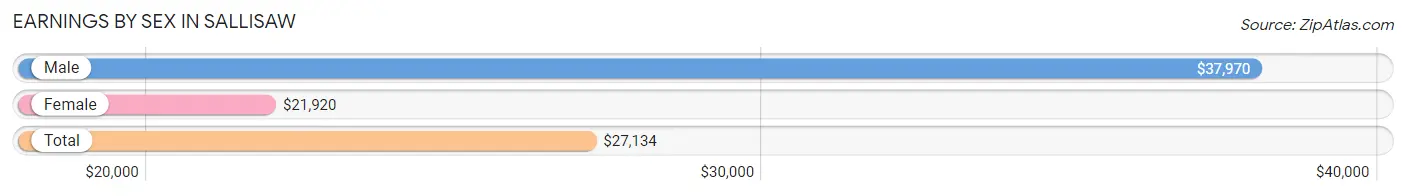
Earnings by Sex in Sallisaw
Average Earnings in Sallisaw are $27,134, $37,970 for men and $21,920 for women, a difference of 42.3%.
| Sex | Number | Average Earnings |
| Male | 1,776 (51.2%) | $37,970 |
| Female | 1,692 (48.8%) | $21,920 |
| Total | 3,468 (100.0%) | $27,134 |
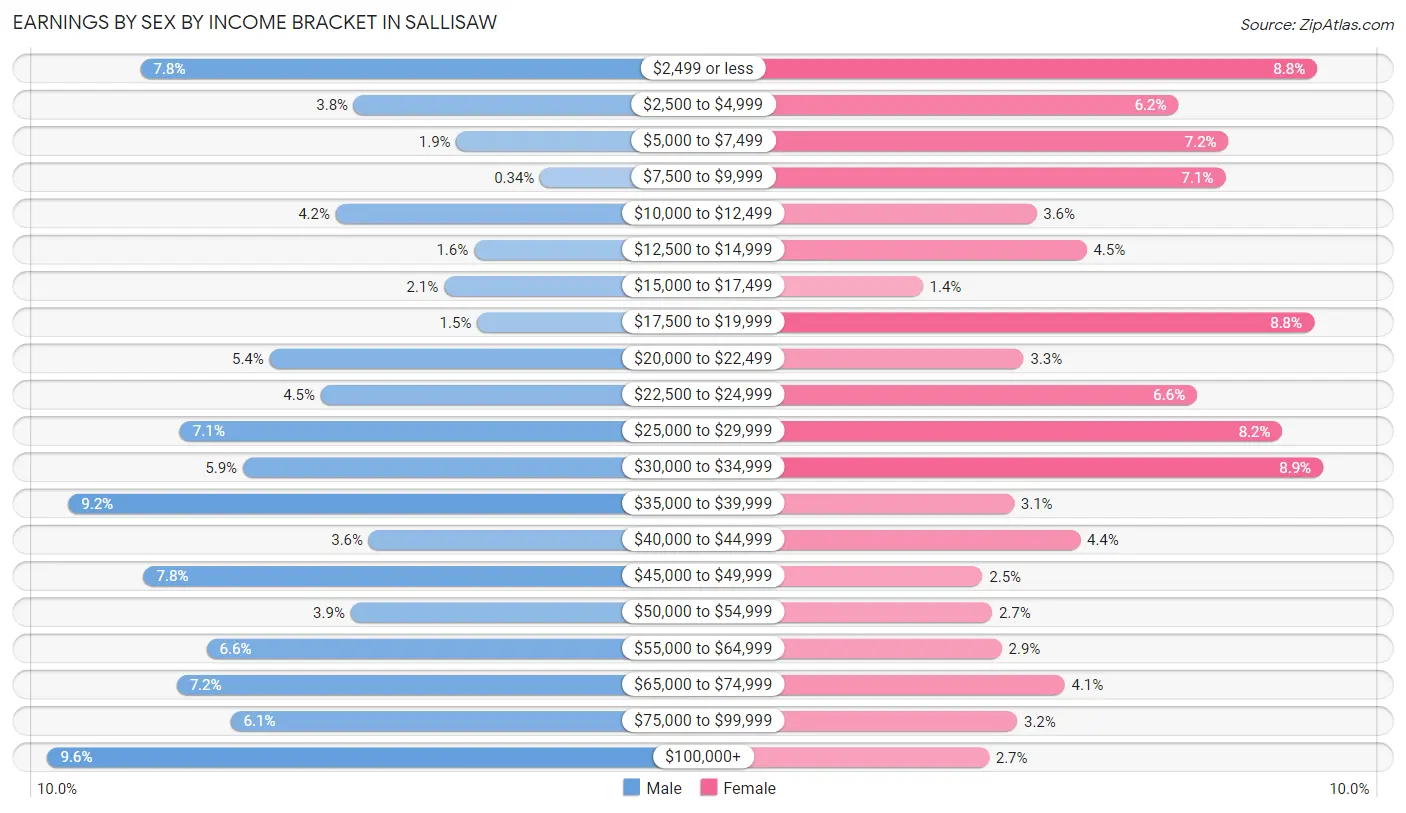
Earnings by Sex by Income Bracket in Sallisaw
The most common earnings brackets in Sallisaw are $100,000+ for men (170 | 9.6%) and $30,000 to $34,999 for women (151 | 8.9%).
| Income | Male | Female |
| $2,499 or less | 139 (7.8%) | 149 (8.8%) |
| $2,500 to $4,999 | 68 (3.8%) | 105 (6.2%) |
| $5,000 to $7,499 | 34 (1.9%) | 121 (7.1%) |
| $7,500 to $9,999 | 6 (0.3%) | 120 (7.1%) |
| $10,000 to $12,499 | 74 (4.2%) | 60 (3.5%) |
| $12,500 to $14,999 | 28 (1.6%) | 76 (4.5%) |
| $15,000 to $17,499 | 38 (2.1%) | 24 (1.4%) |
| $17,500 to $19,999 | 27 (1.5%) | 148 (8.7%) |
| $20,000 to $22,499 | 96 (5.4%) | 56 (3.3%) |
| $22,500 to $24,999 | 79 (4.4%) | 111 (6.6%) |
| $25,000 to $29,999 | 126 (7.1%) | 138 (8.2%) |
| $30,000 to $34,999 | 105 (5.9%) | 151 (8.9%) |
| $35,000 to $39,999 | 163 (9.2%) | 53 (3.1%) |
| $40,000 to $44,999 | 63 (3.5%) | 74 (4.4%) |
| $45,000 to $49,999 | 138 (7.8%) | 43 (2.5%) |
| $50,000 to $54,999 | 69 (3.9%) | 46 (2.7%) |
| $55,000 to $64,999 | 117 (6.6%) | 49 (2.9%) |
| $65,000 to $74,999 | 127 (7.1%) | 69 (4.1%) |
| $75,000 to $99,999 | 109 (6.1%) | 54 (3.2%) |
| $100,000+ | 170 (9.6%) | 45 (2.7%) |
| Total | 1,776 (100.0%) | 1,692 (100.0%) |
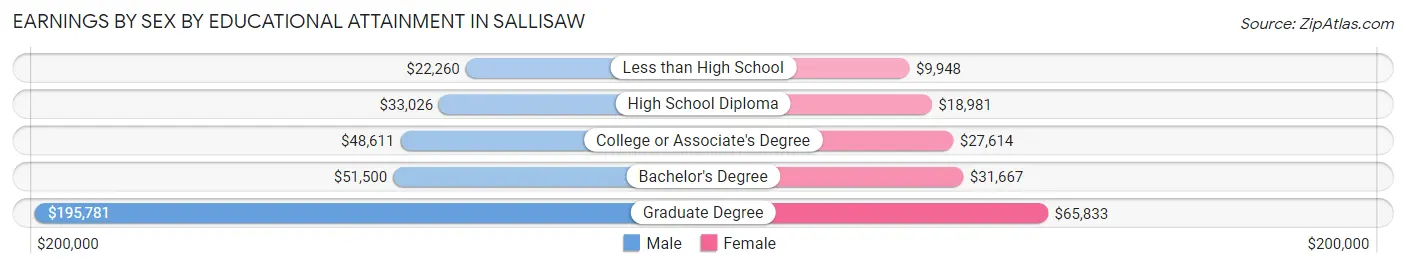
Earnings by Sex by Educational Attainment in Sallisaw
Average earnings in Sallisaw are $38,964 for men and $24,968 for women, a difference of 35.9%. Men with an educational attainment of graduate degree enjoy the highest average annual earnings of $195,781, while those with less than high school education earn the least with $22,260. Women with an educational attainment of graduate degree earn the most with the average annual earnings of $65,833, while those with less than high school education have the smallest earnings of $9,948.
| Educational Attainment | Male Income | Female Income |
| Less than High School | $22,260 | $9,948 |
| High School Diploma | $33,026 | $18,981 |
| College or Associate's Degree | $48,611 | $27,614 |
| Bachelor's Degree | $51,500 | $31,667 |
| Graduate Degree | $195,781 | $65,833 |
| Total | $38,964 | $24,968 |
Family Income in Sallisaw
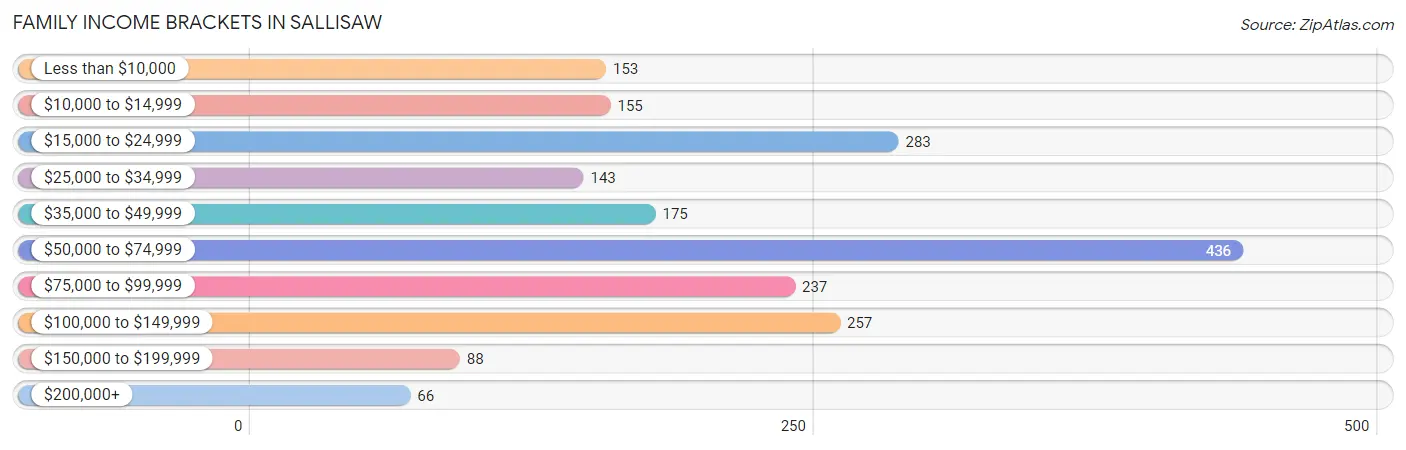
Family Income Brackets in Sallisaw
According to the Sallisaw family income data, there are 436 families falling into the $50,000 to $74,999 income range, which is the most common income bracket and makes up 21.9% of all families. Conversely, the $200,000+ income bracket is the least frequent group with only 66 families (3.3%) belonging to this category.
| Income Bracket | # Families | % Families |
| Less than $10,000 | 153 | 7.7% |
| $10,000 to $14,999 | 155 | 7.8% |
| $15,000 to $24,999 | 283 | 14.2% |
| $25,000 to $34,999 | 143 | 7.2% |
| $35,000 to $49,999 | 175 | 8.8% |
| $50,000 to $74,999 | 436 | 21.9% |
| $75,000 to $99,999 | 237 | 11.9% |
| $100,000 to $149,999 | 257 | 12.9% |
| $150,000 to $199,999 | 88 | 4.4% |
| $200,000+ | 66 | 3.3% |
Family Income by Famaliy Size in Sallisaw
5-person families (117 | 5.9%) account for the highest median family income in Sallisaw with $74,191 per family, while 2-person families (763 | 38.3%) have the highest median income of $29,754 per family member.

| Income Bracket | # Families | Median Income |
| 2-Person Families | 763 (38.3%) | $59,508 |
| 3-Person Families | 511 (25.7%) | $39,485 |
| 4-Person Families | 428 (21.5%) | $45,357 |
| 5-Person Families | 117 (5.9%) | $74,191 |
| 6-Person Families | 108 (5.4%) | $0 |
| 7+ Person Families | 64 (3.2%) | $0 |
| Total | 1,991 (100.0%) | $57,669 |
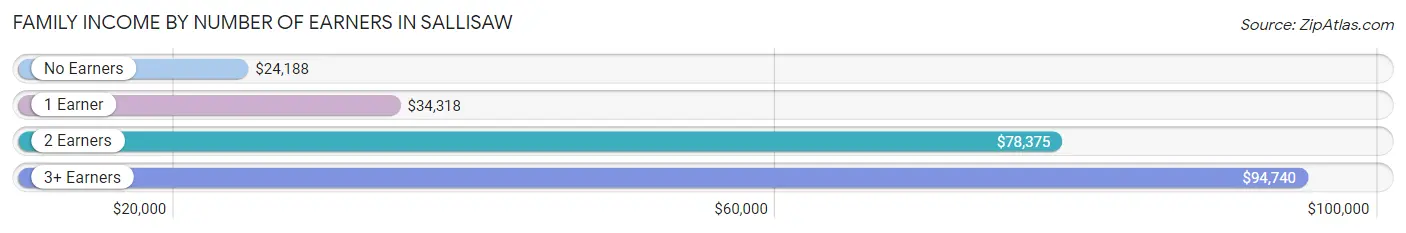
Family Income by Number of Earners in Sallisaw
The median family income in Sallisaw is $57,669, with families comprising 3+ earners (183) having the highest median family income of $94,740, while families with no earners (454) have the lowest median family income of $24,188, accounting for 9.2% and 22.8% of families, respectively.
| Number of Earners | # Families | Median Income |
| No Earners | 454 (22.8%) | $24,188 |
| 1 Earner | 706 (35.5%) | $34,318 |
| 2 Earners | 648 (32.6%) | $78,375 |
| 3+ Earners | 183 (9.2%) | $94,740 |
| Total | 1,991 (100.0%) | $57,669 |
Household Income in Sallisaw
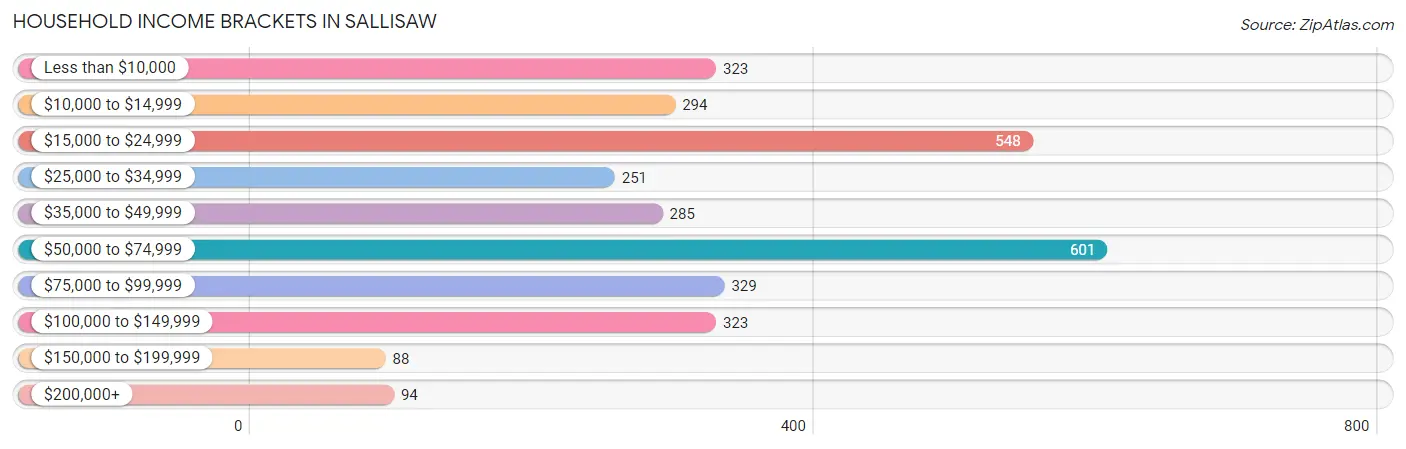
Household Income Brackets in Sallisaw
With 601 households falling in the category, the $50,000 to $74,999 income range is the most frequent in Sallisaw, accounting for 19.2% of all households. In contrast, only 88 households (2.8%) fall into the $150,000 to $199,999 income bracket, making it the least populous group.
| Income Bracket | # Households | % Households |
| Less than $10,000 | 323 | 10.3% |
| $10,000 to $14,999 | 294 | 9.4% |
| $15,000 to $24,999 | 548 | 17.5% |
| $25,000 to $34,999 | 251 | 8.0% |
| $35,000 to $49,999 | 285 | 9.1% |
| $50,000 to $74,999 | 601 | 19.2% |
| $75,000 to $99,999 | 329 | 10.5% |
| $100,000 to $149,999 | 323 | 10.3% |
| $150,000 to $199,999 | 88 | 2.8% |
| $200,000+ | 94 | 3.0% |
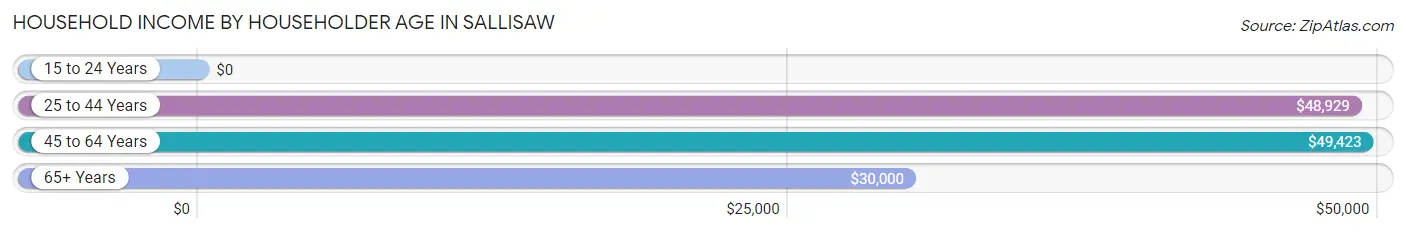
Household Income by Householder Age in Sallisaw
The median household income in Sallisaw is $44,310, with the highest median household income of $49,423 found in the 45 to 64 years age bracket for the primary householder. A total of 1,094 households (34.9%) fall into this category. Meanwhile, the 15 to 24 years age bracket for the primary householder has the lowest median household income of $0, with 110 households (3.5%) in this group.
| Income Bracket | # Households | Median Income |
| 15 to 24 Years | 110 (3.5%) | $0 |
| 25 to 44 Years | 1,014 (32.4%) | $48,929 |
| 45 to 64 Years | 1,094 (34.9%) | $49,423 |
| 65+ Years | 914 (29.2%) | $30,000 |
| Total | 3,132 (100.0%) | $44,310 |
Poverty in Sallisaw
Income Below Poverty by Sex and Age in Sallisaw
With 32.8% poverty level for males and 37.4% for females among the residents of Sallisaw, under 5 year old males and under 5 year old females are the most vulnerable to poverty, with 240 males (62.2%) and 198 females (65.1%) in their respective age groups living below the poverty level.
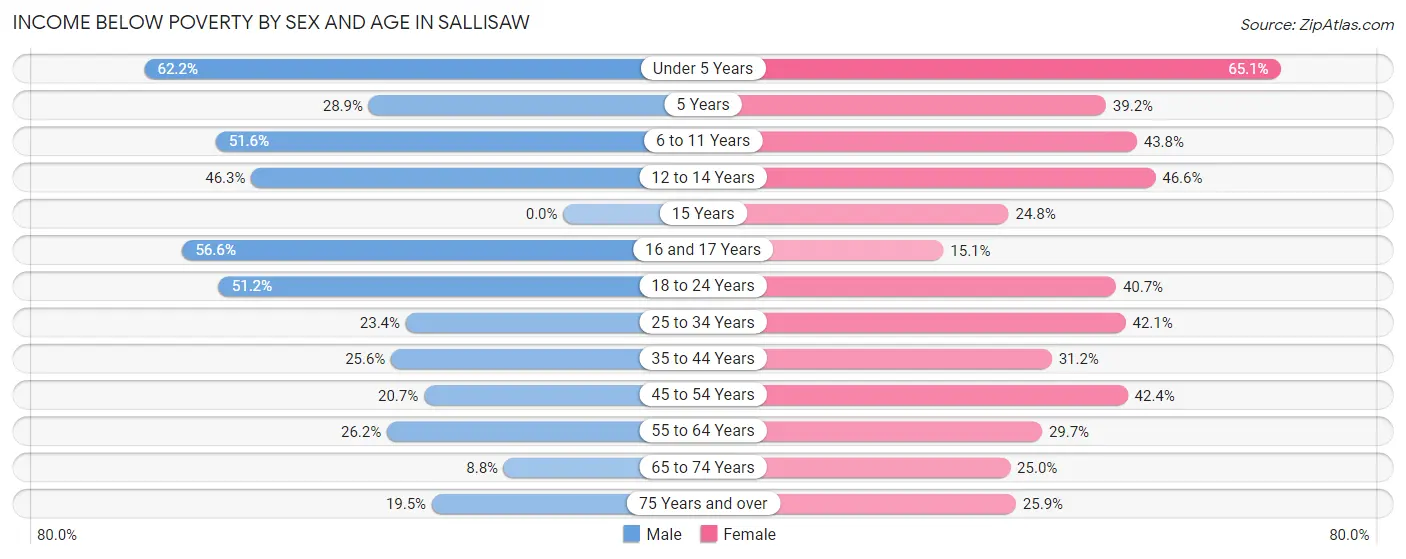
| Age Bracket | Male | Female |
| Under 5 Years | 240 (62.2%) | 198 (65.1%) |
| 5 Years | 13 (28.9%) | 20 (39.2%) |
| 6 to 11 Years | 210 (51.6%) | 159 (43.8%) |
| 12 to 14 Years | 95 (46.3%) | 135 (46.6%) |
| 15 Years | 0 (0.0%) | 26 (24.8%) |
| 16 and 17 Years | 95 (56.6%) | 19 (15.1%) |
| 18 to 24 Years | 89 (51.1%) | 114 (40.7%) |
| 25 to 34 Years | 134 (23.4%) | 244 (42.1%) |
| 35 to 44 Years | 148 (25.6%) | 149 (31.2%) |
| 45 to 54 Years | 91 (20.7%) | 230 (42.4%) |
| 55 to 64 Years | 111 (26.2%) | 126 (29.7%) |
| 65 to 74 Years | 24 (8.8%) | 94 (25.0%) |
| 75 Years and over | 40 (19.5%) | 107 (25.9%) |
| Total | 1,290 (32.8%) | 1,621 (37.4%) |
Income Above Poverty by Sex and Age in Sallisaw
According to the poverty statistics in Sallisaw, males aged 15 years and females aged 16 and 17 years are the age groups that are most secure financially, with 100.0% of males and 84.9% of females in these age groups living above the poverty line.
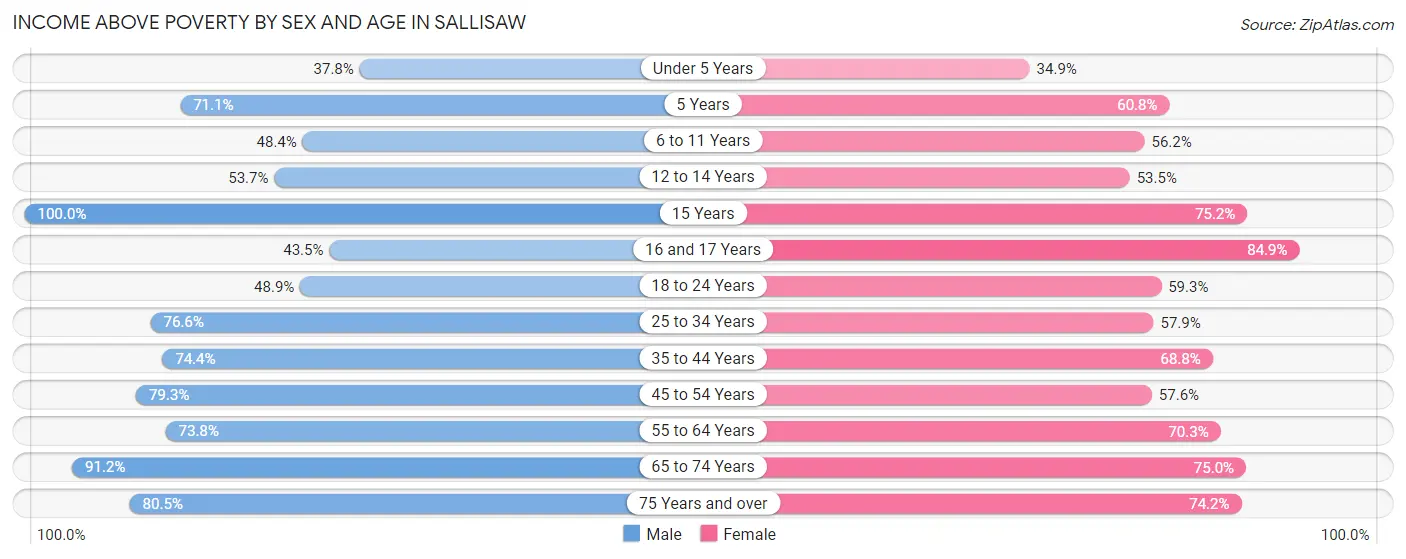
| Age Bracket | Male | Female |
| Under 5 Years | 146 (37.8%) | 106 (34.9%) |
| 5 Years | 32 (71.1%) | 31 (60.8%) |
| 6 to 11 Years | 197 (48.4%) | 204 (56.2%) |
| 12 to 14 Years | 110 (53.7%) | 155 (53.4%) |
| 15 Years | 53 (100.0%) | 79 (75.2%) |
| 16 and 17 Years | 73 (43.4%) | 107 (84.9%) |
| 18 to 24 Years | 85 (48.8%) | 166 (59.3%) |
| 25 to 34 Years | 439 (76.6%) | 335 (57.9%) |
| 35 to 44 Years | 431 (74.4%) | 329 (68.8%) |
| 45 to 54 Years | 349 (79.3%) | 312 (57.6%) |
| 55 to 64 Years | 313 (73.8%) | 298 (70.3%) |
| 65 to 74 Years | 248 (91.2%) | 282 (75.0%) |
| 75 Years and over | 165 (80.5%) | 307 (74.2%) |
| Total | 2,641 (67.2%) | 2,711 (62.6%) |
Income Below Poverty Among Married-Couple Families in Sallisaw
The poverty statistics for married-couple families in Sallisaw show that 18.2% or 231 of the total 1,272 families live below the poverty line. Families with 5 or more children have the highest poverty rate of 43.5%, comprising of 10 families. On the other hand, families with no children have the lowest poverty rate of 13.2%, which includes 73 families.
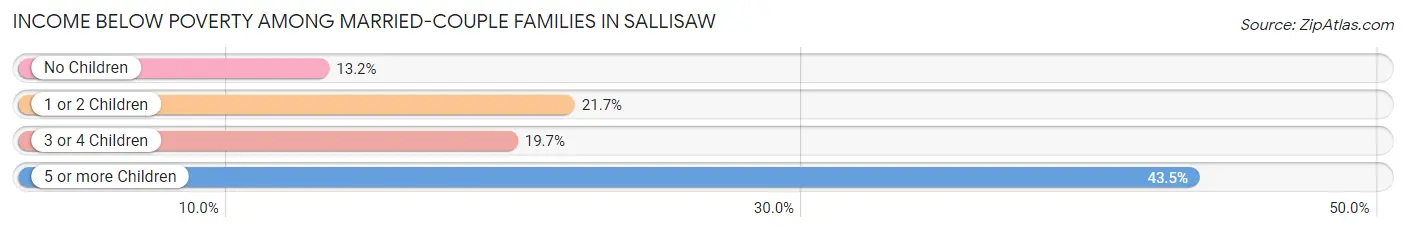
| Children | Above Poverty | Below Poverty |
| No Children | 481 (86.8%) | 73 (13.2%) |
| 1 or 2 Children | 425 (78.3%) | 118 (21.7%) |
| 3 or 4 Children | 122 (80.3%) | 30 (19.7%) |
| 5 or more Children | 13 (56.5%) | 10 (43.5%) |
| Total | 1,041 (81.8%) | 231 (18.2%) |
Income Below Poverty Among Single-Parent Households in Sallisaw
According to the poverty data in Sallisaw, 24.8% or 52 single-father households and 57.2% or 291 single-mother households are living below the poverty line. Among single-father households, those with 1 or 2 children have the highest poverty rate, with 52 households (38.2%) experiencing poverty. Likewise, among single-mother households, those with 5 or more children have the highest poverty rate, with 6 households (100.0%) falling below the poverty line.
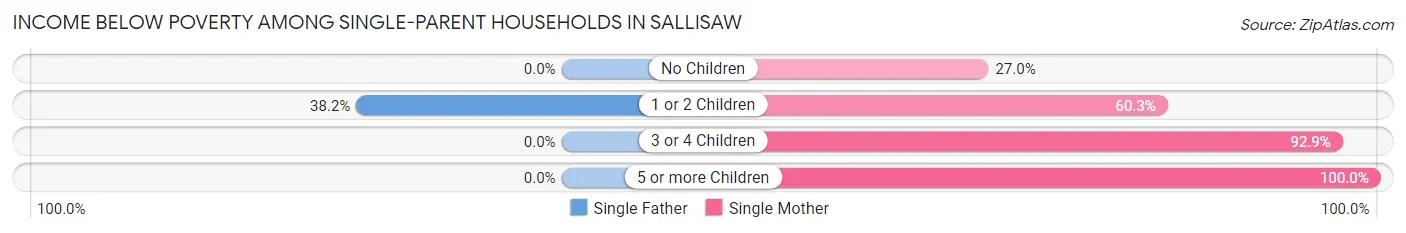
| Children | Single Father | Single Mother |
| No Children | 0 (0.0%) | 41 (27.0%) |
| 1 or 2 Children | 52 (38.2%) | 152 (60.3%) |
| 3 or 4 Children | 0 (0.0%) | 92 (92.9%) |
| 5 or more Children | 0 (0.0%) | 6 (100.0%) |
| Total | 52 (24.8%) | 291 (57.2%) |
Income Below Poverty Among Married-Couple vs Single-Parent Households in Sallisaw
The poverty data for Sallisaw shows that 231 of the married-couple family households (18.2%) and 343 of the single-parent households (47.7%) are living below the poverty level. Within the married-couple family households, those with 5 or more children have the highest poverty rate, with 10 households (43.5%) falling below the poverty line. Among the single-parent households, those with 5 or more children have the highest poverty rate, with 6 household (100.0%) living below poverty.
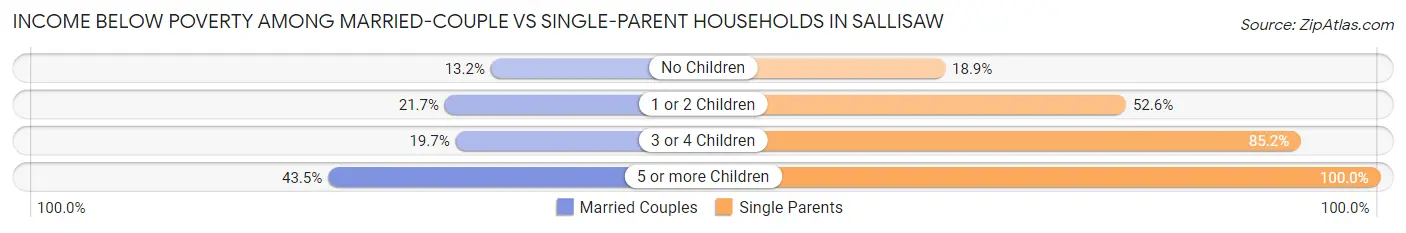
| Children | Married-Couple Families | Single-Parent Households |
| No Children | 73 (13.2%) | 41 (18.9%) |
| 1 or 2 Children | 118 (21.7%) | 204 (52.6%) |
| 3 or 4 Children | 30 (19.7%) | 92 (85.2%) |
| 5 or more Children | 10 (43.5%) | 6 (100.0%) |
| Total | 231 (18.2%) | 343 (47.7%) |
Race in Sallisaw
The most populous races in Sallisaw are White / Caucasian (5,417 | 63.5%), Native / Alaskan (1,527 | 17.9%), and Two or more Races (1,152 | 13.5%).
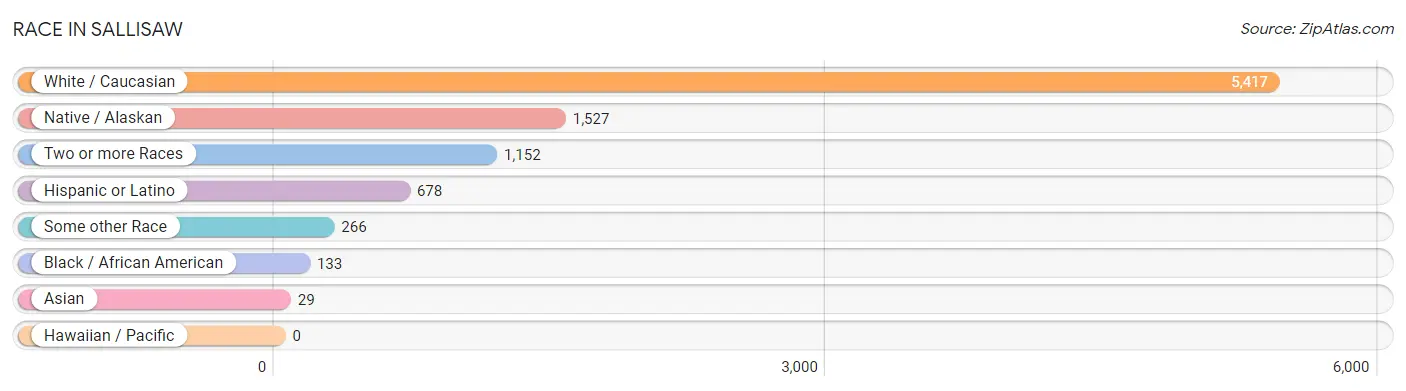
| Race | # Population | % Population |
| Asian | 29 | 0.3% |
| Black / African American | 133 | 1.6% |
| Hawaiian / Pacific | 0 | 0.0% |
| Hispanic or Latino | 678 | 8.0% |
| Native / Alaskan | 1,527 | 17.9% |
| White / Caucasian | 5,417 | 63.5% |
| Two or more Races | 1,152 | 13.5% |
| Some other Race | 266 | 3.1% |
| Total | 8,524 | 100.0% |
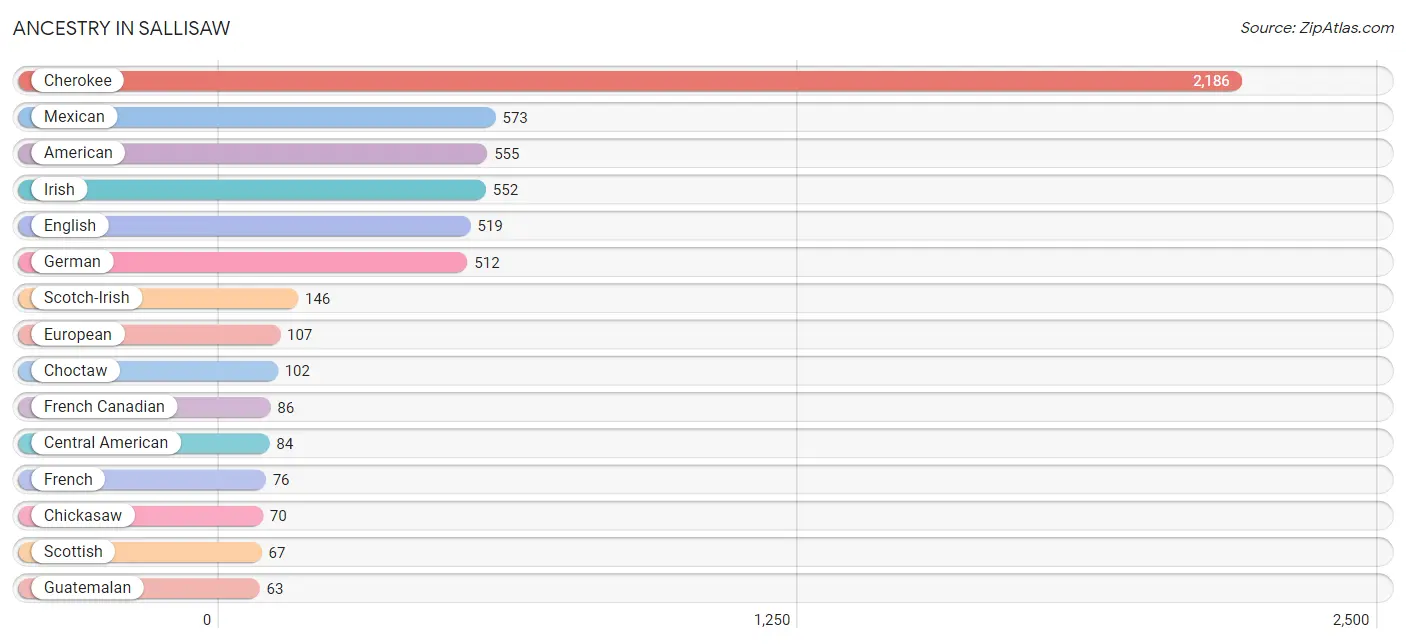
Ancestry in Sallisaw
The most populous ancestries reported in Sallisaw are Cherokee (2,186 | 25.7%), Mexican (573 | 6.7%), American (555 | 6.5%), Irish (552 | 6.5%), and English (519 | 6.1%), together accounting for 51.4% of all Sallisaw residents.
| Ancestry | # Population | % Population |
| African | 26 | 0.3% |
| American | 555 | 6.5% |
| Bhutanese | 39 | 0.5% |
| Central American | 84 | 1.0% |
| Cherokee | 2,186 | 25.7% |
| Chickasaw | 70 | 0.8% |
| Choctaw | 102 | 1.2% |
| Czech | 7 | 0.1% |
| Danish | 10 | 0.1% |
| Dutch | 51 | 0.6% |
| English | 519 | 6.1% |
| European | 107 | 1.3% |
| Finnish | 5 | 0.1% |
| French | 76 | 0.9% |
| French Canadian | 86 | 1.0% |
| German | 512 | 6.0% |
| Guatemalan | 63 | 0.7% |
| Hungarian | 22 | 0.3% |
| Irish | 552 | 6.5% |
| Italian | 51 | 0.6% |
| Mexican | 573 | 6.7% |
| Native Hawaiian | 39 | 0.5% |
| Northern European | 18 | 0.2% |
| Norwegian | 8 | 0.1% |
| Polish | 60 | 0.7% |
| Puerto Rican | 21 | 0.3% |
| Russian | 12 | 0.1% |
| Salvadoran | 21 | 0.3% |
| Scotch-Irish | 146 | 1.7% |
| Scottish | 67 | 0.8% |
| Seminole | 5 | 0.1% |
| Sioux | 31 | 0.4% |
| Sri Lankan | 23 | 0.3% |
| Subsaharan African | 26 | 0.3% |
| Thai | 6 | 0.1% |
| Welsh | 42 | 0.5% |
| Yugoslavian | 8 | 0.1% | View All 37 Rows |
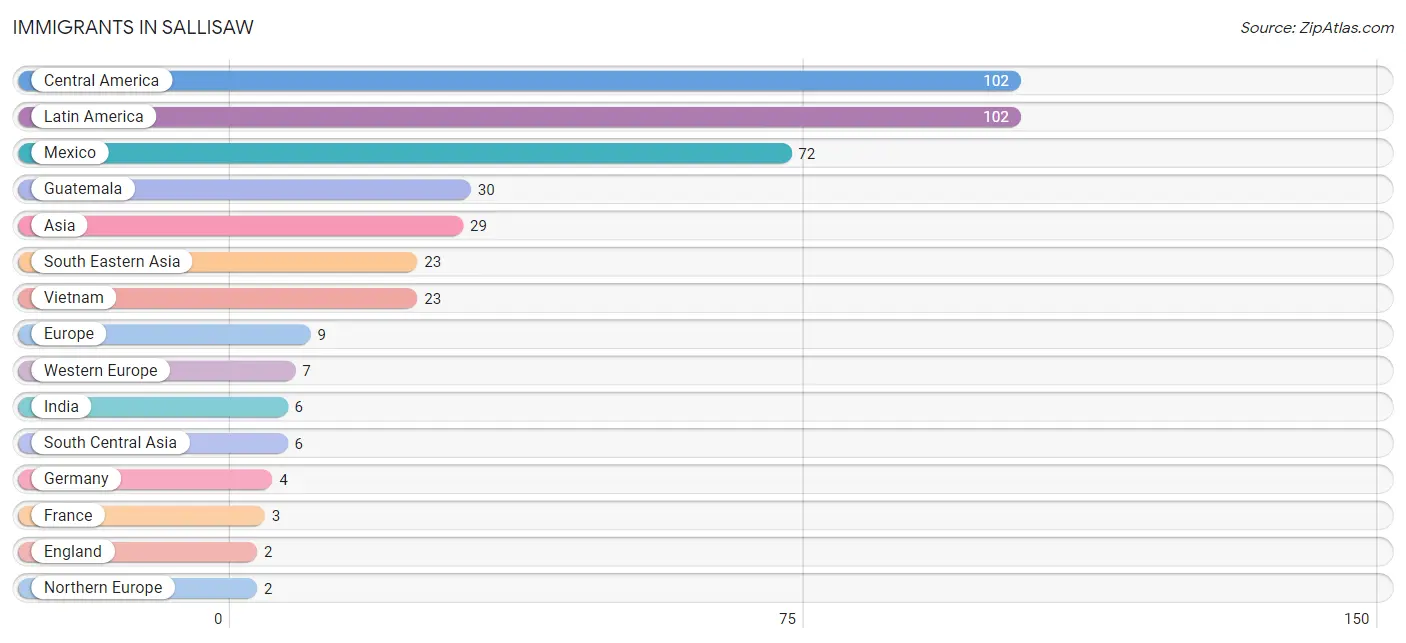
Immigrants in Sallisaw
The most numerous immigrant groups reported in Sallisaw came from Central America (102 | 1.2%), Latin America (102 | 1.2%), Mexico (72 | 0.8%), Guatemala (30 | 0.4%), and Asia (29 | 0.3%), together accounting for 3.9% of all Sallisaw residents.
| Immigration Origin | # Population | % Population |
| Asia | 29 | 0.3% |
| Central America | 102 | 1.2% |
| England | 2 | 0.0% |
| Europe | 9 | 0.1% |
| France | 3 | 0.0% |
| Germany | 4 | 0.1% |
| Guatemala | 30 | 0.4% |
| India | 6 | 0.1% |
| Latin America | 102 | 1.2% |
| Mexico | 72 | 0.8% |
| Northern Europe | 2 | 0.0% |
| South Central Asia | 6 | 0.1% |
| South Eastern Asia | 23 | 0.3% |
| Vietnam | 23 | 0.3% |
| Western Europe | 7 | 0.1% | View All 15 Rows |
Sex and Age in Sallisaw
Sex and Age in Sallisaw
The most populous age groups in Sallisaw are Under 5 Years (390 | 9.5%) for men and 10 to 14 Years (465 | 10.5%) for women.
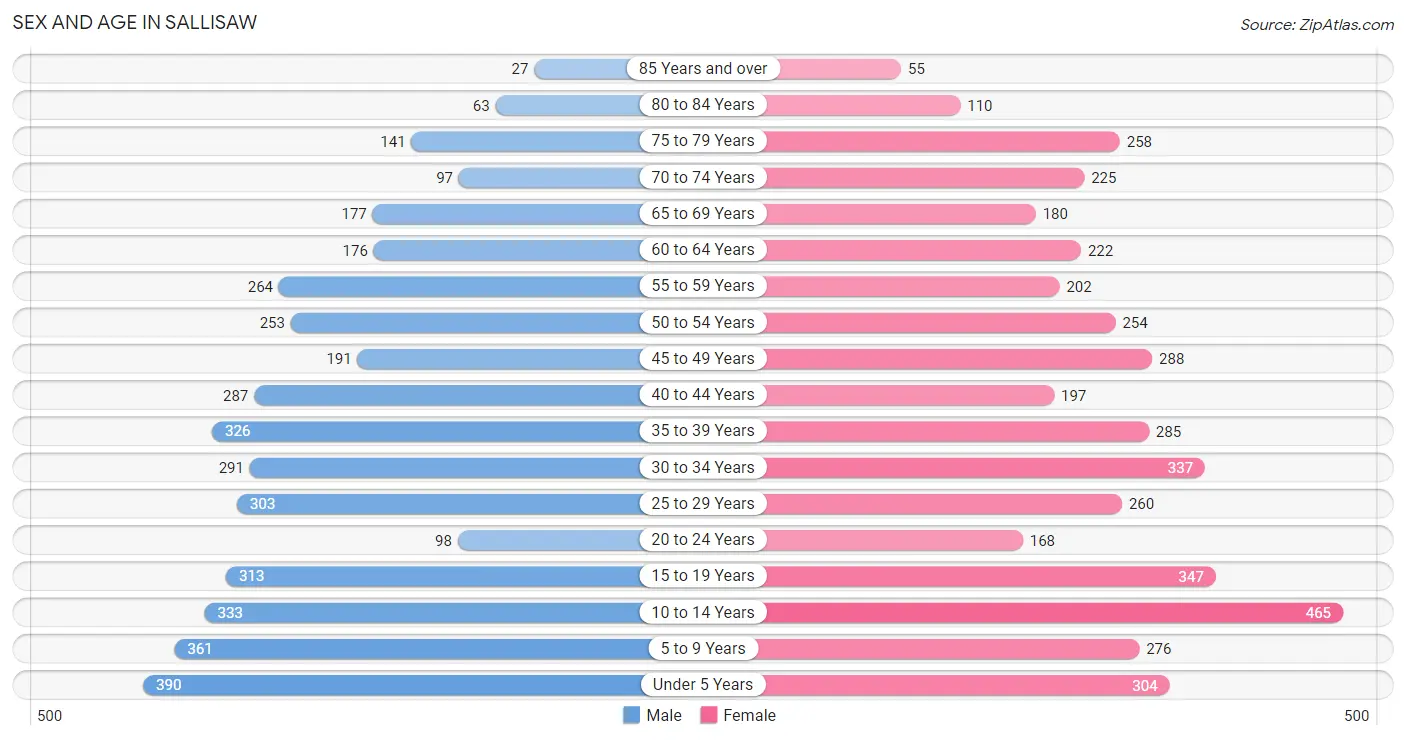
| Age Bracket | Male | Female |
| Under 5 Years | 390 (9.5%) | 304 (6.9%) |
| 5 to 9 Years | 361 (8.8%) | 276 (6.2%) |
| 10 to 14 Years | 333 (8.1%) | 465 (10.5%) |
| 15 to 19 Years | 313 (7.6%) | 347 (7.8%) |
| 20 to 24 Years | 98 (2.4%) | 168 (3.8%) |
| 25 to 29 Years | 303 (7.4%) | 260 (5.9%) |
| 30 to 34 Years | 291 (7.1%) | 337 (7.6%) |
| 35 to 39 Years | 326 (8.0%) | 285 (6.4%) |
| 40 to 44 Years | 287 (7.0%) | 197 (4.4%) |
| 45 to 49 Years | 191 (4.7%) | 288 (6.5%) |
| 50 to 54 Years | 253 (6.2%) | 254 (5.7%) |
| 55 to 59 Years | 264 (6.5%) | 202 (4.6%) |
| 60 to 64 Years | 176 (4.3%) | 222 (5.0%) |
| 65 to 69 Years | 177 (4.3%) | 180 (4.1%) |
| 70 to 74 Years | 97 (2.4%) | 225 (5.1%) |
| 75 to 79 Years | 141 (3.5%) | 258 (5.8%) |
| 80 to 84 Years | 63 (1.5%) | 110 (2.5%) |
| 85 Years and over | 27 (0.7%) | 55 (1.2%) |
| Total | 4,091 (100.0%) | 4,433 (100.0%) |
Families and Households in Sallisaw
Median Family Size in Sallisaw
The median family size in Sallisaw is 3.41 persons per family, with married-couple families (1,272 | 63.9%) accounting for the largest median family size of 3.5 persons per family. On the other hand, single male/father families (210 | 10.5%) represent the smallest median family size with 2.70 persons per family.
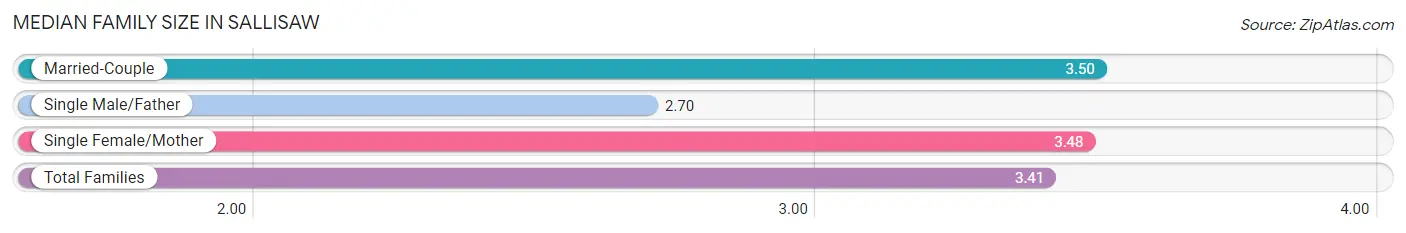
| Family Type | # Families | Family Size |
| Married-Couple | 1,272 (63.9%) | 3.50 |
| Single Male/Father | 210 (10.5%) | 2.70 |
| Single Female/Mother | 509 (25.6%) | 3.48 |
| Total Families | 1,991 (100.0%) | 3.41 |
Median Household Size in Sallisaw
The median household size in Sallisaw is 2.66 persons per household, with single female/mother households (509 | 16.3%) accounting for the largest median household size of 3.6 persons per household. non-family households (1,141 | 36.4%) represent the smallest median household size with 1.20 persons per household.
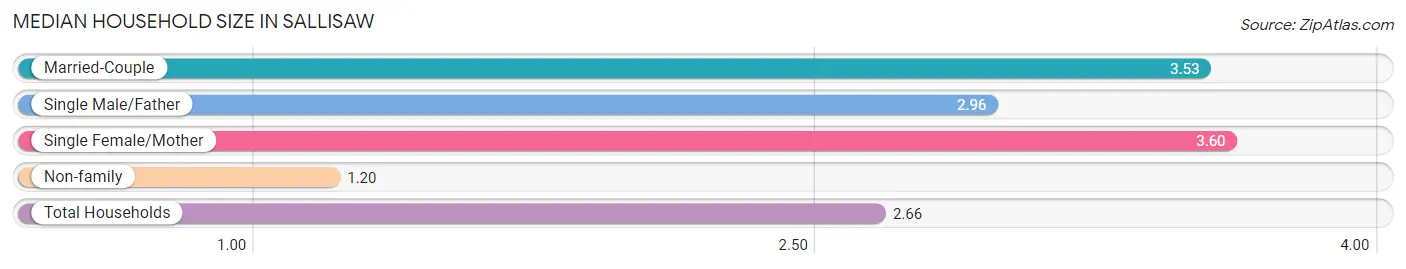
| Household Type | # Households | Household Size |
| Married-Couple | 1,272 (40.6%) | 3.53 |
| Single Male/Father | 210 (6.7%) | 2.96 |
| Single Female/Mother | 509 (16.3%) | 3.60 |
| Non-family | 1,141 (36.4%) | 1.20 |
| Total Households | 3,132 (100.0%) | 2.66 |
Household Size by Marriage Status in Sallisaw
Out of a total of 3,132 households in Sallisaw, 1,991 (63.6%) are family households, while 1,141 (36.4%) are nonfamily households. The most numerous type of family households are 2-person households, comprising 726, and the most common type of nonfamily households are 1-person households, comprising 967.
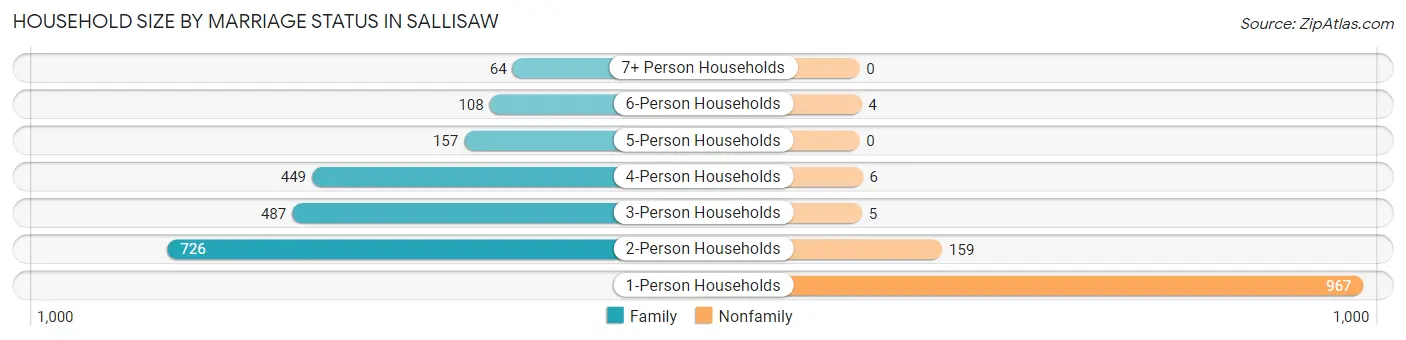
| Household Size | Family Households | Nonfamily Households |
| 1-Person Households | - | 967 (30.9%) |
| 2-Person Households | 726 (23.2%) | 159 (5.1%) |
| 3-Person Households | 487 (15.5%) | 5 (0.2%) |
| 4-Person Households | 449 (14.3%) | 6 (0.2%) |
| 5-Person Households | 157 (5.0%) | 0 (0.0%) |
| 6-Person Households | 108 (3.5%) | 4 (0.1%) |
| 7+ Person Households | 64 (2.0%) | 0 (0.0%) |
| Total | 1,991 (63.6%) | 1,141 (36.4%) |
Female Fertility in Sallisaw
Fertility by Age in Sallisaw
Average fertility rate in Sallisaw is 78.0 births per 1,000 women. Women in the age bracket of 20 to 34 years have the highest fertility rate with 132.0 births per 1,000 women. Women in the age bracket of 20 to 34 years acount for 68.2% of all women with births.
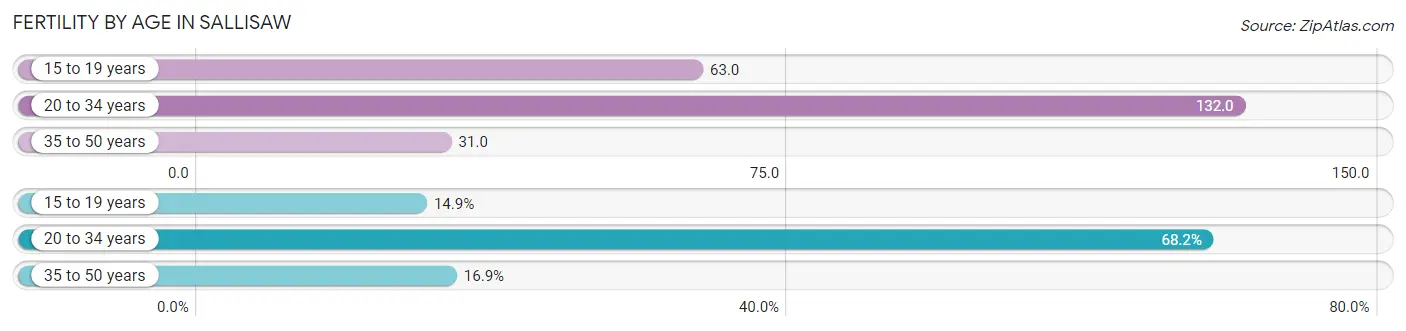
| Age Bracket | Women with Births | Births / 1,000 Women |
| 15 to 19 years | 22 (14.9%) | 63.0 |
| 20 to 34 years | 101 (68.2%) | 132.0 |
| 35 to 50 years | 25 (16.9%) | 31.0 |
| Total | 148 (100.0%) | 78.0 |
Fertility by Age by Marriage Status in Sallisaw
60.1% of women with births (148) in Sallisaw are married. The highest percentage of unmarried women with births falls into 20 to 34 years age bracket with 58.4% of them unmarried at the time of birth, while the lowest percentage of unmarried women with births belong to 15 to 19 years age bracket with 0.0% of them unmarried.
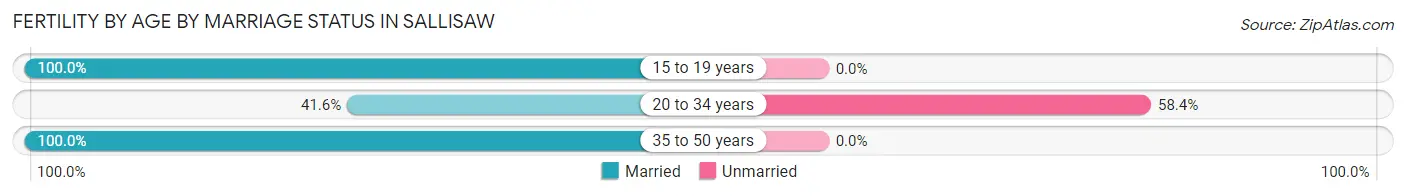
| Age Bracket | Married | Unmarried |
| 15 to 19 years | 22 (100.0%) | 0 (0.0%) |
| 20 to 34 years | 42 (41.6%) | 59 (58.4%) |
| 35 to 50 years | 25 (100.0%) | 0 (0.0%) |
| Total | 89 (60.1%) | 59 (39.9%) |
Fertility by Education in Sallisaw
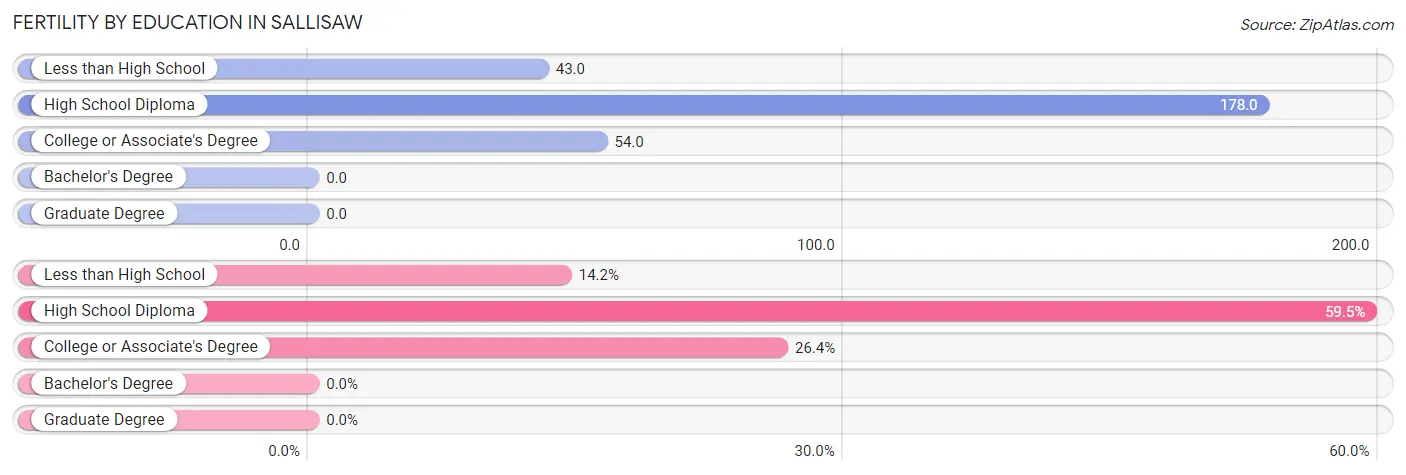
| Educational Attainment | Women with Births | Births / 1,000 Women |
| Less than High School | 21 (14.2%) | 43.0 |
| High School Diploma | 88 (59.5%) | 178.0 |
| College or Associate's Degree | 39 (26.4%) | 54.0 |
| Bachelor's Degree | 0 (0.0%) | 0.0 |
| Graduate Degree | 0 (0.0%) | 0.0 |
| Total | 148 (100.0%) | 78.0 |
Fertility by Education by Marriage Status in Sallisaw
39.9% of women with births in Sallisaw are unmarried. Women with the educational attainment of college or associate's degree are most likely to be married with 100.0% of them married at childbirth, while women with the educational attainment of high school diploma are least likely to be married with 63.6% of them unmarried at childbirth.
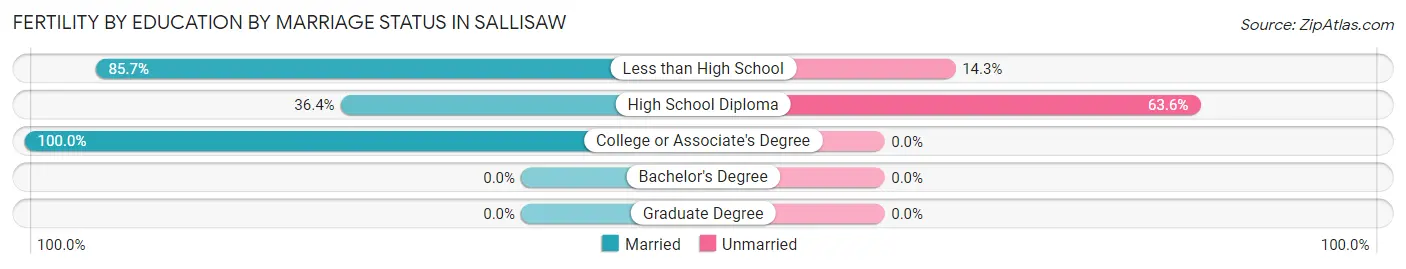
| Educational Attainment | Married | Unmarried |
| Less than High School | 18 (85.7%) | 3 (14.3%) |
| High School Diploma | 32 (36.4%) | 56 (63.6%) |
| College or Associate's Degree | 39 (100.0%) | 0 (0.0%) |
| Bachelor's Degree | 0 (0.0%) | 0 (0.0%) |
| Graduate Degree | 0 (0.0%) | 0 (0.0%) |
| Total | 89 (60.1%) | 59 (39.9%) |
Employment Characteristics in Sallisaw
Employment by Class of Employer in Sallisaw
Among the 3,041 employed individuals in Sallisaw, private company employees (1,834 | 60.3%), not-for-profit organizations (310 | 10.2%), and local government employees (293 | 9.6%) make up the most common classes of employment.
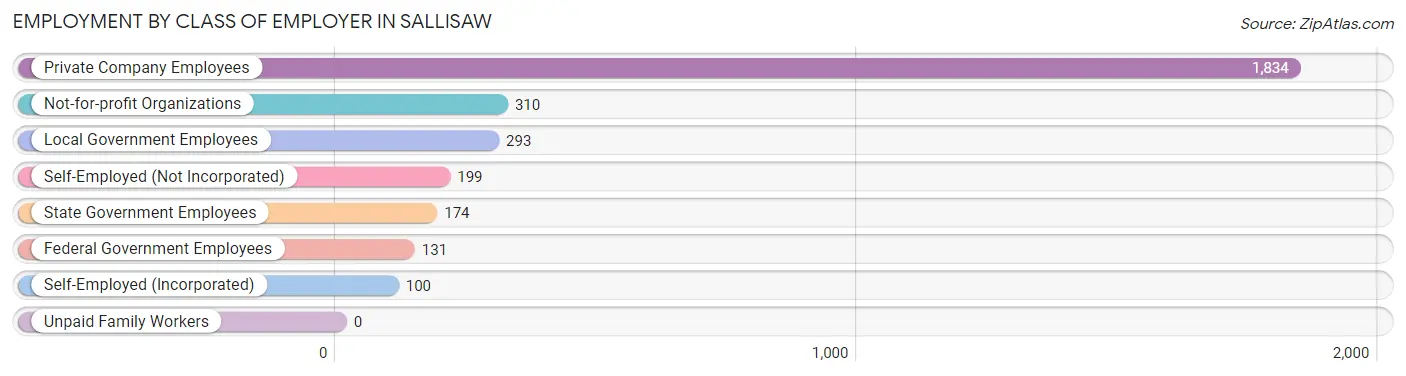
| Employer Class | # Employees | % Employees |
| Private Company Employees | 1,834 | 60.3% |
| Self-Employed (Incorporated) | 100 | 3.3% |
| Self-Employed (Not Incorporated) | 199 | 6.5% |
| Not-for-profit Organizations | 310 | 10.2% |
| Local Government Employees | 293 | 9.6% |
| State Government Employees | 174 | 5.7% |
| Federal Government Employees | 131 | 4.3% |
| Unpaid Family Workers | 0 | 0.0% |
| Total | 3,041 | 100.0% |
Employment Status by Age in Sallisaw
According to the labor force statistics for Sallisaw, out of the total population over 16 years of age (6,237), 52.5% or 3,274 individuals are in the labor force, with 6.4% or 210 of them unemployed. The age group with the highest labor force participation rate is 30 to 34 years, with 80.6% or 506 individuals in the labor force. Within the labor force, the 20 to 24 years age range has the highest percentage of unemployed individuals, with 29.2% or 47 of them being unemployed.
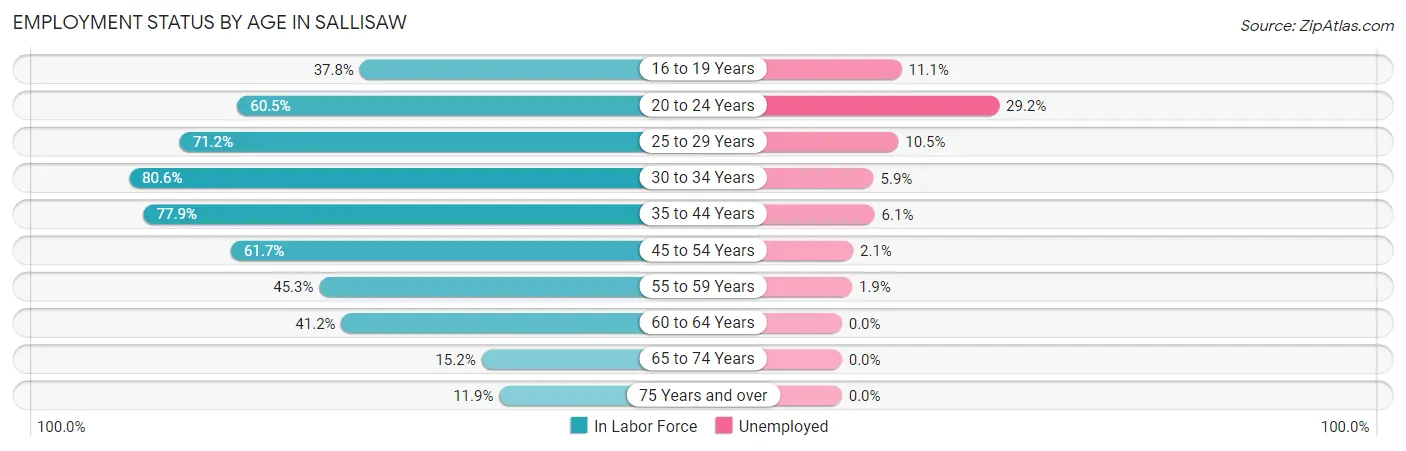
| Age Bracket | In Labor Force | Unemployed |
| 16 to 19 Years | 190 (37.8%) | 21 (11.1%) |
| 20 to 24 Years | 161 (60.5%) | 47 (29.2%) |
| 25 to 29 Years | 401 (71.2%) | 42 (10.5%) |
| 30 to 34 Years | 506 (80.6%) | 30 (5.9%) |
| 35 to 44 Years | 853 (77.9%) | 52 (6.1%) |
| 45 to 54 Years | 608 (61.7%) | 13 (2.1%) |
| 55 to 59 Years | 211 (45.3%) | 4 (1.9%) |
| 60 to 64 Years | 164 (41.2%) | 0 (0.0%) |
| 65 to 74 Years | 103 (15.2%) | 0 (0.0%) |
| 75 Years and over | 78 (11.9%) | 0 (0.0%) |
| Total | 3,274 (52.5%) | 210 (6.4%) |
Employment Status by Educational Attainment in Sallisaw
According to labor force statistics for Sallisaw, 66.3% of individuals (2,742) out of the total population between 25 and 64 years of age (4,136) are in the labor force, with 5.1% or 140 of them being unemployed. The group with the highest labor force participation rate are those with the educational attainment of bachelor's degree or higher, with 83.6% or 536 individuals in the labor force. Within the labor force, individuals with college / associate degree education have the highest percentage of unemployment, with 7.4% or 80 of them being unemployed.
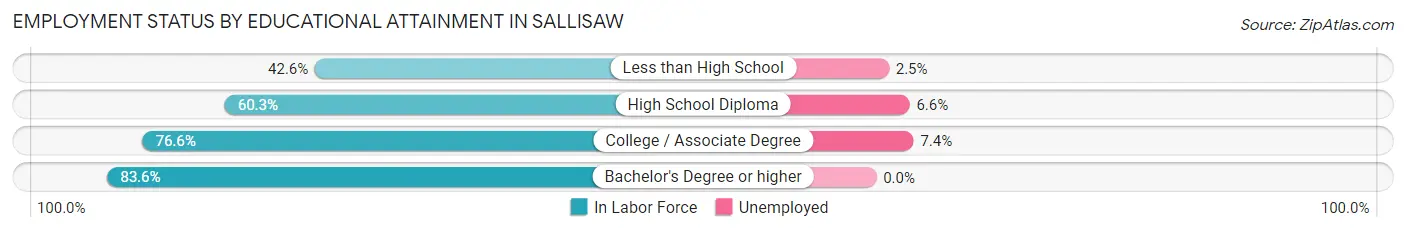
| Educational Attainment | In Labor Force | Unemployed |
| Less than High School | 314 (42.6%) | 18 (2.5%) |
| High School Diploma | 809 (60.3%) | 89 (6.6%) |
| College / Associate Degree | 1,085 (76.6%) | 105 (7.4%) |
| Bachelor's Degree or higher | 536 (83.6%) | 0 (0.0%) |
| Total | 2,742 (66.3%) | 211 (5.1%) |
Employment Occupations by Sex in Sallisaw
Management, Business, Science and Arts Occupations
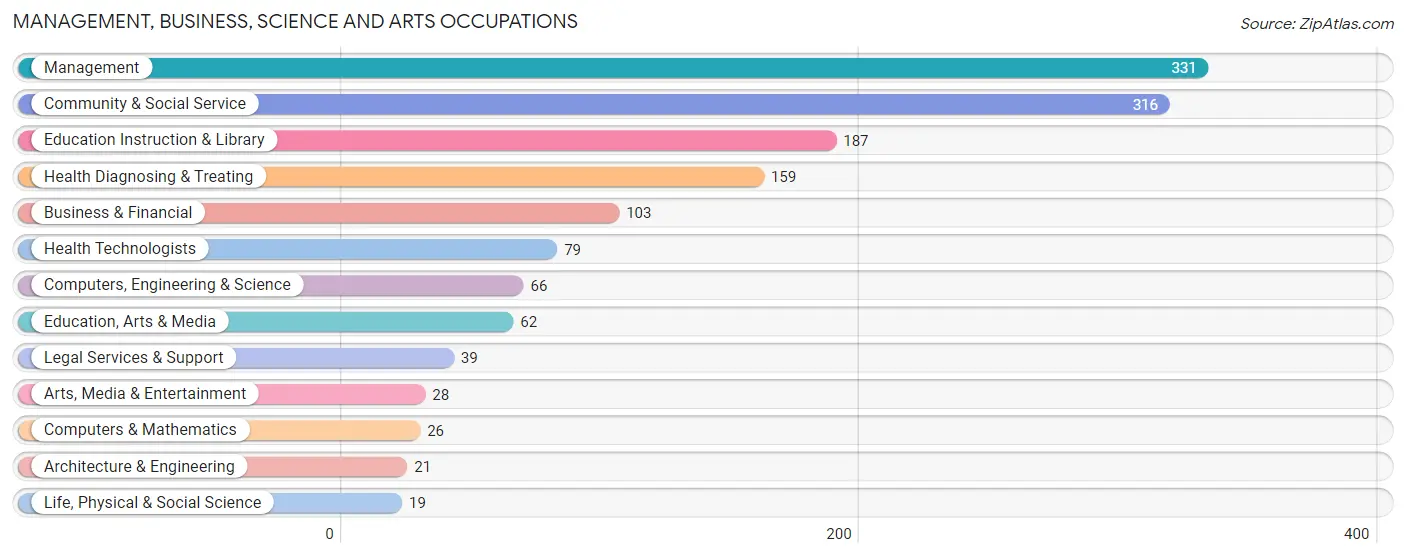
The most common Management, Business, Science and Arts occupations in Sallisaw are Management (331 | 10.8%), Community & Social Service (316 | 10.3%), Education Instruction & Library (187 | 6.1%), Health Diagnosing & Treating (159 | 5.2%), and Business & Financial (103 | 3.4%).
Management, Business, Science and Arts Occupations by Sex
Within the Management, Business, Science and Arts occupations in Sallisaw, the most male-oriented occupations are Computers & Mathematics (100.0%), Architecture & Engineering (100.0%), and Legal Services & Support (84.6%), while the most female-oriented occupations are Life, Physical & Social Science (100.0%), Education, Arts & Media (82.3%), and Health Diagnosing & Treating (76.7%).
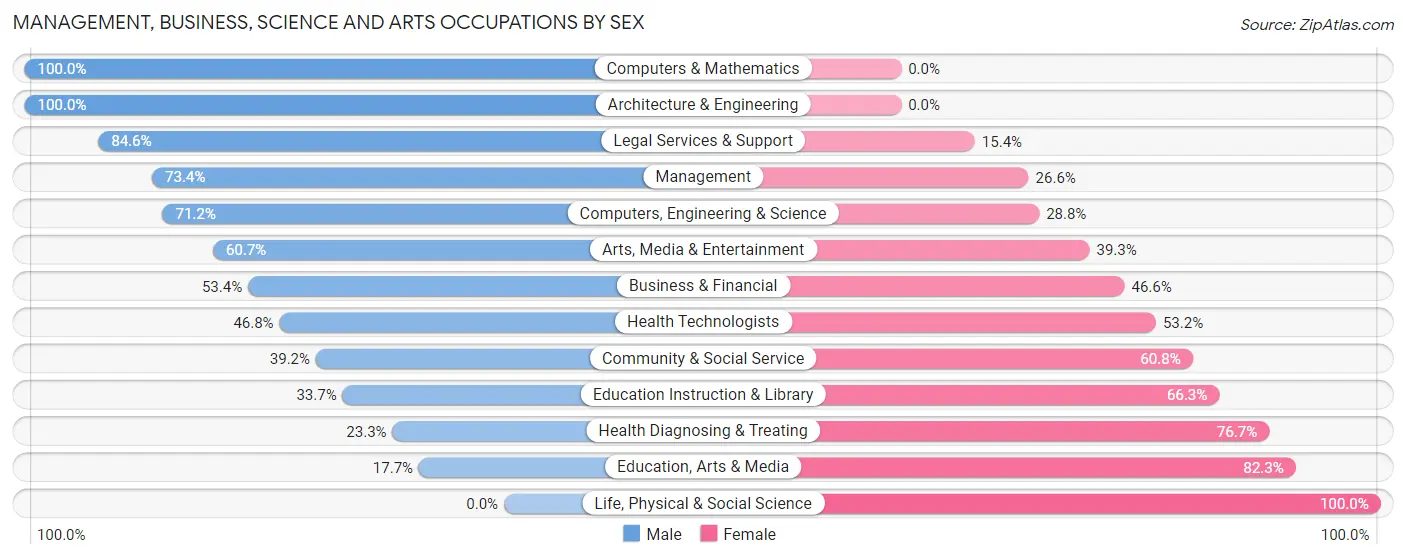
| Occupation | Male | Female |
| Management | 243 (73.4%) | 88 (26.6%) |
| Business & Financial | 55 (53.4%) | 48 (46.6%) |
| Computers, Engineering & Science | 47 (71.2%) | 19 (28.8%) |
| Computers & Mathematics | 26 (100.0%) | 0 (0.0%) |
| Architecture & Engineering | 21 (100.0%) | 0 (0.0%) |
| Life, Physical & Social Science | 0 (0.0%) | 19 (100.0%) |
| Community & Social Service | 124 (39.2%) | 192 (60.8%) |
| Education, Arts & Media | 11 (17.7%) | 51 (82.3%) |
| Legal Services & Support | 33 (84.6%) | 6 (15.4%) |
| Education Instruction & Library | 63 (33.7%) | 124 (66.3%) |
| Arts, Media & Entertainment | 17 (60.7%) | 11 (39.3%) |
| Health Diagnosing & Treating | 37 (23.3%) | 122 (76.7%) |
| Health Technologists | 37 (46.8%) | 42 (53.2%) |
| Total (Category) | 506 (51.9%) | 469 (48.1%) |
| Total (Overall) | 1,635 (53.3%) | 1,431 (46.7%) |
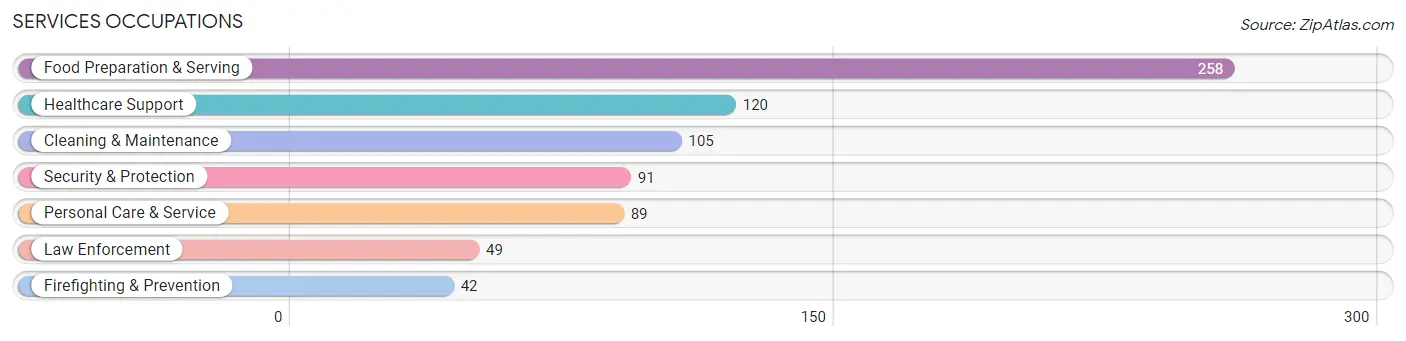
Services Occupations
The most common Services occupations in Sallisaw are Food Preparation & Serving (258 | 8.4%), Healthcare Support (120 | 3.9%), Cleaning & Maintenance (105 | 3.4%), Security & Protection (91 | 3.0%), and Personal Care & Service (89 | 2.9%).
Services Occupations by Sex
Within the Services occupations in Sallisaw, the most male-oriented occupations are Security & Protection (100.0%), Firefighting & Prevention (100.0%), and Law Enforcement (100.0%), while the most female-oriented occupations are Healthcare Support (85.8%), Personal Care & Service (80.9%), and Food Preparation & Serving (69.4%).
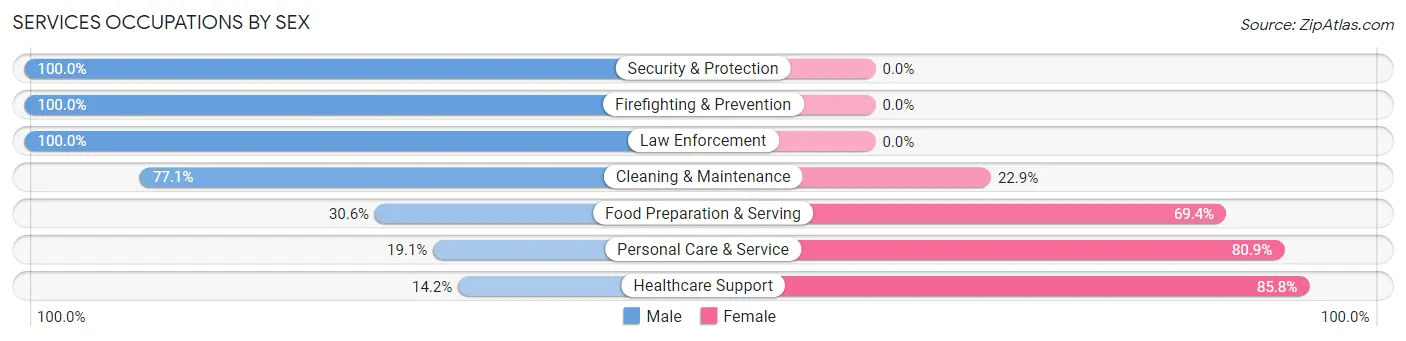
| Occupation | Male | Female |
| Healthcare Support | 17 (14.2%) | 103 (85.8%) |
| Security & Protection | 91 (100.0%) | 0 (0.0%) |
| Firefighting & Prevention | 42 (100.0%) | 0 (0.0%) |
| Law Enforcement | 49 (100.0%) | 0 (0.0%) |
| Food Preparation & Serving | 79 (30.6%) | 179 (69.4%) |
| Cleaning & Maintenance | 81 (77.1%) | 24 (22.9%) |
| Personal Care & Service | 17 (19.1%) | 72 (80.9%) |
| Total (Category) | 285 (43.0%) | 378 (57.0%) |
| Total (Overall) | 1,635 (53.3%) | 1,431 (46.7%) |
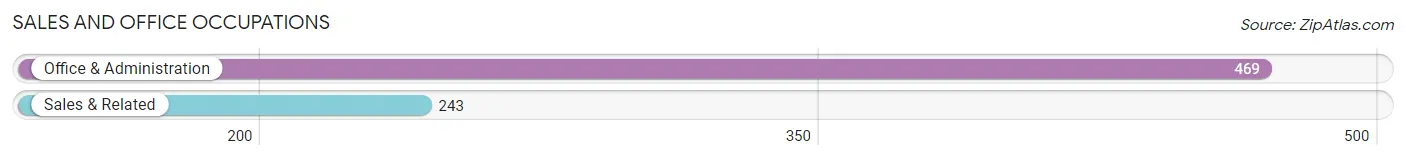
Sales and Office Occupations
The most common Sales and Office occupations in Sallisaw are Office & Administration (469 | 15.3%), and Sales & Related (243 | 7.9%).
Sales and Office Occupations by Sex
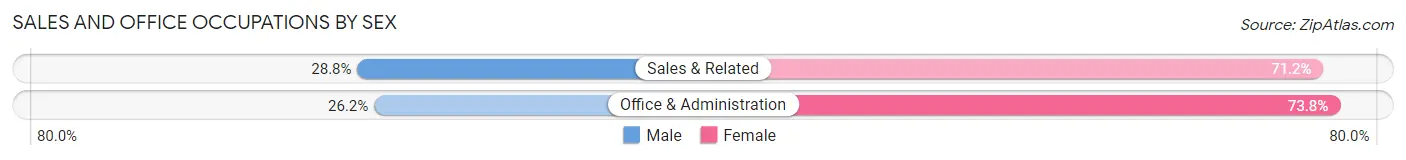
| Occupation | Male | Female |
| Sales & Related | 70 (28.8%) | 173 (71.2%) |
| Office & Administration | 123 (26.2%) | 346 (73.8%) |
| Total (Category) | 193 (27.1%) | 519 (72.9%) |
| Total (Overall) | 1,635 (53.3%) | 1,431 (46.7%) |
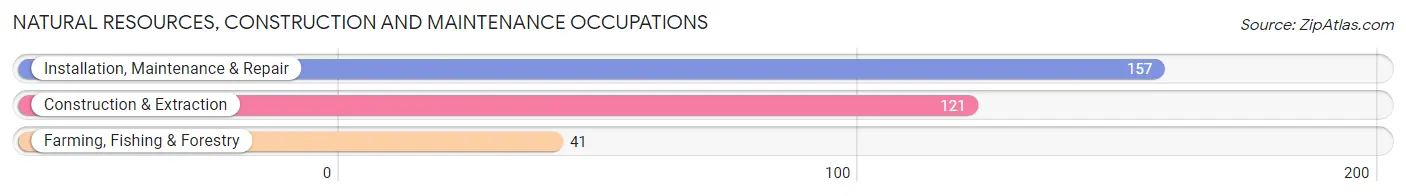
Natural Resources, Construction and Maintenance Occupations
The most common Natural Resources, Construction and Maintenance occupations in Sallisaw are Installation, Maintenance & Repair (157 | 5.1%), Construction & Extraction (121 | 4.0%), and Farming, Fishing & Forestry (41 | 1.3%).
Natural Resources, Construction and Maintenance Occupations by Sex
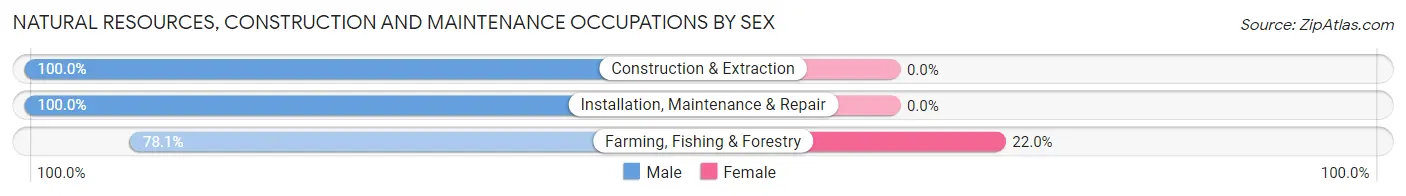
| Occupation | Male | Female |
| Farming, Fishing & Forestry | 32 (78.0%) | 9 (22.0%) |
| Construction & Extraction | 121 (100.0%) | 0 (0.0%) |
| Installation, Maintenance & Repair | 157 (100.0%) | 0 (0.0%) |
| Total (Category) | 310 (97.2%) | 9 (2.8%) |
| Total (Overall) | 1,635 (53.3%) | 1,431 (46.7%) |
Production, Transportation and Moving Occupations
The most common Production, Transportation and Moving occupations in Sallisaw are Production (189 | 6.2%), Transportation (104 | 3.4%), and Material Moving (104 | 3.4%).
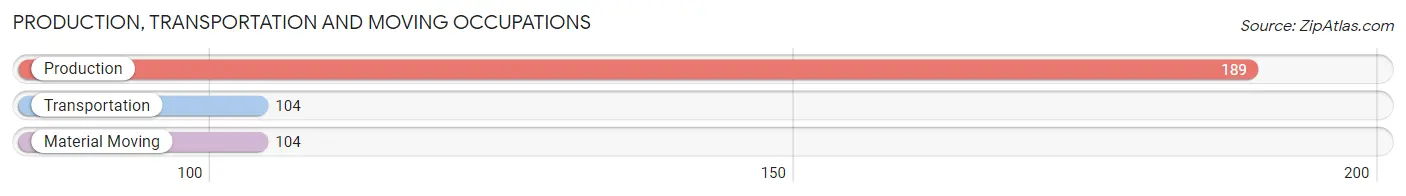
Production, Transportation and Moving Occupations by Sex
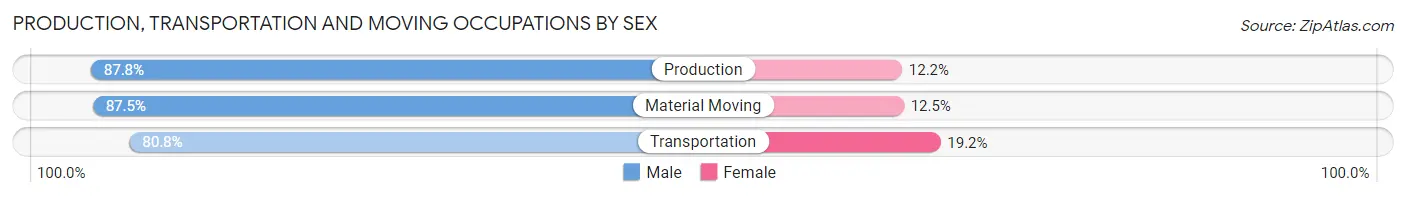
| Occupation | Male | Female |
| Production | 166 (87.8%) | 23 (12.2%) |
| Transportation | 84 (80.8%) | 20 (19.2%) |
| Material Moving | 91 (87.5%) | 13 (12.5%) |
| Total (Category) | 341 (85.9%) | 56 (14.1%) |
| Total (Overall) | 1,635 (53.3%) | 1,431 (46.7%) |
Employment Industries by Sex in Sallisaw
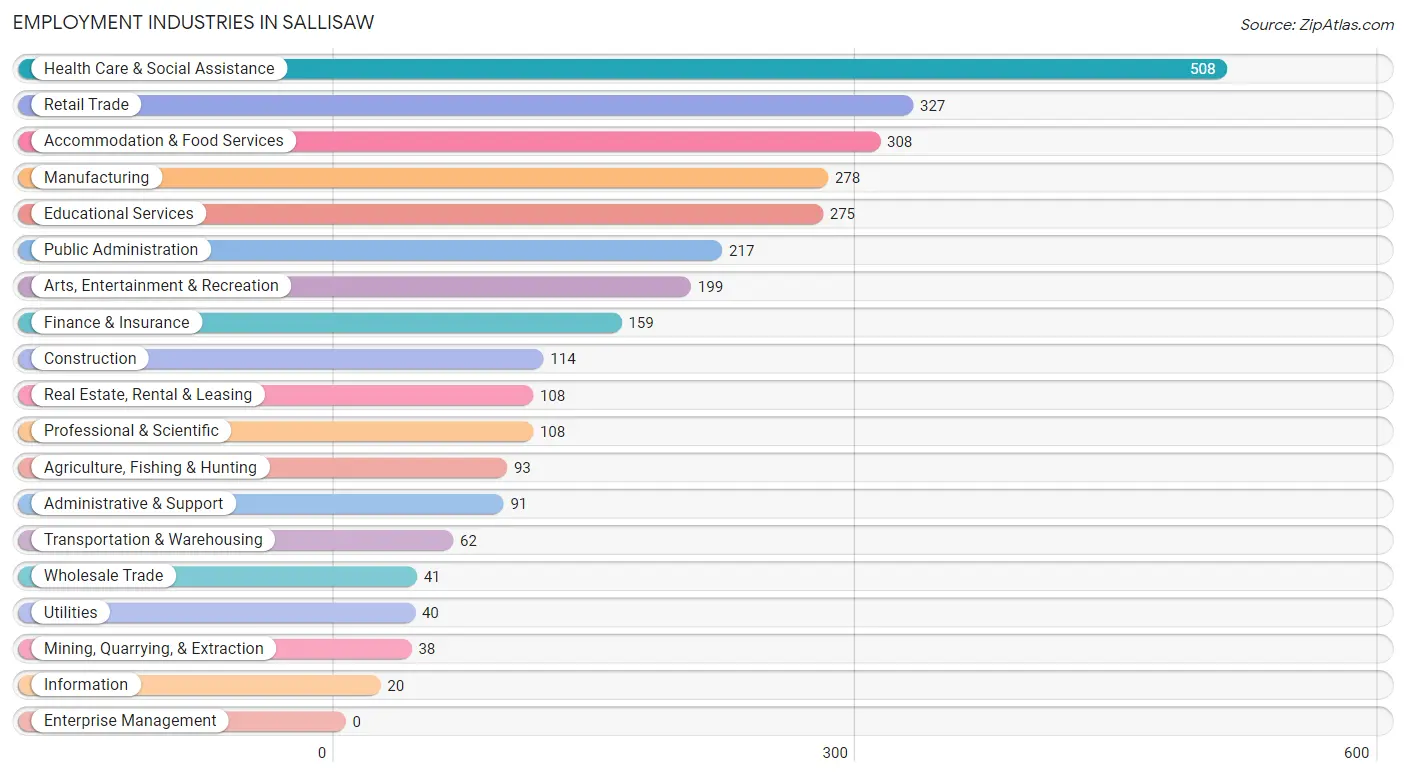
Employment Industries in Sallisaw
The major employment industries in Sallisaw include Health Care & Social Assistance (508 | 16.6%), Retail Trade (327 | 10.7%), Accommodation & Food Services (308 | 10.1%), Manufacturing (278 | 9.1%), and Educational Services (275 | 9.0%).
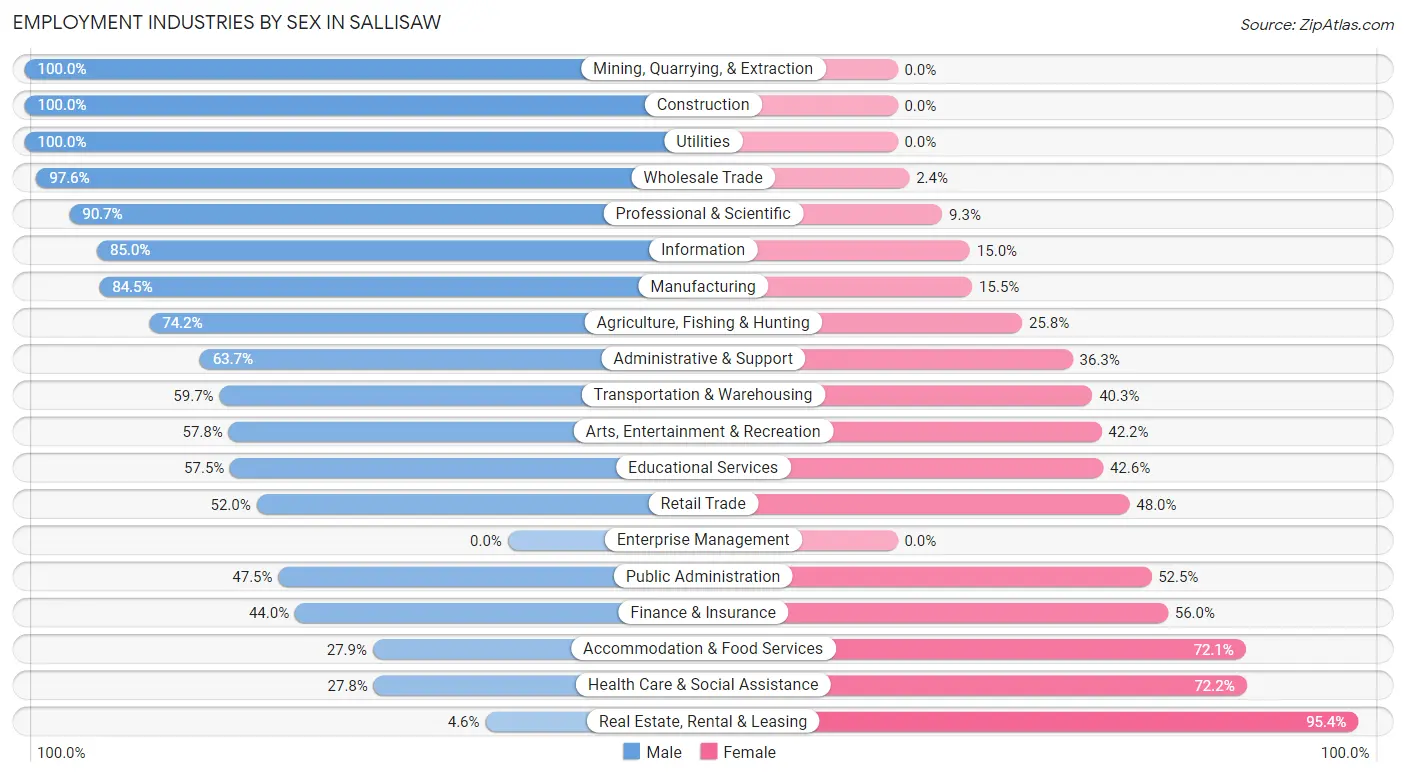
Employment Industries by Sex in Sallisaw
The Sallisaw industries that see more men than women are Mining, Quarrying, & Extraction (100.0%), Construction (100.0%), and Utilities (100.0%), whereas the industries that tend to have a higher number of women are Real Estate, Rental & Leasing (95.4%), Health Care & Social Assistance (72.2%), and Accommodation & Food Services (72.1%).
| Industry | Male | Female |
| Agriculture, Fishing & Hunting | 69 (74.2%) | 24 (25.8%) |
| Mining, Quarrying, & Extraction | 38 (100.0%) | 0 (0.0%) |
| Construction | 114 (100.0%) | 0 (0.0%) |
| Manufacturing | 235 (84.5%) | 43 (15.5%) |
| Wholesale Trade | 40 (97.6%) | 1 (2.4%) |
| Retail Trade | 170 (52.0%) | 157 (48.0%) |
| Transportation & Warehousing | 37 (59.7%) | 25 (40.3%) |
| Utilities | 40 (100.0%) | 0 (0.0%) |
| Information | 17 (85.0%) | 3 (15.0%) |
| Finance & Insurance | 70 (44.0%) | 89 (56.0%) |
| Real Estate, Rental & Leasing | 5 (4.6%) | 103 (95.4%) |
| Professional & Scientific | 98 (90.7%) | 10 (9.3%) |
| Enterprise Management | 0 (0.0%) | 0 (0.0%) |
| Administrative & Support | 58 (63.7%) | 33 (36.3%) |
| Educational Services | 158 (57.5%) | 117 (42.5%) |
| Health Care & Social Assistance | 141 (27.8%) | 367 (72.2%) |
| Arts, Entertainment & Recreation | 115 (57.8%) | 84 (42.2%) |
| Accommodation & Food Services | 86 (27.9%) | 222 (72.1%) |
| Public Administration | 103 (47.5%) | 114 (52.5%) |
| Total | 1,635 (53.3%) | 1,431 (46.7%) |
Education in Sallisaw
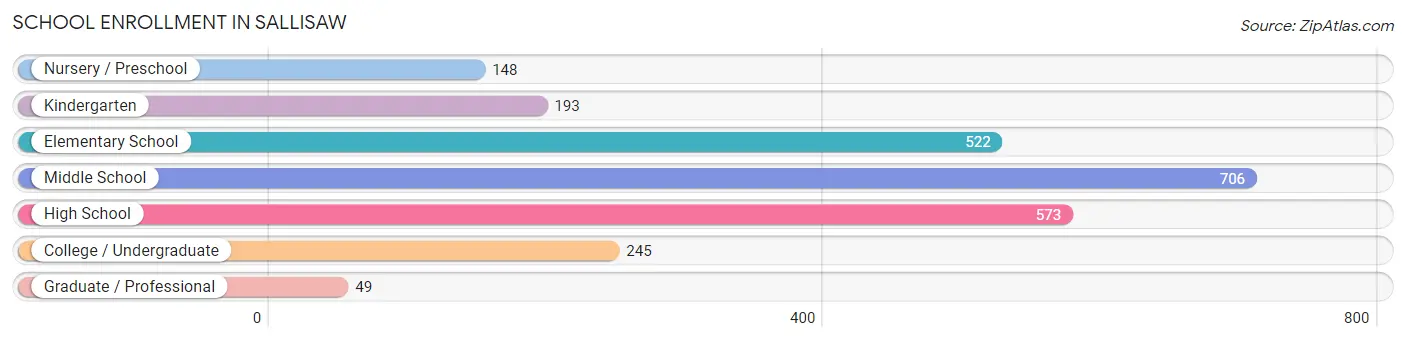
School Enrollment in Sallisaw
The most common levels of schooling among the 2,436 students in Sallisaw are middle school (706 | 29.0%), high school (573 | 23.5%), and elementary school (522 | 21.4%).
| School Level | # Students | % Students |
| Nursery / Preschool | 148 | 6.1% |
| Kindergarten | 193 | 7.9% |
| Elementary School | 522 | 21.4% |
| Middle School | 706 | 29.0% |
| High School | 573 | 23.5% |
| College / Undergraduate | 245 | 10.1% |
| Graduate / Professional | 49 | 2.0% |
| Total | 2,436 | 100.0% |
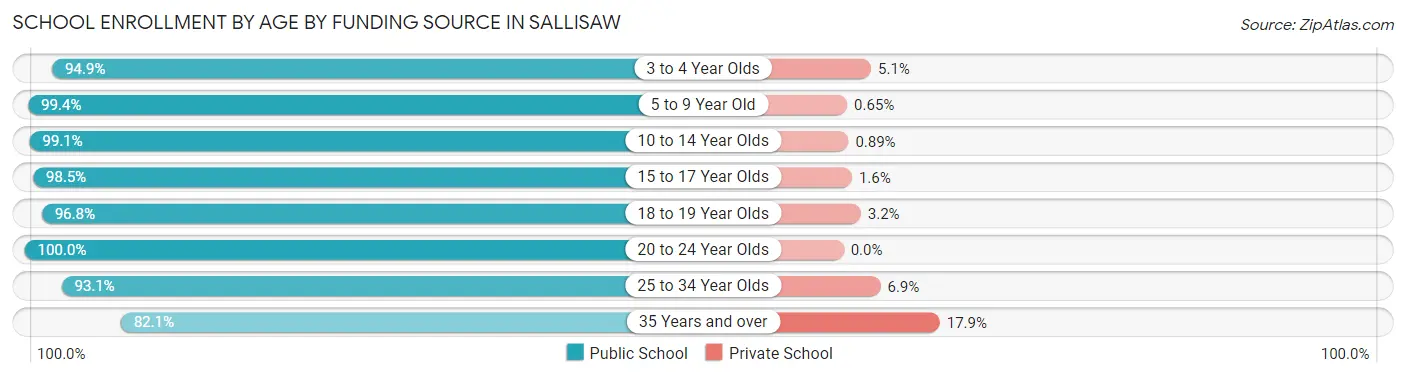
School Enrollment by Age by Funding Source in Sallisaw
Out of a total of 2,436 students who are enrolled in schools in Sallisaw, 51 (2.1%) attend a private institution, while the remaining 2,385 (97.9%) are enrolled in public schools. The age group of 35 years and over has the highest likelihood of being enrolled in private schools, with 12 (17.9% in the age bracket) enrolled. Conversely, the age group of 20 to 24 year olds has the lowest likelihood of being enrolled in a private school, with 84 (100.0% in the age bracket) attending a public institution.
| Age Bracket | Public School | Private School |
| 3 to 4 Year Olds | 167 (94.9%) | 9 (5.1%) |
| 5 to 9 Year Old | 608 (99.4%) | 4 (0.6%) |
| 10 to 14 Year Olds | 783 (99.1%) | 7 (0.9%) |
| 15 to 17 Year Olds | 444 (98.5%) | 7 (1.5%) |
| 18 to 19 Year Olds | 121 (96.8%) | 4 (3.2%) |
| 20 to 24 Year Olds | 84 (100.0%) | 0 (0.0%) |
| 25 to 34 Year Olds | 122 (93.1%) | 9 (6.9%) |
| 35 Years and over | 55 (82.1%) | 12 (17.9%) |
| Total | 2,385 (97.9%) | 51 (2.1%) |
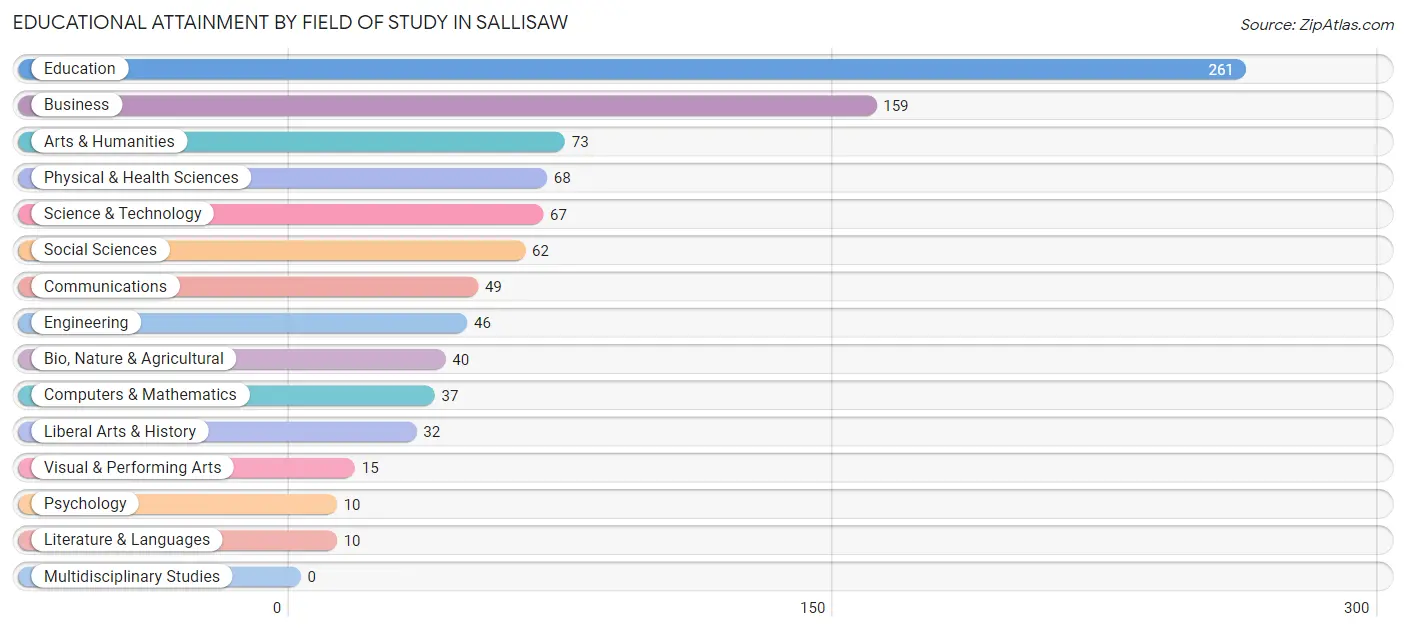
Educational Attainment by Field of Study in Sallisaw
Education (261 | 28.1%), business (159 | 17.1%), arts & humanities (73 | 7.9%), physical & health sciences (68 | 7.3%), and science & technology (67 | 7.2%) are the most common fields of study among 929 individuals in Sallisaw who have obtained a bachelor's degree or higher.
| Field of Study | # Graduates | % Graduates |
| Computers & Mathematics | 37 | 4.0% |
| Bio, Nature & Agricultural | 40 | 4.3% |
| Physical & Health Sciences | 68 | 7.3% |
| Psychology | 10 | 1.1% |
| Social Sciences | 62 | 6.7% |
| Engineering | 46 | 5.0% |
| Multidisciplinary Studies | 0 | 0.0% |
| Science & Technology | 67 | 7.2% |
| Business | 159 | 17.1% |
| Education | 261 | 28.1% |
| Literature & Languages | 10 | 1.1% |
| Liberal Arts & History | 32 | 3.4% |
| Visual & Performing Arts | 15 | 1.6% |
| Communications | 49 | 5.3% |
| Arts & Humanities | 73 | 7.9% |
| Total | 929 | 100.0% |
Transportation & Commute in Sallisaw
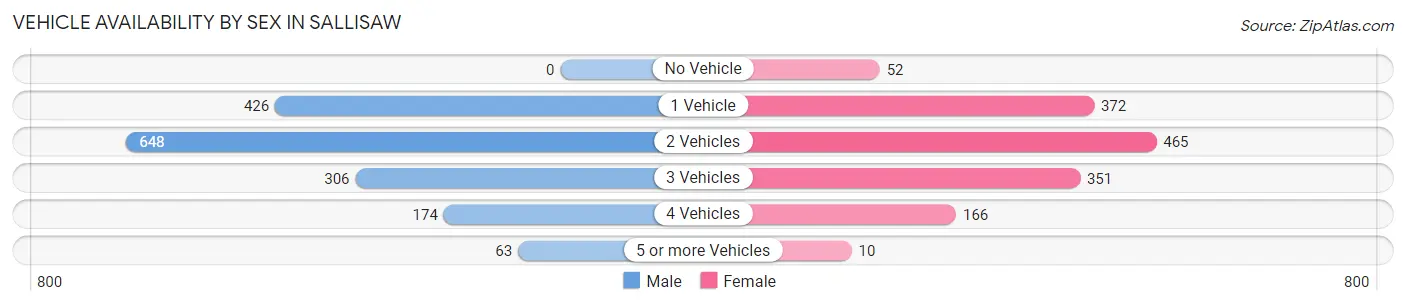
Vehicle Availability by Sex in Sallisaw
The most prevalent vehicle ownership categories in Sallisaw are males with 2 vehicles (648, accounting for 40.1%) and females with 2 vehicles (465, making up 45.8%).
| Vehicles Available | Male | Female |
| No Vehicle | 0 (0.0%) | 52 (3.7%) |
| 1 Vehicle | 426 (26.4%) | 372 (26.3%) |
| 2 Vehicles | 648 (40.1%) | 465 (32.8%) |
| 3 Vehicles | 306 (18.9%) | 351 (24.8%) |
| 4 Vehicles | 174 (10.8%) | 166 (11.7%) |
| 5 or more Vehicles | 63 (3.9%) | 10 (0.7%) |
| Total | 1,617 (100.0%) | 1,416 (100.0%) |
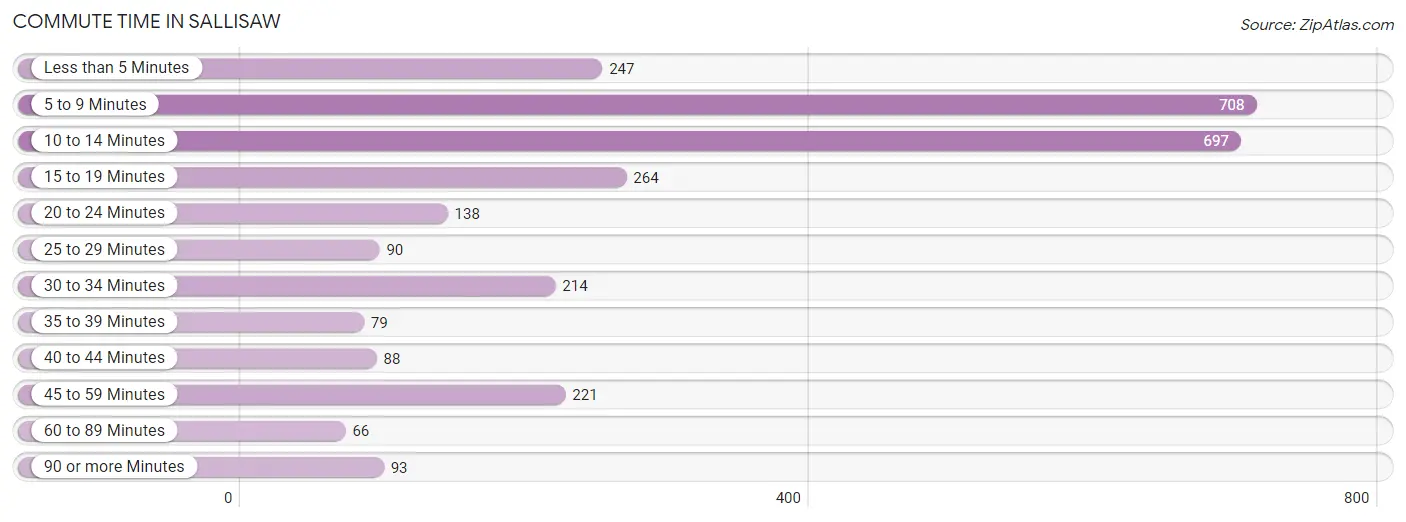
Commute Time in Sallisaw
The most frequently occuring commute durations in Sallisaw are 5 to 9 minutes (708 commuters, 24.4%), 10 to 14 minutes (697 commuters, 24.0%), and 15 to 19 minutes (264 commuters, 9.1%).
| Commute Time | # Commuters | % Commuters |
| Less than 5 Minutes | 247 | 8.5% |
| 5 to 9 Minutes | 708 | 24.4% |
| 10 to 14 Minutes | 697 | 24.0% |
| 15 to 19 Minutes | 264 | 9.1% |
| 20 to 24 Minutes | 138 | 4.8% |
| 25 to 29 Minutes | 90 | 3.1% |
| 30 to 34 Minutes | 214 | 7.4% |
| 35 to 39 Minutes | 79 | 2.7% |
| 40 to 44 Minutes | 88 | 3.0% |
| 45 to 59 Minutes | 221 | 7.6% |
| 60 to 89 Minutes | 66 | 2.3% |
| 90 or more Minutes | 93 | 3.2% |
Commute Time by Sex in Sallisaw
The most common commute times in Sallisaw are 5 to 9 minutes (328 commuters, 21.6%) for males and 10 to 14 minutes (384 commuters, 27.7%) for females.
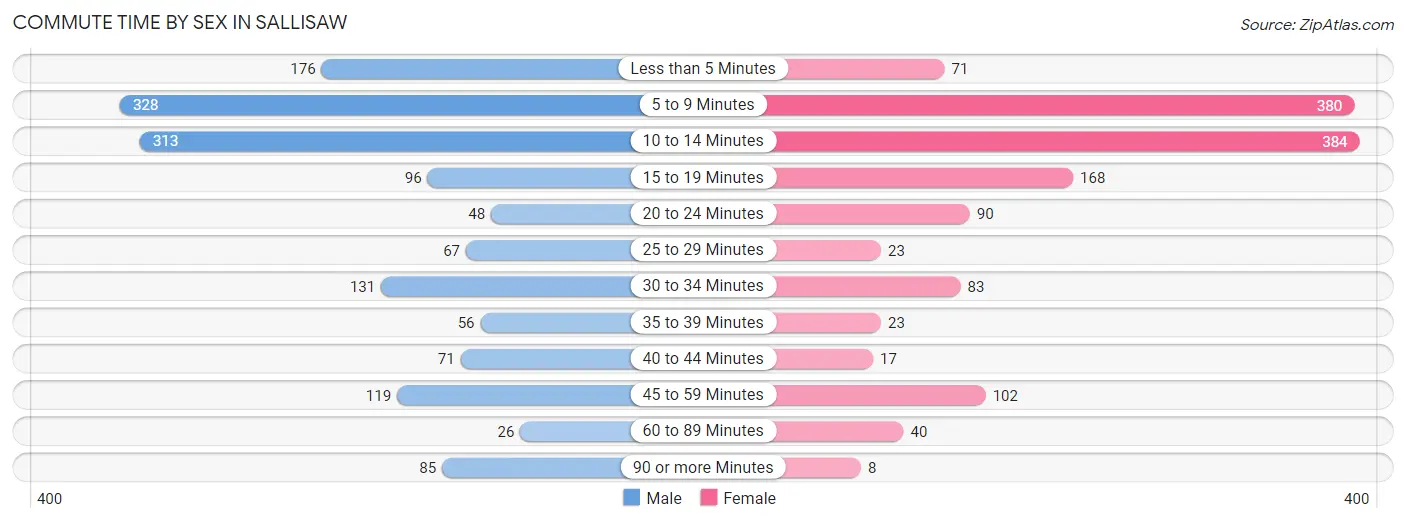
| Commute Time | Male | Female |
| Less than 5 Minutes | 176 (11.6%) | 71 (5.1%) |
| 5 to 9 Minutes | 328 (21.6%) | 380 (27.4%) |
| 10 to 14 Minutes | 313 (20.6%) | 384 (27.7%) |
| 15 to 19 Minutes | 96 (6.3%) | 168 (12.1%) |
| 20 to 24 Minutes | 48 (3.2%) | 90 (6.5%) |
| 25 to 29 Minutes | 67 (4.4%) | 23 (1.7%) |
| 30 to 34 Minutes | 131 (8.6%) | 83 (6.0%) |
| 35 to 39 Minutes | 56 (3.7%) | 23 (1.7%) |
| 40 to 44 Minutes | 71 (4.7%) | 17 (1.2%) |
| 45 to 59 Minutes | 119 (7.9%) | 102 (7.3%) |
| 60 to 89 Minutes | 26 (1.7%) | 40 (2.9%) |
| 90 or more Minutes | 85 (5.6%) | 8 (0.6%) |
Time of Departure to Work by Sex in Sallisaw
The most frequent times of departure to work in Sallisaw are 6:30 AM to 6:59 AM (242, 16.0%) for males and 7:30 AM to 7:59 AM (366, 26.4%) for females.
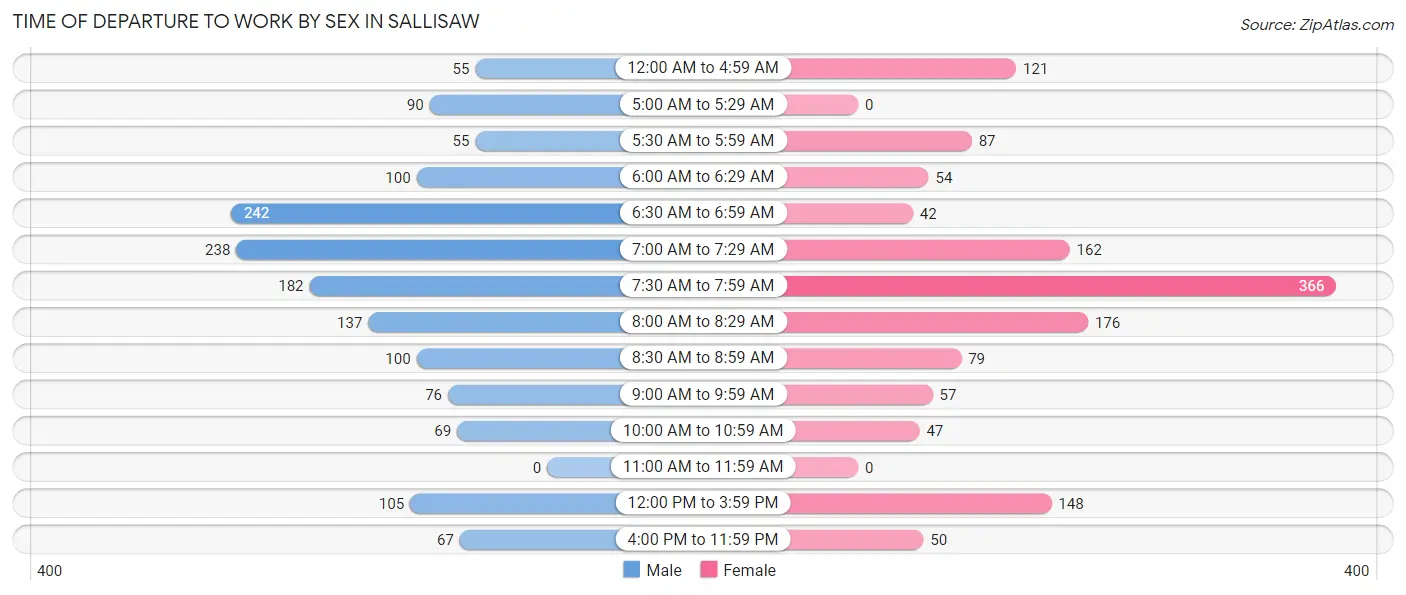
| Time of Departure | Male | Female |
| 12:00 AM to 4:59 AM | 55 (3.6%) | 121 (8.7%) |
| 5:00 AM to 5:29 AM | 90 (5.9%) | 0 (0.0%) |
| 5:30 AM to 5:59 AM | 55 (3.6%) | 87 (6.3%) |
| 6:00 AM to 6:29 AM | 100 (6.6%) | 54 (3.9%) |
| 6:30 AM to 6:59 AM | 242 (16.0%) | 42 (3.0%) |
| 7:00 AM to 7:29 AM | 238 (15.7%) | 162 (11.7%) |
| 7:30 AM to 7:59 AM | 182 (12.0%) | 366 (26.4%) |
| 8:00 AM to 8:29 AM | 137 (9.0%) | 176 (12.7%) |
| 8:30 AM to 8:59 AM | 100 (6.6%) | 79 (5.7%) |
| 9:00 AM to 9:59 AM | 76 (5.0%) | 57 (4.1%) |
| 10:00 AM to 10:59 AM | 69 (4.5%) | 47 (3.4%) |
| 11:00 AM to 11:59 AM | 0 (0.0%) | 0 (0.0%) |
| 12:00 PM to 3:59 PM | 105 (6.9%) | 148 (10.7%) |
| 4:00 PM to 11:59 PM | 67 (4.4%) | 50 (3.6%) |
| Total | 1,516 (100.0%) | 1,389 (100.0%) |
Housing Occupancy in Sallisaw
Occupancy by Ownership in Sallisaw
Of the total 3,132 dwellings in Sallisaw, owner-occupied units account for 1,650 (52.7%), while renter-occupied units make up 1,482 (47.3%).
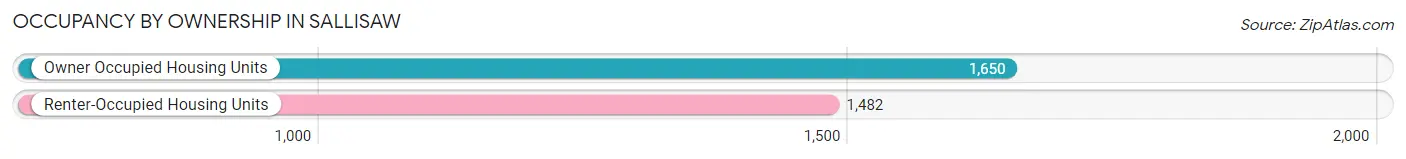
| Occupancy | # Housing Units | % Housing Units |
| Owner Occupied Housing Units | 1,650 | 52.7% |
| Renter-Occupied Housing Units | 1,482 | 47.3% |
| Total Occupied Housing Units | 3,132 | 100.0% |
Occupancy by Household Size in Sallisaw
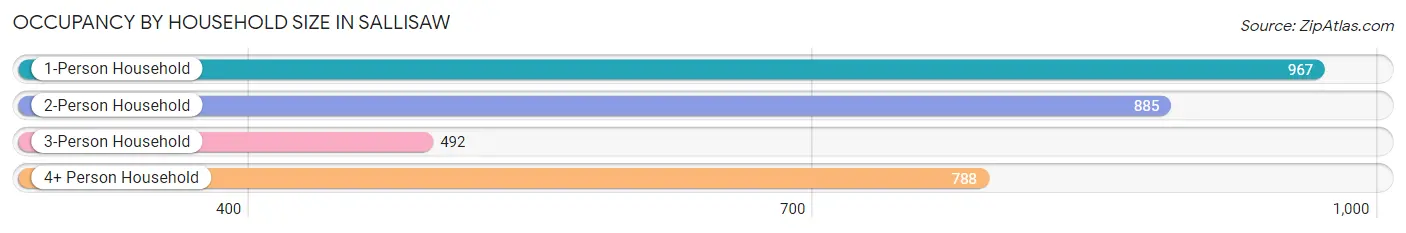
| Household Size | # Housing Units | % Housing Units |
| 1-Person Household | 967 | 30.9% |
| 2-Person Household | 885 | 28.3% |
| 3-Person Household | 492 | 15.7% |
| 4+ Person Household | 788 | 25.2% |
| Total Housing Units | 3,132 | 100.0% |
Occupancy by Ownership by Household Size in Sallisaw
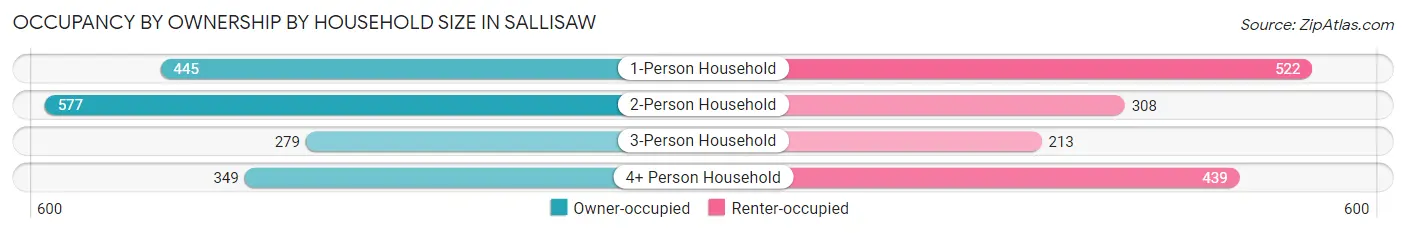
| Household Size | Owner-occupied | Renter-occupied |
| 1-Person Household | 445 (46.0%) | 522 (54.0%) |
| 2-Person Household | 577 (65.2%) | 308 (34.8%) |
| 3-Person Household | 279 (56.7%) | 213 (43.3%) |
| 4+ Person Household | 349 (44.3%) | 439 (55.7%) |
| Total Housing Units | 1,650 (52.7%) | 1,482 (47.3%) |
Occupancy by Educational Attainment in Sallisaw
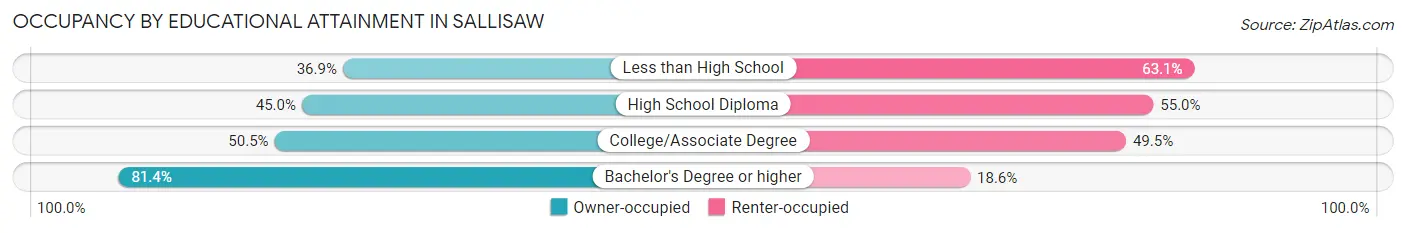
| Household Size | Owner-occupied | Renter-occupied |
| Less than High School | 158 (36.9%) | 270 (63.1%) |
| High School Diploma | 431 (45.0%) | 526 (55.0%) |
| College/Associate Degree | 589 (50.5%) | 578 (49.5%) |
| Bachelor's Degree or higher | 472 (81.4%) | 108 (18.6%) |
Occupancy by Age of Householder in Sallisaw
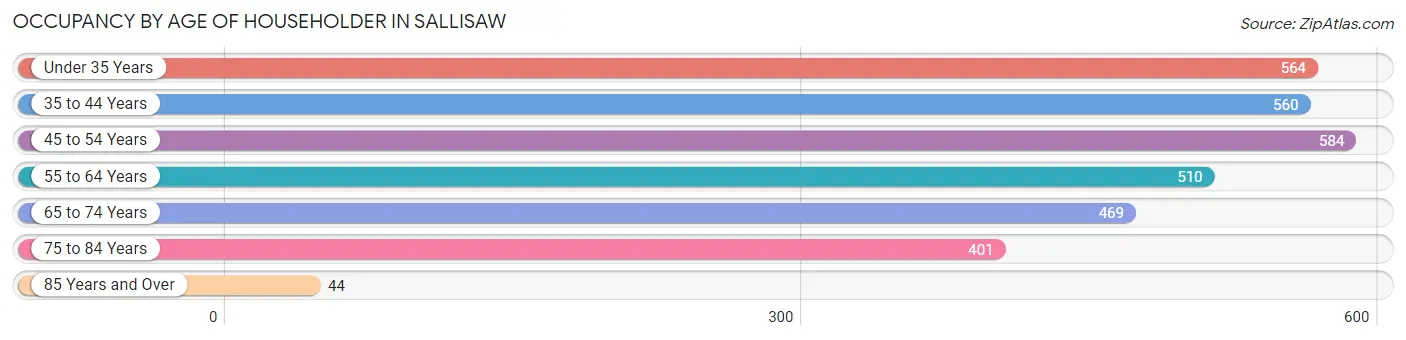
| Age Bracket | # Households | % Households |
| Under 35 Years | 564 | 18.0% |
| 35 to 44 Years | 560 | 17.9% |
| 45 to 54 Years | 584 | 18.6% |
| 55 to 64 Years | 510 | 16.3% |
| 65 to 74 Years | 469 | 15.0% |
| 75 to 84 Years | 401 | 12.8% |
| 85 Years and Over | 44 | 1.4% |
| Total | 3,132 | 100.0% |
Housing Finances in Sallisaw
Median Income by Occupancy in Sallisaw
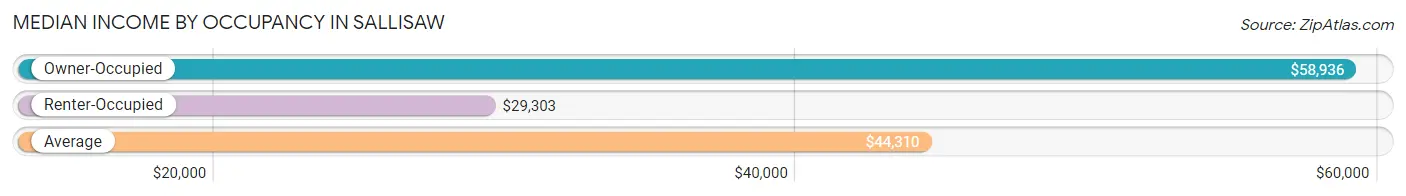
| Occupancy Type | # Households | Median Income |
| Owner-Occupied | 1,650 (52.7%) | $58,936 |
| Renter-Occupied | 1,482 (47.3%) | $29,303 |
| Average | 3,132 (100.0%) | $44,310 |
Occupancy by Householder Income Bracket in Sallisaw
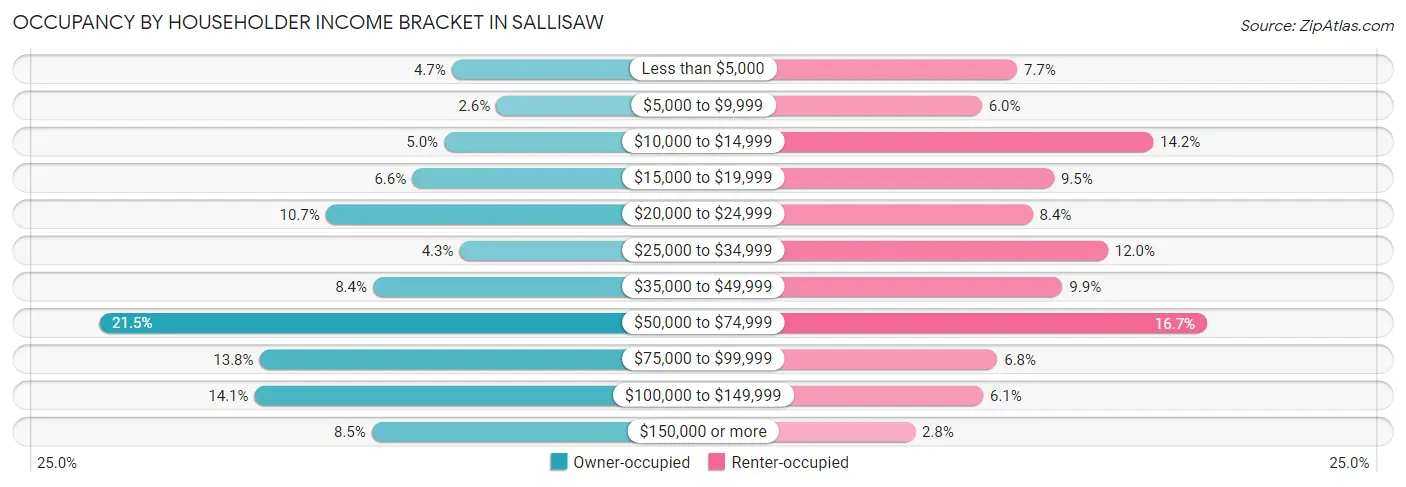
| Income Bracket | Owner-occupied | Renter-occupied |
| Less than $5,000 | 77 (4.7%) | 114 (7.7%) |
| $5,000 to $9,999 | 42 (2.5%) | 89 (6.0%) |
| $10,000 to $14,999 | 83 (5.0%) | 210 (14.2%) |
| $15,000 to $19,999 | 108 (6.6%) | 140 (9.5%) |
| $20,000 to $24,999 | 176 (10.7%) | 125 (8.4%) |
| $25,000 to $34,999 | 71 (4.3%) | 178 (12.0%) |
| $35,000 to $49,999 | 139 (8.4%) | 146 (9.9%) |
| $50,000 to $74,999 | 354 (21.4%) | 248 (16.7%) |
| $75,000 to $99,999 | 228 (13.8%) | 100 (6.8%) |
| $100,000 to $149,999 | 232 (14.1%) | 90 (6.1%) |
| $150,000 or more | 140 (8.5%) | 42 (2.8%) |
| Total | 1,650 (100.0%) | 1,482 (100.0%) |
Monthly Housing Cost Tiers in Sallisaw
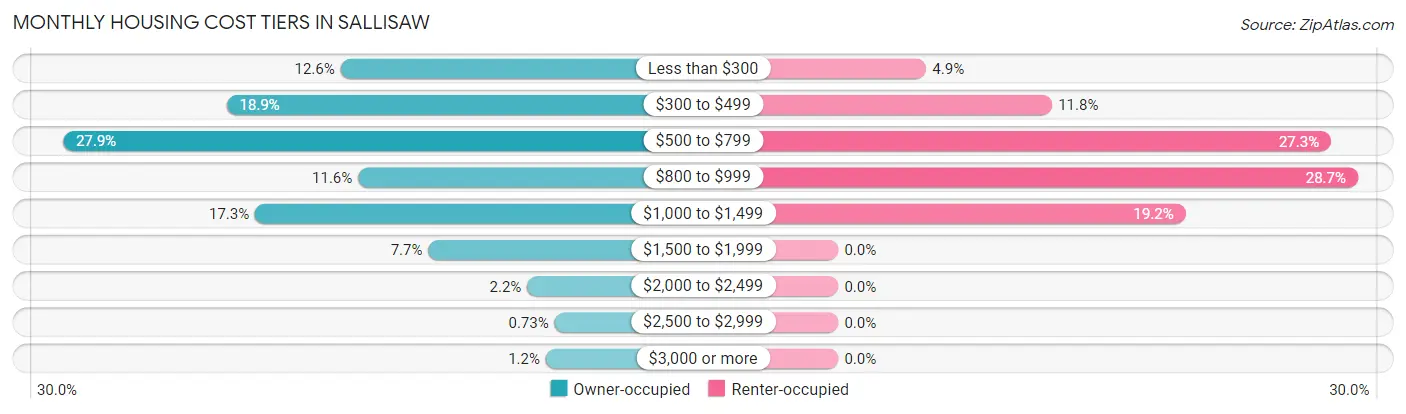
| Monthly Cost | Owner-occupied | Renter-occupied |
| Less than $300 | 207 (12.6%) | 72 (4.9%) |
| $300 to $499 | 311 (18.9%) | 175 (11.8%) |
| $500 to $799 | 460 (27.9%) | 404 (27.3%) |
| $800 to $999 | 191 (11.6%) | 426 (28.7%) |
| $1,000 to $1,499 | 285 (17.3%) | 285 (19.2%) |
| $1,500 to $1,999 | 127 (7.7%) | 0 (0.0%) |
| $2,000 to $2,499 | 37 (2.2%) | 0 (0.0%) |
| $2,500 to $2,999 | 12 (0.7%) | 0 (0.0%) |
| $3,000 or more | 20 (1.2%) | 0 (0.0%) |
| Total | 1,650 (100.0%) | 1,482 (100.0%) |
Physical Housing Characteristics in Sallisaw
Housing Structures in Sallisaw
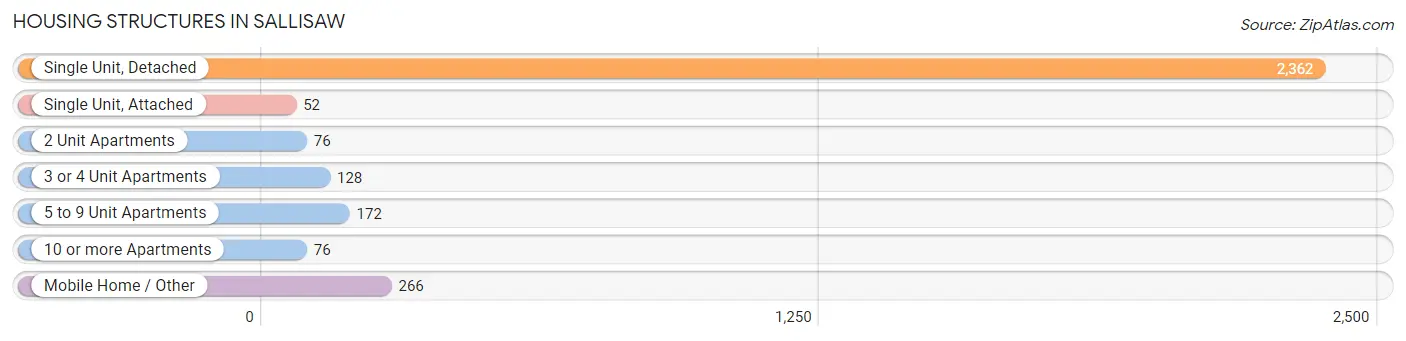
| Structure Type | # Housing Units | % Housing Units |
| Single Unit, Detached | 2,362 | 75.4% |
| Single Unit, Attached | 52 | 1.7% |
| 2 Unit Apartments | 76 | 2.4% |
| 3 or 4 Unit Apartments | 128 | 4.1% |
| 5 to 9 Unit Apartments | 172 | 5.5% |
| 10 or more Apartments | 76 | 2.4% |
| Mobile Home / Other | 266 | 8.5% |
| Total | 3,132 | 100.0% |
Housing Structures by Occupancy in Sallisaw
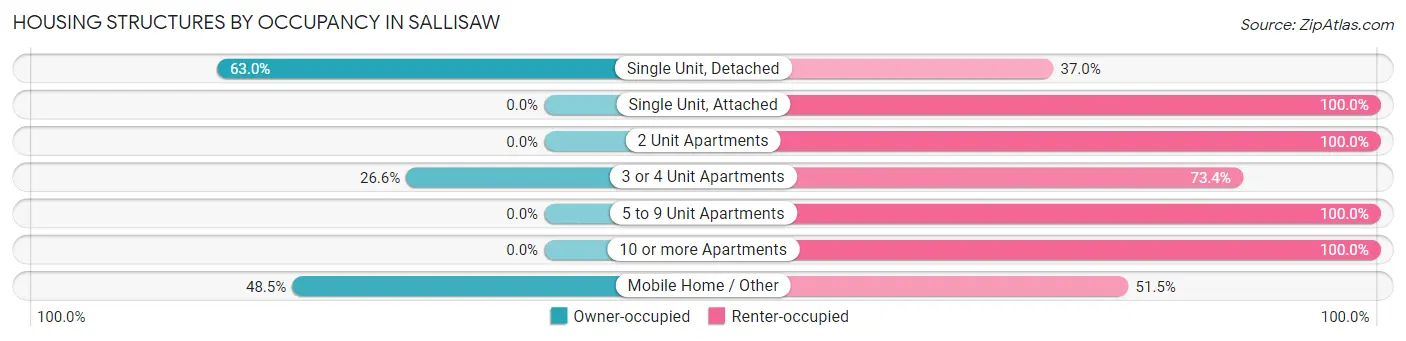
| Structure Type | Owner-occupied | Renter-occupied |
| Single Unit, Detached | 1,487 (63.0%) | 875 (37.0%) |
| Single Unit, Attached | 0 (0.0%) | 52 (100.0%) |
| 2 Unit Apartments | 0 (0.0%) | 76 (100.0%) |
| 3 or 4 Unit Apartments | 34 (26.6%) | 94 (73.4%) |
| 5 to 9 Unit Apartments | 0 (0.0%) | 172 (100.0%) |
| 10 or more Apartments | 0 (0.0%) | 76 (100.0%) |
| Mobile Home / Other | 129 (48.5%) | 137 (51.5%) |
| Total | 1,650 (52.7%) | 1,482 (47.3%) |
Housing Structures by Number of Rooms in Sallisaw
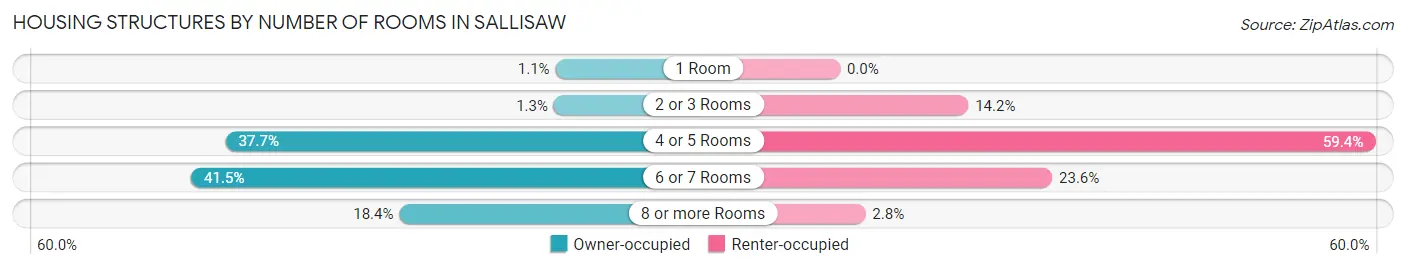
| Number of Rooms | Owner-occupied | Renter-occupied |
| 1 Room | 18 (1.1%) | 0 (0.0%) |
| 2 or 3 Rooms | 21 (1.3%) | 211 (14.2%) |
| 4 or 5 Rooms | 622 (37.7%) | 880 (59.4%) |
| 6 or 7 Rooms | 685 (41.5%) | 349 (23.5%) |
| 8 or more Rooms | 304 (18.4%) | 42 (2.8%) |
| Total | 1,650 (100.0%) | 1,482 (100.0%) |
Housing Structure by Heating Type in Sallisaw
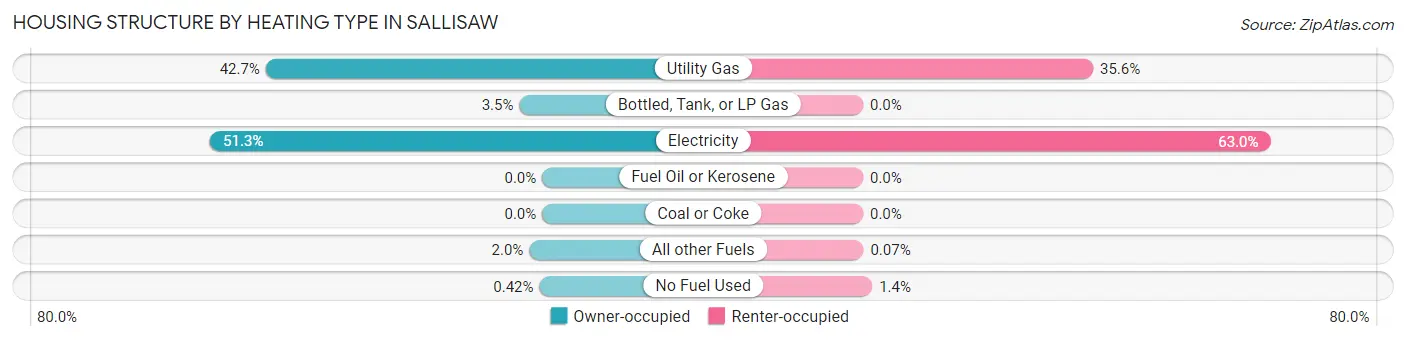
| Heating Type | Owner-occupied | Renter-occupied |
| Utility Gas | 705 (42.7%) | 527 (35.6%) |
| Bottled, Tank, or LP Gas | 58 (3.5%) | 0 (0.0%) |
| Electricity | 847 (51.3%) | 933 (63.0%) |
| Fuel Oil or Kerosene | 0 (0.0%) | 0 (0.0%) |
| Coal or Coke | 0 (0.0%) | 0 (0.0%) |
| All other Fuels | 33 (2.0%) | 1 (0.1%) |
| No Fuel Used | 7 (0.4%) | 21 (1.4%) |
| Total | 1,650 (100.0%) | 1,482 (100.0%) |
Household Vehicle Usage in Sallisaw
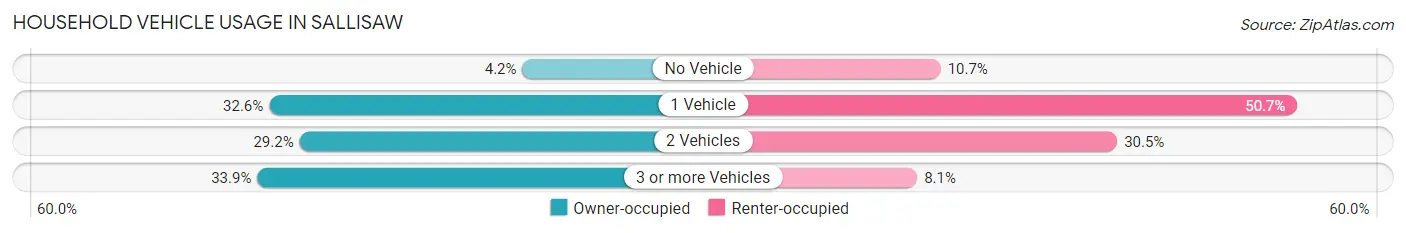
| Vehicles per Household | Owner-occupied | Renter-occupied |
| No Vehicle | 70 (4.2%) | 159 (10.7%) |
| 1 Vehicle | 538 (32.6%) | 751 (50.7%) |
| 2 Vehicles | 482 (29.2%) | 452 (30.5%) |
| 3 or more Vehicles | 560 (33.9%) | 120 (8.1%) |
| Total | 1,650 (100.0%) | 1,482 (100.0%) |
Real Estate & Mortgages in Sallisaw
Real Estate and Mortgage Overview in Sallisaw
| Characteristic | Without Mortgage | With Mortgage |
| Housing Units | 809 | 841 |
| Median Property Value | $110,700 | $131,500 |
| Median Household Income | $38,628 | $117 |
| Monthly Housing Costs | $435 | $20 |
| Real Estate Taxes | $738 | $39 |
Property Value by Mortgage Status in Sallisaw
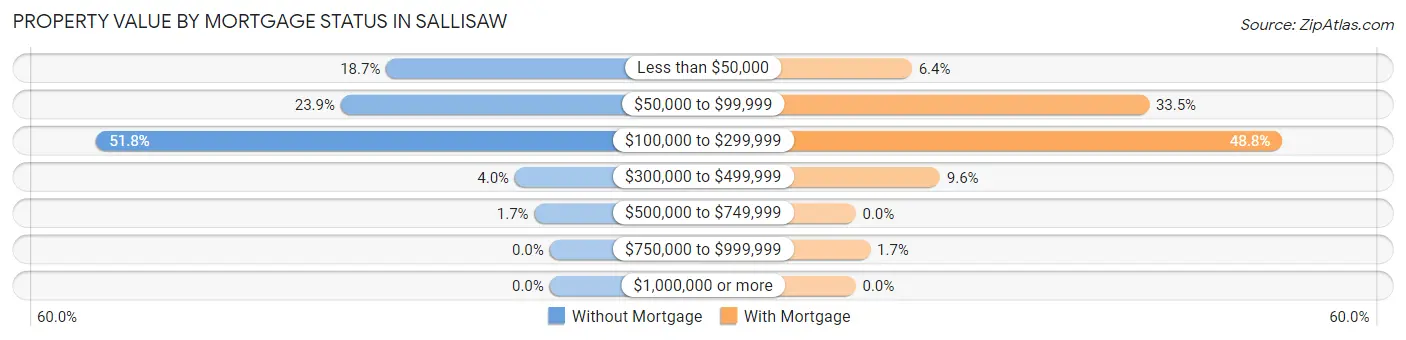
| Property Value | Without Mortgage | With Mortgage |
| Less than $50,000 | 151 (18.7%) | 54 (6.4%) |
| $50,000 to $99,999 | 193 (23.9%) | 282 (33.5%) |
| $100,000 to $299,999 | 419 (51.8%) | 410 (48.7%) |
| $300,000 to $499,999 | 32 (4.0%) | 81 (9.6%) |
| $500,000 to $749,999 | 14 (1.7%) | 0 (0.0%) |
| $750,000 to $999,999 | 0 (0.0%) | 14 (1.7%) |
| $1,000,000 or more | 0 (0.0%) | 0 (0.0%) |
| Total | 809 (100.0%) | 841 (100.0%) |
Household Income by Mortgage Status in Sallisaw
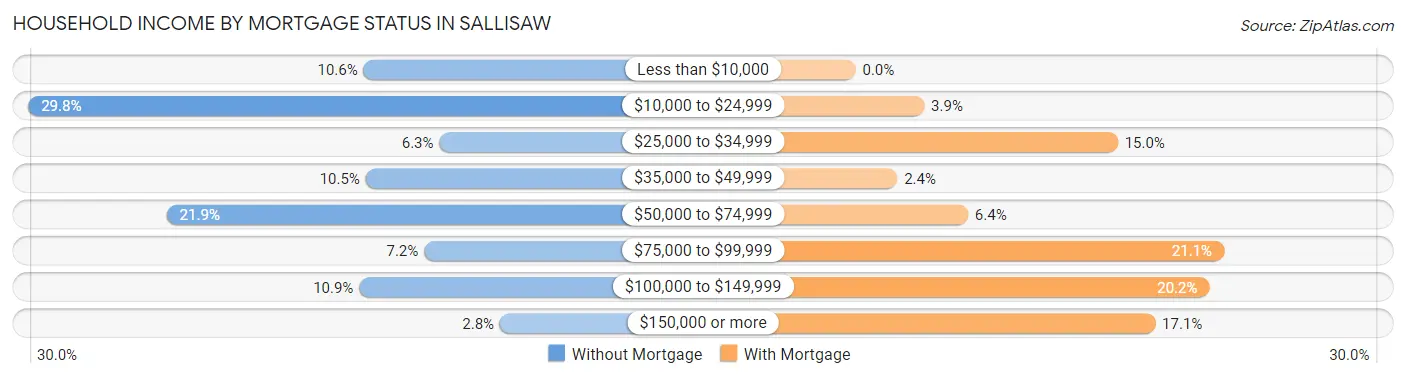
| Household Income | Without Mortgage | With Mortgage |
| Less than $10,000 | 86 (10.6%) | 0 (0.0%) |
| $10,000 to $24,999 | 241 (29.8%) | 33 (3.9%) |
| $25,000 to $34,999 | 51 (6.3%) | 126 (15.0%) |
| $35,000 to $49,999 | 85 (10.5%) | 20 (2.4%) |
| $50,000 to $74,999 | 177 (21.9%) | 54 (6.4%) |
| $75,000 to $99,999 | 58 (7.2%) | 177 (21.0%) |
| $100,000 to $149,999 | 88 (10.9%) | 170 (20.2%) |
| $150,000 or more | 23 (2.8%) | 144 (17.1%) |
| Total | 809 (100.0%) | 841 (100.0%) |
Property Value to Household Income Ratio in Sallisaw
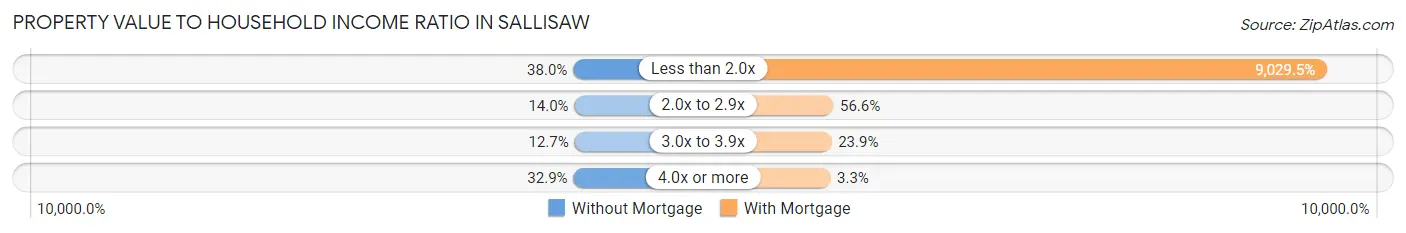
| Value-to-Income Ratio | Without Mortgage | With Mortgage |
| Less than 2.0x | 307 (38.0%) | 75,938 (9,029.5%) |
| 2.0x to 2.9x | 113 (14.0%) | 476 (56.6%) |
| 3.0x to 3.9x | 103 (12.7%) | 201 (23.9%) |
| 4.0x or more | 266 (32.9%) | 28 (3.3%) |
| Total | 809 (100.0%) | 841 (100.0%) |
Real Estate Taxes by Mortgage Status in Sallisaw
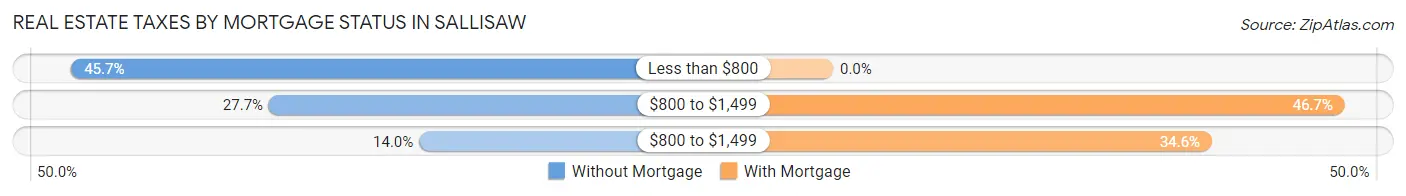
| Property Taxes | Without Mortgage | With Mortgage |
| Less than $800 | 370 (45.7%) | 0 (0.0%) |
| $800 to $1,499 | 224 (27.7%) | 393 (46.7%) |
| $800 to $1,499 | 113 (14.0%) | 291 (34.6%) |
| Total | 809 (100.0%) | 841 (100.0%) |
Health & Disability in Sallisaw
Health Insurance Coverage by Age in Sallisaw
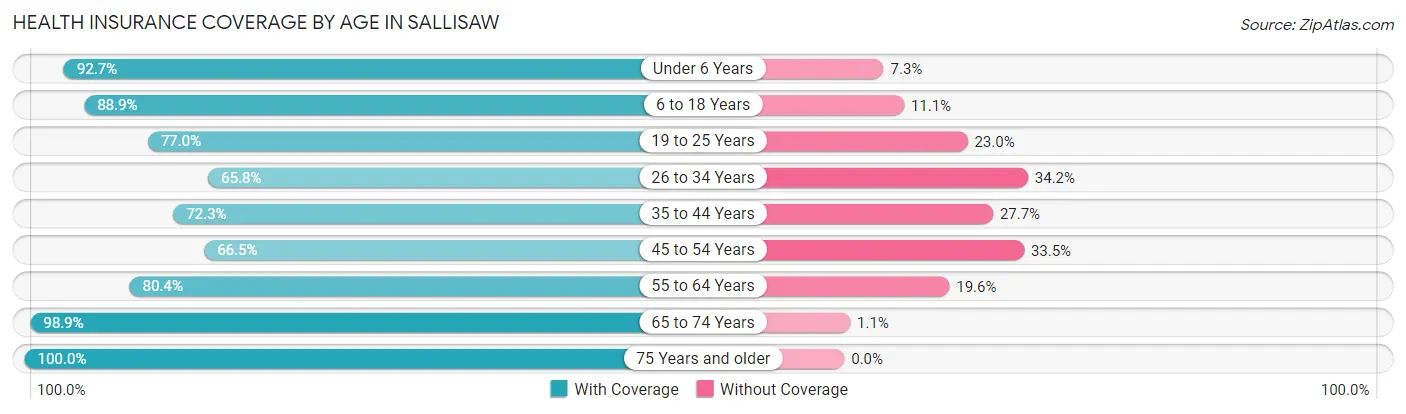
| Age Bracket | With Coverage | Without Coverage |
| Under 6 Years | 758 (92.7%) | 60 (7.3%) |
| 6 to 18 Years | 1,623 (88.9%) | 203 (11.1%) |
| 19 to 25 Years | 379 (77.0%) | 113 (23.0%) |
| 26 to 34 Years | 684 (65.8%) | 356 (34.2%) |
| 35 to 44 Years | 764 (72.3%) | 293 (27.7%) |
| 45 to 54 Years | 653 (66.5%) | 329 (33.5%) |
| 55 to 64 Years | 682 (80.4%) | 166 (19.6%) |
| 65 to 74 Years | 641 (98.9%) | 7 (1.1%) |
| 75 Years and older | 619 (100.0%) | 0 (0.0%) |
| Total | 6,803 (81.7%) | 1,527 (18.3%) |
Health Insurance Coverage by Citizenship Status in Sallisaw
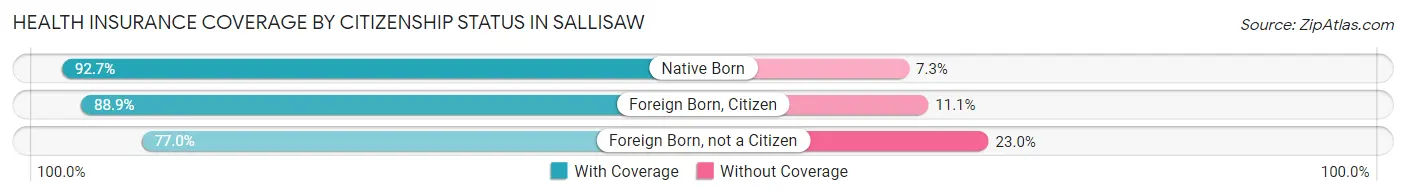
| Citizenship Status | With Coverage | Without Coverage |
| Native Born | 758 (92.7%) | 60 (7.3%) |
| Foreign Born, Citizen | 1,623 (88.9%) | 203 (11.1%) |
| Foreign Born, not a Citizen | 379 (77.0%) | 113 (23.0%) |
Health Insurance Coverage by Household Income in Sallisaw
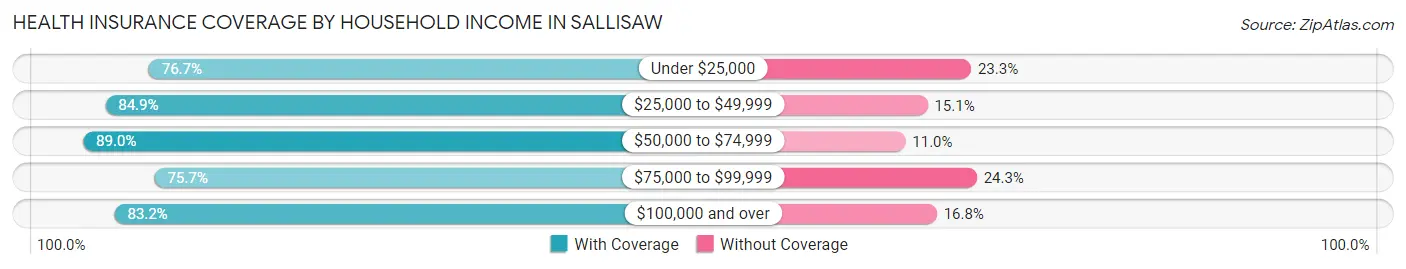
| Household Income | With Coverage | Without Coverage |
| Under $25,000 | 2,002 (76.7%) | 607 (23.3%) |
| $25,000 to $49,999 | 1,431 (84.9%) | 255 (15.1%) |
| $50,000 to $74,999 | 1,233 (89.0%) | 152 (11.0%) |
| $75,000 to $99,999 | 690 (75.7%) | 222 (24.3%) |
| $100,000 and over | 1,437 (83.2%) | 291 (16.8%) |
Public vs Private Health Insurance Coverage by Age in Sallisaw
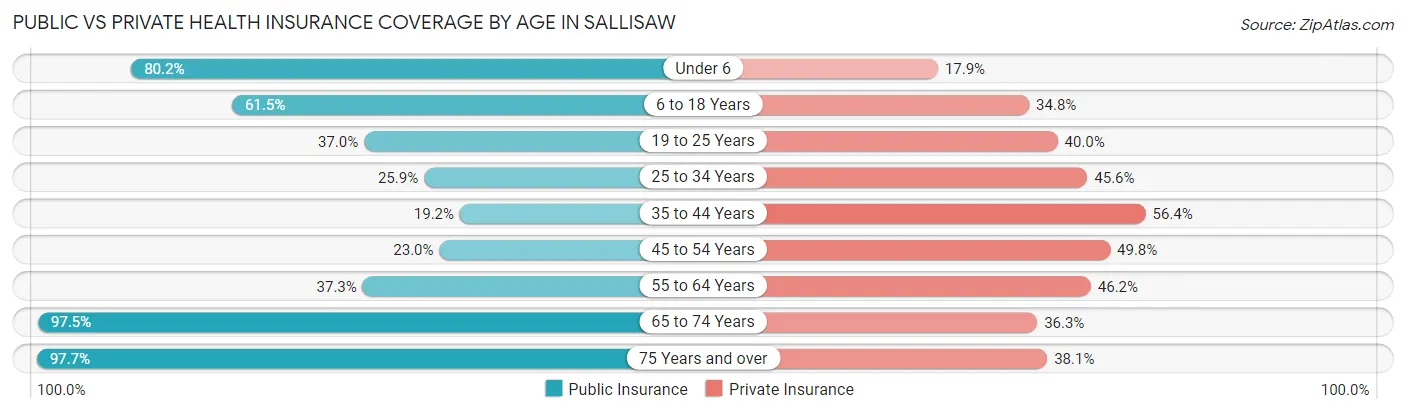
| Age Bracket | Public Insurance | Private Insurance |
| Under 6 | 656 (80.2%) | 146 (17.8%) |
| 6 to 18 Years | 1,123 (61.5%) | 635 (34.8%) |
| 19 to 25 Years | 182 (37.0%) | 197 (40.0%) |
| 25 to 34 Years | 269 (25.9%) | 474 (45.6%) |
| 35 to 44 Years | 203 (19.2%) | 596 (56.4%) |
| 45 to 54 Years | 226 (23.0%) | 489 (49.8%) |
| 55 to 64 Years | 316 (37.3%) | 392 (46.2%) |
| 65 to 74 Years | 632 (97.5%) | 235 (36.3%) |
| 75 Years and over | 605 (97.7%) | 236 (38.1%) |
| Total | 4,212 (50.6%) | 3,400 (40.8%) |
Disability Status by Sex by Age in Sallisaw
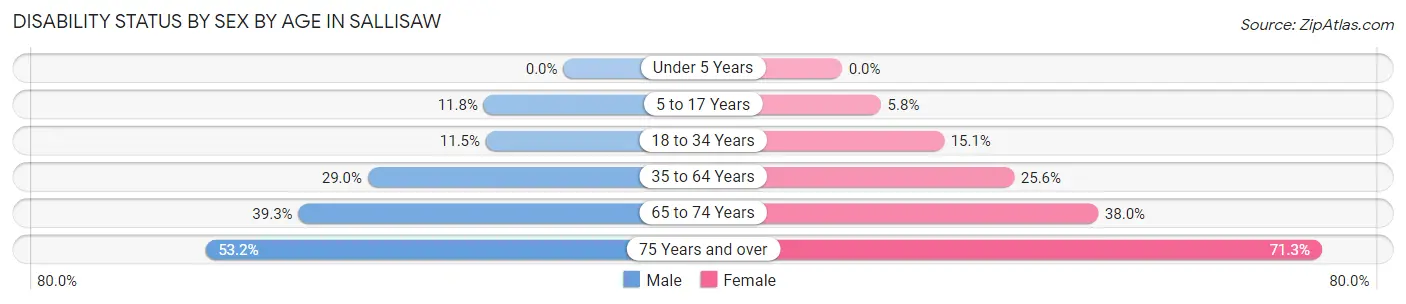
| Age Bracket | Male | Female |
| Under 5 Years | 0 (0.0%) | 0 (0.0%) |
| 5 to 17 Years | 107 (11.8%) | 56 (5.8%) |
| 18 to 34 Years | 86 (11.5%) | 130 (15.1%) |
| 35 to 64 Years | 419 (29.0%) | 369 (25.6%) |
| 65 to 74 Years | 107 (39.3%) | 143 (38.0%) |
| 75 Years and over | 109 (53.2%) | 295 (71.3%) |
Disability Class by Sex by Age in Sallisaw
Disability Class: Hearing Difficulty
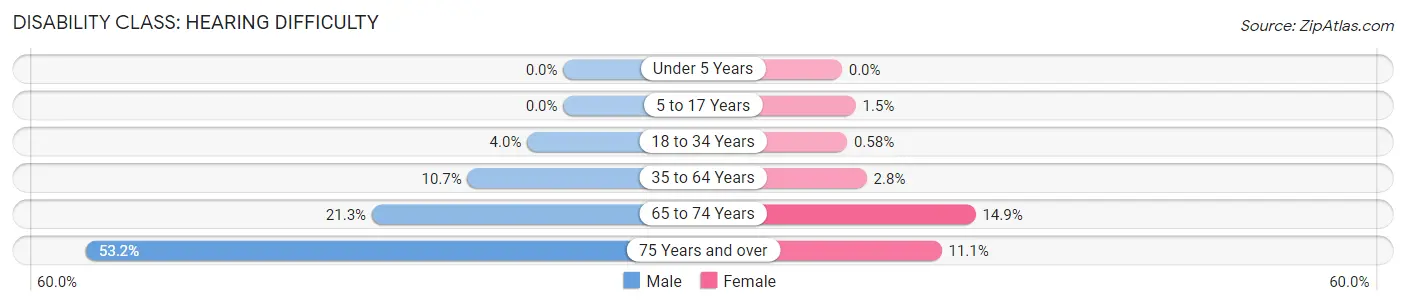
| Age Bracket | Male | Female |
| Under 5 Years | 0 (0.0%) | 0 (0.0%) |
| 5 to 17 Years | 0 (0.0%) | 15 (1.5%) |
| 18 to 34 Years | 30 (4.0%) | 5 (0.6%) |
| 35 to 64 Years | 154 (10.7%) | 40 (2.8%) |
| 65 to 74 Years | 58 (21.3%) | 56 (14.9%) |
| 75 Years and over | 109 (53.2%) | 46 (11.1%) |
Disability Class: Vision Difficulty
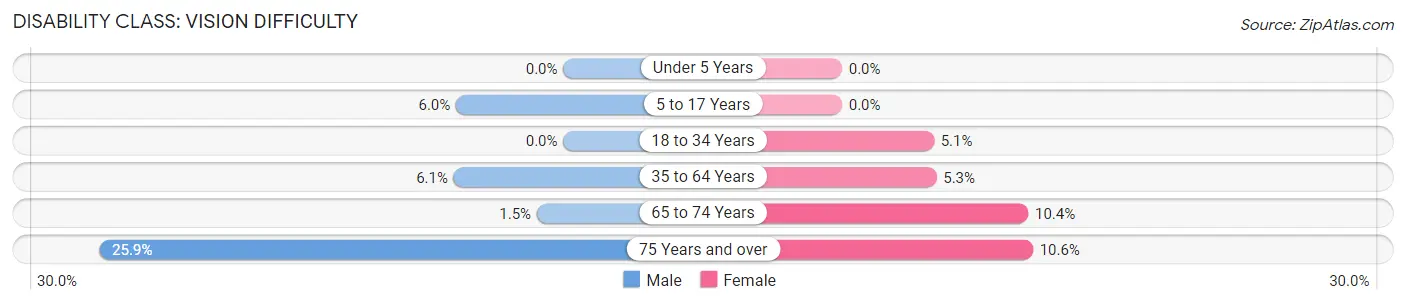
| Age Bracket | Male | Female |
| Under 5 Years | 0 (0.0%) | 0 (0.0%) |
| 5 to 17 Years | 54 (6.0%) | 0 (0.0%) |
| 18 to 34 Years | 0 (0.0%) | 44 (5.1%) |
| 35 to 64 Years | 88 (6.1%) | 76 (5.3%) |
| 65 to 74 Years | 4 (1.5%) | 39 (10.4%) |
| 75 Years and over | 53 (25.9%) | 44 (10.6%) |
Disability Class: Cognitive Difficulty
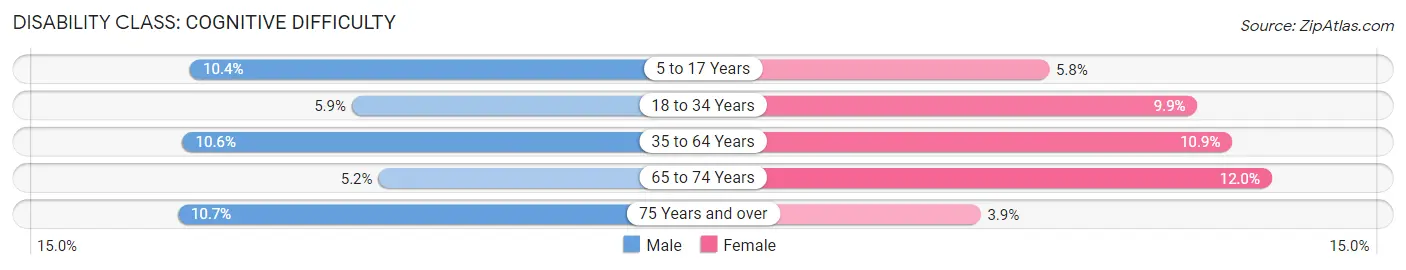
| Age Bracket | Male | Female |
| 5 to 17 Years | 94 (10.4%) | 56 (5.8%) |
| 18 to 34 Years | 44 (5.9%) | 85 (9.9%) |
| 35 to 64 Years | 153 (10.6%) | 157 (10.9%) |
| 65 to 74 Years | 14 (5.1%) | 45 (12.0%) |
| 75 Years and over | 22 (10.7%) | 16 (3.9%) |
Disability Class: Ambulatory Difficulty
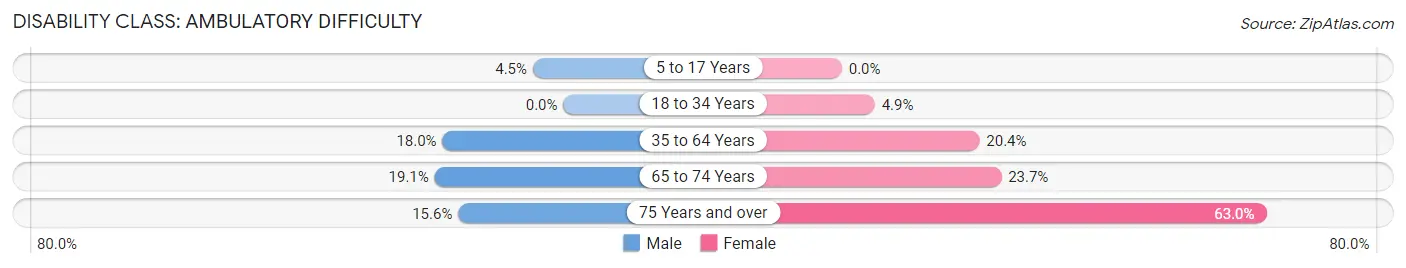
| Age Bracket | Male | Female |
| 5 to 17 Years | 41 (4.5%) | 0 (0.0%) |
| 18 to 34 Years | 0 (0.0%) | 42 (4.9%) |
| 35 to 64 Years | 259 (17.9%) | 295 (20.4%) |
| 65 to 74 Years | 52 (19.1%) | 89 (23.7%) |
| 75 Years and over | 32 (15.6%) | 261 (63.0%) |
Disability Class: Self-Care Difficulty
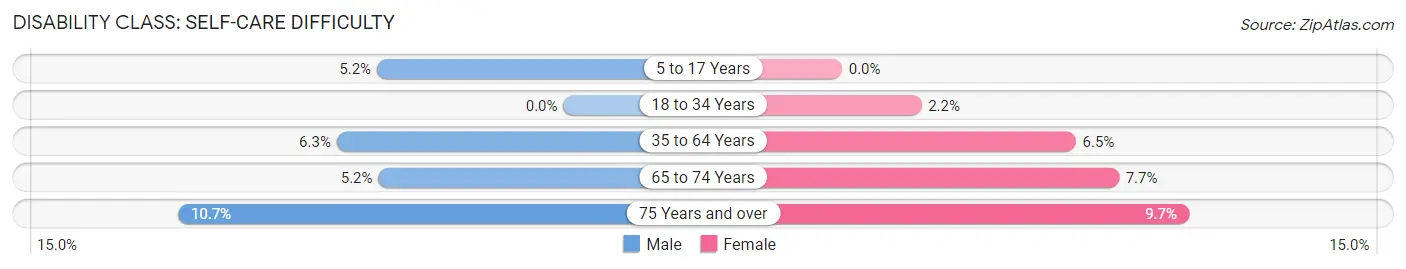
| Age Bracket | Male | Female |
| 5 to 17 Years | 47 (5.2%) | 0 (0.0%) |
| 18 to 34 Years | 0 (0.0%) | 19 (2.2%) |
| 35 to 64 Years | 91 (6.3%) | 94 (6.5%) |
| 65 to 74 Years | 14 (5.1%) | 29 (7.7%) |
| 75 Years and over | 22 (10.7%) | 40 (9.7%) |
Technology Access in Sallisaw
Computing Device Access in Sallisaw
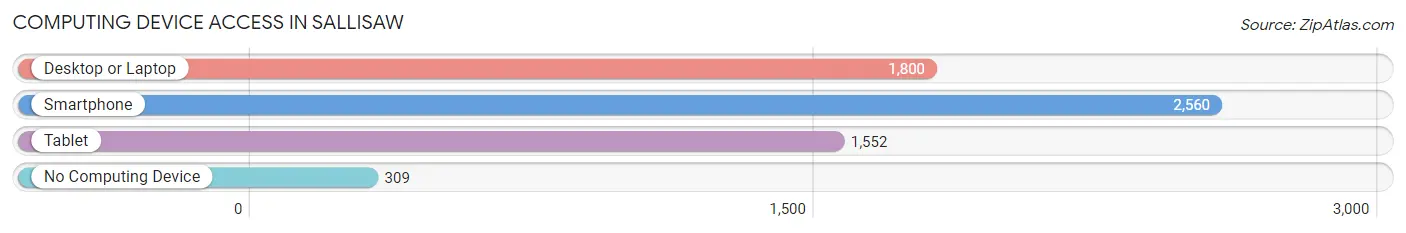
| Device Type | # Households | % Households |
| Desktop or Laptop | 1,800 | 57.5% |
| Smartphone | 2,560 | 81.7% |
| Tablet | 1,552 | 49.5% |
| No Computing Device | 309 | 9.9% |
| Total | 3,132 | 100.0% |
Internet Access in Sallisaw
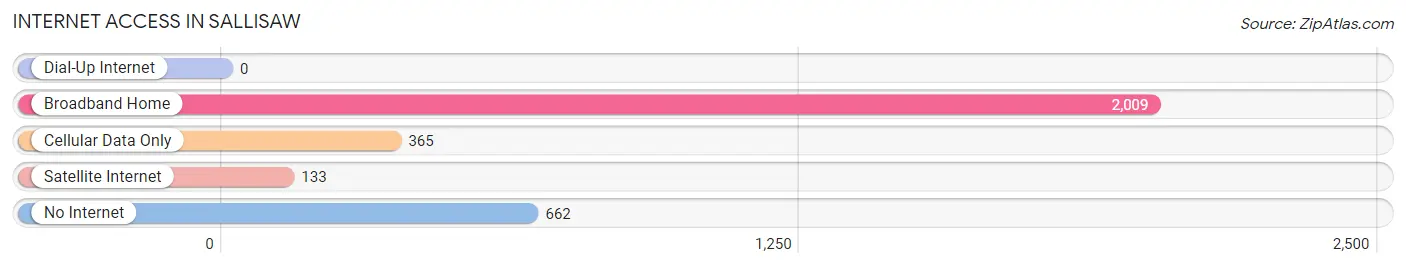
| Internet Type | # Households | % Households |
| Dial-Up Internet | 0 | 0.0% |
| Broadband Home | 2,009 | 64.1% |
| Cellular Data Only | 365 | 11.7% |
| Satellite Internet | 133 | 4.3% |
| No Internet | 662 | 21.1% |
| Total | 3,132 | 100.0% |
Sallisaw Summary
Sallisaw is a city located in Sequoyah County, Oklahoma. It is the county seat of Sequoyah County and is located in the foothills of the Ozark Mountains. The city is situated on the Arkansas River and is home to a population of 8,880 people as of the 2010 census.
History
The area that is now Sallisaw was originally inhabited by the Cherokee Nation. The city was founded in 1883 by the Choctaw and Cherokee Railroad, which was built to connect the Indian Territory with the Arkansas River. The city was named after a nearby creek, which was named after a Choctaw chief named Sallisaw.
The city was incorporated in 1898 and was the site of a major battle during the Civil War. The Battle of Sallisaw was fought on April 22, 1864, and resulted in a Confederate victory.
Geography
Sallisaw is located in the foothills of the Ozark Mountains in eastern Oklahoma. It is situated on the Arkansas River and is bordered by the Sequoyah National Wildlife Refuge to the north and the Cherokee Nation to the south. The city has a total area of 8.3 square miles, all of which is land.
The climate in Sallisaw is characterized by hot, humid summers and mild winters. The average annual temperature is 64°F, and the average annual precipitation is 44 inches.
Economy
The economy of Sallisaw is largely based on agriculture and manufacturing. The city is home to several large manufacturing plants, including a Tyson Foods plant and a ConAgra Foods plant. The city is also home to several large agricultural operations, including a large cattle ranch and a large poultry farm.
The city is also home to several retail stores, restaurants, and other businesses. The city is served by the Sallisaw Municipal Airport, which provides air service to the city and surrounding area.
Demographics
As of the 2010 census, the population of Sallisaw was 8,880. The racial makeup of the city was 79.3% White, 15.2% Native American, 0.7% Asian, 0.3% African American, 0.1% Pacific Islander, and 4.4% from other races. Hispanic or Latino of any race were 3.2% of the population.
The median income for a household in Sallisaw was $30,938, and the median income for a family was $37,917. The per capita income for the city was $17,845. About 17.2% of families and 20.7% of the population were below the poverty line, including 28.3% of those under age 18 and 11.2% of those age 65 or over.
Common Questions
What is Per Capita Income in Sallisaw?
Per Capita income in Sallisaw is $21,330.
What is the Median Family Income in Sallisaw?
Median Family Income in Sallisaw is $57,669.
What is the Median Household income in Sallisaw?
Median Household Income in Sallisaw is $44,310.
What is Income or Wage Gap in Sallisaw?
Income or Wage Gap in Sallisaw is 42.3%.
Women in Sallisaw earn 57.7 cents for every dollar earned by a man.
What is Family Income Deficit in Sallisaw?
Family Income Deficit in Sallisaw is $11,044.
Families that are below poverty line in Sallisaw earn $11,044 less on average than the poverty threshold level.
What is Inequality or Gini Index in Sallisaw?
Inequality or Gini Index in Sallisaw is 0.47.
What is the Total Population of Sallisaw?
Total Population of Sallisaw is 8,524.
What is the Total Male Population of Sallisaw?
Total Male Population of Sallisaw is 4,091.
What is the Total Female Population of Sallisaw?
Total Female Population of Sallisaw is 4,433.
What is the Ratio of Males per 100 Females in Sallisaw?
There are 92.29 Males per 100 Females in Sallisaw.
What is the Ratio of Females per 100 Males in Sallisaw?
There are 108.36 Females per 100 Males in Sallisaw.
What is the Median Population Age in Sallisaw?
Median Population Age in Sallisaw is 35.1 Years.
What is the Average Family Size in Sallisaw
Average Family Size in Sallisaw is 3.4 People.
What is the Average Household Size in Sallisaw
Average Household Size in Sallisaw is 2.7 People.
How Large is the Labor Force in Sallisaw?
There are 3,274 People in the Labor Forcein in Sallisaw.
What is the Percentage of People in the Labor Force in Sallisaw?
52.5% of People are in the Labor Force in Sallisaw.
What is the Unemployment Rate in Sallisaw?
Unemployment Rate in Sallisaw is 6.4%.