Tryon, OK Map & Demographics
Tryon Map
Tryon Overview
$23,796
PER CAPITA INCOME
$60,526
AVG FAMILY INCOME
$57,778
AVG HOUSEHOLD INCOME
28.7%
WAGE / INCOME GAP [ % ]
71.3¢/ $1
WAGE / INCOME GAP [ $ ]
0.46
INEQUALITY / GINI INDEX
529
TOTAL POPULATION
249
MALE POPULATION
280
FEMALE POPULATION
88.93
MALES / 100 FEMALES
112.45
FEMALES / 100 MALES
29.6
MEDIAN AGE
3.6
AVG FAMILY SIZE
3.2
AVG HOUSEHOLD SIZE
238
LABOR FORCE [ PEOPLE ]
59.1%
PERCENT IN LABOR FORCE
Tryon Zip Codes
Tryon Area Codes
Income in Tryon
Income Overview in Tryon
Per Capita Income in Tryon is $23,796, while median incomes of families and households are $60,526 and $57,778 respectively.
| Characteristic | Number | Measure |
| Per Capita Income | 529 | $23,796 |
| Median Family Income | 122 | $60,526 |
| Mean Family Income | 122 | $81,748 |
| Median Household Income | 164 | $57,778 |
| Mean Household Income | 164 | $70,296 |
| Income Deficit | 122 | $0 |
| Wage / Income Gap (%) | 529 | 28.73% |
| Wage / Income Gap ($) | 529 | 71.27¢ per $1 |
| Gini / Inequality Index | 529 | 0.46 |
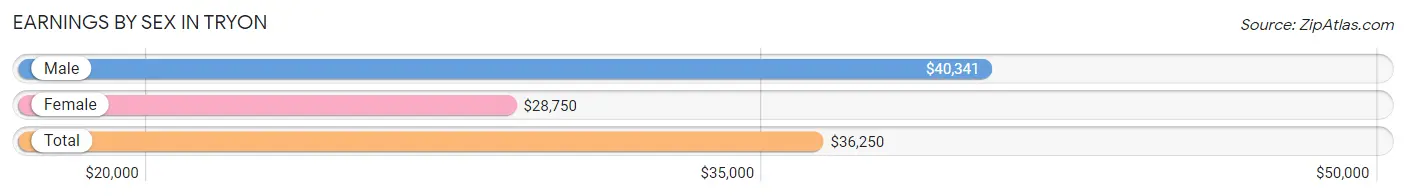
Earnings by Sex in Tryon
Average Earnings in Tryon are $36,250, $40,341 for men and $28,750 for women, a difference of 28.7%.
| Sex | Number | Average Earnings |
| Male | 141 (58.8%) | $40,341 |
| Female | 99 (41.2%) | $28,750 |
| Total | 240 (100.0%) | $36,250 |
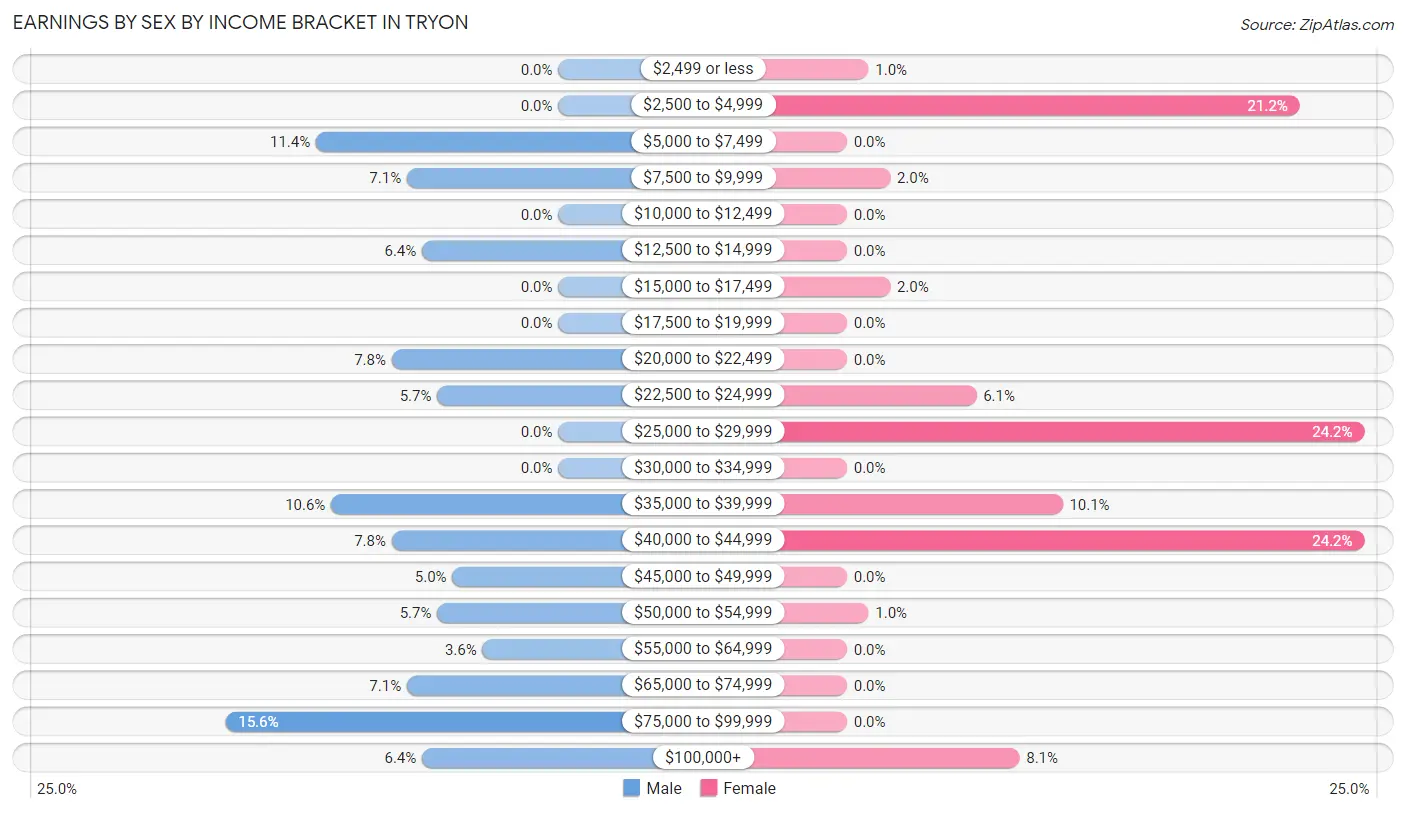
Earnings by Sex by Income Bracket in Tryon
The most common earnings brackets in Tryon are $75,000 to $99,999 for men (22 | 15.6%) and $25,000 to $29,999 for women (24 | 24.2%).
| Income | Male | Female |
| $2,499 or less | 0 (0.0%) | 1 (1.0%) |
| $2,500 to $4,999 | 0 (0.0%) | 21 (21.2%) |
| $5,000 to $7,499 | 16 (11.4%) | 0 (0.0%) |
| $7,500 to $9,999 | 10 (7.1%) | 2 (2.0%) |
| $10,000 to $12,499 | 0 (0.0%) | 0 (0.0%) |
| $12,500 to $14,999 | 9 (6.4%) | 0 (0.0%) |
| $15,000 to $17,499 | 0 (0.0%) | 2 (2.0%) |
| $17,500 to $19,999 | 0 (0.0%) | 0 (0.0%) |
| $20,000 to $22,499 | 11 (7.8%) | 0 (0.0%) |
| $22,500 to $24,999 | 8 (5.7%) | 6 (6.1%) |
| $25,000 to $29,999 | 0 (0.0%) | 24 (24.2%) |
| $30,000 to $34,999 | 0 (0.0%) | 0 (0.0%) |
| $35,000 to $39,999 | 15 (10.6%) | 10 (10.1%) |
| $40,000 to $44,999 | 11 (7.8%) | 24 (24.2%) |
| $45,000 to $49,999 | 7 (5.0%) | 0 (0.0%) |
| $50,000 to $54,999 | 8 (5.7%) | 1 (1.0%) |
| $55,000 to $64,999 | 5 (3.5%) | 0 (0.0%) |
| $65,000 to $74,999 | 10 (7.1%) | 0 (0.0%) |
| $75,000 to $99,999 | 22 (15.6%) | 0 (0.0%) |
| $100,000+ | 9 (6.4%) | 8 (8.1%) |
| Total | 141 (100.0%) | 99 (100.0%) |
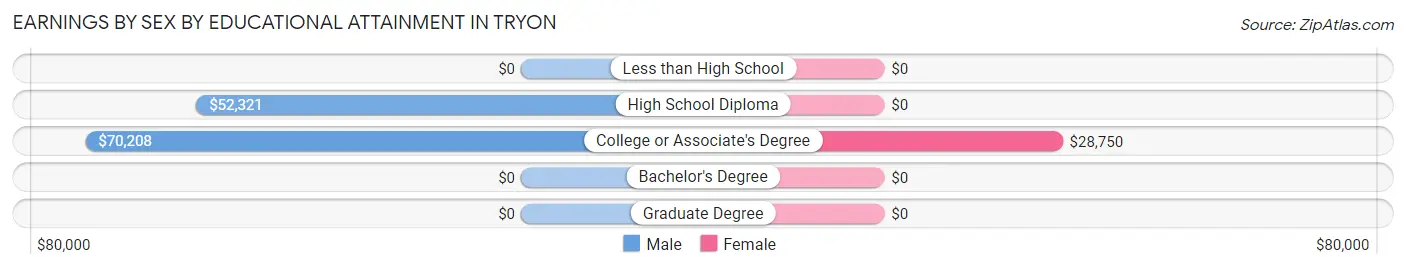
Earnings by Sex by Educational Attainment in Tryon
Average earnings in Tryon are $50,893 for men and $35,139 for women, a difference of 31.0%. Men with an educational attainment of college or associate's degree enjoy the highest average annual earnings of $70,208, while those with high school diploma education earn the least with $52,321. Women with an educational attainment of college or associate's degree earn the most with the average annual earnings of $28,750, while those with college or associate's degree education have the smallest earnings of $28,750.
| Educational Attainment | Male Income | Female Income |
| Less than High School | - | - |
| High School Diploma | $52,321 | $0 |
| College or Associate's Degree | $70,208 | $28,750 |
| Bachelor's Degree | - | - |
| Graduate Degree | - | - |
| Total | $50,893 | $35,139 |
Family Income in Tryon
Family Income Brackets in Tryon
According to the Tryon family income data, there are 49 families falling into the $50,000 to $74,999 income range, which is the most common income bracket and makes up 40.2% of all families.
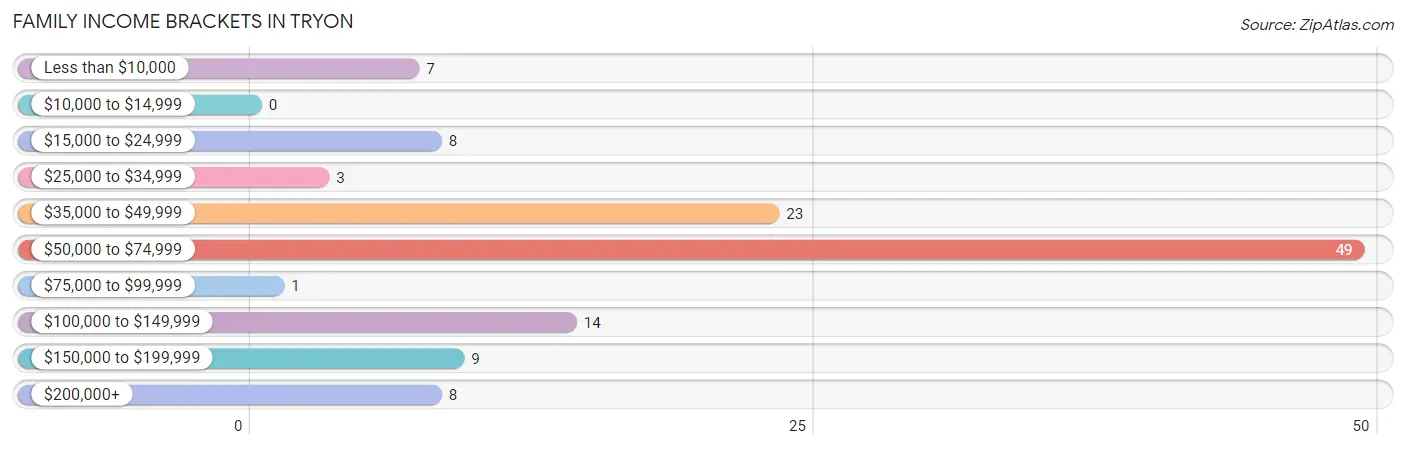
| Income Bracket | # Families | % Families |
| Less than $10,000 | 7 | 5.7% |
| $10,000 to $14,999 | 0 | 0.0% |
| $15,000 to $24,999 | 8 | 6.6% |
| $25,000 to $34,999 | 3 | 2.5% |
| $35,000 to $49,999 | 23 | 18.9% |
| $50,000 to $74,999 | 49 | 40.2% |
| $75,000 to $99,999 | 1 | 0.8% |
| $100,000 to $149,999 | 14 | 11.5% |
| $150,000 to $199,999 | 9 | 7.4% |
| $200,000+ | 8 | 6.6% |
Family Income by Famaliy Size in Tryon
2-person families (67 | 54.9%) account for the highest median family income in Tryon with $60,375 per family, while 2-person families (67 | 54.9%) have the highest median income of $30,188 per family member.
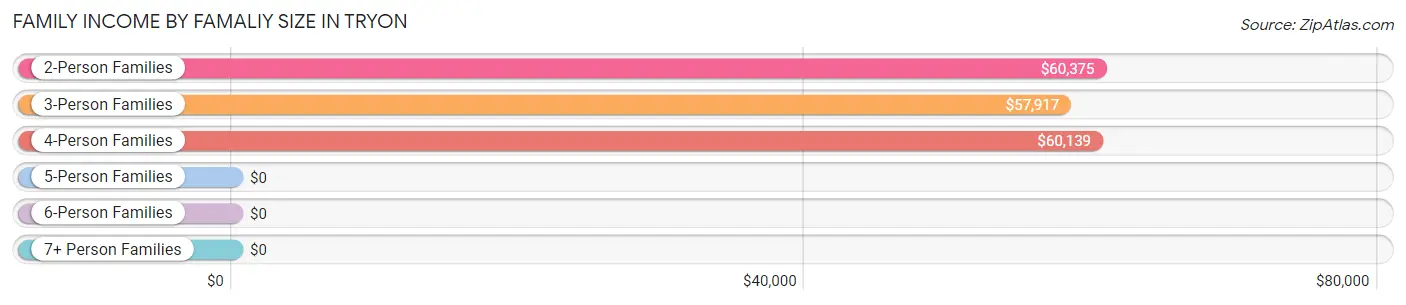
| Income Bracket | # Families | Median Income |
| 2-Person Families | 67 (54.9%) | $60,375 |
| 3-Person Families | 21 (17.2%) | $57,917 |
| 4-Person Families | 19 (15.6%) | $60,139 |
| 5-Person Families | 3 (2.5%) | $0 |
| 6-Person Families | 3 (2.5%) | $0 |
| 7+ Person Families | 9 (7.4%) | $0 |
| Total | 122 (100.0%) | $60,526 |
Family Income by Number of Earners in Tryon

| Number of Earners | # Families | Median Income |
| No Earners | 19 (15.6%) | $0 |
| 1 Earner | 53 (43.4%) | $51,964 |
| 2 Earners | 37 (30.3%) | $0 |
| 3+ Earners | 13 (10.7%) | $0 |
| Total | 122 (100.0%) | $60,526 |
Household Income in Tryon
Household Income Brackets in Tryon
With 56 households falling in the category, the $50,000 to $74,999 income range is the most frequent in Tryon, accounting for 34.2% of all households. In contrast, only 5 households (3.0%) fall into the $75,000 to $99,999 income bracket, making it the least populous group.
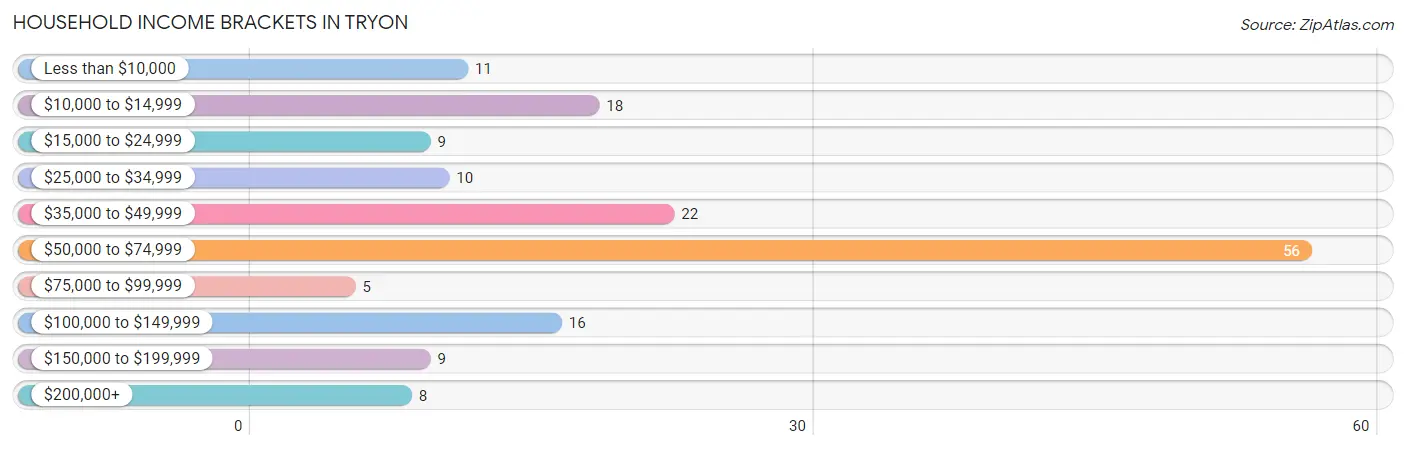
| Income Bracket | # Households | % Households |
| Less than $10,000 | 11 | 6.7% |
| $10,000 to $14,999 | 18 | 11.0% |
| $15,000 to $24,999 | 9 | 5.5% |
| $25,000 to $34,999 | 10 | 6.1% |
| $35,000 to $49,999 | 22 | 13.4% |
| $50,000 to $74,999 | 56 | 34.1% |
| $75,000 to $99,999 | 5 | 3.0% |
| $100,000 to $149,999 | 16 | 9.8% |
| $150,000 to $199,999 | 9 | 5.5% |
| $200,000+ | 8 | 4.9% |
Household Income by Householder Age in Tryon
The median household income in Tryon is $57,778, with the highest median household income of $74,167 found in the 25 to 44 years age bracket for the primary householder. A total of 32 households (19.5%) fall into this category. Meanwhile, the 15 to 24 years age bracket for the primary householder has the lowest median household income of $0, with 22 households (13.4%) in this group.
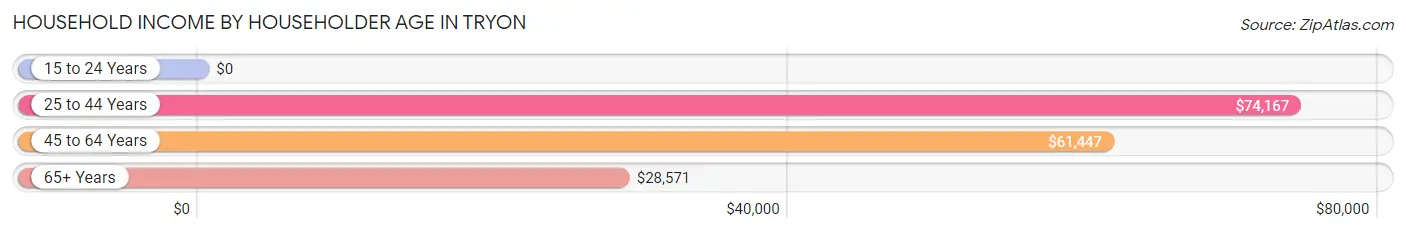
| Income Bracket | # Households | Median Income |
| 15 to 24 Years | 22 (13.4%) | $0 |
| 25 to 44 Years | 32 (19.5%) | $74,167 |
| 45 to 64 Years | 70 (42.7%) | $61,447 |
| 65+ Years | 40 (24.4%) | $28,571 |
| Total | 164 (100.0%) | $57,778 |
Poverty in Tryon
Income Below Poverty by Sex and Age in Tryon
With 11.7% poverty level for males and 18.6% for females among the residents of Tryon, under 5 year old males and 5 year old females are the most vulnerable to poverty, with 5 males (100.0%) and 2 females (100.0%) in their respective age groups living below the poverty level.
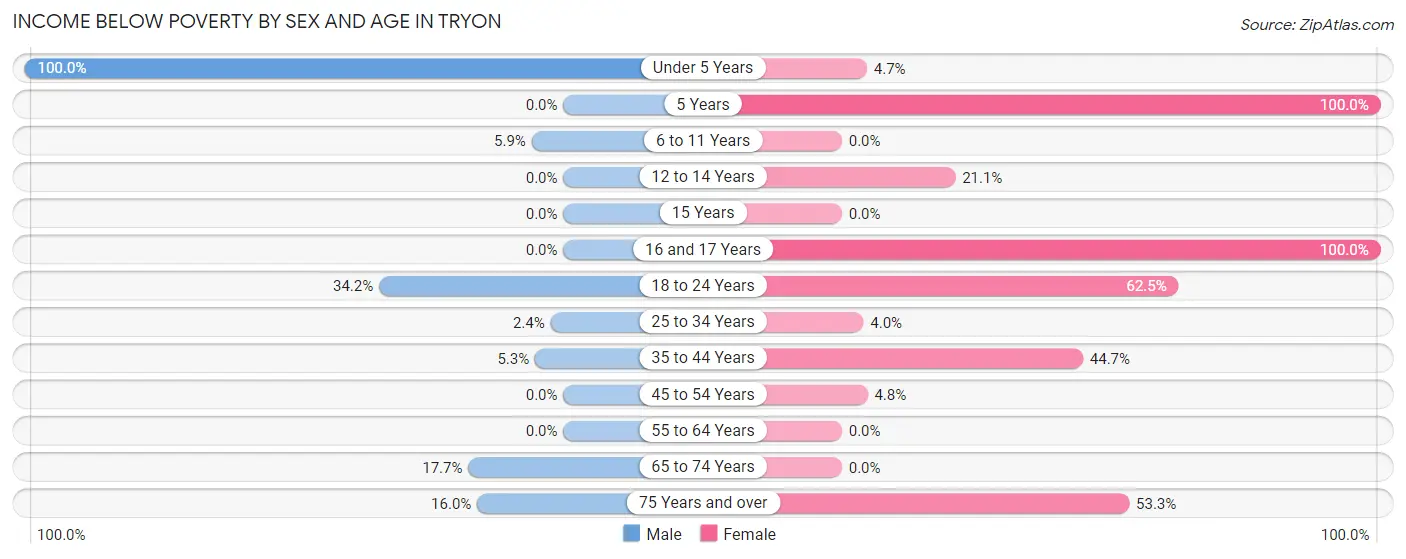
| Age Bracket | Male | Female |
| Under 5 Years | 5 (100.0%) | 2 (4.6%) |
| 5 Years | 0 (0.0%) | 2 (100.0%) |
| 6 to 11 Years | 2 (5.9%) | 0 (0.0%) |
| 12 to 14 Years | 0 (0.0%) | 4 (21.0%) |
| 15 Years | 0 (0.0%) | 0 (0.0%) |
| 16 and 17 Years | 0 (0.0%) | 1 (100.0%) |
| 18 to 24 Years | 13 (34.2%) | 15 (62.5%) |
| 25 to 34 Years | 1 (2.4%) | 2 (4.0%) |
| 35 to 44 Years | 1 (5.3%) | 17 (44.7%) |
| 45 to 54 Years | 0 (0.0%) | 1 (4.8%) |
| 55 to 64 Years | 0 (0.0%) | 0 (0.0%) |
| 65 to 74 Years | 3 (17.6%) | 0 (0.0%) |
| 75 Years and over | 4 (16.0%) | 8 (53.3%) |
| Total | 29 (11.7%) | 52 (18.6%) |
Income Above Poverty by Sex and Age in Tryon
According to the poverty statistics in Tryon, males aged 12 to 14 years and females aged 6 to 11 years are the age groups that are most secure financially, with 100.0% of males and 100.0% of females in these age groups living above the poverty line.
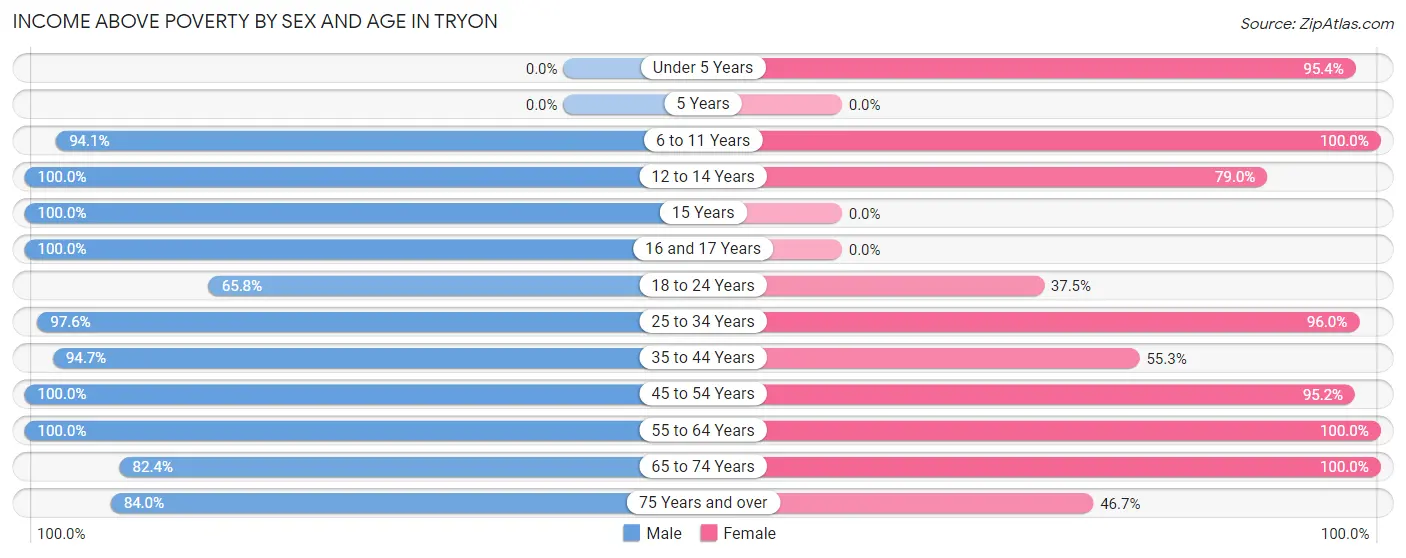
| Age Bracket | Male | Female |
| Under 5 Years | 0 (0.0%) | 41 (95.4%) |
| 5 Years | 0 (0.0%) | 0 (0.0%) |
| 6 to 11 Years | 32 (94.1%) | 10 (100.0%) |
| 12 to 14 Years | 10 (100.0%) | 15 (78.9%) |
| 15 Years | 3 (100.0%) | 0 (0.0%) |
| 16 and 17 Years | 5 (100.0%) | 0 (0.0%) |
| 18 to 24 Years | 25 (65.8%) | 9 (37.5%) |
| 25 to 34 Years | 41 (97.6%) | 48 (96.0%) |
| 35 to 44 Years | 18 (94.7%) | 21 (55.3%) |
| 45 to 54 Years | 20 (100.0%) | 20 (95.2%) |
| 55 to 64 Years | 31 (100.0%) | 33 (100.0%) |
| 65 to 74 Years | 14 (82.4%) | 24 (100.0%) |
| 75 Years and over | 21 (84.0%) | 7 (46.7%) |
| Total | 220 (88.3%) | 228 (81.4%) |
Income Below Poverty Among Married-Couple Families in Tryon
The poverty statistics for married-couple families in Tryon show that 9.1% or 7 of the total 77 families live below the poverty line. Families with no children have the highest poverty rate of 10.4%, comprising of 5 families. On the other hand, families with 3 or 4 children have the lowest poverty rate of 0.0%, which includes 0 families.
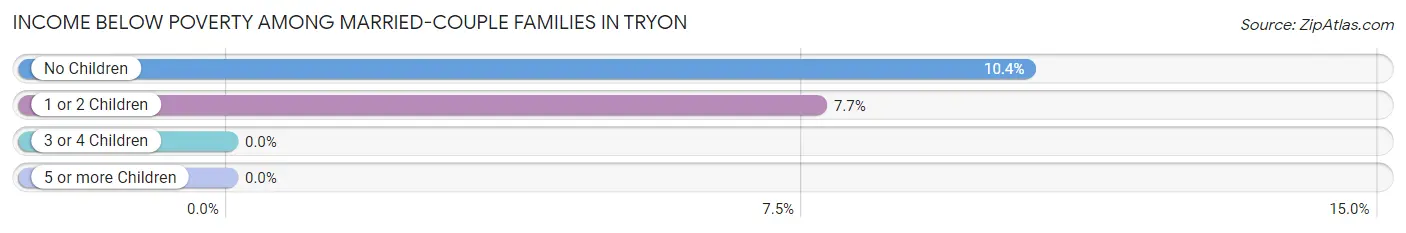
| Children | Above Poverty | Below Poverty |
| No Children | 43 (89.6%) | 5 (10.4%) |
| 1 or 2 Children | 24 (92.3%) | 2 (7.7%) |
| 3 or 4 Children | 3 (100.0%) | 0 (0.0%) |
| 5 or more Children | 0 (0.0%) | 0 (0.0%) |
| Total | 70 (90.9%) | 7 (9.1%) |
Income Below Poverty Among Single-Parent Households in Tryon
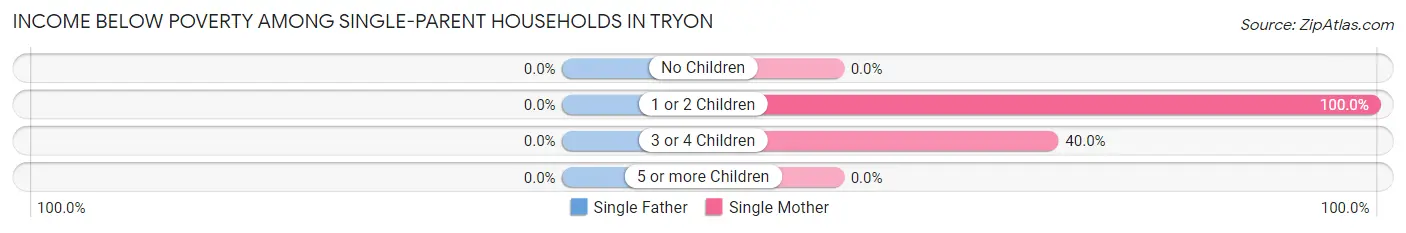
| Children | Single Father | Single Mother |
| No Children | 0 (0.0%) | 0 (0.0%) |
| 1 or 2 Children | 0 (0.0%) | 1 (100.0%) |
| 3 or 4 Children | 0 (0.0%) | 2 (40.0%) |
| 5 or more Children | 0 (0.0%) | 0 (0.0%) |
| Total | 0 (0.0%) | 3 (12.0%) |
Income Below Poverty Among Married-Couple vs Single-Parent Households in Tryon
The poverty data for Tryon shows that 7 of the married-couple family households (9.1%) and 3 of the single-parent households (6.7%) are living below the poverty level. Within the married-couple family households, those with no children have the highest poverty rate, with 5 households (10.4%) falling below the poverty line. Among the single-parent households, those with 3 or 4 children have the highest poverty rate, with 2 household (40.0%) living below poverty.
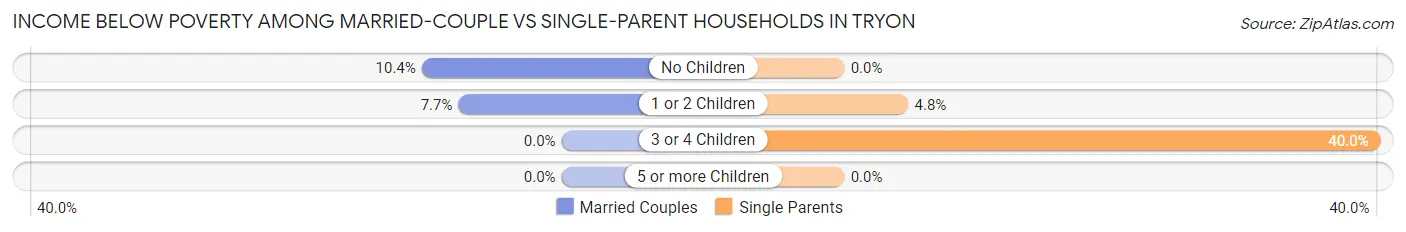
| Children | Married-Couple Families | Single-Parent Households |
| No Children | 5 (10.4%) | 0 (0.0%) |
| 1 or 2 Children | 2 (7.7%) | 1 (4.8%) |
| 3 or 4 Children | 0 (0.0%) | 2 (40.0%) |
| 5 or more Children | 0 (0.0%) | 0 (0.0%) |
| Total | 7 (9.1%) | 3 (6.7%) |
Race in Tryon
The most populous races in Tryon are White / Caucasian (435 | 82.2%), Native / Alaskan (73 | 13.8%), and Hispanic or Latino (42 | 7.9%).
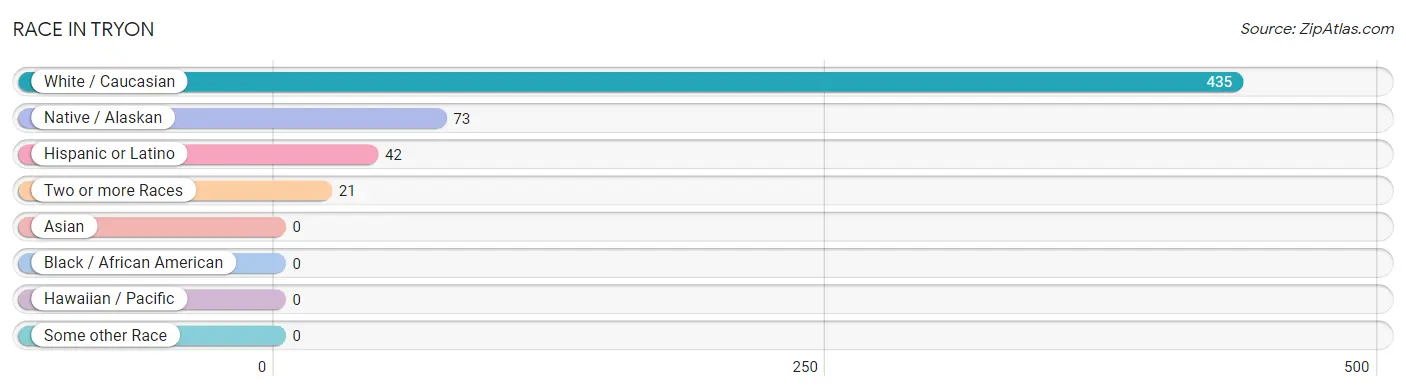
| Race | # Population | % Population |
| Asian | 0 | 0.0% |
| Black / African American | 0 | 0.0% |
| Hawaiian / Pacific | 0 | 0.0% |
| Hispanic or Latino | 42 | 7.9% |
| Native / Alaskan | 73 | 13.8% |
| White / Caucasian | 435 | 82.2% |
| Two or more Races | 21 | 4.0% |
| Some other Race | 0 | 0.0% |
| Total | 529 | 100.0% |
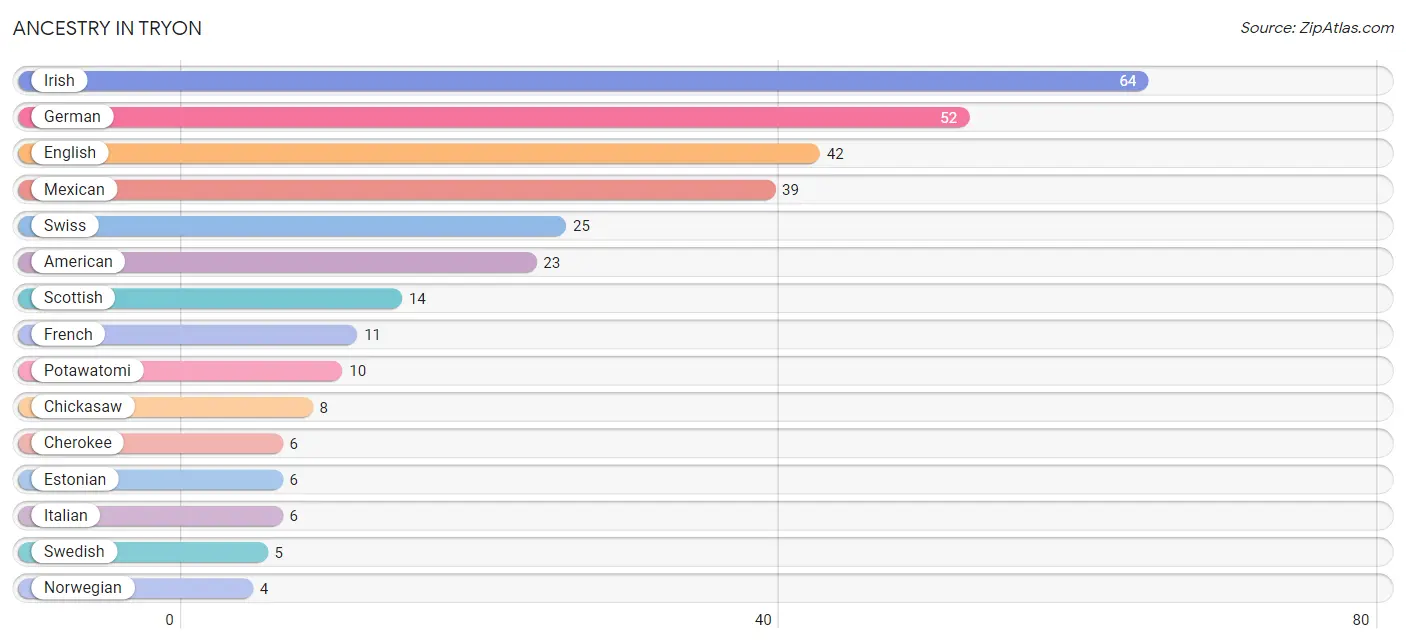
Ancestry in Tryon
The most populous ancestries reported in Tryon are Irish (64 | 12.1%), German (52 | 9.8%), English (42 | 7.9%), Mexican (39 | 7.4%), and Swiss (25 | 4.7%), together accounting for 42.0% of all Tryon residents.
| Ancestry | # Population | % Population |
| American | 23 | 4.3% |
| Apache | 1 | 0.2% |
| Cherokee | 6 | 1.1% |
| Chickasaw | 8 | 1.5% |
| Choctaw | 2 | 0.4% |
| Czechoslovakian | 2 | 0.4% |
| Dutch West Indian | 1 | 0.2% |
| English | 42 | 7.9% |
| Estonian | 6 | 1.1% |
| French | 11 | 2.1% |
| German | 52 | 9.8% |
| Hungarian | 2 | 0.4% |
| Irish | 64 | 12.1% |
| Italian | 6 | 1.1% |
| Mexican | 39 | 7.4% |
| Navajo | 1 | 0.2% |
| Norwegian | 4 | 0.8% |
| Potawatomi | 10 | 1.9% |
| Puerto Rican | 3 | 0.6% |
| Scottish | 14 | 2.6% |
| Swedish | 5 | 0.9% |
| Swiss | 25 | 4.7% |
| Welsh | 3 | 0.6% | View All 23 Rows |
Immigrants in Tryon

| Immigration Origin | # Population | % Population | View All 0 Rows |
Sex and Age in Tryon
Sex and Age in Tryon
The most populous age groups in Tryon are 5 to 9 Years (34 | 13.7%) for men and 25 to 29 Years (44 | 15.7%) for women.
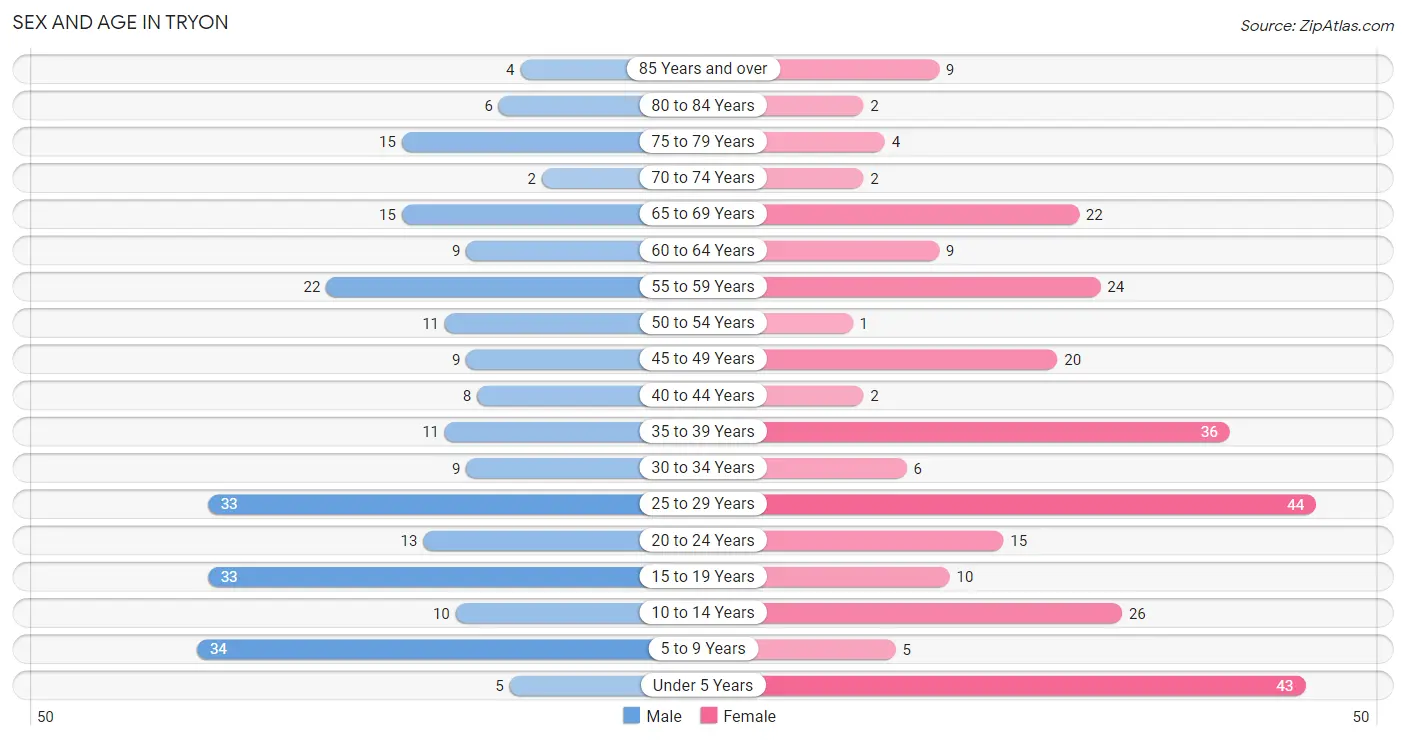
| Age Bracket | Male | Female |
| Under 5 Years | 5 (2.0%) | 43 (15.4%) |
| 5 to 9 Years | 34 (13.7%) | 5 (1.8%) |
| 10 to 14 Years | 10 (4.0%) | 26 (9.3%) |
| 15 to 19 Years | 33 (13.3%) | 10 (3.6%) |
| 20 to 24 Years | 13 (5.2%) | 15 (5.4%) |
| 25 to 29 Years | 33 (13.3%) | 44 (15.7%) |
| 30 to 34 Years | 9 (3.6%) | 6 (2.1%) |
| 35 to 39 Years | 11 (4.4%) | 36 (12.9%) |
| 40 to 44 Years | 8 (3.2%) | 2 (0.7%) |
| 45 to 49 Years | 9 (3.6%) | 20 (7.1%) |
| 50 to 54 Years | 11 (4.4%) | 1 (0.4%) |
| 55 to 59 Years | 22 (8.8%) | 24 (8.6%) |
| 60 to 64 Years | 9 (3.6%) | 9 (3.2%) |
| 65 to 69 Years | 15 (6.0%) | 22 (7.9%) |
| 70 to 74 Years | 2 (0.8%) | 2 (0.7%) |
| 75 to 79 Years | 15 (6.0%) | 4 (1.4%) |
| 80 to 84 Years | 6 (2.4%) | 2 (0.7%) |
| 85 Years and over | 4 (1.6%) | 9 (3.2%) |
| Total | 249 (100.0%) | 280 (100.0%) |
Families and Households in Tryon
Median Family Size in Tryon
The median family size in Tryon is 3.65 persons per family, with married-couple families (77 | 63.1%) accounting for the largest median family size of 4.05 persons per family. On the other hand, single male/father families (20 | 16.4%) represent the smallest median family size with 2.70 persons per family.
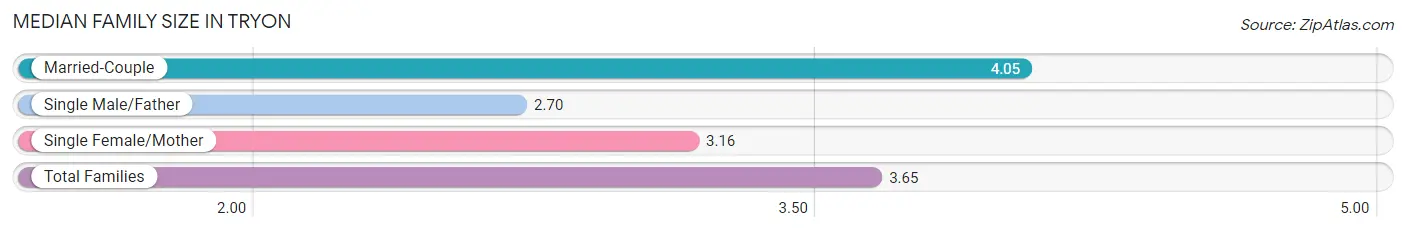
| Family Type | # Families | Family Size |
| Married-Couple | 77 (63.1%) | 4.05 |
| Single Male/Father | 20 (16.4%) | 2.70 |
| Single Female/Mother | 25 (20.5%) | 3.16 |
| Total Families | 122 (100.0%) | 3.65 |
Median Household Size in Tryon
The median household size in Tryon is 3.23 persons per household, with married-couple households (77 | 46.9%) accounting for the largest median household size of 4.05 persons per household. non-family households (42 | 25.6%) represent the smallest median household size with 1.52 persons per household.
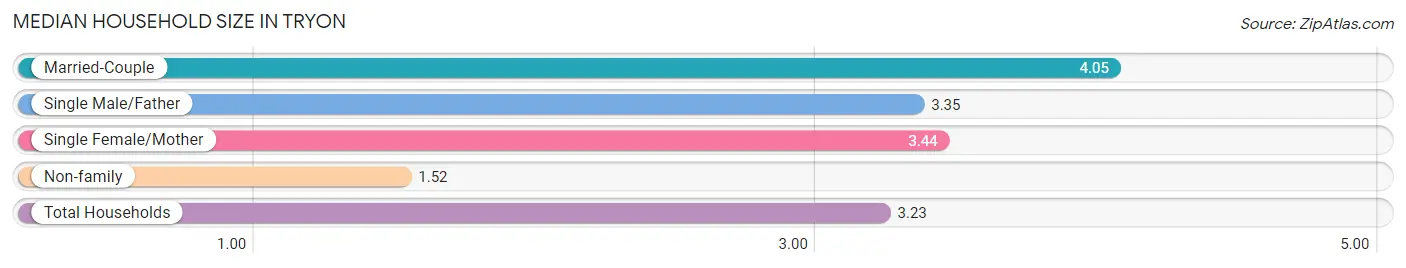
| Household Type | # Households | Household Size |
| Married-Couple | 77 (46.9%) | 4.05 |
| Single Male/Father | 20 (12.2%) | 3.35 |
| Single Female/Mother | 25 (15.2%) | 3.44 |
| Non-family | 42 (25.6%) | 1.52 |
| Total Households | 164 (100.0%) | 3.23 |
Household Size by Marriage Status in Tryon
Out of a total of 164 households in Tryon, 122 (74.4%) are family households, while 42 (25.6%) are nonfamily households. The most numerous type of family households are 2-person households, comprising 65, and the most common type of nonfamily households are 1-person households, comprising 21.
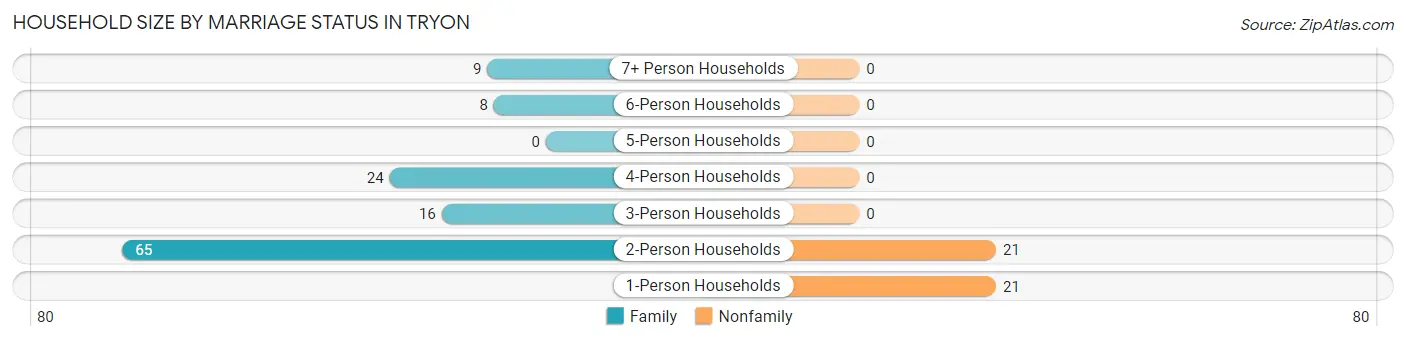
| Household Size | Family Households | Nonfamily Households |
| 1-Person Households | - | 21 (12.8%) |
| 2-Person Households | 65 (39.6%) | 21 (12.8%) |
| 3-Person Households | 16 (9.8%) | 0 (0.0%) |
| 4-Person Households | 24 (14.6%) | 0 (0.0%) |
| 5-Person Households | 0 (0.0%) | 0 (0.0%) |
| 6-Person Households | 8 (4.9%) | 0 (0.0%) |
| 7+ Person Households | 9 (5.5%) | 0 (0.0%) |
| Total | 122 (74.4%) | 42 (25.6%) |
Female Fertility in Tryon
Fertility by Age in Tryon
| Age Bracket | Women with Births | Births / 1,000 Women |
| 15 to 19 years | 0 (0.0%) | 0.0 |
| 20 to 34 years | 0 (0.0%) | 0.0 |
| 35 to 50 years | 0 (0.0%) | 0.0 |
| Total | 0 (0.0%) | 0.0 |
Fertility by Age by Marriage Status in Tryon
| Age Bracket | Married | Unmarried |
| 15 to 19 years | 0 (0.0%) | 0 (0.0%) |
| 20 to 34 years | 0 (0.0%) | 0 (0.0%) |
| 35 to 50 years | 0 (0.0%) | 0 (0.0%) |
| Total | 0 (0.0%) | 0 (0.0%) |
Fertility by Education in Tryon
| Educational Attainment | Women with Births | Births / 1,000 Women |
| Less than High School | 0 (0.0%) | 0.0 |
| High School Diploma | 0 (0.0%) | 0.0 |
| College or Associate's Degree | 0 (0.0%) | 0.0 |
| Bachelor's Degree | 0 (0.0%) | 0.0 |
| Graduate Degree | 0 (0.0%) | 0.0 |
| Total | 0 (0.0%) | 0.0 |
Fertility by Education by Marriage Status in Tryon
| Educational Attainment | Married | Unmarried |
| Less than High School | 0 (0.0%) | 0 (0.0%) |
| High School Diploma | 0 (0.0%) | 0 (0.0%) |
| College or Associate's Degree | 0 (0.0%) | 0 (0.0%) |
| Bachelor's Degree | 0 (0.0%) | 0 (0.0%) |
| Graduate Degree | 0 (0.0%) | 0 (0.0%) |
| Total | 0 (0.0%) | 0 (0.0%) |
Employment Characteristics in Tryon
Employment by Class of Employer in Tryon
Among the 238 employed individuals in Tryon, private company employees (151 | 63.4%), self-employed (not incorporated) (29 | 12.2%), and local government employees (19 | 8.0%) make up the most common classes of employment.
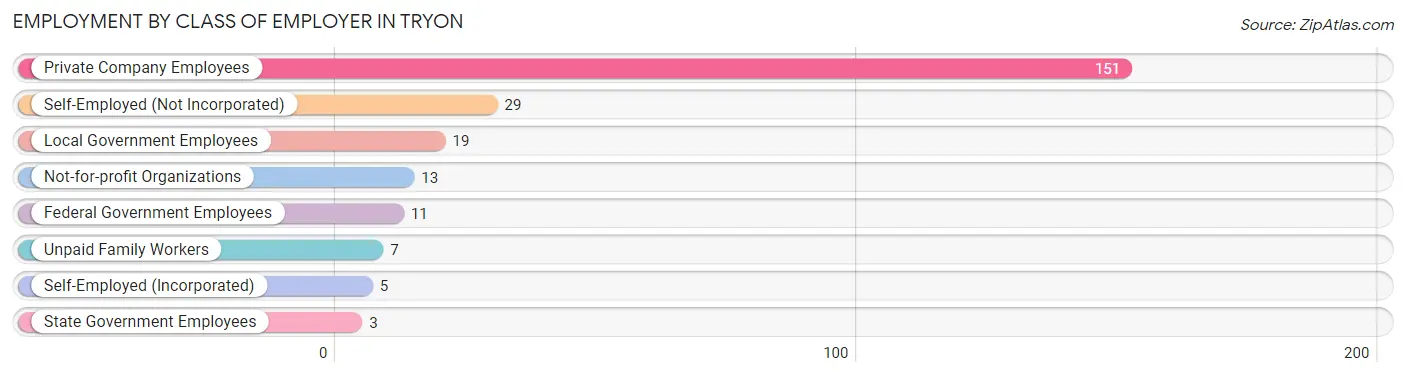
| Employer Class | # Employees | % Employees |
| Private Company Employees | 151 | 63.4% |
| Self-Employed (Incorporated) | 5 | 2.1% |
| Self-Employed (Not Incorporated) | 29 | 12.2% |
| Not-for-profit Organizations | 13 | 5.5% |
| Local Government Employees | 19 | 8.0% |
| State Government Employees | 3 | 1.3% |
| Federal Government Employees | 11 | 4.6% |
| Unpaid Family Workers | 7 | 2.9% |
| Total | 238 | 100.0% |
Employment Status by Age in Tryon
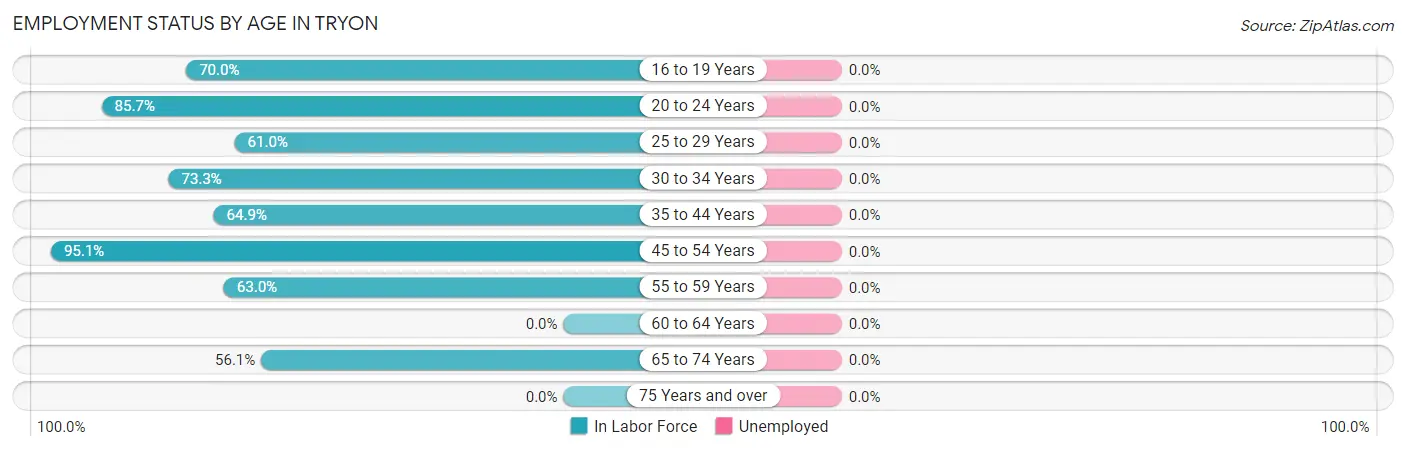
| Age Bracket | In Labor Force | Unemployed |
| 16 to 19 Years | 28 (70.0%) | 0 (0.0%) |
| 20 to 24 Years | 24 (85.7%) | 0 (0.0%) |
| 25 to 29 Years | 47 (61.0%) | 0 (0.0%) |
| 30 to 34 Years | 11 (73.3%) | 0 (0.0%) |
| 35 to 44 Years | 37 (64.9%) | 0 (0.0%) |
| 45 to 54 Years | 39 (95.1%) | 0 (0.0%) |
| 55 to 59 Years | 29 (63.0%) | 0 (0.0%) |
| 60 to 64 Years | 0 (0.0%) | 0 (0.0%) |
| 65 to 74 Years | 23 (56.1%) | 0 (0.0%) |
| 75 Years and over | 0 (0.0%) | 0 (0.0%) |
| Total | 238 (59.1%) | 0 (0.0%) |
Employment Status by Educational Attainment in Tryon
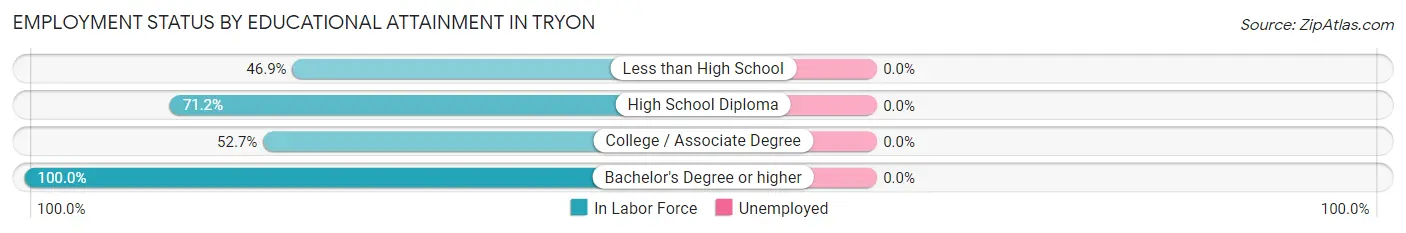
| Educational Attainment | In Labor Force | Unemployed |
| Less than High School | 23 (46.9%) | 0 (0.0%) |
| High School Diploma | 74 (71.2%) | 0 (0.0%) |
| College / Associate Degree | 39 (52.7%) | 0 (0.0%) |
| Bachelor's Degree or higher | 27 (100.0%) | 0 (0.0%) |
| Total | 163 (64.2%) | 0 (0.0%) |
Employment Occupations by Sex in Tryon
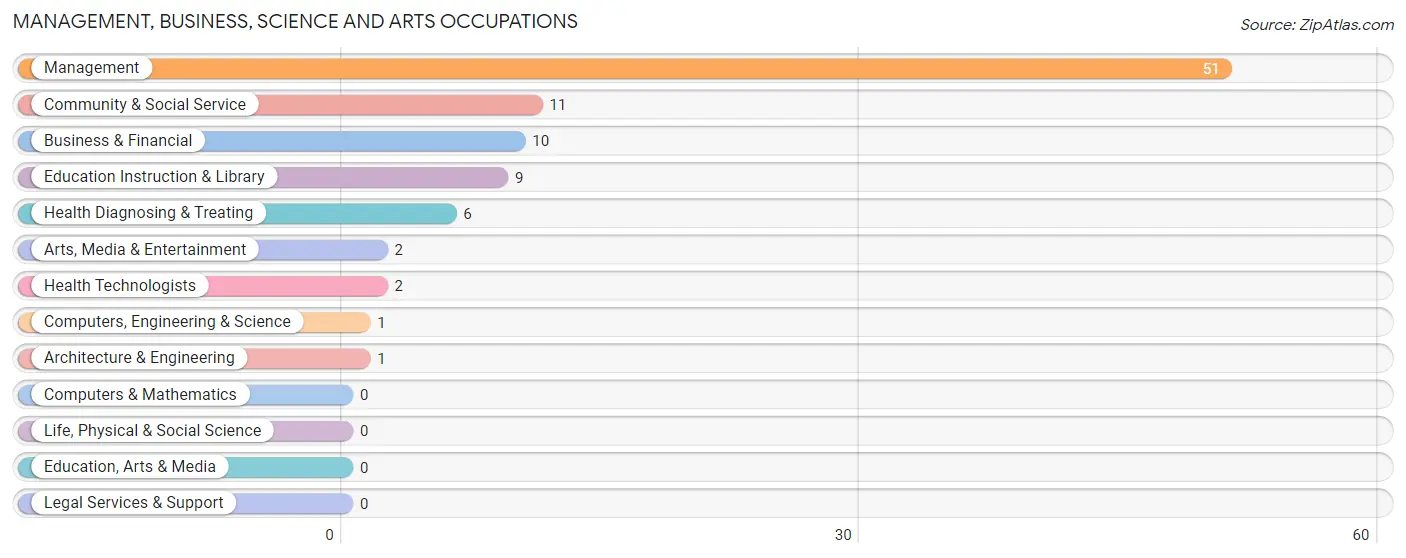
Management, Business, Science and Arts Occupations
The most common Management, Business, Science and Arts occupations in Tryon are Management (51 | 21.4%), Community & Social Service (11 | 4.6%), Business & Financial (10 | 4.2%), Education Instruction & Library (9 | 3.8%), and Health Diagnosing & Treating (6 | 2.5%).
Management, Business, Science and Arts Occupations by Sex
Within the Management, Business, Science and Arts occupations in Tryon, the most male-oriented occupations are Computers, Engineering & Science (100.0%), Architecture & Engineering (100.0%), and Management (54.9%), while the most female-oriented occupations are Business & Financial (100.0%), Community & Social Service (100.0%), and Education Instruction & Library (100.0%).
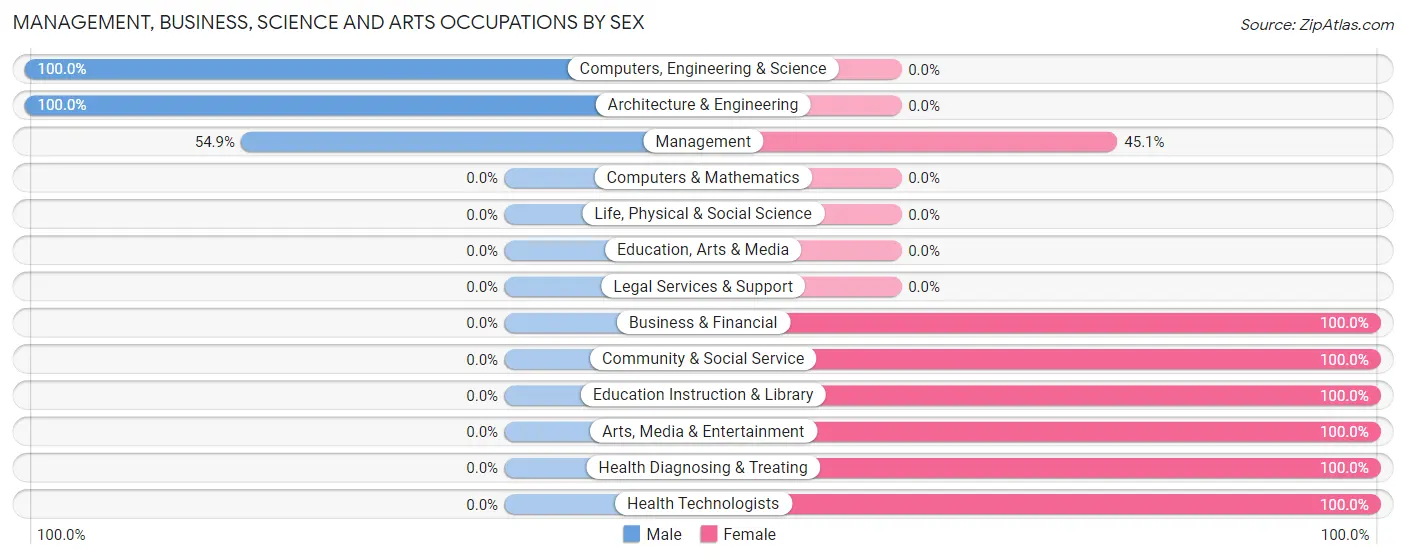
| Occupation | Male | Female |
| Management | 28 (54.9%) | 23 (45.1%) |
| Business & Financial | 0 (0.0%) | 10 (100.0%) |
| Computers, Engineering & Science | 1 (100.0%) | 0 (0.0%) |
| Computers & Mathematics | 0 (0.0%) | 0 (0.0%) |
| Architecture & Engineering | 1 (100.0%) | 0 (0.0%) |
| Life, Physical & Social Science | 0 (0.0%) | 0 (0.0%) |
| Community & Social Service | 0 (0.0%) | 11 (100.0%) |
| Education, Arts & Media | 0 (0.0%) | 0 (0.0%) |
| Legal Services & Support | 0 (0.0%) | 0 (0.0%) |
| Education Instruction & Library | 0 (0.0%) | 9 (100.0%) |
| Arts, Media & Entertainment | 0 (0.0%) | 2 (100.0%) |
| Health Diagnosing & Treating | 0 (0.0%) | 6 (100.0%) |
| Health Technologists | 0 (0.0%) | 2 (100.0%) |
| Total (Category) | 29 (36.7%) | 50 (63.3%) |
| Total (Overall) | 139 (58.4%) | 99 (41.6%) |
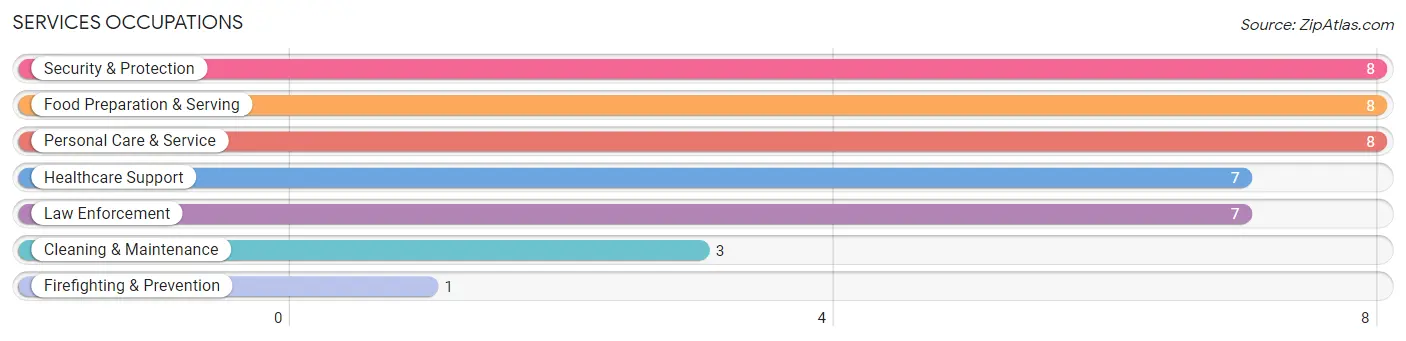
Services Occupations
The most common Services occupations in Tryon are Security & Protection (8 | 3.4%), Food Preparation & Serving (8 | 3.4%), Personal Care & Service (8 | 3.4%), Healthcare Support (7 | 2.9%), and Law Enforcement (7 | 2.9%).
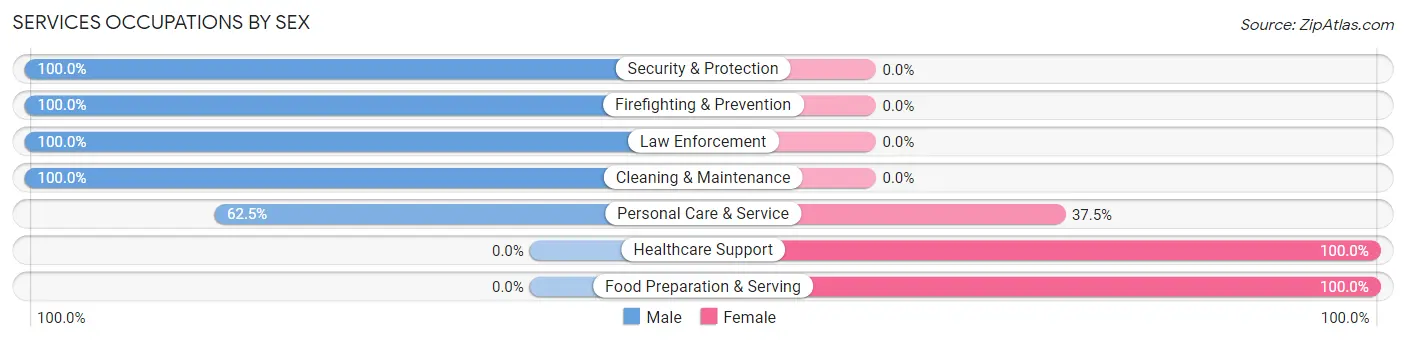
Services Occupations by Sex
Within the Services occupations in Tryon, the most male-oriented occupations are Security & Protection (100.0%), Firefighting & Prevention (100.0%), and Law Enforcement (100.0%), while the most female-oriented occupations are Healthcare Support (100.0%), Food Preparation & Serving (100.0%), and Personal Care & Service (37.5%).
| Occupation | Male | Female |
| Healthcare Support | 0 (0.0%) | 7 (100.0%) |
| Security & Protection | 8 (100.0%) | 0 (0.0%) |
| Firefighting & Prevention | 1 (100.0%) | 0 (0.0%) |
| Law Enforcement | 7 (100.0%) | 0 (0.0%) |
| Food Preparation & Serving | 0 (0.0%) | 8 (100.0%) |
| Cleaning & Maintenance | 3 (100.0%) | 0 (0.0%) |
| Personal Care & Service | 5 (62.5%) | 3 (37.5%) |
| Total (Category) | 16 (47.1%) | 18 (52.9%) |
| Total (Overall) | 139 (58.4%) | 99 (41.6%) |
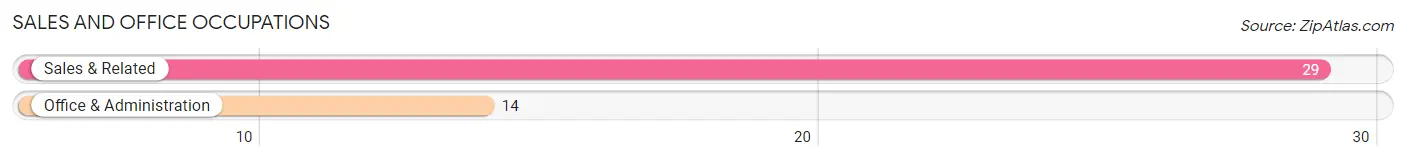
Sales and Office Occupations
The most common Sales and Office occupations in Tryon are Sales & Related (29 | 12.2%), and Office & Administration (14 | 5.9%).
Sales and Office Occupations by Sex
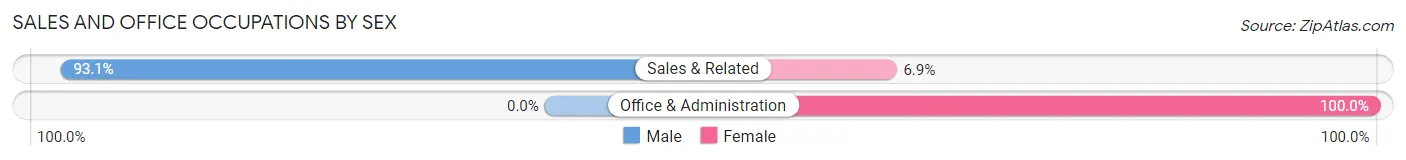
| Occupation | Male | Female |
| Sales & Related | 27 (93.1%) | 2 (6.9%) |
| Office & Administration | 0 (0.0%) | 14 (100.0%) |
| Total (Category) | 27 (62.8%) | 16 (37.2%) |
| Total (Overall) | 139 (58.4%) | 99 (41.6%) |
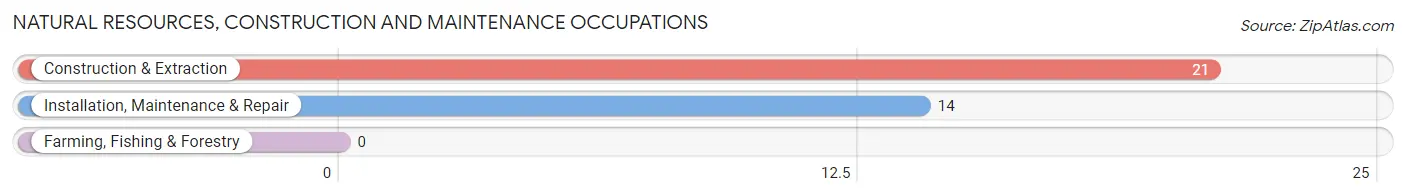
Natural Resources, Construction and Maintenance Occupations
The most common Natural Resources, Construction and Maintenance occupations in Tryon are Construction & Extraction (21 | 8.8%), and Installation, Maintenance & Repair (14 | 5.9%).
Natural Resources, Construction and Maintenance Occupations by Sex
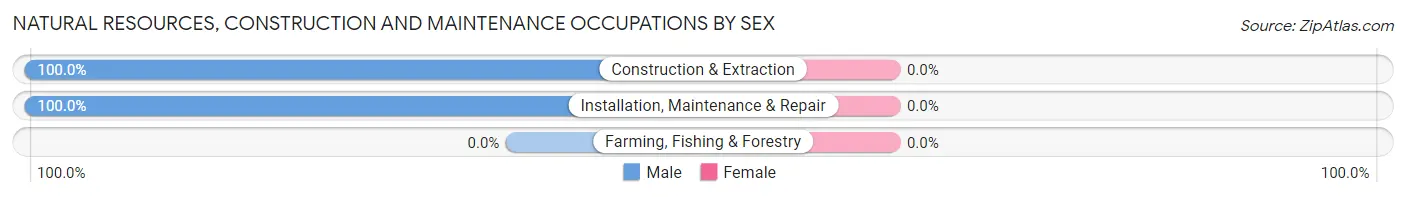
| Occupation | Male | Female |
| Farming, Fishing & Forestry | 0 (0.0%) | 0 (0.0%) |
| Construction & Extraction | 21 (100.0%) | 0 (0.0%) |
| Installation, Maintenance & Repair | 14 (100.0%) | 0 (0.0%) |
| Total (Category) | 35 (100.0%) | 0 (0.0%) |
| Total (Overall) | 139 (58.4%) | 99 (41.6%) |
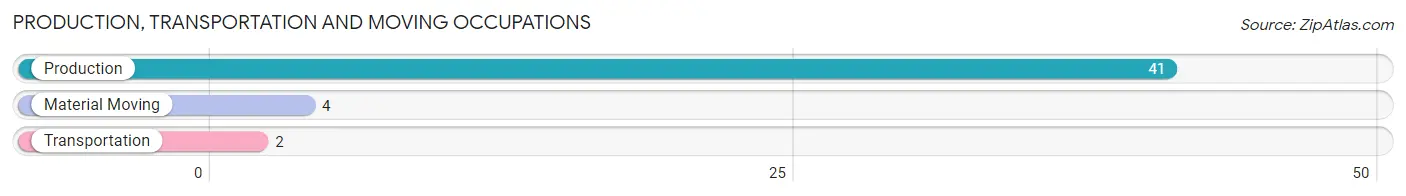
Production, Transportation and Moving Occupations
The most common Production, Transportation and Moving occupations in Tryon are Production (41 | 17.2%), Material Moving (4 | 1.7%), and Transportation (2 | 0.8%).
Production, Transportation and Moving Occupations by Sex
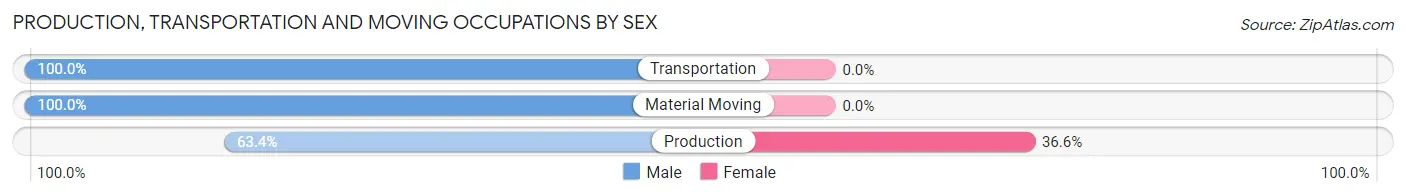
| Occupation | Male | Female |
| Production | 26 (63.4%) | 15 (36.6%) |
| Transportation | 2 (100.0%) | 0 (0.0%) |
| Material Moving | 4 (100.0%) | 0 (0.0%) |
| Total (Category) | 32 (68.1%) | 15 (31.9%) |
| Total (Overall) | 139 (58.4%) | 99 (41.6%) |
Employment Industries by Sex in Tryon
Employment Industries in Tryon
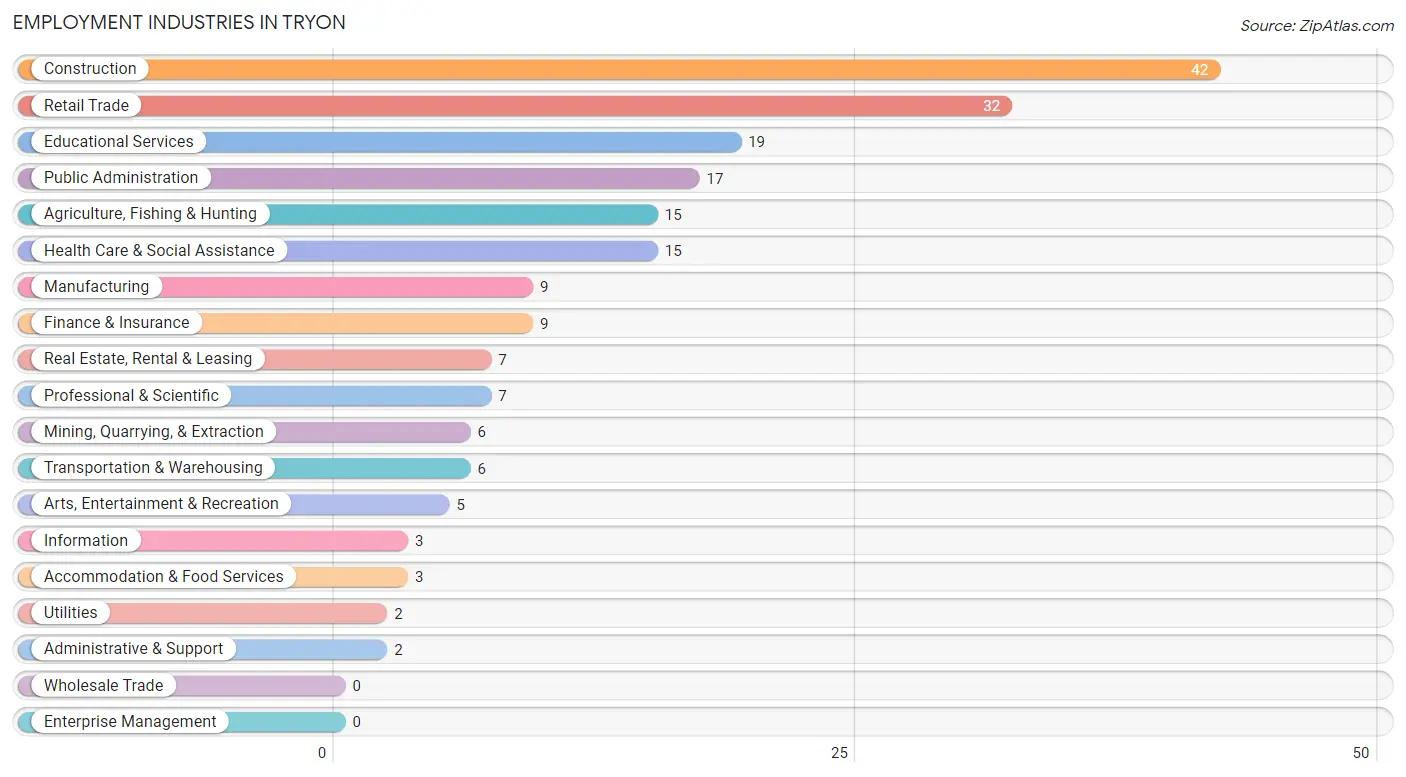
The major employment industries in Tryon include Construction (42 | 17.6%), Retail Trade (32 | 13.5%), Educational Services (19 | 8.0%), Public Administration (17 | 7.1%), and Agriculture, Fishing & Hunting (15 | 6.3%).
Employment Industries by Sex in Tryon
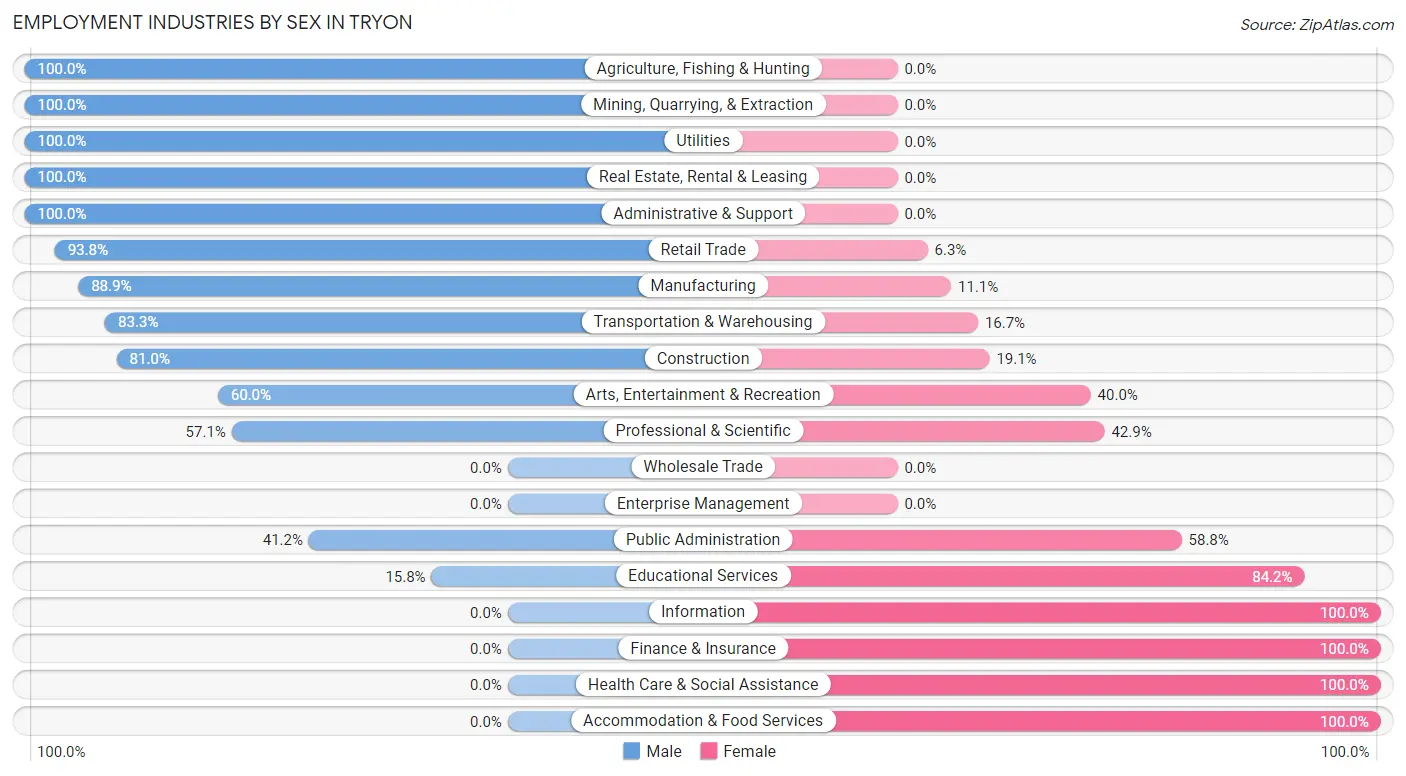
The Tryon industries that see more men than women are Agriculture, Fishing & Hunting (100.0%), Mining, Quarrying, & Extraction (100.0%), and Utilities (100.0%), whereas the industries that tend to have a higher number of women are Information (100.0%), Finance & Insurance (100.0%), and Health Care & Social Assistance (100.0%).
| Industry | Male | Female |
| Agriculture, Fishing & Hunting | 15 (100.0%) | 0 (0.0%) |
| Mining, Quarrying, & Extraction | 6 (100.0%) | 0 (0.0%) |
| Construction | 34 (80.9%) | 8 (19.1%) |
| Manufacturing | 8 (88.9%) | 1 (11.1%) |
| Wholesale Trade | 0 (0.0%) | 0 (0.0%) |
| Retail Trade | 30 (93.8%) | 2 (6.2%) |
| Transportation & Warehousing | 5 (83.3%) | 1 (16.7%) |
| Utilities | 2 (100.0%) | 0 (0.0%) |
| Information | 0 (0.0%) | 3 (100.0%) |
| Finance & Insurance | 0 (0.0%) | 9 (100.0%) |
| Real Estate, Rental & Leasing | 7 (100.0%) | 0 (0.0%) |
| Professional & Scientific | 4 (57.1%) | 3 (42.9%) |
| Enterprise Management | 0 (0.0%) | 0 (0.0%) |
| Administrative & Support | 2 (100.0%) | 0 (0.0%) |
| Educational Services | 3 (15.8%) | 16 (84.2%) |
| Health Care & Social Assistance | 0 (0.0%) | 15 (100.0%) |
| Arts, Entertainment & Recreation | 3 (60.0%) | 2 (40.0%) |
| Accommodation & Food Services | 0 (0.0%) | 3 (100.0%) |
| Public Administration | 7 (41.2%) | 10 (58.8%) |
| Total | 139 (58.4%) | 99 (41.6%) |
Education in Tryon
School Enrollment in Tryon
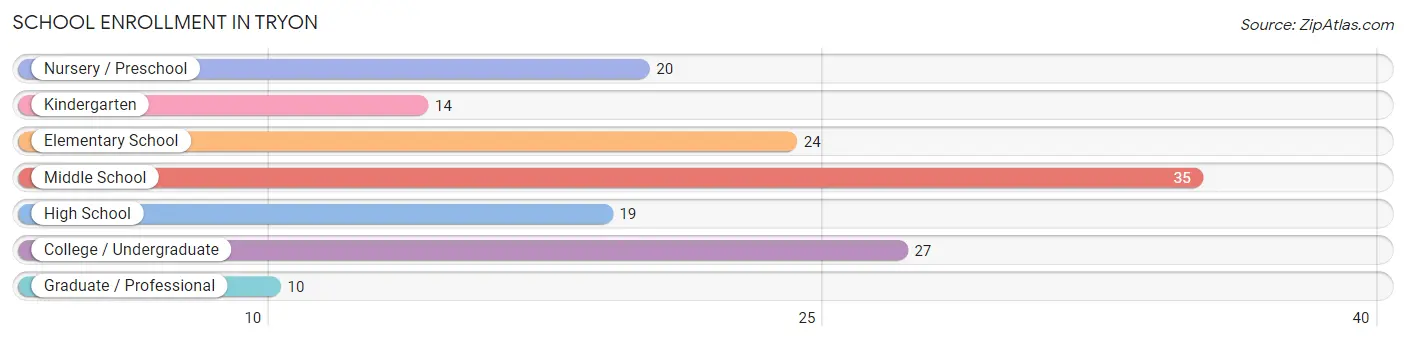
The most common levels of schooling among the 149 students in Tryon are middle school (35 | 23.5%), college / undergraduate (27 | 18.1%), and elementary school (24 | 16.1%).
| School Level | # Students | % Students |
| Nursery / Preschool | 20 | 13.4% |
| Kindergarten | 14 | 9.4% |
| Elementary School | 24 | 16.1% |
| Middle School | 35 | 23.5% |
| High School | 19 | 12.8% |
| College / Undergraduate | 27 | 18.1% |
| Graduate / Professional | 10 | 6.7% |
| Total | 149 | 100.0% |
School Enrollment by Age by Funding Source in Tryon
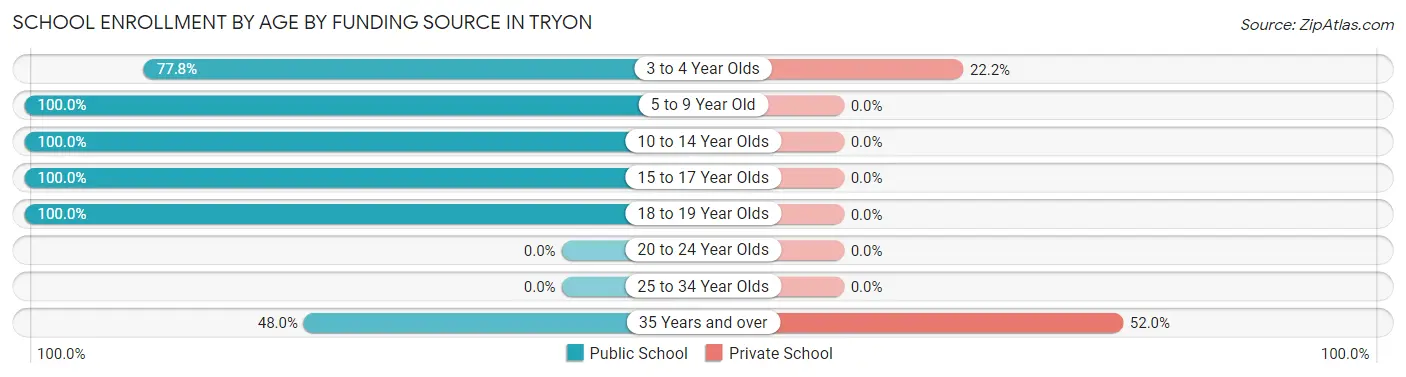
Out of a total of 149 students who are enrolled in schools in Tryon, 17 (11.4%) attend a private institution, while the remaining 132 (88.6%) are enrolled in public schools. The age group of 35 years and over has the highest likelihood of being enrolled in private schools, with 13 (52.0% in the age bracket) enrolled. Conversely, the age group of 5 to 9 year old has the lowest likelihood of being enrolled in a private school, with 39 (100.0% in the age bracket) attending a public institution.
| Age Bracket | Public School | Private School |
| 3 to 4 Year Olds | 14 (77.8%) | 4 (22.2%) |
| 5 to 9 Year Old | 39 (100.0%) | 0 (0.0%) |
| 10 to 14 Year Olds | 36 (100.0%) | 0 (0.0%) |
| 15 to 17 Year Olds | 9 (100.0%) | 0 (0.0%) |
| 18 to 19 Year Olds | 22 (100.0%) | 0 (0.0%) |
| 20 to 24 Year Olds | 0 (0.0%) | 0 (0.0%) |
| 25 to 34 Year Olds | 0 (0.0%) | 0 (0.0%) |
| 35 Years and over | 12 (48.0%) | 13 (52.0%) |
| Total | 132 (88.6%) | 17 (11.4%) |
Educational Attainment by Field of Study in Tryon
Liberal arts & history (10 | 33.3%), arts & humanities (10 | 33.3%), business (9 | 30.0%), and social sciences (1 | 3.3%) are the most common fields of study among 30 individuals in Tryon who have obtained a bachelor's degree or higher.
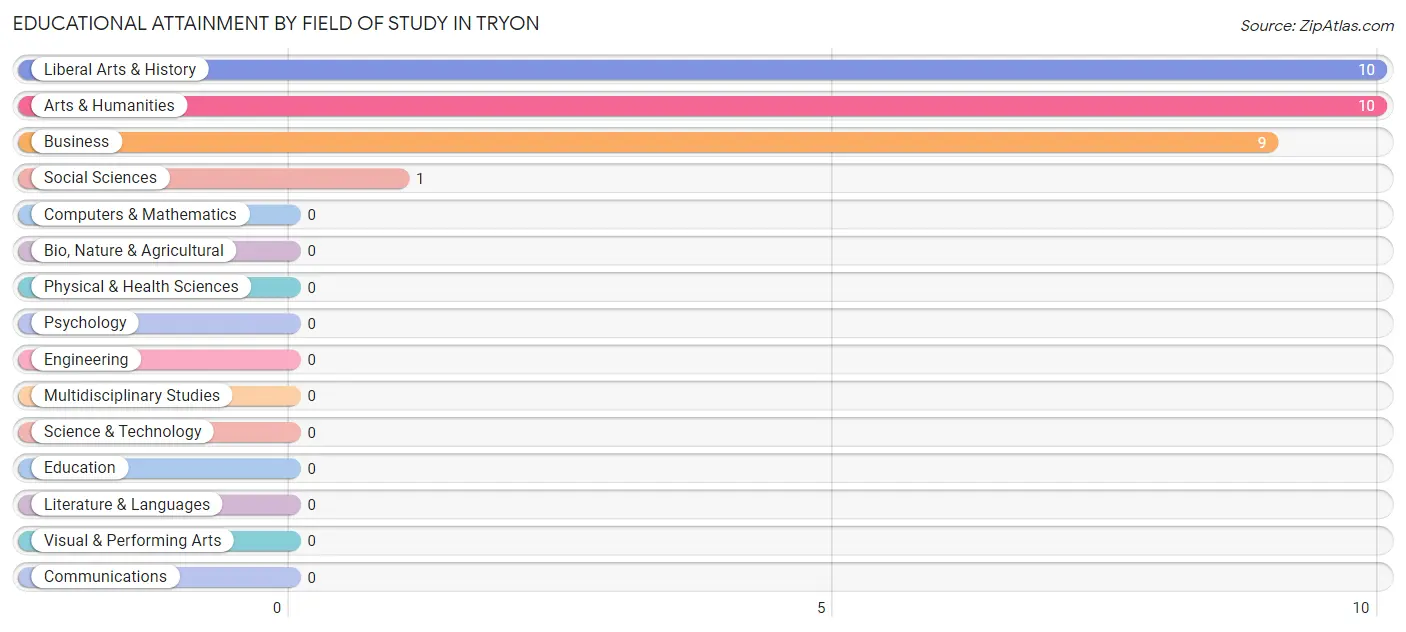
| Field of Study | # Graduates | % Graduates |
| Computers & Mathematics | 0 | 0.0% |
| Bio, Nature & Agricultural | 0 | 0.0% |
| Physical & Health Sciences | 0 | 0.0% |
| Psychology | 0 | 0.0% |
| Social Sciences | 1 | 3.3% |
| Engineering | 0 | 0.0% |
| Multidisciplinary Studies | 0 | 0.0% |
| Science & Technology | 0 | 0.0% |
| Business | 9 | 30.0% |
| Education | 0 | 0.0% |
| Literature & Languages | 0 | 0.0% |
| Liberal Arts & History | 10 | 33.3% |
| Visual & Performing Arts | 0 | 0.0% |
| Communications | 0 | 0.0% |
| Arts & Humanities | 10 | 33.3% |
| Total | 30 | 100.0% |
Transportation & Commute in Tryon
Vehicle Availability by Sex in Tryon
The most prevalent vehicle ownership categories in Tryon are males with 2 vehicles (41, accounting for 29.5%) and females with 2 vehicles (28, making up 41.4%).
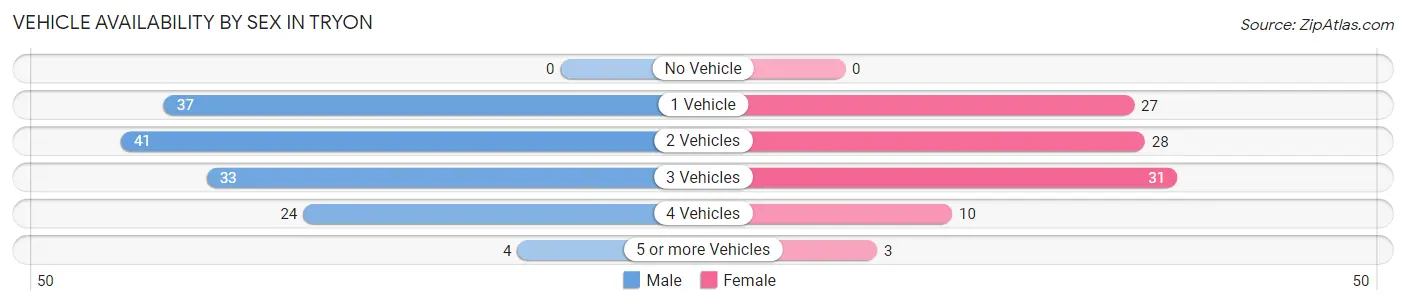
| Vehicles Available | Male | Female |
| No Vehicle | 0 (0.0%) | 0 (0.0%) |
| 1 Vehicle | 37 (26.6%) | 27 (27.3%) |
| 2 Vehicles | 41 (29.5%) | 28 (28.3%) |
| 3 Vehicles | 33 (23.7%) | 31 (31.3%) |
| 4 Vehicles | 24 (17.3%) | 10 (10.1%) |
| 5 or more Vehicles | 4 (2.9%) | 3 (3.0%) |
| Total | 139 (100.0%) | 99 (100.0%) |
Commute Time in Tryon
The most frequently occuring commute durations in Tryon are 35 to 39 minutes (30 commuters, 14.1%), 10 to 14 minutes (26 commuters, 12.2%), and 45 to 59 minutes (25 commuters, 11.7%).
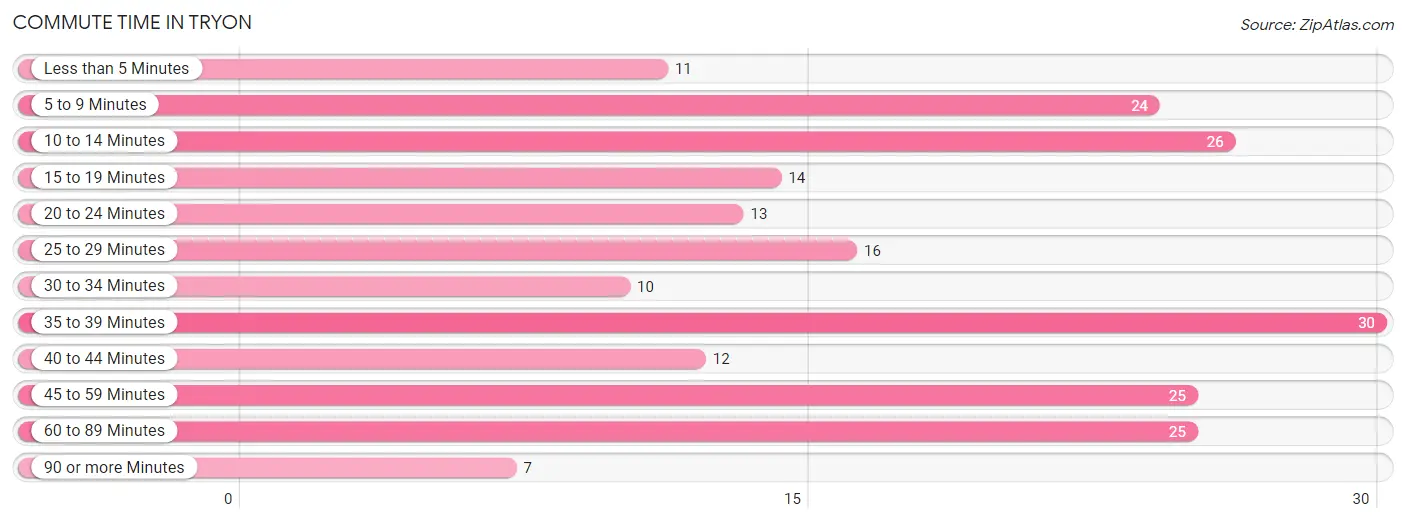
| Commute Time | # Commuters | % Commuters |
| Less than 5 Minutes | 11 | 5.2% |
| 5 to 9 Minutes | 24 | 11.3% |
| 10 to 14 Minutes | 26 | 12.2% |
| 15 to 19 Minutes | 14 | 6.6% |
| 20 to 24 Minutes | 13 | 6.1% |
| 25 to 29 Minutes | 16 | 7.5% |
| 30 to 34 Minutes | 10 | 4.7% |
| 35 to 39 Minutes | 30 | 14.1% |
| 40 to 44 Minutes | 12 | 5.6% |
| 45 to 59 Minutes | 25 | 11.7% |
| 60 to 89 Minutes | 25 | 11.7% |
| 90 or more Minutes | 7 | 3.3% |
Commute Time by Sex in Tryon
The most common commute times in Tryon are 60 to 89 minutes (24 commuters, 19.7%) for males and 35 to 39 minutes (16 commuters, 17.6%) for females.
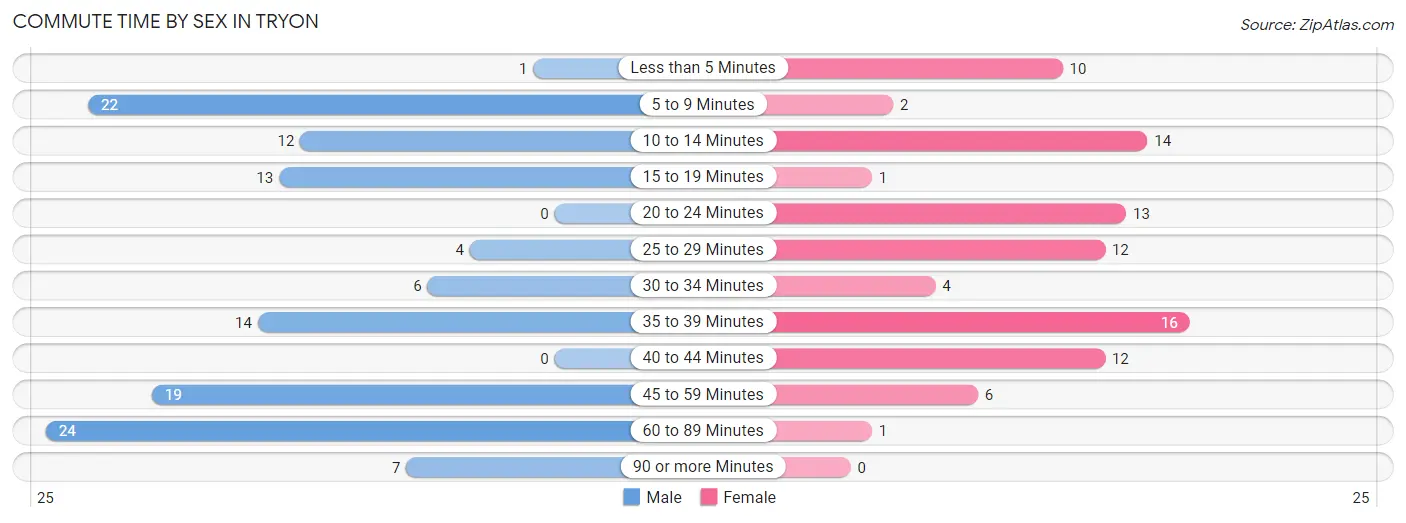
| Commute Time | Male | Female |
| Less than 5 Minutes | 1 (0.8%) | 10 (11.0%) |
| 5 to 9 Minutes | 22 (18.0%) | 2 (2.2%) |
| 10 to 14 Minutes | 12 (9.8%) | 14 (15.4%) |
| 15 to 19 Minutes | 13 (10.7%) | 1 (1.1%) |
| 20 to 24 Minutes | 0 (0.0%) | 13 (14.3%) |
| 25 to 29 Minutes | 4 (3.3%) | 12 (13.2%) |
| 30 to 34 Minutes | 6 (4.9%) | 4 (4.4%) |
| 35 to 39 Minutes | 14 (11.5%) | 16 (17.6%) |
| 40 to 44 Minutes | 0 (0.0%) | 12 (13.2%) |
| 45 to 59 Minutes | 19 (15.6%) | 6 (6.6%) |
| 60 to 89 Minutes | 24 (19.7%) | 1 (1.1%) |
| 90 or more Minutes | 7 (5.7%) | 0 (0.0%) |
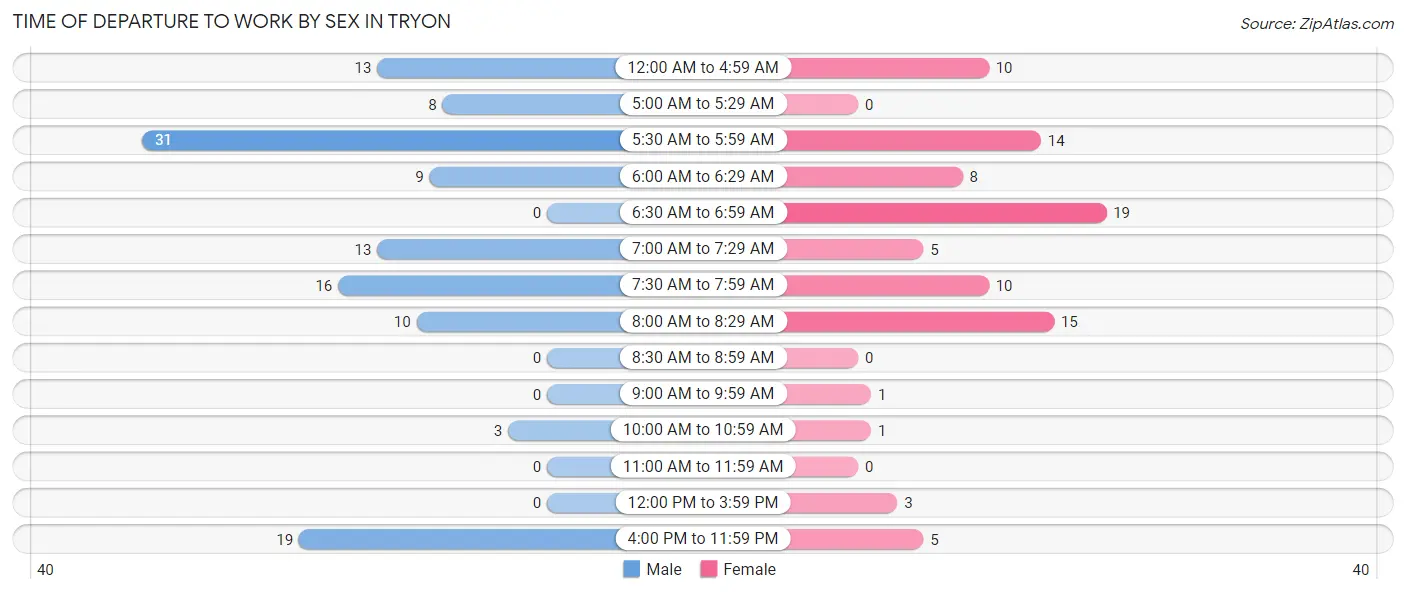
Time of Departure to Work by Sex in Tryon
The most frequent times of departure to work in Tryon are 5:30 AM to 5:59 AM (31, 25.4%) for males and 6:30 AM to 6:59 AM (19, 20.9%) for females.
| Time of Departure | Male | Female |
| 12:00 AM to 4:59 AM | 13 (10.7%) | 10 (11.0%) |
| 5:00 AM to 5:29 AM | 8 (6.6%) | 0 (0.0%) |
| 5:30 AM to 5:59 AM | 31 (25.4%) | 14 (15.4%) |
| 6:00 AM to 6:29 AM | 9 (7.4%) | 8 (8.8%) |
| 6:30 AM to 6:59 AM | 0 (0.0%) | 19 (20.9%) |
| 7:00 AM to 7:29 AM | 13 (10.7%) | 5 (5.5%) |
| 7:30 AM to 7:59 AM | 16 (13.1%) | 10 (11.0%) |
| 8:00 AM to 8:29 AM | 10 (8.2%) | 15 (16.5%) |
| 8:30 AM to 8:59 AM | 0 (0.0%) | 0 (0.0%) |
| 9:00 AM to 9:59 AM | 0 (0.0%) | 1 (1.1%) |
| 10:00 AM to 10:59 AM | 3 (2.5%) | 1 (1.1%) |
| 11:00 AM to 11:59 AM | 0 (0.0%) | 0 (0.0%) |
| 12:00 PM to 3:59 PM | 0 (0.0%) | 3 (3.3%) |
| 4:00 PM to 11:59 PM | 19 (15.6%) | 5 (5.5%) |
| Total | 122 (100.0%) | 91 (100.0%) |
Housing Occupancy in Tryon
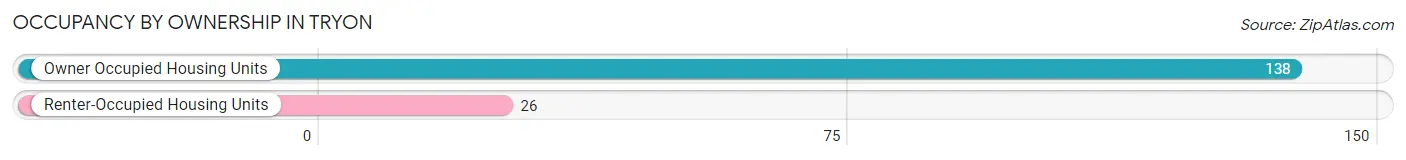
Occupancy by Ownership in Tryon
Of the total 164 dwellings in Tryon, owner-occupied units account for 138 (84.2%), while renter-occupied units make up 26 (15.9%).
| Occupancy | # Housing Units | % Housing Units |
| Owner Occupied Housing Units | 138 | 84.2% |
| Renter-Occupied Housing Units | 26 | 15.9% |
| Total Occupied Housing Units | 164 | 100.0% |
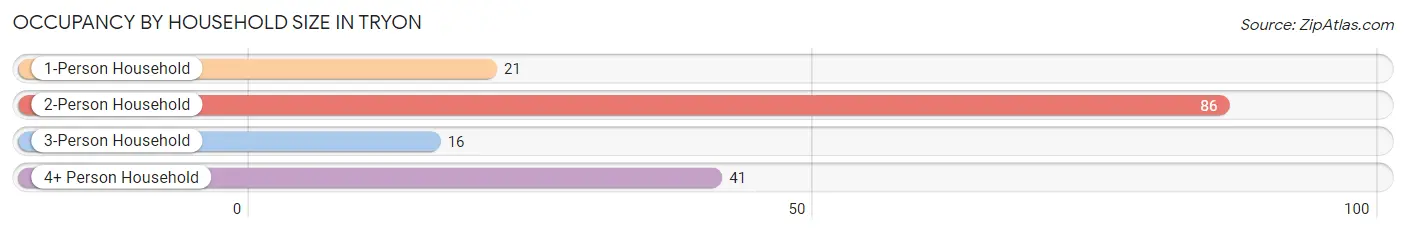
Occupancy by Household Size in Tryon
| Household Size | # Housing Units | % Housing Units |
| 1-Person Household | 21 | 12.8% |
| 2-Person Household | 86 | 52.4% |
| 3-Person Household | 16 | 9.8% |
| 4+ Person Household | 41 | 25.0% |
| Total Housing Units | 164 | 100.0% |
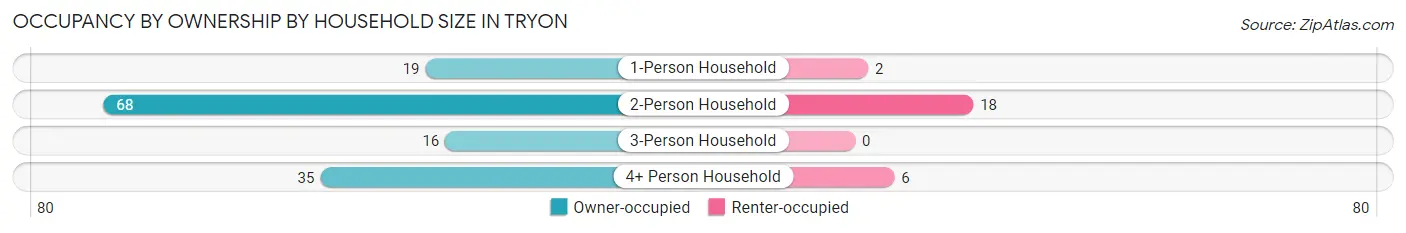
Occupancy by Ownership by Household Size in Tryon
| Household Size | Owner-occupied | Renter-occupied |
| 1-Person Household | 19 (90.5%) | 2 (9.5%) |
| 2-Person Household | 68 (79.1%) | 18 (20.9%) |
| 3-Person Household | 16 (100.0%) | 0 (0.0%) |
| 4+ Person Household | 35 (85.4%) | 6 (14.6%) |
| Total Housing Units | 138 (84.2%) | 26 (15.9%) |
Occupancy by Educational Attainment in Tryon
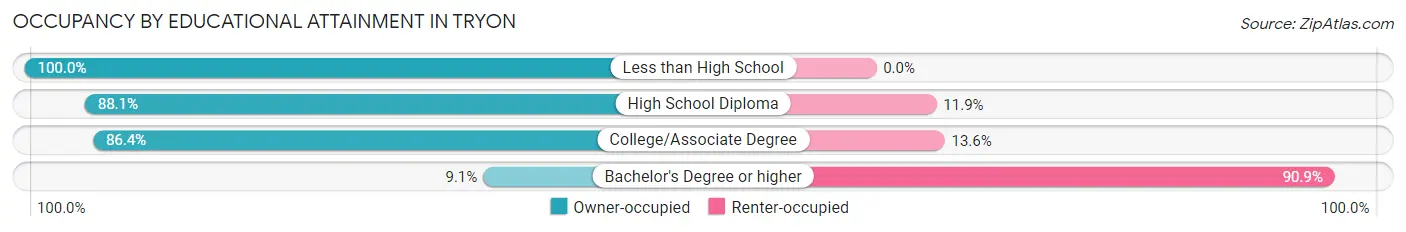
| Household Size | Owner-occupied | Renter-occupied |
| Less than High School | 27 (100.0%) | 0 (0.0%) |
| High School Diploma | 59 (88.1%) | 8 (11.9%) |
| College/Associate Degree | 51 (86.4%) | 8 (13.6%) |
| Bachelor's Degree or higher | 1 (9.1%) | 10 (90.9%) |
Occupancy by Age of Householder in Tryon
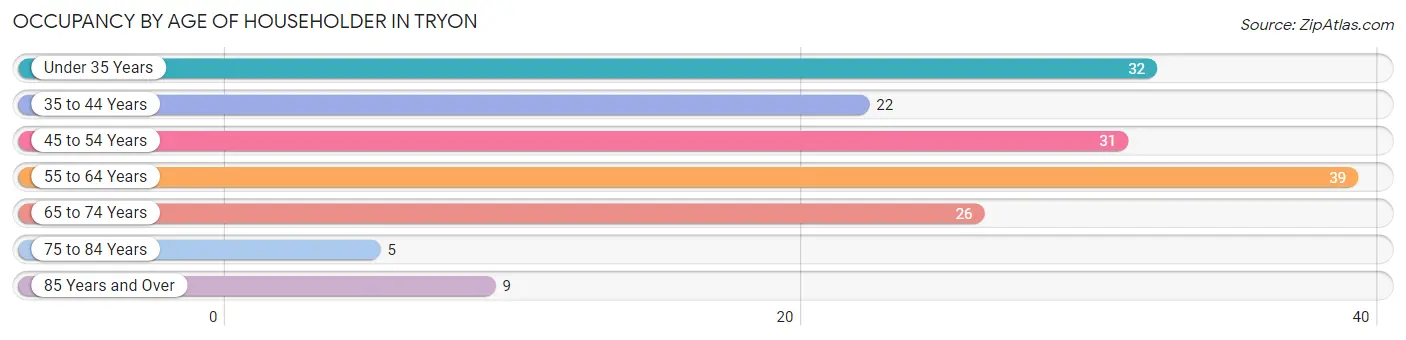
| Age Bracket | # Households | % Households |
| Under 35 Years | 32 | 19.5% |
| 35 to 44 Years | 22 | 13.4% |
| 45 to 54 Years | 31 | 18.9% |
| 55 to 64 Years | 39 | 23.8% |
| 65 to 74 Years | 26 | 15.9% |
| 75 to 84 Years | 5 | 3.0% |
| 85 Years and Over | 9 | 5.5% |
| Total | 164 | 100.0% |
Housing Finances in Tryon
Median Income by Occupancy in Tryon
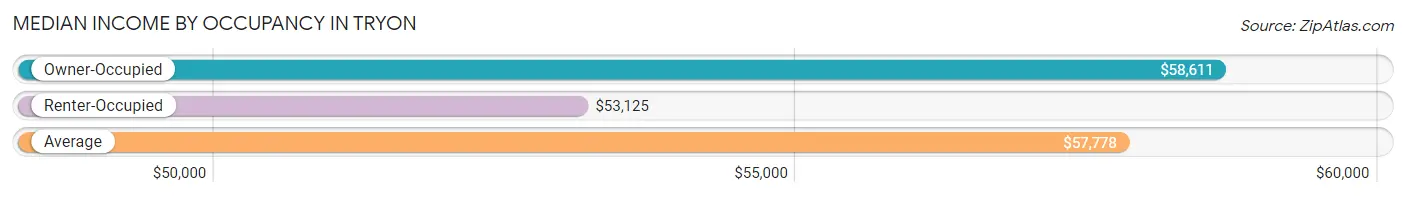
| Occupancy Type | # Households | Median Income |
| Owner-Occupied | 138 (84.2%) | $58,611 |
| Renter-Occupied | 26 (15.9%) | $53,125 |
| Average | 164 (100.0%) | $57,778 |
Occupancy by Householder Income Bracket in Tryon
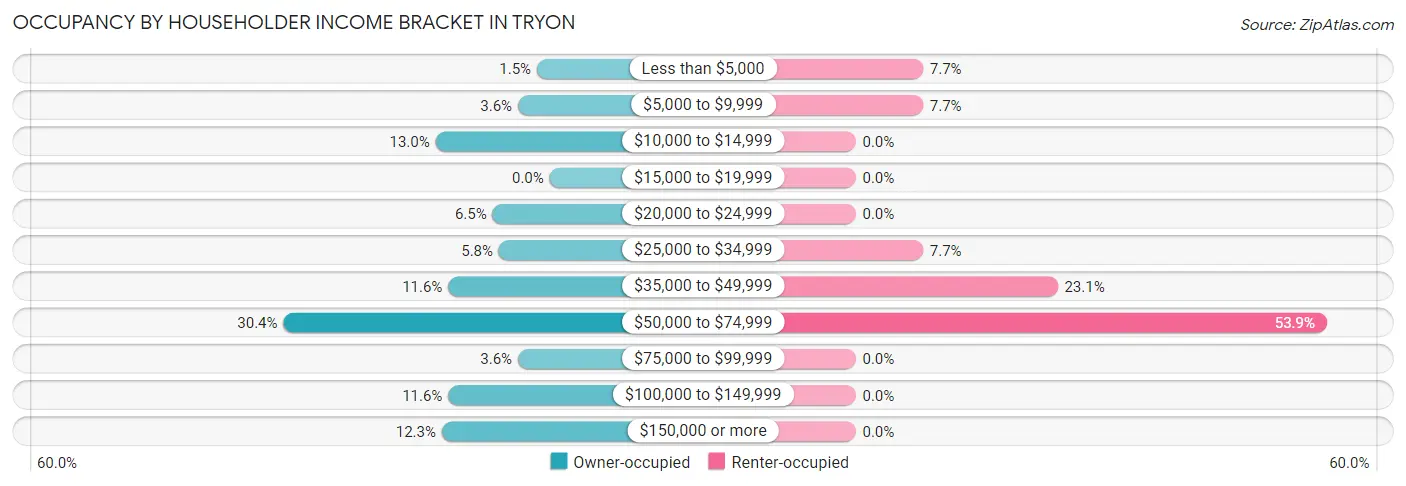
| Income Bracket | Owner-occupied | Renter-occupied |
| Less than $5,000 | 2 (1.5%) | 2 (7.7%) |
| $5,000 to $9,999 | 5 (3.6%) | 2 (7.7%) |
| $10,000 to $14,999 | 18 (13.0%) | 0 (0.0%) |
| $15,000 to $19,999 | 0 (0.0%) | 0 (0.0%) |
| $20,000 to $24,999 | 9 (6.5%) | 0 (0.0%) |
| $25,000 to $34,999 | 8 (5.8%) | 2 (7.7%) |
| $35,000 to $49,999 | 16 (11.6%) | 6 (23.1%) |
| $50,000 to $74,999 | 42 (30.4%) | 14 (53.8%) |
| $75,000 to $99,999 | 5 (3.6%) | 0 (0.0%) |
| $100,000 to $149,999 | 16 (11.6%) | 0 (0.0%) |
| $150,000 or more | 17 (12.3%) | 0 (0.0%) |
| Total | 138 (100.0%) | 26 (100.0%) |
Monthly Housing Cost Tiers in Tryon
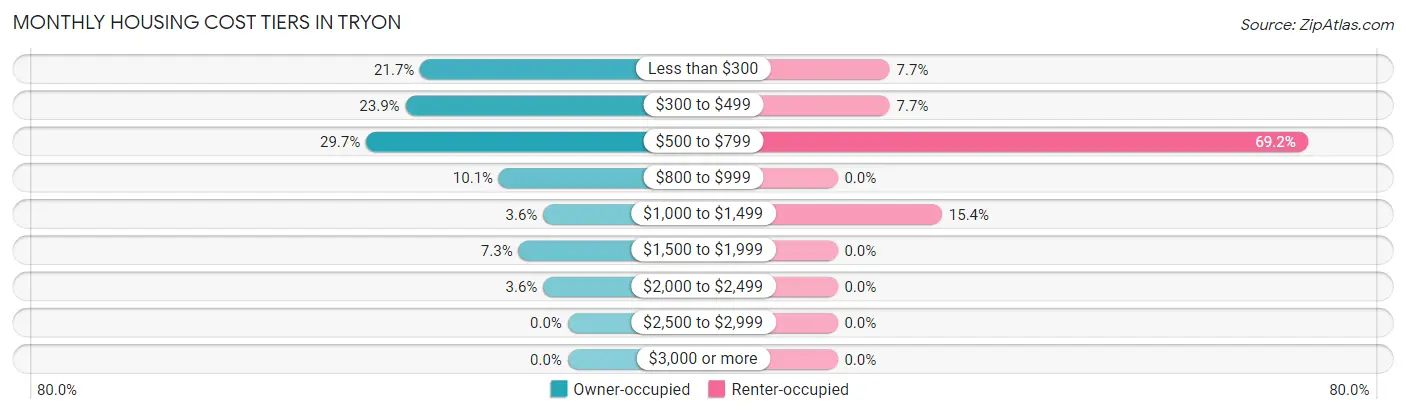
| Monthly Cost | Owner-occupied | Renter-occupied |
| Less than $300 | 30 (21.7%) | 2 (7.7%) |
| $300 to $499 | 33 (23.9%) | 2 (7.7%) |
| $500 to $799 | 41 (29.7%) | 18 (69.2%) |
| $800 to $999 | 14 (10.1%) | 0 (0.0%) |
| $1,000 to $1,499 | 5 (3.6%) | 4 (15.4%) |
| $1,500 to $1,999 | 10 (7.2%) | 0 (0.0%) |
| $2,000 to $2,499 | 5 (3.6%) | 0 (0.0%) |
| $2,500 to $2,999 | 0 (0.0%) | 0 (0.0%) |
| $3,000 or more | 0 (0.0%) | 0 (0.0%) |
| Total | 138 (100.0%) | 26 (100.0%) |
Physical Housing Characteristics in Tryon
Housing Structures in Tryon
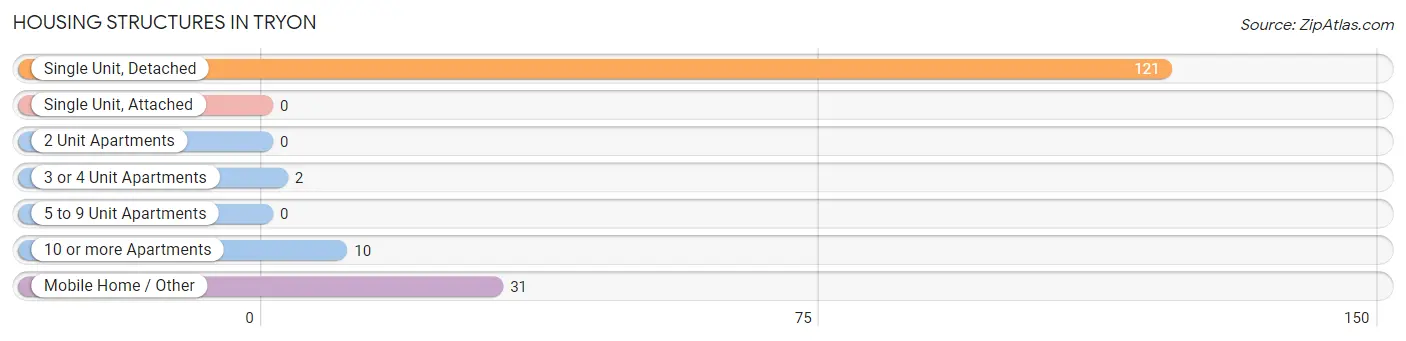
| Structure Type | # Housing Units | % Housing Units |
| Single Unit, Detached | 121 | 73.8% |
| Single Unit, Attached | 0 | 0.0% |
| 2 Unit Apartments | 0 | 0.0% |
| 3 or 4 Unit Apartments | 2 | 1.2% |
| 5 to 9 Unit Apartments | 0 | 0.0% |
| 10 or more Apartments | 10 | 6.1% |
| Mobile Home / Other | 31 | 18.9% |
| Total | 164 | 100.0% |
Housing Structures by Occupancy in Tryon
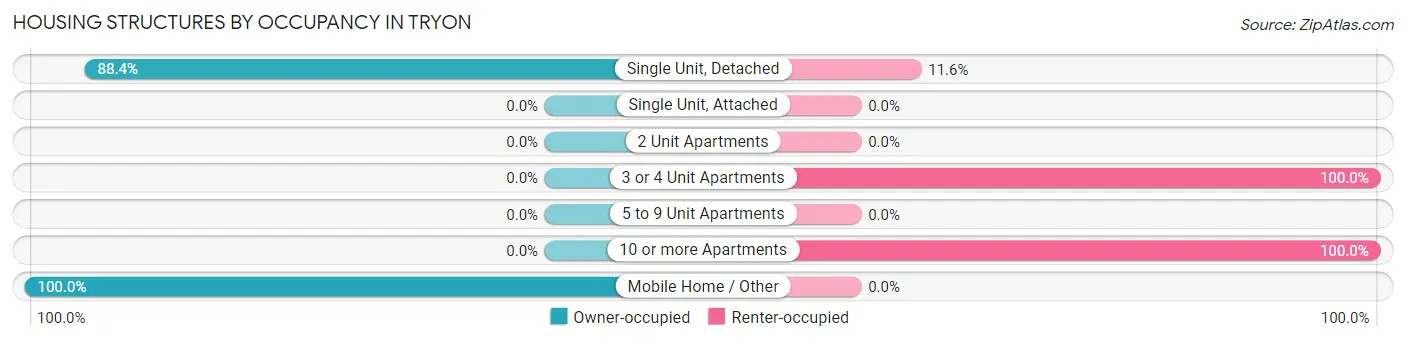
| Structure Type | Owner-occupied | Renter-occupied |
| Single Unit, Detached | 107 (88.4%) | 14 (11.6%) |
| Single Unit, Attached | 0 (0.0%) | 0 (0.0%) |
| 2 Unit Apartments | 0 (0.0%) | 0 (0.0%) |
| 3 or 4 Unit Apartments | 0 (0.0%) | 2 (100.0%) |
| 5 to 9 Unit Apartments | 0 (0.0%) | 0 (0.0%) |
| 10 or more Apartments | 0 (0.0%) | 10 (100.0%) |
| Mobile Home / Other | 31 (100.0%) | 0 (0.0%) |
| Total | 138 (84.2%) | 26 (15.9%) |
Housing Structures by Number of Rooms in Tryon
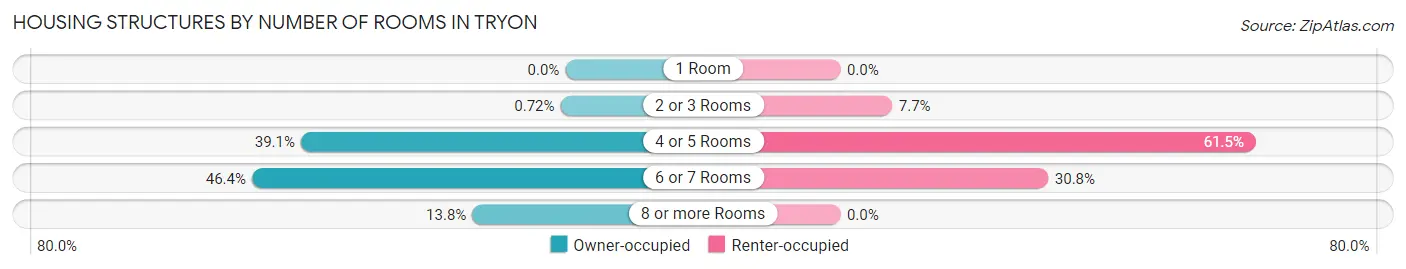
| Number of Rooms | Owner-occupied | Renter-occupied |
| 1 Room | 0 (0.0%) | 0 (0.0%) |
| 2 or 3 Rooms | 1 (0.7%) | 2 (7.7%) |
| 4 or 5 Rooms | 54 (39.1%) | 16 (61.5%) |
| 6 or 7 Rooms | 64 (46.4%) | 8 (30.8%) |
| 8 or more Rooms | 19 (13.8%) | 0 (0.0%) |
| Total | 138 (100.0%) | 26 (100.0%) |
Housing Structure by Heating Type in Tryon
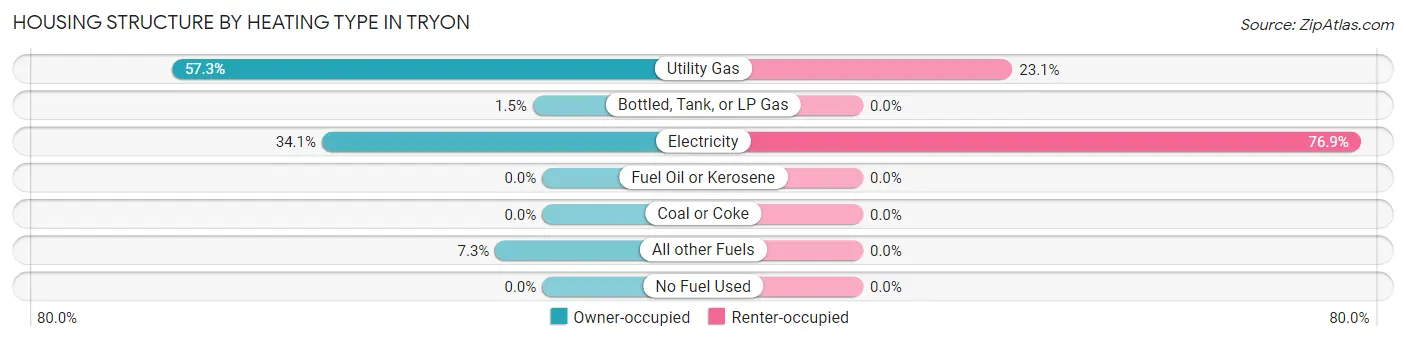
| Heating Type | Owner-occupied | Renter-occupied |
| Utility Gas | 79 (57.3%) | 6 (23.1%) |
| Bottled, Tank, or LP Gas | 2 (1.5%) | 0 (0.0%) |
| Electricity | 47 (34.1%) | 20 (76.9%) |
| Fuel Oil or Kerosene | 0 (0.0%) | 0 (0.0%) |
| Coal or Coke | 0 (0.0%) | 0 (0.0%) |
| All other Fuels | 10 (7.2%) | 0 (0.0%) |
| No Fuel Used | 0 (0.0%) | 0 (0.0%) |
| Total | 138 (100.0%) | 26 (100.0%) |
Household Vehicle Usage in Tryon
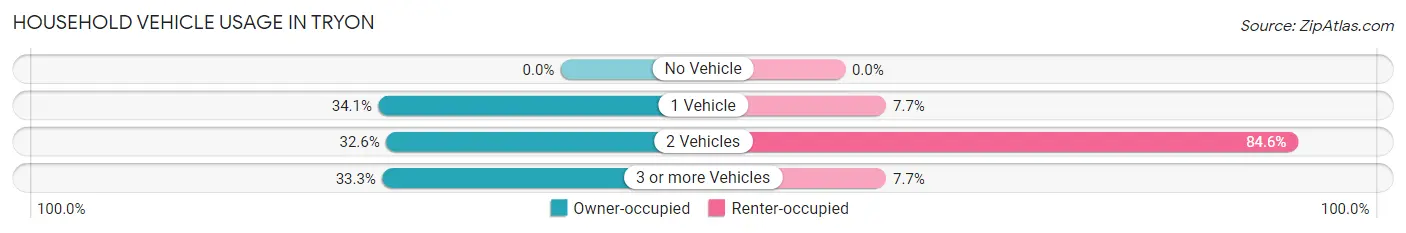
| Vehicles per Household | Owner-occupied | Renter-occupied |
| No Vehicle | 0 (0.0%) | 0 (0.0%) |
| 1 Vehicle | 47 (34.1%) | 2 (7.7%) |
| 2 Vehicles | 45 (32.6%) | 22 (84.6%) |
| 3 or more Vehicles | 46 (33.3%) | 2 (7.7%) |
| Total | 138 (100.0%) | 26 (100.0%) |
Real Estate & Mortgages in Tryon
Real Estate and Mortgage Overview in Tryon
| Characteristic | Without Mortgage | With Mortgage |
| Housing Units | 77 | 61 |
| Median Property Value | $91,700 | $106,300 |
| Median Household Income | $57,708 | $0 |
| Monthly Housing Costs | $328 | $0 |
| Real Estate Taxes | $567 | $10 |
Property Value by Mortgage Status in Tryon
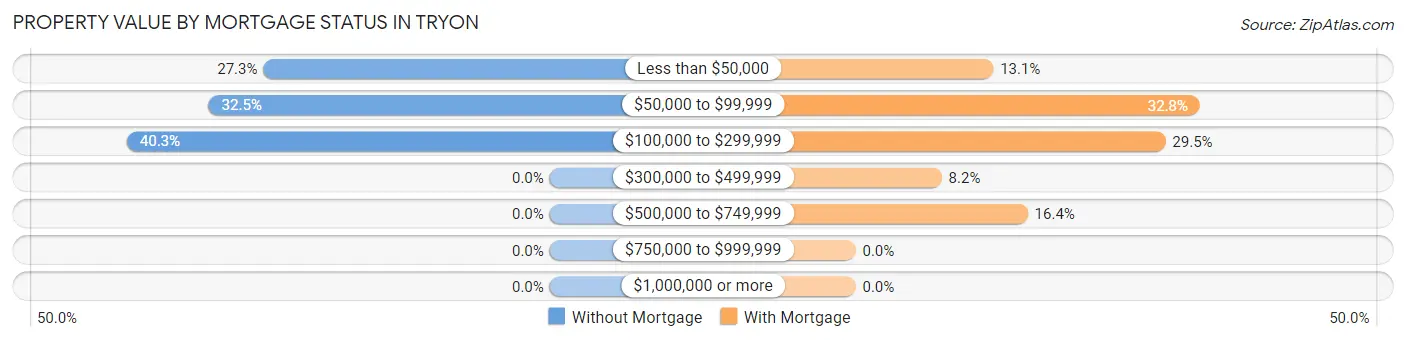
| Property Value | Without Mortgage | With Mortgage |
| Less than $50,000 | 21 (27.3%) | 8 (13.1%) |
| $50,000 to $99,999 | 25 (32.5%) | 20 (32.8%) |
| $100,000 to $299,999 | 31 (40.3%) | 18 (29.5%) |
| $300,000 to $499,999 | 0 (0.0%) | 5 (8.2%) |
| $500,000 to $749,999 | 0 (0.0%) | 10 (16.4%) |
| $750,000 to $999,999 | 0 (0.0%) | 0 (0.0%) |
| $1,000,000 or more | 0 (0.0%) | 0 (0.0%) |
| Total | 77 (100.0%) | 61 (100.0%) |
Household Income by Mortgage Status in Tryon
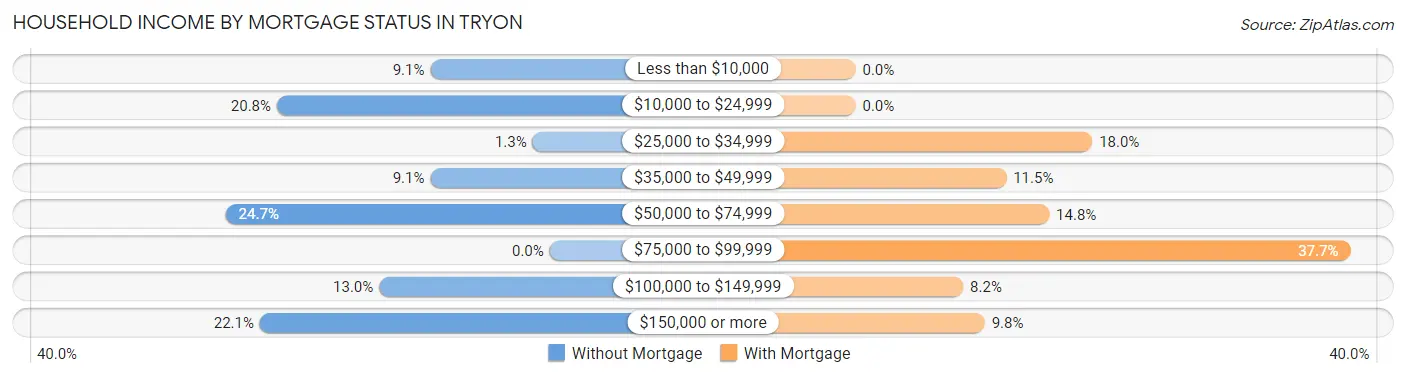
| Household Income | Without Mortgage | With Mortgage |
| Less than $10,000 | 7 (9.1%) | 0 (0.0%) |
| $10,000 to $24,999 | 16 (20.8%) | 0 (0.0%) |
| $25,000 to $34,999 | 1 (1.3%) | 11 (18.0%) |
| $35,000 to $49,999 | 7 (9.1%) | 7 (11.5%) |
| $50,000 to $74,999 | 19 (24.7%) | 9 (14.7%) |
| $75,000 to $99,999 | 0 (0.0%) | 23 (37.7%) |
| $100,000 to $149,999 | 10 (13.0%) | 5 (8.2%) |
| $150,000 or more | 17 (22.1%) | 6 (9.8%) |
| Total | 77 (100.0%) | 61 (100.0%) |
Property Value to Household Income Ratio in Tryon
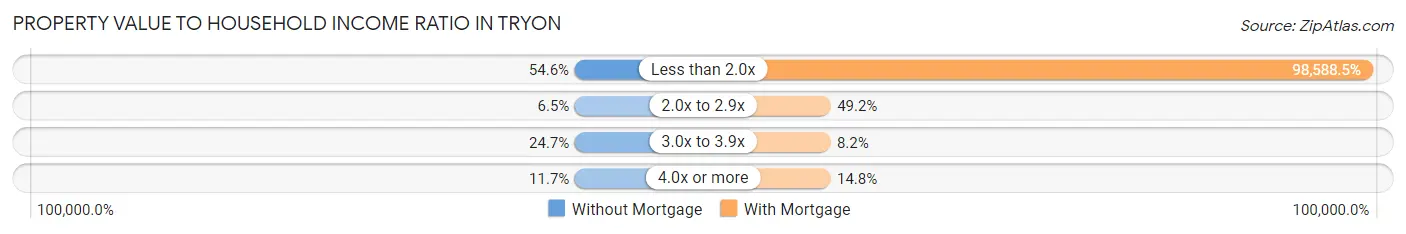
| Value-to-Income Ratio | Without Mortgage | With Mortgage |
| Less than 2.0x | 42 (54.5%) | 60,139 (98,588.5%) |
| 2.0x to 2.9x | 5 (6.5%) | 30 (49.2%) |
| 3.0x to 3.9x | 19 (24.7%) | 5 (8.2%) |
| 4.0x or more | 9 (11.7%) | 9 (14.7%) |
| Total | 77 (100.0%) | 61 (100.0%) |
Real Estate Taxes by Mortgage Status in Tryon
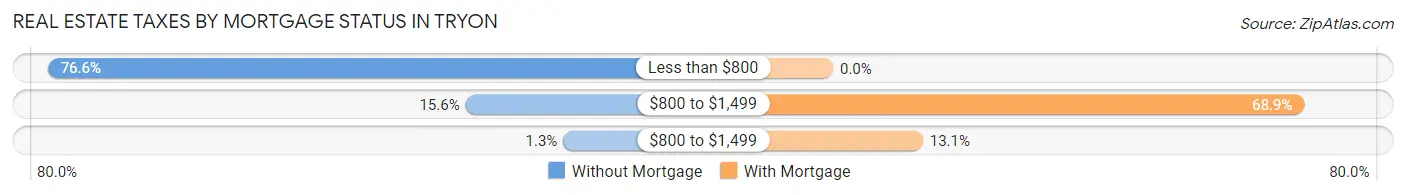
| Property Taxes | Without Mortgage | With Mortgage |
| Less than $800 | 59 (76.6%) | 0 (0.0%) |
| $800 to $1,499 | 12 (15.6%) | 42 (68.9%) |
| $800 to $1,499 | 1 (1.3%) | 8 (13.1%) |
| Total | 77 (100.0%) | 61 (100.0%) |
Health & Disability in Tryon
Health Insurance Coverage by Age in Tryon

| Age Bracket | With Coverage | Without Coverage |
| Under 6 Years | 50 (100.0%) | 0 (0.0%) |
| 6 to 18 Years | 76 (79.2%) | 20 (20.8%) |
| 19 to 25 Years | 41 (66.1%) | 21 (33.9%) |
| 26 to 34 Years | 60 (76.9%) | 18 (23.1%) |
| 35 to 44 Years | 44 (77.2%) | 13 (22.8%) |
| 45 to 54 Years | 29 (70.7%) | 12 (29.3%) |
| 55 to 64 Years | 48 (75.0%) | 16 (25.0%) |
| 65 to 74 Years | 41 (100.0%) | 0 (0.0%) |
| 75 Years and older | 40 (100.0%) | 0 (0.0%) |
| Total | 429 (81.1%) | 100 (18.9%) |
Health Insurance Coverage by Citizenship Status in Tryon
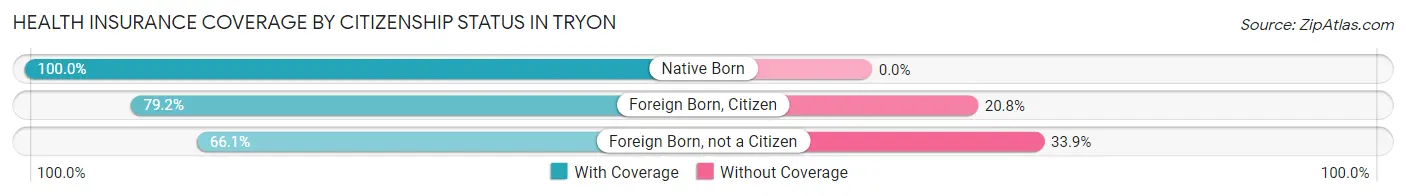
| Citizenship Status | With Coverage | Without Coverage |
| Native Born | 50 (100.0%) | 0 (0.0%) |
| Foreign Born, Citizen | 76 (79.2%) | 20 (20.8%) |
| Foreign Born, not a Citizen | 41 (66.1%) | 21 (33.9%) |
Health Insurance Coverage by Household Income in Tryon
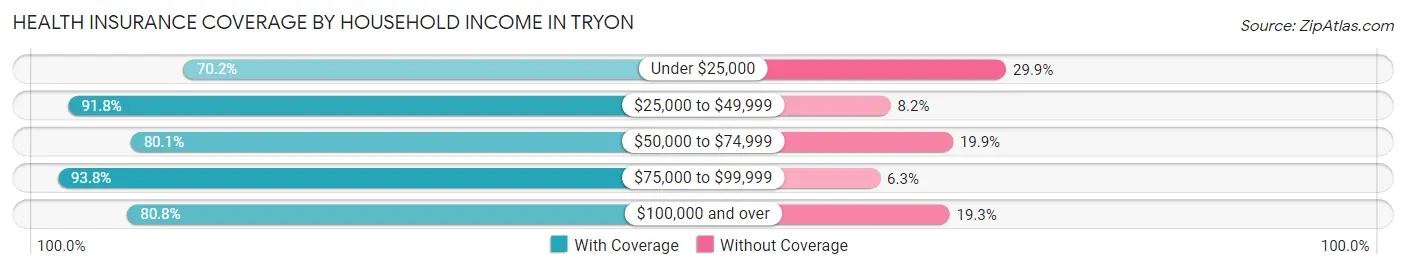
| Household Income | With Coverage | Without Coverage |
| Under $25,000 | 47 (70.2%) | 20 (29.8%) |
| $25,000 to $49,999 | 67 (91.8%) | 6 (8.2%) |
| $50,000 to $74,999 | 149 (80.1%) | 37 (19.9%) |
| $75,000 to $99,999 | 15 (93.8%) | 1 (6.2%) |
| $100,000 and over | 151 (80.7%) | 36 (19.3%) |
Public vs Private Health Insurance Coverage by Age in Tryon
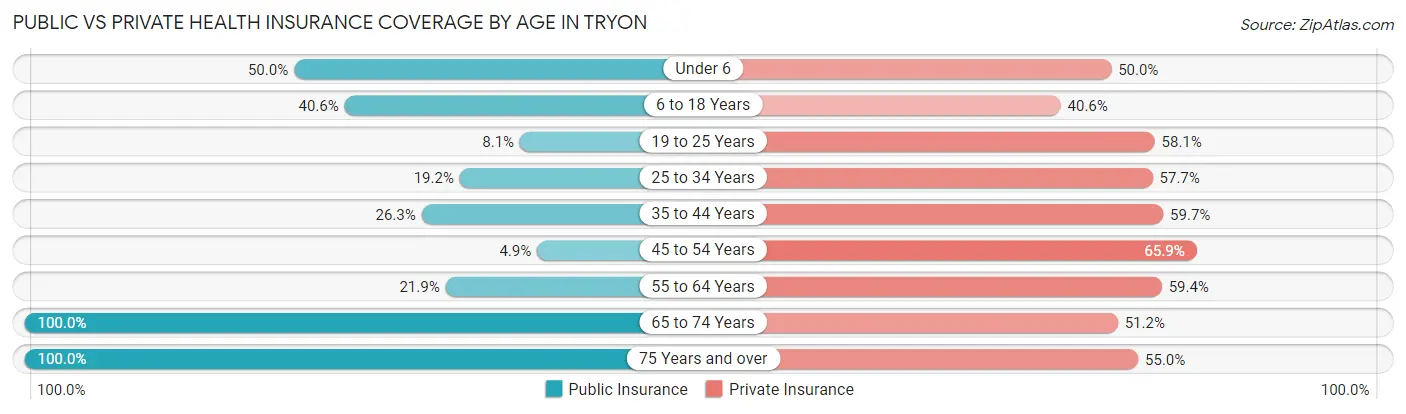
| Age Bracket | Public Insurance | Private Insurance |
| Under 6 | 25 (50.0%) | 25 (50.0%) |
| 6 to 18 Years | 39 (40.6%) | 39 (40.6%) |
| 19 to 25 Years | 5 (8.1%) | 36 (58.1%) |
| 25 to 34 Years | 15 (19.2%) | 45 (57.7%) |
| 35 to 44 Years | 15 (26.3%) | 34 (59.7%) |
| 45 to 54 Years | 2 (4.9%) | 27 (65.8%) |
| 55 to 64 Years | 14 (21.9%) | 38 (59.4%) |
| 65 to 74 Years | 41 (100.0%) | 21 (51.2%) |
| 75 Years and over | 40 (100.0%) | 22 (55.0%) |
| Total | 196 (37.0%) | 287 (54.2%) |
Disability Status by Sex by Age in Tryon
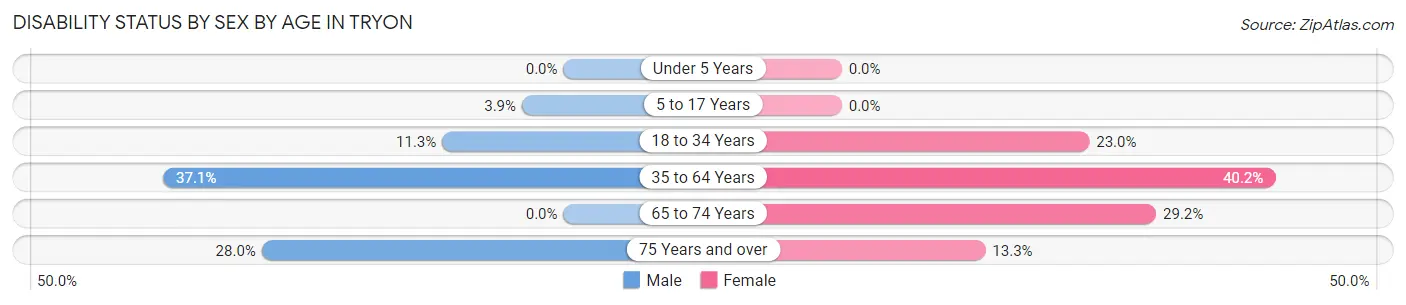
| Age Bracket | Male | Female |
| Under 5 Years | 0 (0.0%) | 0 (0.0%) |
| 5 to 17 Years | 2 (3.8%) | 0 (0.0%) |
| 18 to 34 Years | 9 (11.3%) | 17 (23.0%) |
| 35 to 64 Years | 26 (37.1%) | 37 (40.2%) |
| 65 to 74 Years | 0 (0.0%) | 7 (29.2%) |
| 75 Years and over | 7 (28.0%) | 2 (13.3%) |
Disability Class by Sex by Age in Tryon
Disability Class: Hearing Difficulty
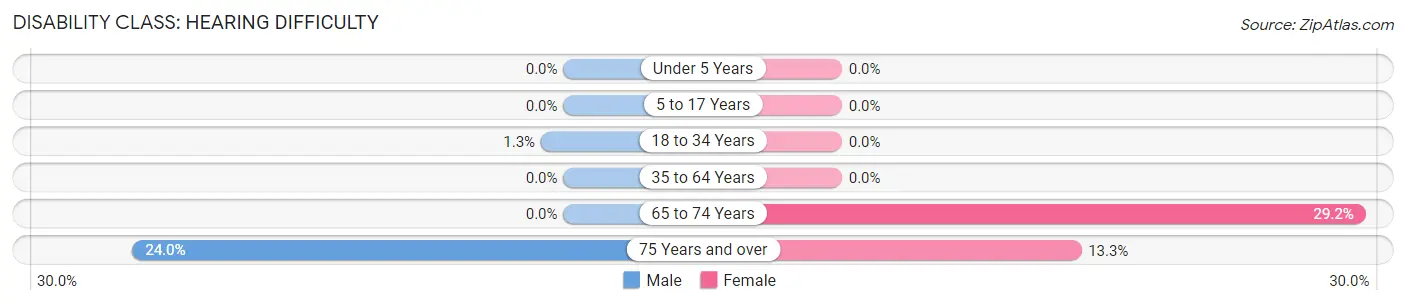
| Age Bracket | Male | Female |
| Under 5 Years | 0 (0.0%) | 0 (0.0%) |
| 5 to 17 Years | 0 (0.0%) | 0 (0.0%) |
| 18 to 34 Years | 1 (1.3%) | 0 (0.0%) |
| 35 to 64 Years | 0 (0.0%) | 0 (0.0%) |
| 65 to 74 Years | 0 (0.0%) | 7 (29.2%) |
| 75 Years and over | 6 (24.0%) | 2 (13.3%) |
Disability Class: Vision Difficulty
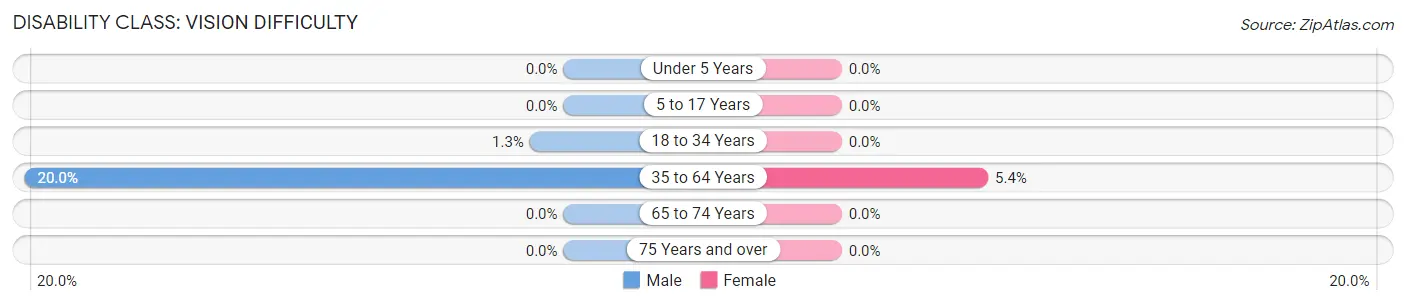
| Age Bracket | Male | Female |
| Under 5 Years | 0 (0.0%) | 0 (0.0%) |
| 5 to 17 Years | 0 (0.0%) | 0 (0.0%) |
| 18 to 34 Years | 1 (1.3%) | 0 (0.0%) |
| 35 to 64 Years | 14 (20.0%) | 5 (5.4%) |
| 65 to 74 Years | 0 (0.0%) | 0 (0.0%) |
| 75 Years and over | 0 (0.0%) | 0 (0.0%) |
Disability Class: Cognitive Difficulty
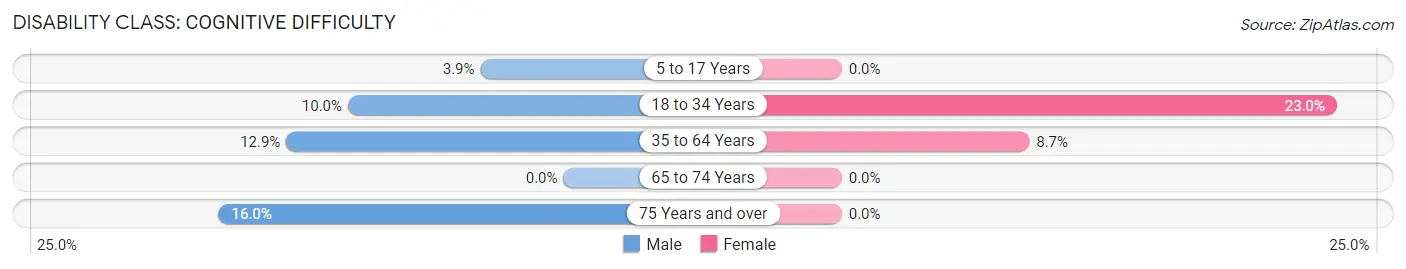
| Age Bracket | Male | Female |
| 5 to 17 Years | 2 (3.8%) | 0 (0.0%) |
| 18 to 34 Years | 8 (10.0%) | 17 (23.0%) |
| 35 to 64 Years | 9 (12.9%) | 8 (8.7%) |
| 65 to 74 Years | 0 (0.0%) | 0 (0.0%) |
| 75 Years and over | 4 (16.0%) | 0 (0.0%) |
Disability Class: Ambulatory Difficulty
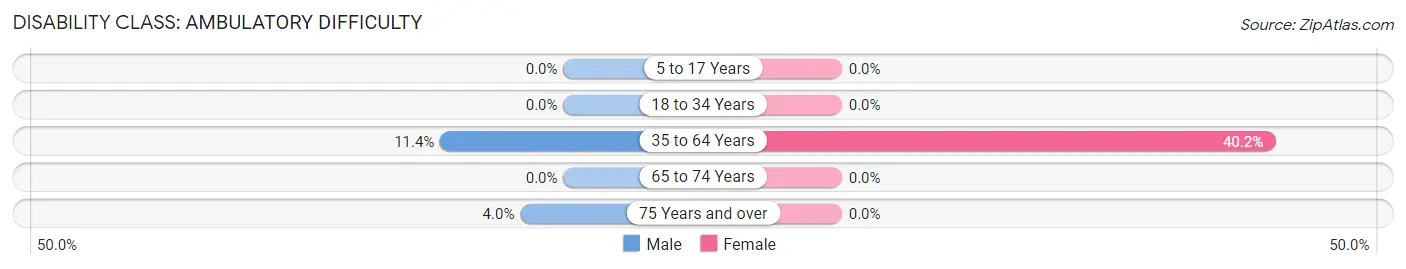
| Age Bracket | Male | Female |
| 5 to 17 Years | 0 (0.0%) | 0 (0.0%) |
| 18 to 34 Years | 0 (0.0%) | 0 (0.0%) |
| 35 to 64 Years | 8 (11.4%) | 37 (40.2%) |
| 65 to 74 Years | 0 (0.0%) | 0 (0.0%) |
| 75 Years and over | 1 (4.0%) | 0 (0.0%) |
Disability Class: Self-Care Difficulty
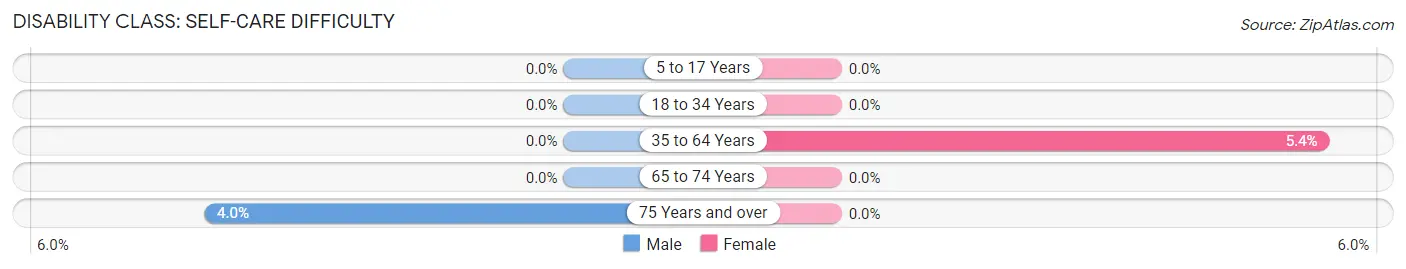
| Age Bracket | Male | Female |
| 5 to 17 Years | 0 (0.0%) | 0 (0.0%) |
| 18 to 34 Years | 0 (0.0%) | 0 (0.0%) |
| 35 to 64 Years | 0 (0.0%) | 5 (5.4%) |
| 65 to 74 Years | 0 (0.0%) | 0 (0.0%) |
| 75 Years and over | 1 (4.0%) | 0 (0.0%) |
Technology Access in Tryon
Computing Device Access in Tryon
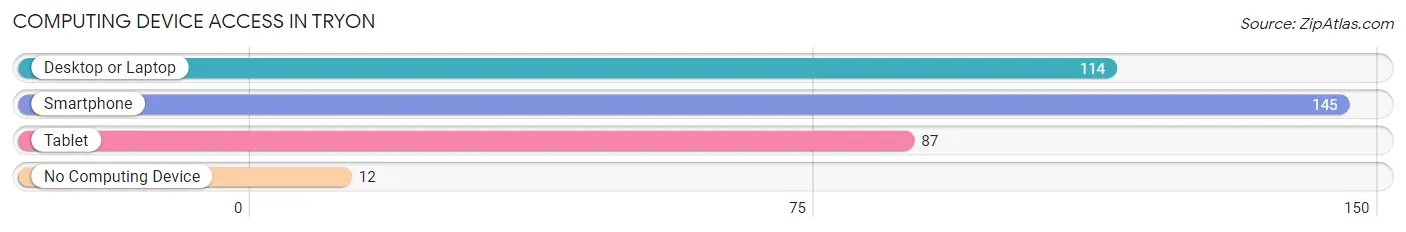
| Device Type | # Households | % Households |
| Desktop or Laptop | 114 | 69.5% |
| Smartphone | 145 | 88.4% |
| Tablet | 87 | 53.0% |
| No Computing Device | 12 | 7.3% |
| Total | 164 | 100.0% |
Internet Access in Tryon
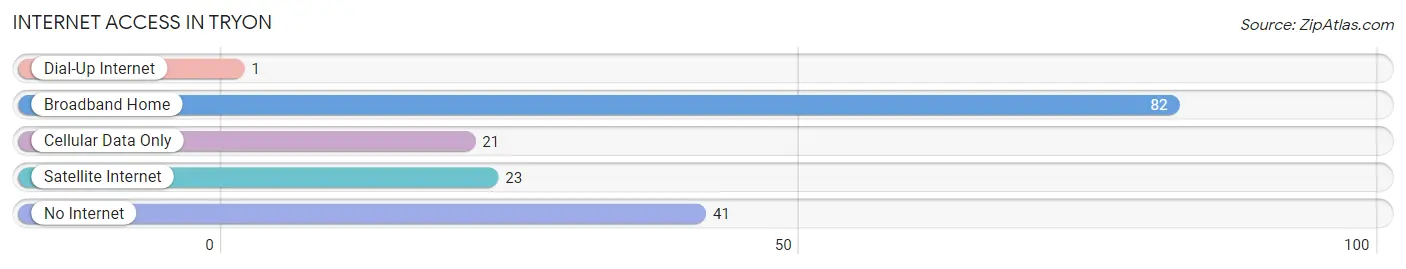
| Internet Type | # Households | % Households |
| Dial-Up Internet | 1 | 0.6% |
| Broadband Home | 82 | 50.0% |
| Cellular Data Only | 21 | 12.8% |
| Satellite Internet | 23 | 14.0% |
| No Internet | 41 | 25.0% |
| Total | 164 | 100.0% |
Tryon Summary
History
The town of Tryon, Oklahoma is located in the southwestern part of the state, in the county of Beckham. It is situated on the banks of the Washita River, and is part of the Washita Valley. The town was founded in 1892, when the Choctaw, Oklahoma and Gulf Railroad (later the Chicago, Rock Island and Pacific Railroad) was built through the area. The town was named after the railroad's president, William Tryon.
The town was originally a farming community, and the main crops grown were cotton, corn, and wheat. The town also had a few small businesses, including a general store, a blacksmith shop, and a livery stable.
In the early 1900s, the town began to grow and prosper. The population increased, and more businesses opened. The town had a bank, a hotel, a newspaper, and a movie theater. The town also had a school, which was built in 1910.
In the 1920s, the town experienced a boom in oil production. Oil wells were drilled in the area, and the town became a center for oil production. The population increased, and more businesses opened. The town had a bank, a hotel, a newspaper, and a movie theater.
In the 1930s, the Great Depression hit the town hard. Many businesses closed, and the population decreased. The town was able to survive, however, and the population slowly began to increase again.
In the 1940s, the town experienced another boom in oil production. Oil wells were drilled in the area, and the town became a center for oil production. The population increased, and more businesses opened. The town had a bank, a hotel, a newspaper, and a movie theater.
In the 1950s, the town experienced a decline in oil production. The population decreased, and many businesses closed. The town was able to survive, however, and the population slowly began to increase again.
In the 1960s, the town experienced another boom in oil production. Oil wells were drilled in the area, and the town became a center for oil production. The population increased, and more businesses opened. The town had a bank, a hotel, a newspaper, and a movie theater.
In the 1970s, the town experienced a decline in oil production. The population decreased, and many businesses closed. The town was able to survive, however, and the population slowly began to increase again.
In the 1980s, the town experienced another boom in oil production. Oil wells were drilled in the area, and the town became a center for oil production. The population increased, and more businesses opened. The town had a bank, a hotel, a newspaper, and a movie theater.
In the 1990s, the town experienced a decline in oil production. The population decreased, and many businesses closed. The town was able to survive, however, and the population slowly began to increase again.
Geography
Tryon is located in the southwestern part of Oklahoma, in the county of Beckham. It is situated on the banks of the Washita River, and is part of the Washita Valley. The town is located at an elevation of 1,068 feet (325 meters).
The town is located in a semi-arid climate, with hot summers and mild winters. The average annual temperature is 64°F (18°C), and the average annual precipitation is 24 inches (610 mm).
Economy
The economy of Tryon is largely based on agriculture and oil production. The main crops grown in the area are cotton, corn, and wheat. The town also has a few small businesses, including a general store, a blacksmith shop, and a livery stable.
The town is also home to several oil companies, including Chevron, ConocoPhillips, and Devon Energy. These companies have oil wells in the area, and they employ many of the town's residents.
Demographics
As of the 2010 census, the population of Tryon was 1,093. The racial makeup of the town was 95.3% White, 0.7% African American, 0.7% Native American, 0.3% Asian, 0.1% Pacific Islander, and 2.0% from other races. Hispanic or Latino of any race were 2.7% of the population.
The median household income in Tryon was $35,938, and the median family income was $41,250. The per capita income was $17,845. About 16.2% of the population was below the poverty line.
Common Questions
What is Per Capita Income in Tryon?
Per Capita income in Tryon is $23,796.
What is the Median Family Income in Tryon?
Median Family Income in Tryon is $60,526.
What is the Median Household income in Tryon?
Median Household Income in Tryon is $57,778.
What is Income or Wage Gap in Tryon?
Income or Wage Gap in Tryon is 28.7%.
Women in Tryon earn 71.3 cents for every dollar earned by a man.
What is Inequality or Gini Index in Tryon?
Inequality or Gini Index in Tryon is 0.46.
What is the Total Population of Tryon?
Total Population of Tryon is 529.
What is the Total Male Population of Tryon?
Total Male Population of Tryon is 249.
What is the Total Female Population of Tryon?
Total Female Population of Tryon is 280.
What is the Ratio of Males per 100 Females in Tryon?
There are 88.93 Males per 100 Females in Tryon.
What is the Ratio of Females per 100 Males in Tryon?
There are 112.45 Females per 100 Males in Tryon.
What is the Median Population Age in Tryon?
Median Population Age in Tryon is 29.6 Years.
What is the Average Family Size in Tryon
Average Family Size in Tryon is 3.6 People.
What is the Average Household Size in Tryon
Average Household Size in Tryon is 3.2 People.
How Large is the Labor Force in Tryon?
There are 238 People in the Labor Forcein in Tryon.
What is the Percentage of People in the Labor Force in Tryon?
59.1% of People are in the Labor Force in Tryon.