Area Code 973 Map & Demographics
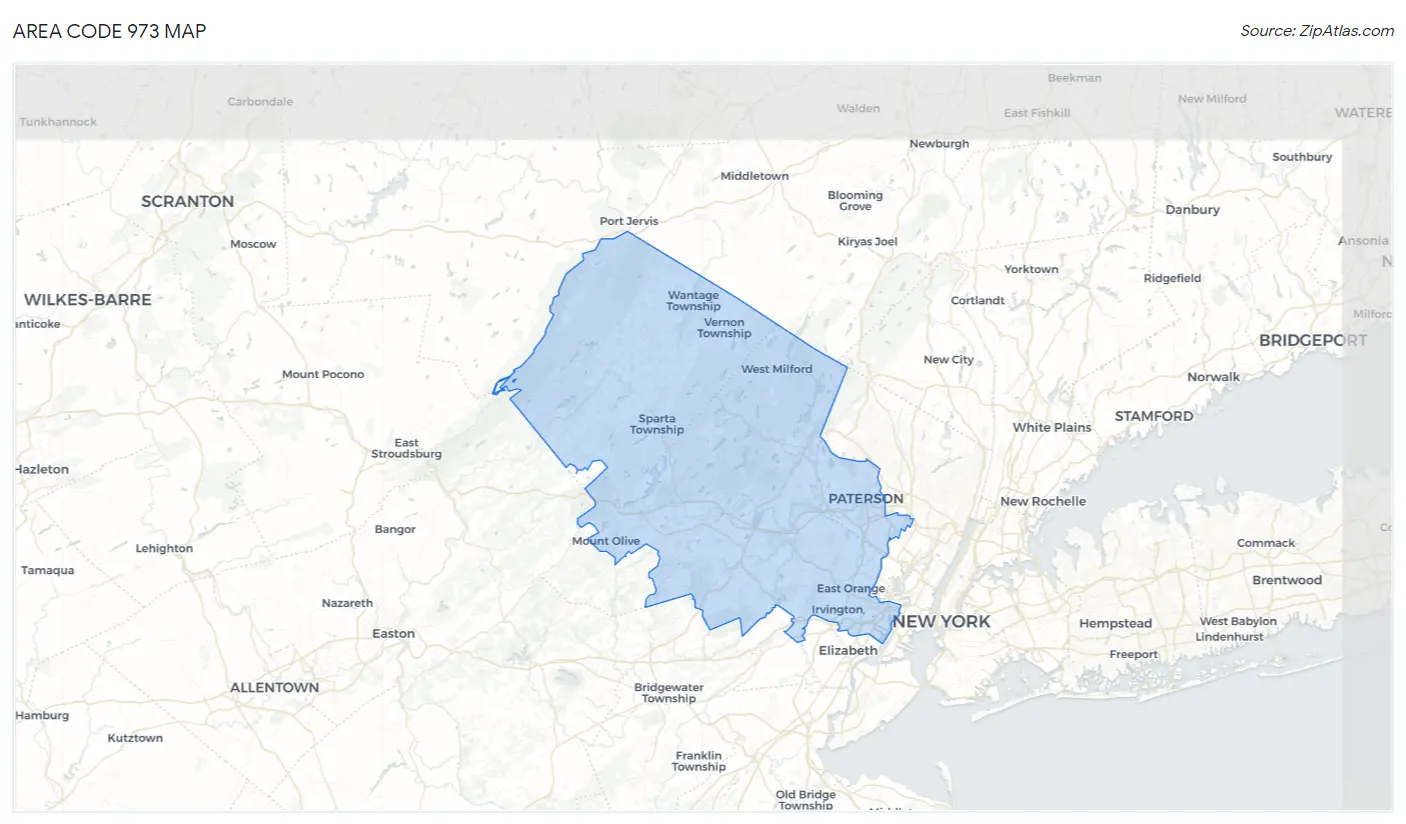
Area Code 973 Map
Area Code 973 Overview
$55,726
PER CAPITA INCOME
$134,473
AVG FAMILY INCOME
$113,614
AVG HOUSEHOLD INCOME
27.2%
WAGE / INCOME GAP [ % ]
72.8¢/ $1
WAGE / INCOME GAP [ $ ]
$11,056
FAMILY INCOME DEFICIT
31.19
INEQUALITY / GINI INDEX
1,456,284
TOTAL POPULATION
718,800
MALE POPULATION
737,484
FEMALE POPULATION
97.47
MALES / 100 FEMALES
102.60
FEMALES / 100 MALES
40.8
MEDIAN AGE
3.2
AVG FAMILY SIZE
2.6
AVG HOUSEHOLD SIZE
792,182
LABOR FORCE [ PEOPLE ]
67.7%
PERCENT IN LABOR FORCE
6.9%
UNEMPLOYMENT RATE
Income in Area Code 973
Income Overview in Area Code 973
Per Capita Income in Area Code 973 is $55,726, while median incomes of families and households are $134,473 and $113,614 respectively.
| Characteristic | Number | Measure |
| Per Capita Income | 1,456,284 | $55,726 |
| Median Family Income | 360,071 | $134,473 |
| Mean Family Income | 360,071 | $11,994,649 |
| Median Household Income | 543,145 | $113,614 |
| Mean Household Income | 543,145 | $10,441,311 |
| Income Deficit | 360,071 | $11,056 |
| Wage / Income Gap (%) | 1,456,284 | 27.19% |
| Wage / Income Gap ($) | 1,456,284 | 72.81¢ per $1 |
| Gini / Inequality Index | 1,456,284 | 31.19 |
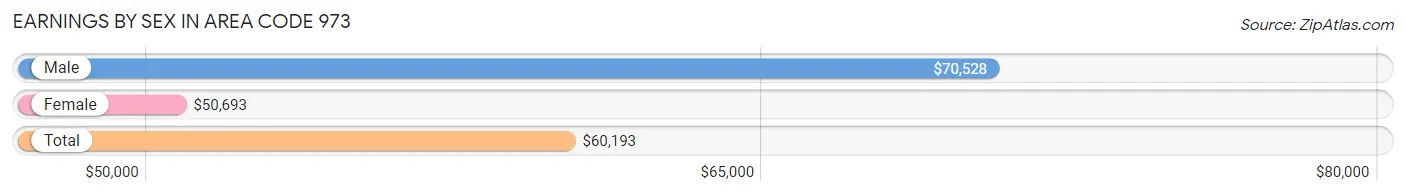
Earnings by Sex in Area Code 973
Average Earnings in Area Code 973 are $60,193, $70,528 for men and $50,693 for women, a difference of 28.1%.
| Sex | Number | Average Earnings |
| Male | 425,936 (52.6%) | $70,528 |
| Female | 383,036 (47.3%) | $50,693 |
| Total | 808,972 (100.0%) | $60,193 |
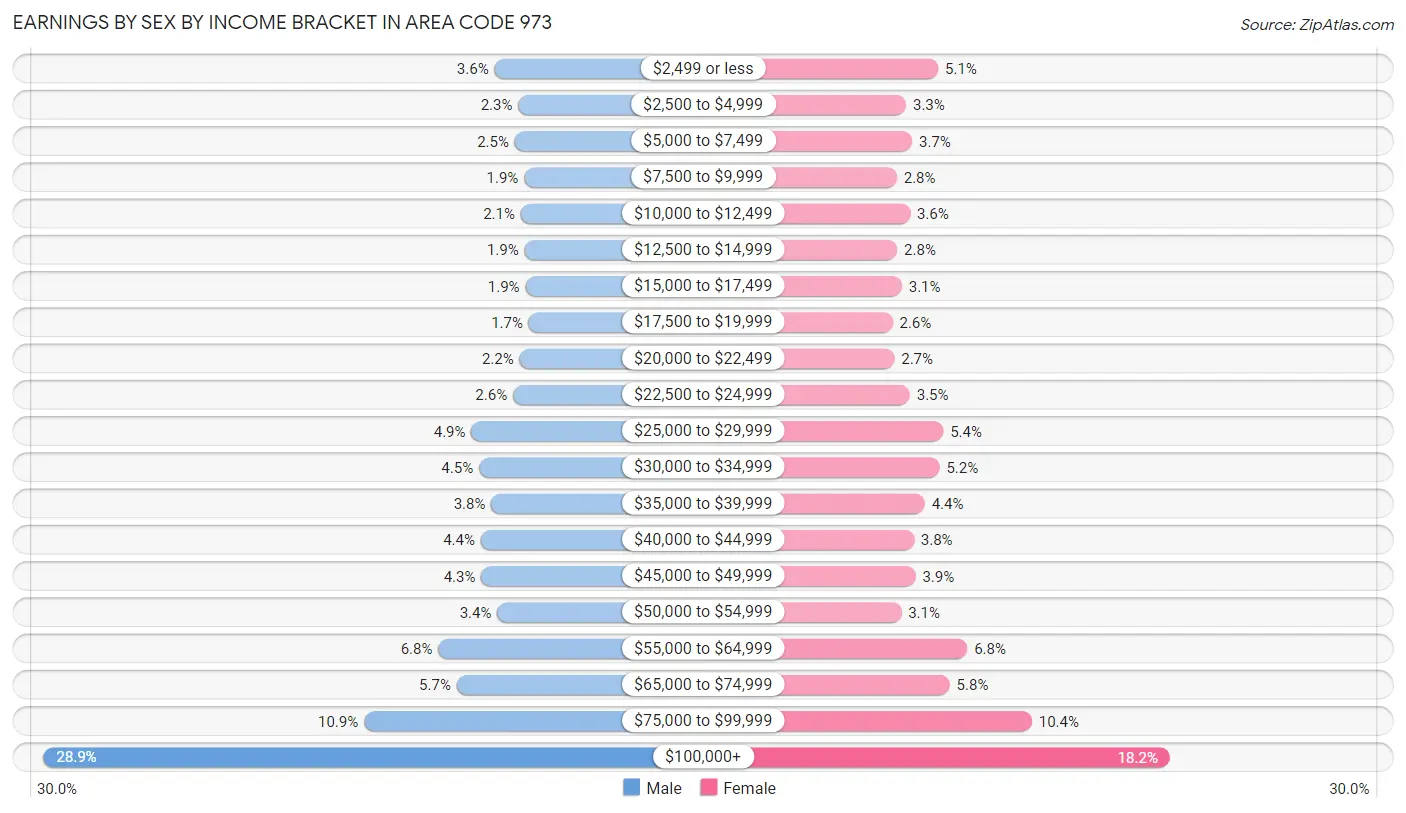
Earnings by Sex by Income Bracket in Area Code 973
The most common earnings brackets in Area Code 973 are $100,000+ for men (123,264 | 28.9%) and $100,000+ for women (69,505 | 18.1%).
| Income | Male | Female |
| $2,499 or less | 15,299 (3.6%) | 19,659 (5.1%) |
| $2,500 to $4,999 | 9,597 (2.2%) | 12,737 (3.3%) |
| $5,000 to $7,499 | 10,419 (2.5%) | 14,052 (3.7%) |
| $7,500 to $9,999 | 8,197 (1.9%) | 10,778 (2.8%) |
| $10,000 to $12,499 | 8,971 (2.1%) | 13,582 (3.5%) |
| $12,500 to $14,999 | 8,084 (1.9%) | 10,843 (2.8%) |
| $15,000 to $17,499 | 7,873 (1.8%) | 11,850 (3.1%) |
| $17,500 to $19,999 | 7,062 (1.7%) | 9,845 (2.6%) |
| $20,000 to $22,499 | 9,273 (2.2%) | 10,242 (2.7%) |
| $22,500 to $24,999 | 10,844 (2.5%) | 13,558 (3.5%) |
| $25,000 to $29,999 | 20,826 (4.9%) | 20,772 (5.4%) |
| $30,000 to $34,999 | 18,996 (4.5%) | 19,962 (5.2%) |
| $35,000 to $39,999 | 16,050 (3.8%) | 16,791 (4.4%) |
| $40,000 to $44,999 | 18,559 (4.4%) | 14,455 (3.8%) |
| $45,000 to $49,999 | 18,461 (4.3%) | 14,796 (3.9%) |
| $50,000 to $54,999 | 14,614 (3.4%) | 11,715 (3.1%) |
| $55,000 to $64,999 | 28,734 (6.8%) | 25,935 (6.8%) |
| $65,000 to $74,999 | 24,310 (5.7%) | 22,121 (5.8%) |
| $75,000 to $99,999 | 46,503 (10.9%) | 39,838 (10.4%) |
| $100,000+ | 123,264 (28.9%) | 69,505 (18.1%) |
| Total | 425,936 (100.0%) | 383,036 (100.0%) |
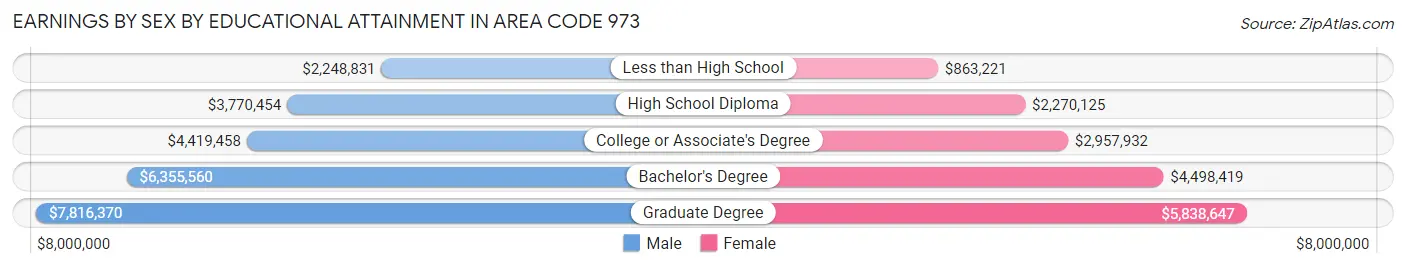
Earnings by Sex by Educational Attainment in Area Code 973
Average earnings in Area Code 973 are $5,692,415 for men and $4,167,192 for women, a difference of 26.8%. Men with an educational attainment of graduate degree enjoy the highest average annual earnings of $7,816,370, while those with less than high school education earn the least with $2,248,831. Women with an educational attainment of graduate degree earn the most with the average annual earnings of $5,838,647, while those with less than high school education have the smallest earnings of $863,221.
| Educational Attainment | Male Income | Female Income |
| Less than High School | $2,248,831 | $863,221 |
| High School Diploma | $3,770,454 | $2,270,125 |
| College or Associate's Degree | $4,419,458 | $2,957,932 |
| Bachelor's Degree | $6,355,560 | $4,498,419 |
| Graduate Degree | $7,816,370 | $5,838,647 |
| Total | $5,692,415 | $4,167,192 |
Family Income in Area Code 973
Family Income Brackets in Area Code 973
According to the Area Code 973 family income data, there are 6,954,771 families falling into the $200,000+ income range, which is the most common income bracket and makes up 1,931.5% of all families. Conversely, the $10,000 to $14,999 income bracket is the least frequent group with only 436,046 families (121.1%) belonging to this category.
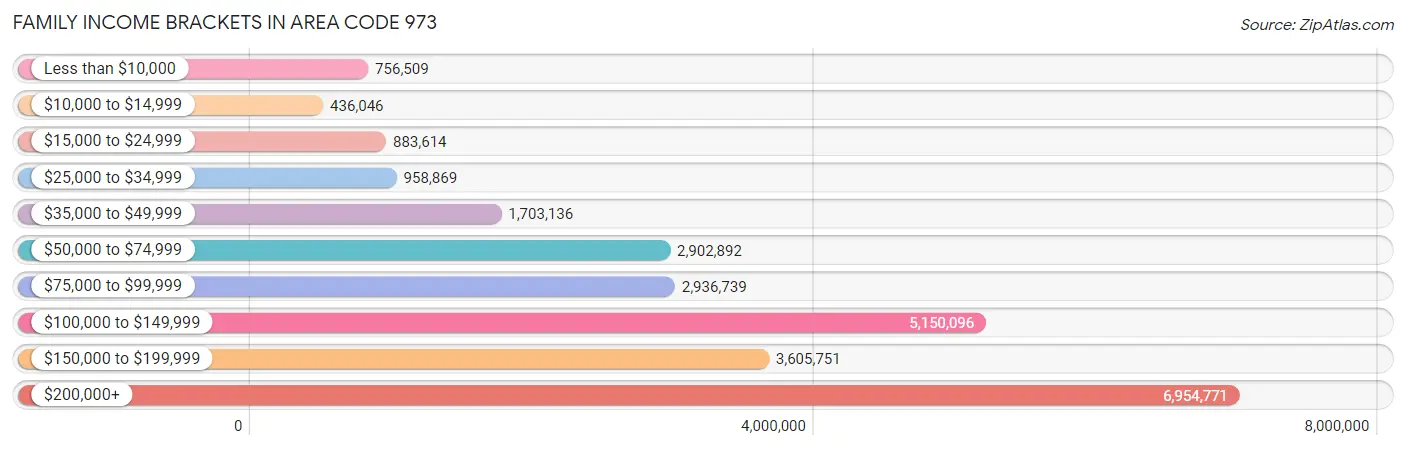
| Income Bracket | # Families | % Families |
| Less than $10,000 | 756,509 | 210.1% |
| $10,000 to $14,999 | 436,046 | 121.1% |
| $15,000 to $24,999 | 883,614 | 245.4% |
| $25,000 to $34,999 | 958,869 | 266.3% |
| $35,000 to $49,999 | 1,703,136 | 473.0% |
| $50,000 to $74,999 | 2,902,892 | 806.2% |
| $75,000 to $99,999 | 2,936,739 | 815.6% |
| $100,000 to $149,999 | 5,150,096 | 1,430.3% |
| $150,000 to $199,999 | 3,605,751 | 1,001.4% |
| $200,000+ | 6,954,771 | 1,931.5% |
Family Income by Famaliy Size in Area Code 973
7+ person families (6,690 | 1.9%) account for the highest median family income in Area Code 973 with $177,106 per family, while 2-person families (144,938 | 40.3%) have the highest median income of $56,630 per family member.
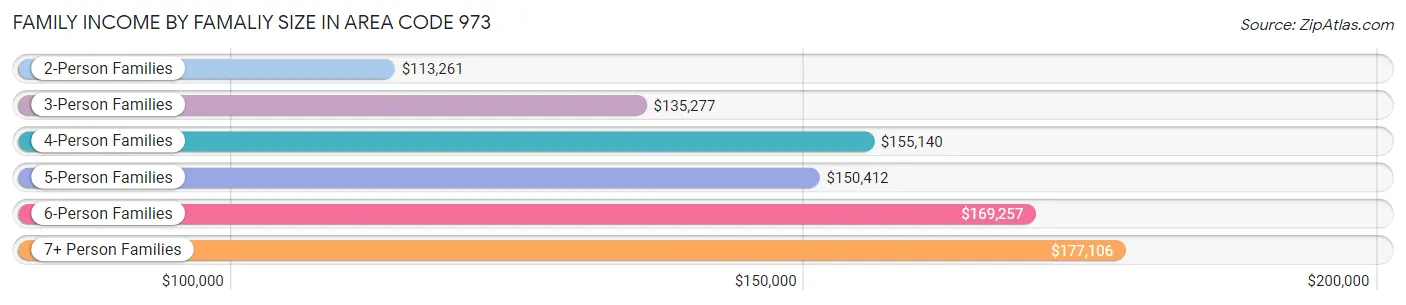
| Income Bracket | # Families | Median Income |
| 2-Person Families | 144,938 (40.3%) | $113,261 |
| 3-Person Families | 88,958 (24.7%) | $135,277 |
| 4-Person Families | 77,214 (21.4%) | $155,140 |
| 5-Person Families | 31,526 (8.8%) | $150,412 |
| 6-Person Families | 10,745 (3.0%) | $169,257 |
| 7+ Person Families | 6,690 (1.9%) | $177,106 |
| Total | 360,071 (100.0%) | $134,473 |
Family Income by Number of Earners in Area Code 973
The median family income in Area Code 973 is $134,473, with families comprising 3+ earners (53,468) having the highest median family income of $185,438, while families with no earners (39,113) have the lowest median family income of $67,911, accounting for 14.8% and 10.9% of families, respectively.
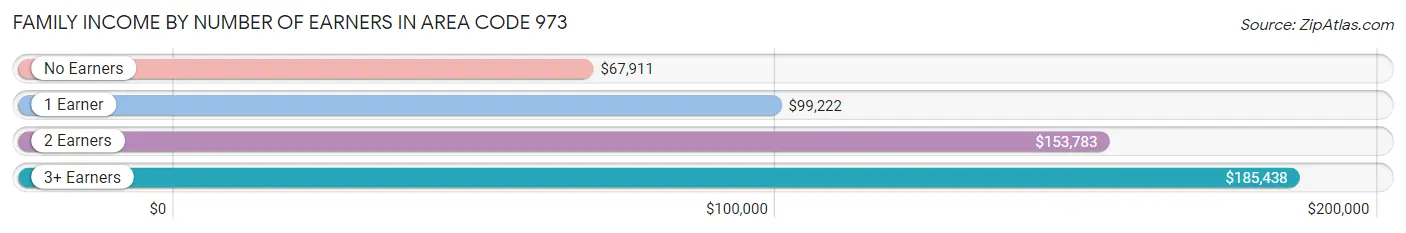
| Number of Earners | # Families | Median Income |
| No Earners | 39,113 (10.9%) | $67,911 |
| 1 Earner | 108,548 (30.1%) | $99,222 |
| 2 Earners | 158,942 (44.1%) | $153,783 |
| 3+ Earners | 53,468 (14.8%) | $185,438 |
| Total | 360,071 (100.0%) | $134,473 |
Household Income in Area Code 973
Household Income Brackets in Area Code 973
With 8,575,173 households falling in the category, the $200,000+ income range is the most frequent in Area Code 973, accounting for 1,578.8% of all households. In contrast, only 1,216,102 households (223.9%) fall into the $10,000 to $14,999 income bracket, making it the least populous group.
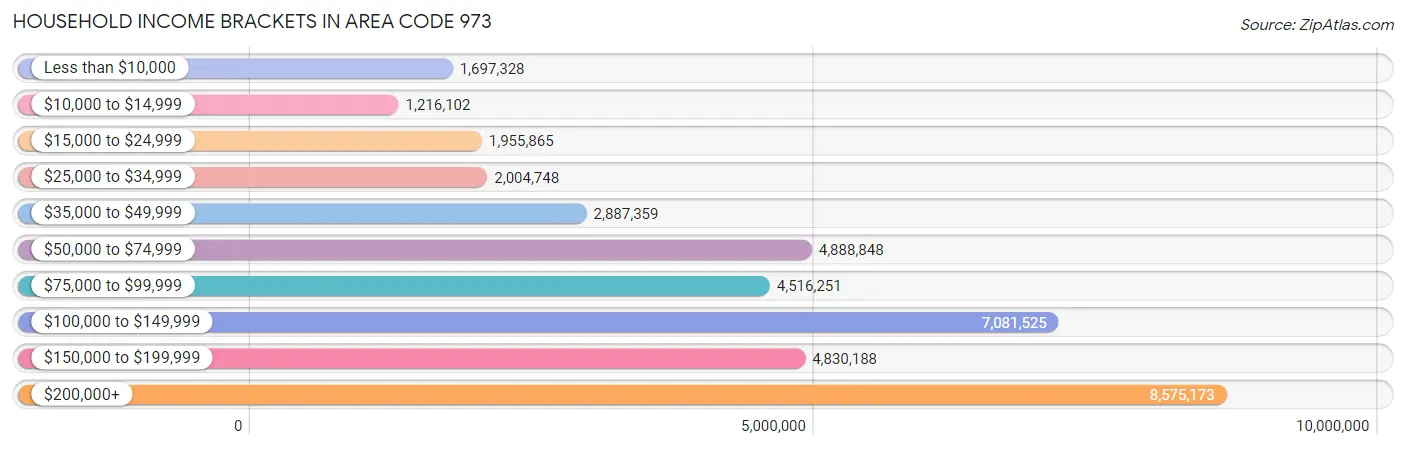
| Income Bracket | # Households | % Households |
| Less than $10,000 | 1,697,328 | 312.5% |
| $10,000 to $14,999 | 1,216,102 | 223.9% |
| $15,000 to $24,999 | 1,955,865 | 360.1% |
| $25,000 to $34,999 | 2,004,748 | 369.1% |
| $35,000 to $49,999 | 2,887,359 | 531.6% |
| $50,000 to $74,999 | 4,888,848 | 900.1% |
| $75,000 to $99,999 | 4,516,251 | 831.5% |
| $100,000 to $149,999 | 7,081,525 | 1,303.8% |
| $150,000 to $199,999 | 4,830,188 | 889.3% |
| $200,000+ | 8,575,173 | 1,578.8% |
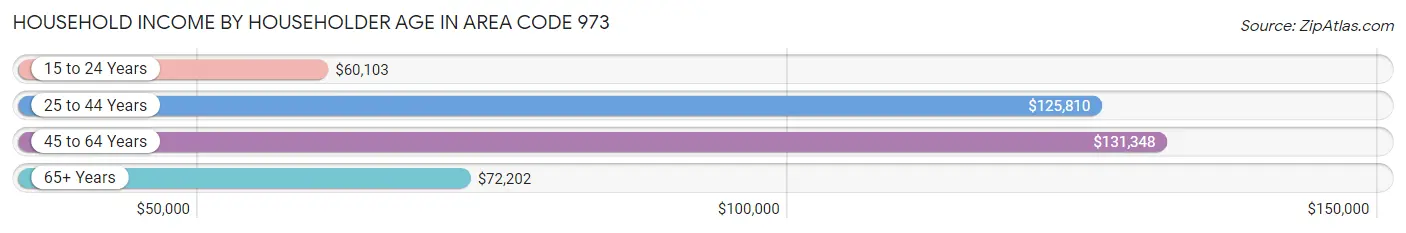
Household Income by Householder Age in Area Code 973
The median household income in Area Code 973 is $113,614, with the highest median household income of $131,348 found in the 45 to 64 years age bracket for the primary householder. A total of 217,891 households (40.1%) fall into this category. Meanwhile, the 15 to 24 years age bracket for the primary householder has the lowest median household income of $60,103, with 10,045 households (1.8%) in this group.
| Income Bracket | # Households | Median Income |
| 15 to 24 Years | 10,045 (1.8%) | $60,103 |
| 25 to 44 Years | 187,648 (34.5%) | $125,810 |
| 45 to 64 Years | 217,891 (40.1%) | $131,348 |
| 65+ Years | 127,561 (23.5%) | $72,202 |
| Total | 543,145 (100.0%) | $113,614 |
Poverty in Area Code 973
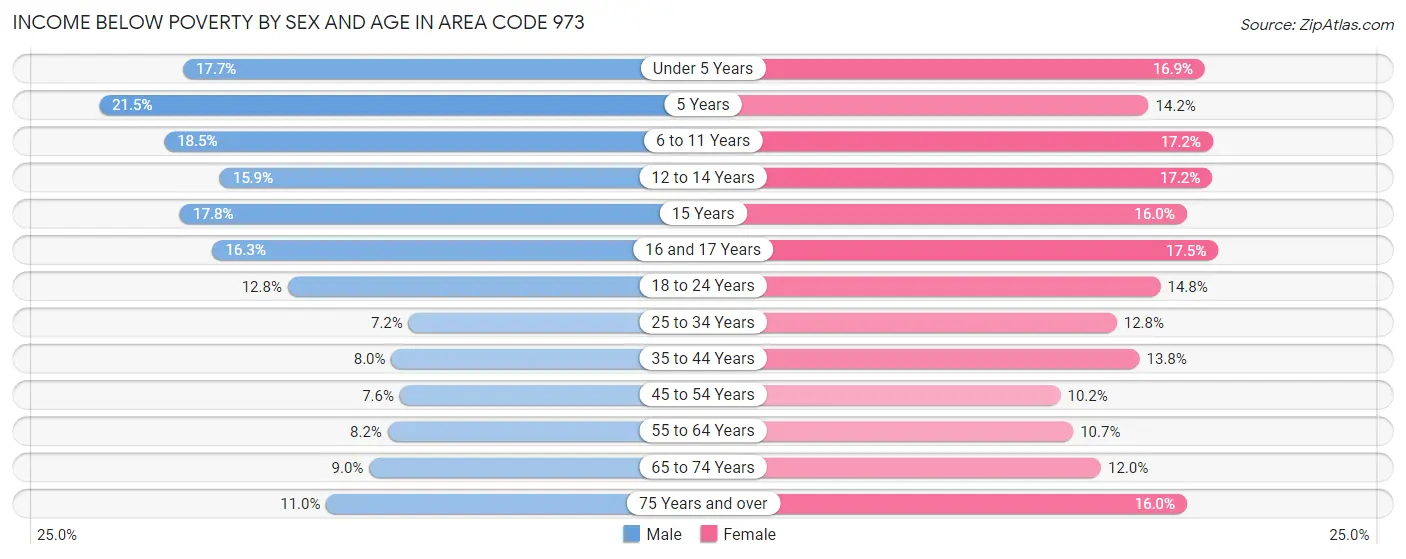
Income Below Poverty by Sex and Age in Area Code 973
With 10.7% poverty level for males and 13.5% for females among the residents of Area Code 973, 5 year old males and 16 and 17 year old females are the most vulnerable to poverty, with 2,184 males (21.5%) and 3,066 females (17.5%) in their respective age groups living below the poverty level.
| Age Bracket | Male | Female |
| Under 5 Years | 7,986 (17.6%) | 7,263 (16.9%) |
| 5 Years | 2,184 (21.5%) | 1,214 (14.2%) |
| 6 to 11 Years | 9,543 (18.5%) | 8,835 (17.2%) |
| 12 to 14 Years | 4,412 (15.9%) | 4,633 (17.2%) |
| 15 Years | 1,813 (17.8%) | 1,371 (16.0%) |
| 16 and 17 Years | 3,066 (16.3%) | 3,066 (17.5%) |
| 18 to 24 Years | 7,915 (12.8%) | 8,634 (14.8%) |
| 25 to 34 Years | 7,457 (7.2%) | 13,082 (12.8%) |
| 35 to 44 Years | 8,013 (8.0%) | 13,681 (13.8%) |
| 45 to 54 Years | 7,209 (7.6%) | 9,988 (10.2%) |
| 55 to 64 Years | 7,455 (8.2%) | 10,427 (10.7%) |
| 65 to 74 Years | 5,177 (9.0%) | 7,891 (12.0%) |
| 75 Years and over | 3,603 (11.0%) | 8,063 (16.0%) |
| Total | 75,833 (10.7%) | 98,148 (13.5%) |
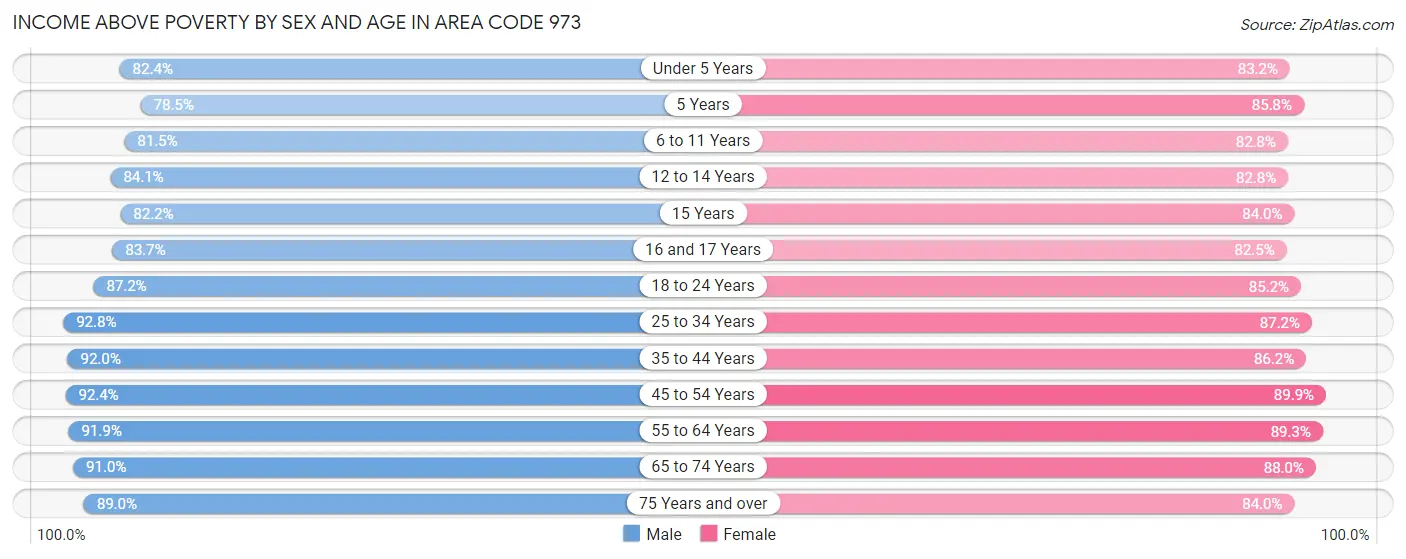
Income Above Poverty by Sex and Age in Area Code 973
According to the poverty statistics in Area Code 973, males aged 25 to 34 years and females aged 45 to 54 years are the age groups that are most secure financially, with 92.8% of males and 89.8% of females in these age groups living above the poverty line.
| Age Bracket | Male | Female |
| Under 5 Years | 37,266 (82.4%) | 35,841 (83.2%) |
| 5 Years | 7,953 (78.5%) | 7,314 (85.8%) |
| 6 to 11 Years | 41,992 (81.5%) | 42,501 (82.8%) |
| 12 to 14 Years | 23,266 (84.1%) | 22,328 (82.8%) |
| 15 Years | 8,382 (82.2%) | 7,198 (84.0%) |
| 16 and 17 Years | 15,767 (83.7%) | 14,493 (82.5%) |
| 18 to 24 Years | 53,970 (87.2%) | 49,751 (85.2%) |
| 25 to 34 Years | 96,361 (92.8%) | 89,467 (87.2%) |
| 35 to 44 Years | 92,414 (92.0%) | 85,344 (86.2%) |
| 45 to 54 Years | 87,785 (92.4%) | 88,429 (89.8%) |
| 55 to 64 Years | 84,041 (91.8%) | 86,672 (89.3%) |
| 65 to 74 Years | 52,300 (91.0%) | 57,696 (88.0%) |
| 75 Years and over | 29,139 (89.0%) | 42,286 (84.0%) |
| Total | 630,636 (89.3%) | 629,320 (86.5%) |
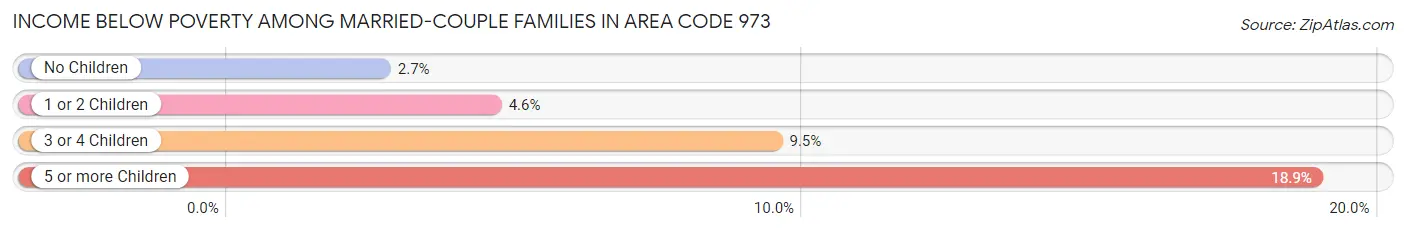
Income Below Poverty Among Married-Couple Families in Area Code 973
The poverty statistics for married-couple families in Area Code 973 show that 4.0% or 9,876 of the total 250,258 families live below the poverty line. Families with 5 or more children have the highest poverty rate of 18.9%, comprising of 237 families. On the other hand, families with no children have the lowest poverty rate of 2.7%, which includes 3,629 families.
| Children | Above Poverty | Below Poverty |
| No Children | 132,656 (97.3%) | 3,629 (2.7%) |
| 1 or 2 Children | 91,270 (95.4%) | 4,394 (4.6%) |
| 3 or 4 Children | 15,439 (90.5%) | 1,616 (9.5%) |
| 5 or more Children | 1,017 (81.1%) | 237 (18.9%) |
| Total | 240,382 (96.1%) | 9,876 (4.0%) |
Income Below Poverty Among Single-Parent Households in Area Code 973
According to the poverty data in Area Code 973, 11.5% or 3,394 single-father households and 25.3% or 20,329 single-mother households are living below the poverty line. Among single-father households, those with 3 or 4 children have the highest poverty rate, with 573 households (27.9%) experiencing poverty. Likewise, among single-mother households, those with 5 or more children have the highest poverty rate, with 486 households (80.2%) falling below the poverty line.
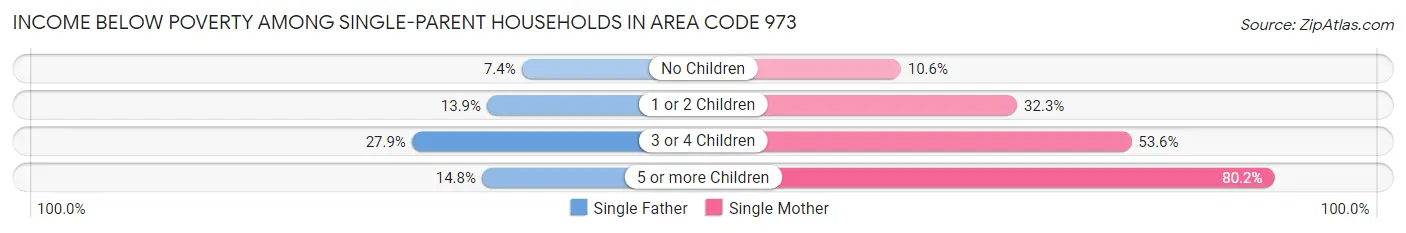
| Children | Single Father | Single Mother |
| No Children | 1,135 (7.4%) | 3,672 (10.6%) |
| 1 or 2 Children | 1,667 (13.9%) | 12,277 (32.3%) |
| 3 or 4 Children | 573 (27.9%) | 3,894 (53.6%) |
| 5 or more Children | 19 (14.8%) | 486 (80.2%) |
| Total | 3,394 (11.5%) | 20,329 (25.3%) |
Income Below Poverty Among Married-Couple vs Single-Parent Households in Area Code 973
The poverty data for Area Code 973 shows that 9,876 of the married-couple family households (4.0%) and 23,723 of the single-parent households (21.6%) are living below the poverty level. Within the married-couple family households, those with 5 or more children have the highest poverty rate, with 237 households (18.9%) falling below the poverty line. Among the single-parent households, those with 5 or more children have the highest poverty rate, with 505 household (68.8%) living below poverty.
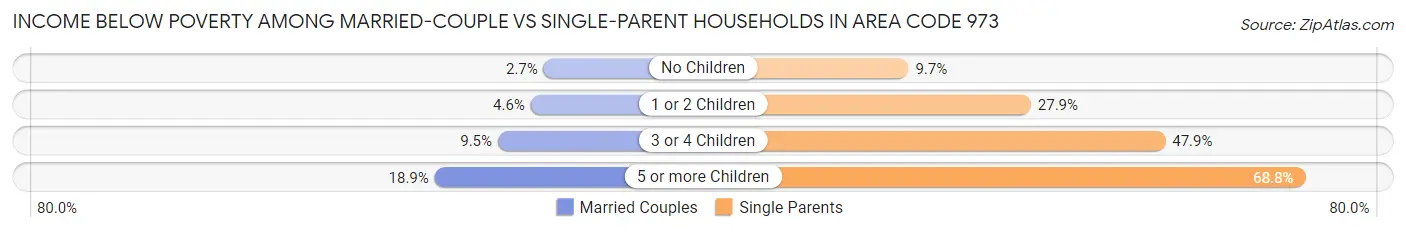
| Children | Married-Couple Families | Single-Parent Households |
| No Children | 3,629 (2.7%) | 4,807 (9.7%) |
| 1 or 2 Children | 4,394 (4.6%) | 13,944 (27.9%) |
| 3 or 4 Children | 1,616 (9.5%) | 4,467 (47.9%) |
| 5 or more Children | 237 (18.9%) | 505 (68.8%) |
| Total | 9,876 (4.0%) | 23,723 (21.6%) |
Race in Area Code 973
The most populous races in Area Code 973 are White / Caucasian (758,880 | 52.1%), Hispanic or Latino (458,433 | 31.5%), and Black / African American (228,034 | 15.7%).
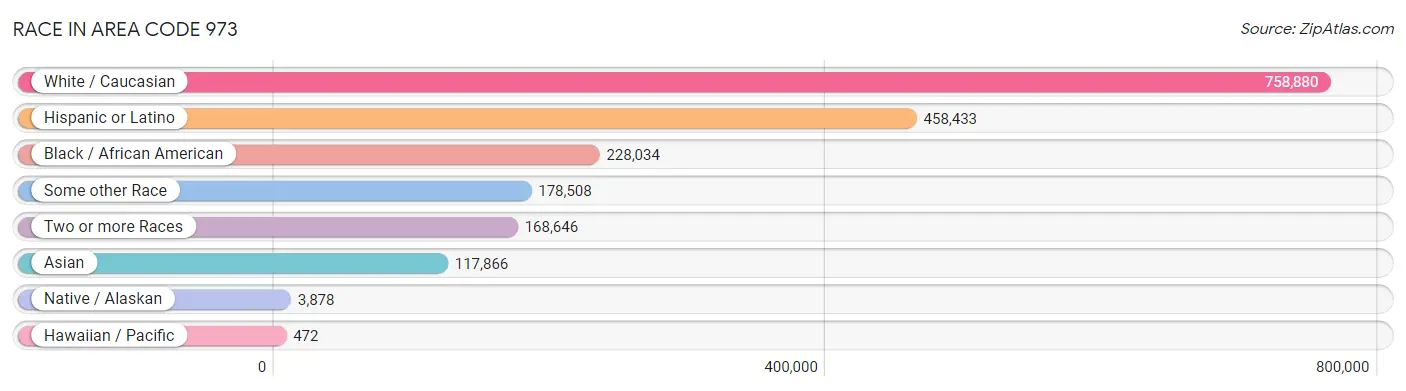
| Race | # Population | % Population |
| Asian | 117,866 | 8.1% |
| Black / African American | 228,034 | 15.7% |
| Hawaiian / Pacific | 472 | 0.0% |
| Hispanic or Latino | 458,433 | 31.5% |
| Native / Alaskan | 3,878 | 0.3% |
| White / Caucasian | 758,880 | 52.1% |
| Two or more Races | 168,646 | 11.6% |
| Some other Race | 178,508 | 12.3% |
| Total | 1,456,284 | 100.0% |
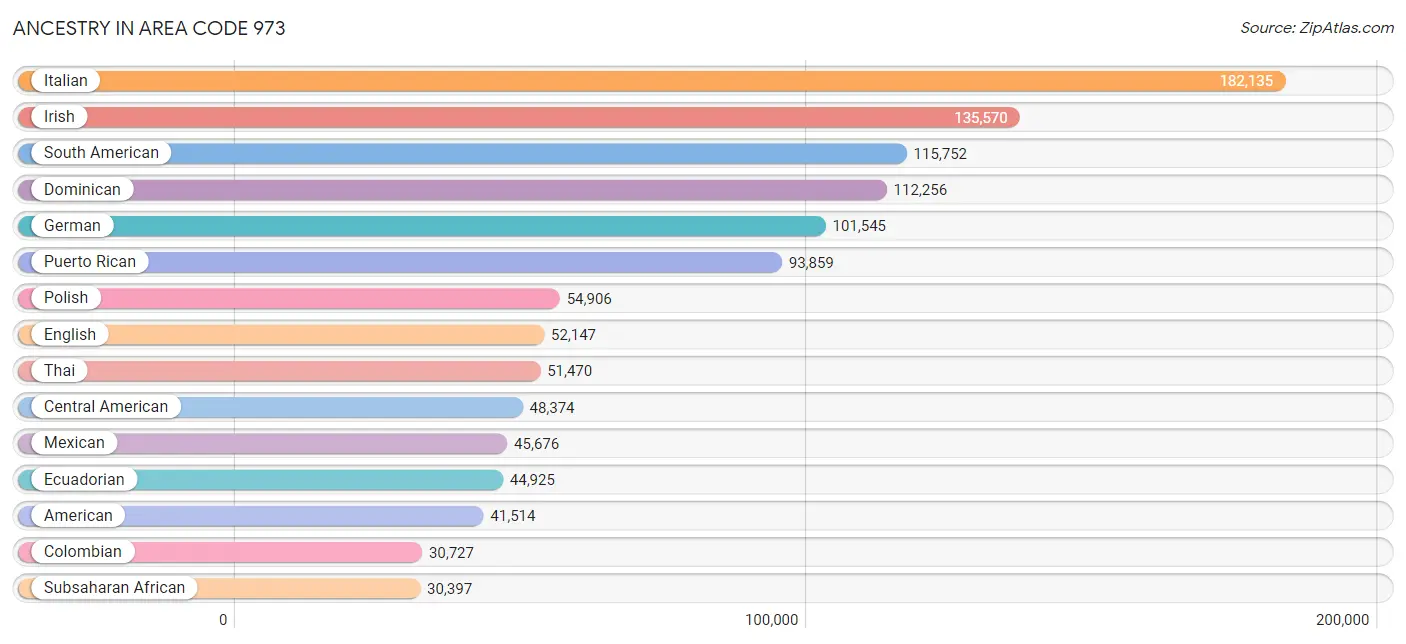
Ancestry in Area Code 973
The most populous ancestries reported in Area Code 973 are Italian (182,135 | 12.5%), Irish (135,570 | 9.3%), South American (115,752 | 8.0%), Dominican (112,256 | 7.7%), and German (101,545 | 7.0%), together accounting for 44.5% of all Area Code 973 residents.
| Ancestry | # Population | % Population |
| Afghan | 326 | 0.0% |
| African | 13,536 | 0.9% |
| Albanian | 2,995 | 0.2% |
| Aleut | 26 | 0.0% |
| Alsatian | 84 | 0.0% |
| American | 41,514 | 2.9% |
| Apache | 28 | 0.0% |
| Arab | 16,811 | 1.1% |
| Arapaho | 20 | 0.0% |
| Argentinean | 3,399 | 0.2% |
| Armenian | 1,857 | 0.1% |
| Assyrian / Chaldean / Syriac | 46 | 0.0% |
| Australian | 280 | 0.0% |
| Austrian | 4,909 | 0.3% |
| Bahamian | 216 | 0.0% |
| Bangladeshi | 18 | 0.0% |
| Barbadian | 837 | 0.1% |
| Basque | 142 | 0.0% |
| Belgian | 998 | 0.1% |
| Belizean | 99 | 0.0% |
| Bermudan | 166 | 0.0% |
| Bhutanese | 3,783 | 0.3% |
| Blackfeet | 367 | 0.0% |
| Bolivian | 1,051 | 0.1% |
| Brazilian | 6,912 | 0.5% |
| British | 4,475 | 0.3% |
| British West Indian | 1,074 | 0.1% |
| Bulgarian | 695 | 0.1% |
| Burmese | 9,226 | 0.6% |
| Cajun | 13 | 0.0% |
| Cambodian | 45 | 0.0% |
| Canadian | 2,253 | 0.2% |
| Cape Verdean | 206 | 0.0% |
| Carpatho Rusyn | 96 | 0.0% |
| Celtic | 139 | 0.0% |
| Central American | 48,374 | 3.3% |
| Central American Indian | 2,711 | 0.2% |
| Cherokee | 838 | 0.1% |
| Cheyenne | 7 | 0.0% |
| Chilean | 2,721 | 0.2% |
| Chippewa | 41 | 0.0% |
| Choctaw | 121 | 0.0% |
| Colombian | 30,727 | 2.1% |
| Costa Rican | 4,417 | 0.3% |
| Creek | 138 | 0.0% |
| Croatian | 1,920 | 0.1% |
| Crow | 24 | 0.0% |
| Cuban | 20,050 | 1.4% |
| Cypriot | 210 | 0.0% |
| Czech | 2,618 | 0.2% |
| Czechoslovakian | 1,007 | 0.1% |
| Danish | 2,077 | 0.1% |
| Delaware | 445 | 0.0% |
| Dominican | 112,256 | 7.7% |
| Dutch | 14,522 | 1.0% |
| Dutch West Indian | 66 | 0.0% |
| Eastern European | 8,003 | 0.5% |
| Ecuadorian | 44,925 | 3.1% |
| Egyptian | 4,187 | 0.3% |
| English | 52,147 | 3.6% |
| Estonian | 420 | 0.0% |
| Ethiopian | 1,354 | 0.1% |
| European | 10,757 | 0.7% |
| Fijian | 68 | 0.0% |
| Filipino | 1,704 | 0.1% |
| Finnish | 736 | 0.1% |
| French | 11,663 | 0.8% |
| French American Indian | 78 | 0.0% |
| French Canadian | 2,432 | 0.2% |
| German | 101,545 | 7.0% |
| German Russian | 322 | 0.0% |
| Ghanaian | 3,054 | 0.2% |
| Greek | 7,936 | 0.5% |
| Guamanian / Chamorro | 44 | 0.0% |
| Guatemalan | 10,540 | 0.7% |
| Guyanese | 4,620 | 0.3% |
| Haitian | 13,460 | 0.9% |
| Hmong | 29 | 0.0% |
| Honduran | 13,505 | 0.9% |
| Houma | 25 | 0.0% |
| Hungarian | 8,982 | 0.6% |
| Icelander | 54 | 0.0% |
| Indian (Asian) | 28,292 | 1.9% |
| Indonesian | 604 | 0.0% |
| Inupiat | 30 | 0.0% |
| Iranian | 1,324 | 0.1% |
| Iraqi | 142 | 0.0% |
| Irish | 135,570 | 9.3% |
| Iroquois | 339 | 0.0% |
| Israeli | 2,039 | 0.1% |
| Italian | 182,135 | 12.5% |
| Jamaican | 15,572 | 1.1% |
| Japanese | 70 | 0.0% |
| Jordanian | 1,480 | 0.1% |
| Kenyan | 637 | 0.0% |
| Korean | 20,652 | 1.4% |
| Laotian | 552 | 0.0% |
| Latvian | 689 | 0.1% |
| Lebanese | 2,819 | 0.2% |
| Liberian | 918 | 0.1% |
| Lithuanian | 3,691 | 0.3% |
| Luxembourger | 52 | 0.0% |
| Macedonian | 1,289 | 0.1% |
| Malaysian | 105 | 0.0% |
| Maltese | 239 | 0.0% |
| Mexican | 45,676 | 3.1% |
| Mexican American Indian | 859 | 0.1% |
| Mongolian | 113 | 0.0% |
| Moroccan | 845 | 0.1% |
| Native Hawaiian | 630 | 0.0% |
| Navajo | 230 | 0.0% |
| New Zealander | 27 | 0.0% |
| Nicaraguan | 1,983 | 0.1% |
| Nigerian | 6,812 | 0.5% |
| Northern European | 760 | 0.1% |
| Norwegian | 5,007 | 0.3% |
| Okinawan | 77 | 0.0% |
| Pakistani | 789 | 0.1% |
| Palestinian | 1,631 | 0.1% |
| Panamanian | 1,058 | 0.1% |
| Paraguayan | 381 | 0.0% |
| Pennsylvania German | 282 | 0.0% |
| Peruvian | 25,515 | 1.8% |
| Polish | 54,906 | 3.8% |
| Portuguese | 9,615 | 0.7% |
| Pueblo | 72 | 0.0% |
| Puerto Rican | 93,859 | 6.5% |
| Puget Sound Salish | 66 | 0.0% |
| Romanian | 2,623 | 0.2% |
| Russian | 18,846 | 1.3% |
| Salvadoran | 16,737 | 1.1% |
| Samoan | 121 | 0.0% |
| Scandinavian | 917 | 0.1% |
| Scotch-Irish | 3,912 | 0.3% |
| Scottish | 10,224 | 0.7% |
| Seminole | 19 | 0.0% |
| Senegalese | 489 | 0.0% |
| Serbian | 762 | 0.1% |
| Sierra Leonean | 343 | 0.0% |
| Sioux | 253 | 0.0% |
| Slavic | 916 | 0.1% |
| Slovak | 2,972 | 0.2% |
| Slovene | 125 | 0.0% |
| Somali | 19 | 0.0% |
| South African | 498 | 0.0% |
| South American | 115,752 | 8.0% |
| South American Indian | 568 | 0.0% |
| Soviet Union | 45 | 0.0% |
| Spaniard | 4,918 | 0.3% |
| Spanish | 2,828 | 0.2% |
| Spanish American Indian | 10 | 0.0% |
| Sri Lankan | 2,311 | 0.2% |
| Subsaharan African | 30,397 | 2.1% |
| Sudanese | 411 | 0.0% |
| Swedish | 6,796 | 0.5% |
| Swiss | 2,057 | 0.1% |
| Syrian | 3,823 | 0.3% |
| Thai | 51,470 | 3.5% |
| Tlingit-Haida | 14 | 0.0% |
| Tohono O'Odham | 9 | 0.0% |
| Tongan | 3 | 0.0% |
| Trinidadian and Tobagonian | 3,049 | 0.2% |
| Turkish | 4,839 | 0.3% |
| U.S. Virgin Islander | 9 | 0.0% |
| Ugandan | 61 | 0.0% |
| Ukrainian | 7,267 | 0.5% |
| Uruguayan | 2,766 | 0.2% |
| Venezuelan | 3,658 | 0.3% |
| Vietnamese | 4,998 | 0.3% |
| Welsh | 3,003 | 0.2% |
| West Indian | 2,031 | 0.1% |
| Yaqui | 10 | 0.0% |
| Yugoslavian | 660 | 0.1% |
| Zimbabwean | 25 | 0.0% | View All 174 Rows |
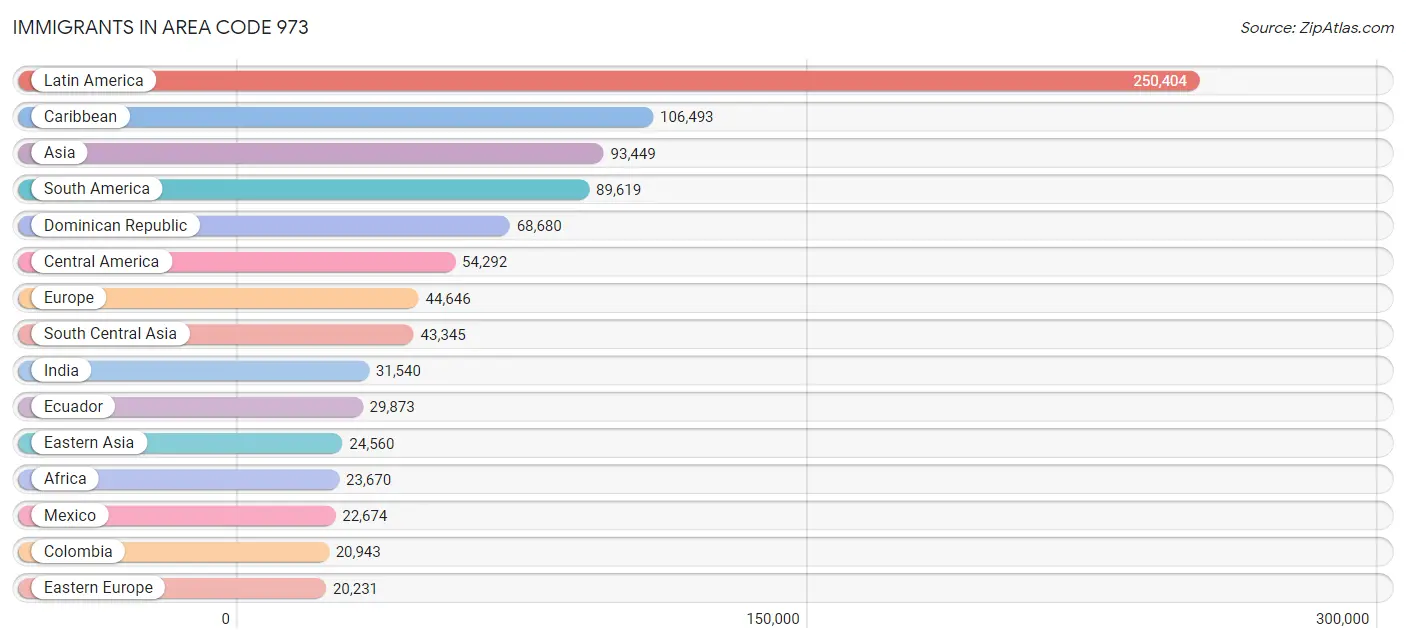
Immigrants in Area Code 973
The most numerous immigrant groups reported in Area Code 973 came from Latin America (250,404 | 17.2%), Caribbean (106,493 | 7.3%), Asia (93,449 | 6.4%), South America (89,619 | 6.1%), and Dominican Republic (68,680 | 4.7%), together accounting for 41.8% of all Area Code 973 residents.
| Immigration Origin | # Population | % Population |
| Afghanistan | 332 | 0.0% |
| Africa | 23,670 | 1.6% |
| Albania | 1,344 | 0.1% |
| Argentina | 1,795 | 0.1% |
| Armenia | 131 | 0.0% |
| Asia | 93,449 | 6.4% |
| Australia | 428 | 0.0% |
| Austria | 289 | 0.0% |
| Azores | 47 | 0.0% |
| Bahamas | 258 | 0.0% |
| Bangladesh | 5,804 | 0.4% |
| Barbados | 437 | 0.0% |
| Belarus | 548 | 0.0% |
| Belgium | 159 | 0.0% |
| Belize | 130 | 0.0% |
| Bolivia | 725 | 0.1% |
| Bosnia and Herzegovina | 234 | 0.0% |
| Brazil | 6,584 | 0.4% |
| Bulgaria | 590 | 0.0% |
| Cabo Verde | 23 | 0.0% |
| Cambodia | 65 | 0.0% |
| Cameroon | 314 | 0.0% |
| Canada | 3,233 | 0.2% |
| Caribbean | 106,493 | 7.3% |
| Central America | 54,292 | 3.7% |
| Chile | 1,918 | 0.1% |
| China | 17,834 | 1.2% |
| Colombia | 20,943 | 1.4% |
| Congo | 216 | 0.0% |
| Costa Rica | 2,696 | 0.2% |
| Croatia | 207 | 0.0% |
| Cuba | 10,684 | 0.7% |
| Czechoslovakia | 374 | 0.0% |
| Denmark | 193 | 0.0% |
| Dominica | 490 | 0.0% |
| Dominican Republic | 68,680 | 4.7% |
| Eastern Africa | 2,331 | 0.2% |
| Eastern Asia | 24,560 | 1.7% |
| Eastern Europe | 20,231 | 1.4% |
| Ecuador | 29,873 | 2.1% |
| Egypt | 3,187 | 0.2% |
| El Salvador | 10,243 | 0.7% |
| England | 2,133 | 0.2% |
| Eritrea | 139 | 0.0% |
| Ethiopia | 747 | 0.1% |
| Europe | 44,646 | 3.1% |
| Fiji | 38 | 0.0% |
| France | 1,086 | 0.1% |
| Germany | 2,066 | 0.1% |
| Ghana | 5,054 | 0.4% |
| Greece | 954 | 0.1% |
| Grenada | 344 | 0.0% |
| Guatemala | 7,214 | 0.5% |
| Guyana | 5,762 | 0.4% |
| Haiti | 9,832 | 0.7% |
| Honduras | 9,626 | 0.7% |
| Hong Kong | 1,507 | 0.1% |
| Hungary | 598 | 0.0% |
| India | 31,540 | 2.2% |
| Indonesia | 354 | 0.0% |
| Iran | 896 | 0.1% |
| Iraq | 157 | 0.0% |
| Ireland | 1,634 | 0.1% |
| Israel | 1,413 | 0.1% |
| Italy | 6,639 | 0.5% |
| Jamaica | 11,681 | 0.8% |
| Japan | 1,576 | 0.1% |
| Jordan | 1,369 | 0.1% |
| Kazakhstan | 124 | 0.0% |
| Kenya | 1,009 | 0.1% |
| Korea | 5,144 | 0.4% |
| Kuwait | 378 | 0.0% |
| Laos | 55 | 0.0% |
| Latin America | 250,404 | 17.2% |
| Latvia | 110 | 0.0% |
| Lebanon | 1,022 | 0.1% |
| Liberia | 1,064 | 0.1% |
| Lithuania | 146 | 0.0% |
| Malaysia | 290 | 0.0% |
| Mexico | 22,674 | 1.6% |
| Middle Africa | 729 | 0.1% |
| Moldova | 249 | 0.0% |
| Morocco | 363 | 0.0% |
| Nepal | 398 | 0.0% |
| Netherlands | 637 | 0.0% |
| Nicaragua | 1,077 | 0.1% |
| Nigeria | 6,341 | 0.4% |
| North Macedonia | 1,011 | 0.1% |
| Northern Africa | 4,089 | 0.3% |
| Northern Europe | 7,455 | 0.5% |
| Norway | 32 | 0.0% |
| Oceania | 543 | 0.0% |
| Pakistan | 3,432 | 0.2% |
| Panama | 632 | 0.0% |
| Peru | 17,171 | 1.2% |
| Philippines | 11,615 | 0.8% |
| Poland | 5,638 | 0.4% |
| Portugal | 3,058 | 0.2% |
| Romania | 1,170 | 0.1% |
| Russia | 3,635 | 0.3% |
| Saudi Arabia | 274 | 0.0% |
| Scotland | 298 | 0.0% |
| Senegal | 477 | 0.0% |
| Serbia | 342 | 0.0% |
| Sierra Leone | 184 | 0.0% |
| Singapore | 185 | 0.0% |
| South Africa | 527 | 0.0% |
| South America | 89,619 | 6.1% |
| South Central Asia | 43,345 | 3.0% |
| South Eastern Asia | 14,609 | 1.0% |
| Southern Europe | 12,306 | 0.9% |
| Spain | 1,472 | 0.1% |
| Sri Lanka | 227 | 0.0% |
| St. Vincent and the Grenadines | 266 | 0.0% |
| Sudan | 296 | 0.0% |
| Sweden | 187 | 0.0% |
| Switzerland | 345 | 0.0% |
| Syria | 1,452 | 0.1% |
| Taiwan | 2,503 | 0.2% |
| Thailand | 549 | 0.0% |
| Trinidad and Tobago | 3,075 | 0.2% |
| Turkey | 2,665 | 0.2% |
| Uganda | 176 | 0.0% |
| Ukraine | 2,989 | 0.2% |
| Uruguay | 1,905 | 0.1% |
| Uzbekistan | 371 | 0.0% |
| Venezuela | 2,479 | 0.2% |
| Vietnam | 1,070 | 0.1% |
| West Indies | 15 | 0.0% |
| Western Africa | 14,684 | 1.0% |
| Western Asia | 10,442 | 0.7% |
| Western Europe | 4,582 | 0.3% |
| Yemen | 159 | 0.0% |
| Zaire | 35 | 0.0% |
| Zimbabwe | 16 | 0.0% | View All 135 Rows |
Sex and Age in Area Code 973
Sex and Age in Area Code 973
The most populous age groups in Area Code 973 are 30 to 34 Years (53,129 | 7.4%) for men and 30 to 34 Years (52,626 | 7.1%) for women.

| Age Bracket | Male | Female |
| Under 5 Years | 45,798 (6.4%) | 43,500 (5.9%) |
| 5 to 9 Years | 43,971 (6.1%) | 42,423 (5.8%) |
| 10 to 14 Years | 46,322 (6.4%) | 45,446 (6.2%) |
| 15 to 19 Years | 48,569 (6.8%) | 43,662 (5.9%) |
| 20 to 24 Years | 46,304 (6.4%) | 44,891 (6.1%) |
| 25 to 29 Years | 52,292 (7.3%) | 50,098 (6.8%) |
| 30 to 34 Years | 53,129 (7.4%) | 52,626 (7.1%) |
| 35 to 39 Years | 52,032 (7.2%) | 50,206 (6.8%) |
| 40 to 44 Years | 49,594 (6.9%) | 48,924 (6.6%) |
| 45 to 49 Years | 46,933 (6.5%) | 46,992 (6.4%) |
| 50 to 54 Years | 48,834 (6.8%) | 51,593 (7.0%) |
| 55 to 59 Years | 48,843 (6.8%) | 50,200 (6.8%) |
| 60 to 64 Years | 43,763 (6.1%) | 47,083 (6.4%) |
| 65 to 69 Years | 33,057 (4.6%) | 36,991 (5.0%) |
| 70 to 74 Years | 25,346 (3.5%) | 29,050 (3.9%) |
| 75 to 79 Years | 15,473 (2.1%) | 21,650 (2.9%) |
| 80 to 84 Years | 9,535 (1.3%) | 13,605 (1.8%) |
| 85 Years and over | 9,005 (1.3%) | 18,544 (2.5%) |
| Total | 718,800 (100.0%) | 737,484 (100.0%) |
Families and Households in Area Code 973
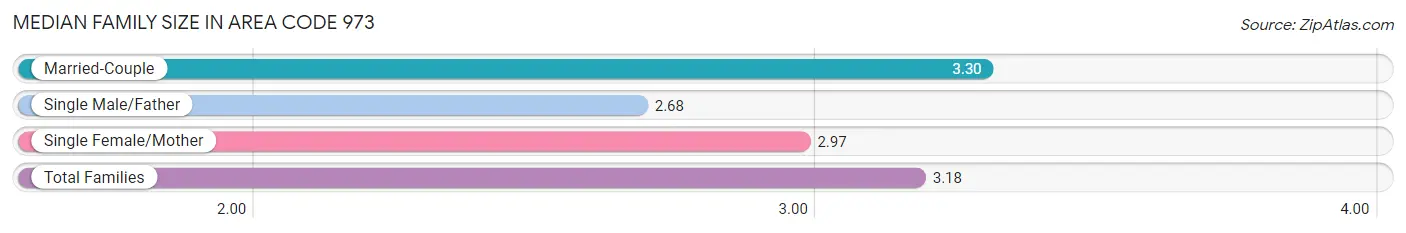
Median Family Size in Area Code 973
The median family size in Area Code 973 is 3.18 persons per family, with married-couple families (250,258 | 69.5%) accounting for the largest median family size of 3.29821 persons per family. On the other hand, single male/father families (29,435 | 8.2%) represent the smallest median family size with 2.68 persons per family.
| Family Type | # Families | Family Size |
| Married-Couple | 250,258 (69.5%) | 3.30 |
| Single Male/Father | 29,435 (8.2%) | 2.68 |
| Single Female/Mother | 80,378 (22.3%) | 2.97 |
| Total Families | 360,071 (100.0%) | 3.18 |
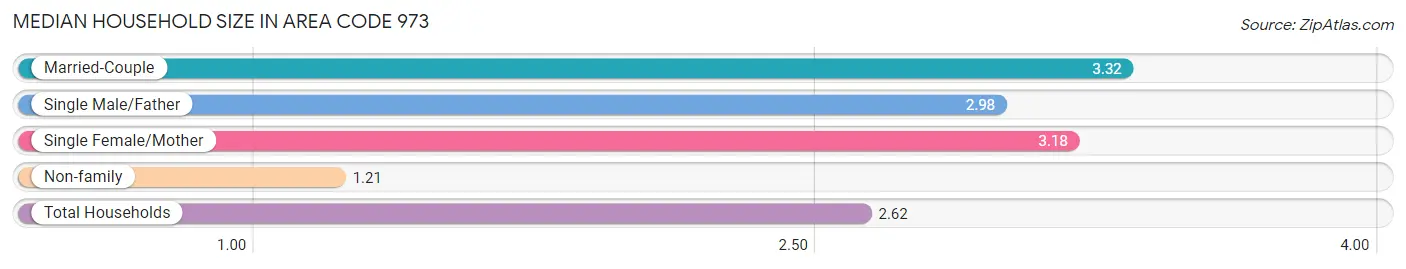
Median Household Size in Area Code 973
The median household size in Area Code 973 is 2.62 persons per household, with married-couple households (250,258 | 46.1%) accounting for the largest median household size of 3.32178 persons per household. non-family households (183,074 | 33.7%) represent the smallest median household size with 1.21 persons per household.
| Household Type | # Households | Household Size |
| Married-Couple | 250,258 (46.1%) | 3.32 |
| Single Male/Father | 29,435 (5.4%) | 2.98 |
| Single Female/Mother | 80,378 (14.8%) | 3.18 |
| Non-family | 183,074 (33.7%) | 1.21 |
| Total Households | 543,145 (100.0%) | 2.62 |
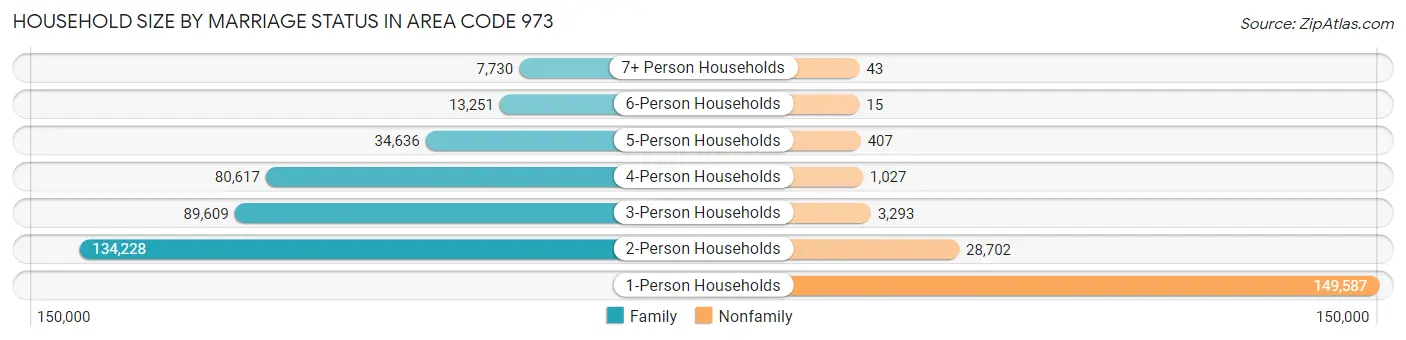
Household Size by Marriage Status in Area Code 973
Out of a total of 543,145 households in Area Code 973, 360,071 (66.3%) are family households, while 183,074 (33.7%) are nonfamily households. The most numerous type of family households are 2-person households, comprising 134,228, and the most common type of nonfamily households are 1-person households, comprising 149,587.
| Household Size | Family Households | Nonfamily Households |
| 1-Person Households | - | 149,587 (27.5%) |
| 2-Person Households | 134,228 (24.7%) | 28,702 (5.3%) |
| 3-Person Households | 89,609 (16.5%) | 3,293 (0.6%) |
| 4-Person Households | 80,617 (14.8%) | 1,027 (0.2%) |
| 5-Person Households | 34,636 (6.4%) | 407 (0.1%) |
| 6-Person Households | 13,251 (2.4%) | 15 (0.0%) |
| 7+ Person Households | 7,730 (1.4%) | 43 (0.0%) |
| Total | 360,071 (66.3%) | 183,074 (33.7%) |
Female Fertility in Area Code 973
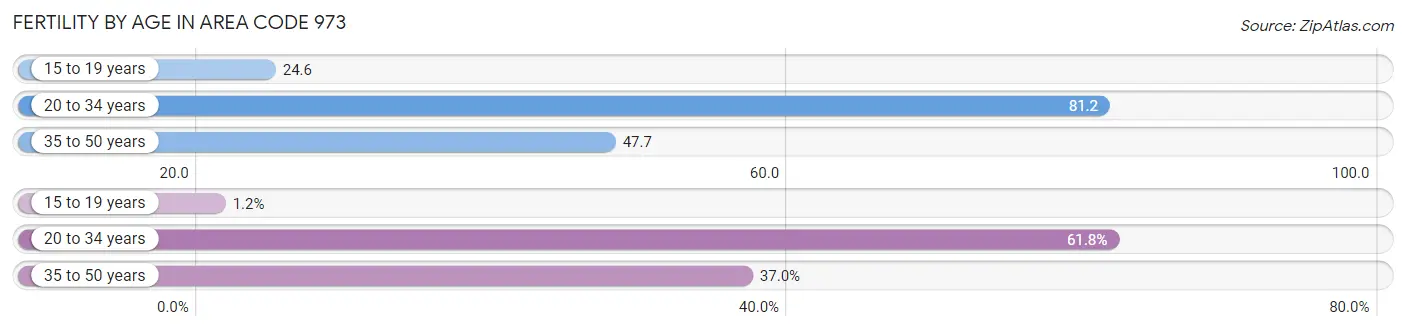
Fertility by Age in Area Code 973
Average fertility rate in Area Code 973 is 51.3 births per 1,000 women. Women in the age bracket of 20 to 34 years have the highest fertility rate with 81.2 births per 1,000 women. Women in the age bracket of 20 to 34 years acount for 61.8% of all women with births.
| Age Bracket | Women with Births | Births / 1,000 Women |
| 15 to 19 years | 214 (1.2%) | 24.6 |
| 20 to 34 years | 11,000 (61.8%) | 81.2 |
| 35 to 50 years | 6,579 (37.0%) | 47.7 |
| Total | 17,793 (100.0%) | 51.3 |
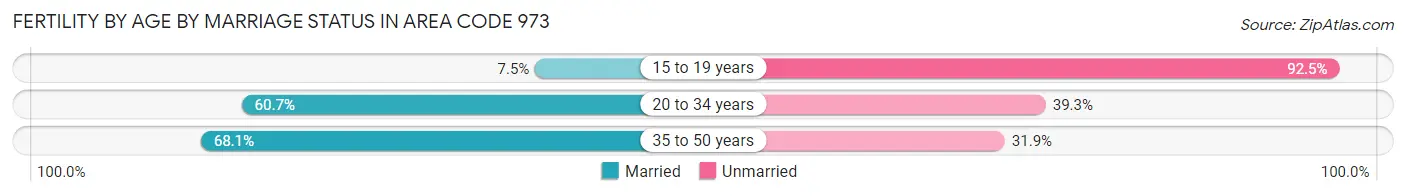
Fertility by Age by Marriage Status in Area Code 973
67.1% of women with births (17,793) in Area Code 973 are married. The highest percentage of unmarried women with births falls into 15 to 19 years age bracket with 92.5% of them unmarried at the time of birth, while the lowest percentage of unmarried women with births belong to 35 to 50 years age bracket with 31.9% of them unmarried.
| Age Bracket | Married | Unmarried |
| 15 to 19 years | 16 (7.5%) | 198 (92.5%) |
| 20 to 34 years | 6,673 (60.7%) | 4,327 (39.3%) |
| 35 to 50 years | 4,478 (68.1%) | 2,101 (31.9%) |
| Total | 11,943 (67.1%) | 5,850 (32.9%) |
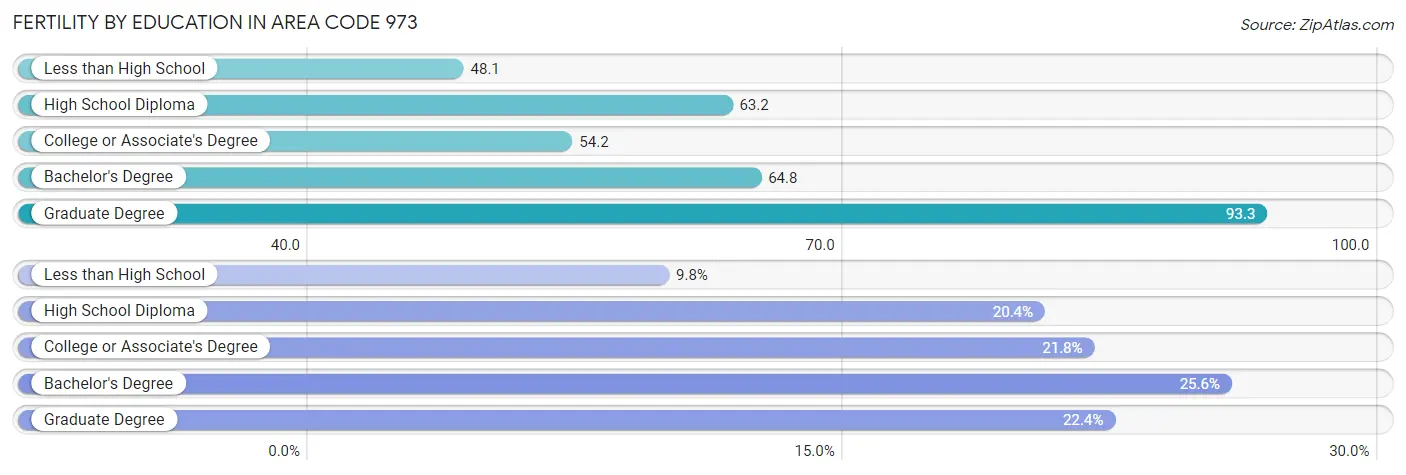
Fertility by Education in Area Code 973
Average fertility rate in Area Code 973 is 51.3 births per 1,000 women. Women with the education attainment of graduate degree have the highest fertility rate of 93.3 births per 1,000 women, while women with the education attainment of less than high school have the lowest fertility at 48.1 births per 1,000 women. Women with the education attainment of bachelor's degree represent 25.6% of all women with births.
| Educational Attainment | Women with Births | Births / 1,000 Women |
| Less than High School | 1,749 (9.8%) | 48.1 |
| High School Diploma | 3,628 (20.4%) | 63.2 |
| College or Associate's Degree | 3,875 (21.8%) | 54.2 |
| Bachelor's Degree | 4,562 (25.6%) | 64.8 |
| Graduate Degree | 3,979 (22.4%) | 93.3 |
| Total | 17,793 (100.0%) | 51.3 |
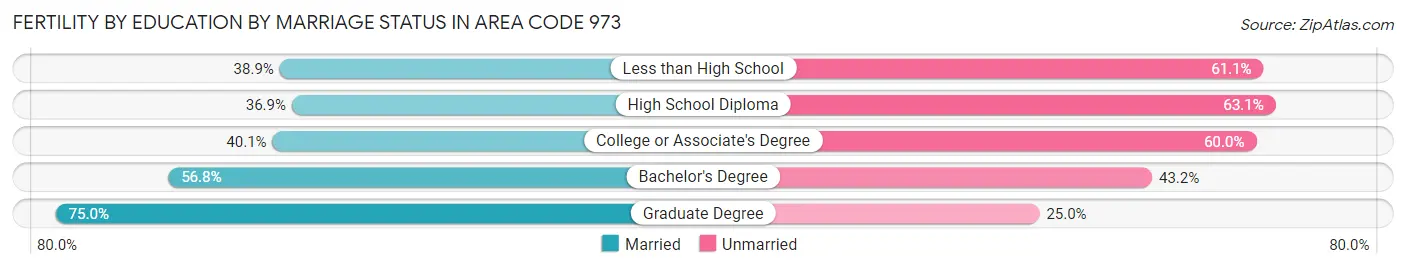
Fertility by Education by Marriage Status in Area Code 973
32.9% of women with births in Area Code 973 are unmarried. Women with the educational attainment of graduate degree are most likely to be married with 75.0% of them married at childbirth, while women with the educational attainment of high school diploma are least likely to be married with 63.1% of them unmarried at childbirth.
| Educational Attainment | Married | Unmarried |
| Less than High School | 680 (38.9%) | 1,069 (61.1%) |
| High School Diploma | 1,340 (36.9%) | 2,288 (63.1%) |
| College or Associate's Degree | 1,552 (40.1%) | 2,323 (60.0%) |
| Bachelor's Degree | 2,593 (56.8%) | 1,969 (43.2%) |
| Graduate Degree | 2,984 (75.0%) | 995 (25.0%) |
| Total | 11,943 (67.1%) | 5,850 (32.9%) |
Employment Characteristics in Area Code 973
Employment by Class of Employer in Area Code 973
Among the 718,779 employed individuals in Area Code 973, private company employees (518,285 | 72.1%), local government employees (54,656 | 7.6%), and not-for-profit organizations (48,391 | 6.7%) make up the most common classes of employment.

| Employer Class | # Employees | % Employees |
| Private Company Employees | 518,285 | 72.1% |
| Self-Employed (Incorporated) | 27,218 | 3.8% |
| Self-Employed (Not Incorporated) | 34,735 | 4.8% |
| Not-for-profit Organizations | 48,391 | 6.7% |
| Local Government Employees | 54,656 | 7.6% |
| State Government Employees | 22,912 | 3.2% |
| Federal Government Employees | 11,644 | 1.6% |
| Unpaid Family Workers | 938 | 0.1% |
| Total | 718,779 | 100.0% |
Employment Status by Age in Area Code 973
According to the labor force statistics for Area Code 973, out of the total population over 16 years of age (1,170,041), 67.7% or 792,235 individuals are in the labor force, with 6.9% or 54,823 of them unemployed. The age group with the highest labor force participation rate is 25 to 29 years, with 86.7% or 88,803 individuals in the labor force. Within the labor force, the 16 to 19 years age range has the highest percentage of unemployed individuals, with 1,288.3% or 298,628 of them being unemployed.
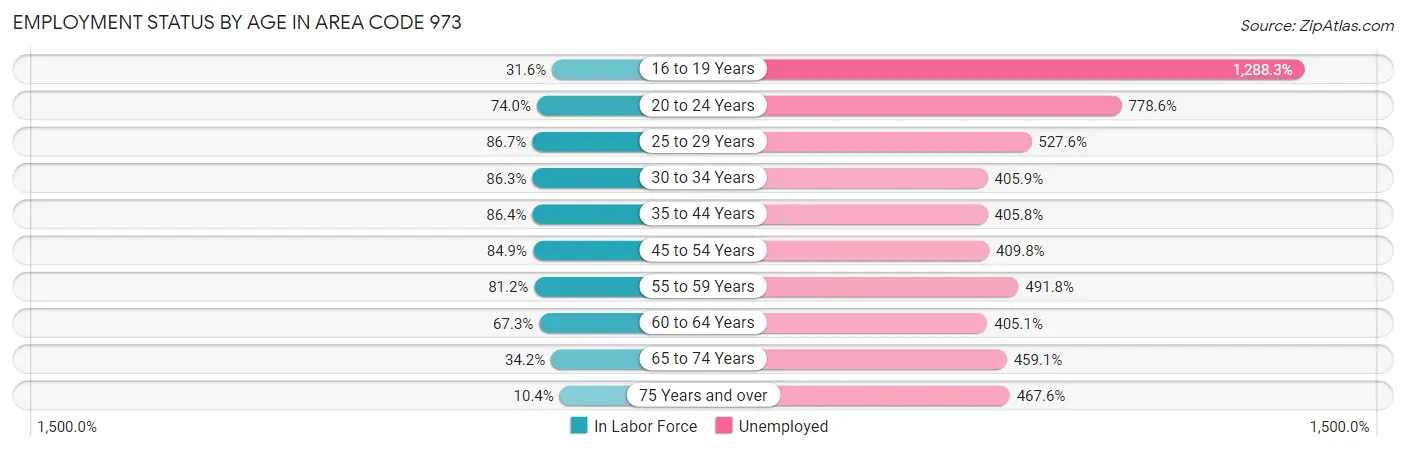
| Age Bracket | In Labor Force | Unemployed |
| 16 to 19 Years | 23,183 (31.6%) | 298,628 (1,288.3%) |
| 20 to 24 Years | 67,444 (74.0%) | 525,150 (778.6%) |
| 25 to 29 Years | 88,799 (86.7%) | 468,525 (527.6%) |
| 30 to 34 Years | 91,261 (86.3%) | 370,408 (405.9%) |
| 35 to 44 Years | 173,364 (86.4%) | 703,548 (405.8%) |
| 45 to 54 Years | 164,920 (84.9%) | 675,871 (409.8%) |
| 55 to 59 Years | 80,407 (81.2%) | 395,422 (491.8%) |
| 60 to 64 Years | 61,179 (67.3%) | 247,824 (405.1%) |
| 65 to 74 Years | 42,515 (34.2%) | 195,163 (459.1%) |
| 75 Years and over | 9,099 (10.4%) | 42,538 (467.6%) |
| Total | 792,182 (67.7%) | 54,851 (6.9%) |
Employment Status by Educational Attainment in Area Code 973
According to labor force statistics for Area Code 973, 83.0% of individuals (658,070) out of the total population between 25 and 64 years of age (793,142) are in the labor force, with 447.5% or 2,944,863 of them being unemployed. The group with the highest labor force participation rate are those with the educational attainment of bachelor's degree or higher, with 88.4% or 308,638 individuals in the labor force. Within the labor force, individuals with less than high school education have the highest percentage of unemployment, with 719.8% or 383,639 of them being unemployed.
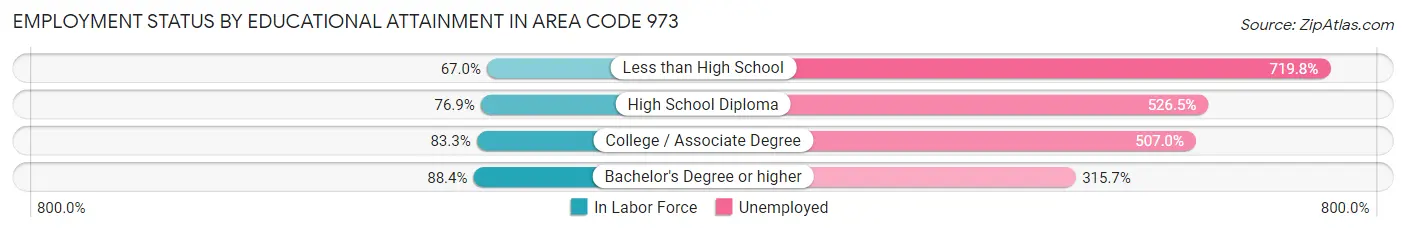
| Educational Attainment | In Labor Force | Unemployed |
| Less than High School | 53,295 (67.0%) | 572,335 (719.8%) |
| High School Diploma | 151,996 (76.9%) | 1,040,875 (526.5%) |
| College / Associate Degree | 138,802 (83.3%) | 845,245 (507.0%) |
| Bachelor's Degree or higher | 308,641 (88.4%) | 1,102,478 (315.7%) |
| Total | 658,069 (83.0%) | 3,549,310 (447.5%) |
Employment Occupations by Sex in Area Code 973
Management, Business, Science and Arts Occupations
The most common Management, Business, Science and Arts occupations in Area Code 973 are Community & Social Service (91,206 | 12.4%), Management (90,519 | 12.3%), Business & Financial (54,331 | 7.4%), Computers, Engineering & Science (54,300 | 7.4%), and Education Instruction & Library (50,387 | 6.8%).

Management, Business, Science and Arts Occupations by Sex
Within the Management, Business, Science and Arts occupations in Area Code 973, the most male-oriented occupations are Architecture & Engineering (84.5%), Computers & Mathematics (74.8%), and Computers, Engineering & Science (72.6%), while the most female-oriented occupations are Education Instruction & Library (73.6%), Health Diagnosing & Treating (72.2%), and Health Technologists (71.8%).
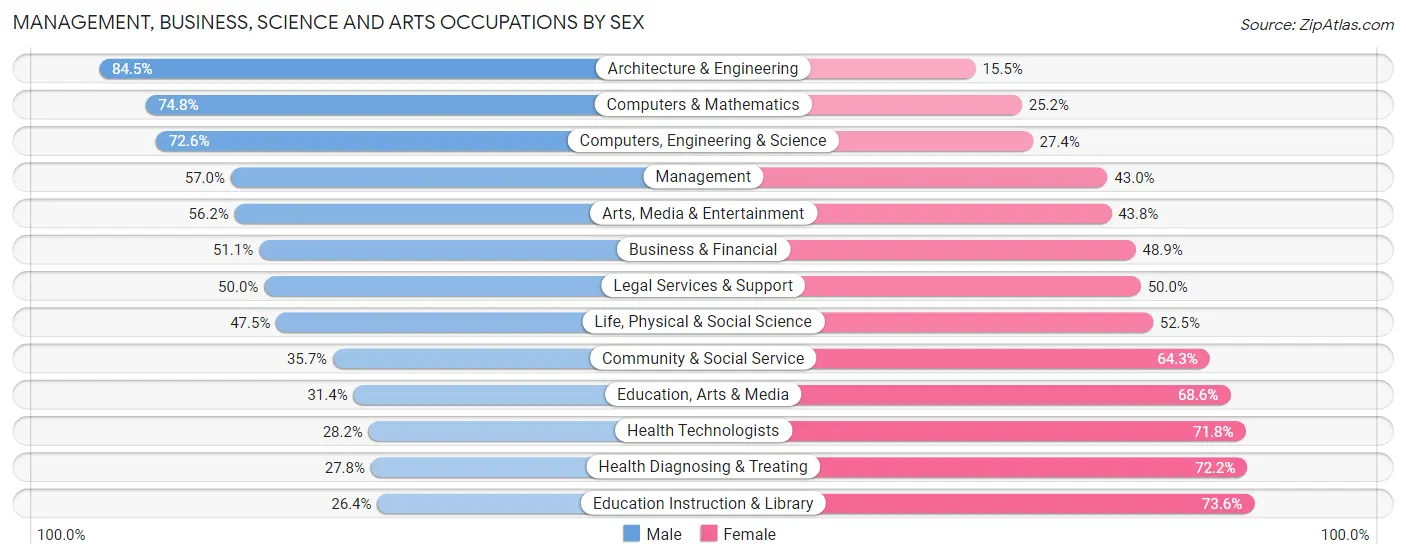
| Occupation | Male | Female |
| Management | 51,579 (57.0%) | 38,940 (43.0%) |
| Business & Financial | 27,771 (51.1%) | 26,560 (48.9%) |
| Computers, Engineering & Science | 39,413 (72.6%) | 14,887 (27.4%) |
| Computers & Mathematics | 24,483 (74.8%) | 8,236 (25.2%) |
| Architecture & Engineering | 10,689 (84.5%) | 1,966 (15.5%) |
| Life, Physical & Social Science | 4,241 (47.5%) | 4,685 (52.5%) |
| Community & Social Service | 32,545 (35.7%) | 58,661 (64.3%) |
| Education, Arts & Media | 3,764 (31.4%) | 8,228 (68.6%) |
| Legal Services & Support | 5,868 (50.0%) | 5,861 (50.0%) |
| Education Instruction & Library | 13,306 (26.4%) | 37,081 (73.6%) |
| Arts, Media & Entertainment | 9,607 (56.2%) | 7,491 (43.8%) |
| Health Diagnosing & Treating | 10,902 (27.8%) | 28,333 (72.2%) |
| Health Technologists | 7,691 (28.2%) | 19,559 (71.8%) |
| Total (Category) | 162,210 (49.2%) | 167,381 (50.8%) |
| Total (Overall) | 390,008 (52.9%) | 346,891 (47.1%) |
Services Occupations
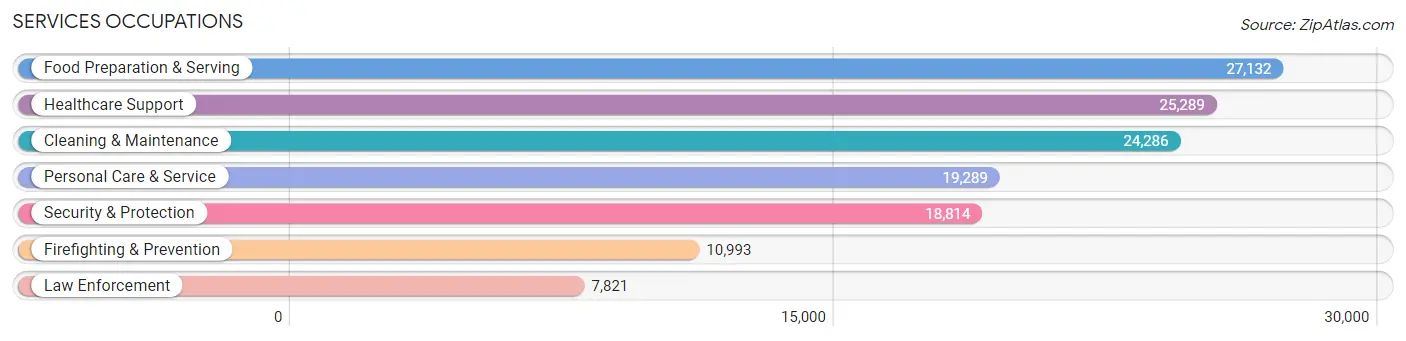
The most common Services occupations in Area Code 973 are Food Preparation & Serving (27,132 | 3.7%), Healthcare Support (25,289 | 3.4%), Cleaning & Maintenance (24,286 | 3.3%), Personal Care & Service (19,289 | 2.6%), and Security & Protection (18,814 | 2.5%).
Services Occupations by Sex
Within the Services occupations in Area Code 973, the most male-oriented occupations are Law Enforcement (84.9%), Security & Protection (77.4%), and Firefighting & Prevention (72.1%), while the most female-oriented occupations are Healthcare Support (86.6%), Personal Care & Service (73.1%), and Food Preparation & Serving (47.9%).
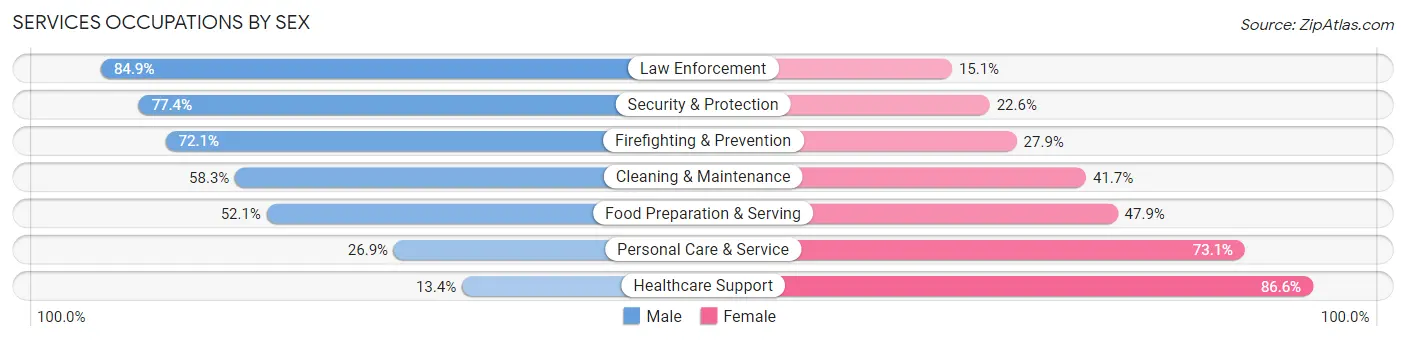
| Occupation | Male | Female |
| Healthcare Support | 3,387 (13.4%) | 21,902 (86.6%) |
| Security & Protection | 14,560 (77.4%) | 4,254 (22.6%) |
| Firefighting & Prevention | 7,922 (72.1%) | 3,071 (27.9%) |
| Law Enforcement | 6,638 (84.9%) | 1,183 (15.1%) |
| Food Preparation & Serving | 14,124 (52.1%) | 13,008 (47.9%) |
| Cleaning & Maintenance | 14,162 (58.3%) | 10,124 (41.7%) |
| Personal Care & Service | 5,183 (26.9%) | 14,106 (73.1%) |
| Total (Category) | 51,416 (44.8%) | 63,394 (55.2%) |
| Total (Overall) | 390,008 (52.9%) | 346,891 (47.1%) |
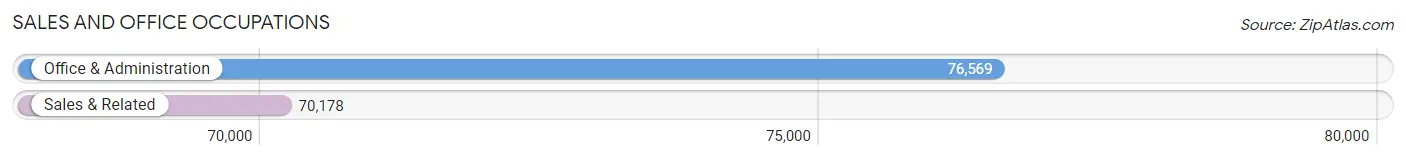
Sales and Office Occupations
The most common Sales and Office occupations in Area Code 973 are Office & Administration (76,569 | 10.4%), and Sales & Related (70,178 | 9.5%).
Sales and Office Occupations by Sex
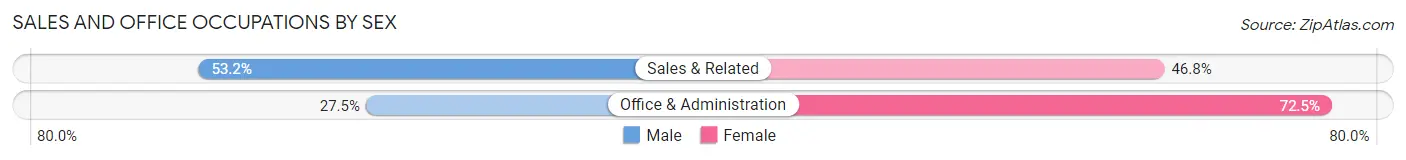
| Occupation | Male | Female |
| Sales & Related | 37,365 (53.2%) | 32,813 (46.8%) |
| Office & Administration | 21,066 (27.5%) | 55,503 (72.5%) |
| Total (Category) | 58,431 (39.8%) | 88,316 (60.2%) |
| Total (Overall) | 390,008 (52.9%) | 346,891 (47.1%) |
Natural Resources, Construction and Maintenance Occupations
The most common Natural Resources, Construction and Maintenance occupations in Area Code 973 are Construction & Extraction (32,725 | 4.4%), Installation, Maintenance & Repair (16,638 | 2.3%), and Farming, Fishing & Forestry (606 | 0.1%).

Natural Resources, Construction and Maintenance Occupations by Sex
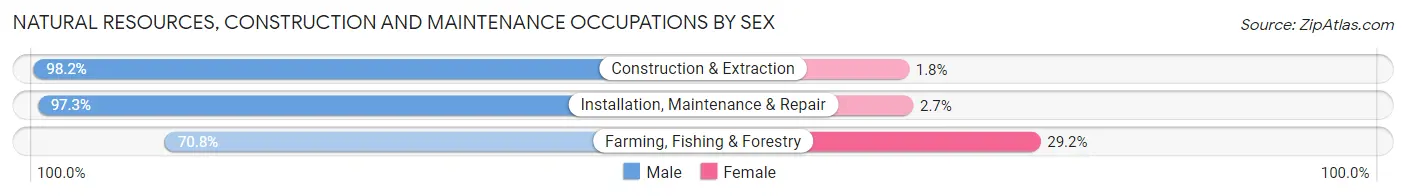
| Occupation | Male | Female |
| Farming, Fishing & Forestry | 429 (70.8%) | 177 (29.2%) |
| Construction & Extraction | 32,124 (98.2%) | 601 (1.8%) |
| Installation, Maintenance & Repair | 16,183 (97.3%) | 455 (2.7%) |
| Total (Category) | 48,736 (97.5%) | 1,233 (2.5%) |
| Total (Overall) | 390,008 (52.9%) | 346,891 (47.1%) |
Production, Transportation and Moving Occupations
The most common Production, Transportation and Moving occupations in Area Code 973 are Production (35,294 | 4.8%), Transportation (31,795 | 4.3%), and Material Moving (28,693 | 3.9%).
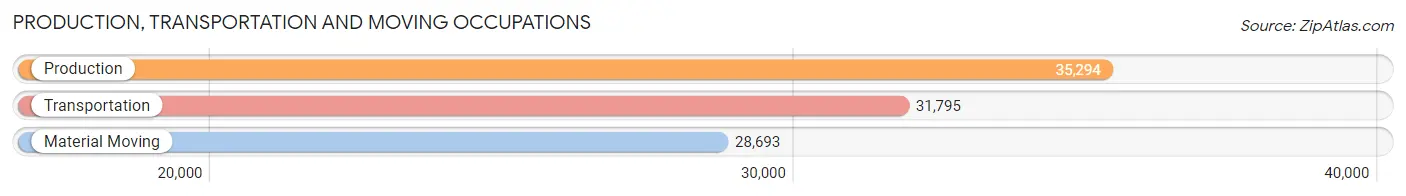
Production, Transportation and Moving Occupations by Sex
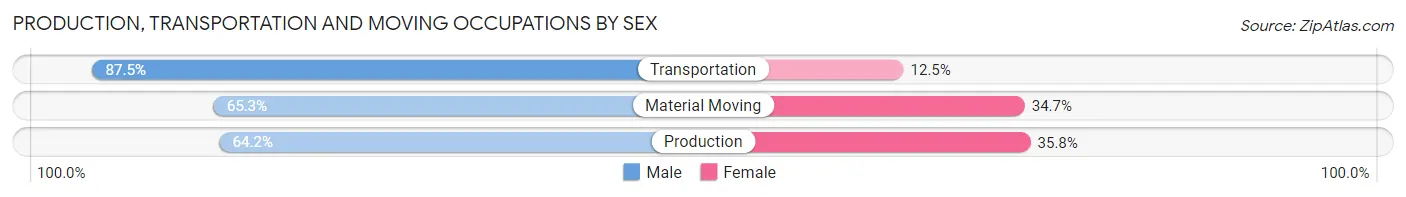
| Occupation | Male | Female |
| Production | 22,662 (64.2%) | 12,632 (35.8%) |
| Transportation | 27,823 (87.5%) | 3,972 (12.5%) |
| Material Moving | 18,730 (65.3%) | 9,963 (34.7%) |
| Total (Category) | 69,215 (72.3%) | 26,567 (27.7%) |
| Total (Overall) | 390,008 (52.9%) | 346,891 (47.1%) |
Employment Industries by Sex in Area Code 973
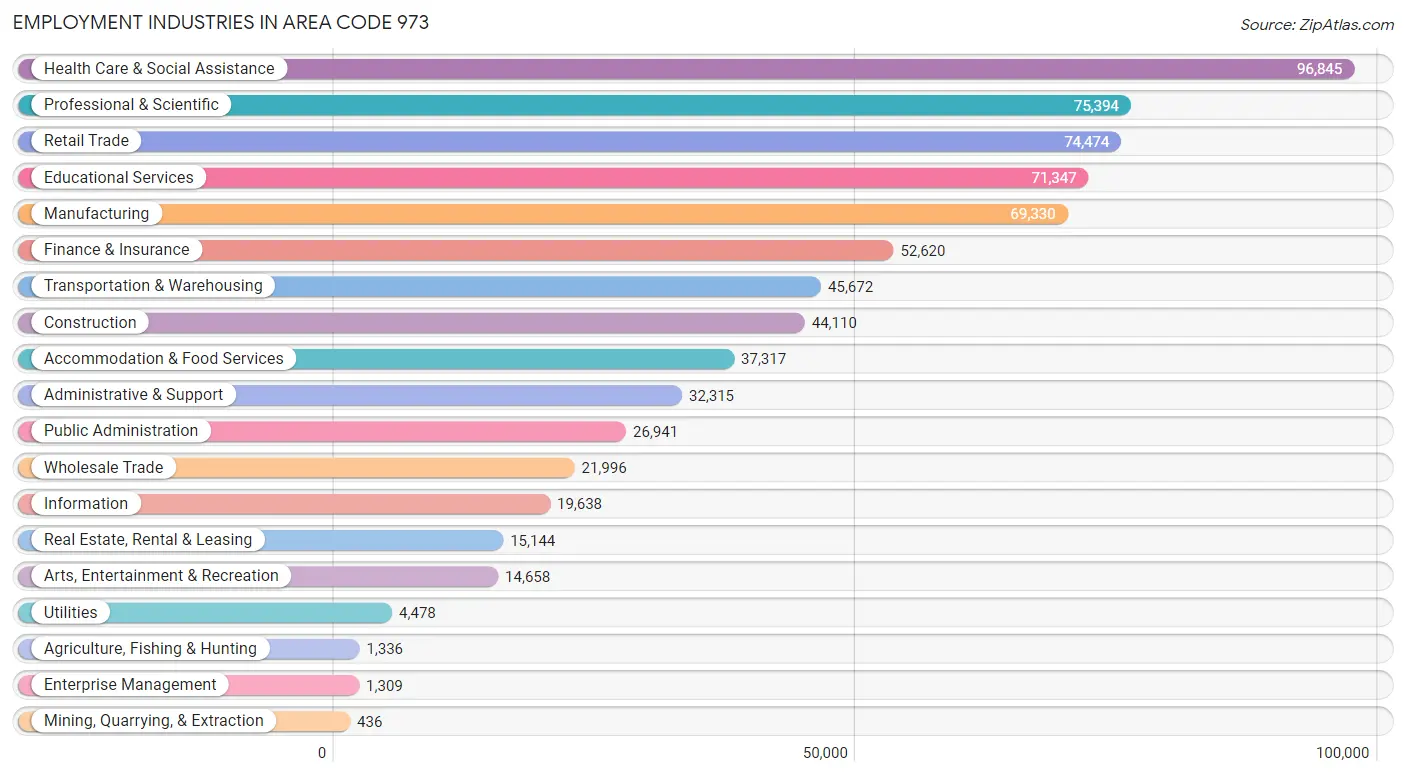
Employment Industries in Area Code 973
The major employment industries in Area Code 973 include Health Care & Social Assistance (96,845 | 13.1%), Professional & Scientific (75,394 | 10.2%), Retail Trade (74,474 | 10.1%), Educational Services (71,347 | 9.7%), and Manufacturing (69,330 | 9.4%).
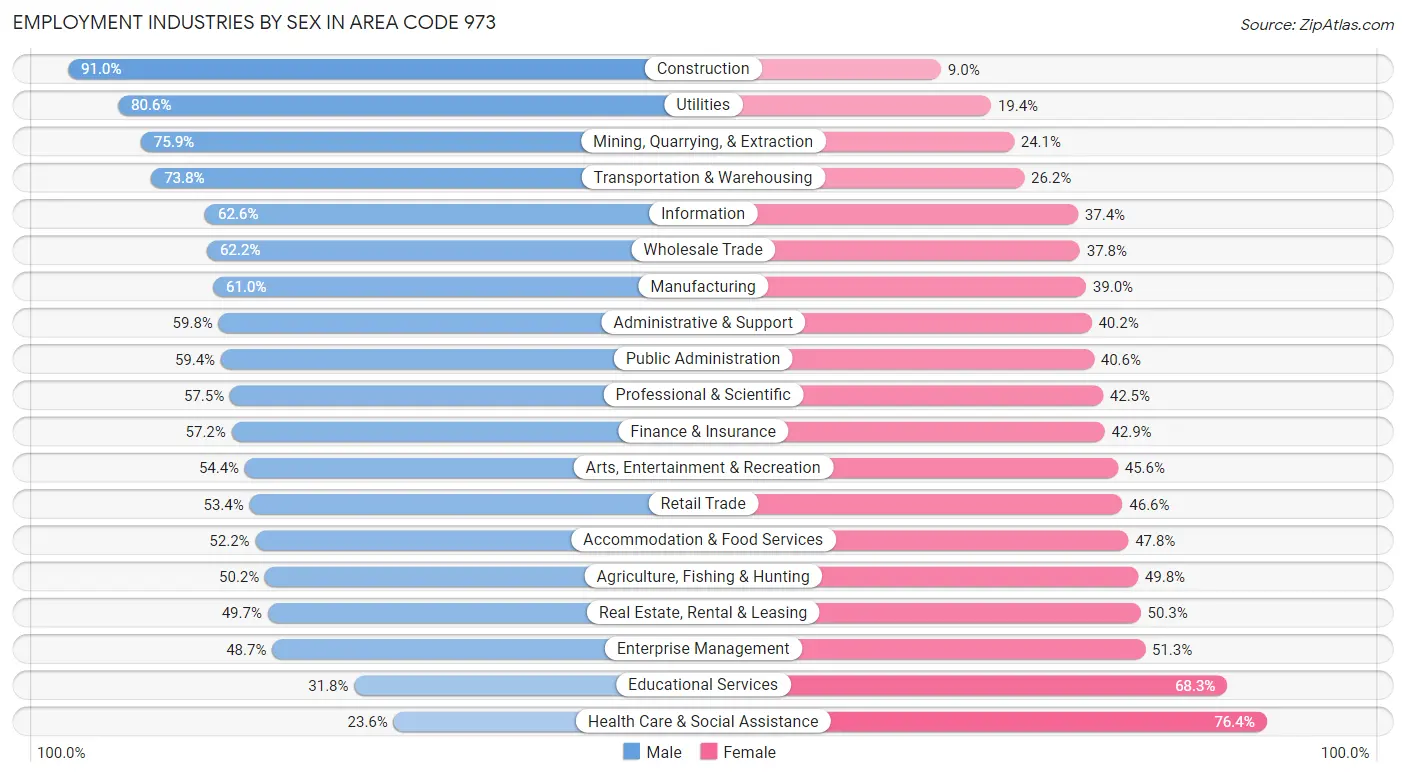
Employment Industries by Sex in Area Code 973
The Area Code 973 industries that see more men than women are Construction (91.0%), Utilities (80.6%), and Mining, Quarrying, & Extraction (75.9%), whereas the industries that tend to have a higher number of women are Health Care & Social Assistance (76.4%), Educational Services (68.2%), and Enterprise Management (51.3%).
| Industry | Male | Female |
| Agriculture, Fishing & Hunting | 671 (50.2%) | 665 (49.8%) |
| Mining, Quarrying, & Extraction | 331 (75.9%) | 105 (24.1%) |
| Construction | 40,138 (91.0%) | 3,972 (9.0%) |
| Manufacturing | 42,279 (61.0%) | 27,051 (39.0%) |
| Wholesale Trade | 13,691 (62.2%) | 8,305 (37.8%) |
| Retail Trade | 39,802 (53.4%) | 34,672 (46.6%) |
| Transportation & Warehousing | 33,699 (73.8%) | 11,973 (26.2%) |
| Utilities | 3,611 (80.6%) | 867 (19.4%) |
| Information | 12,301 (62.6%) | 7,337 (37.4%) |
| Finance & Insurance | 30,073 (57.2%) | 22,547 (42.8%) |
| Real Estate, Rental & Leasing | 7,522 (49.7%) | 7,622 (50.3%) |
| Professional & Scientific | 43,333 (57.5%) | 32,061 (42.5%) |
| Enterprise Management | 638 (48.7%) | 671 (51.3%) |
| Administrative & Support | 19,334 (59.8%) | 12,981 (40.2%) |
| Educational Services | 22,654 (31.8%) | 48,693 (68.2%) |
| Health Care & Social Assistance | 22,876 (23.6%) | 73,969 (76.4%) |
| Arts, Entertainment & Recreation | 7,973 (54.4%) | 6,685 (45.6%) |
| Accommodation & Food Services | 19,489 (52.2%) | 17,828 (47.8%) |
| Public Administration | 15,993 (59.4%) | 10,948 (40.6%) |
| Total | 390,008 (52.9%) | 346,891 (47.1%) |
Education in Area Code 973
School Enrollment in Area Code 973
The most common levels of schooling among the 355,968 students in Area Code 973 are high school (76,228 | 21.4%), middle school (74,233 | 20.8%), and college / undergraduate (70,157 | 19.7%).
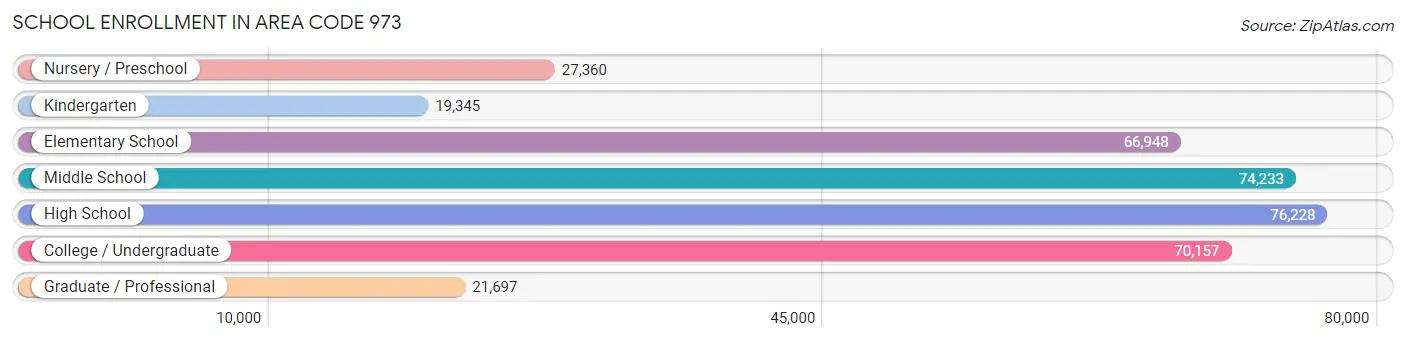
| School Level | # Students | % Students |
| Nursery / Preschool | 27,360 | 7.7% |
| Kindergarten | 19,345 | 5.4% |
| Elementary School | 66,948 | 18.8% |
| Middle School | 74,233 | 20.8% |
| High School | 76,228 | 21.4% |
| College / Undergraduate | 70,157 | 19.7% |
| Graduate / Professional | 21,697 | 6.1% |
| Total | 355,968 | 100.0% |
School Enrollment by Age by Funding Source in Area Code 973
Out of a total of 355,968 students who are enrolled in schools in Area Code 973, 65,193 (18.3%) attend a private institution, while the remaining 290,775 (81.7%) are enrolled in public schools. The age group of 35 years and over has the highest likelihood of being enrolled in private schools, with 7,061 (42.8% in the age bracket) enrolled. Conversely, the age group of 10 to 14 year olds has the lowest likelihood of being enrolled in a private school, with 82,050 (91.1% in the age bracket) attending a public institution.

| Age Bracket | Public School | Private School |
| 3 to 4 Year Olds | 15,568 (66.1%) | 7,973 (33.9%) |
| 5 to 9 Year Old | 73,688 (89.0%) | 9,081 (11.0%) |
| 10 to 14 Year Olds | 82,050 (91.1%) | 8,015 (8.9%) |
| 15 to 17 Year Olds | 48,860 (90.7%) | 5,036 (9.3%) |
| 18 to 19 Year Olds | 21,247 (73.9%) | 7,492 (26.1%) |
| 20 to 24 Year Olds | 26,117 (66.4%) | 13,209 (33.6%) |
| 25 to 34 Year Olds | 13,842 (65.5%) | 7,299 (34.5%) |
| 35 Years and over | 9,430 (57.2%) | 7,061 (42.8%) |
| Total | 290,775 (81.7%) | 65,193 (18.3%) |
Educational Attainment by Field of Study in Area Code 973
Business (99,009 | 22.0%), education (43,478 | 9.6%), social sciences (43,314 | 9.6%), engineering (37,569 | 8.3%), and science & technology (35,984 | 8.0%) are the most common fields of study among 450,961 individuals in Area Code 973 who have obtained a bachelor's degree or higher.
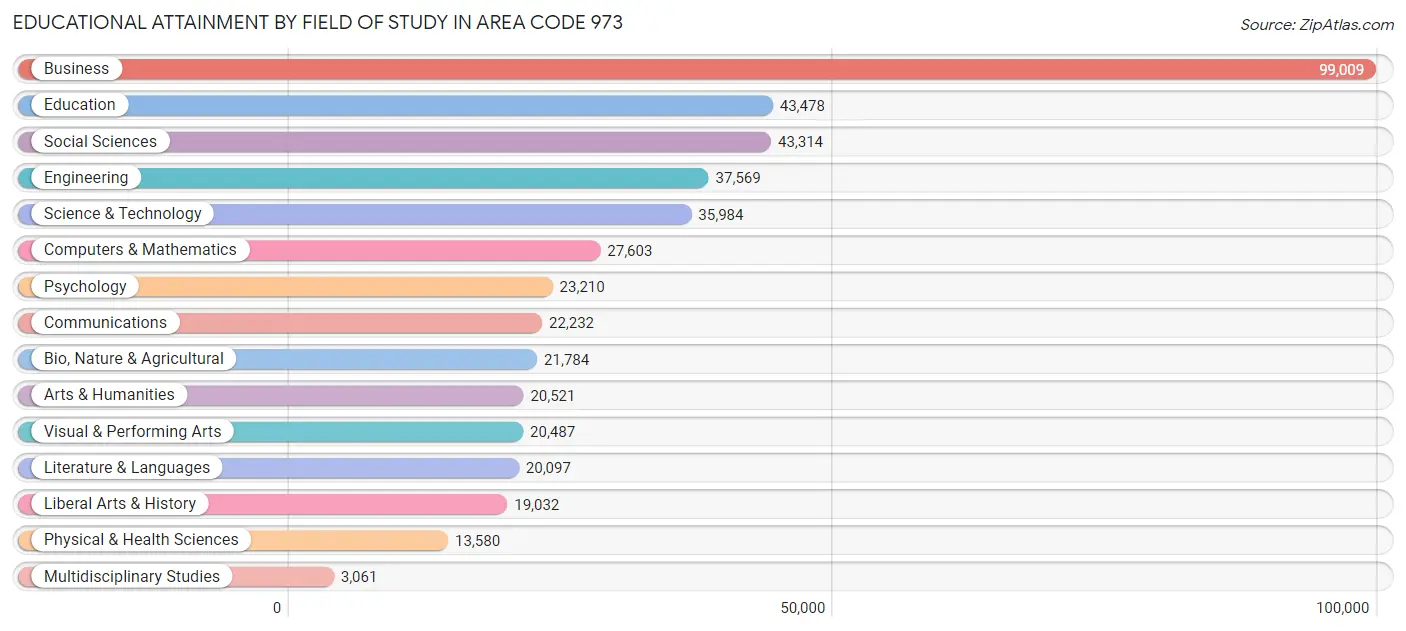
| Field of Study | # Graduates | % Graduates |
| Computers & Mathematics | 27,603 | 6.1% |
| Bio, Nature & Agricultural | 21,784 | 4.8% |
| Physical & Health Sciences | 13,580 | 3.0% |
| Psychology | 23,210 | 5.1% |
| Social Sciences | 43,314 | 9.6% |
| Engineering | 37,569 | 8.3% |
| Multidisciplinary Studies | 3,061 | 0.7% |
| Science & Technology | 35,984 | 8.0% |
| Business | 99,009 | 22.0% |
| Education | 43,478 | 9.6% |
| Literature & Languages | 20,097 | 4.5% |
| Liberal Arts & History | 19,032 | 4.2% |
| Visual & Performing Arts | 20,487 | 4.5% |
| Communications | 22,232 | 4.9% |
| Arts & Humanities | 20,521 | 4.5% |
| Total | 450,961 | 100.0% |
Transportation & Commute in Area Code 973
Vehicle Availability by Sex in Area Code 973
The most prevalent vehicle ownership categories in Area Code 973 are males with 2 vehicles (137,864, accounting for 36.1%) and females with 2 vehicles (115,136, making up 41.3%).
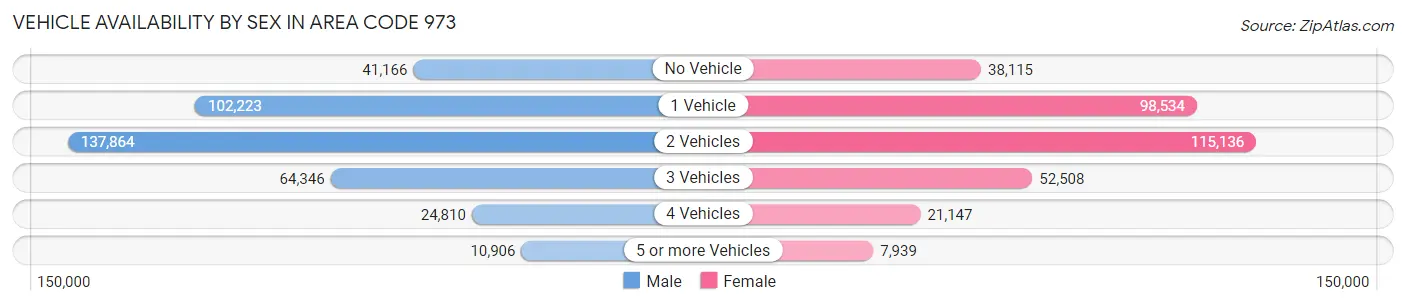
| Vehicles Available | Male | Female |
| No Vehicle | 41,166 (10.8%) | 38,115 (11.4%) |
| 1 Vehicle | 102,223 (26.8%) | 98,534 (29.6%) |
| 2 Vehicles | 137,864 (36.1%) | 115,136 (34.5%) |
| 3 Vehicles | 64,346 (16.9%) | 52,508 (15.8%) |
| 4 Vehicles | 24,810 (6.5%) | 21,147 (6.3%) |
| 5 or more Vehicles | 10,906 (2.9%) | 7,939 (2.4%) |
| Total | 381,315 (100.0%) | 333,379 (100.0%) |
Commute Time in Area Code 973
The most frequently occuring commute durations in Area Code 973 are 30 to 34 minutes (95,878 commuters, 15.4%), 20 to 24 minutes (83,071 commuters, 13.3%), and 15 to 19 minutes (77,693 commuters, 12.4%).
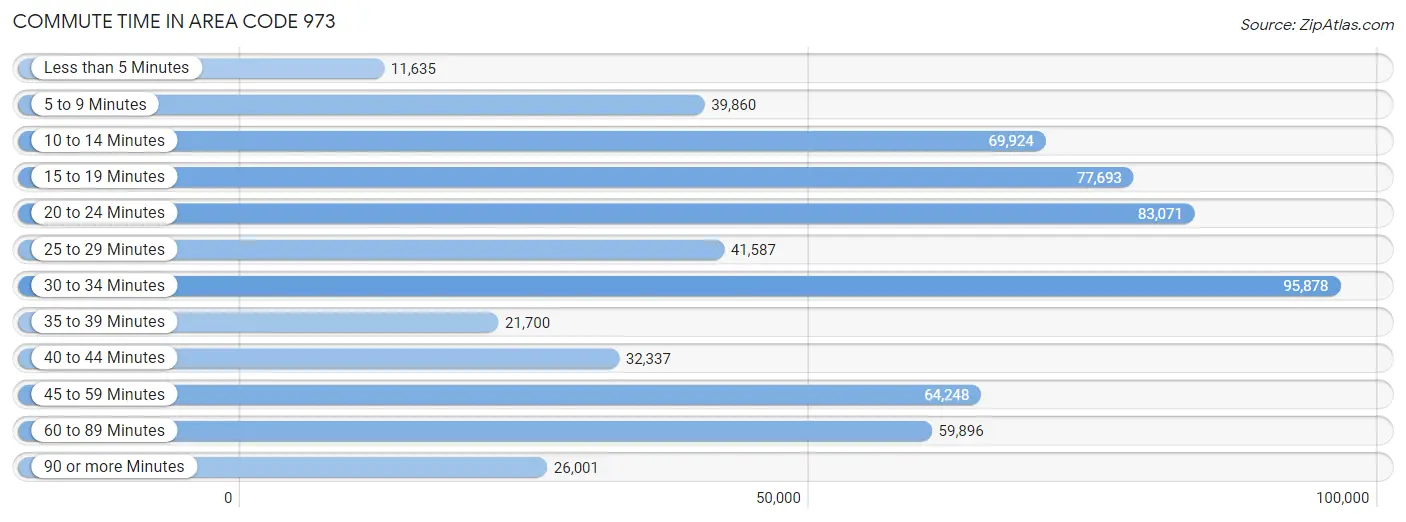
| Commute Time | # Commuters | % Commuters |
| Less than 5 Minutes | 11,635 | 1.9% |
| 5 to 9 Minutes | 39,860 | 6.4% |
| 10 to 14 Minutes | 69,924 | 11.2% |
| 15 to 19 Minutes | 77,693 | 12.4% |
| 20 to 24 Minutes | 83,071 | 13.3% |
| 25 to 29 Minutes | 41,587 | 6.7% |
| 30 to 34 Minutes | 95,878 | 15.4% |
| 35 to 39 Minutes | 21,700 | 3.5% |
| 40 to 44 Minutes | 32,337 | 5.2% |
| 45 to 59 Minutes | 64,248 | 10.3% |
| 60 to 89 Minutes | 59,896 | 9.6% |
| 90 or more Minutes | 26,001 | 4.2% |
Commute Time by Sex in Area Code 973
The most common commute times in Area Code 973 are 30 to 34 minutes (52,864 commuters, 15.7%) for males and 30 to 34 minutes (43,014 commuters, 14.9%) for females.
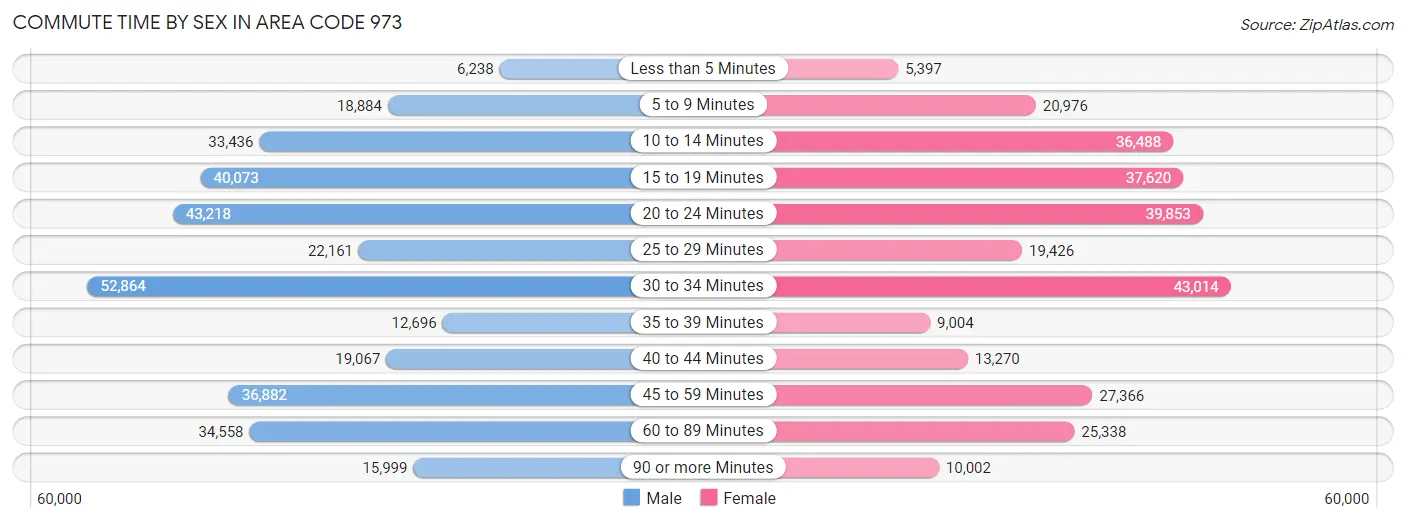
| Commute Time | Male | Female |
| Less than 5 Minutes | 6,238 (1.9%) | 5,397 (1.9%) |
| 5 to 9 Minutes | 18,884 (5.6%) | 20,976 (7.3%) |
| 10 to 14 Minutes | 33,436 (10.0%) | 36,488 (12.7%) |
| 15 to 19 Minutes | 40,073 (11.9%) | 37,620 (13.1%) |
| 20 to 24 Minutes | 43,218 (12.9%) | 39,853 (13.9%) |
| 25 to 29 Minutes | 22,161 (6.6%) | 19,426 (6.8%) |
| 30 to 34 Minutes | 52,864 (15.7%) | 43,014 (14.9%) |
| 35 to 39 Minutes | 12,696 (3.8%) | 9,004 (3.1%) |
| 40 to 44 Minutes | 19,067 (5.7%) | 13,270 (4.6%) |
| 45 to 59 Minutes | 36,882 (11.0%) | 27,366 (9.5%) |
| 60 to 89 Minutes | 34,558 (10.3%) | 25,338 (8.8%) |
| 90 or more Minutes | 15,999 (4.8%) | 10,002 (3.5%) |
Time of Departure to Work by Sex in Area Code 973
The most frequent times of departure to work in Area Code 973 are 8:00 AM to 8:29 AM (50,767, 15.1%) for males and 8:00 AM to 8:29 AM (50,833, 17.7%) for females.
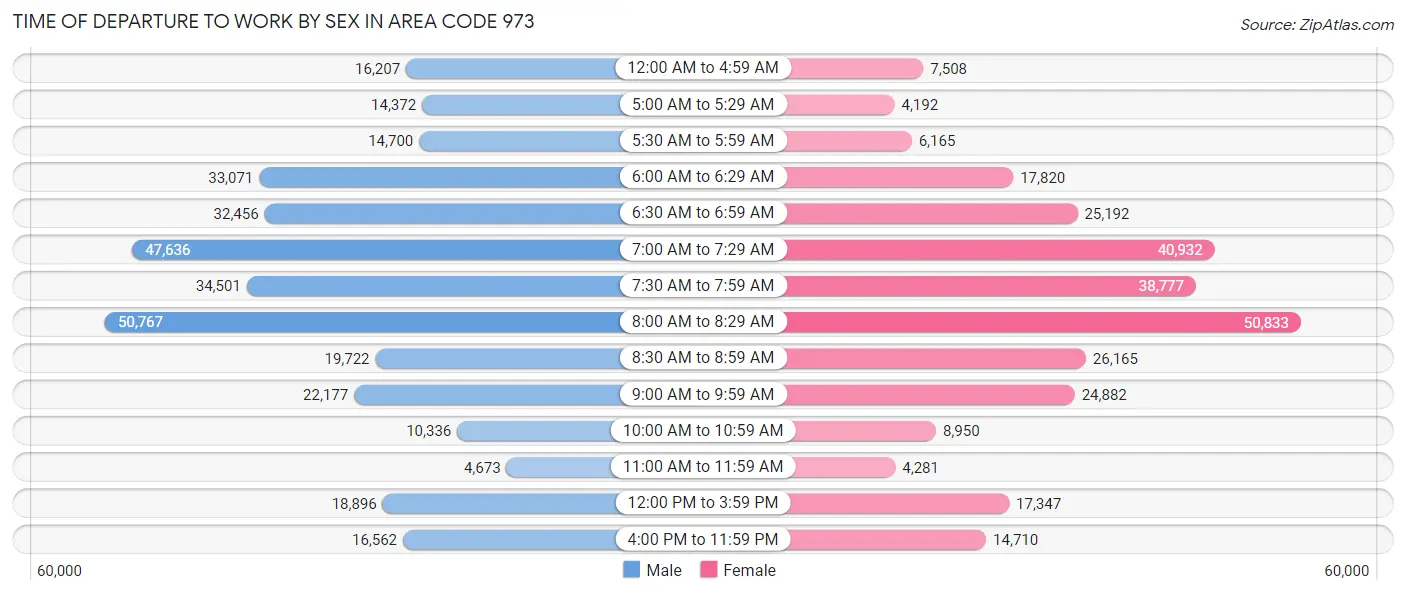
| Time of Departure | Male | Female |
| 12:00 AM to 4:59 AM | 16,207 (4.8%) | 7,508 (2.6%) |
| 5:00 AM to 5:29 AM | 14,372 (4.3%) | 4,192 (1.5%) |
| 5:30 AM to 5:59 AM | 14,700 (4.4%) | 6,165 (2.1%) |
| 6:00 AM to 6:29 AM | 33,071 (9.8%) | 17,820 (6.2%) |
| 6:30 AM to 6:59 AM | 32,456 (9.7%) | 25,192 (8.7%) |
| 7:00 AM to 7:29 AM | 47,636 (14.2%) | 40,932 (14.2%) |
| 7:30 AM to 7:59 AM | 34,501 (10.3%) | 38,777 (13.5%) |
| 8:00 AM to 8:29 AM | 50,767 (15.1%) | 50,833 (17.7%) |
| 8:30 AM to 8:59 AM | 19,722 (5.9%) | 26,165 (9.1%) |
| 9:00 AM to 9:59 AM | 22,177 (6.6%) | 24,882 (8.6%) |
| 10:00 AM to 10:59 AM | 10,336 (3.1%) | 8,950 (3.1%) |
| 11:00 AM to 11:59 AM | 4,673 (1.4%) | 4,281 (1.5%) |
| 12:00 PM to 3:59 PM | 18,896 (5.6%) | 17,347 (6.0%) |
| 4:00 PM to 11:59 PM | 16,562 (4.9%) | 14,710 (5.1%) |
| Total | 336,076 (100.0%) | 287,754 (100.0%) |
Housing Occupancy in Area Code 973
Occupancy by Ownership in Area Code 973
Of the total 543,145 dwellings in Area Code 973, owner-occupied units account for 281,291 (51.8%), while renter-occupied units make up 261,854 (48.2%).
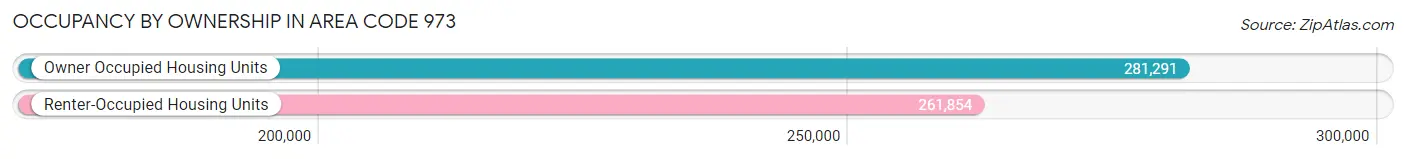
| Occupancy | # Housing Units | % Housing Units |
| Owner Occupied Housing Units | 281,291 | 51.8% |
| Renter-Occupied Housing Units | 261,854 | 48.2% |
| Total Occupied Housing Units | 543,145 | 100.0% |
Occupancy by Household Size in Area Code 973
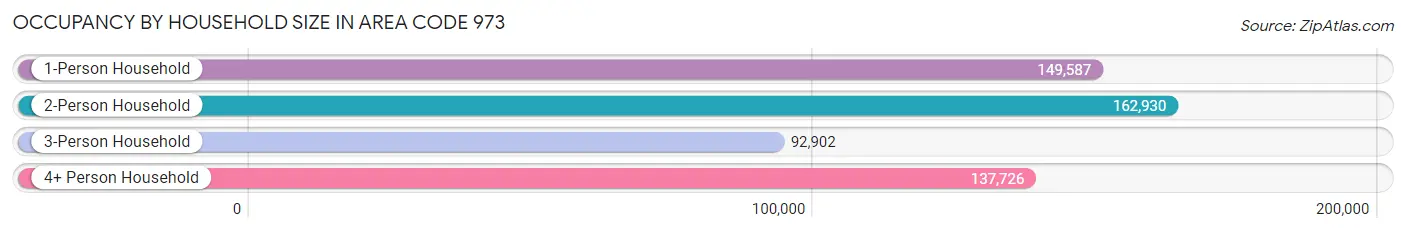
| Household Size | # Housing Units | % Housing Units |
| 1-Person Household | 149,587 | 27.5% |
| 2-Person Household | 162,930 | 30.0% |
| 3-Person Household | 92,902 | 17.1% |
| 4+ Person Household | 137,726 | 25.4% |
| Total Housing Units | 543,145 | 100.0% |
Occupancy by Ownership by Household Size in Area Code 973
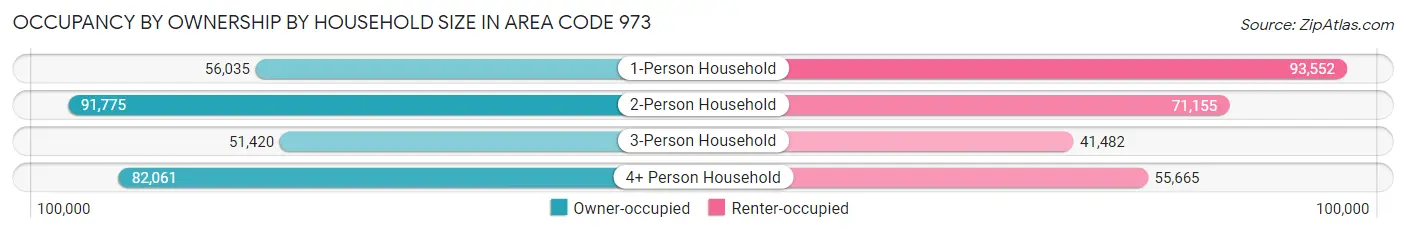
| Household Size | Owner-occupied | Renter-occupied |
| 1-Person Household | 56,035 (37.5%) | 93,552 (62.5%) |
| 2-Person Household | 91,775 (56.3%) | 71,155 (43.7%) |
| 3-Person Household | 51,420 (55.3%) | 41,482 (44.7%) |
| 4+ Person Household | 82,061 (59.6%) | 55,665 (40.4%) |
| Total Housing Units | 281,291 (51.8%) | 261,854 (48.2%) |
Occupancy by Educational Attainment in Area Code 973
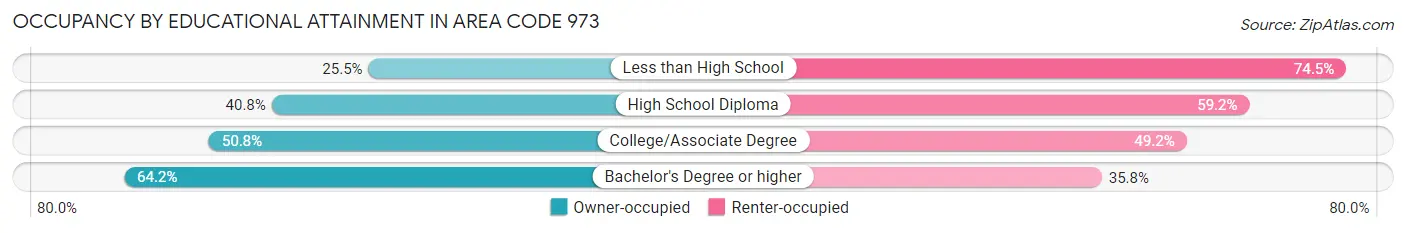
| Household Size | Owner-occupied | Renter-occupied |
| Less than High School | 14,138 (25.5%) | 41,381 (74.5%) |
| High School Diploma | 53,008 (40.8%) | 76,842 (59.2%) |
| College/Associate Degree | 58,919 (50.8%) | 57,121 (49.2%) |
| Bachelor's Degree or higher | 155,226 (64.2%) | 86,510 (35.8%) |
Occupancy by Age of Householder in Area Code 973
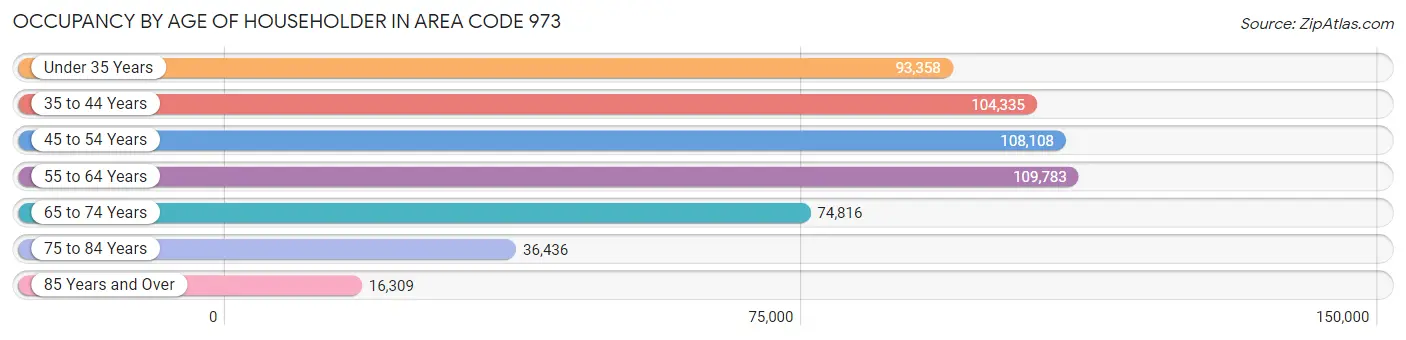
| Age Bracket | # Households | % Households |
| Under 35 Years | 93,358 | 17.2% |
| 35 to 44 Years | 104,335 | 19.2% |
| 45 to 54 Years | 108,108 | 19.9% |
| 55 to 64 Years | 109,783 | 20.2% |
| 65 to 74 Years | 74,816 | 13.8% |
| 75 to 84 Years | 36,436 | 6.7% |
| 85 Years and Over | 16,309 | 3.0% |
| Total | 543,145 | 100.0% |
Housing Finances in Area Code 973
Median Income by Occupancy in Area Code 973

| Occupancy Type | # Households | Median Income |
| Owner-Occupied | 281,291 (51.8%) | $9,819,090 |
| Renter-Occupied | 261,854 (48.2%) | $4,861,391 |
| Average | 543,145 (100.0%) | $8,293,823 |
Occupancy by Householder Income Bracket in Area Code 973
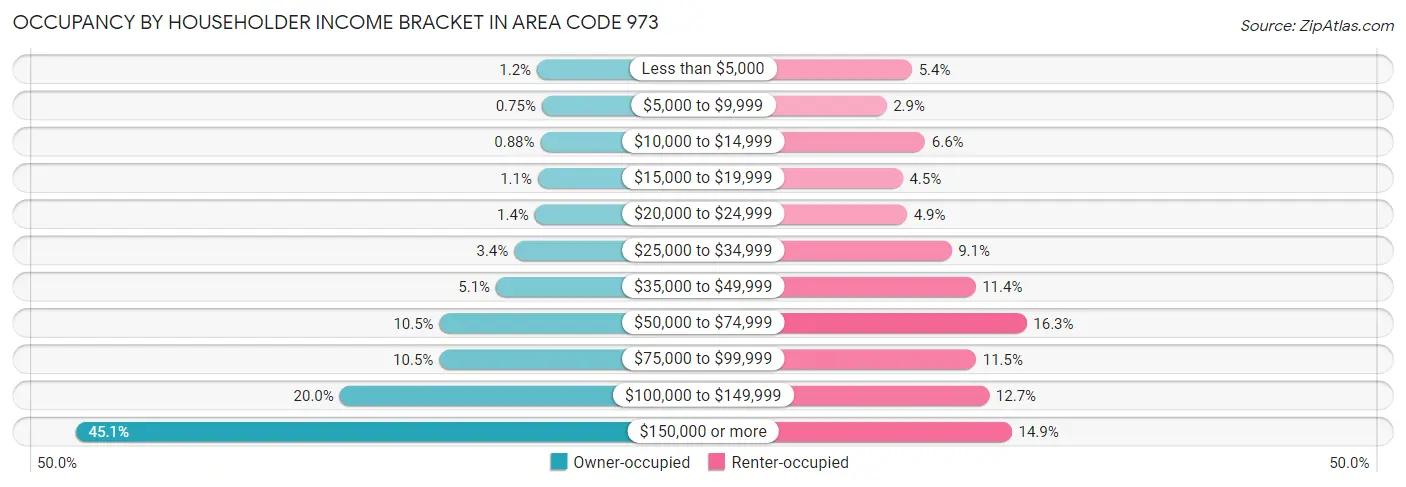
| Income Bracket | Owner-occupied | Renter-occupied |
| Less than $5,000 | 3,390 (1.2%) | 14,015 (5.3%) |
| $5,000 to $9,999 | 2,099 (0.7%) | 7,649 (2.9%) |
| $10,000 to $14,999 | 2,462 (0.9%) | 17,281 (6.6%) |
| $15,000 to $19,999 | 3,147 (1.1%) | 11,695 (4.5%) |
| $20,000 to $24,999 | 4,000 (1.4%) | 12,786 (4.9%) |
| $25,000 to $34,999 | 9,501 (3.4%) | 23,855 (9.1%) |
| $35,000 to $49,999 | 14,378 (5.1%) | 29,846 (11.4%) |
| $50,000 to $74,999 | 29,499 (10.5%) | 42,592 (16.3%) |
| $75,000 to $99,999 | 29,593 (10.5%) | 29,990 (11.5%) |
| $100,000 to $149,999 | 56,261 (20.0%) | 33,244 (12.7%) |
| $150,000 or more | 126,961 (45.1%) | 38,901 (14.9%) |
| Total | 281,291 (100.0%) | 261,854 (100.0%) |
Monthly Housing Cost Tiers in Area Code 973
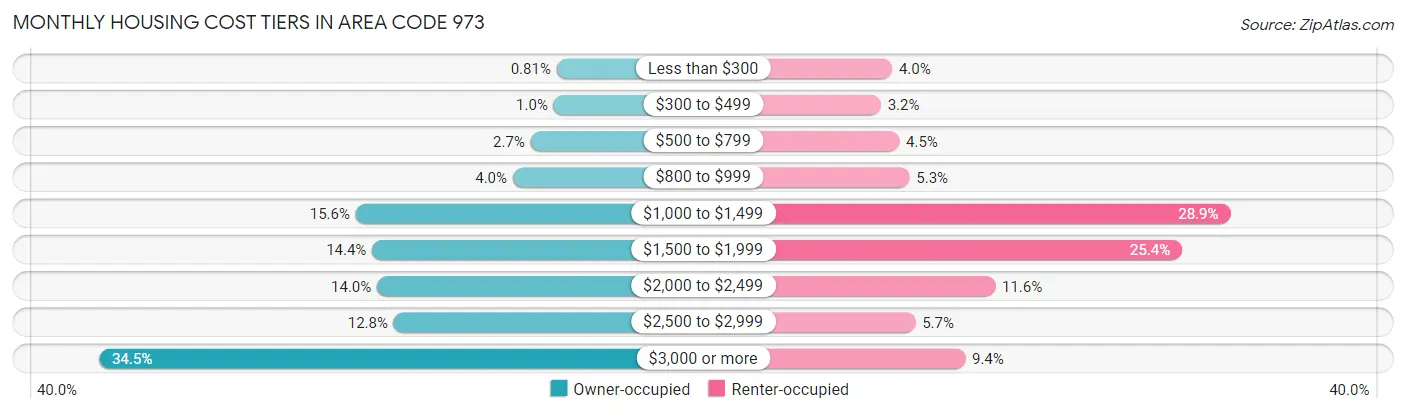
| Monthly Cost | Owner-occupied | Renter-occupied |
| Less than $300 | 2,276 (0.8%) | 10,537 (4.0%) |
| $300 to $499 | 2,907 (1.0%) | 8,351 (3.2%) |
| $500 to $799 | 7,676 (2.7%) | 11,894 (4.5%) |
| $800 to $999 | 11,360 (4.0%) | 13,872 (5.3%) |
| $1,000 to $1,499 | 43,896 (15.6%) | 75,759 (28.9%) |
| $1,500 to $1,999 | 40,517 (14.4%) | 66,449 (25.4%) |
| $2,000 to $2,499 | 39,501 (14.0%) | 30,410 (11.6%) |
| $2,500 to $2,999 | 36,043 (12.8%) | 15,007 (5.7%) |
| $3,000 or more | 97,115 (34.5%) | 24,621 (9.4%) |
| Total | 281,291 (100.0%) | 261,854 (100.0%) |
Physical Housing Characteristics in Area Code 973
Housing Structures in Area Code 973
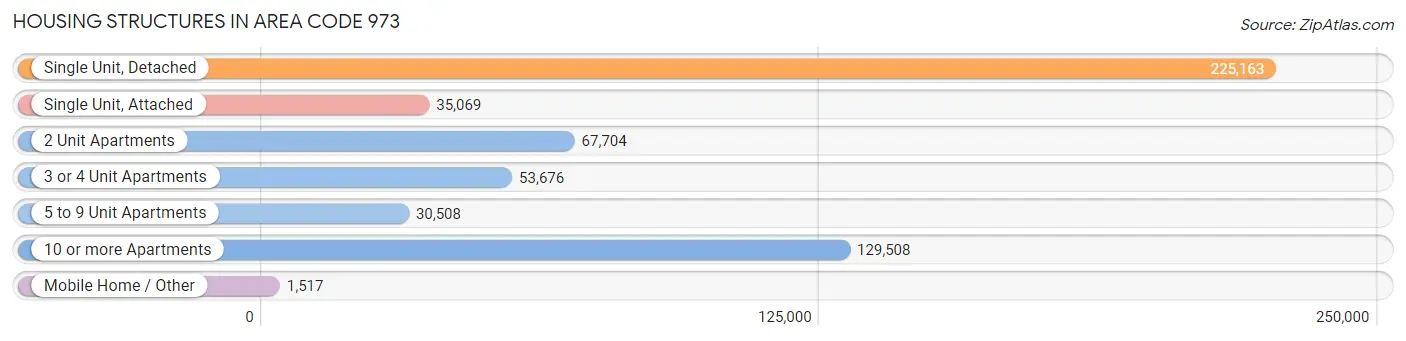
| Structure Type | # Housing Units | % Housing Units |
| Single Unit, Detached | 225,163 | 41.5% |
| Single Unit, Attached | 35,069 | 6.5% |
| 2 Unit Apartments | 67,704 | 12.5% |
| 3 or 4 Unit Apartments | 53,676 | 9.9% |
| 5 to 9 Unit Apartments | 30,508 | 5.6% |
| 10 or more Apartments | 129,508 | 23.8% |
| Mobile Home / Other | 1,517 | 0.3% |
| Total | 543,145 | 100.0% |
Housing Structures by Occupancy in Area Code 973
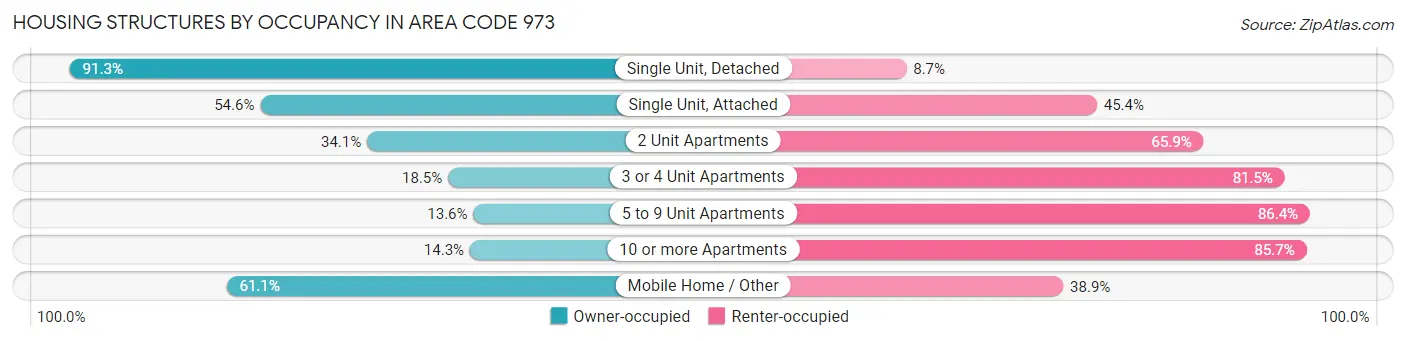
| Structure Type | Owner-occupied | Renter-occupied |
| Single Unit, Detached | 205,616 (91.3%) | 19,547 (8.7%) |
| Single Unit, Attached | 19,159 (54.6%) | 15,910 (45.4%) |
| 2 Unit Apartments | 23,066 (34.1%) | 44,638 (65.9%) |
| 3 or 4 Unit Apartments | 9,908 (18.5%) | 43,768 (81.5%) |
| 5 to 9 Unit Apartments | 4,148 (13.6%) | 26,360 (86.4%) |
| 10 or more Apartments | 18,467 (14.3%) | 111,041 (85.7%) |
| Mobile Home / Other | 927 (61.1%) | 590 (38.9%) |
| Total | 281,291 (51.8%) | 261,854 (48.2%) |
Housing Structures by Number of Rooms in Area Code 973
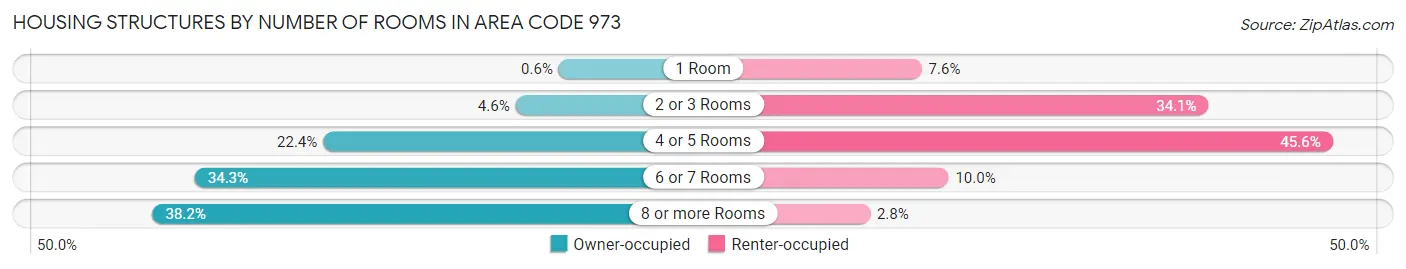
| Number of Rooms | Owner-occupied | Renter-occupied |
| 1 Room | 1,688 (0.6%) | 19,803 (7.6%) |
| 2 or 3 Rooms | 12,929 (4.6%) | 89,204 (34.1%) |
| 4 or 5 Rooms | 62,988 (22.4%) | 119,273 (45.6%) |
| 6 or 7 Rooms | 96,330 (34.3%) | 26,283 (10.0%) |
| 8 or more Rooms | 107,356 (38.2%) | 7,291 (2.8%) |
| Total | 281,291 (100.0%) | 261,854 (100.0%) |
Housing Structure by Heating Type in Area Code 973
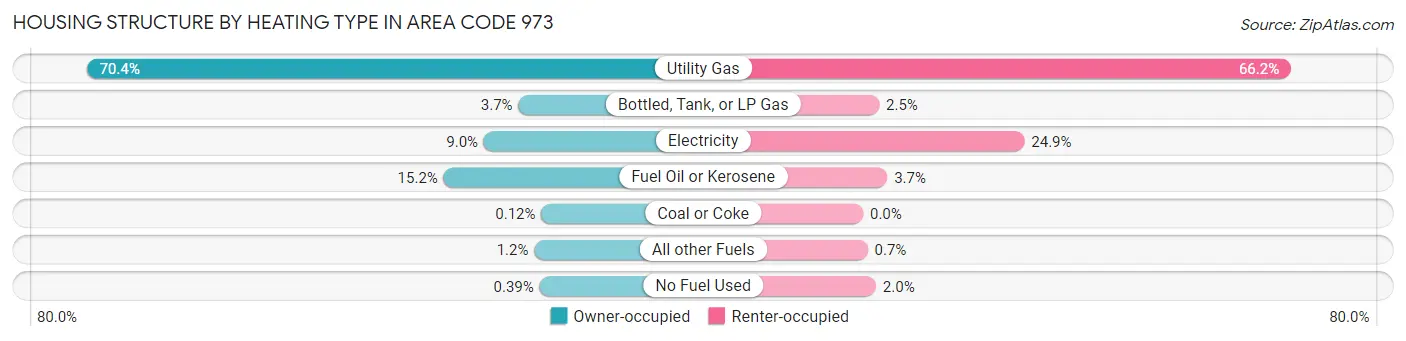
| Heating Type | Owner-occupied | Renter-occupied |
| Utility Gas | 198,112 (70.4%) | 173,228 (66.1%) |
| Bottled, Tank, or LP Gas | 10,285 (3.7%) | 6,491 (2.5%) |
| Electricity | 25,283 (9.0%) | 65,294 (24.9%) |
| Fuel Oil or Kerosene | 42,816 (15.2%) | 9,797 (3.7%) |
| Coal or Coke | 338 (0.1%) | 11 (0.0%) |
| All other Fuels | 3,374 (1.2%) | 1,822 (0.7%) |
| No Fuel Used | 1,083 (0.4%) | 5,211 (2.0%) |
| Total | 281,291 (100.0%) | 261,854 (100.0%) |
Household Vehicle Usage in Area Code 973
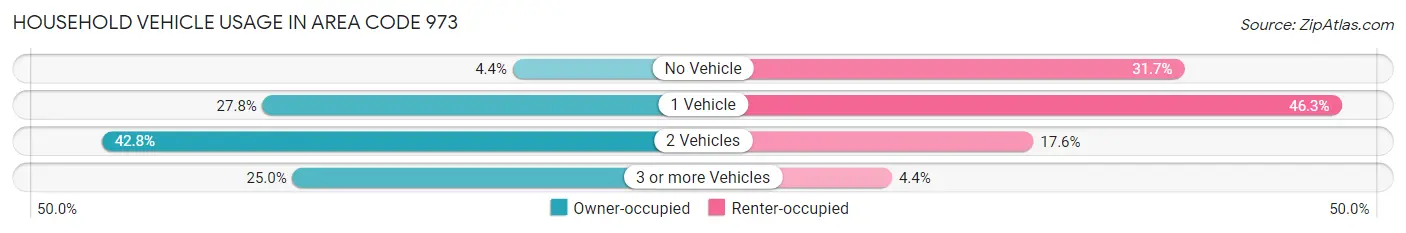
| Vehicles per Household | Owner-occupied | Renter-occupied |
| No Vehicle | 12,456 (4.4%) | 82,965 (31.7%) |
| 1 Vehicle | 78,155 (27.8%) | 121,330 (46.3%) |
| 2 Vehicles | 120,386 (42.8%) | 46,071 (17.6%) |
| 3 or more Vehicles | 70,294 (25.0%) | 11,488 (4.4%) |
| Total | 281,291 (100.0%) | 261,854 (100.0%) |
Real Estate & Mortgages in Area Code 973
Real Estate and Mortgage Overview in Area Code 973
| Characteristic | Without Mortgage | With Mortgage |
| Housing Units | 92,157 | 189,134 |
| Median Property Value | $31,402,200 | $33,988,400 |
| Median Household Income | $7,565,591 | $96,182 |
| Monthly Housing Costs | $88,308 | $94,585 |
| Real Estate Taxes | $632,472 | $3,718 |
Property Value by Mortgage Status in Area Code 973
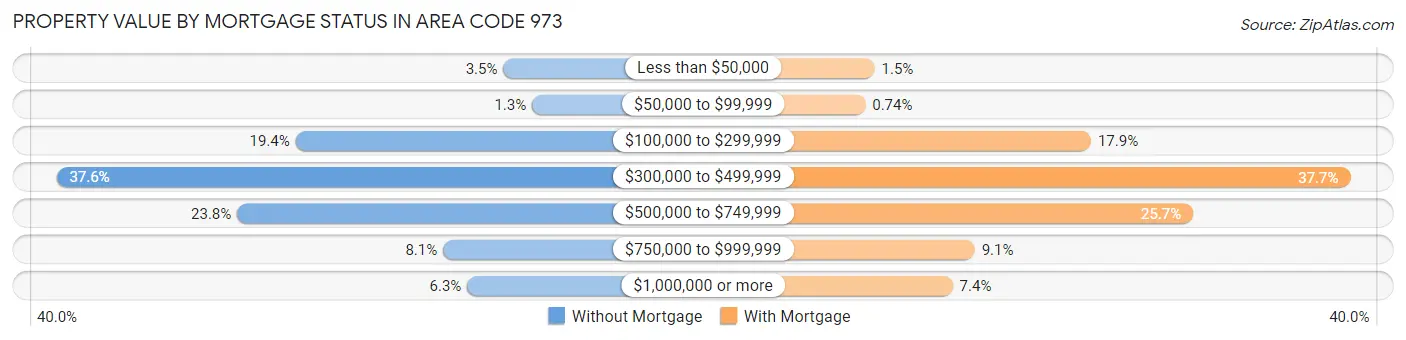
| Property Value | Without Mortgage | With Mortgage |
| Less than $50,000 | 3,254 (3.5%) | 2,742 (1.5%) |
| $50,000 to $99,999 | 1,237 (1.3%) | 1,402 (0.7%) |
| $100,000 to $299,999 | 17,842 (19.4%) | 33,922 (17.9%) |
| $300,000 to $499,999 | 34,623 (37.6%) | 71,280 (37.7%) |
| $500,000 to $749,999 | 21,938 (23.8%) | 48,621 (25.7%) |
| $750,000 to $999,999 | 7,480 (8.1%) | 17,166 (9.1%) |
| $1,000,000 or more | 5,783 (6.3%) | 14,001 (7.4%) |
| Total | 92,157 (100.0%) | 189,134 (100.0%) |
Household Income by Mortgage Status in Area Code 973
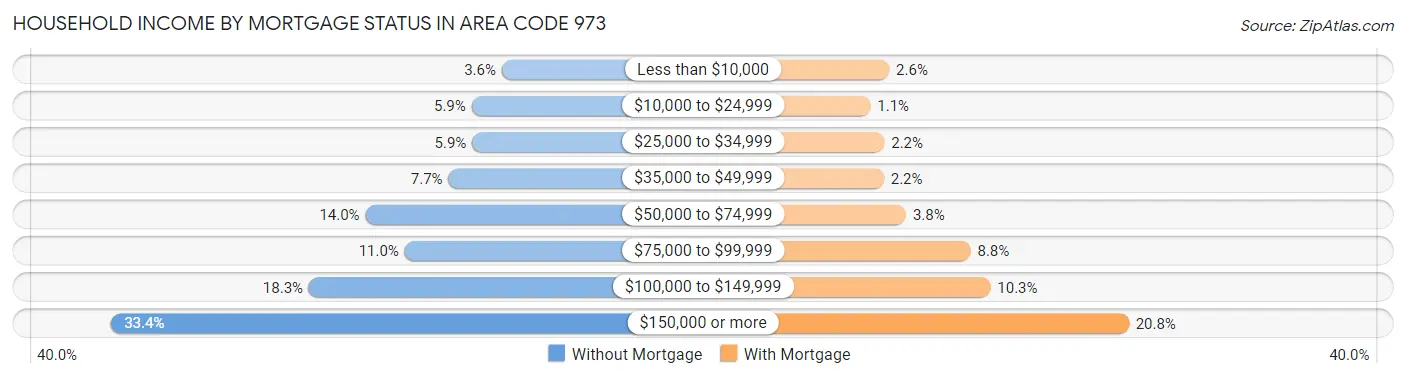
| Household Income | Without Mortgage | With Mortgage |
| Less than $10,000 | 3,353 (3.6%) | 4,846 (2.6%) |
| $10,000 to $24,999 | 5,472 (5.9%) | 2,136 (1.1%) |
| $25,000 to $34,999 | 5,441 (5.9%) | 4,137 (2.2%) |
| $35,000 to $49,999 | 7,108 (7.7%) | 4,060 (2.1%) |
| $50,000 to $74,999 | 12,928 (14.0%) | 7,270 (3.8%) |
| $75,000 to $99,999 | 10,174 (11.0%) | 16,571 (8.8%) |
| $100,000 to $149,999 | 16,902 (18.3%) | 19,419 (10.3%) |
| $150,000 or more | 30,779 (33.4%) | 39,359 (20.8%) |
| Total | 92,157 (100.0%) | 189,134 (100.0%) |
Property Value to Household Income Ratio in Area Code 973
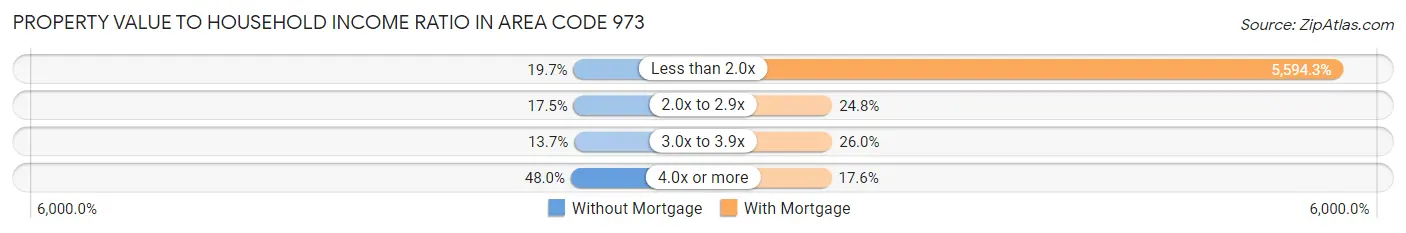
| Value-to-Income Ratio | Without Mortgage | With Mortgage |
| Less than 2.0x | 18,172 (19.7%) | 10,580,718 (5,594.3%) |
| 2.0x to 2.9x | 16,119 (17.5%) | 46,971 (24.8%) |
| 3.0x to 3.9x | 12,635 (13.7%) | 49,089 (26.0%) |
| 4.0x or more | 44,243 (48.0%) | 33,369 (17.6%) |
| Total | 92,157 (100.0%) | 189,134 (100.0%) |
Real Estate Taxes by Mortgage Status in Area Code 973
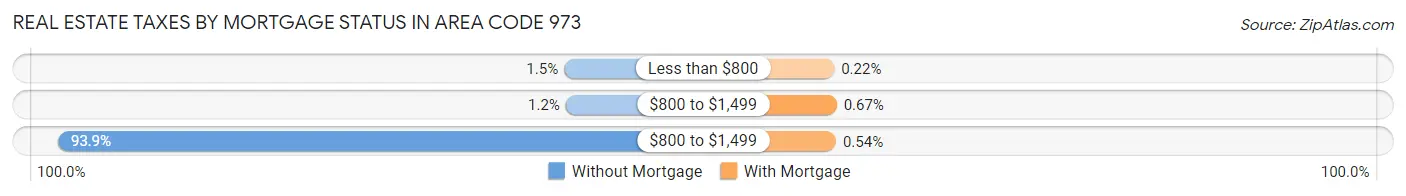
| Property Taxes | Without Mortgage | With Mortgage |
| Less than $800 | 1,365 (1.5%) | 410 (0.2%) |
| $800 to $1,499 | 1,074 (1.2%) | 1,270 (0.7%) |
| $800 to $1,499 | 86,565 (93.9%) | 1,028 (0.5%) |
| Total | 92,157 (100.0%) | 189,134 (100.0%) |
Health & Disability in Area Code 973
Health Insurance Coverage by Age in Area Code 973
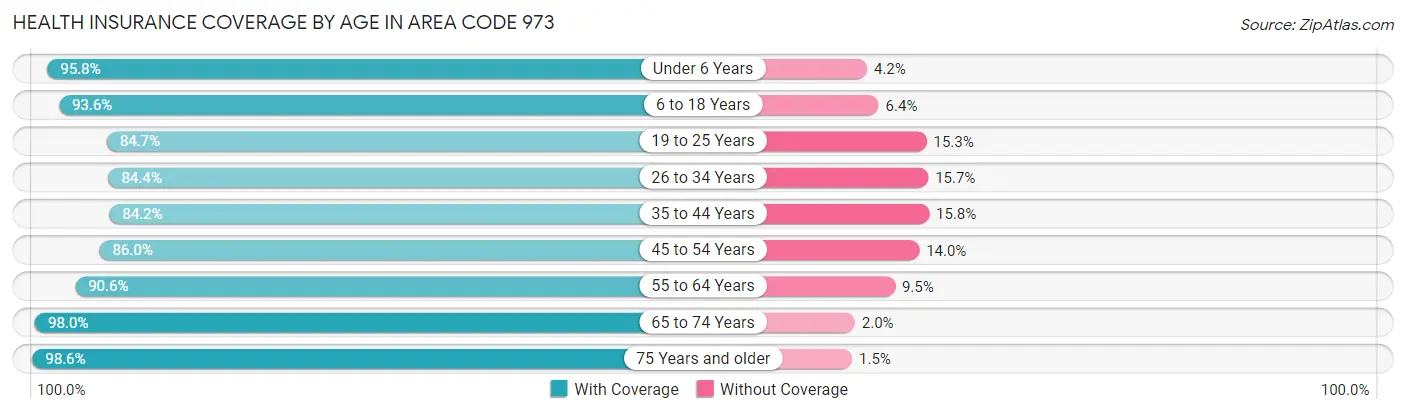
| Age Bracket | With Coverage | Without Coverage |
| Under 6 Years | 103,542 (95.8%) | 4,581 (4.2%) |
| 6 to 18 Years | 218,905 (93.6%) | 15,005 (6.4%) |
| 19 to 25 Years | 108,246 (84.7%) | 19,611 (15.3%) |
| 26 to 34 Years | 157,225 (84.4%) | 29,179 (15.7%) |
| 35 to 44 Years | 167,862 (84.2%) | 31,527 (15.8%) |
| 45 to 54 Years | 166,336 (86.0%) | 27,021 (14.0%) |
| 55 to 64 Years | 170,754 (90.5%) | 17,826 (9.5%) |
| 65 to 74 Years | 120,650 (98.0%) | 2,414 (2.0%) |
| 75 Years and older | 81,889 (98.6%) | 1,202 (1.5%) |
| Total | 1,295,409 (89.7%) | 148,366 (10.3%) |
Health Insurance Coverage by Citizenship Status in Area Code 973
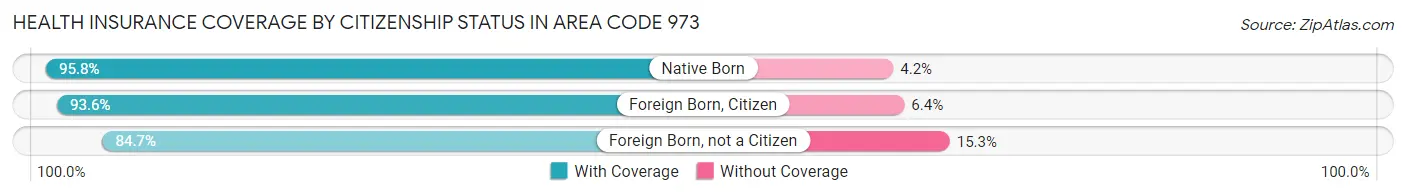
| Citizenship Status | With Coverage | Without Coverage |
| Native Born | 103,542 (95.8%) | 4,581 (4.2%) |
| Foreign Born, Citizen | 218,905 (93.6%) | 15,005 (6.4%) |
| Foreign Born, not a Citizen | 108,246 (84.7%) | 19,611 (15.3%) |
Health Insurance Coverage by Household Income in Area Code 973
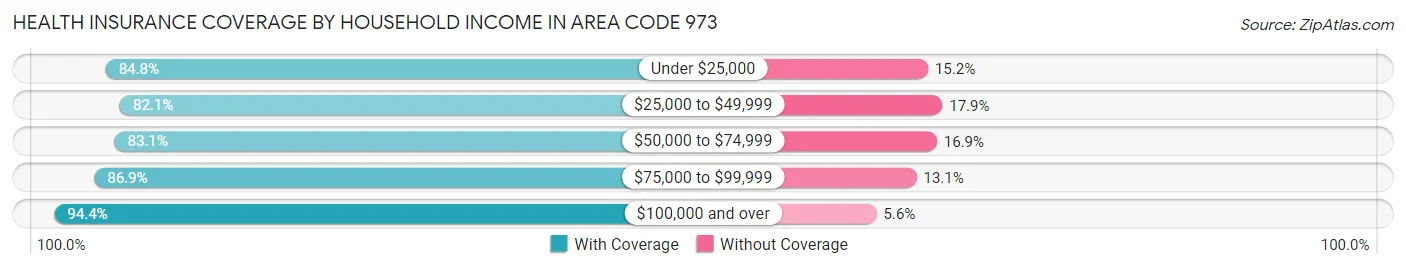
| Household Income | With Coverage | Without Coverage |
| Under $25,000 | 121,952 (84.8%) | 21,874 (15.2%) |
| $25,000 to $49,999 | 146,602 (82.1%) | 31,931 (17.9%) |
| $50,000 to $74,999 | 147,908 (83.1%) | 30,012 (16.9%) |
| $75,000 to $99,999 | 135,998 (86.9%) | 20,452 (13.1%) |
| $100,000 and over | 730,328 (94.4%) | 43,263 (5.6%) |
Public vs Private Health Insurance Coverage by Age in Area Code 973

| Age Bracket | Public Insurance | Private Insurance |
| Under 6 | 44,115 (40.8%) | 62,763 (58.1%) |
| 6 to 18 Years | 88,300 (37.8%) | 138,976 (59.4%) |
| 19 to 25 Years | 27,162 (21.2%) | 83,658 (65.4%) |
| 25 to 34 Years | 30,724 (16.5%) | 129,763 (69.6%) |
| 35 to 44 Years | 30,619 (15.4%) | 141,443 (70.9%) |
| 45 to 54 Years | 29,065 (15.0%) | 140,939 (72.9%) |
| 55 to 64 Years | 36,075 (19.1%) | 140,657 (74.6%) |
| 65 to 74 Years | 110,998 (90.2%) | 65,224 (53.0%) |
| 75 Years and over | 80,506 (96.9%) | 42,819 (51.5%) |
| Total | 477,564 (33.1%) | 946,242 (65.5%) |
Disability Status by Sex by Age in Area Code 973
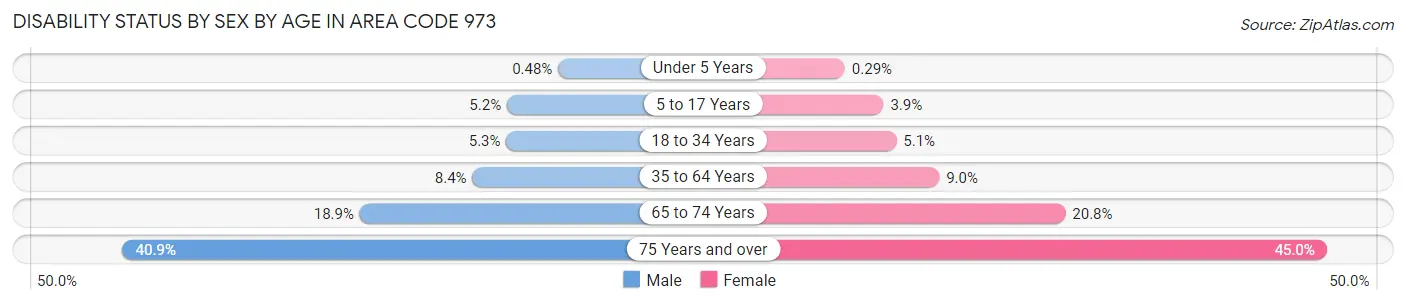
| Age Bracket | Male | Female |
| Under 5 Years | 219 (0.5%) | 127 (0.3%) |
| 5 to 17 Years | 6,241 (5.2%) | 4,411 (3.9%) |
| 18 to 34 Years | 8,924 (5.3%) | 8,348 (5.1%) |
| 35 to 64 Years | 24,191 (8.4%) | 26,632 (9.0%) |
| 65 to 74 Years | 10,857 (18.9%) | 13,607 (20.7%) |
| 75 Years and over | 13,390 (40.9%) | 22,657 (45.0%) |
Disability Class by Sex by Age in Area Code 973
Disability Class: Hearing Difficulty
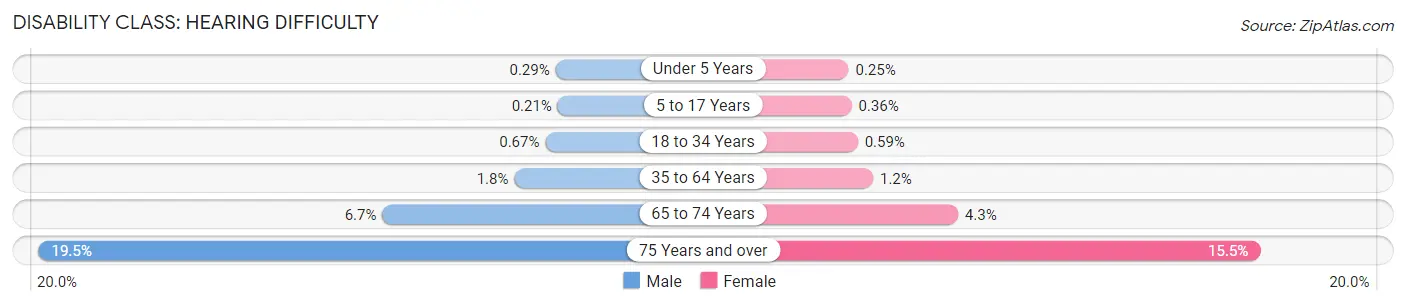
| Age Bracket | Male | Female |
| Under 5 Years | 133 (0.3%) | 107 (0.3%) |
| 5 to 17 Years | 245 (0.2%) | 405 (0.4%) |
| 18 to 34 Years | 1,138 (0.7%) | 977 (0.6%) |
| 35 to 64 Years | 5,217 (1.8%) | 3,417 (1.2%) |
| 65 to 74 Years | 3,863 (6.7%) | 2,827 (4.3%) |
| 75 Years and over | 6,377 (19.5%) | 7,820 (15.5%) |
Disability Class: Vision Difficulty
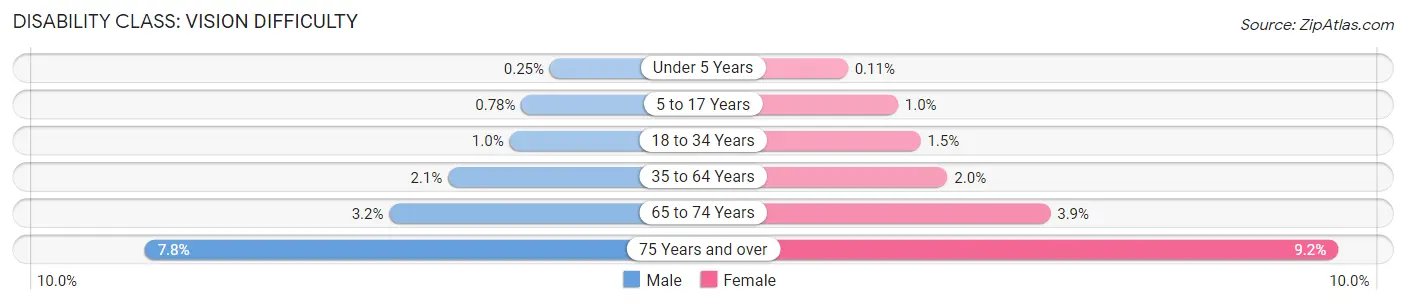
| Age Bracket | Male | Female |
| Under 5 Years | 114 (0.3%) | 49 (0.1%) |
| 5 to 17 Years | 928 (0.8%) | 1,187 (1.0%) |
| 18 to 34 Years | 1,692 (1.0%) | 2,411 (1.5%) |
| 35 to 64 Years | 6,127 (2.1%) | 5,787 (2.0%) |
| 65 to 74 Years | 1,859 (3.2%) | 2,536 (3.9%) |
| 75 Years and over | 2,545 (7.8%) | 4,637 (9.2%) |
Disability Class: Cognitive Difficulty
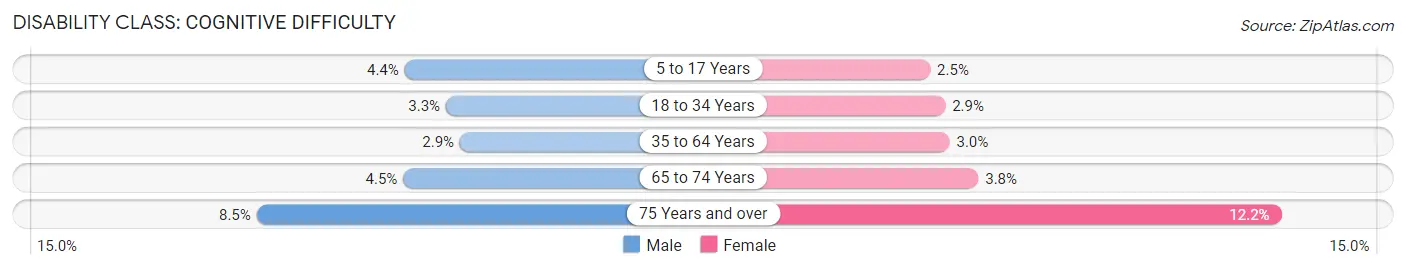
| Age Bracket | Male | Female |
| 5 to 17 Years | 5,276 (4.4%) | 2,802 (2.5%) |
| 18 to 34 Years | 5,523 (3.3%) | 4,755 (2.9%) |
| 35 to 64 Years | 8,271 (2.9%) | 8,830 (3.0%) |
| 65 to 74 Years | 2,564 (4.5%) | 2,490 (3.8%) |
| 75 Years and over | 2,795 (8.5%) | 6,164 (12.2%) |
Disability Class: Ambulatory Difficulty
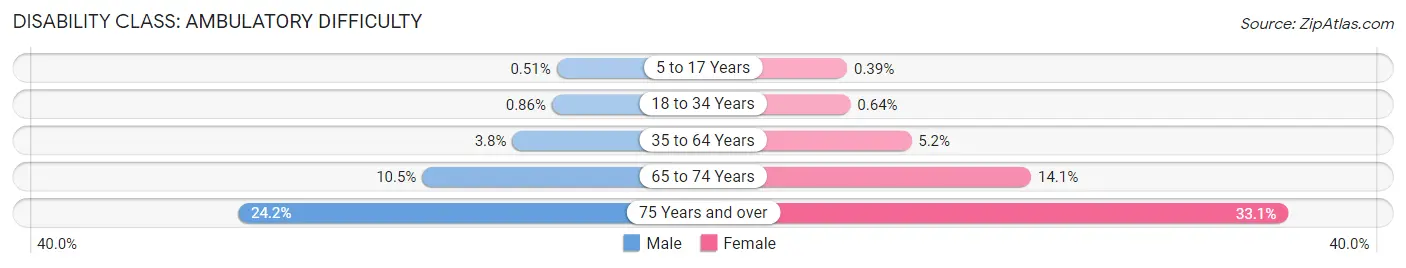
| Age Bracket | Male | Female |
| 5 to 17 Years | 611 (0.5%) | 447 (0.4%) |
| 18 to 34 Years | 1,446 (0.9%) | 1,048 (0.6%) |
| 35 to 64 Years | 10,882 (3.8%) | 15,208 (5.2%) |
| 65 to 74 Years | 6,026 (10.5%) | 9,212 (14.1%) |
| 75 Years and over | 7,908 (24.1%) | 16,682 (33.1%) |
Disability Class: Self-Care Difficulty
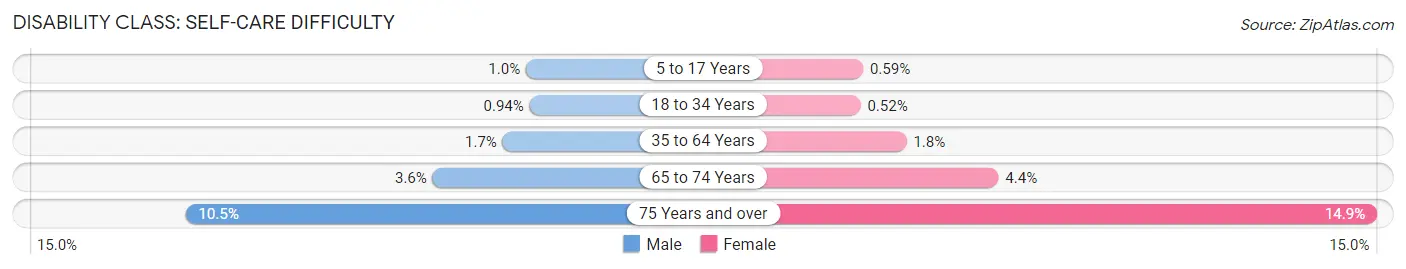
| Age Bracket | Male | Female |
| 5 to 17 Years | 1,236 (1.0%) | 671 (0.6%) |
| 18 to 34 Years | 1,586 (0.9%) | 851 (0.5%) |
| 35 to 64 Years | 4,859 (1.7%) | 5,294 (1.8%) |
| 65 to 74 Years | 2,094 (3.6%) | 2,862 (4.4%) |
| 75 Years and over | 3,444 (10.5%) | 7,500 (14.9%) |
Technology Access in Area Code 973
Computing Device Access in Area Code 973
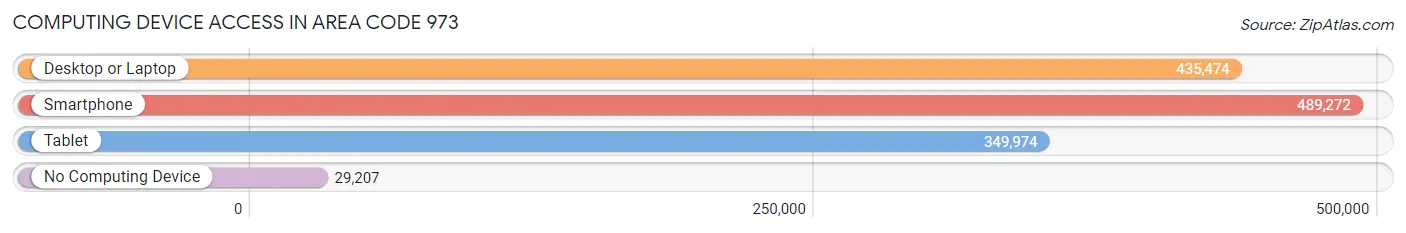
| Device Type | # Households | % Households |
| Desktop or Laptop | 435,474 | 80.2% |
| Smartphone | 489,272 | 90.1% |
| Tablet | 349,974 | 64.4% |
| No Computing Device | 29,207 | 5.4% |
| Total | 543,145 | 100.0% |
Internet Access in Area Code 973
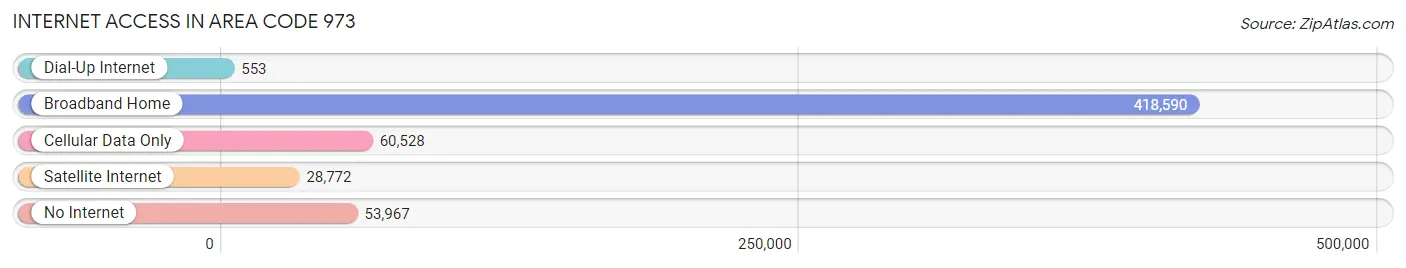
| Internet Type | # Households | % Households |
| Dial-Up Internet | 553 | 0.1% |
| Broadband Home | 418,590 | 77.1% |
| Cellular Data Only | 60,528 | 11.1% |
| Satellite Internet | 28,772 | 5.3% |
| No Internet | 53,967 | 9.9% |
| Total | 543,145 | 100.0% |
Area Code 973 Summary
Geography
Area code 973 is located in the northern part of New Jersey, covering the cities of Newark, Paterson, and Clifton. It is bordered by area codes 201, 551, 862, and 908.
Social
Area code 973 is home to a diverse population of people from all walks of life. The area is known for its vibrant nightlife, with a variety of bars, clubs, and restaurants. It is also home to a number of cultural attractions, including the Newark Museum and the New Jersey Performing Arts Center.
Economics
Area code 973 is a major economic hub in New Jersey, with a number of large corporations and businesses based in the area. It is also home to a number of universities and colleges, including Rutgers University and Seton Hall University.
Demographics
Area code 973 is home to a population of over 1.5 million people, with a median age of 35. The area is predominantly African American, with a large Hispanic population as well. The median household income is $50,000, and the unemployment rate is 6.2%.
Common Questions
What is Per Capita Income in Area Code 973?
Per Capita income in Area Code 973 is $55,726.
What is the Median Family Income in Area Code 973?
Median Family Income in Area Code 973 is $134,473.
What is the Median Household income in Area Code 973?
Median Household Income in Area Code 973 is $113,614.
What is Income or Wage Gap in Area Code 973?
Income or Wage Gap in Area Code 973 is 27.2%.
Women in Area Code 973 earn 72.8 cents for every dollar earned by a man.
What is Family Income Deficit in Area Code 973?
Family Income Deficit in Area Code 973 is $11,056.
Families that are below poverty line in Area Code 973 earn $11,056 less on average than the poverty threshold level.
What is Inequality or Gini Index in Area Code 973?
Inequality or Gini Index in Area Code 973 is 31.19.
What is the Total Population of Area Code 973?
Total Population of Area Code 973 is 1,456,284.
What is the Total Male Population of Area Code 973?
Total Male Population of Area Code 973 is 718,800.
What is the Total Female Population of Area Code 973?
Total Female Population of Area Code 973 is 737,484.
What is the Ratio of Males per 100 Females in Area Code 973?
There are 97.47 Males per 100 Females in Area Code 973.
What is the Ratio of Females per 100 Males in Area Code 973?
There are 102.60 Females per 100 Males in Area Code 973.
What is the Median Population Age in Area Code 973?
Median Population Age in Area Code 973 is 40.8 Years.
What is the Average Family Size in Area Code 973
Average Family Size in Area Code 973 is 3.2 People.
What is the Average Household Size in Area Code 973
Average Household Size in Area Code 973 is 2.6 People.
How Large is the Labor Force in Area Code 973?
There are 792,182 People in the Labor Forcein in Area Code 973.
What is the Percentage of People in the Labor Force in Area Code 973?
67.7% of People are in the Labor Force in Area Code 973.
What is the Unemployment Rate in Area Code 973?
Unemployment Rate in Area Code 973 is 6.9%.