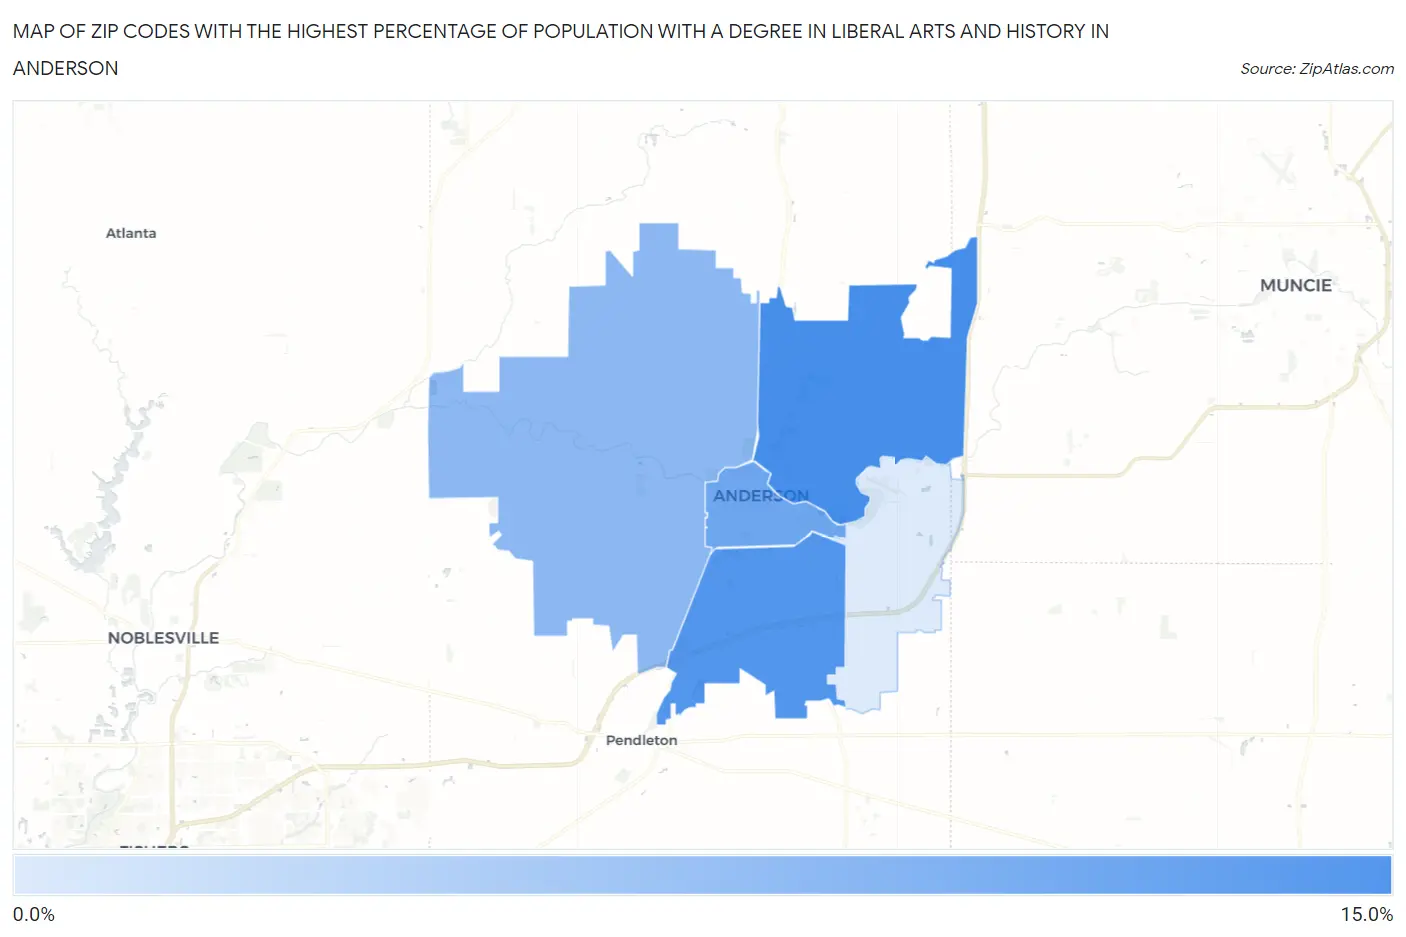
Zip Codes with the Highest Percentage of Population with a Degree in Liberal Arts and History in Anderson, IN
RELATED REPORTS & OPTIONS
Liberal Arts and History
Anderson
Compare Zip Codes
Map of Zip Codes with the Highest Percentage of Population with a Degree in Liberal Arts and History in Anderson
1.8%
11.7%
Zip Codes with the Highest Percentage of Population with a Degree in Liberal Arts and History in Anderson, IN
| Zip Code | % Graduates | vs State | vs National | |
| 1. | 46012 | 11.7% | 5.8%(+5.92)#77 | 4.9%(+6.88)#2,281 |
| 2. | 46013 | 11.0% | 5.8%(+5.17)#89 | 4.9%(+6.12)#2,561 |
| 3. | 46016 | 9.1% | 5.8%(+3.29)#140 | 4.9%(+4.24)#3,739 |
| 4. | 46011 | 7.0% | 5.8%(+1.20)#232 | 4.9%(+2.15)#6,355 |
| 5. | 46017 | 1.8% | 5.8%(-3.99)#546 | 4.9%(-3.04)#21,760 |
1
Common Questions
What are the Top 3 Zip Codes with the Highest Percentage of Population with a Degree in Liberal Arts and History in Anderson, IN?
Top 3 Zip Codes with the Highest Percentage of Population with a Degree in Liberal Arts and History in Anderson, IN are:
What zip code has the Highest Percentage of Population with a Degree in Liberal Arts and History in Anderson, IN?
46012 has the Highest Percentage of Population with a Degree in Liberal Arts and History in Anderson, IN with 11.7%.
What is the Percentage of Population with a Degree in Liberal Arts and History in Anderson, IN?
Percentage of Population with a Degree in Liberal Arts and History in Anderson is 9.8%.
What is the Percentage of Population with a Degree in Liberal Arts and History in Indiana?
Percentage of Population with a Degree in Liberal Arts and History in Indiana is 5.8%.
What is the Percentage of Population with a Degree in Liberal Arts and History in the United States?
Percentage of Population with a Degree in Liberal Arts and History in the United States is 4.9%.