Zip Codes with the Highest Percentage of Population with a Degree in Liberal Arts and History in Muncie, IN
RELATED REPORTS & OPTIONS
Liberal Arts and History
Muncie
Compare Zip Codes
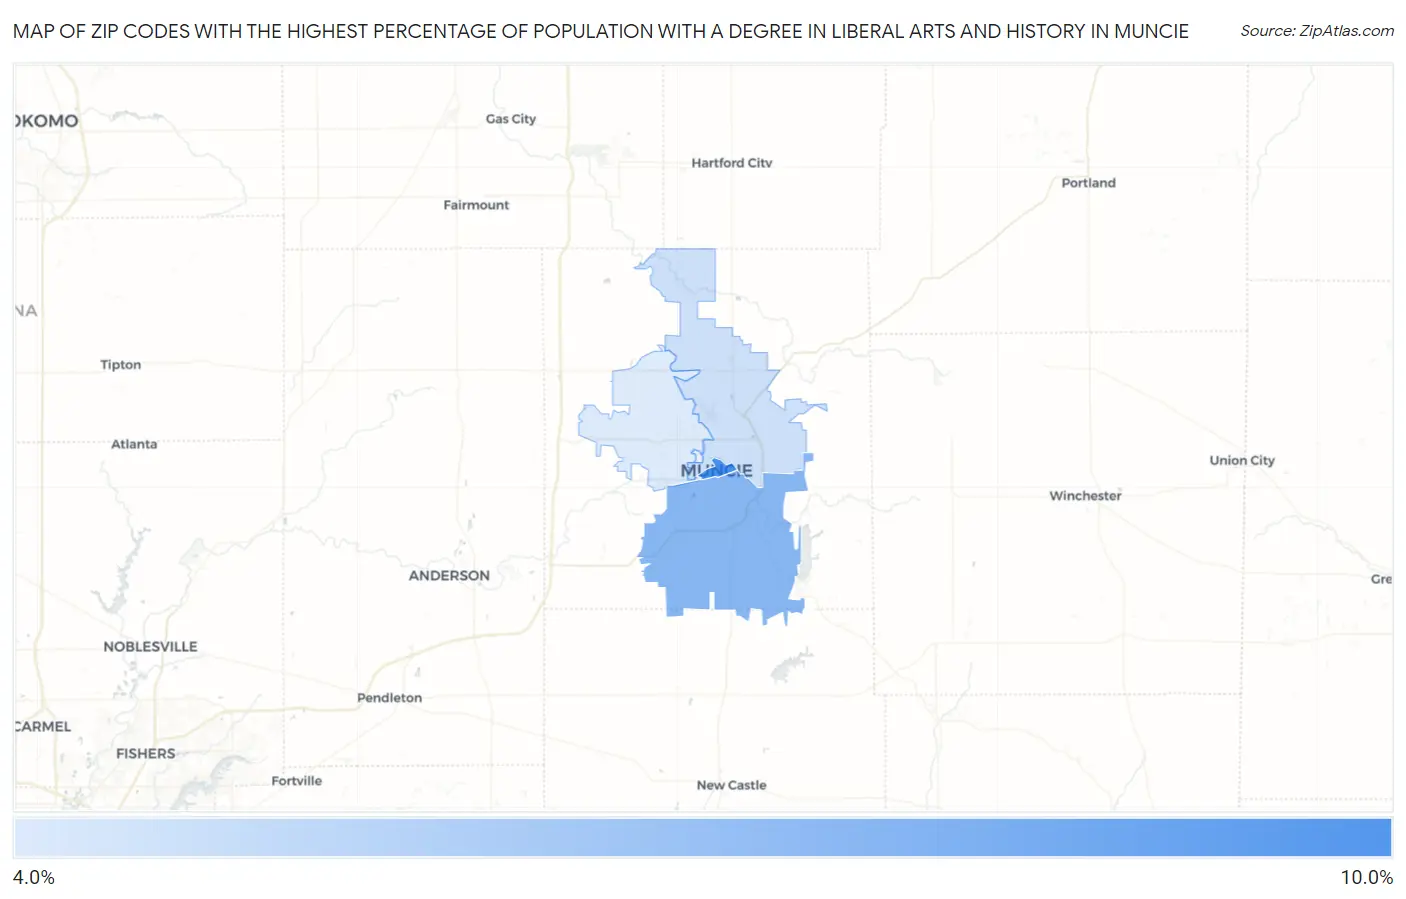
Map of Zip Codes with the Highest Percentage of Population with a Degree in Liberal Arts and History in Muncie
4.7%
9.7%
Zip Codes with the Highest Percentage of Population with a Degree in Liberal Arts and History in Muncie, IN
| Zip Code | % Graduates | vs State | vs National | |
| 1. | 47305 | 9.7% | 5.8%(+3.89)#122 | 4.9%(+4.85)#3,292 |
| 2. | 47302 | 7.5% | 5.8%(+1.66)#209 | 4.9%(+2.61)#5,607 |
| 3. | 47303 | 5.2% | 5.8%(-0.598)#337 | 4.9%(+0.354)#10,662 |
| 4. | 47304 | 4.7% | 5.8%(-1.17)#375 | 4.9%(-0.218)#12,470 |
1
Common Questions
What are the Top 3 Zip Codes with the Highest Percentage of Population with a Degree in Liberal Arts and History in Muncie, IN?
Top 3 Zip Codes with the Highest Percentage of Population with a Degree in Liberal Arts and History in Muncie, IN are:
What zip code has the Highest Percentage of Population with a Degree in Liberal Arts and History in Muncie, IN?
47305 has the Highest Percentage of Population with a Degree in Liberal Arts and History in Muncie, IN with 9.7%.
What is the Percentage of Population with a Degree in Liberal Arts and History in Muncie, IN?
Percentage of Population with a Degree in Liberal Arts and History in Muncie is 5.2%.
What is the Percentage of Population with a Degree in Liberal Arts and History in Indiana?
Percentage of Population with a Degree in Liberal Arts and History in Indiana is 5.8%.
What is the Percentage of Population with a Degree in Liberal Arts and History in the United States?
Percentage of Population with a Degree in Liberal Arts and History in the United States is 4.9%.