Zip Codes with the Highest Percentage of Population with a Degree in Liberal Arts and History in Columbus, IN
RELATED REPORTS & OPTIONS
Liberal Arts and History
Columbus
Compare Zip Codes
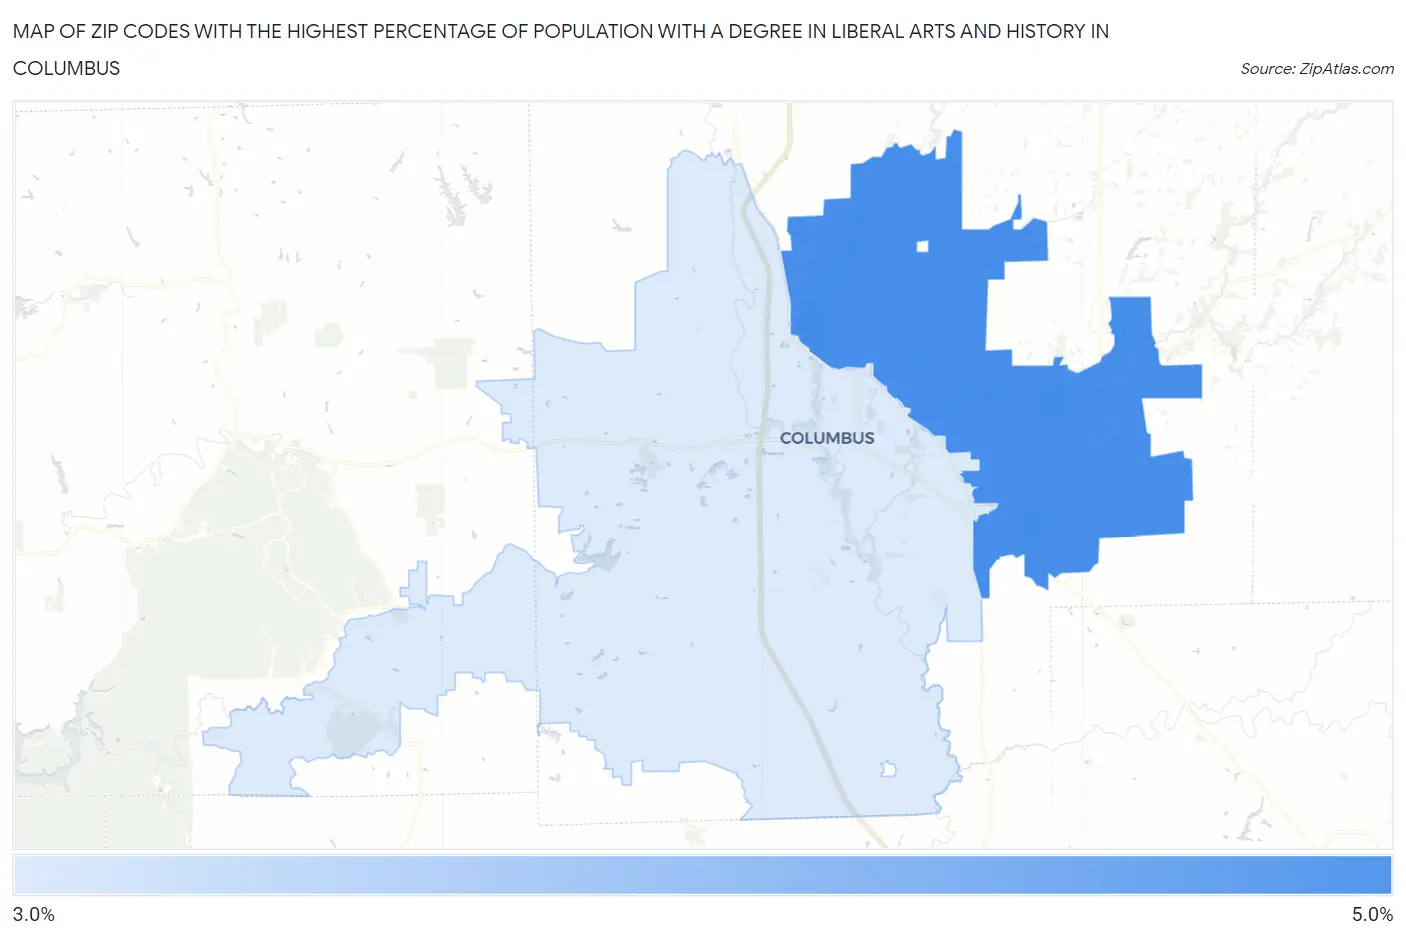
Map of Zip Codes with the Highest Percentage of Population with a Degree in Liberal Arts and History in Columbus
3.2%
4.2%
Zip Codes with the Highest Percentage of Population with a Degree in Liberal Arts and History in Columbus, IN
| Zip Code | % Graduates | vs State | vs National | |
| 1. | 47203 | 4.2% | 5.8%(-1.61)#398 | 4.9%(-0.656)#13,952 |
| 2. | 47201 | 3.2% | 5.8%(-2.61)#472 | 4.9%(-1.66)#17,611 |
1
Common Questions
What are the Top Zip Codes with the Highest Percentage of Population with a Degree in Liberal Arts and History in Columbus, IN?
Top Zip Codes with the Highest Percentage of Population with a Degree in Liberal Arts and History in Columbus, IN are:
What zip code has the Highest Percentage of Population with a Degree in Liberal Arts and History in Columbus, IN?
47203 has the Highest Percentage of Population with a Degree in Liberal Arts and History in Columbus, IN with 4.2%.
What is the Percentage of Population with a Degree in Liberal Arts and History in Columbus, IN?
Percentage of Population with a Degree in Liberal Arts and History in Columbus is 3.6%.
What is the Percentage of Population with a Degree in Liberal Arts and History in Indiana?
Percentage of Population with a Degree in Liberal Arts and History in Indiana is 5.8%.
What is the Percentage of Population with a Degree in Liberal Arts and History in the United States?
Percentage of Population with a Degree in Liberal Arts and History in the United States is 4.9%.