Zip Codes with the Highest Percentage of Population with a Degree in Liberal Arts and History in Indianapolis, IN

RELATED REPORTS & OPTIONS

Liberal Arts and History
Population
Families and Households
Female Fertility
Female Fertility (Unmarried)
Race (Community Size)
Race (Percentage)
Ancestry (Community Size)
AfghanAfricanAlaskan AthabascanAlbanianAlsatianAmericanApacheArabArgentineanArmenianAustralianAustrianBahamianBangladeshiBarbadianBasqueBelgianBelizeanBhutaneseBlackfeetBolivianBrazilianBritishBritish West IndianBulgarianBurmeseCajunCanadianCelticCentral AmericanCentral American IndianCherokeeChickasawChileanChippewaChoctawColombianCosta RicanCroatianCrowCubanCzechCzechoslovakianDanishDominicanDutchEastern EuropeanEcuadorianEgyptianEnglishEstonianEthiopianEuropeanFilipinoFinnishFrenchFrench CanadianGermanGerman RussianGhanaianGreekGuamanian / ChamorroGuatemalanGuyaneseHaitianHonduranHopiHungarianIcelanderIndian (Asian)IndonesianInupiatIranianIraqiIrishIroquoisIsraeliItalianJamaicanJapaneseJordanianKenyanKoreanLaotianLatvianLebaneseLiberianLithuanianLuxembourgerMacedonianMalaysianMenomineeMexicanMexican American IndianMongolianMoroccanNative HawaiianNavajoNew ZealanderNicaraguanNigerianNorthern EuropeanNorwegianPakistaniPalestinianPanamanianPennsylvania GermanPeruvianPolishPortuguesePotawatomiPuerto RicanRomanianRussianSalvadoranSamoanScandinavianScotch-IrishScottishSeminoleSenegaleseSerbianSierra LeoneanSiouxSlavicSlovakSloveneSouth AfricanSouth AmericanSouth American IndianSpaniardSpanishSri LankanSubsaharan AfricanSudaneseSwedishSwissSyrianThaiTonganTrinidadian and TobagonianTurkishUgandanUkrainianUruguayanVenezuelanVietnameseWelshWest IndianYugoslavianZimbabwean
Ancestry (Percentage)
AfghanAfricanAlaskan AthabascanAlbanianAlsatianAmericanApacheArabArgentineanArmenianAustralianAustrianBahamianBangladeshiBarbadianBasqueBelgianBelizeanBhutaneseBlackfeetBolivianBrazilianBritishBritish West IndianBulgarianBurmeseCajunCanadianCelticCentral AmericanCentral American IndianCherokeeChickasawChileanChippewaChoctawColombianCosta RicanCroatianCrowCubanCzechCzechoslovakianDanishDominicanDutchEastern EuropeanEcuadorianEgyptianEnglishEstonianEthiopianEuropeanFilipinoFinnishFrenchFrench CanadianGermanGerman RussianGhanaianGreekGuamanian / ChamorroGuatemalanGuyaneseHaitianHonduranHopiHungarianIcelanderIndian (Asian)IndonesianInupiatIranianIraqiIrishIroquoisIsraeliItalianJamaicanJapaneseJordanianKenyanKoreanLaotianLatvianLebaneseLiberianLithuanianLuxembourgerMacedonianMalaysianMenomineeMexicanMexican American IndianMongolianMoroccanNative HawaiianNavajoNew ZealanderNicaraguanNigerianNorthern EuropeanNorwegianPakistaniPalestinianPanamanianPennsylvania GermanPeruvianPolishPortuguesePotawatomiPuerto RicanRomanianRussianSalvadoranSamoanScandinavianScotch-IrishScottishSeminoleSenegaleseSerbianSierra LeoneanSiouxSlavicSlovakSloveneSouth AfricanSouth AmericanSouth American IndianSpaniardSpanishSri LankanSubsaharan AfricanSudaneseSwedishSwissSyrianThaiTonganTrinidadian and TobagonianTurkishUgandanUkrainianUruguayanVenezuelanVietnameseWelshWest IndianYugoslavianZimbabwean
Immigrant Origin (Total)
AfghanistanAfricaArgentinaAsiaAustraliaAustriaBahamasBangladeshBarbadosBelarusBoliviaBosnia and HerzegovinaBrazilBulgariaBurma / MyanmarCambodiaCameroonCanadaCaribbeanCentral AmericaChileChinaColombiaCongoCosta RicaCubaDenmarkDominican RepublicEastern AfricaEastern AsiaEastern EuropeEcuadorEgyptEl SalvadorEnglandEritreaEthiopiaEuropeFranceGermanyGhanaGreeceGuatemalaGuyanaHaitiHondurasHong KongHungaryIndiaIndonesiaIranIraqIrelandIsraelItalyJamaicaJapanJordanKenyaKoreaLaosLatin AmericaLatviaLebanonLiberiaMalaysiaMexicoMiddle AfricaMoldovaMoroccoNepalNetherlandsNicaraguaNigeriaNorth MacedoniaNorthern AfricaNorthern EuropeNorwayOceaniaPakistanPanamaPeruPhilippinesPolandPortugalRomaniaRussiaSaudi ArabiaScotlandSenegalSerbiaSierra LeoneSingaporeSouth AfricaSouth AmericaSouth Central AsiaSouth Eastern AsiaSouthern EuropeSpainSt. Vincent and the GrenadinesSudanSyriaTaiwanThailandTrinidad and TobagoTurkeyUgandaUkraineUzbekistanVenezuelaVietnamWest IndiesWestern AfricaWestern AsiaWestern EuropeYemenZaireZimbabwe
Immigrant Origin (Percentage)
AfghanistanAfricaArgentinaAsiaAustraliaAustriaBahamasBangladeshBarbadosBelarusBoliviaBosnia and HerzegovinaBrazilBulgariaBurma / MyanmarCambodiaCameroonCanadaCaribbeanCentral AmericaChileChinaColombiaCongoCosta RicaCubaDenmarkDominican RepublicEastern AfricaEastern AsiaEastern EuropeEcuadorEgyptEl SalvadorEnglandEritreaEthiopiaEuropeFranceGermanyGhanaGreeceGuatemalaGuyanaHaitiHondurasHong KongHungaryIndiaIndonesiaIranIraqIrelandIsraelItalyJamaicaJapanJordanKenyaKoreaLaosLatin AmericaLatviaLebanonLiberiaMalaysiaMexicoMiddle AfricaMoldovaMoroccoNepalNetherlandsNicaraguaNigeriaNorth MacedoniaNorthern AfricaNorthern EuropeNorwayOceaniaPakistanPanamaPeruPhilippinesPolandPortugalRomaniaRussiaSaudi ArabiaScotlandSenegalSerbiaSierra LeoneSingaporeSouth AfricaSouth AmericaSouth Central AsiaSouth Eastern AsiaSouthern EuropeSpainSt. Vincent and the GrenadinesSudanSyriaTaiwanThailandTrinidad and TobagoTurkeyUgandaUkraineUzbekistanVenezuelaVietnamWest IndiesWestern AfricaWestern AsiaWestern EuropeYemenZaireZimbabwe
Income
Income (Families)
Income (Households)
Poverty
Poverty (Families)
Unemployment
Employment Occupations
Employment Industries
Employer Class
Commute Time
Commute Means
School Enrollment
Education by Degree Field
Occupancy
Finances
Physical Characteristics
Indianapolis
Compare Zip Codes
Comparison Subject

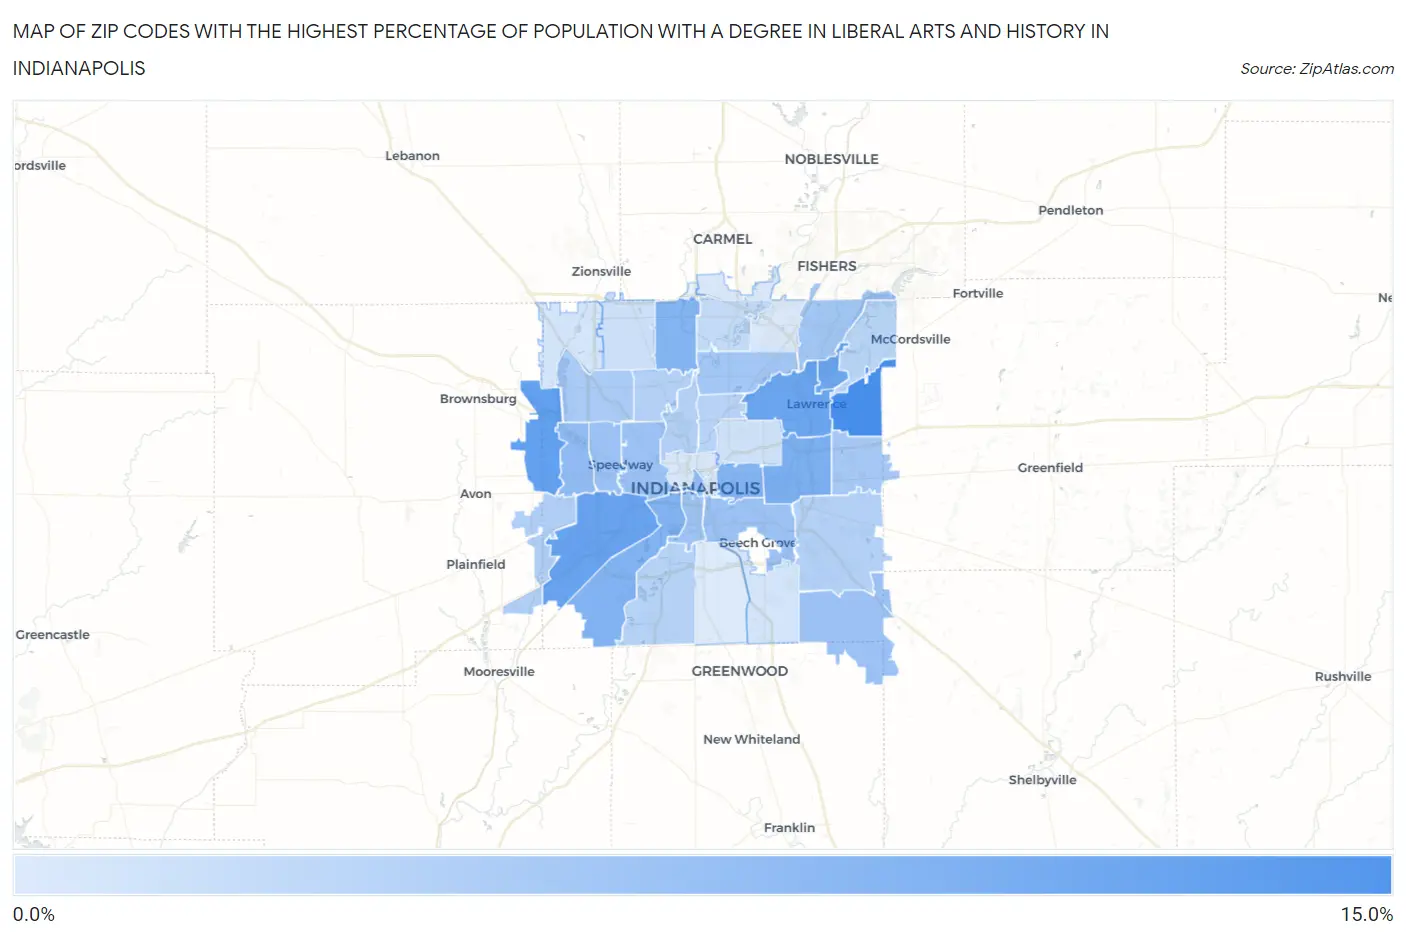
Map of Zip Codes with the Highest Percentage of Population with a Degree in Liberal Arts and History in Indianapolis

0.0%
15.0%
Zip Codes with the Highest Percentage of Population with a Degree in Liberal Arts and History in Indianapolis Map

Zip Codes with the Highest Percentage of Population with a Degree in Liberal Arts and History in Indianapolis, IN

Zip Code % Graduates vs State vs National
1.4623512.7%5.8%(+6.86)#624.9%(+7.81)#1,991
2.4623410.8%5.8%(+4.97)#964.9%(+5.92)#2,650
3.4624110.6%5.8%(+4.75)#1044.9%(+5.70)#2,779
4.4622610.3%5.8%(+4.49)#1124.9%(+5.45)#2,920
5.4621610.0%5.8%(+4.22)#1164.9%(+5.17)#3,081
6.462199.2%5.8%(+3.37)#1394.9%(+4.32)#3,687
7.462219.0%5.8%(+3.17)#1454.9%(+4.12)#3,861
8.462018.7%5.8%(+2.91)#1564.9%(+3.87)#4,094
9.462608.7%5.8%(+2.90)#1584.9%(+3.85)#4,104
10.462047.9%5.8%(+2.06)#1944.9%(+3.01)#5,058
11.462147.9%5.8%(+2.04)#1954.9%(+3.00)#5,073
12.462227.4%5.8%(+1.53)#2144.9%(+2.49)#5,787
13.462037.3%5.8%(+1.46)#2164.9%(+2.41)#5,900
14.462597.2%5.8%(+1.41)#2204.9%(+2.36)#5,997
15.462247.1%5.8%(+1.30)#2284.9%(+2.25)#6,193
16.462257.0%5.8%(+1.13)#2344.9%(+2.08)#6,461
17.462566.7%5.8%(+0.921)#2484.9%(+1.87)#6,840
18.462206.7%5.8%(+0.854)#2514.9%(+1.81)#6,987
19.462296.6%5.8%(+0.742)#2614.9%(+1.69)#7,217
20.462546.4%5.8%(+0.536)#2684.9%(+1.49)#7,649
21.462315.8%5.8%(-0.011)#3014.9%(+0.941)#9,008
22.462085.7%5.8%(-0.115)#3094.9%(+0.837)#9,287
23.462395.7%5.8%(-0.132)#3114.9%(+0.820)#9,322
24.462285.7%5.8%(-0.164)#3134.9%(+0.788)#9,410
25.462175.6%5.8%(-0.201)#3154.9%(+0.751)#9,507
26.462055.4%5.8%(-0.380)#3284.9%(+0.572)#10,022
27.462365.3%5.8%(-0.487)#3324.9%(+0.466)#10,316
28.462404.8%5.8%(-1.04)#3604.9%(-0.085)#12,013
29.462684.1%5.8%(-1.73)#4064.9%(-0.779)#14,432
30.462184.0%5.8%(-1.86)#4164.9%(-0.907)#14,922
31.462783.7%5.8%(-2.11)#4374.9%(-1.16)#15,838
32.462373.7%5.8%(-2.14)#4424.9%(-1.18)#15,957
33.462803.5%5.8%(-2.32)#4544.9%(-1.37)#16,574
34.462023.4%5.8%(-2.38)#4594.9%(-1.42)#16,787
35.462503.3%5.8%(-2.52)#4674.9%(-1.56)#17,288
36.462273.2%5.8%(-2.66)#4734.9%(-1.71)#17,775

Common Questions

What are the Top 10 Zip Codes with the Highest Percentage of Population with a Degree in Liberal Arts and History in Indianapolis, IN?
Top 10 Zip Codes with the Highest Percentage of Population with a Degree in Liberal Arts and History in Indianapolis, IN are:
#1
12.7%
#2
10.8%
#3
10.6%
#4
10.3%
#5
10.0%
#6
9.2%
#7
9.0%
#8
8.7%
#9
8.7%
#10
7.9%
What zip code has the Highest Percentage of Population with a Degree in Liberal Arts and History in Indianapolis, IN?
46235 has the Highest Percentage of Population with a Degree in Liberal Arts and History in Indianapolis, IN with 12.7%.
What is the Percentage of Population with a Degree in Liberal Arts and History in Indianapolis, IN?
Percentage of Population with a Degree in Liberal Arts and History in Indianapolis is 6.4%.
What is the Percentage of Population with a Degree in Liberal Arts and History in Indiana?
Percentage of Population with a Degree in Liberal Arts and History in Indiana is 5.8%.
What is the Percentage of Population with a Degree in Liberal Arts and History in the United States?
Percentage of Population with a Degree in Liberal Arts and History in the United States is 4.9%.