Zip Codes with the Highest Percentage of Population with a Degree in Liberal Arts and History in Hammond, IN
RELATED REPORTS & OPTIONS
Liberal Arts and History
Hammond
Compare Zip Codes
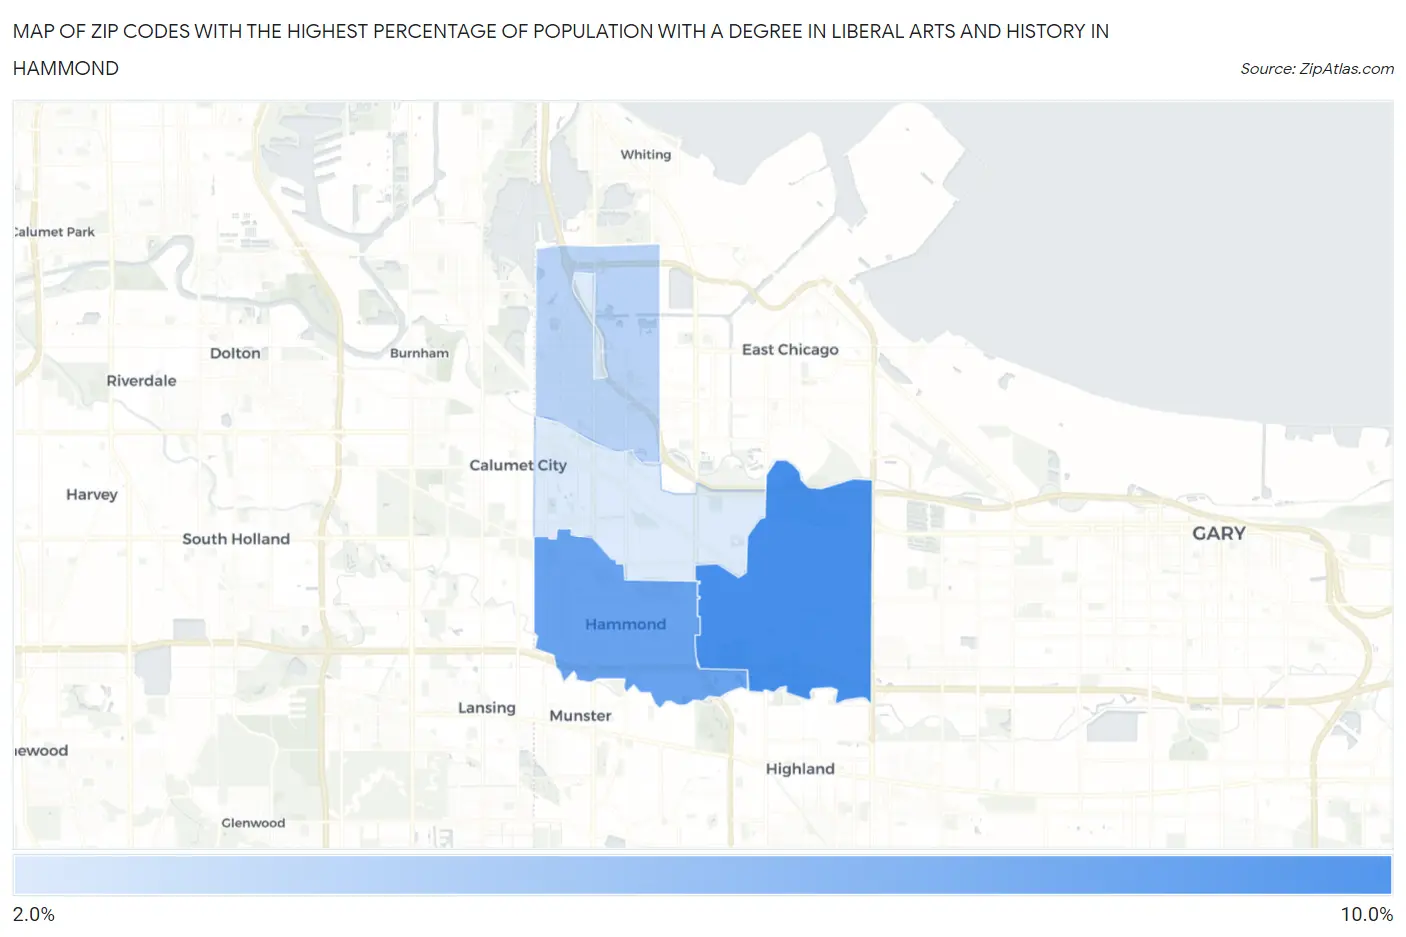
Map of Zip Codes with the Highest Percentage of Population with a Degree in Liberal Arts and History in Hammond
2.3%
9.8%
Zip Codes with the Highest Percentage of Population with a Degree in Liberal Arts and History in Hammond, IN
| Zip Code | % Graduates | vs State | vs National | |
| 1. | 46323 | 9.8% | 5.8%(+3.94)#121 | 4.9%(+4.89)#3,260 |
| 2. | 46324 | 8.1% | 5.8%(+2.29)#189 | 4.9%(+3.25)#4,758 |
| 3. | 46327 | 4.1% | 5.8%(-1.76)#409 | 4.9%(-0.813)#14,547 |
| 4. | 46320 | 2.3% | 5.8%(-3.53)#524 | 4.9%(-2.58)#20,555 |
1
Common Questions
What are the Top 3 Zip Codes with the Highest Percentage of Population with a Degree in Liberal Arts and History in Hammond, IN?
Top 3 Zip Codes with the Highest Percentage of Population with a Degree in Liberal Arts and History in Hammond, IN are:
What zip code has the Highest Percentage of Population with a Degree in Liberal Arts and History in Hammond, IN?
46323 has the Highest Percentage of Population with a Degree in Liberal Arts and History in Hammond, IN with 9.8%.
What is the Percentage of Population with a Degree in Liberal Arts and History in Hammond, IN?
Percentage of Population with a Degree in Liberal Arts and History in Hammond is 6.3%.
What is the Percentage of Population with a Degree in Liberal Arts and History in Indiana?
Percentage of Population with a Degree in Liberal Arts and History in Indiana is 5.8%.
What is the Percentage of Population with a Degree in Liberal Arts and History in the United States?
Percentage of Population with a Degree in Liberal Arts and History in the United States is 4.9%.