Zip Codes with the Highest Percentage of Population with a Degree in Liberal Arts and History in Fishers, IN
RELATED REPORTS & OPTIONS
Liberal Arts and History
Fishers
Compare Zip Codes
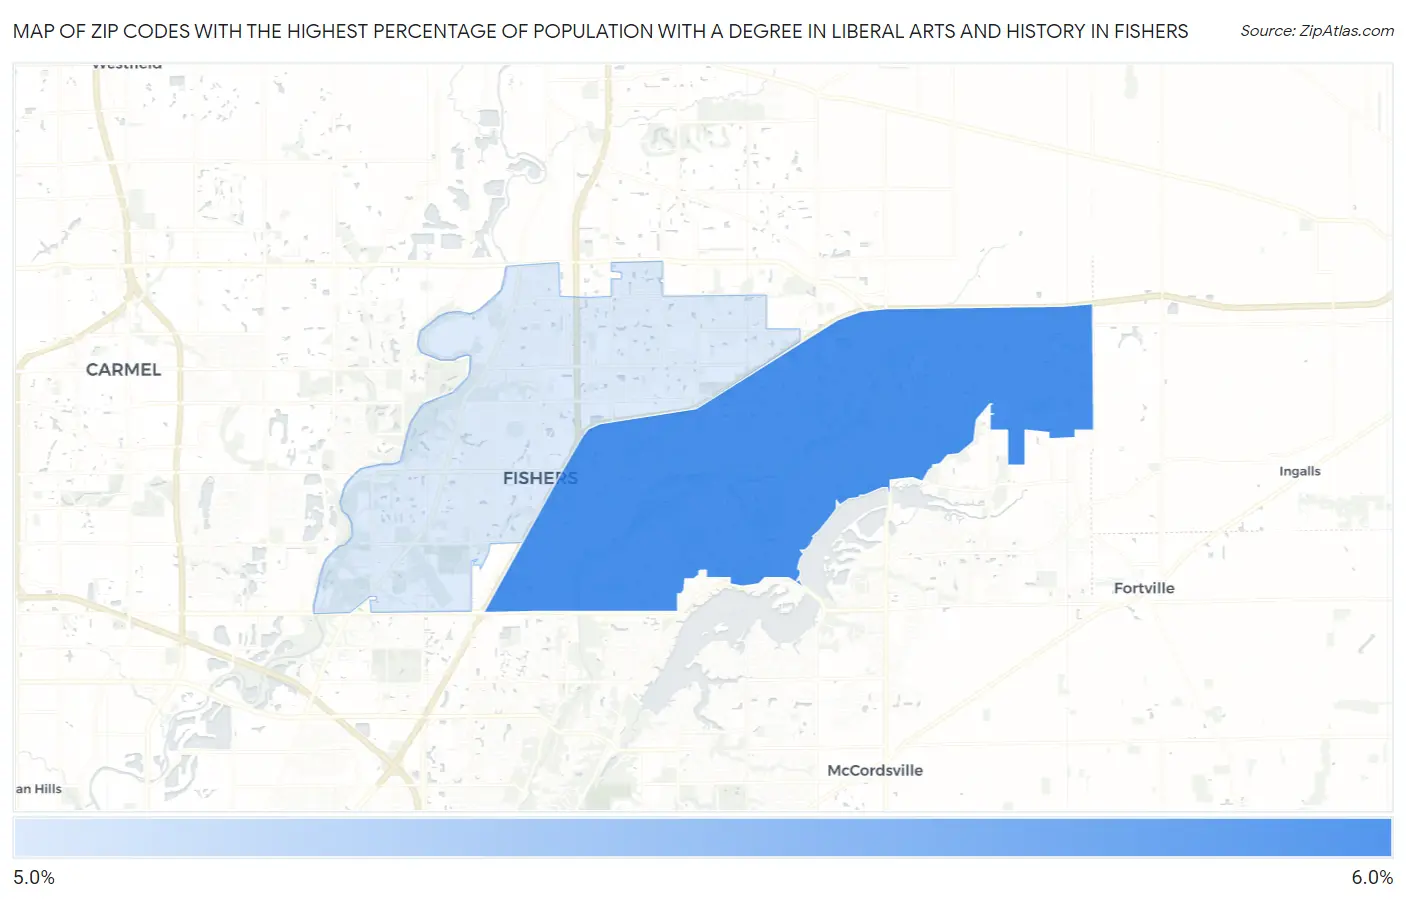
Map of Zip Codes with the Highest Percentage of Population with a Degree in Liberal Arts and History in Fishers
5.8%
5.8%
Zip Codes with the Highest Percentage of Population with a Degree in Liberal Arts and History in Fishers, IN
| Zip Code | % Graduates | vs State | vs National | |
| 1. | 46037 | 5.8% | 5.8%(-0.027)#303 | 4.9%(+0.925)#9,045 |
| 2. | 46038 | 5.8% | 5.8%(-0.036)#304 | 4.9%(+0.916)#9,063 |
1
Common Questions
What are the Top Zip Codes with the Highest Percentage of Population with a Degree in Liberal Arts and History in Fishers, IN?
Top Zip Codes with the Highest Percentage of Population with a Degree in Liberal Arts and History in Fishers, IN are:
What zip code has the Highest Percentage of Population with a Degree in Liberal Arts and History in Fishers, IN?
46037 has the Highest Percentage of Population with a Degree in Liberal Arts and History in Fishers, IN with 5.8%.
What is the Percentage of Population with a Degree in Liberal Arts and History in Fishers, IN?
Percentage of Population with a Degree in Liberal Arts and History in Fishers is 5.3%.
What is the Percentage of Population with a Degree in Liberal Arts and History in Indiana?
Percentage of Population with a Degree in Liberal Arts and History in Indiana is 5.8%.
What is the Percentage of Population with a Degree in Liberal Arts and History in the United States?
Percentage of Population with a Degree in Liberal Arts and History in the United States is 4.9%.