Zip Codes with the Highest Percentage of Population with a Degree in Liberal Arts and History in Indiana
RELATED REPORTS & OPTIONS
Liberal Arts and History
Indiana
Compare Zip Codes
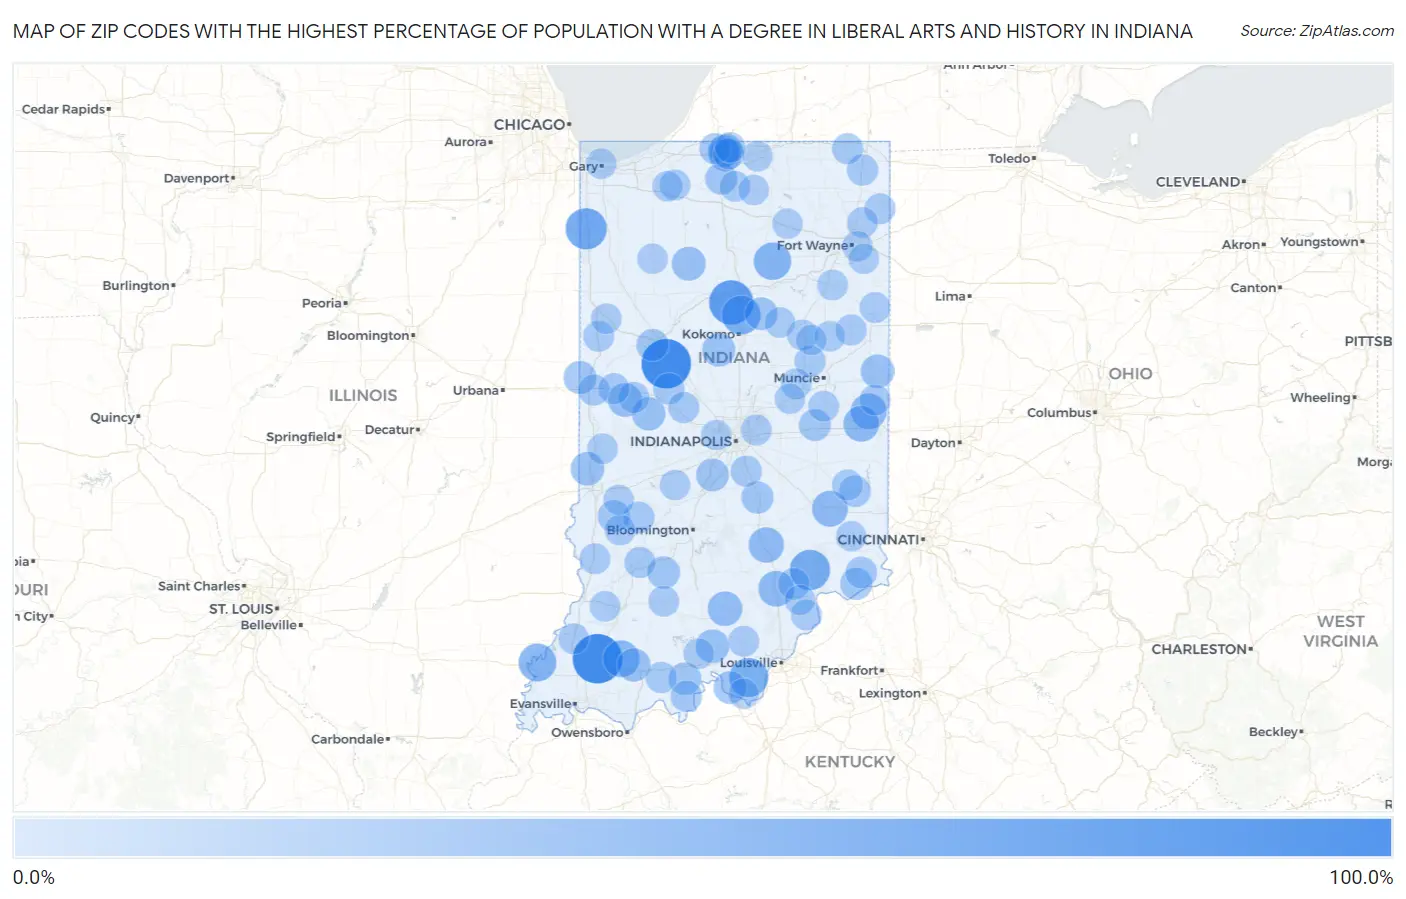
Map of Zip Codes with the Highest Percentage of Population with a Degree in Liberal Arts and History in Indiana
0.0%
100.0%
Zip Codes with the Highest Percentage of Population with a Degree in Liberal Arts and History in Indiana
| Zip Code | % Graduates | vs State | vs National | |
| 1. | 47983 | 100.0% | 5.8%(+94.2)#1 | 4.9%(+95.1)#34 |
| 2. | 47683 | 100.0% | 5.8%(+94.2)#2 | 4.9%(+95.1)#48 |
| 3. | 46967 | 75.0% | 5.8%(+69.2)#3 | 4.9%(+70.1)#67 |
| 4. | 46376 | 60.0% | 5.8%(+54.2)#4 | 4.9%(+55.1)#103 |
| 5. | 47231 | 56.0% | 5.8%(+50.2)#5 | 4.9%(+51.1)#117 |
| 6. | 46959 | 50.0% | 5.8%(+44.2)#6 | 4.9%(+45.1)#149 |
| 7. | 47160 | 50.0% | 5.8%(+44.2)#7 | 4.9%(+45.1)#165 |
| 8. | 47616 | 44.2% | 5.8%(+38.4)#8 | 4.9%(+39.3)#207 |
| 9. | 46943 | 42.9% | 5.8%(+37.0)#9 | 4.9%(+38.0)#223 |
| 10. | 47585 | 39.3% | 5.8%(+33.5)#10 | 4.9%(+34.4)#255 |
| 11. | 47263 | 36.0% | 5.8%(+30.2)#11 | 4.9%(+31.1)#298 |
| 12. | 47393 | 35.7% | 5.8%(+29.9)#12 | 4.9%(+30.8)#303 |
| 13. | 47345 | 35.5% | 5.8%(+29.7)#13 | 4.9%(+30.6)#309 |
| 14. | 47102 | 34.8% | 5.8%(+29.0)#14 | 4.9%(+29.9)#319 |
| 15. | 47247 | 33.3% | 5.8%(+27.5)#15 | 4.9%(+28.5)#351 |
| 16. | 47108 | 29.9% | 5.8%(+24.1)#16 | 4.9%(+25.0)#423 |
| 17. | 46985 | 26.9% | 5.8%(+21.0)#17 | 4.9%(+22.0)#506 |
| 18. | 47949 | 26.2% | 5.8%(+20.4)#18 | 4.9%(+21.3)#528 |
| 19. | 47140 | 25.5% | 5.8%(+19.7)#19 | 4.9%(+20.7)#552 |
| 20. | 47863 | 25.0% | 5.8%(+19.2)#20 | 4.9%(+20.1)#584 |
| 21. | 47382 | 25.0% | 5.8%(+19.2)#21 | 4.9%(+20.1)#589 |
| 22. | 47965 | 24.4% | 5.8%(+18.6)#22 | 4.9%(+19.6)#611 |
| 23. | 47541 | 24.4% | 5.8%(+18.6)#23 | 4.9%(+19.5)#614 |
| 24. | 46039 | 23.3% | 5.8%(+17.4)#24 | 4.9%(+18.4)#663 |
| 25. | 47982 | 22.2% | 5.8%(+16.4)#25 | 4.9%(+17.4)#727 |
| 26. | 46911 | 21.5% | 5.8%(+15.7)#26 | 4.9%(+16.6)#766 |
| 27. | 46111 | 21.1% | 5.8%(+15.2)#27 | 4.9%(+16.2)#796 |
| 28. | 47142 | 20.8% | 5.8%(+15.0)#28 | 4.9%(+16.0)#804 |
| 29. | 47514 | 20.5% | 5.8%(+14.6)#29 | 4.9%(+15.6)#827 |
| 30. | 47522 | 20.0% | 5.8%(+14.2)#30 | 4.9%(+15.1)#860 |
| 31. | 46601 | 19.9% | 5.8%(+14.1)#31 | 4.9%(+15.0)#874 |
| 32. | 46124 | 19.1% | 5.8%(+13.3)#32 | 4.9%(+14.3)#925 |
| 33. | 47901 | 18.8% | 5.8%(+12.9)#33 | 4.9%(+13.9)#953 |
| 34. | 47858 | 18.6% | 5.8%(+12.8)#34 | 4.9%(+13.7)#968 |
| 35. | 47043 | 18.4% | 5.8%(+12.6)#35 | 4.9%(+13.5)#986 |
| 36. | 47344 | 18.2% | 5.8%(+12.4)#36 | 4.9%(+13.3)#1,016 |
| 37. | 46556 | 17.6% | 5.8%(+11.8)#37 | 4.9%(+12.7)#1,077 |
| 38. | 46616 | 17.4% | 5.8%(+11.6)#38 | 4.9%(+12.6)#1,088 |
| 39. | 46536 | 17.0% | 5.8%(+11.2)#39 | 4.9%(+12.1)#1,129 |
| 40. | 47427 | 16.4% | 5.8%(+10.6)#40 | 4.9%(+11.5)#1,201 |
| 41. | 47230 | 15.8% | 5.8%(+10.0)#41 | 4.9%(+11.0)#1,279 |
| 42. | 47011 | 15.7% | 5.8%(+9.92)#42 | 4.9%(+10.9)#1,298 |
| 43. | 47030 | 15.6% | 5.8%(+9.80)#43 | 4.9%(+10.8)#1,311 |
| 44. | 47520 | 15.4% | 5.8%(+9.59)#44 | 4.9%(+10.5)#1,338 |
| 45. | 47940 | 15.3% | 5.8%(+9.49)#45 | 4.9%(+10.4)#1,368 |
| 46. | 46779 | 14.8% | 5.8%(+8.93)#46 | 4.9%(+9.88)#1,471 |
| 47. | 46184 | 14.6% | 5.8%(+8.82)#47 | 4.9%(+9.77)#1,487 |
| 48. | 47577 | 14.6% | 5.8%(+8.79)#48 | 4.9%(+9.74)#1,494 |
| 49. | 46102 | 14.5% | 5.8%(+8.63)#49 | 4.9%(+9.59)#1,529 |
| 50. | 47932 | 14.4% | 5.8%(+8.59)#50 | 4.9%(+9.54)#1,534 |
| 51. | 46628 | 13.9% | 5.8%(+8.12)#51 | 4.9%(+9.07)#1,652 |
| 52. | 47990 | 13.8% | 5.8%(+8.02)#52 | 4.9%(+8.97)#1,671 |
| 53. | 47987 | 13.8% | 5.8%(+8.01)#53 | 4.9%(+8.96)#1,677 |
| 54. | 46615 | 13.8% | 5.8%(+7.99)#54 | 4.9%(+8.94)#1,680 |
| 55. | 47342 | 13.8% | 5.8%(+7.97)#55 | 4.9%(+8.92)#1,685 |
| 56. | 47449 | 13.8% | 5.8%(+7.97)#56 | 4.9%(+8.92)#1,688 |
| 57. | 46776 | 13.5% | 5.8%(+7.67)#57 | 4.9%(+8.62)#1,770 |
| 58. | 47369 | 13.3% | 5.8%(+7.51)#58 | 4.9%(+8.46)#1,813 |
| 59. | 47921 | 13.1% | 5.8%(+7.25)#59 | 4.9%(+8.20)#1,886 |
| 60. | 47024 | 12.9% | 5.8%(+7.06)#60 | 4.9%(+8.01)#1,943 |
| 61. | 47355 | 12.8% | 5.8%(+6.95)#61 | 4.9%(+7.90)#1,964 |
| 62. | 46235 | 12.7% | 5.8%(+6.86)#62 | 4.9%(+7.81)#1,991 |
| 63. | 46711 | 12.7% | 5.8%(+6.83)#63 | 4.9%(+7.78)#1,997 |
| 64. | 46785 | 12.6% | 5.8%(+6.81)#64 | 4.9%(+7.76)#2,006 |
| 65. | 46506 | 12.6% | 5.8%(+6.79)#65 | 4.9%(+7.75)#2,009 |
| 66. | 47438 | 12.5% | 5.8%(+6.68)#66 | 4.9%(+7.63)#2,032 |
| 67. | 46346 | 12.5% | 5.8%(+6.68)#67 | 4.9%(+7.63)#2,040 |
| 68. | 47666 | 12.4% | 5.8%(+6.55)#68 | 4.9%(+7.50)#2,090 |
| 69. | 47838 | 12.3% | 5.8%(+6.46)#69 | 4.9%(+7.41)#2,108 |
| 70. | 46933 | 12.2% | 5.8%(+6.41)#70 | 4.9%(+7.37)#2,124 |
| 71. | 46770 | 12.1% | 5.8%(+6.33)#71 | 4.9%(+7.28)#2,155 |
| 72. | 47581 | 12.1% | 5.8%(+6.32)#72 | 4.9%(+7.27)#2,158 |
| 73. | 47164 | 12.1% | 5.8%(+6.25)#73 | 4.9%(+7.20)#2,186 |
| 74. | 47147 | 12.1% | 5.8%(+6.24)#74 | 4.9%(+7.20)#2,188 |
| 75. | 47361 | 12.1% | 5.8%(+6.24)#75 | 4.9%(+7.20)#2,191 |
| 76. | 47860 | 11.8% | 5.8%(+5.94)#76 | 4.9%(+6.89)#2,272 |
| 77. | 46012 | 11.7% | 5.8%(+5.92)#77 | 4.9%(+6.88)#2,281 |
| 78. | 46765 | 11.7% | 5.8%(+5.86)#78 | 4.9%(+6.81)#2,305 |
| 79. | 47944 | 11.5% | 5.8%(+5.71)#79 | 4.9%(+6.67)#2,347 |
| 80. | 47946 | 11.5% | 5.8%(+5.65)#80 | 4.9%(+6.60)#2,366 |
| 81. | 47348 | 11.4% | 5.8%(+5.60)#81 | 4.9%(+6.56)#2,379 |
| 82. | 47597 | 11.4% | 5.8%(+5.54)#82 | 4.9%(+6.49)#2,418 |
| 83. | 47846 | 11.4% | 5.8%(+5.54)#83 | 4.9%(+6.49)#2,419 |
| 84. | 46550 | 11.2% | 5.8%(+5.38)#84 | 4.9%(+6.33)#2,476 |
| 85. | 46989 | 11.1% | 5.8%(+5.26)#85 | 4.9%(+6.22)#2,526 |
| 86. | 46803 | 11.1% | 5.8%(+5.24)#86 | 4.9%(+6.19)#2,533 |
| 87. | 47118 | 11.0% | 5.8%(+5.19)#87 | 4.9%(+6.14)#2,553 |
| 88. | 46987 | 11.0% | 5.8%(+5.19)#88 | 4.9%(+6.14)#2,556 |
| 89. | 46013 | 11.0% | 5.8%(+5.17)#89 | 4.9%(+6.12)#2,561 |
| 90. | 46562 | 11.0% | 5.8%(+5.14)#90 | 4.9%(+6.09)#2,576 |
| 91. | 47456 | 10.9% | 5.8%(+5.08)#91 | 4.9%(+6.04)#2,602 |
| 92. | 46516 | 10.9% | 5.8%(+5.05)#92 | 4.9%(+6.01)#2,609 |
| 93. | 46402 | 10.9% | 5.8%(+5.05)#93 | 4.9%(+6.00)#2,610 |
| 94. | 47031 | 10.9% | 5.8%(+5.04)#94 | 4.9%(+5.99)#2,617 |
| 95. | 46635 | 10.8% | 5.8%(+4.98)#95 | 4.9%(+5.93)#2,645 |
| 96. | 46234 | 10.8% | 5.8%(+4.97)#96 | 4.9%(+5.92)#2,650 |
| 97. | 47135 | 10.8% | 5.8%(+4.94)#97 | 4.9%(+5.89)#2,661 |
| 98. | 46816 | 10.7% | 5.8%(+4.88)#98 | 4.9%(+5.83)#2,699 |
| 99. | 47138 | 10.7% | 5.8%(+4.86)#99 | 4.9%(+5.81)#2,709 |
| 100. | 46382 | 10.7% | 5.8%(+4.84)#100 | 4.9%(+5.79)#2,718 |
Common Questions
What are the Top 10 Zip Codes with the Highest Percentage of Population with a Degree in Liberal Arts and History in Indiana?
Top 10 Zip Codes with the Highest Percentage of Population with a Degree in Liberal Arts and History in Indiana are:
What zip code has the Highest Percentage of Population with a Degree in Liberal Arts and History in Indiana?
47983 has the Highest Percentage of Population with a Degree in Liberal Arts and History in Indiana with 100.0%.
What is the Percentage of Population with a Degree in Liberal Arts and History in the State of Indiana?
Percentage of Population with a Degree in Liberal Arts and History in Indiana is 5.8%.
What is the Percentage of Population with a Degree in Liberal Arts and History in the United States?
Percentage of Population with a Degree in Liberal Arts and History in the United States is 4.9%.