Zip Codes with the Highest Percentage of Population with a Degree in Liberal Arts and History in Marion, IN
RELATED REPORTS & OPTIONS
Liberal Arts and History
Marion
Compare Zip Codes
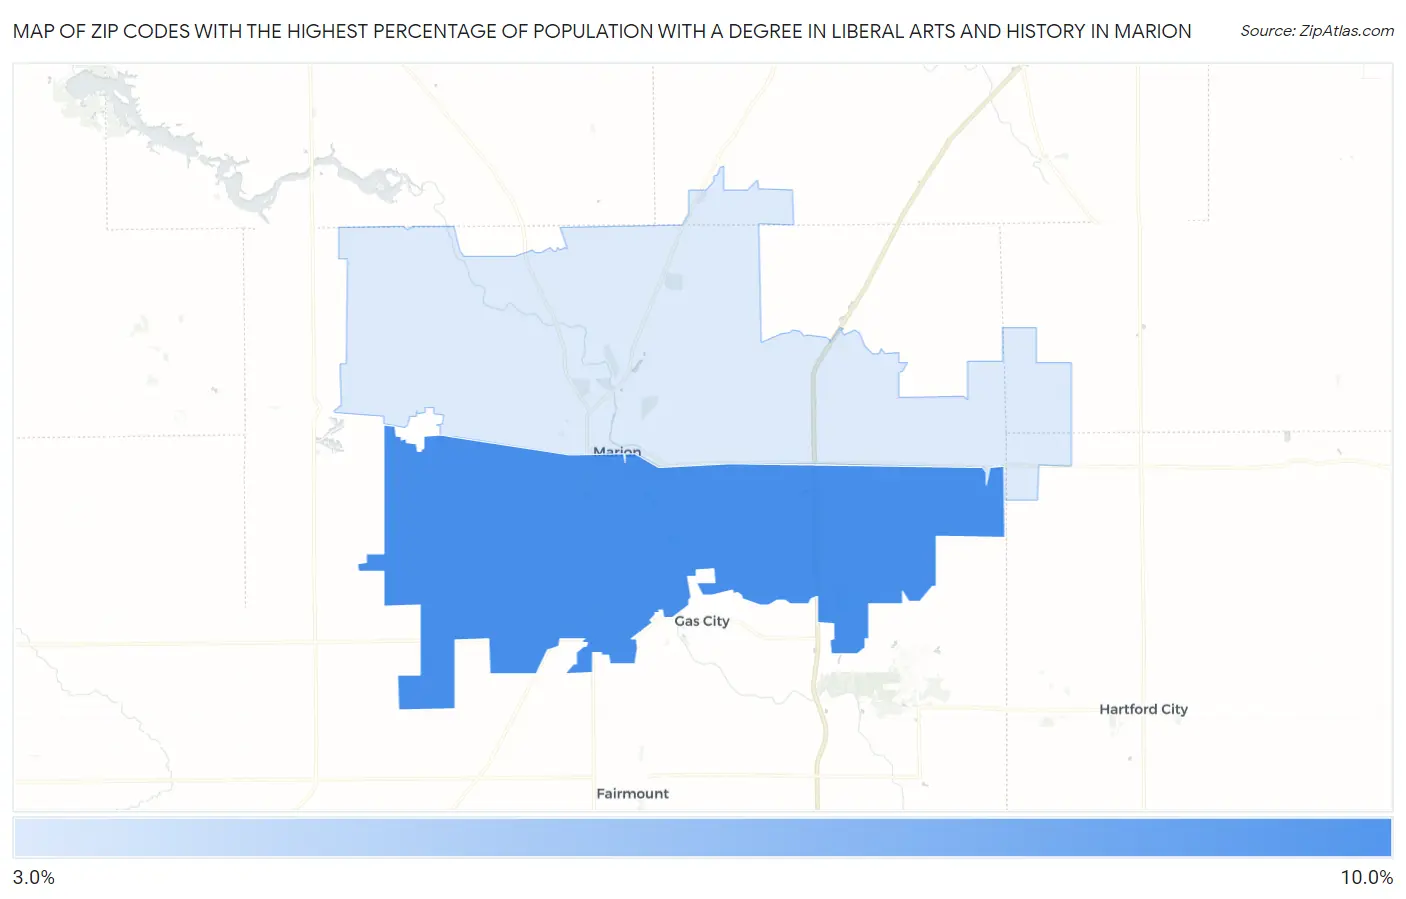
Map of Zip Codes with the Highest Percentage of Population with a Degree in Liberal Arts and History in Marion
3.7%
9.0%
Zip Codes with the Highest Percentage of Population with a Degree in Liberal Arts and History in Marion, IN
| Zip Code | % Graduates | vs State | vs National | |
| 1. | 46953 | 9.0% | 5.8%(+3.16)#146 | 4.9%(+4.12)#3,872 |
| 2. | 46952 | 3.7% | 5.8%(-2.13)#439 | 4.9%(-1.18)#15,925 |
1
Common Questions
What are the Top Zip Codes with the Highest Percentage of Population with a Degree in Liberal Arts and History in Marion, IN?
Top Zip Codes with the Highest Percentage of Population with a Degree in Liberal Arts and History in Marion, IN are:
What zip code has the Highest Percentage of Population with a Degree in Liberal Arts and History in Marion, IN?
46953 has the Highest Percentage of Population with a Degree in Liberal Arts and History in Marion, IN with 9.0%.
What is the Percentage of Population with a Degree in Liberal Arts and History in Indiana?
Percentage of Population with a Degree in Liberal Arts and History in Indiana is 5.8%.
What is the Percentage of Population with a Degree in Liberal Arts and History in the United States?
Percentage of Population with a Degree in Liberal Arts and History in the United States is 4.9%.