Zip Codes with the Highest Percentage of Population Employed in Arts, Media & Entertainment in Fishers, IN
RELATED REPORTS & OPTIONS
Arts, Media & Entertainment
Fishers
Compare Zip Codes
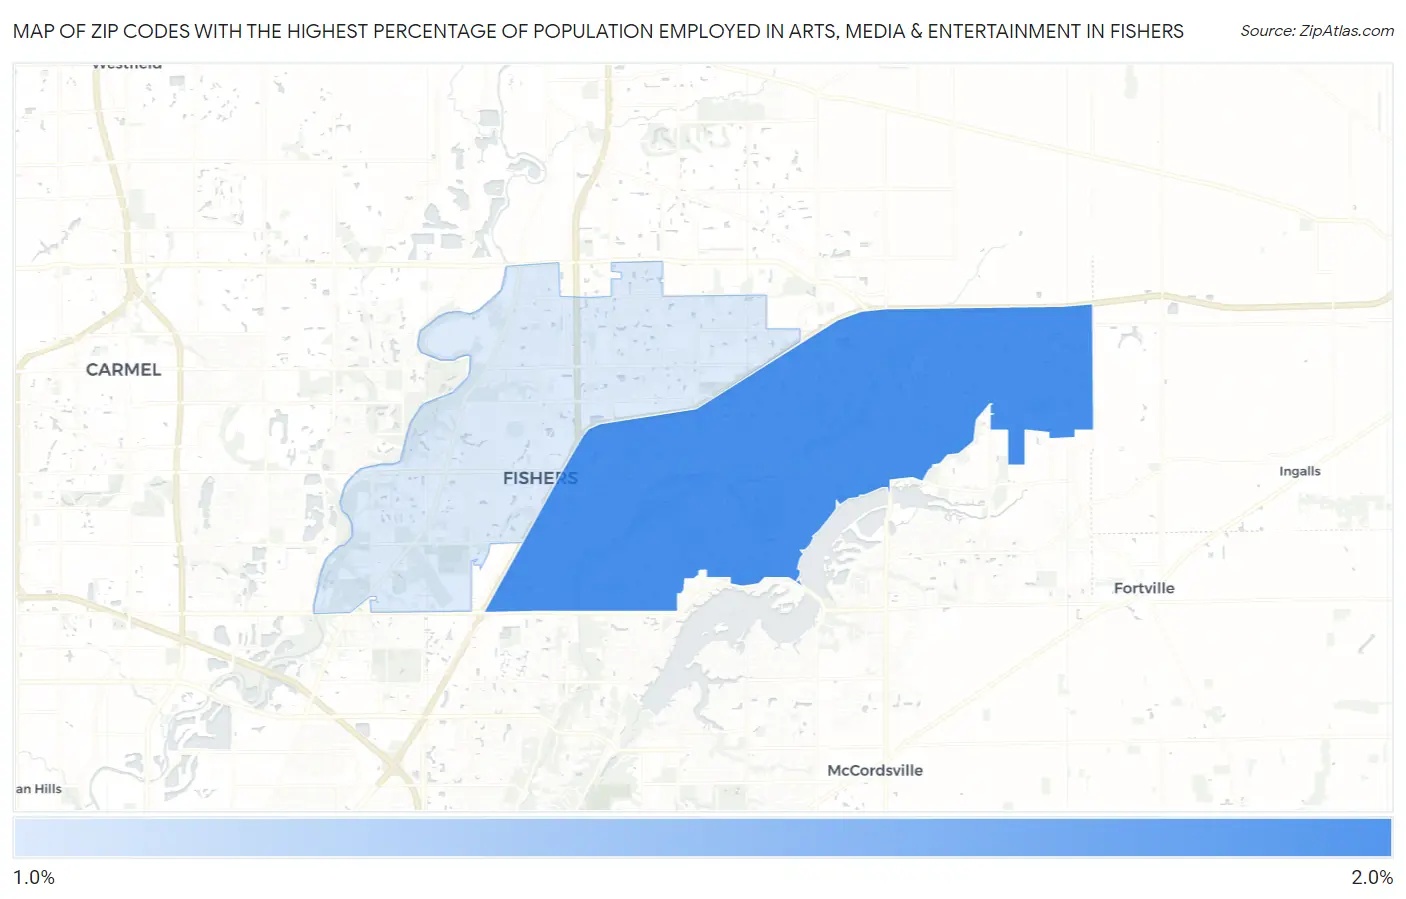
Map of Zip Codes with the Highest Percentage of Population Employed in Arts, Media & Entertainment in Fishers
1.6%
1.6%
Zip Codes with the Highest Percentage of Population Employed in Arts, Media & Entertainment in Fishers, IN
| Zip Code | % Employed | vs State | vs National | |
| 1. | 46037 | 1.6% | 1.4%(+0.219)#165 | 2.1%(-0.430)#10,117 |
| 2. | 46038 | 1.6% | 1.4%(+0.154)#172 | 2.1%(-0.495)#10,539 |
1
Common Questions
What are the Top Zip Codes with the Highest Percentage of Population Employed in Arts, Media & Entertainment in Fishers, IN?
Top Zip Codes with the Highest Percentage of Population Employed in Arts, Media & Entertainment in Fishers, IN are:
What zip code has the Highest Percentage of Population Employed in Arts, Media & Entertainment in Fishers, IN?
46037 has the Highest Percentage of Population Employed in Arts, Media & Entertainment in Fishers, IN with 1.6%.
What is the Percentage of Population Employed in Arts, Media & Entertainment in Fishers, IN?
Percentage of Population Employed in Arts, Media & Entertainment in Fishers is 1.6%.
What is the Percentage of Population Employed in Arts, Media & Entertainment in Indiana?
Percentage of Population Employed in Arts, Media & Entertainment in Indiana is 1.4%.
What is the Percentage of Population Employed in Arts, Media & Entertainment in the United States?
Percentage of Population Employed in Arts, Media & Entertainment in the United States is 2.1%.