Zip Codes with the Highest Percentage of Population Employed in Arts, Media & Entertainment in Indiana
RELATED REPORTS & OPTIONS
Arts, Media & Entertainment
Indiana
Compare Zip Codes
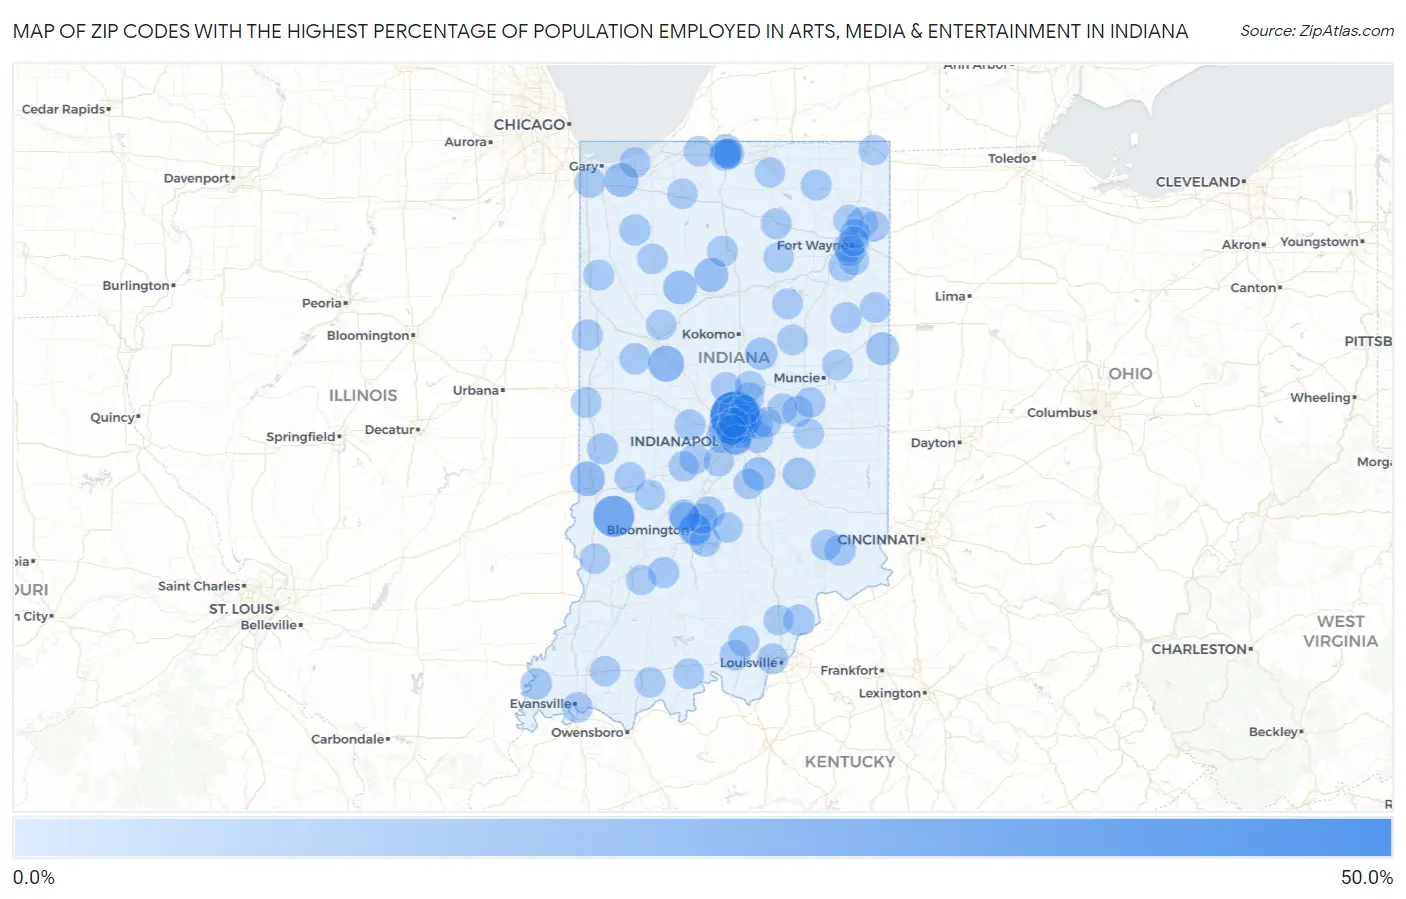
Map of Zip Codes with the Highest Percentage of Population Employed in Arts, Media & Entertainment in Indiana
0.0%
50.0%
Zip Codes with the Highest Percentage of Population Employed in Arts, Media & Entertainment in Indiana
| Zip Code | % Employed | vs State | vs National | |
| 1. | 46290 | 44.8% | 1.4%(+43.4)#1 | 2.1%(+42.8)#18 |
| 2. | 47858 | 25.6% | 1.4%(+24.1)#2 | 2.1%(+23.5)#58 |
| 3. | 47983 | 14.1% | 1.4%(+12.7)#3 | 2.1%(+12.1)#187 |
| 4. | 47876 | 11.4% | 1.4%(+10.0)#4 | 2.1%(+9.37)#287 |
| 5. | 46950 | 10.3% | 1.4%(+8.86)#5 | 2.1%(+8.21)#355 |
| 6. | 46393 | 9.9% | 1.4%(+8.46)#6 | 2.1%(+7.82)#382 |
| 7. | 47950 | 9.7% | 1.4%(+8.24)#7 | 2.1%(+7.59)#399 |
| 8. | 46162 | 8.1% | 1.4%(+6.68)#8 | 2.1%(+6.03)#541 |
| 9. | 47381 | 7.4% | 1.4%(+6.03)#9 | 2.1%(+5.39)#655 |
| 10. | 47405 | 6.7% | 1.4%(+5.32)#10 | 2.1%(+4.67)#825 |
| 11. | 46076 | 6.7% | 1.4%(+5.27)#11 | 2.1%(+4.62)#838 |
| 12. | 46150 | 6.3% | 1.4%(+4.88)#12 | 2.1%(+4.23)#930 |
| 13. | 47468 | 6.0% | 1.4%(+4.62)#13 | 2.1%(+3.97)#1,021 |
| 14. | 46220 | 4.7% | 1.4%(+3.24)#14 | 2.1%(+2.59)#1,729 |
| 15. | 47406 | 4.5% | 1.4%(+3.12)#15 | 2.1%(+2.47)#1,825 |
| 16. | 47631 | 4.5% | 1.4%(+3.12)#16 | 2.1%(+2.47)#1,826 |
| 17. | 46556 | 4.5% | 1.4%(+3.11)#17 | 2.1%(+2.46)#1,836 |
| 18. | 47042 | 4.4% | 1.4%(+3.00)#18 | 2.1%(+2.35)#1,928 |
| 19. | 46601 | 4.4% | 1.4%(+2.97)#19 | 2.1%(+2.32)#1,954 |
| 20. | 47992 | 4.2% | 1.4%(+2.84)#20 | 2.1%(+2.19)#2,091 |
| 21. | 46392 | 4.1% | 1.4%(+2.71)#21 | 2.1%(+2.06)#2,230 |
| 22. | 47522 | 4.0% | 1.4%(+2.55)#22 | 2.1%(+1.90)#2,420 |
| 23. | 47141 | 3.9% | 1.4%(+2.46)#23 | 2.1%(+1.81)#2,531 |
| 24. | 46205 | 3.8% | 1.4%(+2.43)#24 | 2.1%(+1.78)#2,566 |
| 25. | 46229 | 3.8% | 1.4%(+2.42)#25 | 2.1%(+1.77)#2,582 |
| 26. | 47860 | 3.7% | 1.4%(+2.26)#26 | 2.1%(+1.61)#2,804 |
| 27. | 46149 | 3.7% | 1.4%(+2.25)#27 | 2.1%(+1.60)#2,816 |
| 28. | 47917 | 3.6% | 1.4%(+2.18)#28 | 2.1%(+1.53)#2,927 |
| 29. | 47429 | 3.6% | 1.4%(+2.16)#29 | 2.1%(+1.52)#2,951 |
| 30. | 46202 | 3.6% | 1.4%(+2.15)#30 | 2.1%(+1.50)#2,977 |
| 31. | 46208 | 3.6% | 1.4%(+2.14)#31 | 2.1%(+1.49)#2,985 |
| 32. | 47401 | 3.6% | 1.4%(+2.14)#32 | 2.1%(+1.49)#2,998 |
| 33. | 47164 | 3.5% | 1.4%(+2.07)#33 | 2.1%(+1.42)#3,097 |
| 34. | 46765 | 3.5% | 1.4%(+2.05)#34 | 2.1%(+1.41)#3,114 |
| 35. | 46794 | 3.5% | 1.4%(+2.05)#35 | 2.1%(+1.40)#3,116 |
| 36. | 46590 | 3.4% | 1.4%(+2.00)#36 | 2.1%(+1.35)#3,220 |
| 37. | 47150 | 3.4% | 1.4%(+1.97)#37 | 2.1%(+1.32)#3,280 |
| 38. | 46975 | 3.4% | 1.4%(+1.96)#38 | 2.1%(+1.31)#3,282 |
| 39. | 46069 | 3.3% | 1.4%(+1.93)#39 | 2.1%(+1.28)#3,370 |
| 40. | 47713 | 3.3% | 1.4%(+1.89)#40 | 2.1%(+1.24)#3,417 |
| 41. | 46250 | 3.3% | 1.4%(+1.86)#41 | 2.1%(+1.21)#3,472 |
| 42. | 46759 | 3.3% | 1.4%(+1.86)#42 | 2.1%(+1.21)#3,474 |
| 43. | 47922 | 3.3% | 1.4%(+1.86)#43 | 2.1%(+1.21)#3,479 |
| 44. | 47023 | 3.2% | 1.4%(+1.83)#44 | 2.1%(+1.18)#3,520 |
| 45. | 47576 | 3.2% | 1.4%(+1.81)#45 | 2.1%(+1.16)#3,555 |
| 46. | 47946 | 3.2% | 1.4%(+1.79)#46 | 2.1%(+1.14)#3,604 |
| 47. | 46118 | 3.2% | 1.4%(+1.77)#47 | 2.1%(+1.12)#3,668 |
| 48. | 46938 | 3.2% | 1.4%(+1.76)#48 | 2.1%(+1.11)#3,694 |
| 49. | 46056 | 3.1% | 1.4%(+1.73)#49 | 2.1%(+1.08)#3,760 |
| 50. | 46798 | 3.1% | 1.4%(+1.68)#50 | 2.1%(+1.04)#3,859 |
| 51. | 46375 | 3.1% | 1.4%(+1.68)#51 | 2.1%(+1.03)#3,862 |
| 52. | 46032 | 3.1% | 1.4%(+1.67)#52 | 2.1%(+1.02)#3,889 |
| 53. | 46214 | 3.0% | 1.4%(+1.62)#53 | 2.1%(+0.969)#4,015 |
| 54. | 47408 | 3.0% | 1.4%(+1.61)#54 | 2.1%(+0.957)#4,039 |
| 55. | 46940 | 3.0% | 1.4%(+1.60)#55 | 2.1%(+0.954)#4,043 |
| 56. | 46304 | 3.0% | 1.4%(+1.60)#56 | 2.1%(+0.948)#4,053 |
| 57. | 46131 | 3.0% | 1.4%(+1.57)#57 | 2.1%(+0.920)#4,135 |
| 58. | 47320 | 3.0% | 1.4%(+1.56)#58 | 2.1%(+0.914)#4,149 |
| 59. | 47974 | 3.0% | 1.4%(+1.55)#59 | 2.1%(+0.897)#4,188 |
| 60. | 46741 | 2.9% | 1.4%(+1.53)#60 | 2.1%(+0.879)#4,232 |
| 61. | 47356 | 2.9% | 1.4%(+1.52)#61 | 2.1%(+0.873)#4,248 |
| 62. | 47166 | 2.9% | 1.4%(+1.52)#62 | 2.1%(+0.867)#4,269 |
| 63. | 46236 | 2.9% | 1.4%(+1.50)#63 | 2.1%(+0.851)#4,316 |
| 64. | 46819 | 2.9% | 1.4%(+1.49)#64 | 2.1%(+0.837)#4,353 |
| 65. | 47857 | 2.8% | 1.4%(+1.42)#65 | 2.1%(+0.776)#4,511 |
| 66. | 46055 | 2.8% | 1.4%(+1.41)#66 | 2.1%(+0.760)#4,559 |
| 67. | 46180 | 2.8% | 1.4%(+1.39)#67 | 2.1%(+0.745)#4,602 |
| 68. | 46802 | 2.8% | 1.4%(+1.39)#68 | 2.1%(+0.741)#4,614 |
| 69. | 46748 | 2.8% | 1.4%(+1.38)#69 | 2.1%(+0.734)#4,635 |
| 70. | 46617 | 2.8% | 1.4%(+1.38)#70 | 2.1%(+0.734)#4,637 |
| 71. | 46711 | 2.7% | 1.4%(+1.32)#71 | 2.1%(+0.674)#4,808 |
| 72. | 47404 | 2.7% | 1.4%(+1.28)#72 | 2.1%(+0.626)#4,951 |
| 73. | 46240 | 2.7% | 1.4%(+1.24)#73 | 2.1%(+0.591)#5,056 |
| 74. | 46615 | 2.7% | 1.4%(+1.24)#74 | 2.1%(+0.591)#5,057 |
| 75. | 46962 | 2.6% | 1.4%(+1.24)#75 | 2.1%(+0.587)#5,070 |
| 76. | 46254 | 2.6% | 1.4%(+1.22)#76 | 2.1%(+0.568)#5,145 |
| 77. | 46807 | 2.6% | 1.4%(+1.19)#77 | 2.1%(+0.541)#5,224 |
| 78. | 46113 | 2.6% | 1.4%(+1.16)#78 | 2.1%(+0.513)#5,319 |
| 79. | 46204 | 2.6% | 1.4%(+1.15)#79 | 2.1%(+0.500)#5,365 |
| 80. | 46062 | 2.5% | 1.4%(+1.13)#80 | 2.1%(+0.480)#5,418 |
| 81. | 47579 | 2.5% | 1.4%(+1.10)#81 | 2.1%(+0.453)#5,508 |
| 82. | 46532 | 2.5% | 1.4%(+1.10)#82 | 2.1%(+0.447)#5,526 |
| 83. | 47448 | 2.5% | 1.4%(+1.10)#83 | 2.1%(+0.447)#5,529 |
| 84. | 46064 | 2.5% | 1.4%(+1.05)#84 | 2.1%(+0.399)#5,683 |
| 85. | 47920 | 2.5% | 1.4%(+1.04)#85 | 2.1%(+0.394)#5,708 |
| 86. | 47619 | 2.5% | 1.4%(+1.04)#86 | 2.1%(+0.389)#5,738 |
| 87. | 46148 | 2.4% | 1.4%(+1.04)#87 | 2.1%(+0.388)#5,749 |
| 88. | 47838 | 2.4% | 1.4%(+1.03)#88 | 2.1%(+0.381)#5,780 |
| 89. | 46034 | 2.4% | 1.4%(+1.02)#89 | 2.1%(+0.375)#5,803 |
| 90. | 47562 | 2.4% | 1.4%(+1.02)#90 | 2.1%(+0.373)#5,811 |
| 91. | 46737 | 2.4% | 1.4%(+1.02)#91 | 2.1%(+0.367)#5,829 |
| 92. | 46033 | 2.4% | 1.4%(+1.01)#92 | 2.1%(+0.362)#5,846 |
| 93. | 46526 | 2.4% | 1.4%(+0.996)#93 | 2.1%(+0.347)#5,912 |
| 94. | 46825 | 2.4% | 1.4%(+0.968)#94 | 2.1%(+0.319)#6,012 |
| 95. | 46805 | 2.4% | 1.4%(+0.957)#95 | 2.1%(+0.308)#6,057 |
| 96. | 46552 | 2.3% | 1.4%(+0.933)#96 | 2.1%(+0.284)#6,164 |
| 97. | 47868 | 2.3% | 1.4%(+0.900)#97 | 2.1%(+0.251)#6,331 |
| 98. | 47126 | 2.3% | 1.4%(+0.863)#98 | 2.1%(+0.214)#6,477 |
| 99. | 46228 | 2.2% | 1.4%(+0.835)#99 | 2.1%(+0.187)#6,616 |
| 100. | 46260 | 2.2% | 1.4%(+0.829)#100 | 2.1%(+0.180)#6,645 |
Common Questions
What are the Top 10 Zip Codes with the Highest Percentage of Population Employed in Arts, Media & Entertainment in Indiana?
Top 10 Zip Codes with the Highest Percentage of Population Employed in Arts, Media & Entertainment in Indiana are:
What zip code has the Highest Percentage of Population Employed in Arts, Media & Entertainment in Indiana?
46290 has the Highest Percentage of Population Employed in Arts, Media & Entertainment in Indiana with 44.8%.
What is the Percentage of Population Employed in Arts, Media & Entertainment in the State of Indiana?
Percentage of Population Employed in Arts, Media & Entertainment in Indiana is 1.4%.
What is the Percentage of Population Employed in Arts, Media & Entertainment in the United States?
Percentage of Population Employed in Arts, Media & Entertainment in the United States is 2.1%.