Area Code 480 Map & Demographics
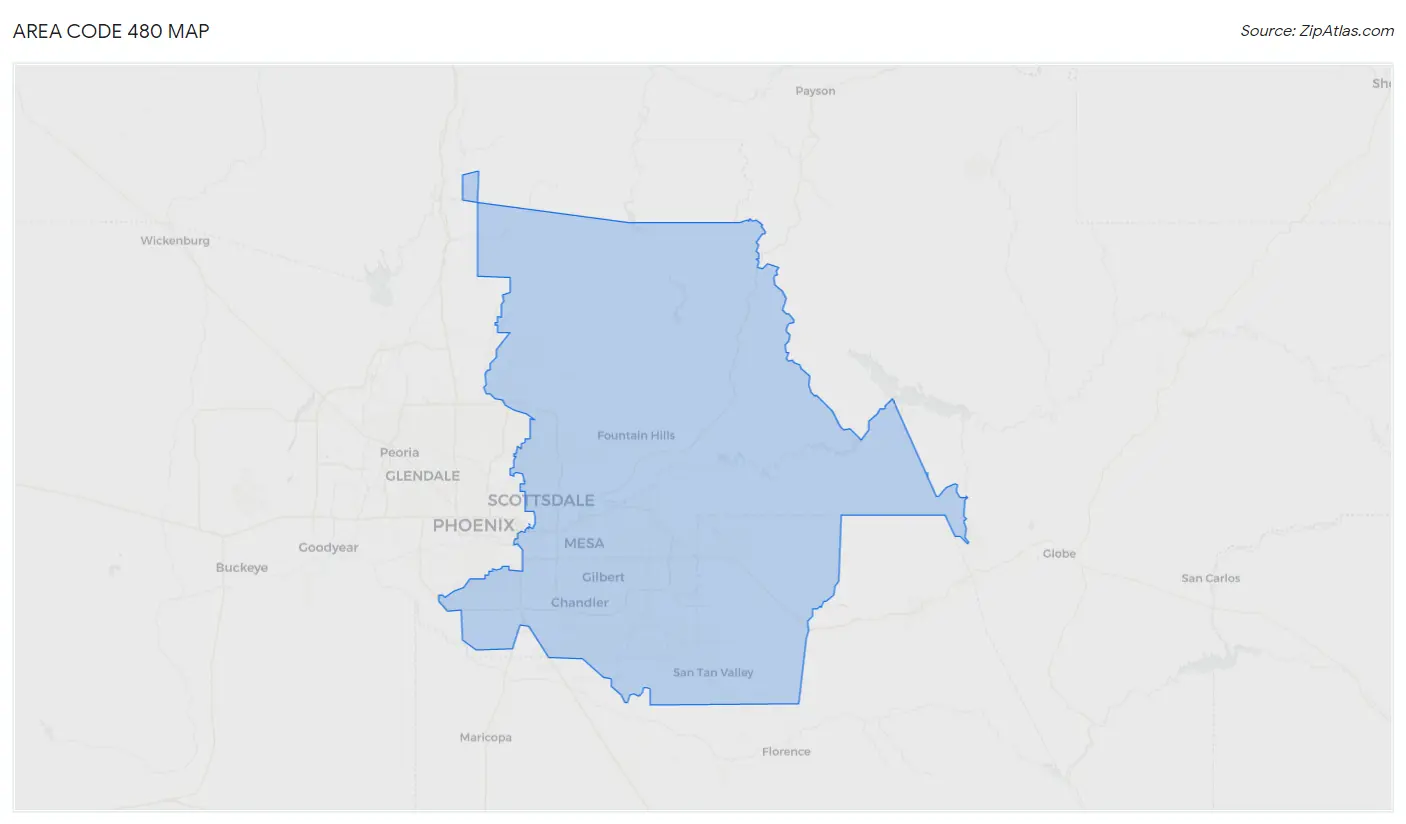
Area Code 480 Map
Area Code 480 Overview
$50,187
PER CAPITA INCOME
$107,719
AVG FAMILY INCOME
$91,290
AVG HOUSEHOLD INCOME
25.0%
WAGE / INCOME GAP [ % ]
75.0¢/ $1
WAGE / INCOME GAP [ $ ]
$11,331
FAMILY INCOME DEFICIT
32.10
INEQUALITY / GINI INDEX
2,553,748
TOTAL POPULATION
1,277,610
MALE POPULATION
1,276,138
FEMALE POPULATION
100.12
MALES / 100 FEMALES
99.88
FEMALES / 100 MALES
41.0
MEDIAN AGE
3.0
AVG FAMILY SIZE
2.5
AVG HOUSEHOLD SIZE
1,328,354
LABOR FORCE [ PEOPLE ]
64.6%
PERCENT IN LABOR FORCE
4.7%
UNEMPLOYMENT RATE
Income in Area Code 480
Income Overview in Area Code 480
Per Capita Income in Area Code 480 is $50,187, while median incomes of families and households are $107,719 and $91,290 respectively.
| Characteristic | Number | Measure |
| Per Capita Income | 2,553,748 | $50,187 |
| Median Family Income | 640,172 | $107,719 |
| Mean Family Income | 640,172 | $10,136,242 |
| Median Household Income | 1,009,153 | $91,290 |
| Mean Household Income | 1,009,153 | $8,756,557 |
| Income Deficit | 640,172 | $11,331 |
| Wage / Income Gap (%) | 2,553,748 | 24.99% |
| Wage / Income Gap ($) | 2,553,748 | 75.01¢ per $1 |
| Gini / Inequality Index | 2,553,748 | 32.10 |
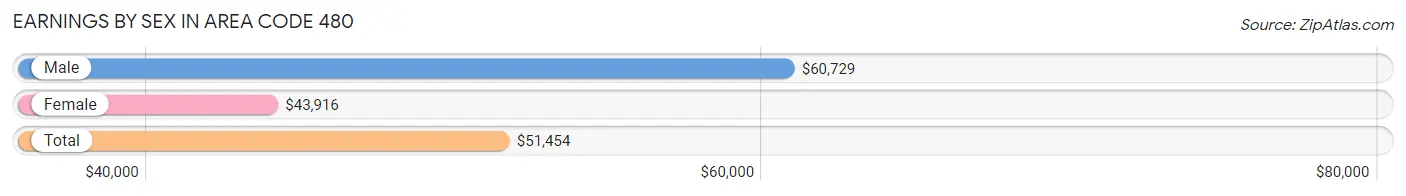
Earnings by Sex in Area Code 480
Average Earnings in Area Code 480 are $51,454, $60,729 for men and $43,916 for women, a difference of 27.7%.
| Sex | Number | Average Earnings |
| Male | 759,094 (54.0%) | $60,729 |
| Female | 647,500 (46.0%) | $43,916 |
| Total | 1,406,594 (100.0%) | $51,454 |
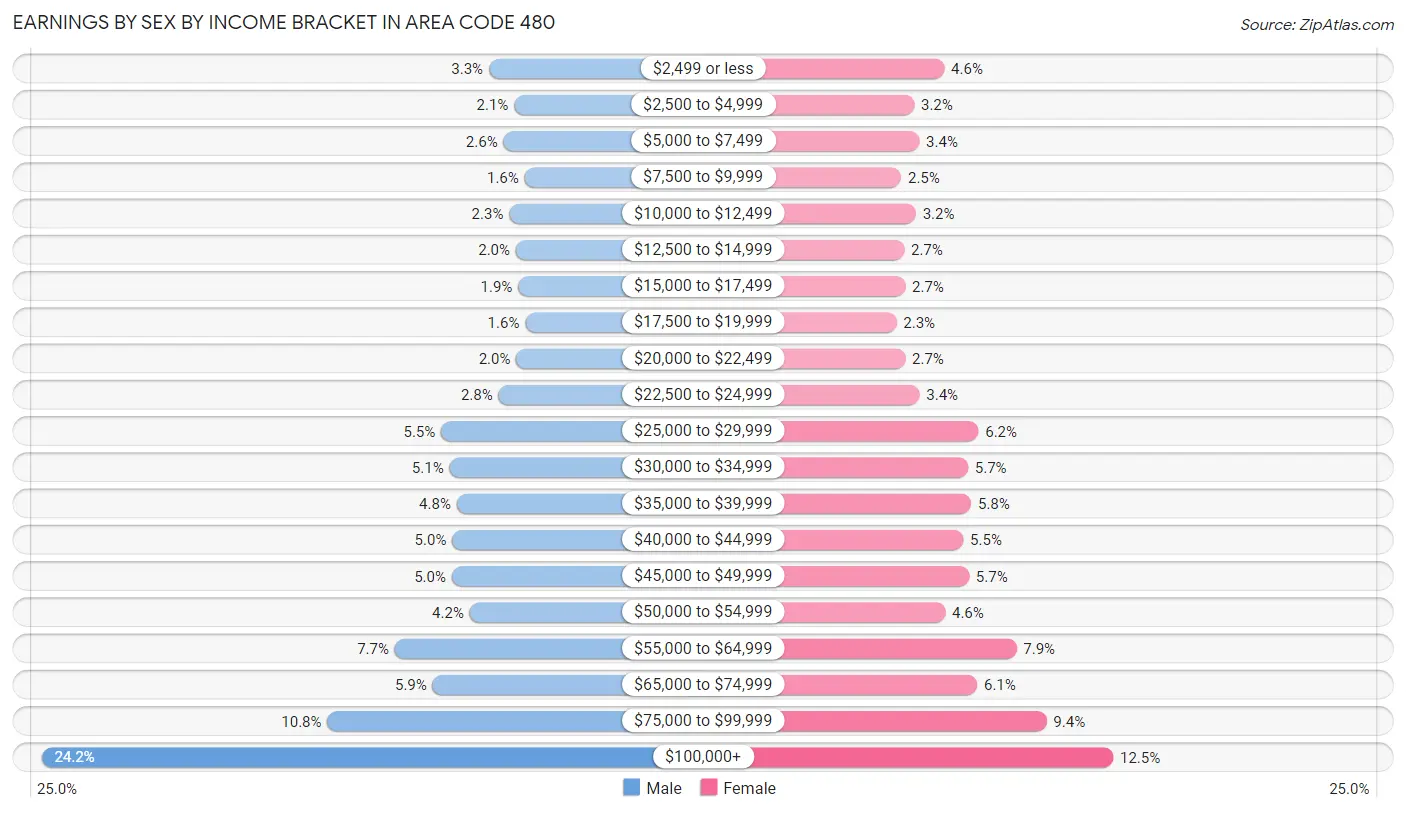
Earnings by Sex by Income Bracket in Area Code 480
The most common earnings brackets in Area Code 480 are $100,000+ for men (183,802 | 24.2%) and $100,000+ for women (80,731 | 12.5%).
| Income | Male | Female |
| $2,499 or less | 24,667 (3.3%) | 29,515 (4.6%) |
| $2,500 to $4,999 | 15,706 (2.1%) | 20,398 (3.2%) |
| $5,000 to $7,499 | 19,495 (2.6%) | 21,957 (3.4%) |
| $7,500 to $9,999 | 11,972 (1.6%) | 16,446 (2.5%) |
| $10,000 to $12,499 | 17,427 (2.3%) | 20,918 (3.2%) |
| $12,500 to $14,999 | 15,085 (2.0%) | 17,354 (2.7%) |
| $15,000 to $17,499 | 14,267 (1.9%) | 17,646 (2.7%) |
| $17,500 to $19,999 | 11,783 (1.5%) | 15,009 (2.3%) |
| $20,000 to $22,499 | 14,957 (2.0%) | 17,660 (2.7%) |
| $22,500 to $24,999 | 21,289 (2.8%) | 21,986 (3.4%) |
| $25,000 to $29,999 | 41,672 (5.5%) | 39,907 (6.2%) |
| $30,000 to $34,999 | 38,714 (5.1%) | 36,742 (5.7%) |
| $35,000 to $39,999 | 36,129 (4.8%) | 37,702 (5.8%) |
| $40,000 to $44,999 | 37,759 (5.0%) | 35,277 (5.4%) |
| $45,000 to $49,999 | 37,846 (5.0%) | 37,042 (5.7%) |
| $50,000 to $54,999 | 31,518 (4.2%) | 29,817 (4.6%) |
| $55,000 to $64,999 | 58,165 (7.7%) | 51,382 (7.9%) |
| $65,000 to $74,999 | 44,690 (5.9%) | 39,478 (6.1%) |
| $75,000 to $99,999 | 82,151 (10.8%) | 60,533 (9.3%) |
| $100,000+ | 183,802 (24.2%) | 80,731 (12.5%) |
| Total | 759,094 (100.0%) | 647,500 (100.0%) |
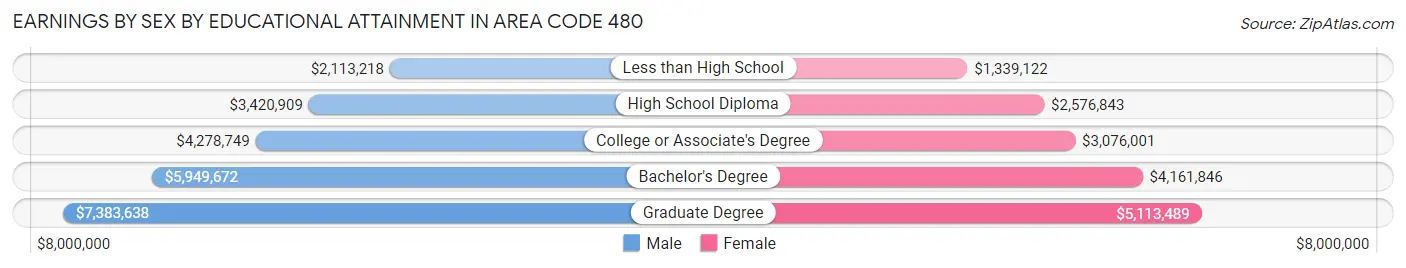
Earnings by Sex by Educational Attainment in Area Code 480
Average earnings in Area Code 480 are $4,909,565 for men and $3,626,077 for women, a difference of 26.1%. Men with an educational attainment of graduate degree enjoy the highest average annual earnings of $7,383,638, while those with less than high school education earn the least with $2,113,218. Women with an educational attainment of graduate degree earn the most with the average annual earnings of $5,113,489, while those with less than high school education have the smallest earnings of $1,339,122.
| Educational Attainment | Male Income | Female Income |
| Less than High School | $2,113,218 | $1,339,122 |
| High School Diploma | $3,420,909 | $2,576,843 |
| College or Associate's Degree | $4,278,749 | $3,076,001 |
| Bachelor's Degree | $5,949,672 | $4,161,846 |
| Graduate Degree | $7,383,638 | $5,113,489 |
| Total | $4,909,565 | $3,626,077 |
Family Income in Area Code 480
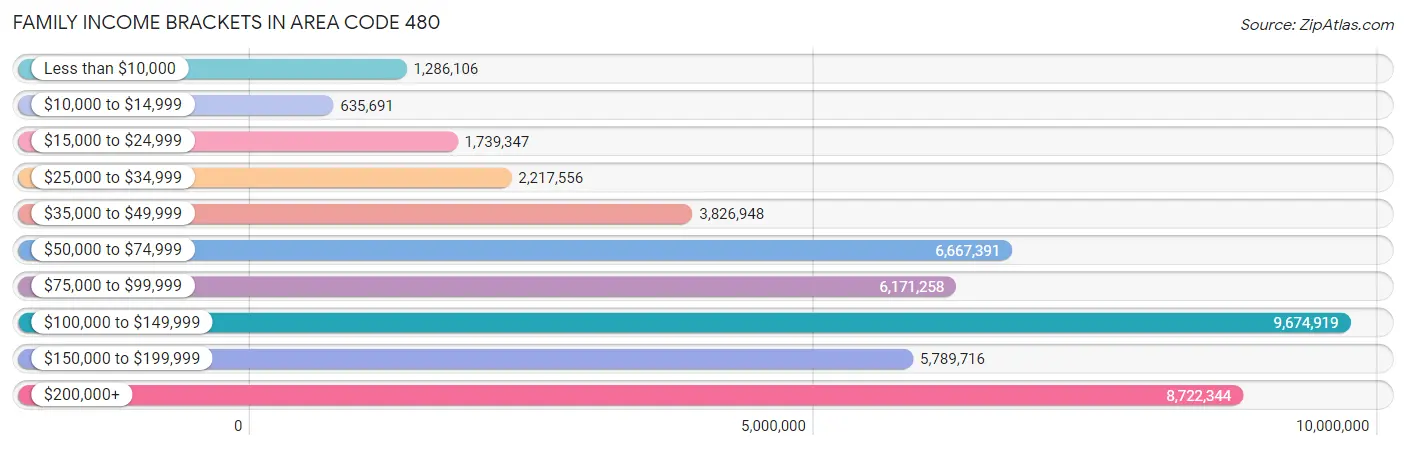
Family Income Brackets in Area Code 480
According to the Area Code 480 family income data, there are 9,674,919 families falling into the $100,000 to $149,999 income range, which is the most common income bracket and makes up 1,511.3% of all families. Conversely, the $10,000 to $14,999 income bracket is the least frequent group with only 635,691 families (99.3%) belonging to this category.
| Income Bracket | # Families | % Families |
| Less than $10,000 | 1,286,106 | 200.9% |
| $10,000 to $14,999 | 635,691 | 99.3% |
| $15,000 to $24,999 | 1,739,347 | 271.7% |
| $25,000 to $34,999 | 2,217,556 | 346.4% |
| $35,000 to $49,999 | 3,826,948 | 597.8% |
| $50,000 to $74,999 | 6,667,391 | 1,041.5% |
| $75,000 to $99,999 | 6,171,258 | 964.0% |
| $100,000 to $149,999 | 9,674,919 | 1,511.3% |
| $150,000 to $199,999 | 5,789,716 | 904.4% |
| $200,000+ | 8,722,344 | 1,362.5% |
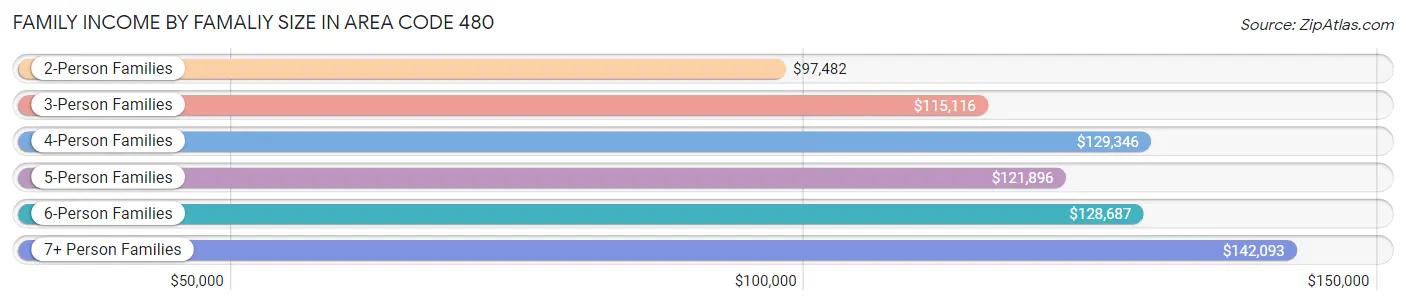
Family Income by Famaliy Size in Area Code 480
7+ person families (13,083 | 2.0%) account for the highest median family income in Area Code 480 with $142,093 per family, while 2-person families (308,097 | 48.1%) have the highest median income of $48,741 per family member.
| Income Bracket | # Families | Median Income |
| 2-Person Families | 308,097 (48.1%) | $97,482 |
| 3-Person Families | 135,530 (21.2%) | $115,116 |
| 4-Person Families | 109,494 (17.1%) | $129,346 |
| 5-Person Families | 51,545 (8.1%) | $121,896 |
| 6-Person Families | 22,423 (3.5%) | $128,687 |
| 7+ Person Families | 13,083 (2.0%) | $142,093 |
| Total | 640,172 (100.0%) | $107,719 |
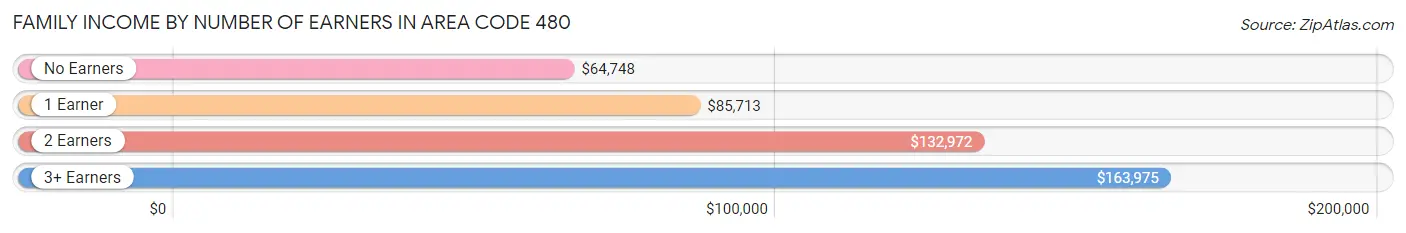
Family Income by Number of Earners in Area Code 480
The median family income in Area Code 480 is $107,719, with families comprising 3+ earners (74,125) having the highest median family income of $163,975, while families with no earners (96,329) have the lowest median family income of $64,748, accounting for 11.6% and 15.0% of families, respectively.
| Number of Earners | # Families | Median Income |
| No Earners | 96,329 (15.0%) | $64,748 |
| 1 Earner | 200,915 (31.4%) | $85,713 |
| 2 Earners | 268,803 (42.0%) | $132,972 |
| 3+ Earners | 74,125 (11.6%) | $163,975 |
| Total | 640,172 (100.0%) | $107,719 |
Household Income in Area Code 480
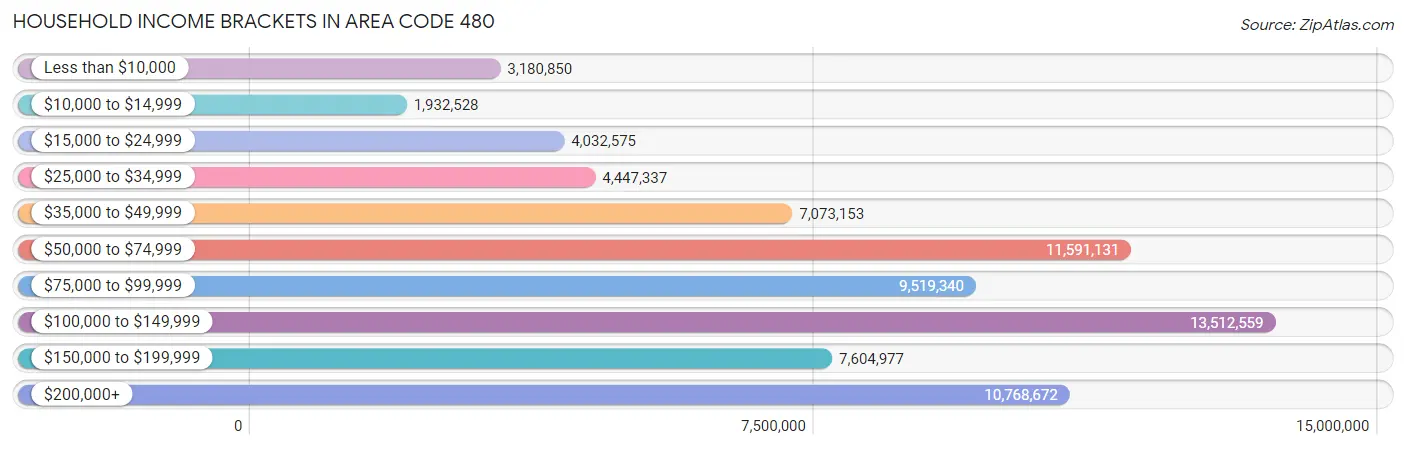
Household Income Brackets in Area Code 480
With 13,512,559 households falling in the category, the $100,000 to $149,999 income range is the most frequent in Area Code 480, accounting for 1,339.0% of all households. In contrast, only 1,932,528 households (191.5%) fall into the $10,000 to $14,999 income bracket, making it the least populous group.
| Income Bracket | # Households | % Households |
| Less than $10,000 | 3,180,850 | 315.2% |
| $10,000 to $14,999 | 1,932,528 | 191.5% |
| $15,000 to $24,999 | 4,032,575 | 399.6% |
| $25,000 to $34,999 | 4,447,337 | 440.7% |
| $35,000 to $49,999 | 7,073,153 | 700.9% |
| $50,000 to $74,999 | 11,591,131 | 1,148.6% |
| $75,000 to $99,999 | 9,519,340 | 943.3% |
| $100,000 to $149,999 | 13,512,559 | 1,339.0% |
| $150,000 to $199,999 | 7,604,977 | 753.6% |
| $200,000+ | 10,768,672 | 1,067.1% |
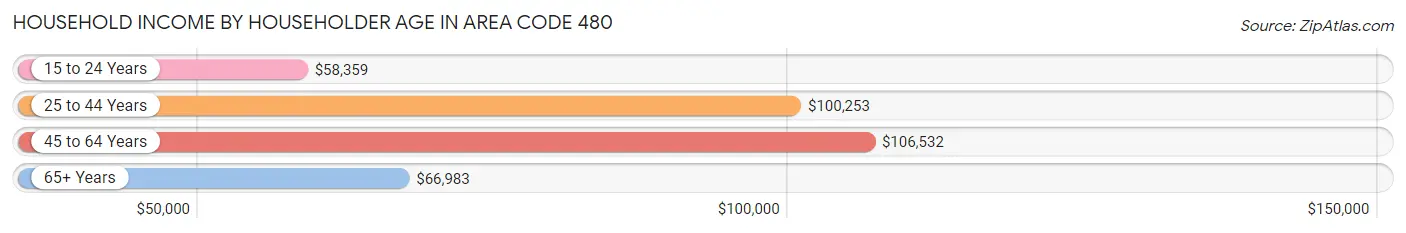
Household Income by Householder Age in Area Code 480
The median household income in Area Code 480 is $91,290, with the highest median household income of $106,532 found in the 45 to 64 years age bracket for the primary householder. A total of 363,683 households (36.0%) fall into this category. Meanwhile, the 15 to 24 years age bracket for the primary householder has the lowest median household income of $58,359, with 42,356 households (4.2%) in this group.
| Income Bracket | # Households | Median Income |
| 15 to 24 Years | 42,356 (4.2%) | $58,359 |
| 25 to 44 Years | 349,072 (34.6%) | $100,253 |
| 45 to 64 Years | 363,683 (36.0%) | $106,532 |
| 65+ Years | 254,042 (25.2%) | $66,983 |
| Total | 1,009,153 (100.0%) | $91,290 |
Poverty in Area Code 480
Income Below Poverty by Sex and Age in Area Code 480
With 9.5% poverty level for males and 11.1% for females among the residents of Area Code 480, 5 year old males and 5 year old females are the most vulnerable to poverty, with 2,411 males (15.9%) and 2,191 females (15.6%) in their respective age groups living below the poverty level.
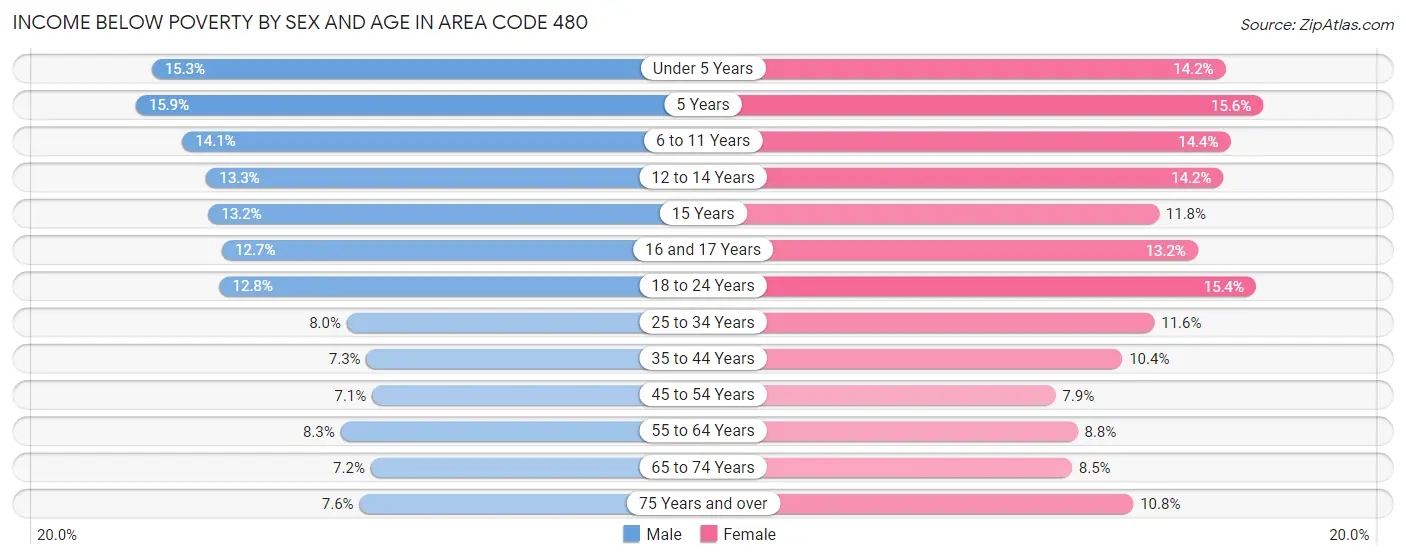
| Age Bracket | Male | Female |
| Under 5 Years | 10,833 (15.3%) | 9,722 (14.2%) |
| 5 Years | 2,411 (15.9%) | 2,191 (15.6%) |
| 6 to 11 Years | 13,648 (14.1%) | 12,729 (14.4%) |
| 12 to 14 Years | 6,858 (13.3%) | 7,036 (14.2%) |
| 15 Years | 2,363 (13.2%) | 1,845 (11.8%) |
| 16 and 17 Years | 4,288 (12.7%) | 4,313 (13.2%) |
| 18 to 24 Years | 14,500 (12.8%) | 16,198 (15.4%) |
| 25 to 34 Years | 15,287 (8.0%) | 21,115 (11.6%) |
| 35 to 44 Years | 12,431 (7.3%) | 17,060 (10.4%) |
| 45 to 54 Years | 11,644 (7.1%) | 12,895 (7.9%) |
| 55 to 64 Years | 12,514 (8.3%) | 13,865 (8.7%) |
| 65 to 74 Years | 7,929 (7.1%) | 10,866 (8.5%) |
| 75 Years and over | 5,740 (7.6%) | 10,561 (10.8%) |
| Total | 120,446 (9.5%) | 140,396 (11.1%) |
Income Above Poverty by Sex and Age in Area Code 480
According to the poverty statistics in Area Code 480, males aged 45 to 54 years and females aged 45 to 54 years are the age groups that are most secure financially, with 92.9% of males and 92.1% of females in these age groups living above the poverty line.
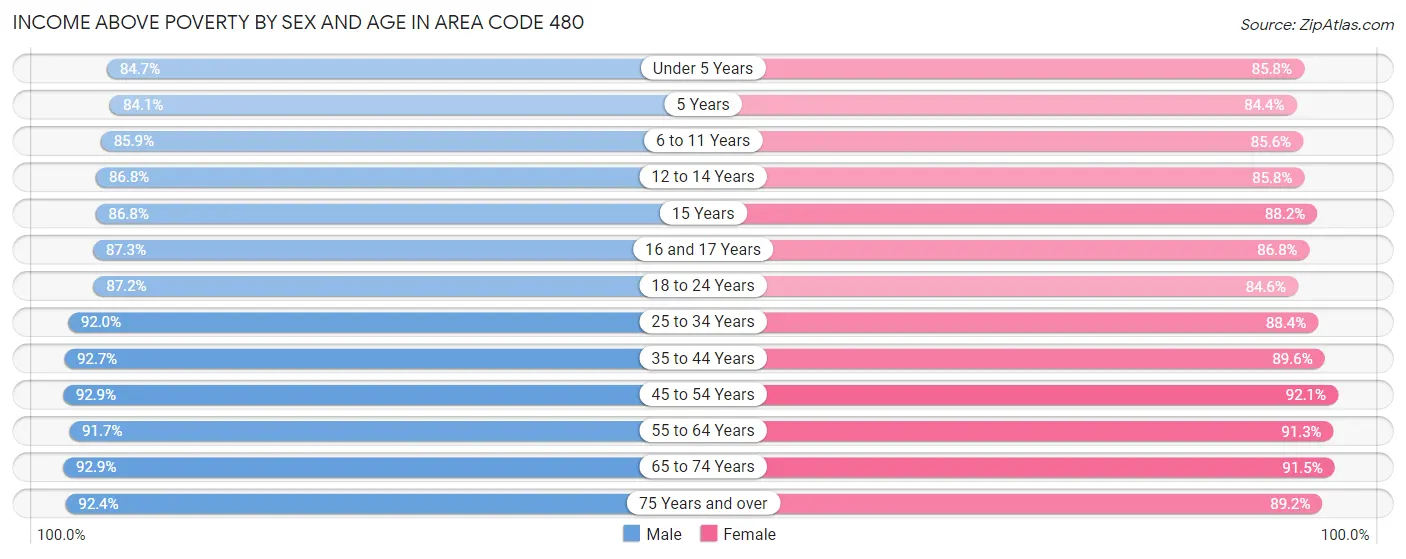
| Age Bracket | Male | Female |
| Under 5 Years | 60,082 (84.7%) | 58,540 (85.8%) |
| 5 Years | 12,779 (84.1%) | 11,820 (84.4%) |
| 6 to 11 Years | 82,871 (85.9%) | 75,516 (85.6%) |
| 12 to 14 Years | 44,911 (86.8%) | 42,658 (85.8%) |
| 15 Years | 15,566 (86.8%) | 13,827 (88.2%) |
| 16 and 17 Years | 29,566 (87.3%) | 28,340 (86.8%) |
| 18 to 24 Years | 99,127 (87.2%) | 89,206 (84.6%) |
| 25 to 34 Years | 174,941 (92.0%) | 160,985 (88.4%) |
| 35 to 44 Years | 157,691 (92.7%) | 146,787 (89.6%) |
| 45 to 54 Years | 152,448 (92.9%) | 149,613 (92.1%) |
| 55 to 64 Years | 138,768 (91.7%) | 144,670 (91.2%) |
| 65 to 74 Years | 102,997 (92.8%) | 116,317 (91.5%) |
| 75 Years and over | 70,050 (92.4%) | 87,082 (89.2%) |
| Total | 1,141,797 (90.5%) | 1,125,361 (88.9%) |
Income Below Poverty Among Married-Couple Families in Area Code 480
The poverty statistics for married-couple families in Area Code 480 show that 4.1% or 19,203 of the total 473,574 families live below the poverty line. Families with 5 or more children have the highest poverty rate of 18.5%, comprising of 869 families. On the other hand, families with no children have the lowest poverty rate of 3.0%, which includes 8,325 families.
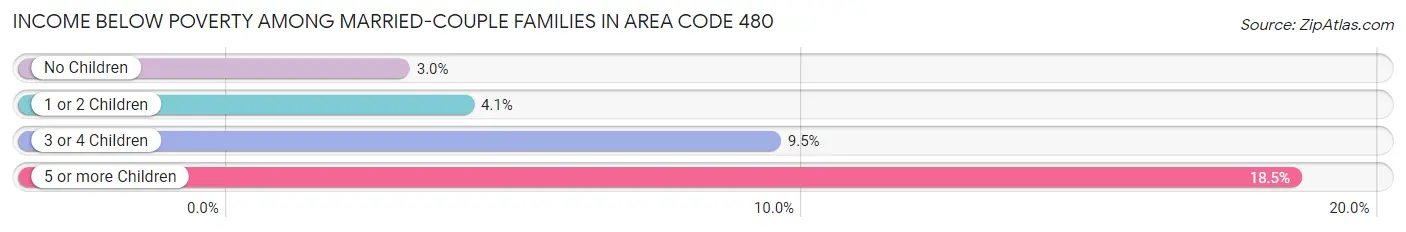
| Children | Above Poverty | Below Poverty |
| No Children | 270,502 (97.0%) | 8,325 (3.0%) |
| 1 or 2 Children | 142,776 (95.9%) | 6,118 (4.1%) |
| 3 or 4 Children | 37,270 (90.5%) | 3,891 (9.5%) |
| 5 or more Children | 3,823 (81.5%) | 869 (18.5%) |
| Total | 454,371 (96.0%) | 19,203 (4.1%) |
Income Below Poverty Among Single-Parent Households in Area Code 480
According to the poverty data in Area Code 480, 9.9% or 5,354 single-father households and 18.8% or 21,214 single-mother households are living below the poverty line. Among single-father households, those with 5 or more children have the highest poverty rate, with 203 households (24.8%) experiencing poverty. Likewise, among single-mother households, those with 5 or more children have the highest poverty rate, with 838 households (61.0%) falling below the poverty line.
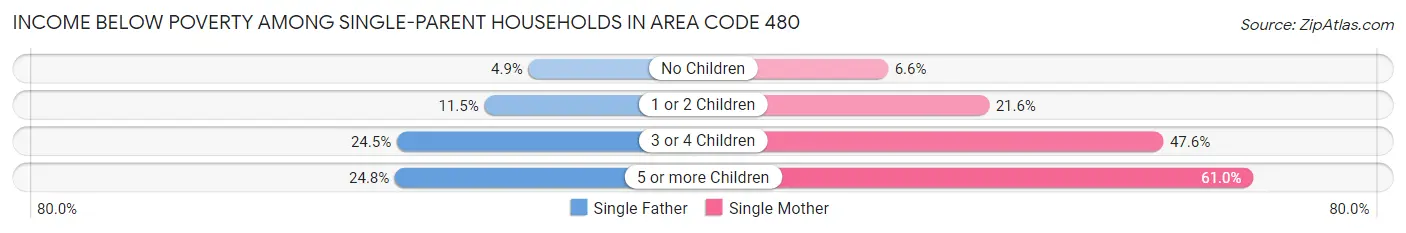
| Children | Single Father | Single Mother |
| No Children | 1,108 (4.9%) | 2,866 (6.6%) |
| 1 or 2 Children | 3,001 (11.5%) | 12,194 (21.6%) |
| 3 or 4 Children | 1,042 (24.5%) | 5,316 (47.6%) |
| 5 or more Children | 203 (24.8%) | 838 (61.0%) |
| Total | 5,354 (9.9%) | 21,214 (18.8%) |
Income Below Poverty Among Married-Couple vs Single-Parent Households in Area Code 480
The poverty data for Area Code 480 shows that 19,203 of the married-couple family households (4.1%) and 26,568 of the single-parent households (16.0%) are living below the poverty level. Within the married-couple family households, those with 5 or more children have the highest poverty rate, with 869 households (18.5%) falling below the poverty line. Among the single-parent households, those with 5 or more children have the highest poverty rate, with 1,041 household (47.5%) living below poverty.
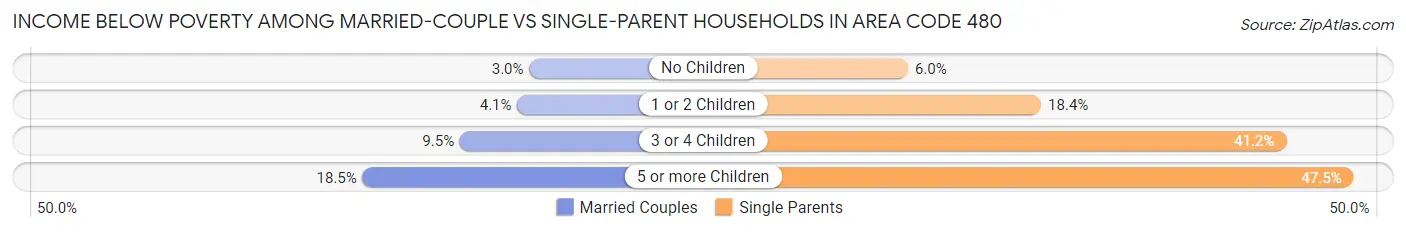
| Children | Married-Couple Families | Single-Parent Households |
| No Children | 8,325 (3.0%) | 3,974 (6.0%) |
| 1 or 2 Children | 6,118 (4.1%) | 15,195 (18.4%) |
| 3 or 4 Children | 3,891 (9.5%) | 6,358 (41.2%) |
| 5 or more Children | 869 (18.5%) | 1,041 (47.5%) |
| Total | 19,203 (4.1%) | 26,568 (16.0%) |
Race in Area Code 480
The most populous races in Area Code 480 are White / Caucasian (1,798,165 | 70.4%), Hispanic or Latino (655,215 | 25.7%), and Two or more Races (307,914 | 12.1%).
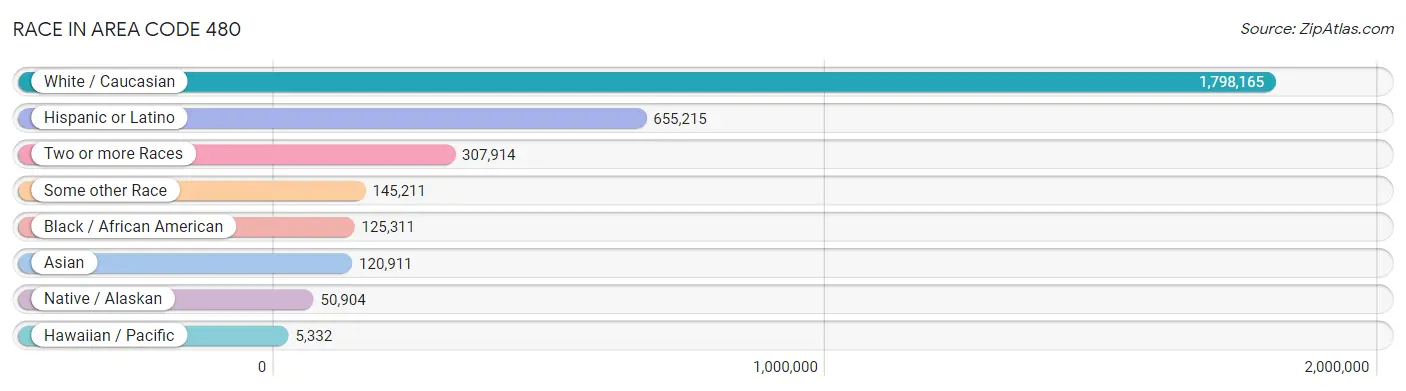
| Race | # Population | % Population |
| Asian | 120,911 | 4.7% |
| Black / African American | 125,311 | 4.9% |
| Hawaiian / Pacific | 5,332 | 0.2% |
| Hispanic or Latino | 655,215 | 25.7% |
| Native / Alaskan | 50,904 | 2.0% |
| White / Caucasian | 1,798,165 | 70.4% |
| Two or more Races | 307,914 | 12.1% |
| Some other Race | 145,211 | 5.7% |
| Total | 2,553,748 | 100.0% |
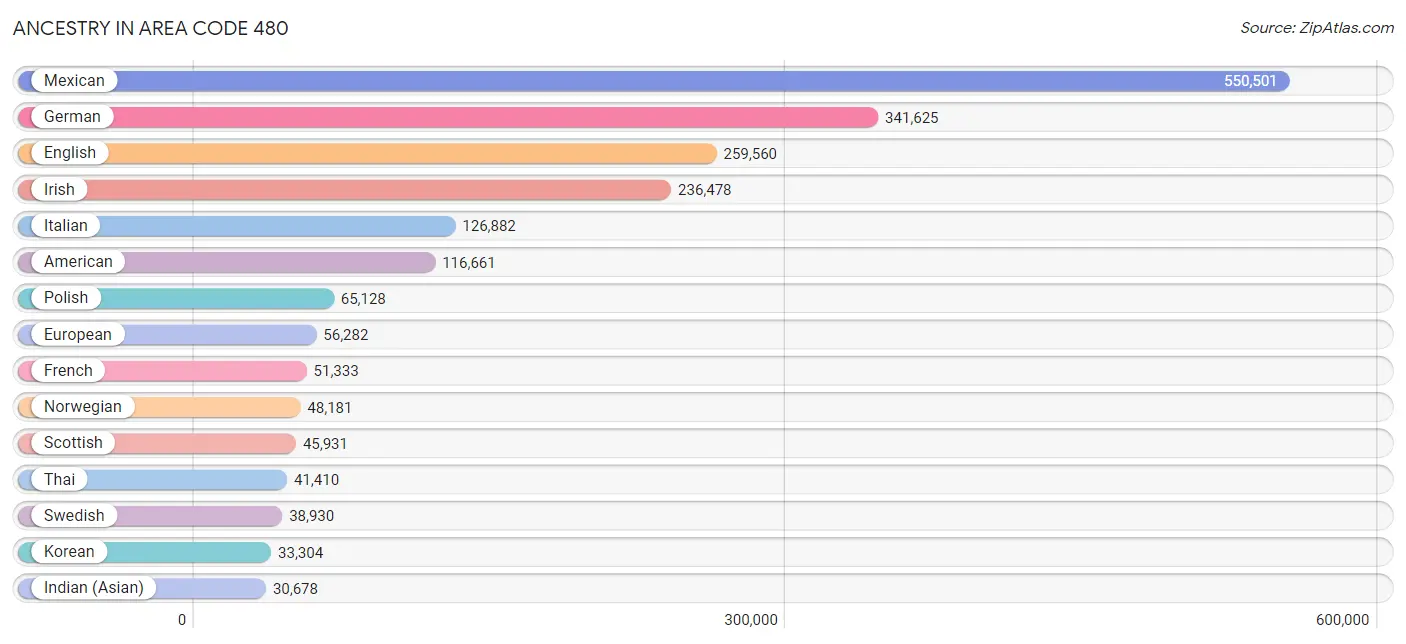
Ancestry in Area Code 480
The most populous ancestries reported in Area Code 480 are Mexican (550,501 | 21.6%), German (341,625 | 13.4%), English (259,560 | 10.2%), Irish (236,478 | 9.3%), and Italian (126,882 | 5.0%), together accounting for 59.3% of all Area Code 480 residents.
| Ancestry | # Population | % Population |
| Afghan | 759 | 0.0% |
| African | 9,429 | 0.4% |
| Alaska Native | 170 | 0.0% |
| Alaskan Athabascan | 171 | 0.0% |
| Albanian | 1,477 | 0.1% |
| Aleut | 262 | 0.0% |
| Alsatian | 33 | 0.0% |
| American | 116,661 | 4.6% |
| Apache | 3,565 | 0.1% |
| Arab | 15,893 | 0.6% |
| Arapaho | 69 | 0.0% |
| Argentinean | 2,051 | 0.1% |
| Armenian | 2,439 | 0.1% |
| Assyrian / Chaldean / Syriac | 1,913 | 0.1% |
| Australian | 1,149 | 0.0% |
| Austrian | 5,218 | 0.2% |
| Bahamian | 99 | 0.0% |
| Bangladeshi | 177 | 0.0% |
| Barbadian | 345 | 0.0% |
| Basque | 693 | 0.0% |
| Belgian | 2,482 | 0.1% |
| Belizean | 212 | 0.0% |
| Bhutanese | 13,787 | 0.5% |
| Blackfeet | 998 | 0.0% |
| Bolivian | 501 | 0.0% |
| Brazilian | 2,236 | 0.1% |
| British | 18,477 | 0.7% |
| British West Indian | 45 | 0.0% |
| Bulgarian | 1,266 | 0.1% |
| Burmese | 12,397 | 0.5% |
| Cajun | 252 | 0.0% |
| Cambodian | 206 | 0.0% |
| Canadian | 9,484 | 0.4% |
| Cape Verdean | 115 | 0.0% |
| Carpatho Rusyn | 39 | 0.0% |
| Celtic | 388 | 0.0% |
| Central American | 24,180 | 0.9% |
| Central American Indian | 2,173 | 0.1% |
| Cherokee | 6,092 | 0.2% |
| Cheyenne | 125 | 0.0% |
| Chickasaw | 590 | 0.0% |
| Chilean | 1,167 | 0.1% |
| Chinese | 25 | 0.0% |
| Chippewa | 747 | 0.0% |
| Choctaw | 2,234 | 0.1% |
| Colombian | 5,078 | 0.2% |
| Colville | 76 | 0.0% |
| Comanche | 243 | 0.0% |
| Costa Rican | 1,640 | 0.1% |
| Cree | 99 | 0.0% |
| Creek | 457 | 0.0% |
| Croatian | 4,562 | 0.2% |
| Crow | 10 | 0.0% |
| Cuban | 5,587 | 0.2% |
| Cypriot | 144 | 0.0% |
| Czech | 11,094 | 0.4% |
| Czechoslovakian | 3,337 | 0.1% |
| Danish | 17,287 | 0.7% |
| Delaware | 67 | 0.0% |
| Dominican | 2,211 | 0.1% |
| Dutch | 28,180 | 1.1% |
| Dutch West Indian | 33 | 0.0% |
| Eastern European | 9,549 | 0.4% |
| Ecuadorian | 2,044 | 0.1% |
| Egyptian | 1,528 | 0.1% |
| English | 259,560 | 10.2% |
| Estonian | 308 | 0.0% |
| Ethiopian | 2,057 | 0.1% |
| European | 56,282 | 2.2% |
| Fijian | 777 | 0.0% |
| Filipino | 1,717 | 0.1% |
| Finnish | 6,292 | 0.3% |
| French | 51,333 | 2.0% |
| French American Indian | 368 | 0.0% |
| French Canadian | 10,460 | 0.4% |
| German | 341,625 | 13.4% |
| German Russian | 93 | 0.0% |
| Ghanaian | 671 | 0.0% |
| Greek | 10,524 | 0.4% |
| Guamanian / Chamorro | 1,642 | 0.1% |
| Guatemalan | 10,561 | 0.4% |
| Guyanese | 268 | 0.0% |
| Haitian | 801 | 0.0% |
| Honduran | 1,623 | 0.1% |
| Hopi | 1,827 | 0.1% |
| Houma | 195 | 0.0% |
| Hungarian | 10,102 | 0.4% |
| Icelander | 296 | 0.0% |
| Indian (Asian) | 30,678 | 1.2% |
| Indonesian | 505 | 0.0% |
| Inupiat | 406 | 0.0% |
| Iranian | 5,256 | 0.2% |
| Iraqi | 2,045 | 0.1% |
| Irish | 236,478 | 9.3% |
| Iroquois | 491 | 0.0% |
| Israeli | 988 | 0.0% |
| Italian | 126,882 | 5.0% |
| Jamaican | 2,963 | 0.1% |
| Japanese | 1,948 | 0.1% |
| Jordanian | 927 | 0.0% |
| Kenyan | 467 | 0.0% |
| Kiowa | 318 | 0.0% |
| Korean | 33,304 | 1.3% |
| Laotian | 1,570 | 0.1% |
| Latvian | 700 | 0.0% |
| Lebanese | 5,637 | 0.2% |
| Liberian | 584 | 0.0% |
| Lithuanian | 5,144 | 0.2% |
| Lumbee | 43 | 0.0% |
| Luxembourger | 645 | 0.0% |
| Macedonian | 464 | 0.0% |
| Malaysian | 1,267 | 0.1% |
| Maltese | 215 | 0.0% |
| Marshallese | 109 | 0.0% |
| Menominee | 48 | 0.0% |
| Mexican | 550,501 | 21.6% |
| Mexican American Indian | 4,094 | 0.2% |
| Mongolian | 280 | 0.0% |
| Moroccan | 446 | 0.0% |
| Native Hawaiian | 4,516 | 0.2% |
| Navajo | 21,971 | 0.9% |
| New Zealander | 190 | 0.0% |
| Nicaraguan | 2,005 | 0.1% |
| Nigerian | 2,193 | 0.1% |
| Northern European | 5,176 | 0.2% |
| Norwegian | 48,181 | 1.9% |
| Okinawan | 34 | 0.0% |
| Osage | 128 | 0.0% |
| Ottawa | 27 | 0.0% |
| Paiute | 65 | 0.0% |
| Pakistani | 2,807 | 0.1% |
| Palestinian | 904 | 0.0% |
| Panamanian | 1,238 | 0.1% |
| Paraguayan | 128 | 0.0% |
| Pennsylvania German | 508 | 0.0% |
| Peruvian | 3,020 | 0.1% |
| Pima | 9,156 | 0.4% |
| Polish | 65,128 | 2.5% |
| Portuguese | 7,190 | 0.3% |
| Potawatomi | 356 | 0.0% |
| Pueblo | 854 | 0.0% |
| Puerto Rican | 18,628 | 0.7% |
| Puget Sound Salish | 153 | 0.0% |
| Romanian | 4,381 | 0.2% |
| Russian | 20,056 | 0.8% |
| Salvadoran | 6,943 | 0.3% |
| Samoan | 1,095 | 0.0% |
| Scandinavian | 10,806 | 0.4% |
| Scotch-Irish | 17,227 | 0.7% |
| Scottish | 45,931 | 1.8% |
| Seminole | 90 | 0.0% |
| Senegalese | 167 | 0.0% |
| Serbian | 3,450 | 0.1% |
| Shoshone | 231 | 0.0% |
| Sierra Leonean | 145 | 0.0% |
| Sioux | 1,382 | 0.1% |
| Slavic | 1,202 | 0.1% |
| Slovak | 4,157 | 0.2% |
| Slovene | 1,306 | 0.1% |
| Somali | 2,291 | 0.1% |
| South African | 880 | 0.0% |
| South American | 16,028 | 0.6% |
| South American Indian | 408 | 0.0% |
| Soviet Union | 50 | 0.0% |
| Spaniard | 12,269 | 0.5% |
| Spanish | 10,356 | 0.4% |
| Spanish American | 311 | 0.0% |
| Spanish American Indian | 59 | 0.0% |
| Sri Lankan | 16,264 | 0.6% |
| Subsaharan African | 20,769 | 0.8% |
| Sudanese | 603 | 0.0% |
| Swedish | 38,930 | 1.5% |
| Swiss | 8,212 | 0.3% |
| Syrian | 1,386 | 0.1% |
| Thai | 41,410 | 1.6% |
| Tlingit-Haida | 345 | 0.0% |
| Tohono O'Odham | 3,295 | 0.1% |
| Tongan | 919 | 0.0% |
| Trinidadian and Tobagonian | 463 | 0.0% |
| Tsimshian | 26 | 0.0% |
| Turkish | 1,595 | 0.1% |
| U.S. Virgin Islander | 38 | 0.0% |
| Ugandan | 39 | 0.0% |
| Ukrainian | 6,342 | 0.3% |
| Uruguayan | 107 | 0.0% |
| Ute | 234 | 0.0% |
| Venezuelan | 1,778 | 0.1% |
| Vietnamese | 1,734 | 0.1% |
| Welsh | 16,358 | 0.6% |
| West Indian | 639 | 0.0% |
| Yakama | 15 | 0.0% |
| Yaqui | 4,765 | 0.2% |
| Yugoslavian | 2,040 | 0.1% |
| Yuman | 1,042 | 0.0% |
| Yup'ik | 82 | 0.0% |
| Zimbabwean | 92 | 0.0% | View All 196 Rows |
Immigrants in Area Code 480
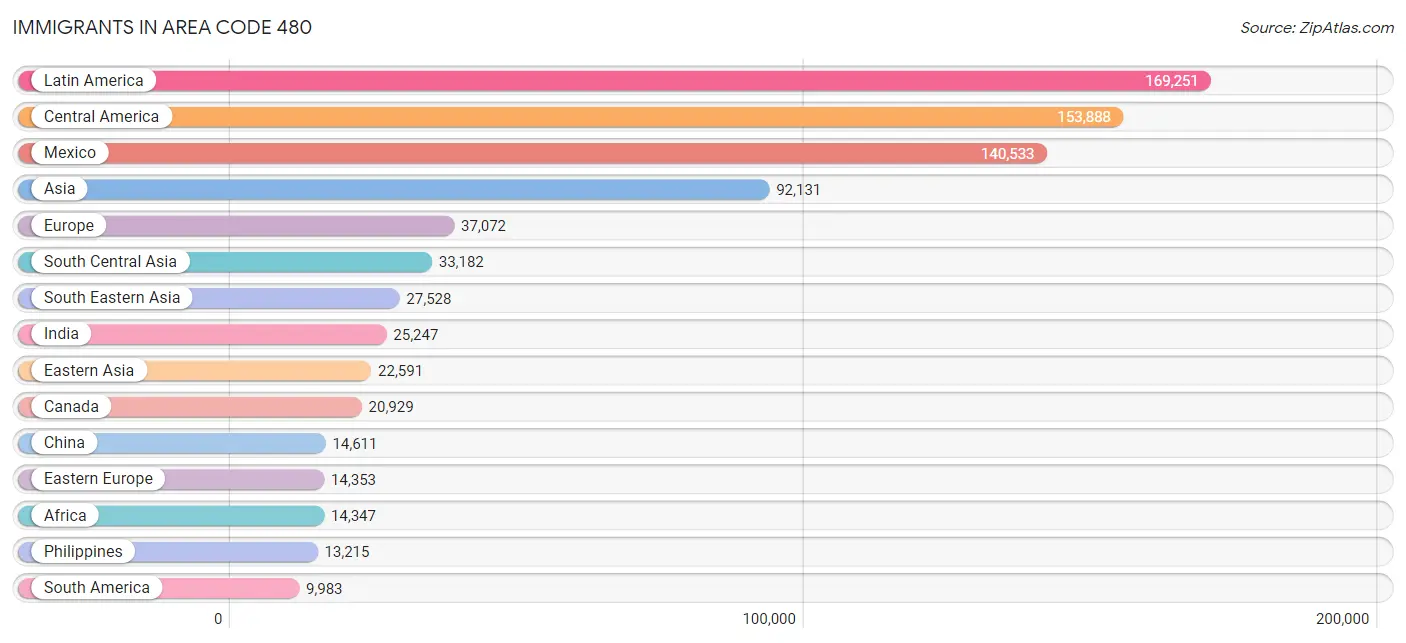
The most numerous immigrant groups reported in Area Code 480 came from Latin America (169,251 | 6.6%), Central America (153,888 | 6.0%), Mexico (140,533 | 5.5%), Asia (92,131 | 3.6%), and Europe (37,072 | 1.5%), together accounting for 23.2% of all Area Code 480 residents.
| Immigration Origin | # Population | % Population |
| Afghanistan | 501 | 0.0% |
| Africa | 14,347 | 0.6% |
| Albania | 1,077 | 0.0% |
| Argentina | 961 | 0.0% |
| Armenia | 129 | 0.0% |
| Asia | 92,131 | 3.6% |
| Australia | 934 | 0.0% |
| Austria | 377 | 0.0% |
| Bahamas | 29 | 0.0% |
| Bangladesh | 1,276 | 0.1% |
| Barbados | 369 | 0.0% |
| Belarus | 303 | 0.0% |
| Belgium | 199 | 0.0% |
| Belize | 162 | 0.0% |
| Bolivia | 127 | 0.0% |
| Bosnia and Herzegovina | 1,007 | 0.0% |
| Brazil | 1,201 | 0.1% |
| Bulgaria | 772 | 0.0% |
| Cambodia | 694 | 0.0% |
| Cameroon | 303 | 0.0% |
| Canada | 20,929 | 0.8% |
| Caribbean | 5,380 | 0.2% |
| Central America | 153,888 | 6.0% |
| Chile | 756 | 0.0% |
| China | 14,611 | 0.6% |
| Colombia | 2,626 | 0.1% |
| Congo | 290 | 0.0% |
| Costa Rica | 783 | 0.0% |
| Croatia | 792 | 0.0% |
| Cuba | 2,128 | 0.1% |
| Czechoslovakia | 666 | 0.0% |
| Denmark | 165 | 0.0% |
| Dominica | 54 | 0.0% |
| Dominican Republic | 900 | 0.0% |
| Eastern Africa | 6,707 | 0.3% |
| Eastern Asia | 22,591 | 0.9% |
| Eastern Europe | 14,353 | 0.6% |
| Ecuador | 896 | 0.0% |
| Egypt | 887 | 0.0% |
| El Salvador | 3,479 | 0.1% |
| England | 4,319 | 0.2% |
| Eritrea | 266 | 0.0% |
| Ethiopia | 2,280 | 0.1% |
| Europe | 37,072 | 1.5% |
| Fiji | 153 | 0.0% |
| France | 1,774 | 0.1% |
| Germany | 5,027 | 0.2% |
| Ghana | 326 | 0.0% |
| Greece | 709 | 0.0% |
| Grenada | 13 | 0.0% |
| Guatemala | 6,341 | 0.3% |
| Guyana | 435 | 0.0% |
| Haiti | 573 | 0.0% |
| Honduras | 928 | 0.0% |
| Hong Kong | 1,036 | 0.0% |
| Hungary | 747 | 0.0% |
| India | 25,247 | 1.0% |
| Indonesia | 1,145 | 0.0% |
| Iran | 3,454 | 0.1% |
| Iraq | 2,562 | 0.1% |
| Ireland | 682 | 0.0% |
| Israel | 1,022 | 0.0% |
| Italy | 2,118 | 0.1% |
| Jamaica | 904 | 0.0% |
| Japan | 2,628 | 0.1% |
| Jordan | 624 | 0.0% |
| Kazakhstan | 159 | 0.0% |
| Kenya | 1,625 | 0.1% |
| Korea | 5,281 | 0.2% |
| Kuwait | 172 | 0.0% |
| Laos | 449 | 0.0% |
| Latin America | 169,251 | 6.6% |
| Latvia | 131 | 0.0% |
| Lebanon | 1,011 | 0.0% |
| Liberia | 434 | 0.0% |
| Lithuania | 228 | 0.0% |
| Malaysia | 885 | 0.0% |
| Mexico | 140,533 | 5.5% |
| Micronesia | 103 | 0.0% |
| Middle Africa | 977 | 0.0% |
| Moldova | 137 | 0.0% |
| Morocco | 337 | 0.0% |
| Nepal | 344 | 0.0% |
| Netherlands | 1,261 | 0.1% |
| Nicaragua | 1,188 | 0.1% |
| Nigeria | 1,142 | 0.0% |
| North Macedonia | 48 | 0.0% |
| Northern Africa | 1,933 | 0.1% |
| Northern Europe | 9,681 | 0.4% |
| Norway | 154 | 0.0% |
| Oceania | 2,570 | 0.1% |
| Pakistan | 1,583 | 0.1% |
| Panama | 474 | 0.0% |
| Peru | 1,545 | 0.1% |
| Philippines | 13,215 | 0.5% |
| Poland | 1,650 | 0.1% |
| Portugal | 189 | 0.0% |
| Romania | 1,853 | 0.1% |
| Russia | 1,805 | 0.1% |
| Saudi Arabia | 448 | 0.0% |
| Scotland | 652 | 0.0% |
| Senegal | 205 | 0.0% |
| Serbia | 649 | 0.0% |
| Sierra Leone | 126 | 0.0% |
| Singapore | 238 | 0.0% |
| Somalia | 1,049 | 0.0% |
| South Africa | 1,450 | 0.1% |
| South America | 9,983 | 0.4% |
| South Central Asia | 33,182 | 1.3% |
| South Eastern Asia | 27,528 | 1.1% |
| Southern Europe | 4,014 | 0.2% |
| Spain | 979 | 0.0% |
| Sri Lanka | 325 | 0.0% |
| Sudan | 462 | 0.0% |
| Sweden | 541 | 0.0% |
| Switzerland | 210 | 0.0% |
| Syria | 891 | 0.0% |
| Taiwan | 2,812 | 0.1% |
| Thailand | 1,480 | 0.1% |
| Trinidad and Tobago | 348 | 0.0% |
| Turkey | 850 | 0.0% |
| Uganda | 170 | 0.0% |
| Ukraine | 1,055 | 0.0% |
| Uruguay | 73 | 0.0% |
| Uzbekistan | 198 | 0.0% |
| Venezuela | 1,283 | 0.1% |
| Vietnam | 9,150 | 0.4% |
| Western Africa | 2,452 | 0.1% |
| Western Asia | 8,293 | 0.3% |
| Western Europe | 8,914 | 0.4% |
| Yemen | 91 | 0.0% |
| Zaire | 300 | 0.0% |
| Zimbabwe | 205 | 0.0% | View All 133 Rows |
Sex and Age in Area Code 480
Sex and Age in Area Code 480
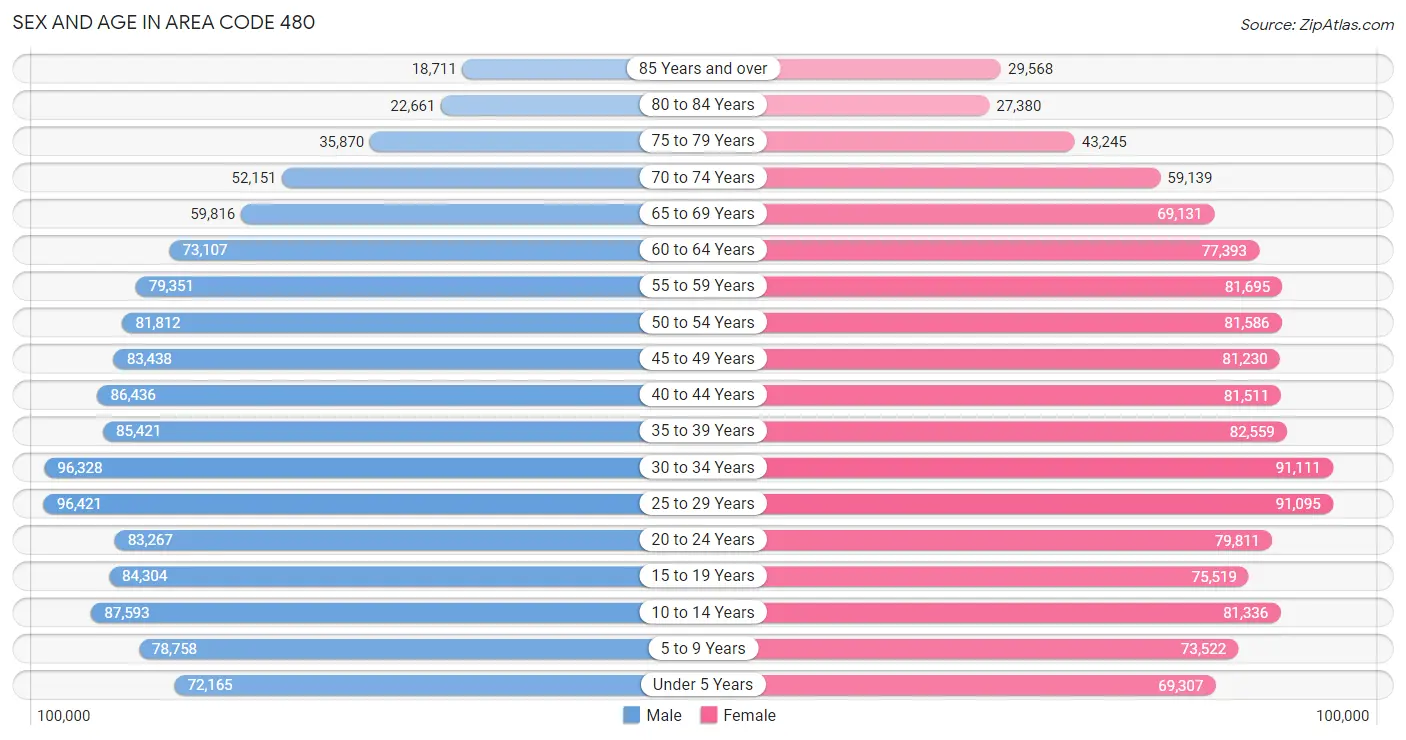
The most populous age groups in Area Code 480 are 25 to 29 Years (96,421 | 7.5%) for men and 30 to 34 Years (91,111 | 7.1%) for women.
| Age Bracket | Male | Female |
| Under 5 Years | 72,165 (5.7%) | 69,307 (5.4%) |
| 5 to 9 Years | 78,758 (6.2%) | 73,522 (5.8%) |
| 10 to 14 Years | 87,593 (6.9%) | 81,336 (6.4%) |
| 15 to 19 Years | 84,304 (6.6%) | 75,519 (5.9%) |
| 20 to 24 Years | 83,267 (6.5%) | 79,811 (6.2%) |
| 25 to 29 Years | 96,421 (7.5%) | 91,095 (7.1%) |
| 30 to 34 Years | 96,328 (7.5%) | 91,111 (7.1%) |
| 35 to 39 Years | 85,421 (6.7%) | 82,559 (6.5%) |
| 40 to 44 Years | 86,436 (6.8%) | 81,511 (6.4%) |
| 45 to 49 Years | 83,438 (6.5%) | 81,230 (6.4%) |
| 50 to 54 Years | 81,812 (6.4%) | 81,586 (6.4%) |
| 55 to 59 Years | 79,351 (6.2%) | 81,695 (6.4%) |
| 60 to 64 Years | 73,107 (5.7%) | 77,393 (6.1%) |
| 65 to 69 Years | 59,816 (4.7%) | 69,131 (5.4%) |
| 70 to 74 Years | 52,151 (4.1%) | 59,139 (4.6%) |
| 75 to 79 Years | 35,870 (2.8%) | 43,245 (3.4%) |
| 80 to 84 Years | 22,661 (1.8%) | 27,380 (2.1%) |
| 85 Years and over | 18,711 (1.5%) | 29,568 (2.3%) |
| Total | 1,277,610 (100.0%) | 1,276,138 (100.0%) |
Families and Households in Area Code 480
Median Family Size in Area Code 480
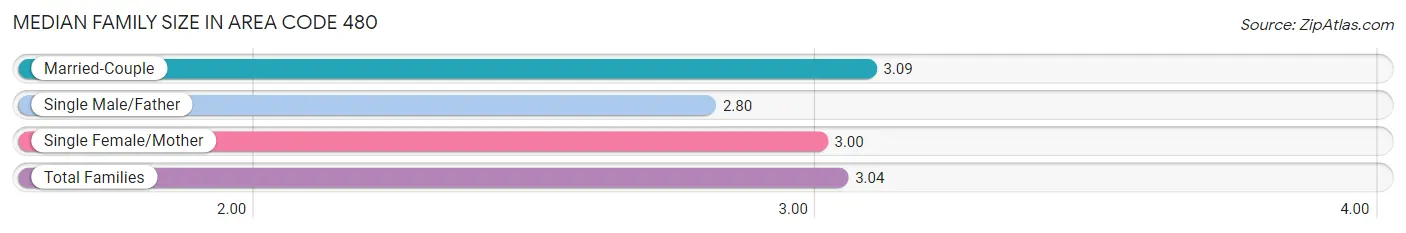
The median family size in Area Code 480 is 3.04 persons per family, with married-couple families (473,574 | 74.0%) accounting for the largest median family size of 3.08972 persons per family. On the other hand, single male/father families (53,915 | 8.4%) represent the smallest median family size with 2.80 persons per family.
| Family Type | # Families | Family Size |
| Married-Couple | 473,574 (74.0%) | 3.09 |
| Single Male/Father | 53,915 (8.4%) | 2.80 |
| Single Female/Mother | 112,683 (17.6%) | 3.00 |
| Total Families | 640,172 (100.0%) | 3.04 |
Median Household Size in Area Code 480
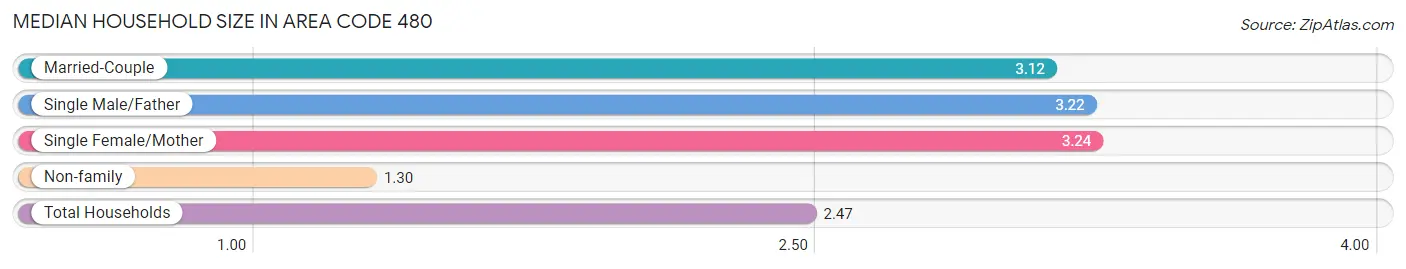
The median household size in Area Code 480 is 2.47 persons per household, with single female/mother households (112,683 | 11.2%) accounting for the largest median household size of 3.24068 persons per household. non-family households (368,981 | 36.6%) represent the smallest median household size with 1.30 persons per household.
| Household Type | # Households | Household Size |
| Married-Couple | 473,574 (46.9%) | 3.12 |
| Single Male/Father | 53,915 (5.3%) | 3.22 |
| Single Female/Mother | 112,683 (11.2%) | 3.24 |
| Non-family | 368,981 (36.6%) | 1.30 |
| Total Households | 1,009,153 (100.0%) | 2.47 |
Household Size by Marriage Status in Area Code 480
Out of a total of 1,009,153 households in Area Code 480, 640,172 (63.4%) are family households, while 368,981 (36.6%) are nonfamily households. The most numerous type of family households are 2-person households, comprising 285,369, and the most common type of nonfamily households are 1-person households, comprising 281,132.
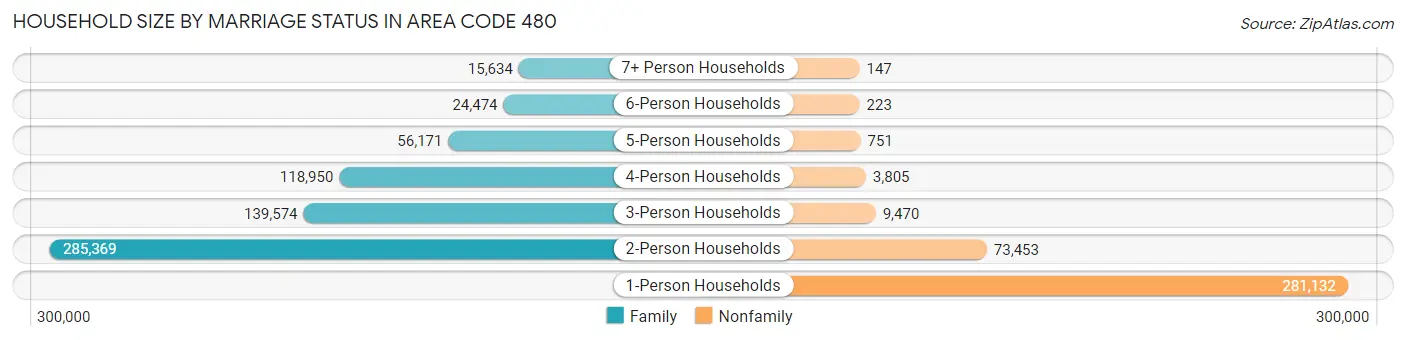
| Household Size | Family Households | Nonfamily Households |
| 1-Person Households | - | 281,132 (27.9%) |
| 2-Person Households | 285,369 (28.3%) | 73,453 (7.3%) |
| 3-Person Households | 139,574 (13.8%) | 9,470 (0.9%) |
| 4-Person Households | 118,950 (11.8%) | 3,805 (0.4%) |
| 5-Person Households | 56,171 (5.6%) | 751 (0.1%) |
| 6-Person Households | 24,474 (2.4%) | 223 (0.0%) |
| 7+ Person Households | 15,634 (1.5%) | 147 (0.0%) |
| Total | 640,172 (63.4%) | 368,981 (36.6%) |
Female Fertility in Area Code 480
Fertility by Age in Area Code 480
Average fertility rate in Area Code 480 is 49.9 births per 1,000 women. Women in the age bracket of 20 to 34 years have the highest fertility rate with 84.0 births per 1,000 women. Women in the age bracket of 20 to 34 years acount for 68.4% of all women with births.
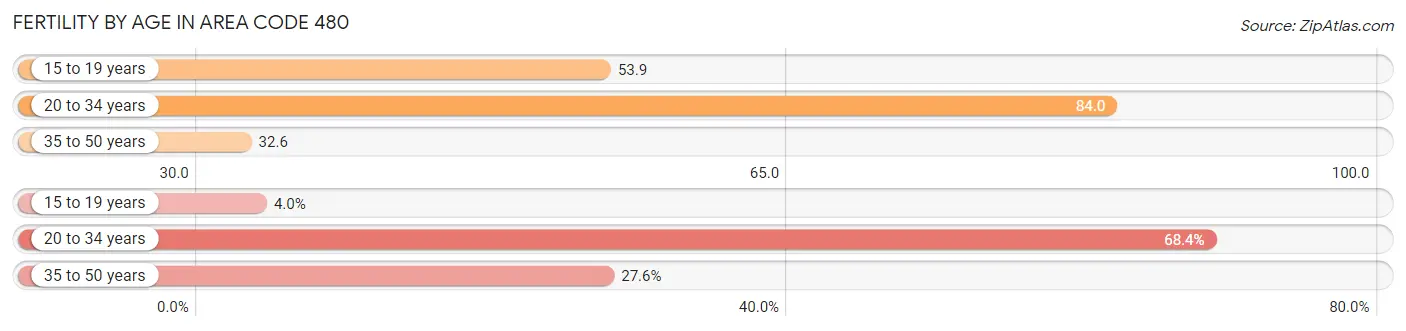
| Age Bracket | Women with Births | Births / 1,000 Women |
| 15 to 19 years | 1,222 (4.0%) | 53.9 |
| 20 to 34 years | 20,886 (68.4%) | 84.0 |
| 35 to 50 years | 8,414 (27.6%) | 32.6 |
| Total | 30,522 (100.0%) | 49.9 |
Fertility by Age by Marriage Status in Area Code 480
66.7% of women with births (30,522) in Area Code 480 are married. The highest percentage of unmarried women with births falls into 15 to 19 years age bracket with 99.4% of them unmarried at the time of birth, while the lowest percentage of unmarried women with births belong to 35 to 50 years age bracket with 28.1% of them unmarried.
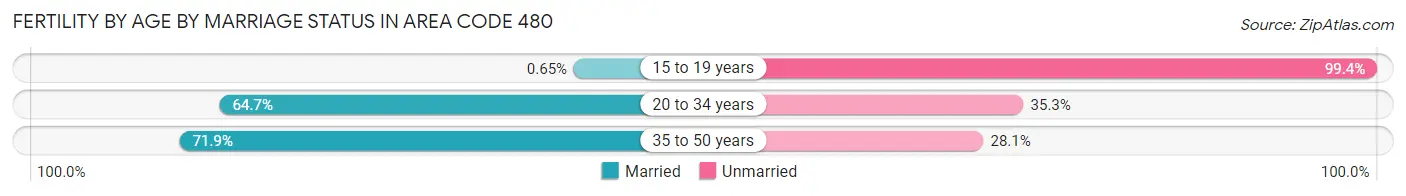
| Age Bracket | Married | Unmarried |
| 15 to 19 years | 8 (0.6%) | 1,214 (99.4%) |
| 20 to 34 years | 13,510 (64.7%) | 7,376 (35.3%) |
| 35 to 50 years | 6,052 (71.9%) | 2,362 (28.1%) |
| Total | 20,353 (66.7%) | 10,169 (33.3%) |
Fertility by Education in Area Code 480
Average fertility rate in Area Code 480 is 49.9 births per 1,000 women. Women with the education attainment of graduate degree have the highest fertility rate of 71.2 births per 1,000 women, while women with the education attainment of college or associate's degree have the lowest fertility at 48.1 births per 1,000 women. Women with the education attainment of college or associate's degree represent 28.3% of all women with births.
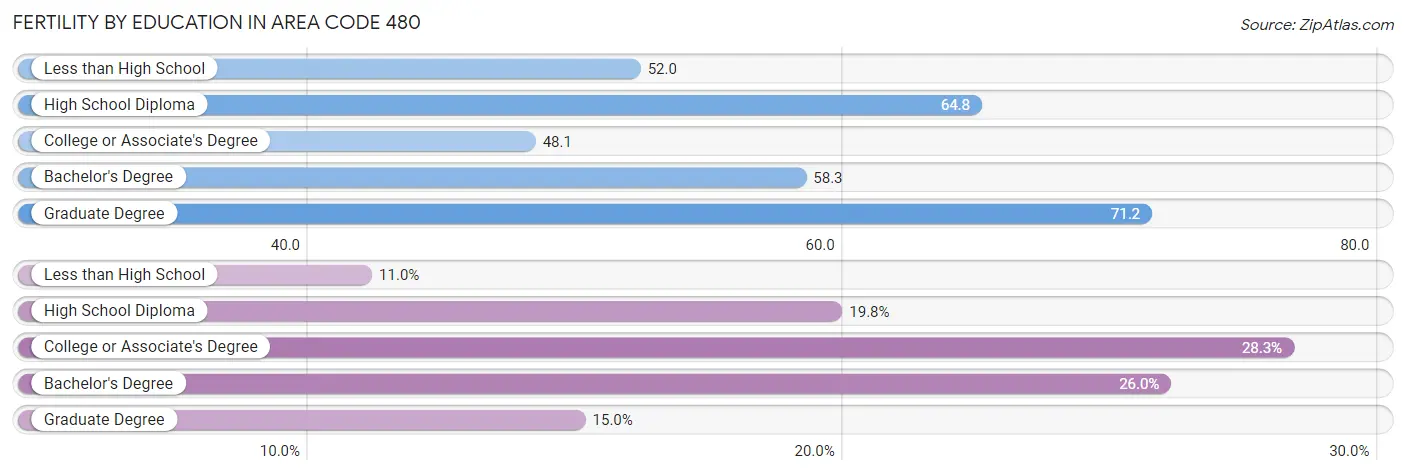
| Educational Attainment | Women with Births | Births / 1,000 Women |
| Less than High School | 3,353 (11.0%) | 52.0 |
| High School Diploma | 6,043 (19.8%) | 64.8 |
| College or Associate's Degree | 8,626 (28.3%) | 48.1 |
| Bachelor's Degree | 7,924 (26.0%) | 58.2 |
| Graduate Degree | 4,576 (15.0%) | 71.2 |
| Total | 30,522 (100.0%) | 49.9 |
Fertility by Education by Marriage Status in Area Code 480
33.3% of women with births in Area Code 480 are unmarried. Women with the educational attainment of graduate degree are most likely to be married with 78.4% of them married at childbirth, while women with the educational attainment of less than high school are least likely to be married with 73.4% of them unmarried at childbirth.
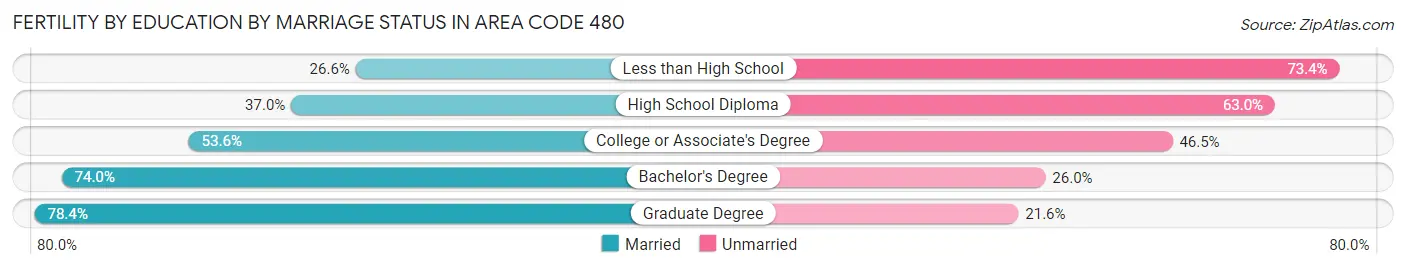
| Educational Attainment | Married | Unmarried |
| Less than High School | 893 (26.6%) | 2,460 (73.4%) |
| High School Diploma | 2,238 (37.0%) | 3,805 (63.0%) |
| College or Associate's Degree | 4,619 (53.5%) | 4,007 (46.5%) |
| Bachelor's Degree | 5,866 (74.0%) | 2,058 (26.0%) |
| Graduate Degree | 3,587 (78.4%) | 989 (21.6%) |
| Total | 20,353 (66.7%) | 10,169 (33.3%) |
Employment Characteristics in Area Code 480
Employment by Class of Employer in Area Code 480
Among the 1,282,209 employed individuals in Area Code 480, private company employees (918,303 | 71.6%), not-for-profit organizations (86,322 | 6.7%), and self-employed (not incorporated) (74,435 | 5.8%) make up the most common classes of employment.
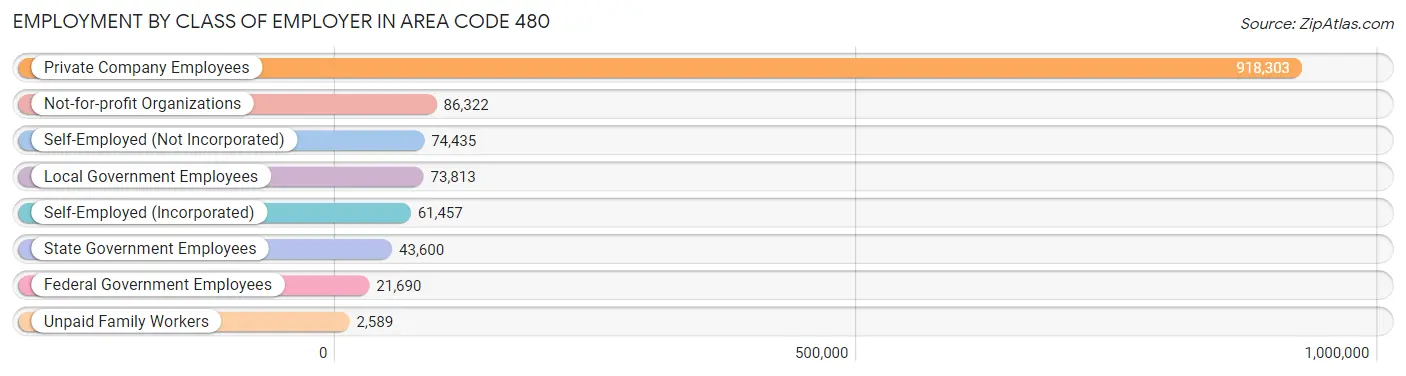
| Employer Class | # Employees | % Employees |
| Private Company Employees | 918,303 | 71.6% |
| Self-Employed (Incorporated) | 61,457 | 4.8% |
| Self-Employed (Not Incorporated) | 74,435 | 5.8% |
| Not-for-profit Organizations | 86,322 | 6.7% |
| Local Government Employees | 73,813 | 5.8% |
| State Government Employees | 43,600 | 3.4% |
| Federal Government Employees | 21,690 | 1.7% |
| Unpaid Family Workers | 2,589 | 0.2% |
| Total | 1,282,209 | 100.0% |
Employment Status by Age in Area Code 480
According to the labor force statistics for Area Code 480, out of the total population over 16 years of age (2,057,322), 64.6% or 1,328,413 individuals are in the labor force, with 4.7% or 62,037 of them unemployed. The age group with the highest labor force participation rate is 25 to 29 years, with 85.3% or 159,914 individuals in the labor force. Within the labor force, the 16 to 19 years age range has the highest percentage of unemployed individuals, with 976.4% or 529,834 of them being unemployed.
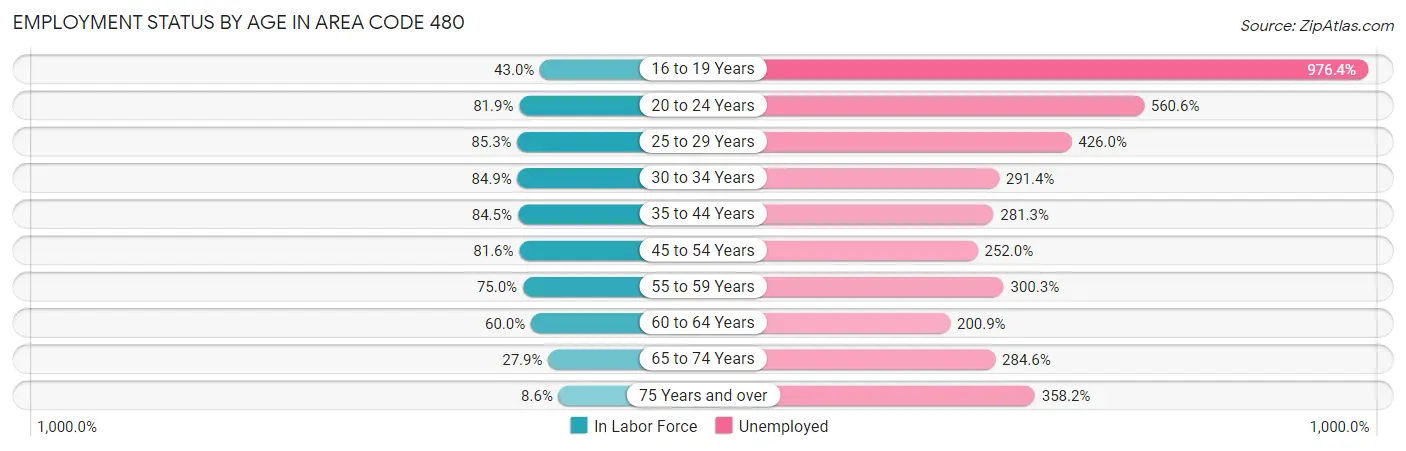
| Age Bracket | In Labor Force | Unemployed |
| 16 to 19 Years | 54,267 (43.0%) | 529,834 (976.4%) |
| 20 to 24 Years | 133,572 (81.9%) | 748,833 (560.6%) |
| 25 to 29 Years | 159,912 (85.3%) | 681,234 (426.0%) |
| 30 to 34 Years | 159,214 (84.9%) | 463,941 (291.4%) |
| 35 to 44 Years | 283,774 (84.5%) | 798,211 (281.3%) |
| 45 to 54 Years | 267,832 (81.6%) | 674,939 (252.0%) |
| 55 to 59 Years | 120,767 (75.0%) | 362,666 (300.3%) |
| 60 to 64 Years | 90,244 (60.0%) | 181,292 (200.9%) |
| 65 to 74 Years | 67,016 (27.9%) | 190,756 (284.6%) |
| 75 Years and over | 15,178 (8.6%) | 54,343 (358.2%) |
| Total | 1,328,354 (64.6%) | 61,980 (4.7%) |
Employment Status by Educational Attainment in Area Code 480
According to labor force statistics for Area Code 480, 79.7% of individuals (1,076,614) out of the total population between 25 and 64 years of age (1,350,494) are in the labor force, with 291.1% or 3,134,023 of them being unemployed. The group with the highest labor force participation rate are those with the educational attainment of bachelor's degree or higher, with 85.9% or 482,097 individuals in the labor force. Within the labor force, individuals with less than high school education have the highest percentage of unemployment, with 499.0% or 365,552 of them being unemployed.
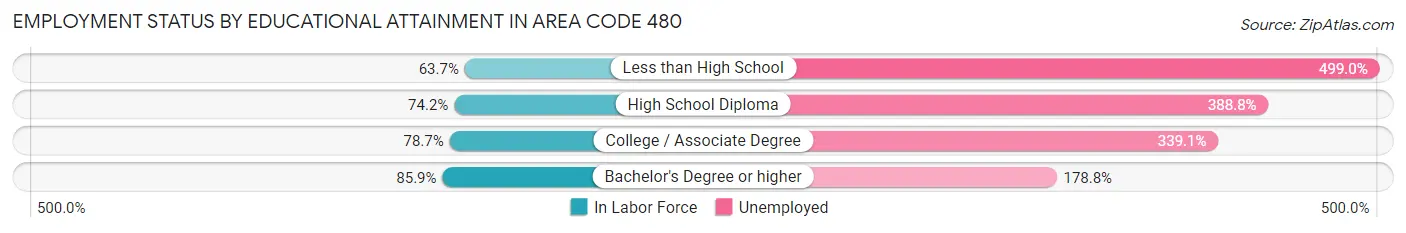
| Educational Attainment | In Labor Force | Unemployed |
| Less than High School | 73,261 (63.7%) | 574,045 (499.0%) |
| High School Diploma | 190,394 (74.2%) | 997,847 (388.8%) |
| College / Associate Degree | 328,501 (78.7%) | 1,414,895 (339.1%) |
| Bachelor's Degree or higher | 482,093 (85.9%) | 1,004,064 (178.8%) |
| Total | 1,076,603 (79.7%) | 3,931,288 (291.1%) |
Employment Occupations by Sex in Area Code 480
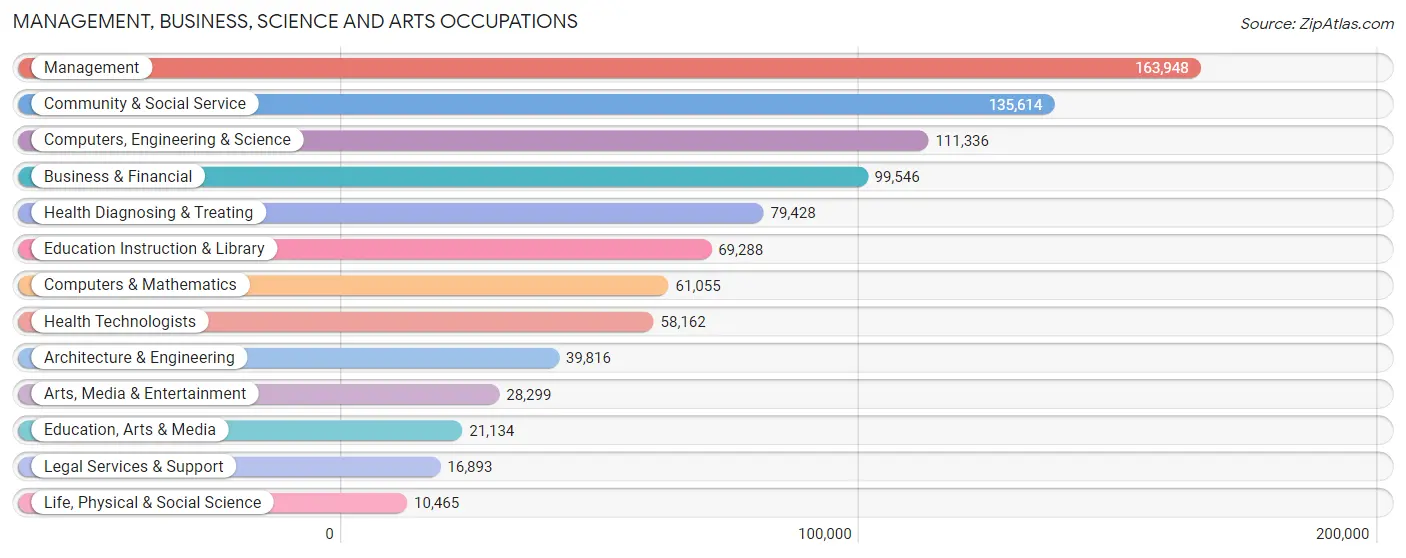
Management, Business, Science and Arts Occupations
The most common Management, Business, Science and Arts occupations in Area Code 480 are Management (163,948 | 12.6%), Community & Social Service (135,614 | 10.4%), Computers, Engineering & Science (111,336 | 8.6%), Business & Financial (99,546 | 7.6%), and Health Diagnosing & Treating (79,428 | 6.1%).
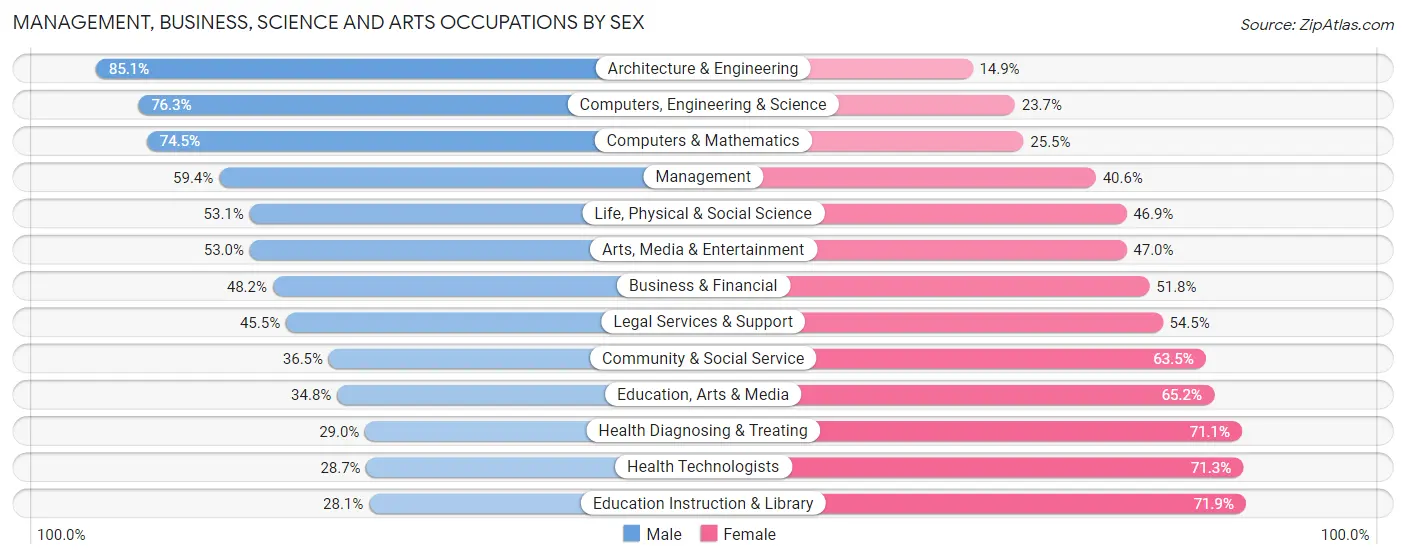
Management, Business, Science and Arts Occupations by Sex
Within the Management, Business, Science and Arts occupations in Area Code 480, the most male-oriented occupations are Architecture & Engineering (85.1%), Computers, Engineering & Science (76.3%), and Computers & Mathematics (74.5%), while the most female-oriented occupations are Education Instruction & Library (71.9%), Health Technologists (71.3%), and Health Diagnosing & Treating (71.1%).
| Occupation | Male | Female |
| Management | 97,424 (59.4%) | 66,524 (40.6%) |
| Business & Financial | 48,004 (48.2%) | 51,542 (51.8%) |
| Computers, Engineering & Science | 84,940 (76.3%) | 26,396 (23.7%) |
| Computers & Mathematics | 45,490 (74.5%) | 15,565 (25.5%) |
| Architecture & Engineering | 33,897 (85.1%) | 5,919 (14.9%) |
| Life, Physical & Social Science | 5,553 (53.1%) | 4,912 (46.9%) |
| Community & Social Service | 49,536 (36.5%) | 86,078 (63.5%) |
| Education, Arts & Media | 7,354 (34.8%) | 13,780 (65.2%) |
| Legal Services & Support | 7,682 (45.5%) | 9,211 (54.5%) |
| Education Instruction & Library | 19,492 (28.1%) | 49,796 (71.9%) |
| Arts, Media & Entertainment | 15,008 (53.0%) | 13,291 (47.0%) |
| Health Diagnosing & Treating | 22,997 (28.9%) | 56,431 (71.1%) |
| Health Technologists | 16,687 (28.7%) | 41,475 (71.3%) |
| Total (Category) | 302,901 (51.3%) | 286,971 (48.6%) |
| Total (Overall) | 705,216 (54.2%) | 596,558 (45.8%) |
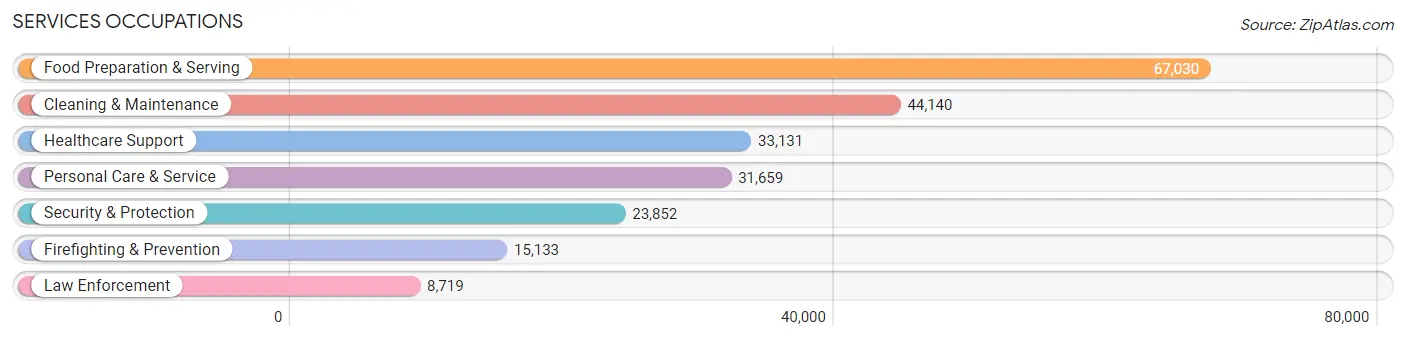
Services Occupations
The most common Services occupations in Area Code 480 are Food Preparation & Serving (67,030 | 5.1%), Cleaning & Maintenance (44,140 | 3.4%), Healthcare Support (33,131 | 2.5%), Personal Care & Service (31,659 | 2.4%), and Security & Protection (23,852 | 1.8%).
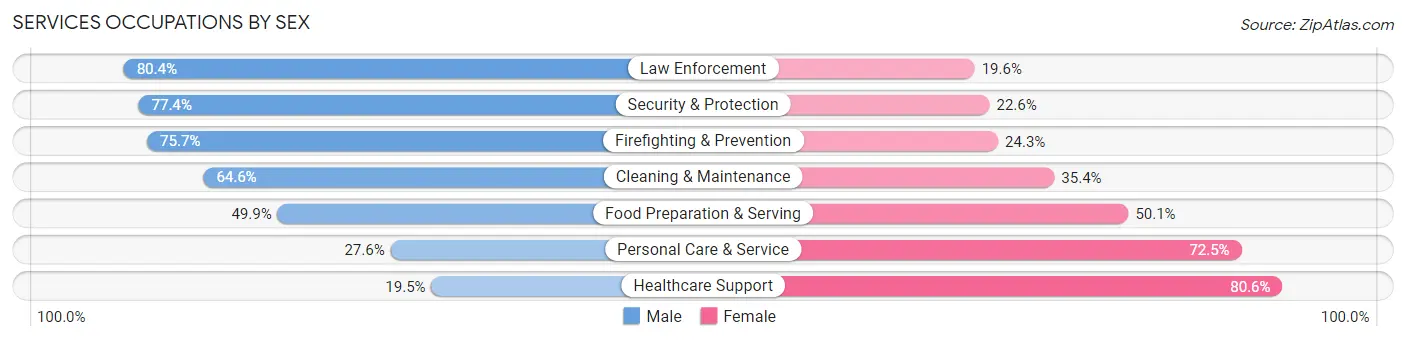
Services Occupations by Sex
Within the Services occupations in Area Code 480, the most male-oriented occupations are Law Enforcement (80.4%), Security & Protection (77.4%), and Firefighting & Prevention (75.7%), while the most female-oriented occupations are Healthcare Support (80.5%), Personal Care & Service (72.5%), and Food Preparation & Serving (50.1%).
| Occupation | Male | Female |
| Healthcare Support | 6,445 (19.5%) | 26,686 (80.5%) |
| Security & Protection | 18,466 (77.4%) | 5,386 (22.6%) |
| Firefighting & Prevention | 11,459 (75.7%) | 3,674 (24.3%) |
| Law Enforcement | 7,007 (80.4%) | 1,712 (19.6%) |
| Food Preparation & Serving | 33,463 (49.9%) | 33,567 (50.1%) |
| Cleaning & Maintenance | 28,504 (64.6%) | 15,636 (35.4%) |
| Personal Care & Service | 8,723 (27.6%) | 22,936 (72.5%) |
| Total (Category) | 95,601 (47.8%) | 104,211 (52.1%) |
| Total (Overall) | 705,216 (54.2%) | 596,558 (45.8%) |
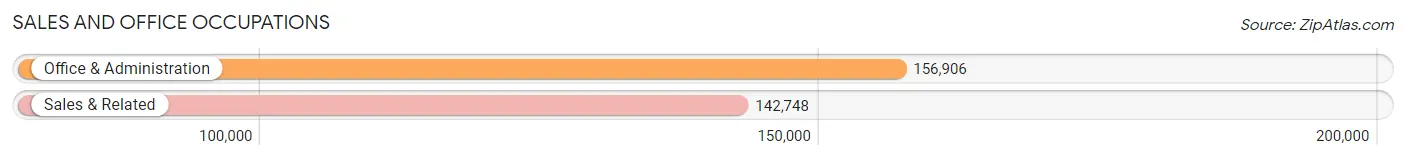
Sales and Office Occupations
The most common Sales and Office occupations in Area Code 480 are Office & Administration (156,906 | 12.0%), and Sales & Related (142,748 | 11.0%).
Sales and Office Occupations by Sex
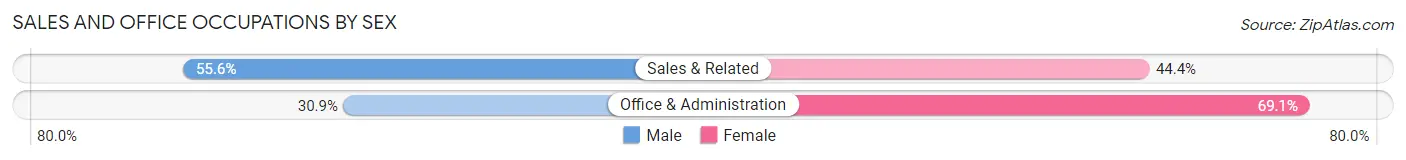
| Occupation | Male | Female |
| Sales & Related | 79,405 (55.6%) | 63,343 (44.4%) |
| Office & Administration | 48,475 (30.9%) | 108,431 (69.1%) |
| Total (Category) | 127,880 (42.7%) | 171,774 (57.3%) |
| Total (Overall) | 705,216 (54.2%) | 596,558 (45.8%) |
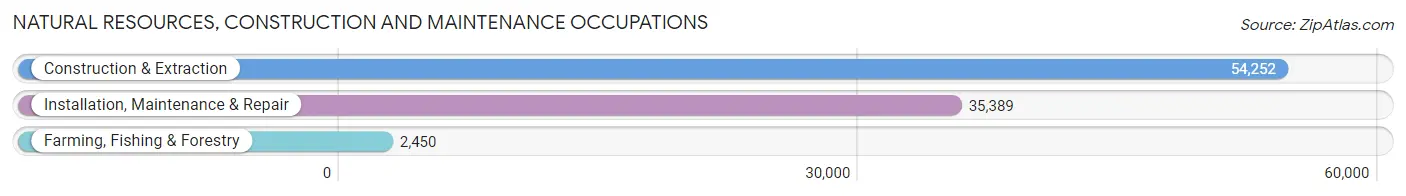
Natural Resources, Construction and Maintenance Occupations
The most common Natural Resources, Construction and Maintenance occupations in Area Code 480 are Construction & Extraction (54,252 | 4.2%), Installation, Maintenance & Repair (35,389 | 2.7%), and Farming, Fishing & Forestry (2,450 | 0.2%).
Natural Resources, Construction and Maintenance Occupations by Sex
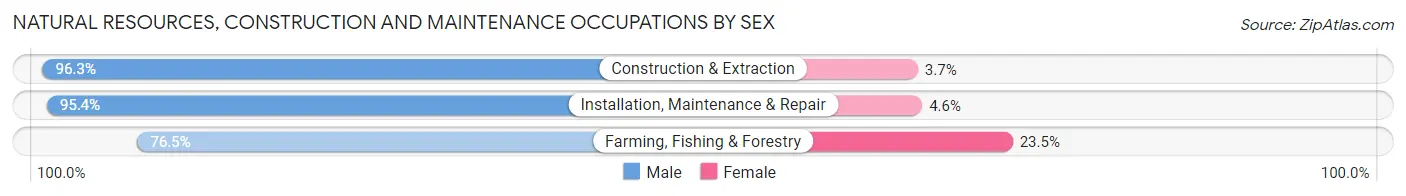
| Occupation | Male | Female |
| Farming, Fishing & Forestry | 1,875 (76.5%) | 575 (23.5%) |
| Construction & Extraction | 52,222 (96.3%) | 2,030 (3.7%) |
| Installation, Maintenance & Repair | 33,746 (95.4%) | 1,643 (4.6%) |
| Total (Category) | 87,843 (95.4%) | 4,248 (4.6%) |
| Total (Overall) | 705,216 (54.2%) | 596,558 (45.8%) |
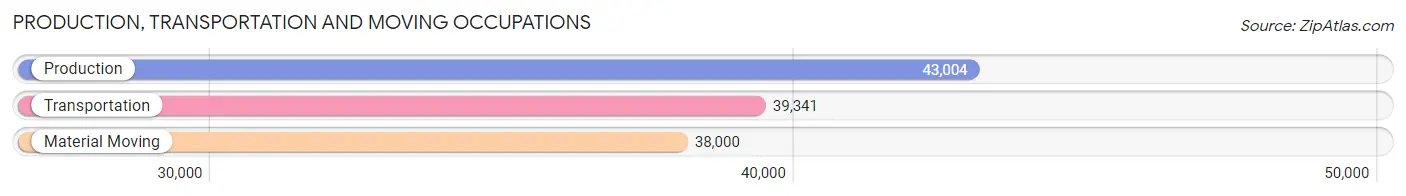
Production, Transportation and Moving Occupations
The most common Production, Transportation and Moving occupations in Area Code 480 are Production (43,004 | 3.3%), Transportation (39,341 | 3.0%), and Material Moving (38,000 | 2.9%).
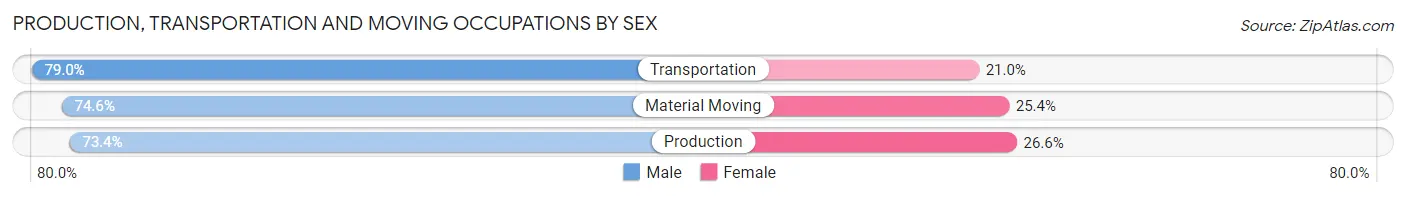
Production, Transportation and Moving Occupations by Sex
| Occupation | Male | Female |
| Production | 31,579 (73.4%) | 11,425 (26.6%) |
| Transportation | 31,077 (79.0%) | 8,264 (21.0%) |
| Material Moving | 28,335 (74.6%) | 9,665 (25.4%) |
| Total (Category) | 90,991 (75.6%) | 29,354 (24.4%) |
| Total (Overall) | 705,216 (54.2%) | 596,558 (45.8%) |
Employment Industries by Sex in Area Code 480
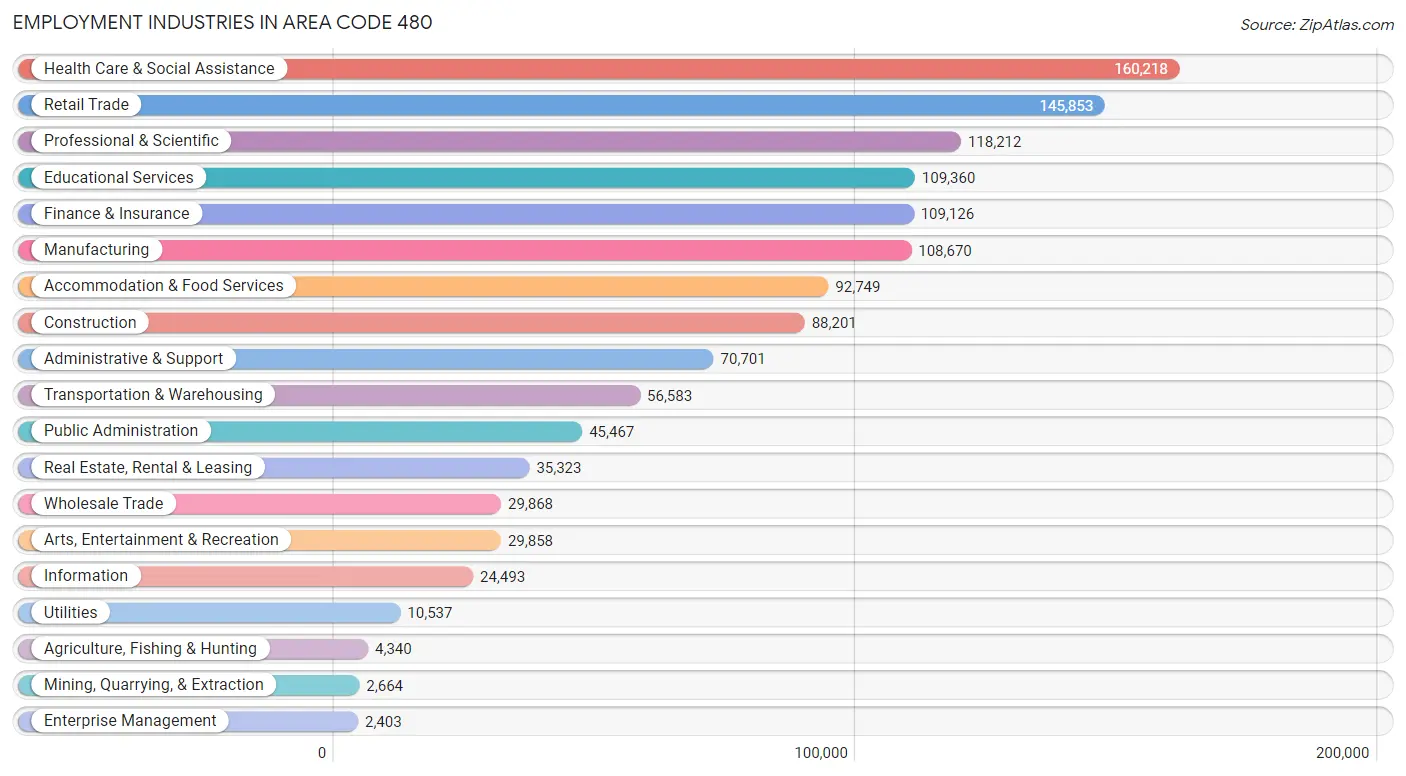
Employment Industries in Area Code 480
The major employment industries in Area Code 480 include Health Care & Social Assistance (160,218 | 12.3%), Retail Trade (145,853 | 11.2%), Professional & Scientific (118,212 | 9.1%), Educational Services (109,360 | 8.4%), and Finance & Insurance (109,126 | 8.4%).
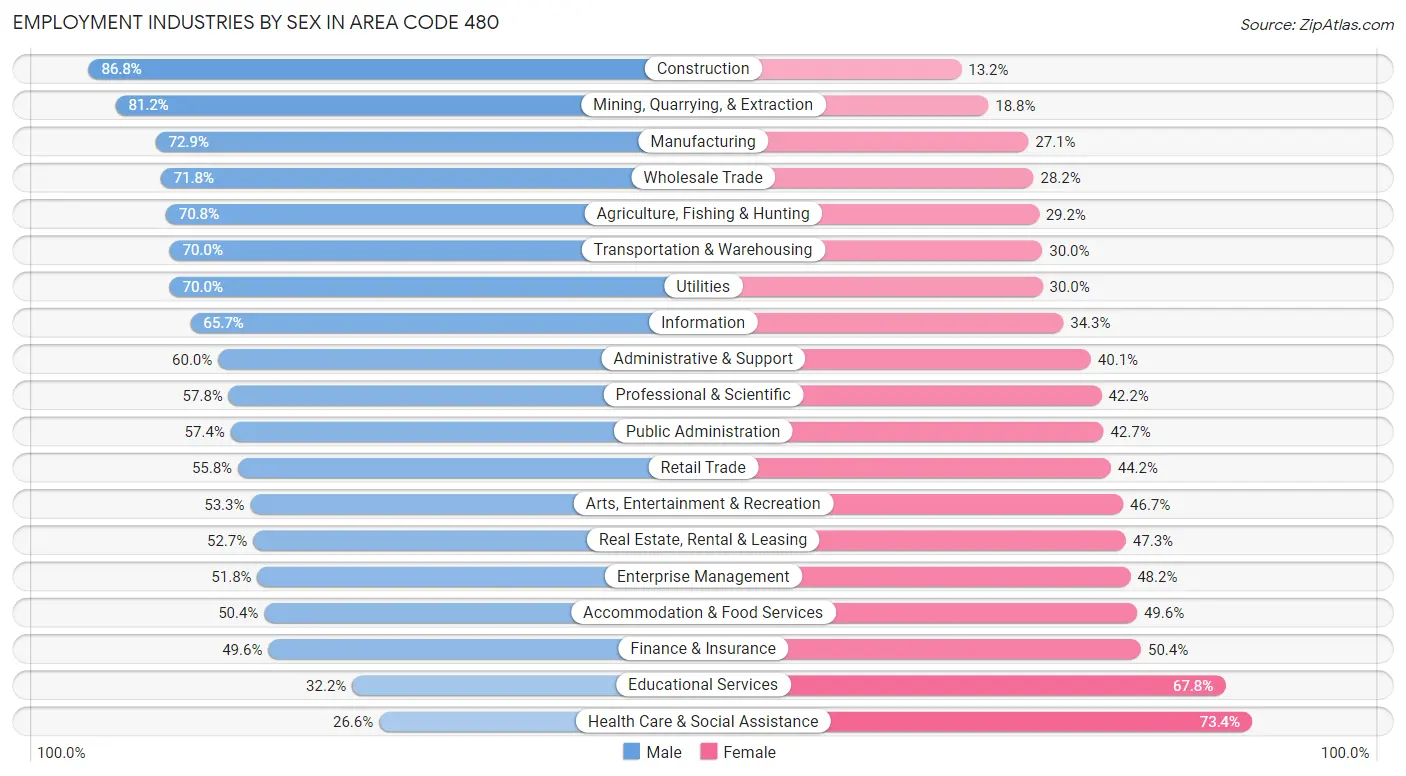
Employment Industries by Sex in Area Code 480
The Area Code 480 industries that see more men than women are Construction (86.8%), Mining, Quarrying, & Extraction (81.2%), and Manufacturing (72.9%), whereas the industries that tend to have a higher number of women are Health Care & Social Assistance (73.4%), Educational Services (67.8%), and Finance & Insurance (50.4%).
| Industry | Male | Female |
| Agriculture, Fishing & Hunting | 3,071 (70.8%) | 1,269 (29.2%) |
| Mining, Quarrying, & Extraction | 2,163 (81.2%) | 501 (18.8%) |
| Construction | 76,543 (86.8%) | 11,658 (13.2%) |
| Manufacturing | 79,219 (72.9%) | 29,451 (27.1%) |
| Wholesale Trade | 21,454 (71.8%) | 8,414 (28.2%) |
| Retail Trade | 81,443 (55.8%) | 64,410 (44.2%) |
| Transportation & Warehousing | 39,607 (70.0%) | 16,976 (30.0%) |
| Utilities | 7,373 (70.0%) | 3,164 (30.0%) |
| Information | 16,084 (65.7%) | 8,409 (34.3%) |
| Finance & Insurance | 54,092 (49.6%) | 55,034 (50.4%) |
| Real Estate, Rental & Leasing | 18,617 (52.7%) | 16,706 (47.3%) |
| Professional & Scientific | 68,280 (57.8%) | 49,932 (42.2%) |
| Enterprise Management | 1,245 (51.8%) | 1,158 (48.2%) |
| Administrative & Support | 42,383 (60.0%) | 28,318 (40.1%) |
| Educational Services | 35,212 (32.2%) | 74,148 (67.8%) |
| Health Care & Social Assistance | 42,675 (26.6%) | 117,543 (73.4%) |
| Arts, Entertainment & Recreation | 15,907 (53.3%) | 13,951 (46.7%) |
| Accommodation & Food Services | 46,752 (50.4%) | 45,997 (49.6%) |
| Public Administration | 26,076 (57.4%) | 19,391 (42.6%) |
| Total | 705,216 (54.2%) | 596,558 (45.8%) |
Education in Area Code 480
School Enrollment in Area Code 480
The most common levels of schooling among the 595,916 students in Area Code 480 are high school (133,423 | 22.4%), middle school (132,999 | 22.3%), and elementary school (120,842 | 20.3%).
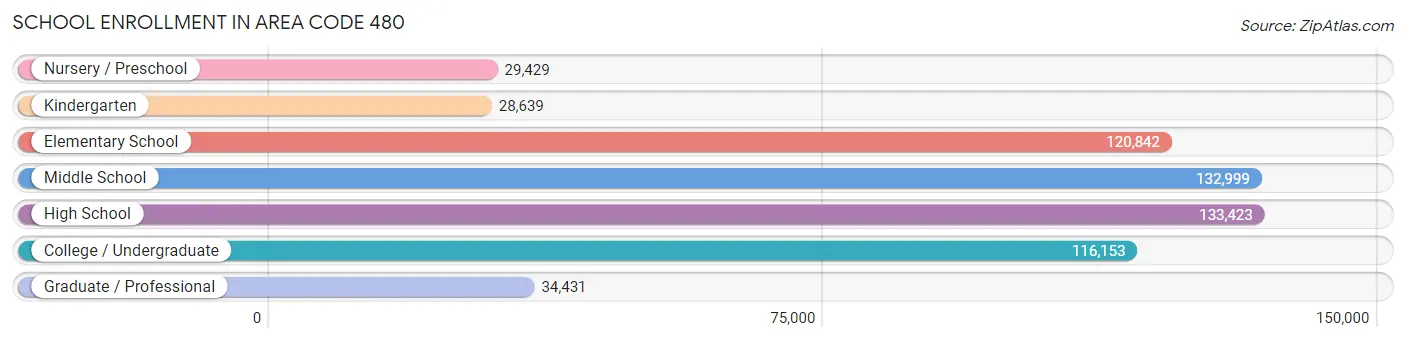
| School Level | # Students | % Students |
| Nursery / Preschool | 29,429 | 4.9% |
| Kindergarten | 28,639 | 4.8% |
| Elementary School | 120,842 | 20.3% |
| Middle School | 132,999 | 22.3% |
| High School | 133,423 | 22.4% |
| College / Undergraduate | 116,153 | 19.5% |
| Graduate / Professional | 34,431 | 5.8% |
| Total | 595,916 | 100.0% |
School Enrollment by Age by Funding Source in Area Code 480
Out of a total of 595,916 students who are enrolled in schools in Area Code 480, 84,684 (14.2%) attend a private institution, while the remaining 511,232 (85.8%) are enrolled in public schools. The age group of 3 to 4 year olds has the highest likelihood of being enrolled in private schools, with 10,413 (43.8% in the age bracket) enrolled. Conversely, the age group of 15 to 17 year olds has the lowest likelihood of being enrolled in a private school, with 89,230 (92.5% in the age bracket) attending a public institution.
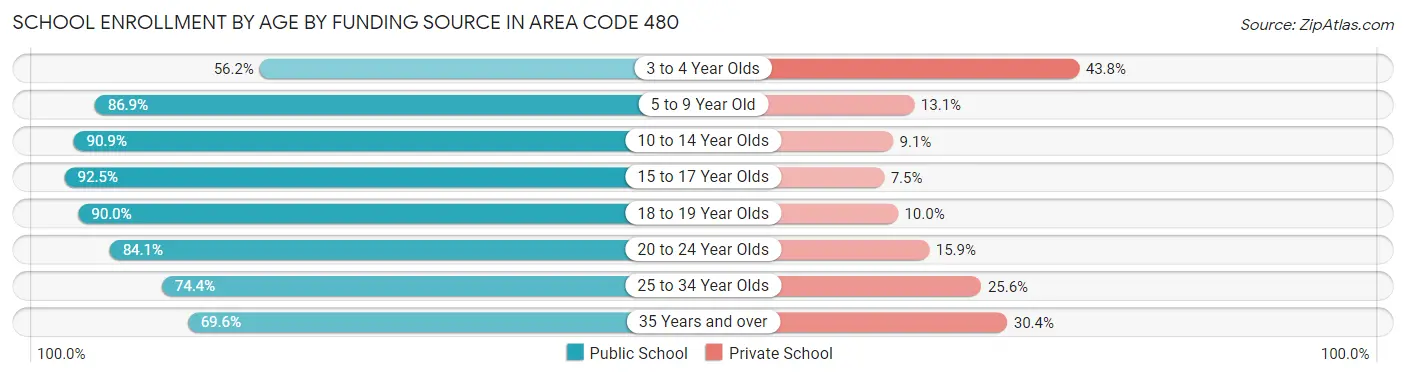
| Age Bracket | Public School | Private School |
| 3 to 4 Year Olds | 13,369 (56.2%) | 10,413 (43.8%) |
| 5 to 9 Year Old | 122,677 (86.9%) | 18,461 (13.1%) |
| 10 to 14 Year Olds | 149,860 (90.9%) | 15,037 (9.1%) |
| 15 to 17 Year Olds | 89,230 (92.5%) | 7,190 (7.5%) |
| 18 to 19 Year Olds | 34,671 (90.0%) | 3,861 (10.0%) |
| 20 to 24 Year Olds | 47,682 (84.1%) | 8,991 (15.9%) |
| 25 to 34 Year Olds | 29,107 (74.4%) | 10,000 (25.6%) |
| 35 Years and over | 24,620 (69.6%) | 10,747 (30.4%) |
| Total | 511,232 (85.8%) | 84,684 (14.2%) |
Educational Attainment by Field of Study in Area Code 480
Business (173,989 | 22.6%), education (83,668 | 10.9%), science & technology (75,103 | 9.7%), engineering (67,540 | 8.8%), and social sciences (55,670 | 7.2%) are the most common fields of study among 770,752 individuals in Area Code 480 who have obtained a bachelor's degree or higher.
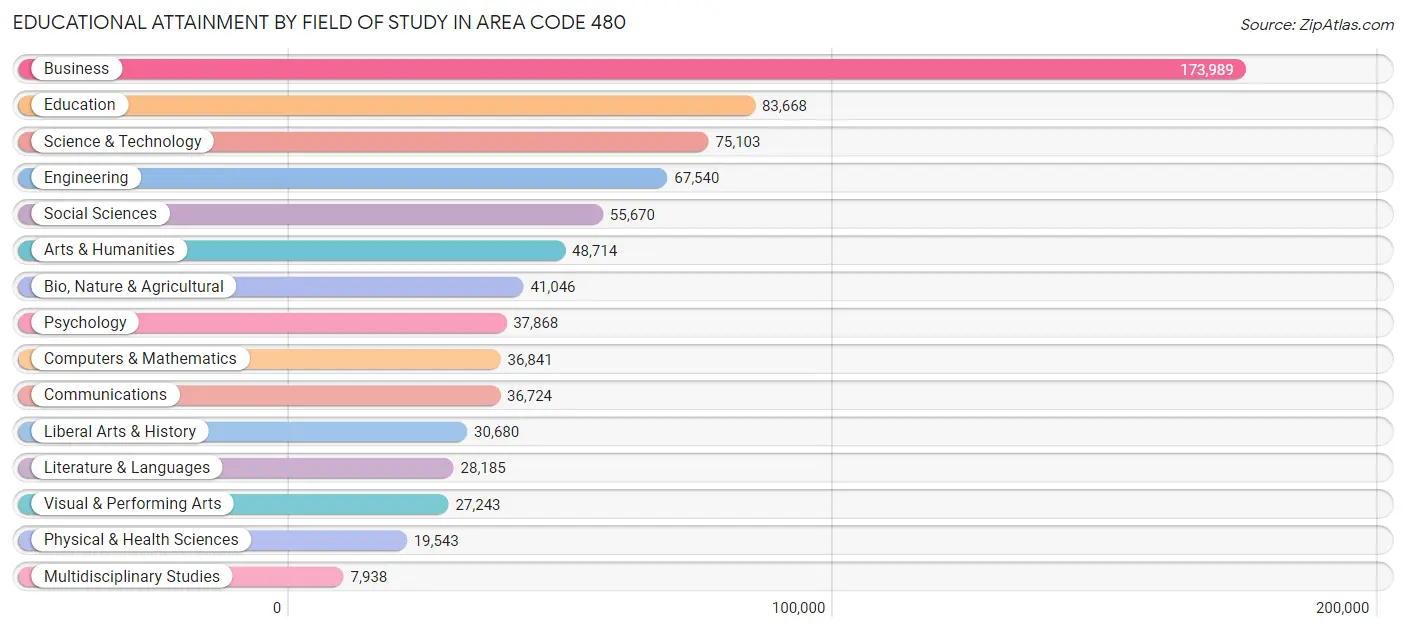
| Field of Study | # Graduates | % Graduates |
| Computers & Mathematics | 36,841 | 4.8% |
| Bio, Nature & Agricultural | 41,046 | 5.3% |
| Physical & Health Sciences | 19,543 | 2.5% |
| Psychology | 37,868 | 4.9% |
| Social Sciences | 55,670 | 7.2% |
| Engineering | 67,540 | 8.8% |
| Multidisciplinary Studies | 7,938 | 1.0% |
| Science & Technology | 75,103 | 9.7% |
| Business | 173,989 | 22.6% |
| Education | 83,668 | 10.9% |
| Literature & Languages | 28,185 | 3.7% |
| Liberal Arts & History | 30,680 | 4.0% |
| Visual & Performing Arts | 27,243 | 3.5% |
| Communications | 36,724 | 4.8% |
| Arts & Humanities | 48,714 | 6.3% |
| Total | 770,752 | 100.0% |
Transportation & Commute in Area Code 480
Vehicle Availability by Sex in Area Code 480
The most prevalent vehicle ownership categories in Area Code 480 are males with 2 vehicles (307,688, accounting for 44.3%) and females with 2 vehicles (250,446, making up 52.6%).
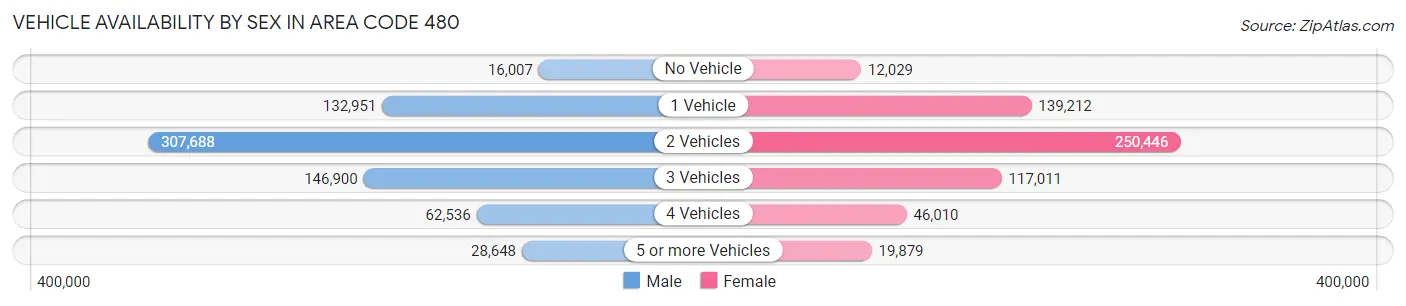
| Vehicles Available | Male | Female |
| No Vehicle | 16,007 (2.3%) | 12,029 (2.1%) |
| 1 Vehicle | 132,951 (19.1%) | 139,212 (23.8%) |
| 2 Vehicles | 307,688 (44.3%) | 250,446 (42.8%) |
| 3 Vehicles | 146,900 (21.1%) | 117,011 (20.0%) |
| 4 Vehicles | 62,536 (9.0%) | 46,010 (7.9%) |
| 5 or more Vehicles | 28,648 (4.1%) | 19,879 (3.4%) |
| Total | 694,730 (100.0%) | 584,587 (100.0%) |
Commute Time in Area Code 480
The most frequently occuring commute durations in Area Code 480 are 20 to 24 minutes (179,967 commuters, 17.1%), 15 to 19 minutes (168,246 commuters, 16.0%), and 30 to 34 minutes (153,711 commuters, 14.6%).
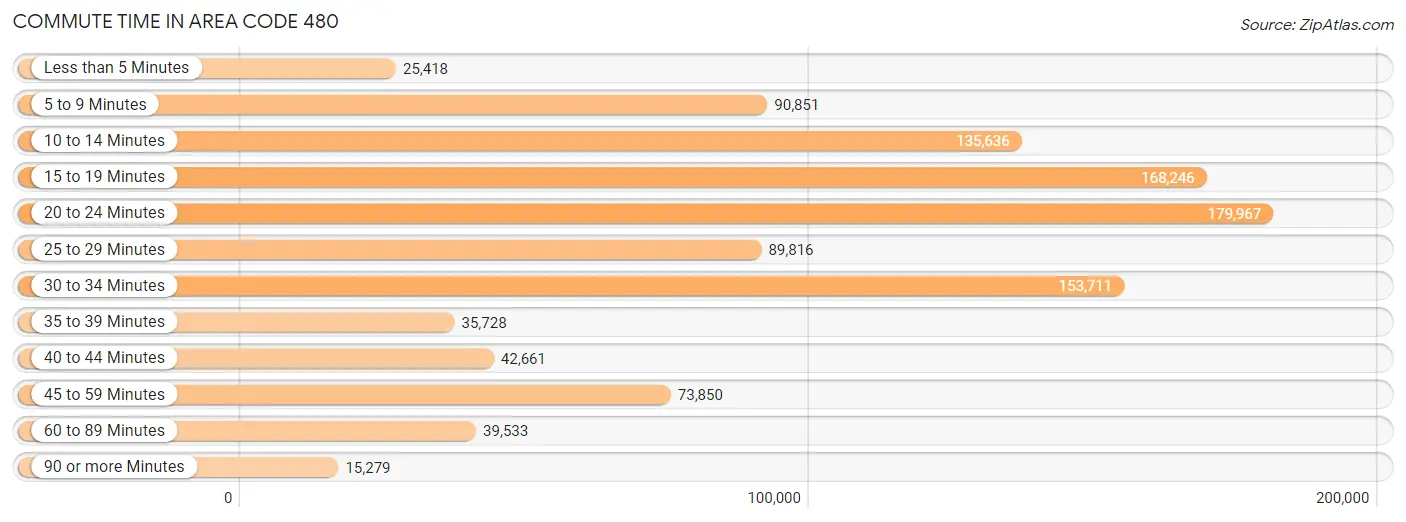
| Commute Time | # Commuters | % Commuters |
| Less than 5 Minutes | 25,418 | 2.4% |
| 5 to 9 Minutes | 90,851 | 8.6% |
| 10 to 14 Minutes | 135,636 | 12.9% |
| 15 to 19 Minutes | 168,246 | 16.0% |
| 20 to 24 Minutes | 179,967 | 17.1% |
| 25 to 29 Minutes | 89,816 | 8.6% |
| 30 to 34 Minutes | 153,711 | 14.6% |
| 35 to 39 Minutes | 35,728 | 3.4% |
| 40 to 44 Minutes | 42,661 | 4.1% |
| 45 to 59 Minutes | 73,850 | 7.0% |
| 60 to 89 Minutes | 39,533 | 3.8% |
| 90 or more Minutes | 15,279 | 1.5% |
Commute Time by Sex in Area Code 480
The most common commute times in Area Code 480 are 20 to 24 minutes (98,291 commuters, 17.0%) for males and 20 to 24 minutes (81,676 commuters, 17.3%) for females.
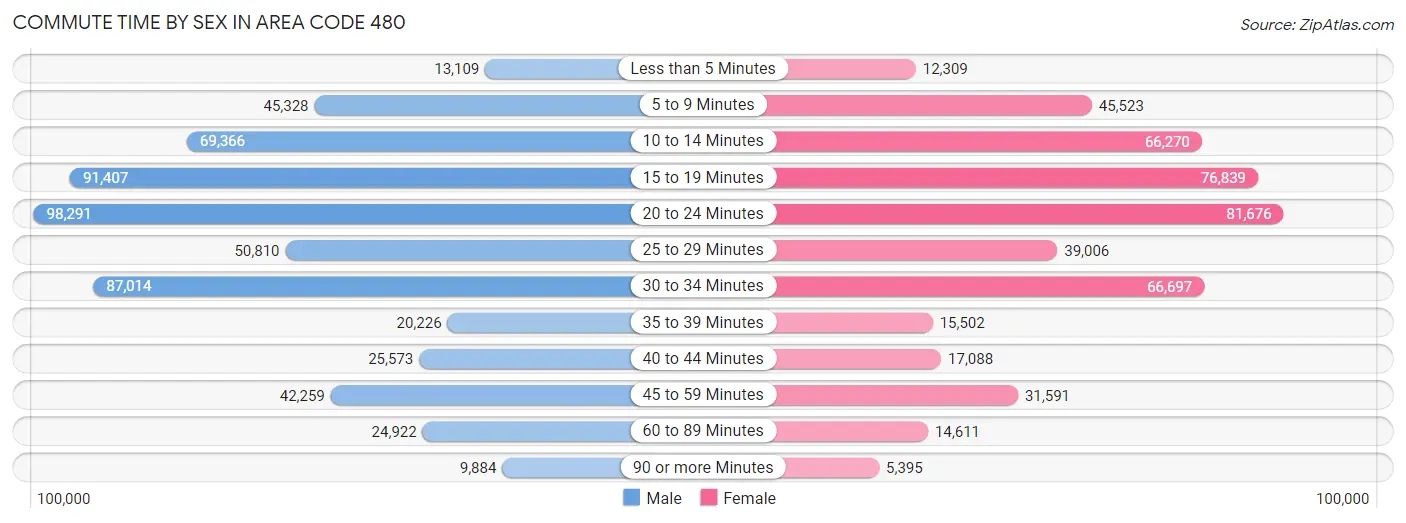
| Commute Time | Male | Female |
| Less than 5 Minutes | 13,109 (2.3%) | 12,309 (2.6%) |
| 5 to 9 Minutes | 45,328 (7.8%) | 45,523 (9.6%) |
| 10 to 14 Minutes | 69,366 (12.0%) | 66,270 (14.0%) |
| 15 to 19 Minutes | 91,407 (15.8%) | 76,839 (16.3%) |
| 20 to 24 Minutes | 98,291 (17.0%) | 81,676 (17.3%) |
| 25 to 29 Minutes | 50,810 (8.8%) | 39,006 (8.3%) |
| 30 to 34 Minutes | 87,014 (15.0%) | 66,697 (14.1%) |
| 35 to 39 Minutes | 20,226 (3.5%) | 15,502 (3.3%) |
| 40 to 44 Minutes | 25,573 (4.4%) | 17,088 (3.6%) |
| 45 to 59 Minutes | 42,259 (7.3%) | 31,591 (6.7%) |
| 60 to 89 Minutes | 24,922 (4.3%) | 14,611 (3.1%) |
| 90 or more Minutes | 9,884 (1.7%) | 5,395 (1.1%) |
Time of Departure to Work by Sex in Area Code 480
The most frequent times of departure to work in Area Code 480 are 7:00 AM to 7:29 AM (72,713, 12.6%) for males and 7:00 AM to 7:29 AM (72,682, 15.4%) for females.
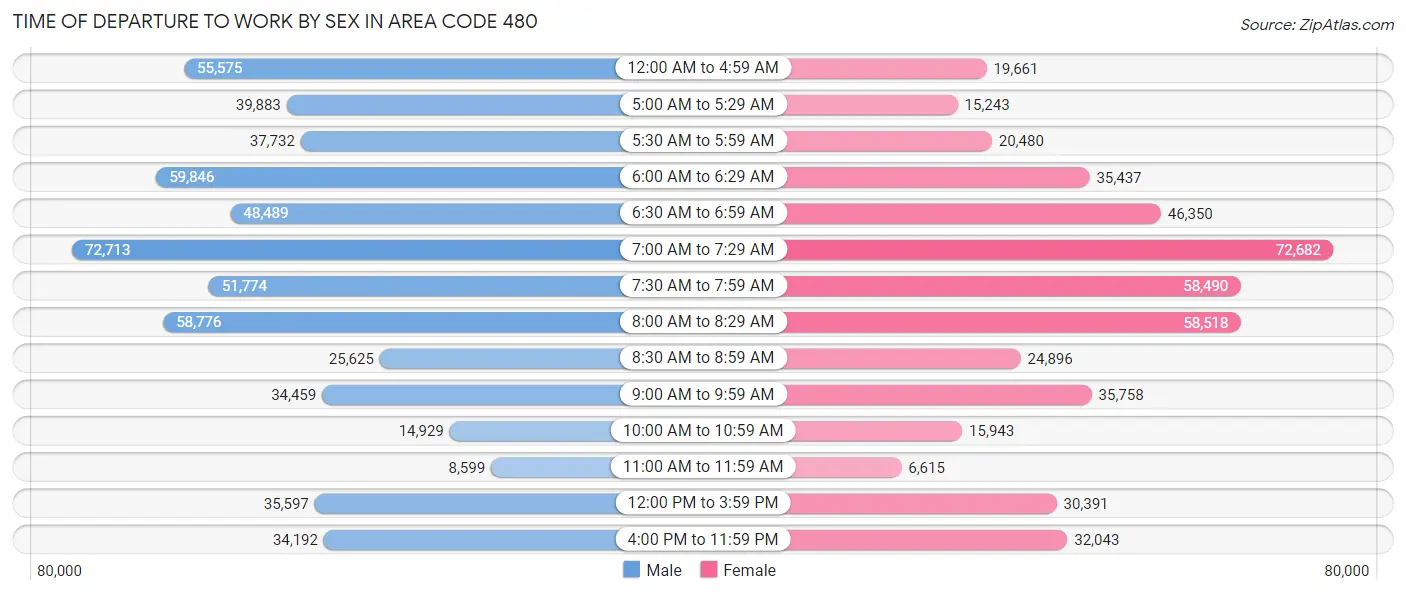
| Time of Departure | Male | Female |
| 12:00 AM to 4:59 AM | 55,575 (9.6%) | 19,661 (4.2%) |
| 5:00 AM to 5:29 AM | 39,883 (6.9%) | 15,243 (3.2%) |
| 5:30 AM to 5:59 AM | 37,732 (6.5%) | 20,480 (4.3%) |
| 6:00 AM to 6:29 AM | 59,846 (10.3%) | 35,437 (7.5%) |
| 6:30 AM to 6:59 AM | 48,489 (8.4%) | 46,350 (9.8%) |
| 7:00 AM to 7:29 AM | 72,713 (12.6%) | 72,682 (15.4%) |
| 7:30 AM to 7:59 AM | 51,774 (8.9%) | 58,490 (12.4%) |
| 8:00 AM to 8:29 AM | 58,776 (10.2%) | 58,518 (12.4%) |
| 8:30 AM to 8:59 AM | 25,625 (4.4%) | 24,896 (5.3%) |
| 9:00 AM to 9:59 AM | 34,459 (6.0%) | 35,758 (7.6%) |
| 10:00 AM to 10:59 AM | 14,929 (2.6%) | 15,943 (3.4%) |
| 11:00 AM to 11:59 AM | 8,599 (1.5%) | 6,615 (1.4%) |
| 12:00 PM to 3:59 PM | 35,597 (6.2%) | 30,391 (6.4%) |
| 4:00 PM to 11:59 PM | 34,192 (5.9%) | 32,043 (6.8%) |
| Total | 578,189 (100.0%) | 472,507 (100.0%) |
Housing Occupancy in Area Code 480
Occupancy by Ownership in Area Code 480
Of the total 1,009,153 dwellings in Area Code 480, owner-occupied units account for 646,900 (64.1%), while renter-occupied units make up 362,253 (35.9%).
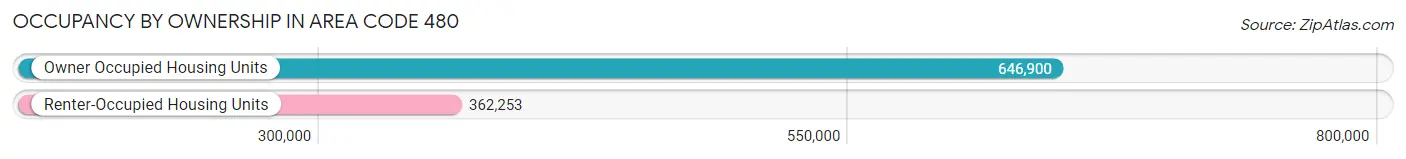
| Occupancy | # Housing Units | % Housing Units |
| Owner Occupied Housing Units | 646,900 | 64.1% |
| Renter-Occupied Housing Units | 362,253 | 35.9% |
| Total Occupied Housing Units | 1,009,153 | 100.0% |
Occupancy by Household Size in Area Code 480
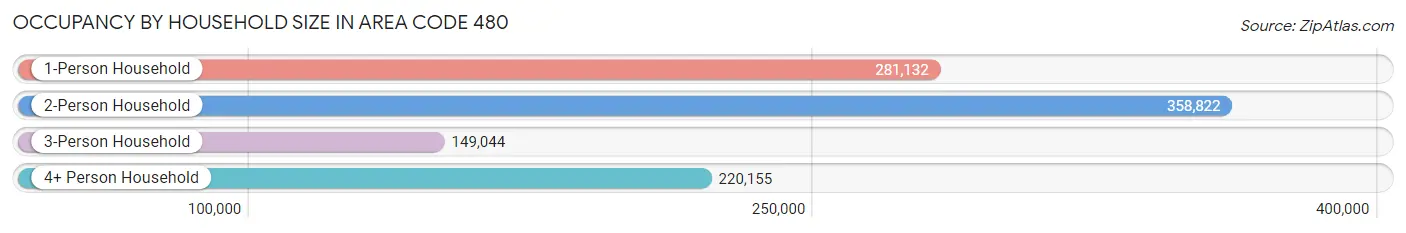
| Household Size | # Housing Units | % Housing Units |
| 1-Person Household | 281,132 | 27.9% |
| 2-Person Household | 358,822 | 35.6% |
| 3-Person Household | 149,044 | 14.8% |
| 4+ Person Household | 220,155 | 21.8% |
| Total Housing Units | 1,009,153 | 100.0% |
Occupancy by Ownership by Household Size in Area Code 480
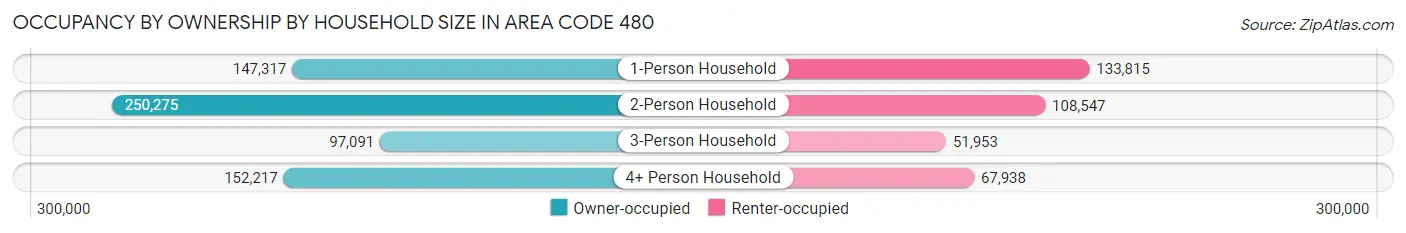
| Household Size | Owner-occupied | Renter-occupied |
| 1-Person Household | 147,317 (52.4%) | 133,815 (47.6%) |
| 2-Person Household | 250,275 (69.8%) | 108,547 (30.2%) |
| 3-Person Household | 97,091 (65.1%) | 51,953 (34.9%) |
| 4+ Person Household | 152,217 (69.1%) | 67,938 (30.9%) |
| Total Housing Units | 646,900 (64.1%) | 362,253 (35.9%) |
Occupancy by Educational Attainment in Area Code 480
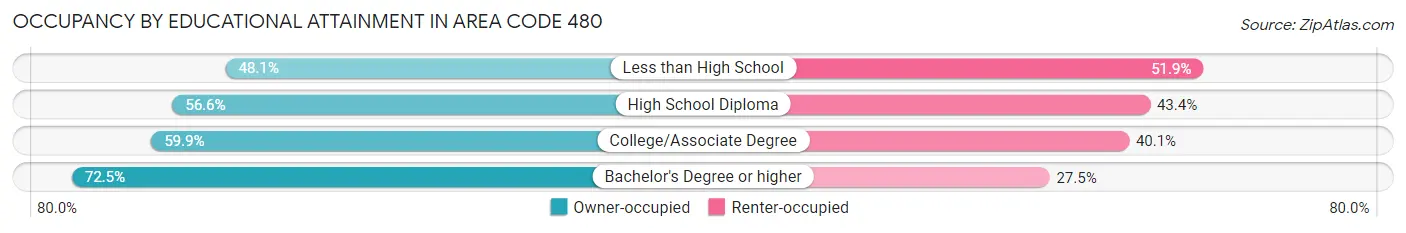
| Household Size | Owner-occupied | Renter-occupied |
| Less than High School | 32,984 (48.1%) | 35,546 (51.9%) |
| High School Diploma | 93,760 (56.6%) | 71,981 (43.4%) |
| College/Associate Degree | 198,451 (59.9%) | 132,774 (40.1%) |
| Bachelor's Degree or higher | 321,705 (72.5%) | 121,952 (27.5%) |
Occupancy by Age of Householder in Area Code 480
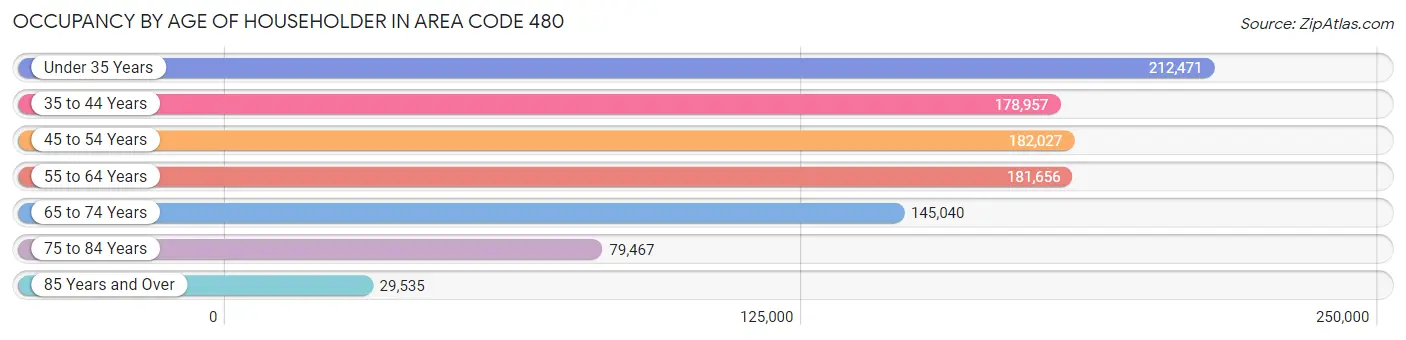
| Age Bracket | # Households | % Households |
| Under 35 Years | 212,471 | 21.0% |
| 35 to 44 Years | 178,957 | 17.7% |
| 45 to 54 Years | 182,027 | 18.0% |
| 55 to 64 Years | 181,656 | 18.0% |
| 65 to 74 Years | 145,040 | 14.4% |
| 75 to 84 Years | 79,467 | 7.9% |
| 85 Years and Over | 29,535 | 2.9% |
| Total | 1,009,153 | 100.0% |
Housing Finances in Area Code 480
Median Income by Occupancy in Area Code 480
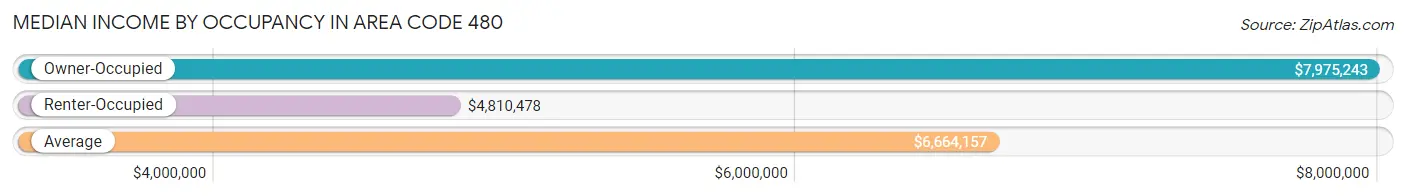
| Occupancy Type | # Households | Median Income |
| Owner-Occupied | 646,900 (64.1%) | $7,975,243 |
| Renter-Occupied | 362,253 (35.9%) | $4,810,478 |
| Average | 1,009,153 (100.0%) | $6,664,157 |
Occupancy by Householder Income Bracket in Area Code 480
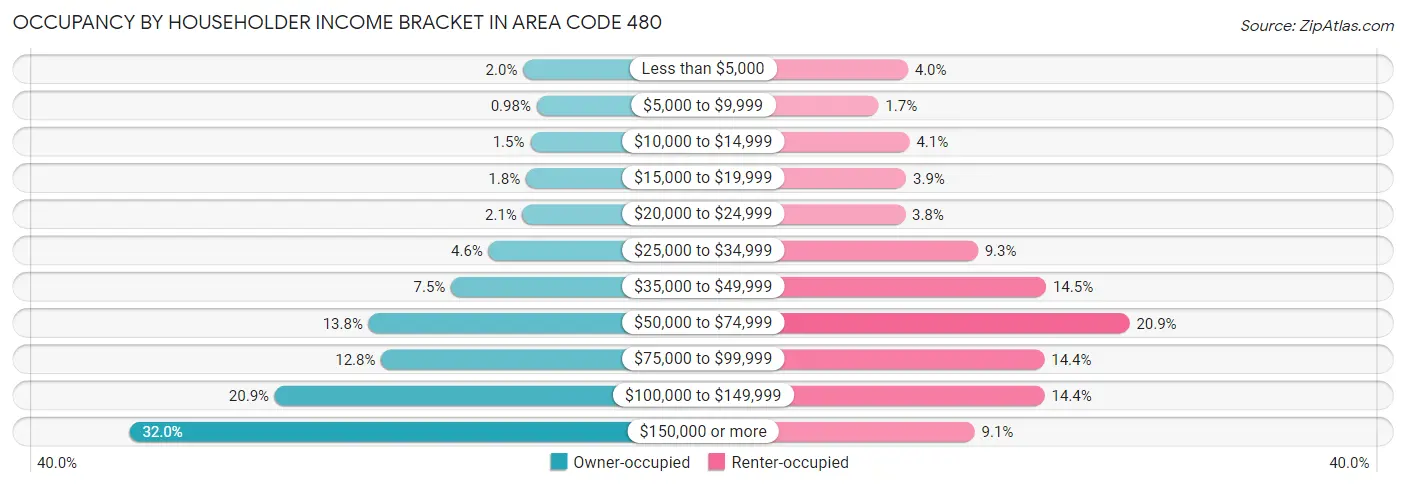
| Income Bracket | Owner-occupied | Renter-occupied |
| Less than $5,000 | 13,000 (2.0%) | 14,429 (4.0%) |
| $5,000 to $9,999 | 6,338 (1.0%) | 6,313 (1.7%) |
| $10,000 to $14,999 | 9,497 (1.5%) | 14,900 (4.1%) |
| $15,000 to $19,999 | 11,659 (1.8%) | 13,932 (3.8%) |
| $20,000 to $24,999 | 13,261 (2.1%) | 13,640 (3.8%) |
| $25,000 to $34,999 | 30,048 (4.6%) | 33,725 (9.3%) |
| $35,000 to $49,999 | 48,529 (7.5%) | 52,573 (14.5%) |
| $50,000 to $74,999 | 89,121 (13.8%) | 75,610 (20.9%) |
| $75,000 to $99,999 | 82,934 (12.8%) | 52,098 (14.4%) |
| $100,000 to $149,999 | 135,411 (20.9%) | 52,167 (14.4%) |
| $150,000 or more | 207,102 (32.0%) | 32,866 (9.1%) |
| Total | 646,900 (100.0%) | 362,253 (100.0%) |
Monthly Housing Cost Tiers in Area Code 480
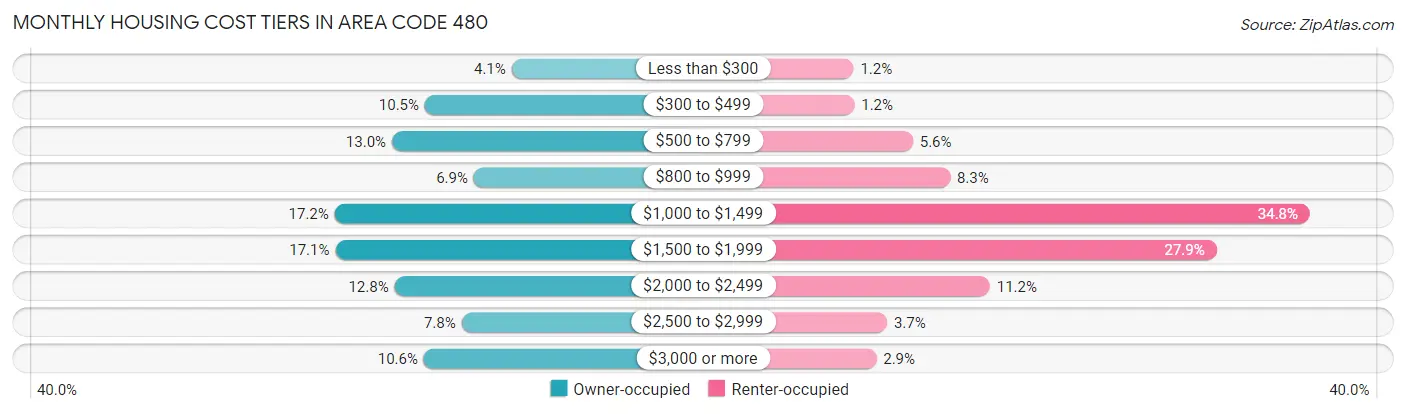
| Monthly Cost | Owner-occupied | Renter-occupied |
| Less than $300 | 26,729 (4.1%) | 4,268 (1.2%) |
| $300 to $499 | 68,062 (10.5%) | 4,483 (1.2%) |
| $500 to $799 | 83,781 (13.0%) | 20,117 (5.6%) |
| $800 to $999 | 44,791 (6.9%) | 30,023 (8.3%) |
| $1,000 to $1,499 | 111,097 (17.2%) | 126,034 (34.8%) |
| $1,500 to $1,999 | 110,765 (17.1%) | 101,132 (27.9%) |
| $2,000 to $2,499 | 82,527 (12.8%) | 40,642 (11.2%) |
| $2,500 to $2,999 | 50,566 (7.8%) | 13,206 (3.6%) |
| $3,000 or more | 68,582 (10.6%) | 10,367 (2.9%) |
| Total | 646,900 (100.0%) | 362,253 (100.0%) |
Physical Housing Characteristics in Area Code 480
Housing Structures in Area Code 480
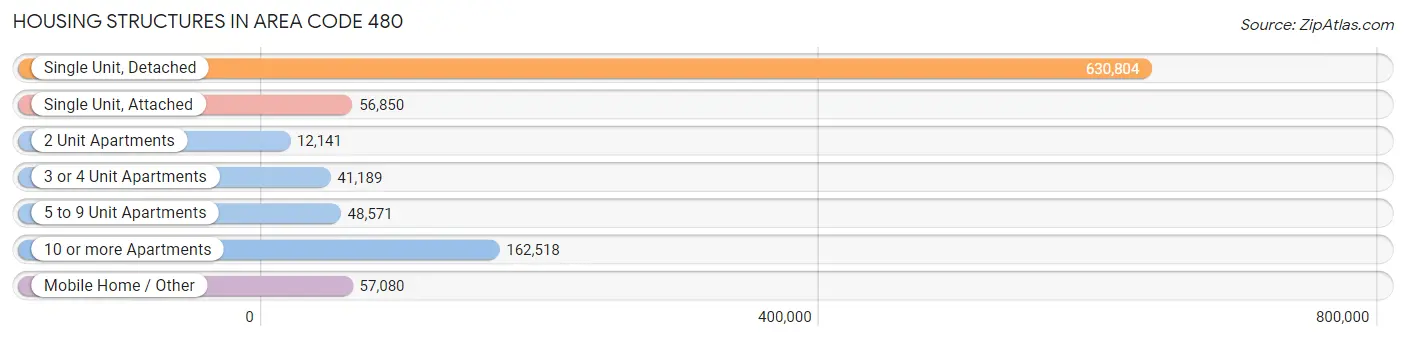
| Structure Type | # Housing Units | % Housing Units |
| Single Unit, Detached | 630,804 | 62.5% |
| Single Unit, Attached | 56,850 | 5.6% |
| 2 Unit Apartments | 12,141 | 1.2% |
| 3 or 4 Unit Apartments | 41,189 | 4.1% |
| 5 to 9 Unit Apartments | 48,571 | 4.8% |
| 10 or more Apartments | 162,518 | 16.1% |
| Mobile Home / Other | 57,080 | 5.7% |
| Total | 1,009,153 | 100.0% |
Housing Structures by Occupancy in Area Code 480
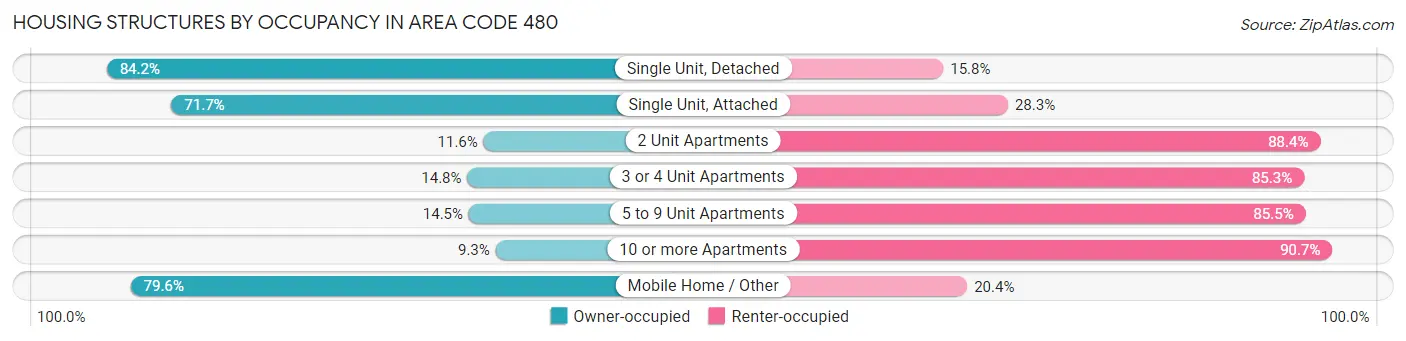
| Structure Type | Owner-occupied | Renter-occupied |
| Single Unit, Detached | 531,056 (84.2%) | 99,748 (15.8%) |
| Single Unit, Attached | 40,777 (71.7%) | 16,073 (28.3%) |
| 2 Unit Apartments | 1,411 (11.6%) | 10,730 (88.4%) |
| 3 or 4 Unit Apartments | 6,075 (14.7%) | 35,114 (85.3%) |
| 5 to 9 Unit Apartments | 7,025 (14.5%) | 41,546 (85.5%) |
| 10 or more Apartments | 15,130 (9.3%) | 147,388 (90.7%) |
| Mobile Home / Other | 45,426 (79.6%) | 11,654 (20.4%) |
| Total | 646,900 (64.1%) | 362,253 (35.9%) |
Housing Structures by Number of Rooms in Area Code 480
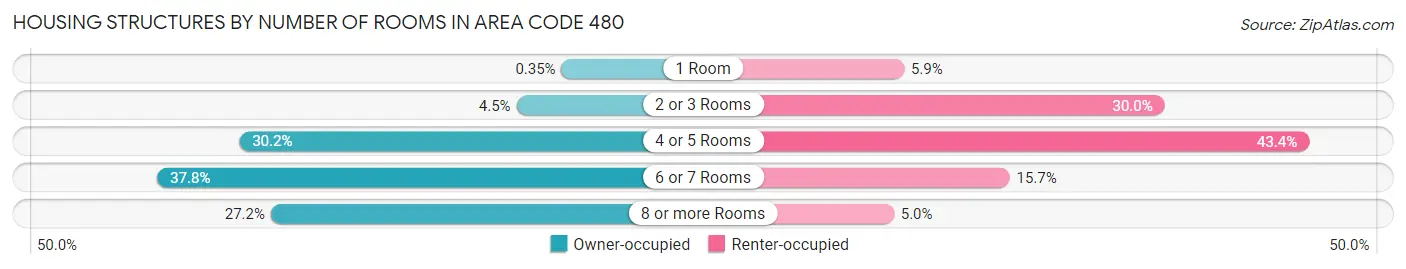
| Number of Rooms | Owner-occupied | Renter-occupied |
| 1 Room | 2,276 (0.4%) | 21,439 (5.9%) |
| 2 or 3 Rooms | 29,204 (4.5%) | 108,762 (30.0%) |
| 4 or 5 Rooms | 195,046 (30.1%) | 157,161 (43.4%) |
| 6 or 7 Rooms | 244,195 (37.8%) | 56,841 (15.7%) |
| 8 or more Rooms | 176,179 (27.2%) | 18,050 (5.0%) |
| Total | 646,900 (100.0%) | 362,253 (100.0%) |
Housing Structure by Heating Type in Area Code 480
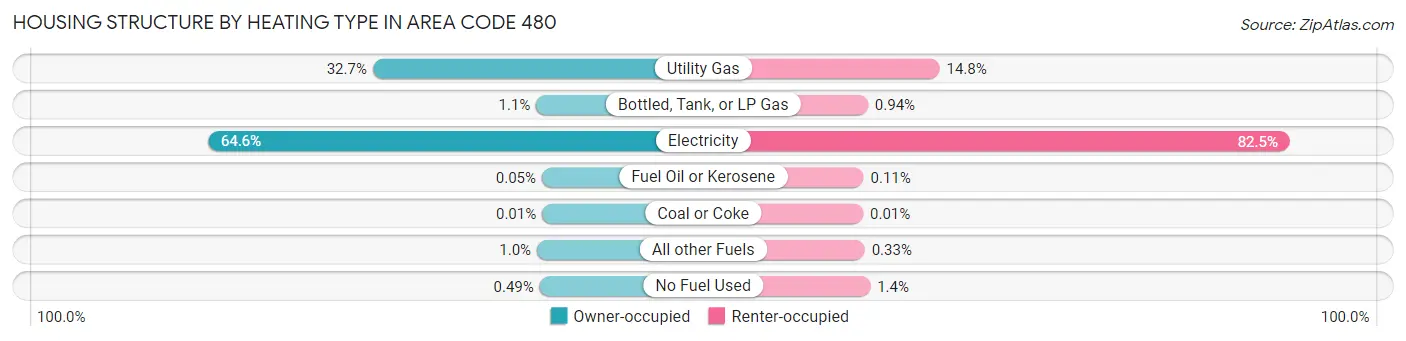
| Heating Type | Owner-occupied | Renter-occupied |
| Utility Gas | 211,722 (32.7%) | 53,547 (14.8%) |
| Bottled, Tank, or LP Gas | 7,343 (1.1%) | 3,410 (0.9%) |
| Electricity | 417,800 (64.6%) | 298,660 (82.5%) |
| Fuel Oil or Kerosene | 339 (0.1%) | 390 (0.1%) |
| Coal or Coke | 39 (0.0%) | 50 (0.0%) |
| All other Fuels | 6,480 (1.0%) | 1,186 (0.3%) |
| No Fuel Used | 3,177 (0.5%) | 5,010 (1.4%) |
| Total | 646,900 (100.0%) | 362,253 (100.0%) |
Household Vehicle Usage in Area Code 480
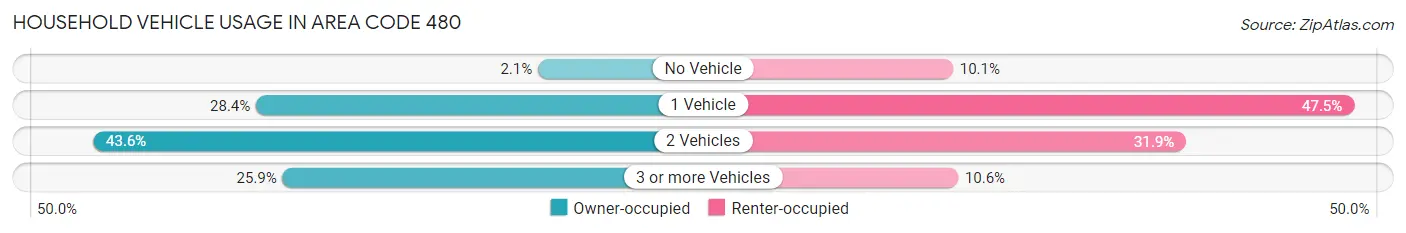
| Vehicles per Household | Owner-occupied | Renter-occupied |
| No Vehicle | 13,372 (2.1%) | 36,477 (10.1%) |
| 1 Vehicle | 183,645 (28.4%) | 172,178 (47.5%) |
| 2 Vehicles | 282,193 (43.6%) | 115,387 (31.9%) |
| 3 or more Vehicles | 167,690 (25.9%) | 38,211 (10.5%) |
| Total | 646,900 (100.0%) | 362,253 (100.0%) |
Real Estate & Mortgages in Area Code 480
Real Estate and Mortgage Overview in Area Code 480
| Characteristic | Without Mortgage | With Mortgage |
| Housing Units | 214,094 | 432,806 |
| Median Property Value | $29,921,500 | $33,129,000 |
| Median Household Income | $5,922,476 | $162,042 |
| Monthly Housing Costs | $41,837 | $67,598 |
| Real Estate Taxes | $156,577 | $10,643 |
Property Value by Mortgage Status in Area Code 480
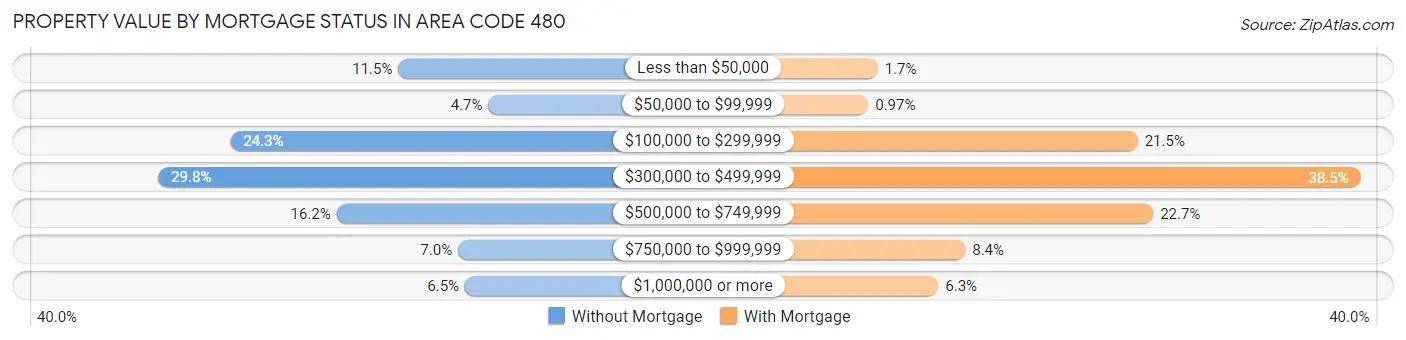
| Property Value | Without Mortgage | With Mortgage |
| Less than $50,000 | 24,683 (11.5%) | 7,313 (1.7%) |
| $50,000 to $99,999 | 10,004 (4.7%) | 4,204 (1.0%) |
| $100,000 to $299,999 | 52,080 (24.3%) | 93,065 (21.5%) |
| $300,000 to $499,999 | 63,837 (29.8%) | 166,556 (38.5%) |
| $500,000 to $749,999 | 34,747 (16.2%) | 98,169 (22.7%) |
| $750,000 to $999,999 | 14,939 (7.0%) | 36,179 (8.4%) |
| $1,000,000 or more | 13,804 (6.5%) | 27,320 (6.3%) |
| Total | 214,094 (100.0%) | 432,806 (100.0%) |
Household Income by Mortgage Status in Area Code 480
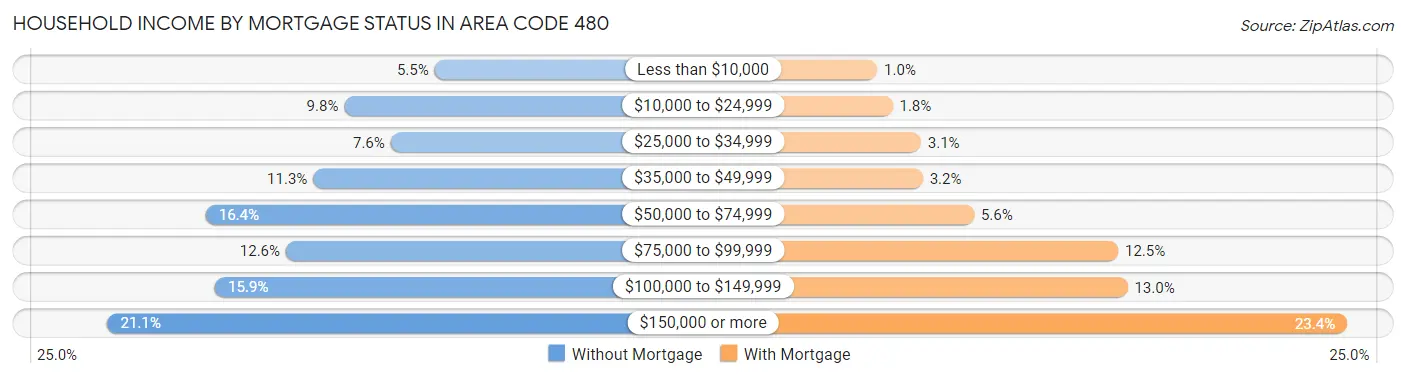
| Household Income | Without Mortgage | With Mortgage |
| Less than $10,000 | 11,724 (5.5%) | 4,466 (1.0%) |
| $10,000 to $24,999 | 20,947 (9.8%) | 7,614 (1.8%) |
| $25,000 to $34,999 | 16,213 (7.6%) | 13,470 (3.1%) |
| $35,000 to $49,999 | 24,100 (11.3%) | 13,835 (3.2%) |
| $50,000 to $74,999 | 35,038 (16.4%) | 24,429 (5.6%) |
| $75,000 to $99,999 | 26,897 (12.6%) | 54,083 (12.5%) |
| $100,000 to $149,999 | 34,115 (15.9%) | 56,037 (13.0%) |
| $150,000 or more | 45,060 (21.0%) | 101,296 (23.4%) |
| Total | 214,094 (100.0%) | 432,806 (100.0%) |
Property Value to Household Income Ratio in Area Code 480
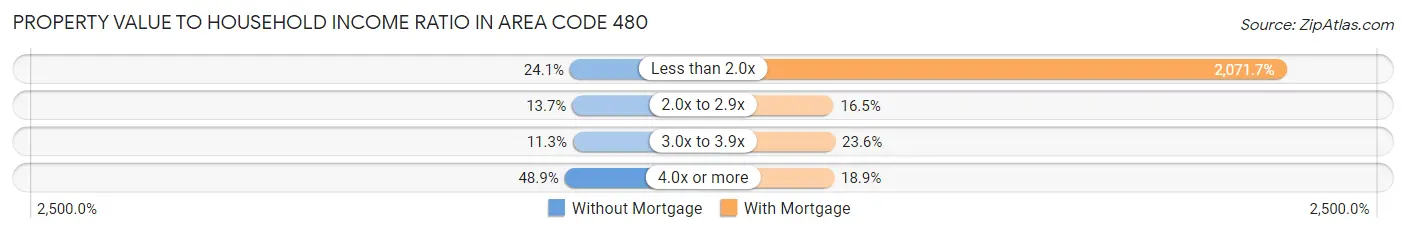
| Value-to-Income Ratio | Without Mortgage | With Mortgage |
| Less than 2.0x | 51,684 (24.1%) | 8,966,585 (2,071.7%) |
| 2.0x to 2.9x | 29,366 (13.7%) | 71,187 (16.5%) |
| 3.0x to 3.9x | 24,212 (11.3%) | 102,034 (23.6%) |
| 4.0x or more | 104,585 (48.8%) | 81,598 (18.9%) |
| Total | 214,094 (100.0%) | 432,806 (100.0%) |
Real Estate Taxes by Mortgage Status in Area Code 480
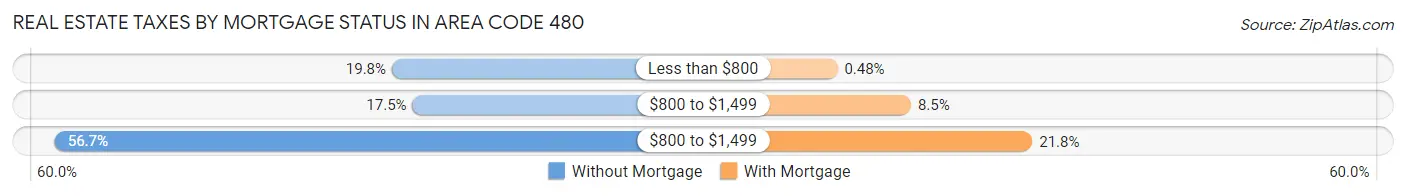
| Property Taxes | Without Mortgage | With Mortgage |
| Less than $800 | 42,288 (19.8%) | 2,099 (0.5%) |
| $800 to $1,499 | 37,458 (17.5%) | 36,966 (8.5%) |
| $800 to $1,499 | 121,367 (56.7%) | 94,513 (21.8%) |
| Total | 214,094 (100.0%) | 432,806 (100.0%) |
Health & Disability in Area Code 480
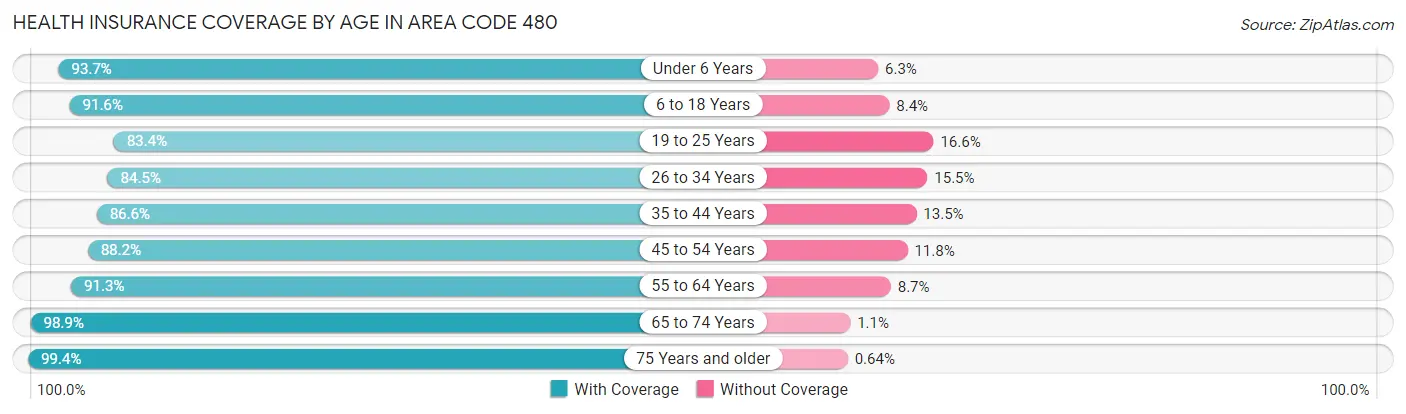
Health Insurance Coverage by Age in Area Code 480
| Age Bracket | With Coverage | Without Coverage |
| Under 6 Years | 160,234 (93.7%) | 10,795 (6.3%) |
| 6 to 18 Years | 387,577 (91.6%) | 35,563 (8.4%) |
| 19 to 25 Years | 190,448 (83.4%) | 37,993 (16.6%) |
| 26 to 34 Years | 281,540 (84.5%) | 51,585 (15.5%) |
| 35 to 44 Years | 288,788 (86.6%) | 44,885 (13.5%) |
| 45 to 54 Years | 288,003 (88.2%) | 38,471 (11.8%) |
| 55 to 64 Years | 282,954 (91.3%) | 26,873 (8.7%) |
| 65 to 74 Years | 235,473 (98.9%) | 2,636 (1.1%) |
| 75 Years and older | 172,322 (99.4%) | 1,111 (0.6%) |
| Total | 2,287,339 (90.1%) | 249,912 (9.9%) |
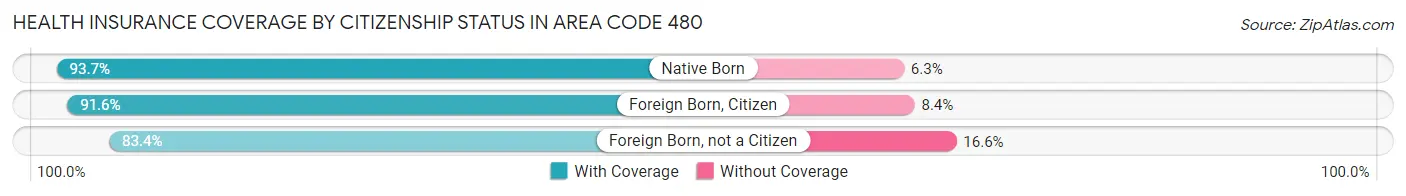
Health Insurance Coverage by Citizenship Status in Area Code 480
| Citizenship Status | With Coverage | Without Coverage |
| Native Born | 160,234 (93.7%) | 10,795 (6.3%) |
| Foreign Born, Citizen | 387,577 (91.6%) | 35,563 (8.4%) |
| Foreign Born, not a Citizen | 190,448 (83.4%) | 37,993 (16.6%) |
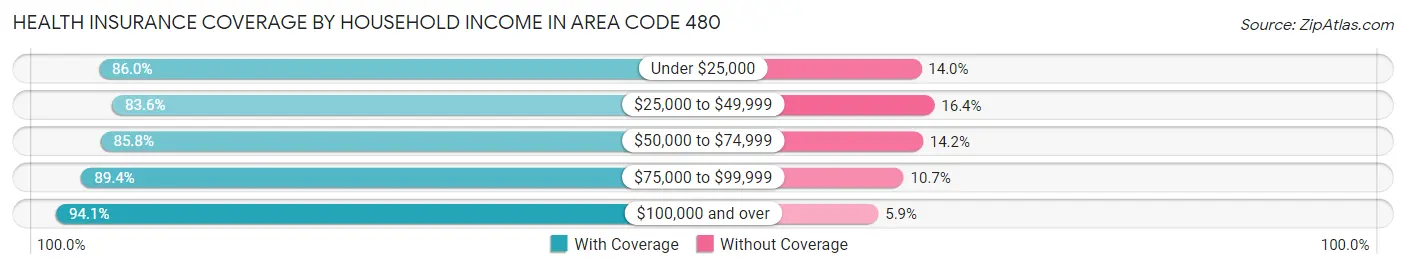
Health Insurance Coverage by Household Income in Area Code 480
| Household Income | With Coverage | Without Coverage |
| Under $25,000 | 173,107 (86.0%) | 28,106 (14.0%) |
| $25,000 to $49,999 | 284,042 (83.6%) | 55,743 (16.4%) |
| $50,000 to $74,999 | 322,810 (85.8%) | 53,622 (14.2%) |
| $75,000 to $99,999 | 304,879 (89.3%) | 36,329 (10.6%) |
| $100,000 and over | 1,190,908 (94.1%) | 74,713 (5.9%) |
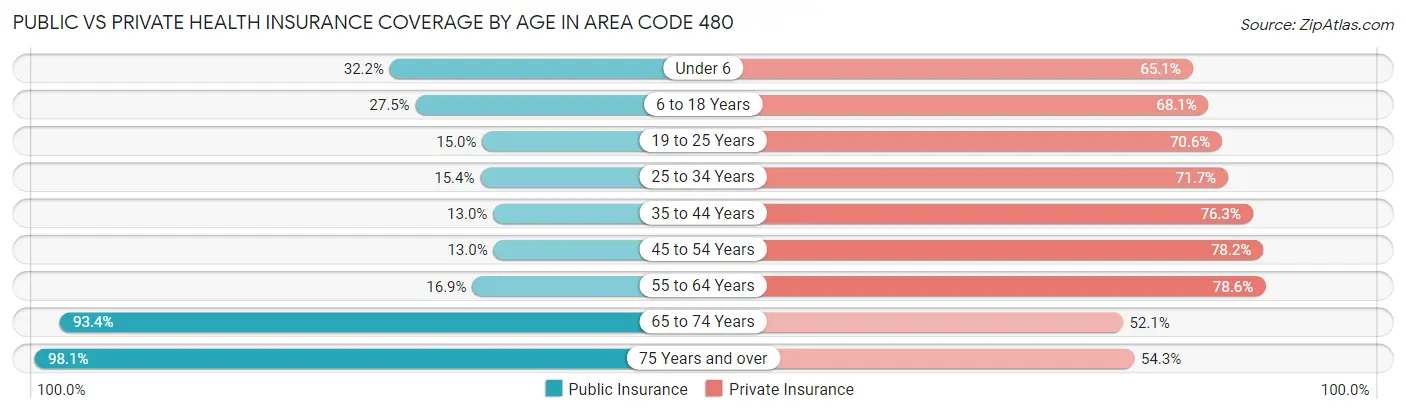
Public vs Private Health Insurance Coverage by Age in Area Code 480
| Age Bracket | Public Insurance | Private Insurance |
| Under 6 | 55,081 (32.2%) | 111,349 (65.1%) |
| 6 to 18 Years | 116,183 (27.5%) | 288,107 (68.1%) |
| 19 to 25 Years | 34,346 (15.0%) | 161,282 (70.6%) |
| 25 to 34 Years | 51,318 (15.4%) | 238,706 (71.7%) |
| 35 to 44 Years | 43,488 (13.0%) | 254,480 (76.3%) |
| 45 to 54 Years | 42,344 (13.0%) | 255,381 (78.2%) |
| 55 to 64 Years | 52,336 (16.9%) | 243,436 (78.6%) |
| 65 to 74 Years | 222,390 (93.4%) | 124,096 (52.1%) |
| 75 Years and over | 170,075 (98.1%) | 94,091 (54.2%) |
| Total | 787,561 (31.0%) | 1,770,928 (69.8%) |
Disability Status by Sex by Age in Area Code 480
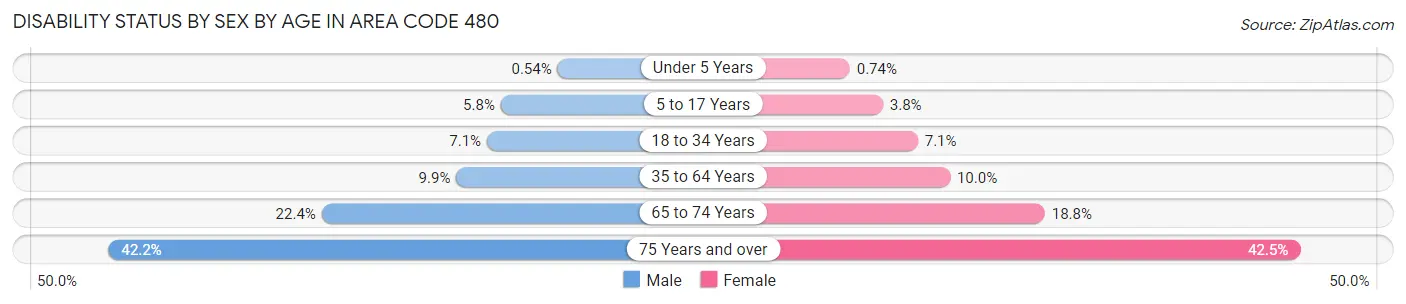
| Age Bracket | Male | Female |
| Under 5 Years | 390 (0.5%) | 510 (0.7%) |
| 5 to 17 Years | 12,663 (5.8%) | 7,732 (3.8%) |
| 18 to 34 Years | 21,561 (7.1%) | 20,360 (7.0%) |
| 35 to 64 Years | 48,247 (9.9%) | 48,667 (10.0%) |
| 65 to 74 Years | 24,877 (22.4%) | 23,959 (18.8%) |
| 75 Years and over | 32,000 (42.2%) | 41,541 (42.5%) |
Disability Class by Sex by Age in Area Code 480
Disability Class: Hearing Difficulty
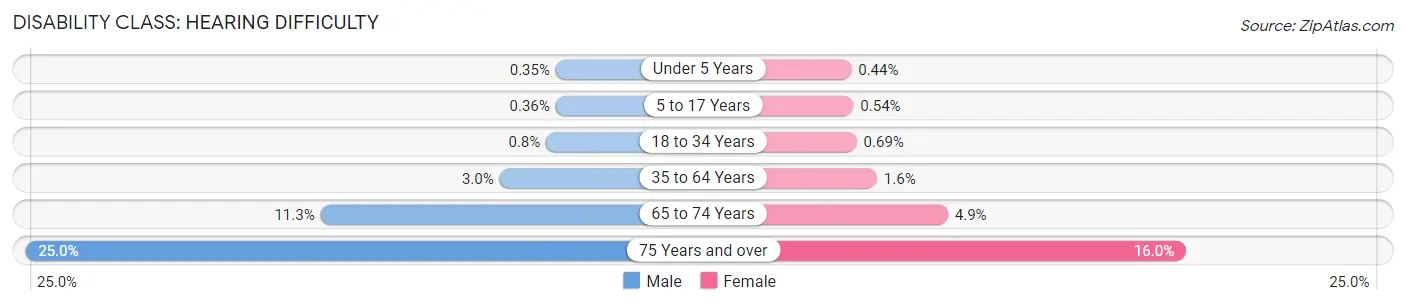
| Age Bracket | Male | Female |
| Under 5 Years | 251 (0.4%) | 302 (0.4%) |
| 5 to 17 Years | 782 (0.4%) | 1,091 (0.5%) |
| 18 to 34 Years | 2,439 (0.8%) | 1,999 (0.7%) |
| 35 to 64 Years | 14,366 (3.0%) | 7,919 (1.6%) |
| 65 to 74 Years | 12,501 (11.3%) | 6,263 (4.9%) |
| 75 Years and over | 18,926 (25.0%) | 15,592 (16.0%) |
Disability Class: Vision Difficulty
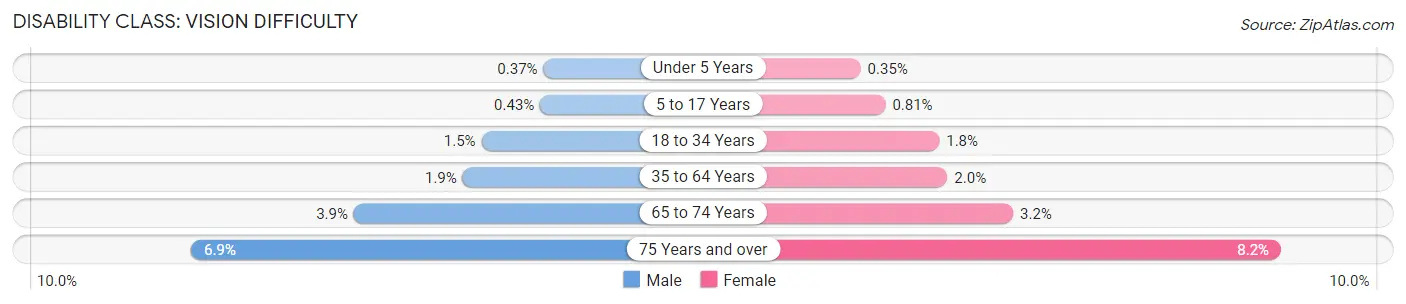
| Age Bracket | Male | Female |
| Under 5 Years | 266 (0.4%) | 244 (0.4%) |
| 5 to 17 Years | 929 (0.4%) | 1,641 (0.8%) |
| 18 to 34 Years | 4,615 (1.5%) | 5,215 (1.8%) |
| 35 to 64 Years | 9,051 (1.9%) | 9,509 (2.0%) |
| 65 to 74 Years | 4,314 (3.9%) | 4,041 (3.2%) |
| 75 Years and over | 5,239 (6.9%) | 7,957 (8.2%) |
Disability Class: Cognitive Difficulty
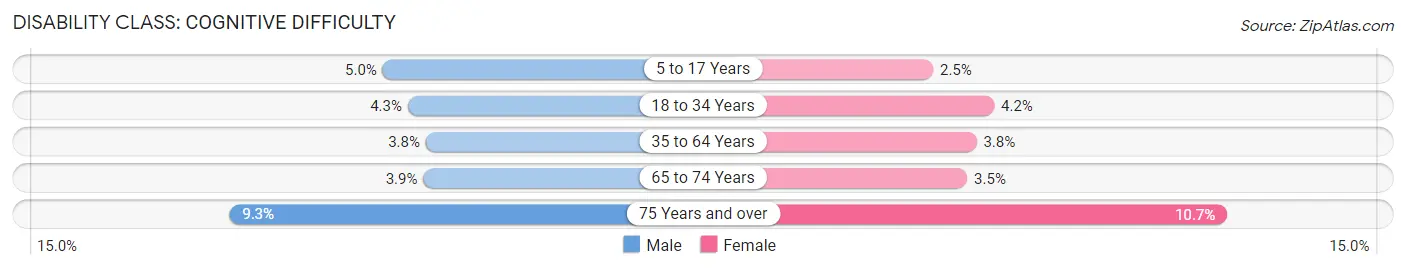
| Age Bracket | Male | Female |
| 5 to 17 Years | 10,972 (5.0%) | 5,171 (2.5%) |
| 18 to 34 Years | 13,170 (4.3%) | 12,250 (4.2%) |
| 35 to 64 Years | 18,571 (3.8%) | 18,159 (3.7%) |
| 65 to 74 Years | 4,323 (3.9%) | 4,444 (3.5%) |
| 75 Years and over | 7,048 (9.3%) | 10,479 (10.7%) |
Disability Class: Ambulatory Difficulty
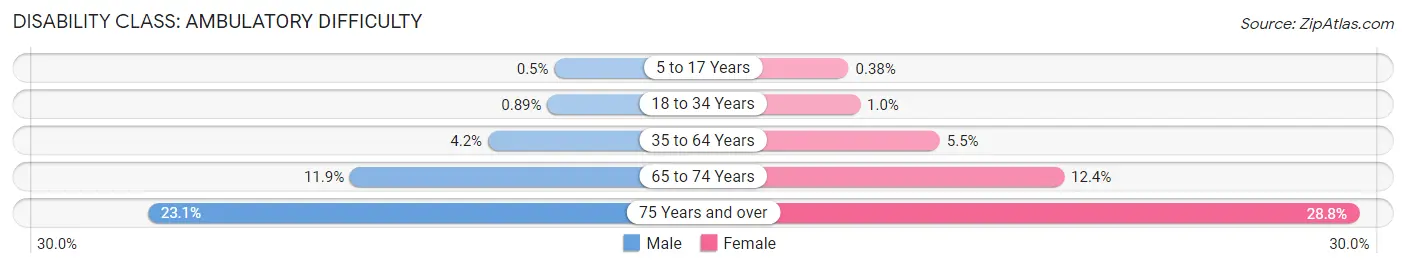
| Age Bracket | Male | Female |
| 5 to 17 Years | 1,095 (0.5%) | 776 (0.4%) |
| 18 to 34 Years | 2,720 (0.9%) | 2,942 (1.0%) |
| 35 to 64 Years | 20,391 (4.2%) | 26,460 (5.5%) |
| 65 to 74 Years | 13,178 (11.9%) | 15,747 (12.4%) |
| 75 Years and over | 17,541 (23.1%) | 28,107 (28.8%) |
Disability Class: Self-Care Difficulty
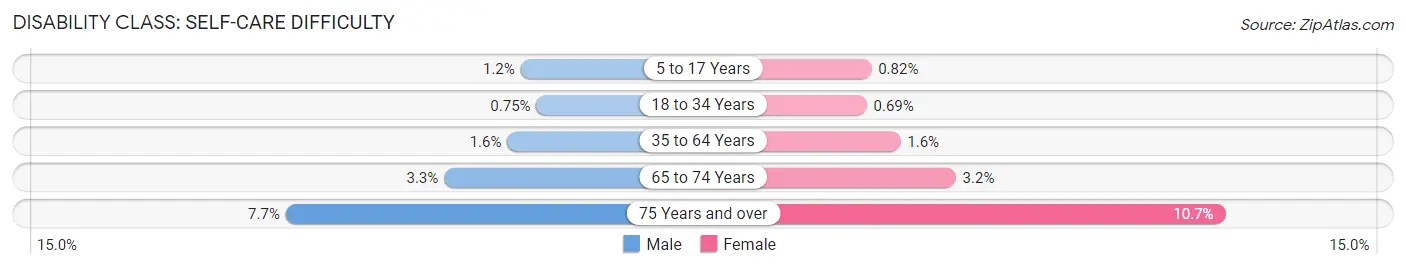
| Age Bracket | Male | Female |
| 5 to 17 Years | 2,595 (1.2%) | 1,669 (0.8%) |
| 18 to 34 Years | 2,271 (0.7%) | 1,993 (0.7%) |
| 35 to 64 Years | 7,569 (1.6%) | 7,924 (1.6%) |
| 65 to 74 Years | 3,682 (3.3%) | 4,035 (3.2%) |
| 75 Years and over | 5,861 (7.7%) | 10,429 (10.7%) |
Technology Access in Area Code 480
Computing Device Access in Area Code 480
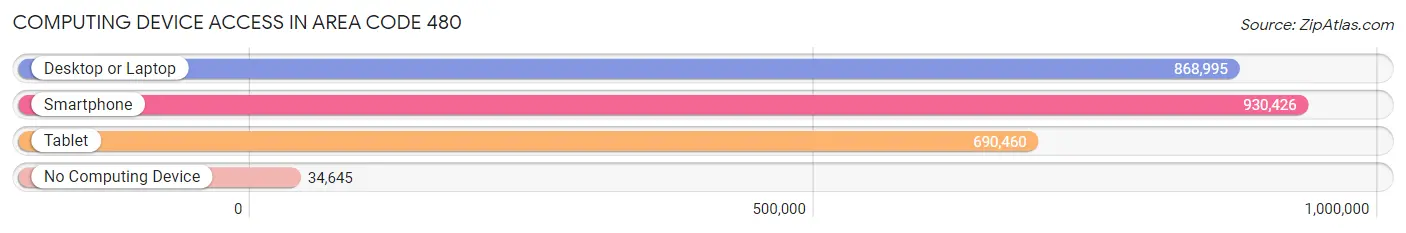
| Device Type | # Households | % Households |
| Desktop or Laptop | 868,995 | 86.1% |
| Smartphone | 930,426 | 92.2% |
| Tablet | 690,460 | 68.4% |
| No Computing Device | 34,645 | 3.4% |
| Total | 1,009,153 | 100.0% |
Internet Access in Area Code 480
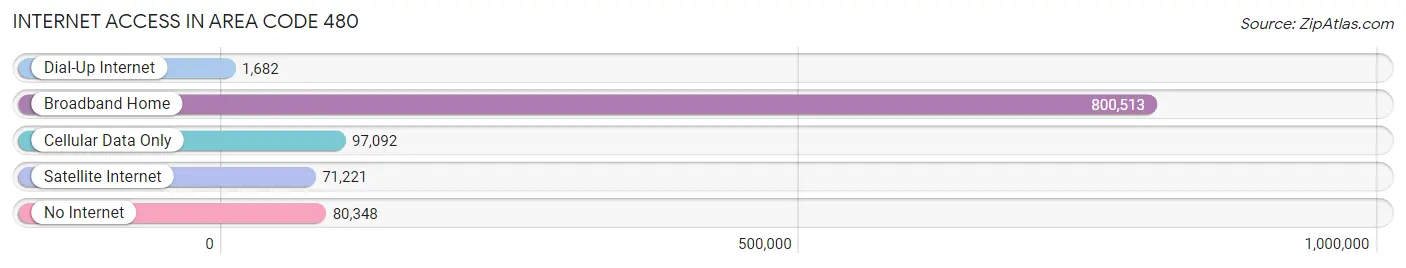
| Internet Type | # Households | % Households |
| Dial-Up Internet | 1,682 | 0.2% |
| Broadband Home | 800,513 | 79.3% |
| Cellular Data Only | 97,092 | 9.6% |
| Satellite Internet | 71,221 | 7.1% |
| No Internet | 80,348 | 8.0% |
| Total | 1,009,153 | 100.0% |
Area Code 480 Summary
Geography
Area code 480 is located in the state of Arizona and covers the cities of Tempe, Mesa, Chandler, and Scottsdale. It is bordered by area codes 602, 623, and 520.
Social
Area code 480 is home to a diverse population of people from all walks of life. The area is known for its vibrant nightlife, with many bars, restaurants, and clubs. It is also home to a number of universities and colleges, including Arizona State University and the University of Phoenix.
Economics
Area code 480 is a major economic hub in the state of Arizona. It is home to a number of large corporations, including Intel, Wells Fargo, and US Airways. The area is also home to a number of small businesses, including restaurants, retail stores, and professional services.
Demographics
Area code 480 is home to a population of over 1.5 million people. The population is diverse, with a mix of races and ethnicities. The median household income is $60,000, and the median age is 33. The area is also home to a large number of college students, as well as a large number of retirees.
Common Questions
What is Per Capita Income in Area Code 480?
Per Capita income in Area Code 480 is $50,187.
What is the Median Family Income in Area Code 480?
Median Family Income in Area Code 480 is $107,719.
What is the Median Household income in Area Code 480?
Median Household Income in Area Code 480 is $91,290.
What is Income or Wage Gap in Area Code 480?
Income or Wage Gap in Area Code 480 is 25.0%.
Women in Area Code 480 earn 75.0 cents for every dollar earned by a man.
What is Family Income Deficit in Area Code 480?
Family Income Deficit in Area Code 480 is $11,331.
Families that are below poverty line in Area Code 480 earn $11,331 less on average than the poverty threshold level.
What is Inequality or Gini Index in Area Code 480?
Inequality or Gini Index in Area Code 480 is 32.10.
What is the Total Population of Area Code 480?
Total Population of Area Code 480 is 2,553,748.
What is the Total Male Population of Area Code 480?
Total Male Population of Area Code 480 is 1,277,610.
What is the Total Female Population of Area Code 480?
Total Female Population of Area Code 480 is 1,276,138.
What is the Ratio of Males per 100 Females in Area Code 480?
There are 100.12 Males per 100 Females in Area Code 480.
What is the Ratio of Females per 100 Males in Area Code 480?
There are 99.88 Females per 100 Males in Area Code 480.
What is the Median Population Age in Area Code 480?
Median Population Age in Area Code 480 is 41.0 Years.
What is the Average Family Size in Area Code 480
Average Family Size in Area Code 480 is 3.0 People.
What is the Average Household Size in Area Code 480
Average Household Size in Area Code 480 is 2.5 People.
How Large is the Labor Force in Area Code 480?
There are 1,328,354 People in the Labor Forcein in Area Code 480.
What is the Percentage of People in the Labor Force in Area Code 480?
64.6% of People are in the Labor Force in Area Code 480.
What is the Unemployment Rate in Area Code 480?
Unemployment Rate in Area Code 480 is 4.7%.