San Tan Valley, AZ Map & Demographics
San Tan Valley Map
San Tan Valley Overview
$33,019
PER CAPITA INCOME
$91,590
AVG FAMILY INCOME
$88,466
AVG HOUSEHOLD INCOME
33.3%
WAGE / INCOME GAP [ % ]
66.7¢/ $1
WAGE / INCOME GAP [ $ ]
$12,126
FAMILY INCOME DEFICIT
0.35
INEQUALITY / GINI INDEX
101,207
TOTAL POPULATION
49,294
MALE POPULATION
51,913
FEMALE POPULATION
94.96
MALES / 100 FEMALES
105.31
FEMALES / 100 MALES
34.7
MEDIAN AGE
3.4
AVG FAMILY SIZE
3.1
AVG HOUSEHOLD SIZE
50,564
LABOR FORCE [ PEOPLE ]
66.8%
PERCENT IN LABOR FORCE
4.5%
UNEMPLOYMENT RATE
Income in San Tan Valley
Income Overview in San Tan Valley
Per Capita Income in San Tan Valley is $33,019, while median incomes of families and households are $91,590 and $88,466 respectively.
| Characteristic | Number | Measure |
| Per Capita Income | 101,207 | $33,019 |
| Median Family Income | 26,357 | $91,590 |
| Mean Family Income | 26,357 | $105,549 |
| Median Household Income | 32,530 | $88,466 |
| Mean Household Income | 32,530 | $101,303 |
| Income Deficit | 26,357 | $12,126 |
| Wage / Income Gap (%) | 101,207 | 33.34% |
| Wage / Income Gap ($) | 101,207 | 66.66¢ per $1 |
| Gini / Inequality Index | 101,207 | 0.35 |
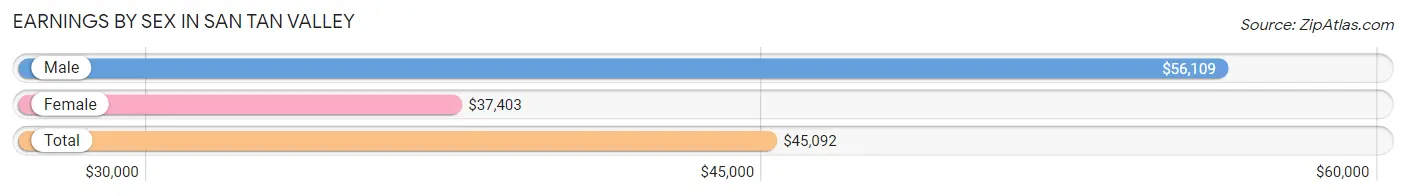
Earnings by Sex in San Tan Valley
Average Earnings in San Tan Valley are $45,092, $56,109 for men and $37,403 for women, a difference of 33.3%.
| Sex | Number | Average Earnings |
| Male | 27,448 (53.0%) | $56,109 |
| Female | 24,326 (47.0%) | $37,403 |
| Total | 51,774 (100.0%) | $45,092 |
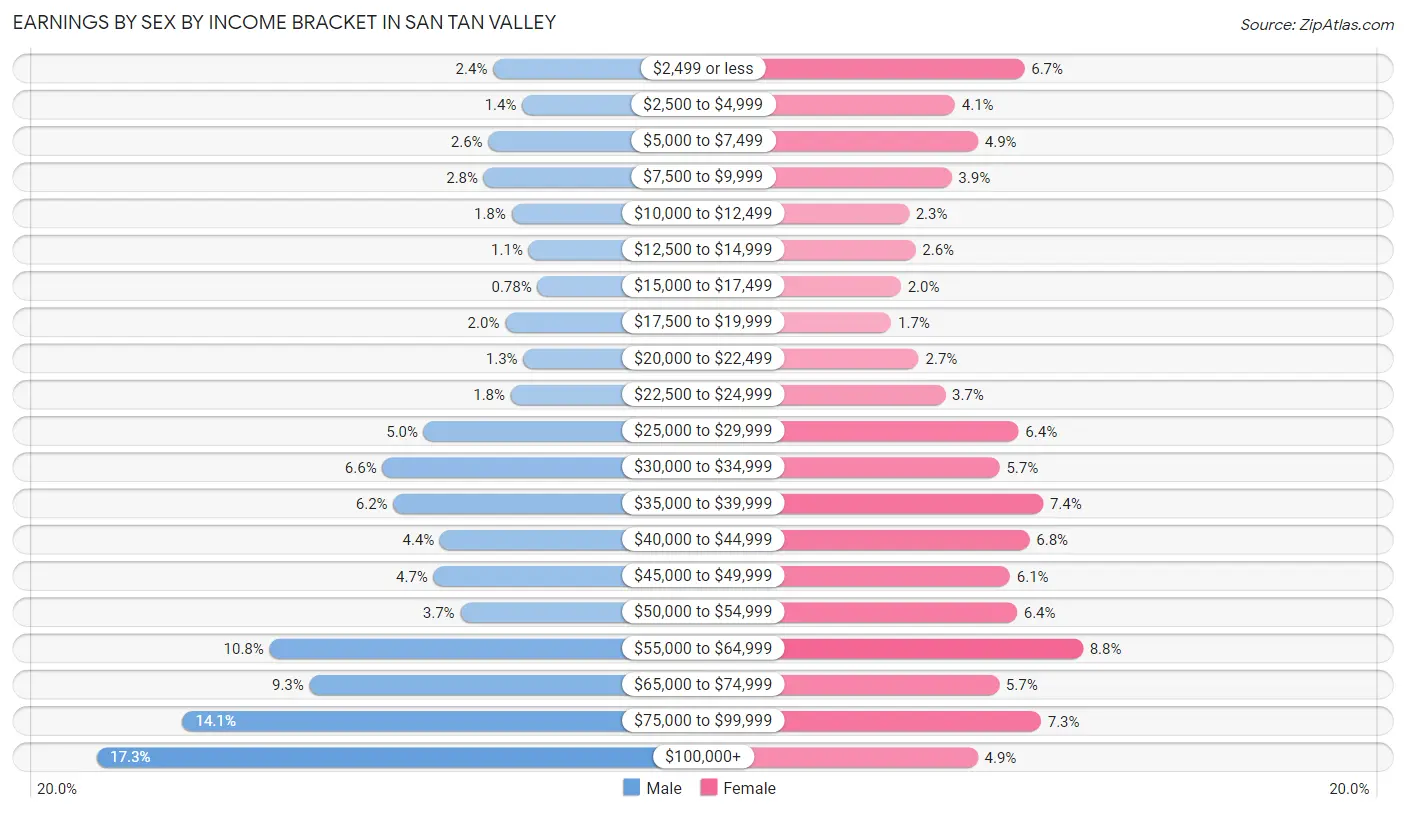
Earnings by Sex by Income Bracket in San Tan Valley
The most common earnings brackets in San Tan Valley are $100,000+ for men (4,743 | 17.3%) and $55,000 to $64,999 for women (2,151 | 8.8%).
| Income | Male | Female |
| $2,499 or less | 670 (2.4%) | 1,617 (6.7%) |
| $2,500 to $4,999 | 370 (1.3%) | 986 (4.1%) |
| $5,000 to $7,499 | 719 (2.6%) | 1,194 (4.9%) |
| $7,500 to $9,999 | 765 (2.8%) | 953 (3.9%) |
| $10,000 to $12,499 | 479 (1.8%) | 565 (2.3%) |
| $12,500 to $14,999 | 305 (1.1%) | 626 (2.6%) |
| $15,000 to $17,499 | 215 (0.8%) | 492 (2.0%) |
| $17,500 to $19,999 | 546 (2.0%) | 403 (1.7%) |
| $20,000 to $22,499 | 359 (1.3%) | 655 (2.7%) |
| $22,500 to $24,999 | 488 (1.8%) | 896 (3.7%) |
| $25,000 to $29,999 | 1,384 (5.0%) | 1,565 (6.4%) |
| $30,000 to $34,999 | 1,809 (6.6%) | 1,392 (5.7%) |
| $35,000 to $39,999 | 1,697 (6.2%) | 1,787 (7.3%) |
| $40,000 to $44,999 | 1,217 (4.4%) | 1,664 (6.8%) |
| $45,000 to $49,999 | 1,283 (4.7%) | 1,486 (6.1%) |
| $50,000 to $54,999 | 1,006 (3.7%) | 1,549 (6.4%) |
| $55,000 to $64,999 | 2,969 (10.8%) | 2,151 (8.8%) |
| $65,000 to $74,999 | 2,558 (9.3%) | 1,386 (5.7%) |
| $75,000 to $99,999 | 3,866 (14.1%) | 1,768 (7.3%) |
| $100,000+ | 4,743 (17.3%) | 1,191 (4.9%) |
| Total | 27,448 (100.0%) | 24,326 (100.0%) |
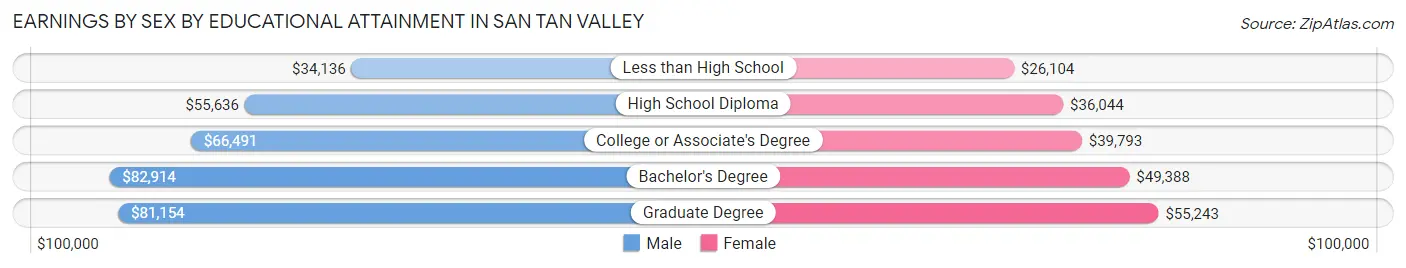
Earnings by Sex by Educational Attainment in San Tan Valley
Average earnings in San Tan Valley are $62,198 for men and $40,830 for women, a difference of 34.4%. Men with an educational attainment of bachelor's degree enjoy the highest average annual earnings of $82,914, while those with less than high school education earn the least with $34,136. Women with an educational attainment of graduate degree earn the most with the average annual earnings of $55,243, while those with less than high school education have the smallest earnings of $26,104.
| Educational Attainment | Male Income | Female Income |
| Less than High School | $34,136 | $26,104 |
| High School Diploma | $55,636 | $36,044 |
| College or Associate's Degree | $66,491 | $39,793 |
| Bachelor's Degree | $82,914 | $49,388 |
| Graduate Degree | $81,154 | $55,243 |
| Total | $62,198 | $40,830 |
Family Income in San Tan Valley
Family Income Brackets in San Tan Valley
According to the San Tan Valley family income data, there are 7,195 families falling into the $100,000 to $149,999 income range, which is the most common income bracket and makes up 27.3% of all families. Conversely, the $10,000 to $14,999 income bracket is the least frequent group with only 184 families (0.7%) belonging to this category.
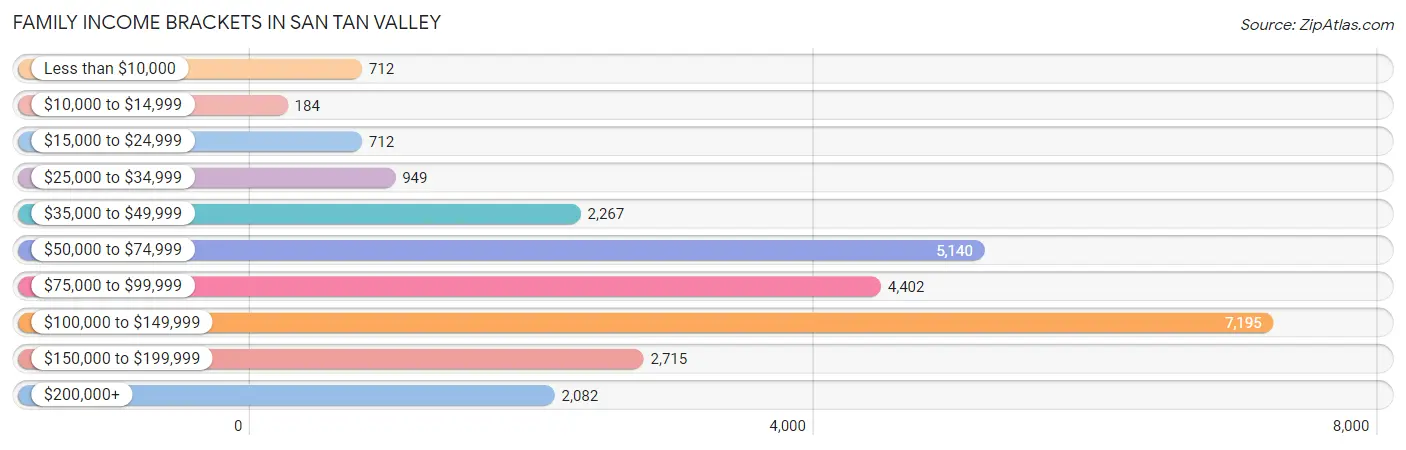
| Income Bracket | # Families | % Families |
| Less than $10,000 | 712 | 2.7% |
| $10,000 to $14,999 | 184 | 0.7% |
| $15,000 to $24,999 | 712 | 2.7% |
| $25,000 to $34,999 | 949 | 3.6% |
| $35,000 to $49,999 | 2,267 | 8.6% |
| $50,000 to $74,999 | 5,140 | 19.5% |
| $75,000 to $99,999 | 4,402 | 16.7% |
| $100,000 to $149,999 | 7,195 | 27.3% |
| $150,000 to $199,999 | 2,715 | 10.3% |
| $200,000+ | 2,082 | 7.9% |
Family Income by Famaliy Size in San Tan Valley
7+ person families (1,410 | 5.3%) account for the highest median family income in San Tan Valley with $118,374 per family, while 2-person families (10,061 | 38.2%) have the highest median income of $38,558 per family member.
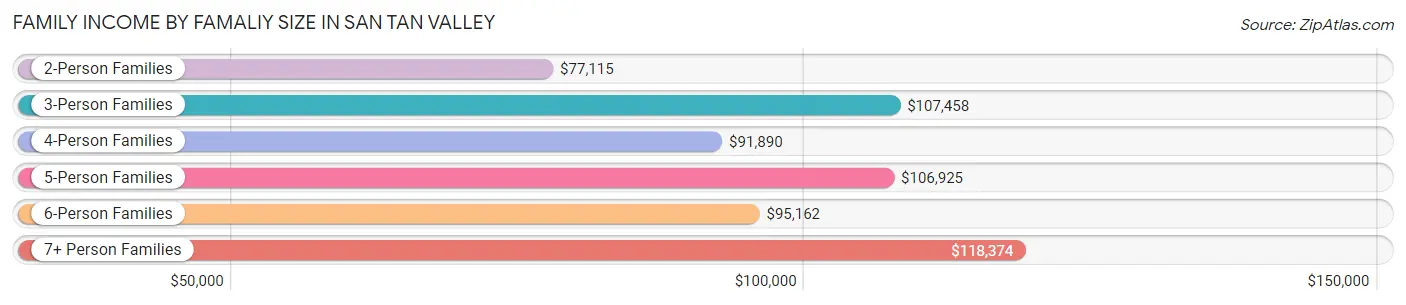
| Income Bracket | # Families | Median Income |
| 2-Person Families | 10,061 (38.2%) | $77,115 |
| 3-Person Families | 4,755 (18.0%) | $107,458 |
| 4-Person Families | 5,029 (19.1%) | $91,890 |
| 5-Person Families | 3,463 (13.1%) | $106,925 |
| 6-Person Families | 1,639 (6.2%) | $95,162 |
| 7+ Person Families | 1,410 (5.3%) | $118,374 |
| Total | 26,357 (100.0%) | $91,590 |
Family Income by Number of Earners in San Tan Valley
The median family income in San Tan Valley is $91,590, with families comprising 3+ earners (3,719) having the highest median family income of $128,685, while families with no earners (2,963) have the lowest median family income of $48,663, accounting for 14.1% and 11.2% of families, respectively.
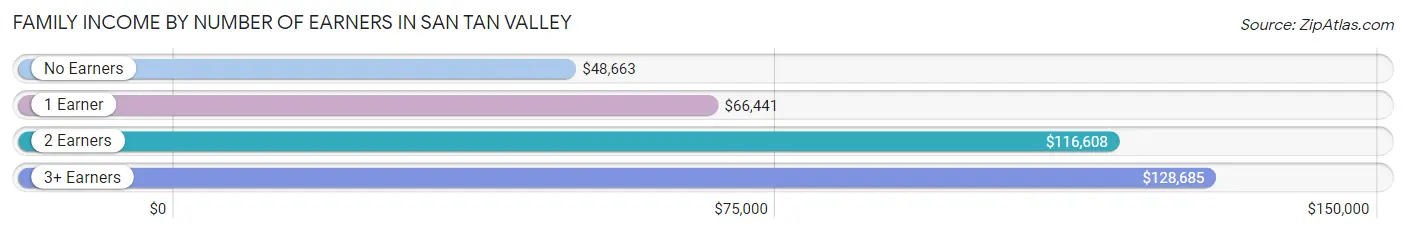
| Number of Earners | # Families | Median Income |
| No Earners | 2,963 (11.2%) | $48,663 |
| 1 Earner | 9,517 (36.1%) | $66,441 |
| 2 Earners | 10,158 (38.5%) | $116,608 |
| 3+ Earners | 3,719 (14.1%) | $128,685 |
| Total | 26,357 (100.0%) | $91,590 |
Household Income in San Tan Valley
Household Income Brackets in San Tan Valley
With 8,100 households falling in the category, the $100,000 to $149,999 income range is the most frequent in San Tan Valley, accounting for 24.9% of all households. In contrast, only 423 households (1.3%) fall into the $10,000 to $14,999 income bracket, making it the least populous group.
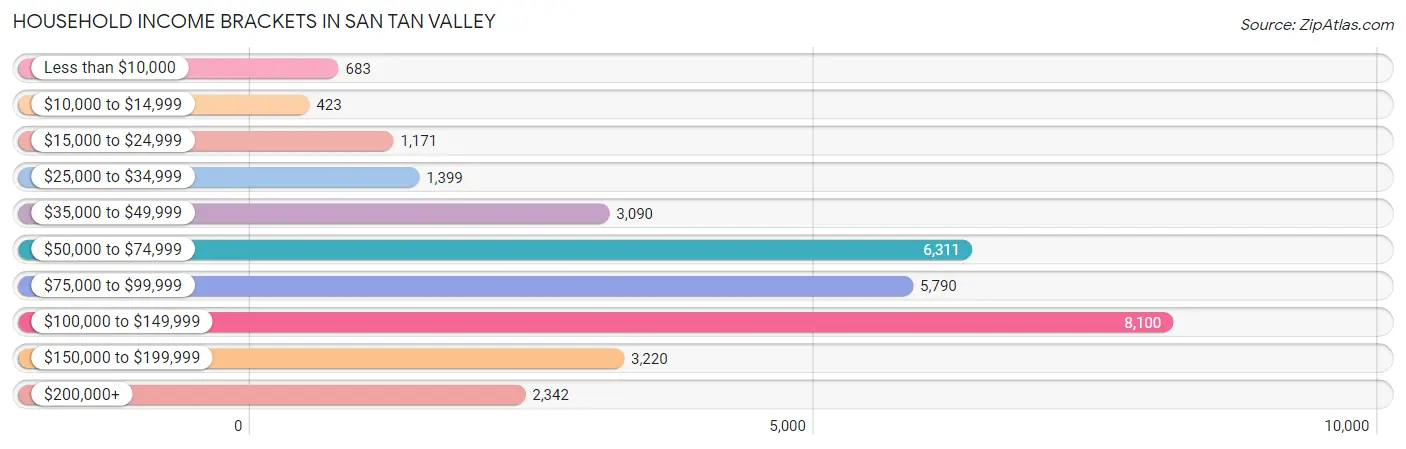
| Income Bracket | # Households | % Households |
| Less than $10,000 | 683 | 2.1% |
| $10,000 to $14,999 | 423 | 1.3% |
| $15,000 to $24,999 | 1,171 | 3.6% |
| $25,000 to $34,999 | 1,399 | 4.3% |
| $35,000 to $49,999 | 3,090 | 9.5% |
| $50,000 to $74,999 | 6,311 | 19.4% |
| $75,000 to $99,999 | 5,790 | 17.8% |
| $100,000 to $149,999 | 8,100 | 24.9% |
| $150,000 to $199,999 | 3,220 | 9.9% |
| $200,000+ | 2,342 | 7.2% |
Household Income by Householder Age in San Tan Valley
The median household income in San Tan Valley is $88,466, with the highest median household income of $104,617 found in the 45 to 64 years age bracket for the primary householder. A total of 11,866 households (36.5%) fall into this category. Meanwhile, the 65+ years age bracket for the primary householder has the lowest median household income of $54,060, with 6,340 households (19.5%) in this group.
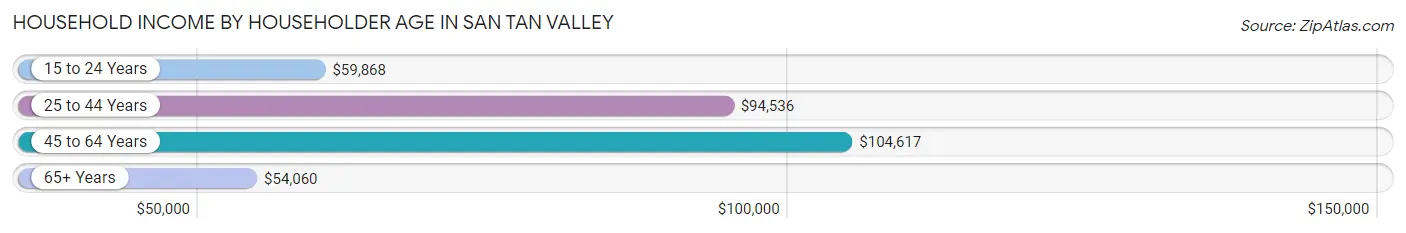
| Income Bracket | # Households | Median Income |
| 15 to 24 Years | 1,025 (3.2%) | $59,868 |
| 25 to 44 Years | 13,299 (40.9%) | $94,536 |
| 45 to 64 Years | 11,866 (36.5%) | $104,617 |
| 65+ Years | 6,340 (19.5%) | $54,060 |
| Total | 32,530 (100.0%) | $88,466 |
Poverty in San Tan Valley
Income Below Poverty by Sex and Age in San Tan Valley
With 6.4% poverty level for males and 8.9% for females among the residents of San Tan Valley, 15 year old males and 5 year old females are the most vulnerable to poverty, with 203 males (24.6%) and 120 females (22.4%) in their respective age groups living below the poverty level.
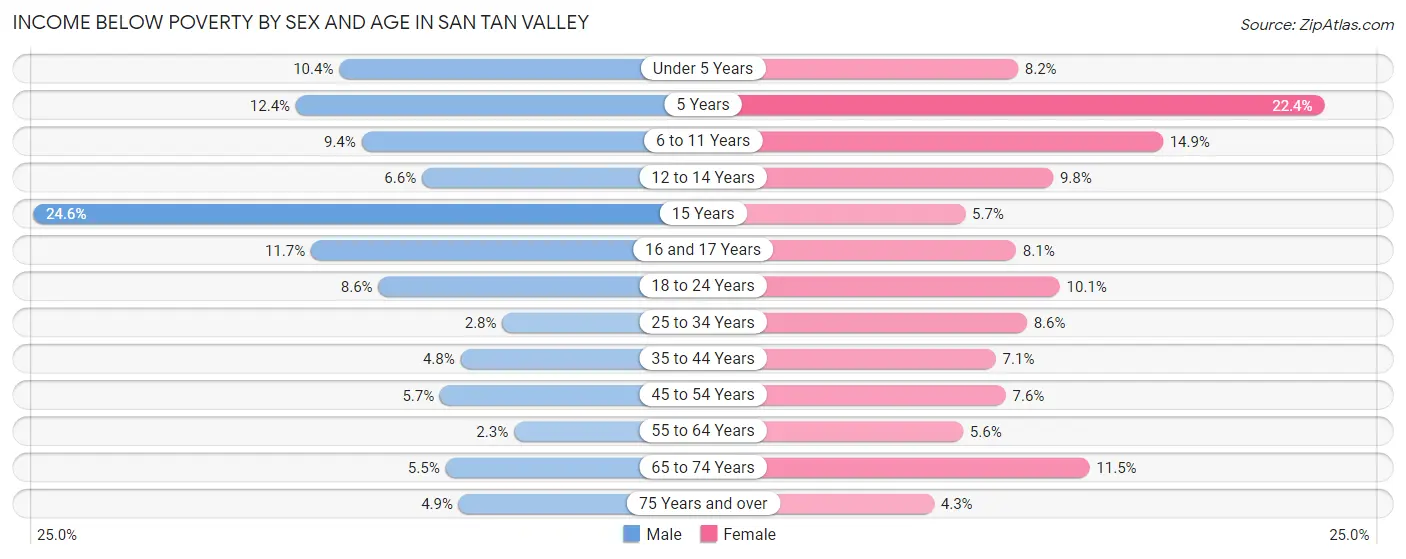
| Age Bracket | Male | Female |
| Under 5 Years | 311 (10.4%) | 272 (8.2%) |
| 5 Years | 104 (12.4%) | 120 (22.4%) |
| 6 to 11 Years | 453 (9.4%) | 813 (14.9%) |
| 12 to 14 Years | 148 (6.6%) | 303 (9.8%) |
| 15 Years | 203 (24.6%) | 56 (5.7%) |
| 16 and 17 Years | 183 (11.7%) | 126 (8.1%) |
| 18 to 24 Years | 435 (8.6%) | 424 (10.1%) |
| 25 to 34 Years | 184 (2.8%) | 581 (8.6%) |
| 35 to 44 Years | 386 (4.8%) | 584 (7.1%) |
| 45 to 54 Years | 312 (5.7%) | 447 (7.6%) |
| 55 to 64 Years | 114 (2.3%) | 315 (5.6%) |
| 65 to 74 Years | 212 (5.5%) | 511 (11.5%) |
| 75 Years and over | 87 (4.9%) | 73 (4.3%) |
| Total | 3,132 (6.4%) | 4,625 (8.9%) |
Income Above Poverty by Sex and Age in San Tan Valley
According to the poverty statistics in San Tan Valley, males aged 55 to 64 years and females aged 75 years and over are the age groups that are most secure financially, with 97.7% of males and 95.7% of females in these age groups living above the poverty line.
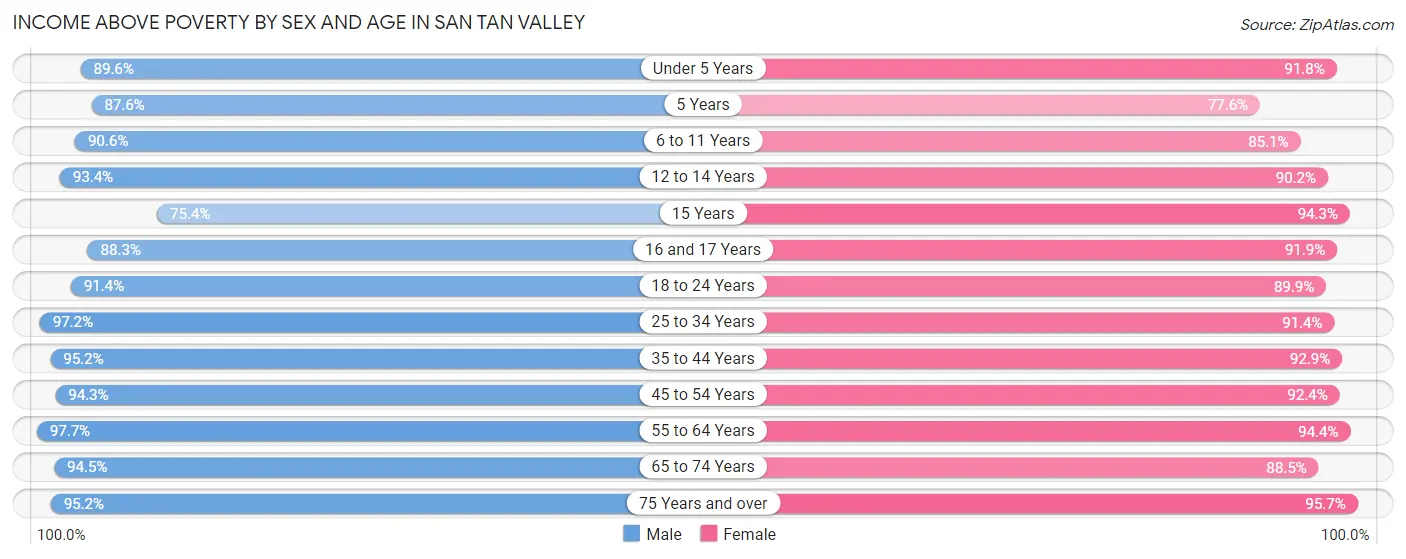
| Age Bracket | Male | Female |
| Under 5 Years | 2,678 (89.6%) | 3,057 (91.8%) |
| 5 Years | 734 (87.6%) | 416 (77.6%) |
| 6 to 11 Years | 4,388 (90.6%) | 4,647 (85.1%) |
| 12 to 14 Years | 2,109 (93.4%) | 2,790 (90.2%) |
| 15 Years | 622 (75.4%) | 923 (94.3%) |
| 16 and 17 Years | 1,380 (88.3%) | 1,434 (91.9%) |
| 18 to 24 Years | 4,636 (91.4%) | 3,771 (89.9%) |
| 25 to 34 Years | 6,322 (97.2%) | 6,193 (91.4%) |
| 35 to 44 Years | 7,705 (95.2%) | 7,599 (92.9%) |
| 45 to 54 Years | 5,144 (94.3%) | 5,435 (92.4%) |
| 55 to 64 Years | 4,856 (97.7%) | 5,286 (94.4%) |
| 65 to 74 Years | 3,663 (94.5%) | 3,937 (88.5%) |
| 75 Years and over | 1,708 (95.2%) | 1,638 (95.7%) |
| Total | 45,945 (93.6%) | 47,126 (91.1%) |
Income Below Poverty Among Married-Couple Families in San Tan Valley
The poverty statistics for married-couple families in San Tan Valley show that 3.8% or 793 of the total 20,810 families live below the poverty line. Families with 5 or more children have the highest poverty rate of 12.2%, comprising of 64 families. On the other hand, families with 1 or 2 children have the lowest poverty rate of 2.3%, which includes 162 families.
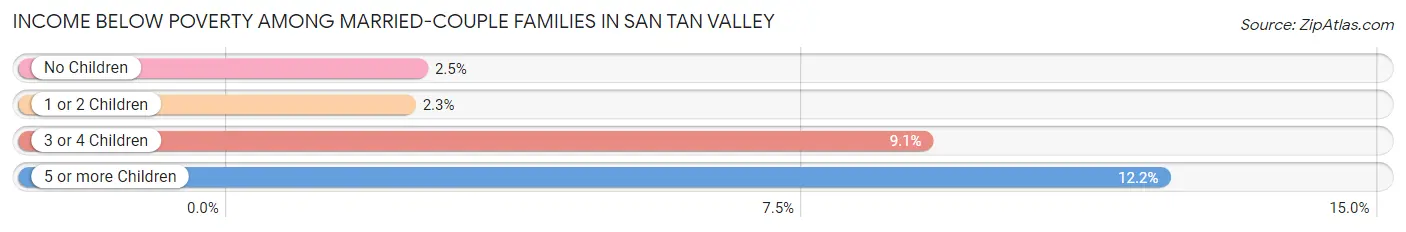
| Children | Above Poverty | Below Poverty |
| No Children | 9,466 (97.5%) | 241 (2.5%) |
| 1 or 2 Children | 6,826 (97.7%) | 162 (2.3%) |
| 3 or 4 Children | 3,263 (90.9%) | 326 (9.1%) |
| 5 or more Children | 462 (87.8%) | 64 (12.2%) |
| Total | 20,017 (96.2%) | 793 (3.8%) |
Income Below Poverty Among Single-Parent Households in San Tan Valley
According to the poverty data in San Tan Valley, 1.7% or 30 single-father households and 22.2% or 840 single-mother households are living below the poverty line. Among single-father households, those with 1 or 2 children have the highest poverty rate, with 30 households (3.2%) experiencing poverty. Likewise, among single-mother households, those with 1 or 2 children have the highest poverty rate, with 461 households (31.2%) falling below the poverty line.
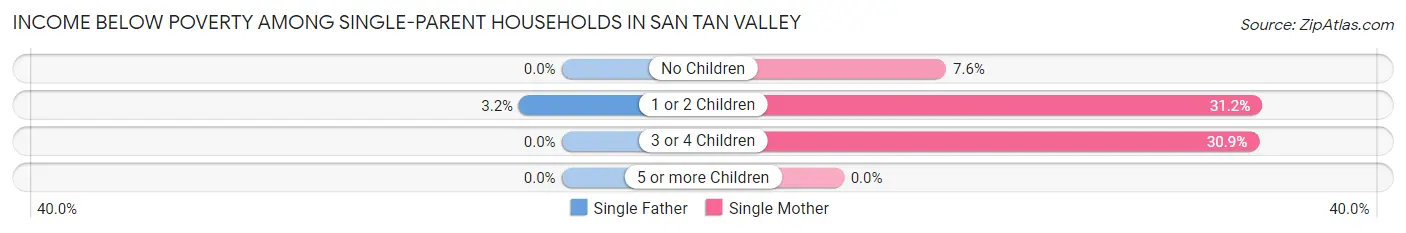
| Children | Single Father | Single Mother |
| No Children | 0 (0.0%) | 108 (7.6%) |
| 1 or 2 Children | 30 (3.2%) | 461 (31.2%) |
| 3 or 4 Children | 0 (0.0%) | 271 (30.9%) |
| 5 or more Children | 0 (0.0%) | 0 (0.0%) |
| Total | 30 (1.7%) | 840 (22.2%) |
Income Below Poverty Among Married-Couple vs Single-Parent Households in San Tan Valley
The poverty data for San Tan Valley shows that 793 of the married-couple family households (3.8%) and 870 of the single-parent households (15.7%) are living below the poverty level. Within the married-couple family households, those with 5 or more children have the highest poverty rate, with 64 households (12.2%) falling below the poverty line. Among the single-parent households, those with 3 or 4 children have the highest poverty rate, with 271 household (26.0%) living below poverty.
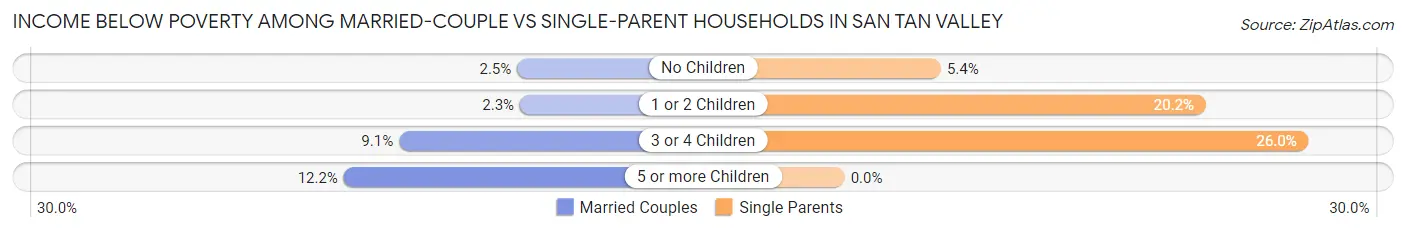
| Children | Married-Couple Families | Single-Parent Households |
| No Children | 241 (2.5%) | 108 (5.4%) |
| 1 or 2 Children | 162 (2.3%) | 491 (20.2%) |
| 3 or 4 Children | 326 (9.1%) | 271 (26.0%) |
| 5 or more Children | 64 (12.2%) | 0 (0.0%) |
| Total | 793 (3.8%) | 870 (15.7%) |
Race in San Tan Valley
The most populous races in San Tan Valley are White / Caucasian (75,902 | 75.0%), Hispanic or Latino (26,754 | 26.4%), and Two or more Races (11,083 | 11.0%).
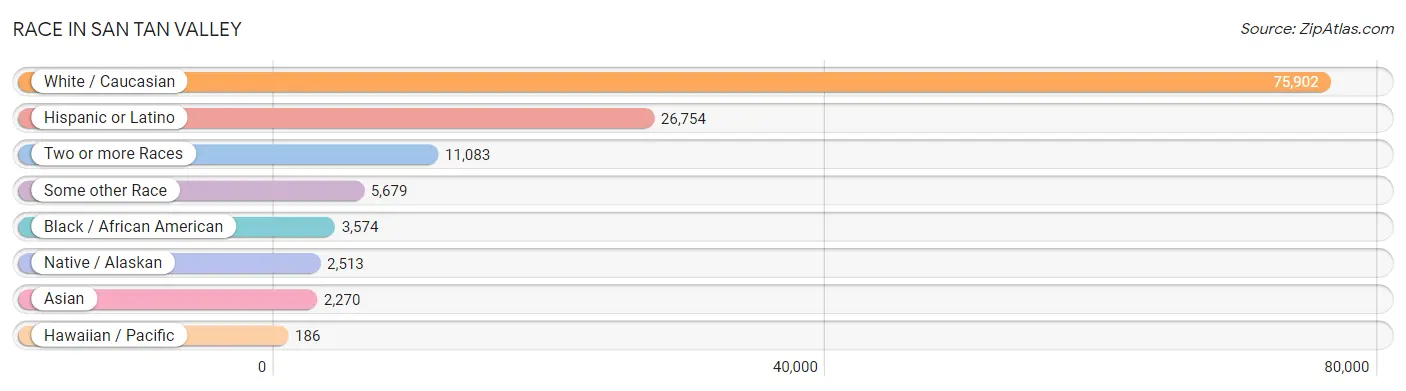
| Race | # Population | % Population |
| Asian | 2,270 | 2.2% |
| Black / African American | 3,574 | 3.5% |
| Hawaiian / Pacific | 186 | 0.2% |
| Hispanic or Latino | 26,754 | 26.4% |
| Native / Alaskan | 2,513 | 2.5% |
| White / Caucasian | 75,902 | 75.0% |
| Two or more Races | 11,083 | 11.0% |
| Some other Race | 5,679 | 5.6% |
| Total | 101,207 | 100.0% |
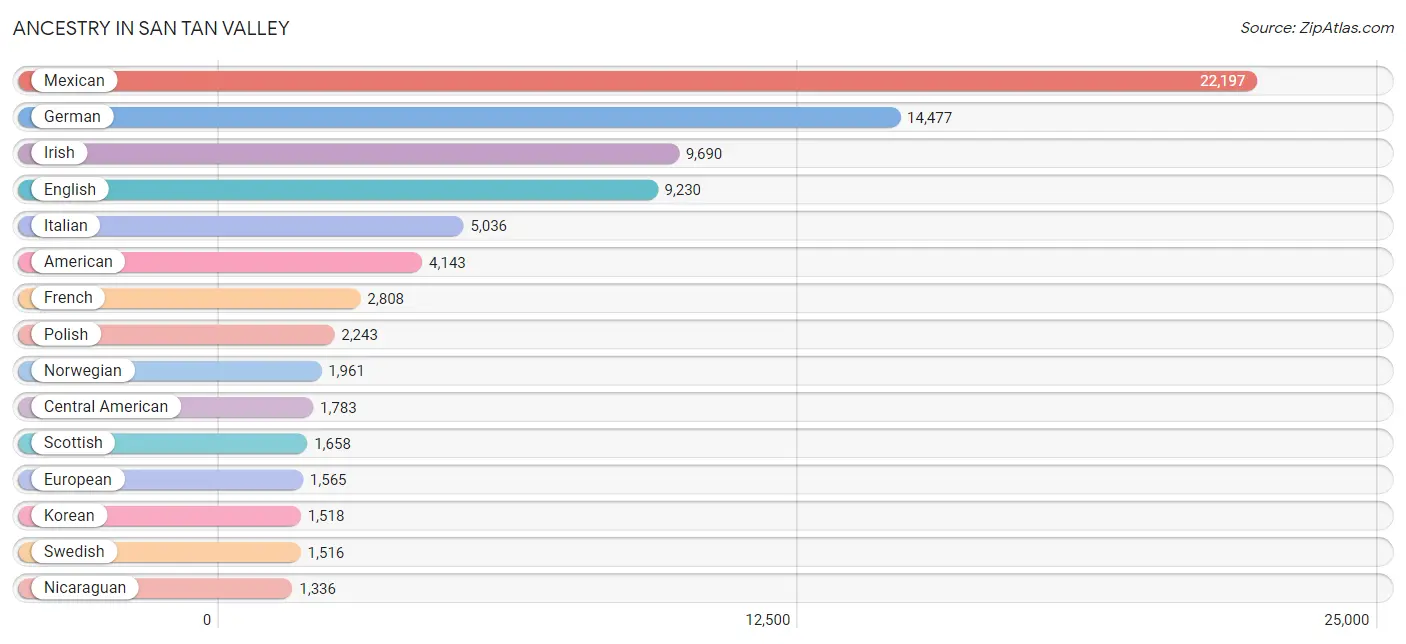
Ancestry in San Tan Valley
The most populous ancestries reported in San Tan Valley are Mexican (22,197 | 21.9%), German (14,477 | 14.3%), Irish (9,690 | 9.6%), English (9,230 | 9.1%), and Italian (5,036 | 5.0%), together accounting for 59.9% of all San Tan Valley residents.
| Ancestry | # Population | % Population |
| Afghan | 105 | 0.1% |
| African | 115 | 0.1% |
| Alsatian | 8 | 0.0% |
| American | 4,143 | 4.1% |
| Apache | 636 | 0.6% |
| Arab | 202 | 0.2% |
| Argentinean | 59 | 0.1% |
| Armenian | 8 | 0.0% |
| Assyrian / Chaldean / Syriac | 15 | 0.0% |
| Austrian | 46 | 0.1% |
| Bangladeshi | 76 | 0.1% |
| Basque | 45 | 0.0% |
| Belgian | 410 | 0.4% |
| Bhutanese | 416 | 0.4% |
| Blackfeet | 73 | 0.1% |
| Bolivian | 11 | 0.0% |
| British | 729 | 0.7% |
| Burmese | 435 | 0.4% |
| Canadian | 91 | 0.1% |
| Central American | 1,783 | 1.8% |
| Central American Indian | 52 | 0.1% |
| Cherokee | 443 | 0.4% |
| Chilean | 194 | 0.2% |
| Chinese | 27 | 0.0% |
| Choctaw | 120 | 0.1% |
| Colombian | 77 | 0.1% |
| Cree | 19 | 0.0% |
| Creek | 67 | 0.1% |
| Croatian | 250 | 0.3% |
| Cuban | 228 | 0.2% |
| Czech | 160 | 0.2% |
| Czechoslovakian | 100 | 0.1% |
| Danish | 887 | 0.9% |
| Dominican | 11 | 0.0% |
| Dutch | 840 | 0.8% |
| Eastern European | 147 | 0.2% |
| Egyptian | 18 | 0.0% |
| English | 9,230 | 9.1% |
| European | 1,565 | 1.5% |
| Finnish | 83 | 0.1% |
| French | 2,808 | 2.8% |
| French American Indian | 5 | 0.0% |
| French Canadian | 591 | 0.6% |
| German | 14,477 | 14.3% |
| Greek | 384 | 0.4% |
| Guamanian / Chamorro | 177 | 0.2% |
| Guatemalan | 103 | 0.1% |
| Honduran | 63 | 0.1% |
| Hopi | 31 | 0.0% |
| Hungarian | 549 | 0.5% |
| Indian (Asian) | 328 | 0.3% |
| Indonesian | 59 | 0.1% |
| Irish | 9,690 | 9.6% |
| Italian | 5,036 | 5.0% |
| Jamaican | 70 | 0.1% |
| Japanese | 34 | 0.0% |
| Jordanian | 53 | 0.1% |
| Kenyan | 11 | 0.0% |
| Kiowa | 5 | 0.0% |
| Korean | 1,518 | 1.5% |
| Laotian | 258 | 0.3% |
| Lebanese | 52 | 0.1% |
| Lithuanian | 152 | 0.2% |
| Malaysian | 171 | 0.2% |
| Mexican | 22,197 | 21.9% |
| Mexican American Indian | 270 | 0.3% |
| Native Hawaiian | 112 | 0.1% |
| Navajo | 941 | 0.9% |
| Nicaraguan | 1,336 | 1.3% |
| Northern European | 354 | 0.4% |
| Norwegian | 1,961 | 1.9% |
| Osage | 51 | 0.1% |
| Pakistani | 106 | 0.1% |
| Palestinian | 43 | 0.0% |
| Panamanian | 81 | 0.1% |
| Peruvian | 15 | 0.0% |
| Pima | 331 | 0.3% |
| Polish | 2,243 | 2.2% |
| Portuguese | 368 | 0.4% |
| Puerto Rican | 912 | 0.9% |
| Russian | 208 | 0.2% |
| Salvadoran | 191 | 0.2% |
| Samoan | 12 | 0.0% |
| Scandinavian | 501 | 0.5% |
| Scotch-Irish | 806 | 0.8% |
| Scottish | 1,658 | 1.6% |
| Slovak | 57 | 0.1% |
| Slovene | 406 | 0.4% |
| South American | 356 | 0.4% |
| Spaniard | 470 | 0.5% |
| Spanish | 262 | 0.3% |
| Sri Lankan | 68 | 0.1% |
| Subsaharan African | 126 | 0.1% |
| Swedish | 1,516 | 1.5% |
| Swiss | 108 | 0.1% |
| Syrian | 18 | 0.0% |
| Thai | 10 | 0.0% |
| Tongan | 28 | 0.0% |
| Ukrainian | 145 | 0.1% |
| Welsh | 679 | 0.7% |
| West Indian | 51 | 0.1% |
| Yaqui | 174 | 0.2% |
| Yugoslavian | 39 | 0.0% | View All 103 Rows |
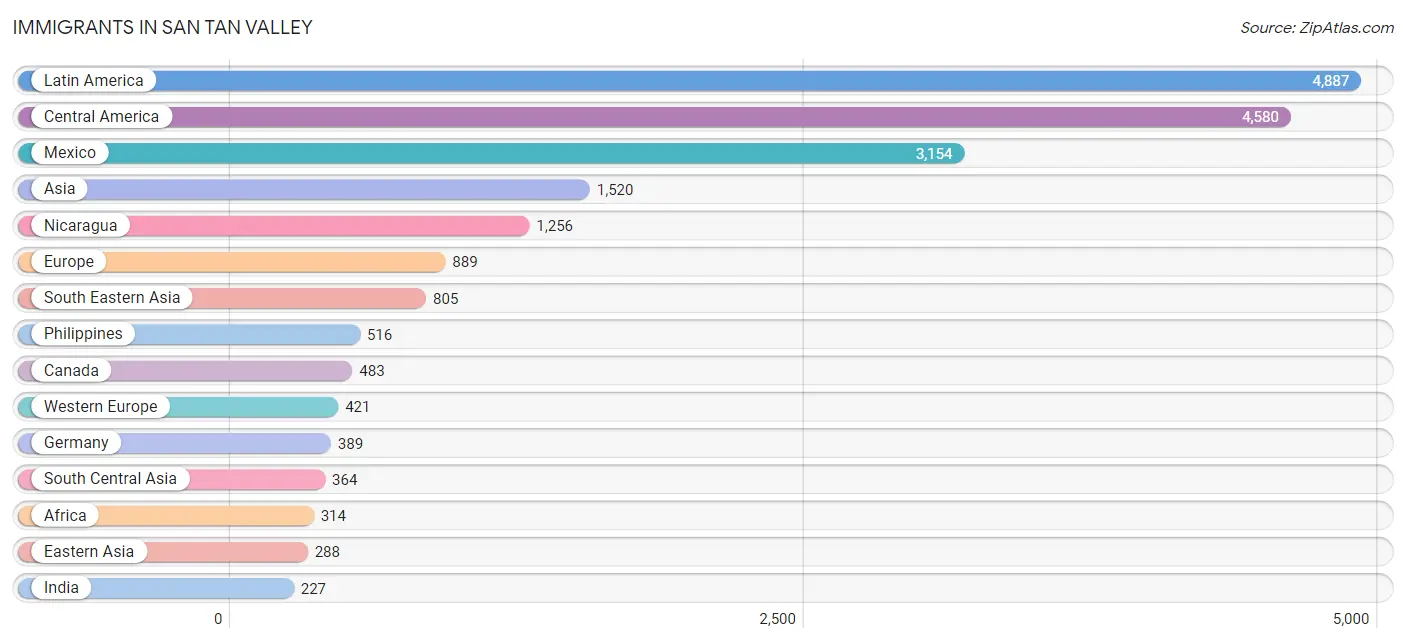
Immigrants in San Tan Valley
The most numerous immigrant groups reported in San Tan Valley came from Latin America (4,887 | 4.8%), Central America (4,580 | 4.5%), Mexico (3,154 | 3.1%), Asia (1,520 | 1.5%), and Nicaragua (1,256 | 1.2%), together accounting for 15.2% of all San Tan Valley residents.
| Immigration Origin | # Population | % Population |
| Afghanistan | 91 | 0.1% |
| Africa | 314 | 0.3% |
| Argentina | 30 | 0.0% |
| Asia | 1,520 | 1.5% |
| Austria | 15 | 0.0% |
| Bolivia | 11 | 0.0% |
| Brazil | 46 | 0.1% |
| Canada | 483 | 0.5% |
| Caribbean | 96 | 0.1% |
| Central America | 4,580 | 4.5% |
| Chile | 49 | 0.1% |
| China | 17 | 0.0% |
| Colombia | 33 | 0.0% |
| Congo | 1 | 0.0% |
| Cuba | 44 | 0.0% |
| Dominica | 42 | 0.0% |
| Dominican Republic | 10 | 0.0% |
| Eastern Africa | 107 | 0.1% |
| Eastern Asia | 288 | 0.3% |
| Eastern Europe | 147 | 0.2% |
| Ecuador | 19 | 0.0% |
| Egypt | 7 | 0.0% |
| El Salvador | 110 | 0.1% |
| England | 80 | 0.1% |
| Europe | 889 | 0.9% |
| Fiji | 10 | 0.0% |
| Germany | 389 | 0.4% |
| Guatemala | 20 | 0.0% |
| Honduras | 40 | 0.0% |
| Hungary | 43 | 0.0% |
| India | 227 | 0.2% |
| Indonesia | 56 | 0.1% |
| Iraq | 45 | 0.0% |
| Italy | 43 | 0.0% |
| Japan | 53 | 0.1% |
| Jordan | 18 | 0.0% |
| Kazakhstan | 17 | 0.0% |
| Kenya | 107 | 0.1% |
| Korea | 218 | 0.2% |
| Laos | 73 | 0.1% |
| Latin America | 4,887 | 4.8% |
| Mexico | 3,154 | 3.1% |
| Middle Africa | 1 | 0.0% |
| Netherlands | 17 | 0.0% |
| Nicaragua | 1,256 | 1.2% |
| Nigeria | 181 | 0.2% |
| Northern Africa | 25 | 0.0% |
| Northern Europe | 160 | 0.2% |
| Oceania | 10 | 0.0% |
| Pakistan | 29 | 0.0% |
| Peru | 23 | 0.0% |
| Philippines | 516 | 0.5% |
| Poland | 55 | 0.1% |
| Portugal | 59 | 0.1% |
| Russia | 28 | 0.0% |
| South America | 211 | 0.2% |
| South Central Asia | 364 | 0.4% |
| South Eastern Asia | 805 | 0.8% |
| Southern Europe | 161 | 0.2% |
| Spain | 59 | 0.1% |
| Sweden | 36 | 0.0% |
| Thailand | 102 | 0.1% |
| Ukraine | 21 | 0.0% |
| Vietnam | 58 | 0.1% |
| Western Africa | 181 | 0.2% |
| Western Asia | 63 | 0.1% |
| Western Europe | 421 | 0.4% | View All 67 Rows |
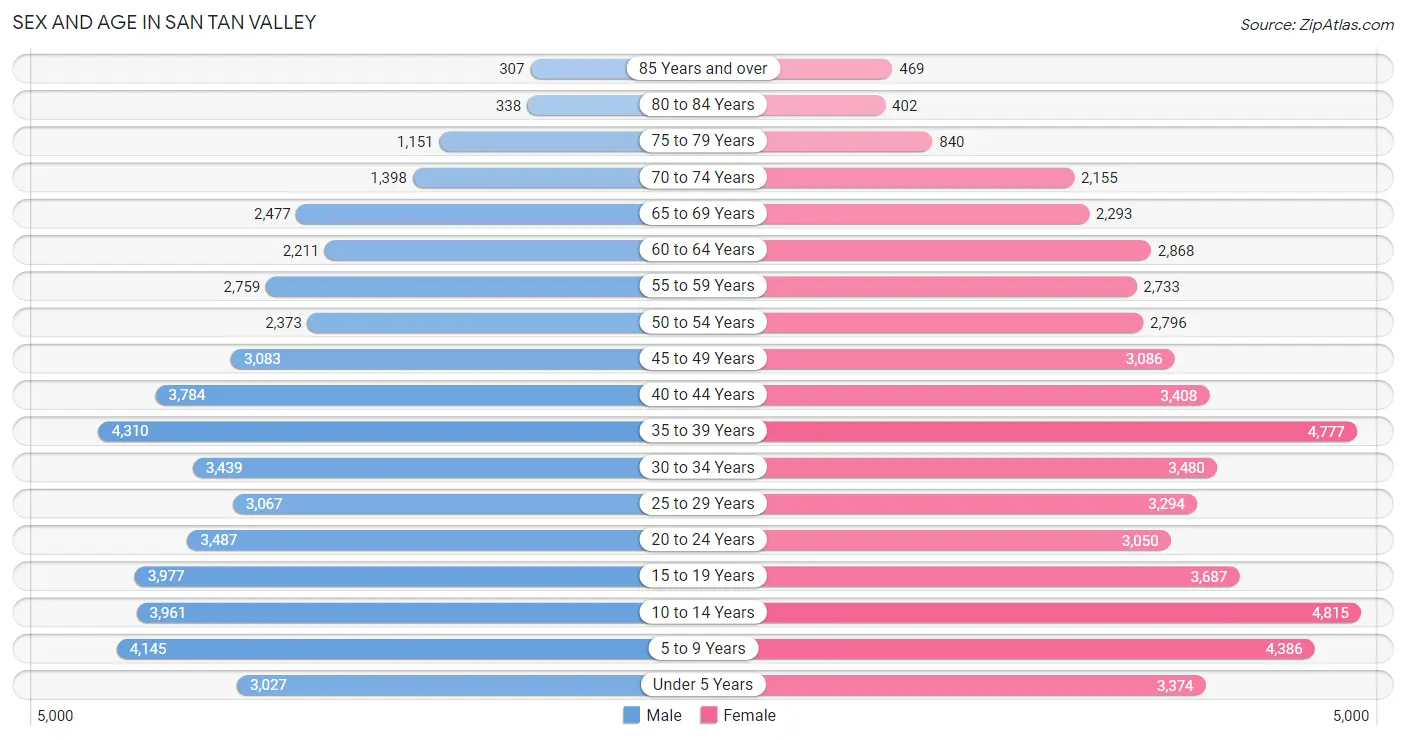
Sex and Age in San Tan Valley
Sex and Age in San Tan Valley
The most populous age groups in San Tan Valley are 35 to 39 Years (4,310 | 8.7%) for men and 10 to 14 Years (4,815 | 9.3%) for women.
| Age Bracket | Male | Female |
| Under 5 Years | 3,027 (6.1%) | 3,374 (6.5%) |
| 5 to 9 Years | 4,145 (8.4%) | 4,386 (8.5%) |
| 10 to 14 Years | 3,961 (8.0%) | 4,815 (9.3%) |
| 15 to 19 Years | 3,977 (8.1%) | 3,687 (7.1%) |
| 20 to 24 Years | 3,487 (7.1%) | 3,050 (5.9%) |
| 25 to 29 Years | 3,067 (6.2%) | 3,294 (6.4%) |
| 30 to 34 Years | 3,439 (7.0%) | 3,480 (6.7%) |
| 35 to 39 Years | 4,310 (8.7%) | 4,777 (9.2%) |
| 40 to 44 Years | 3,784 (7.7%) | 3,408 (6.6%) |
| 45 to 49 Years | 3,083 (6.2%) | 3,086 (5.9%) |
| 50 to 54 Years | 2,373 (4.8%) | 2,796 (5.4%) |
| 55 to 59 Years | 2,759 (5.6%) | 2,733 (5.3%) |
| 60 to 64 Years | 2,211 (4.5%) | 2,868 (5.5%) |
| 65 to 69 Years | 2,477 (5.0%) | 2,293 (4.4%) |
| 70 to 74 Years | 1,398 (2.8%) | 2,155 (4.2%) |
| 75 to 79 Years | 1,151 (2.3%) | 840 (1.6%) |
| 80 to 84 Years | 338 (0.7%) | 402 (0.8%) |
| 85 Years and over | 307 (0.6%) | 469 (0.9%) |
| Total | 49,294 (100.0%) | 51,913 (100.0%) |
Families and Households in San Tan Valley
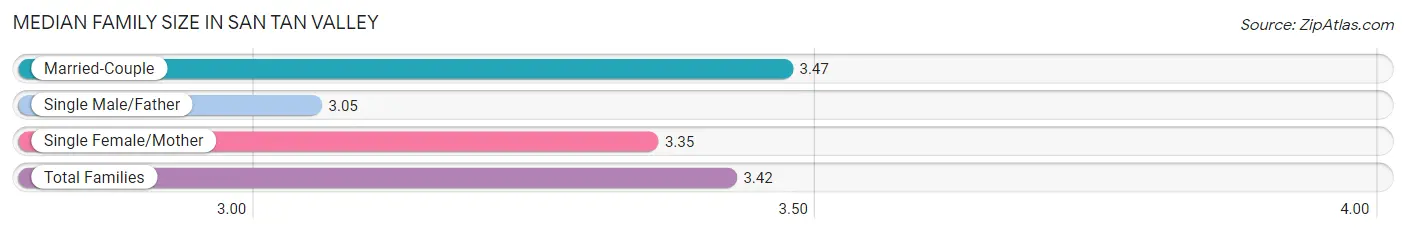
Median Family Size in San Tan Valley
The median family size in San Tan Valley is 3.42 persons per family, with married-couple families (20,810 | 78.9%) accounting for the largest median family size of 3.47 persons per family. On the other hand, single male/father families (1,758 | 6.7%) represent the smallest median family size with 3.05 persons per family.
| Family Type | # Families | Family Size |
| Married-Couple | 20,810 (78.9%) | 3.47 |
| Single Male/Father | 1,758 (6.7%) | 3.05 |
| Single Female/Mother | 3,789 (14.4%) | 3.35 |
| Total Families | 26,357 (100.0%) | 3.42 |
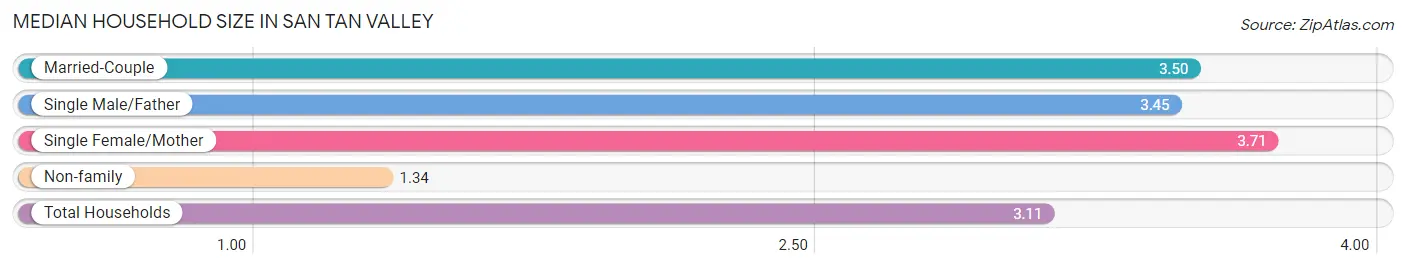
Median Household Size in San Tan Valley
The median household size in San Tan Valley is 3.11 persons per household, with single female/mother households (3,789 | 11.7%) accounting for the largest median household size of 3.71 persons per household. non-family households (6,173 | 19.0%) represent the smallest median household size with 1.34 persons per household.
| Household Type | # Households | Household Size |
| Married-Couple | 20,810 (64.0%) | 3.50 |
| Single Male/Father | 1,758 (5.4%) | 3.45 |
| Single Female/Mother | 3,789 (11.7%) | 3.71 |
| Non-family | 6,173 (19.0%) | 1.34 |
| Total Households | 32,530 (100.0%) | 3.11 |
Household Size by Marriage Status in San Tan Valley
Out of a total of 32,530 households in San Tan Valley, 26,357 (81.0%) are family households, while 6,173 (19.0%) are nonfamily households. The most numerous type of family households are 2-person households, comprising 9,057, and the most common type of nonfamily households are 1-person households, comprising 4,303.
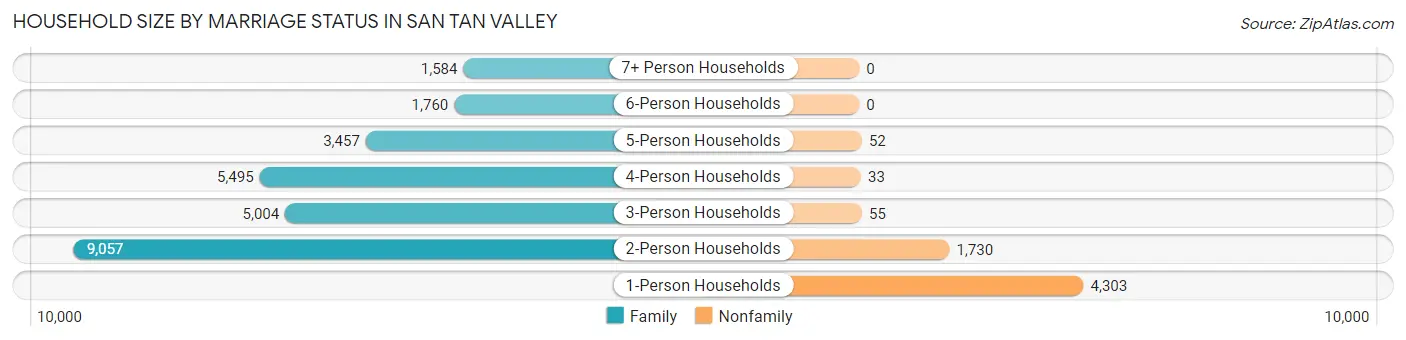
| Household Size | Family Households | Nonfamily Households |
| 1-Person Households | - | 4,303 (13.2%) |
| 2-Person Households | 9,057 (27.8%) | 1,730 (5.3%) |
| 3-Person Households | 5,004 (15.4%) | 55 (0.2%) |
| 4-Person Households | 5,495 (16.9%) | 33 (0.1%) |
| 5-Person Households | 3,457 (10.6%) | 52 (0.2%) |
| 6-Person Households | 1,760 (5.4%) | 0 (0.0%) |
| 7+ Person Households | 1,584 (4.9%) | 0 (0.0%) |
| Total | 26,357 (81.0%) | 6,173 (19.0%) |
Female Fertility in San Tan Valley
Fertility by Age in San Tan Valley
Average fertility rate in San Tan Valley is 60.0 births per 1,000 women. Women in the age bracket of 20 to 34 years have the highest fertility rate with 123.0 births per 1,000 women. Women in the age bracket of 20 to 34 years acount for 79.4% of all women with births.
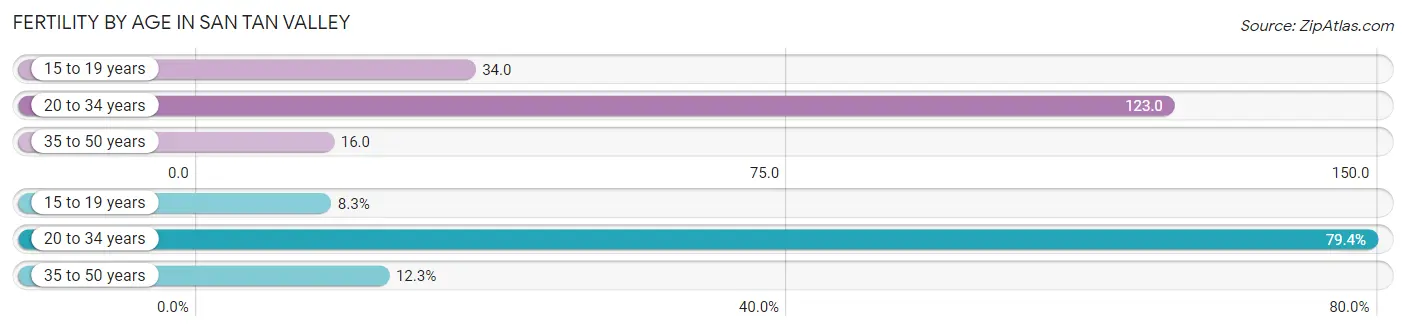
| Age Bracket | Women with Births | Births / 1,000 Women |
| 15 to 19 years | 127 (8.3%) | 34.0 |
| 20 to 34 years | 1,209 (79.4%) | 123.0 |
| 35 to 50 years | 187 (12.3%) | 16.0 |
| Total | 1,523 (100.0%) | 60.0 |
Fertility by Age by Marriage Status in San Tan Valley
73.7% of women with births (1,523) in San Tan Valley are married. The highest percentage of unmarried women with births falls into 15 to 19 years age bracket with 100.0% of them unmarried at the time of birth, while the lowest percentage of unmarried women with births belong to 35 to 50 years age bracket with 4.8% of them unmarried.
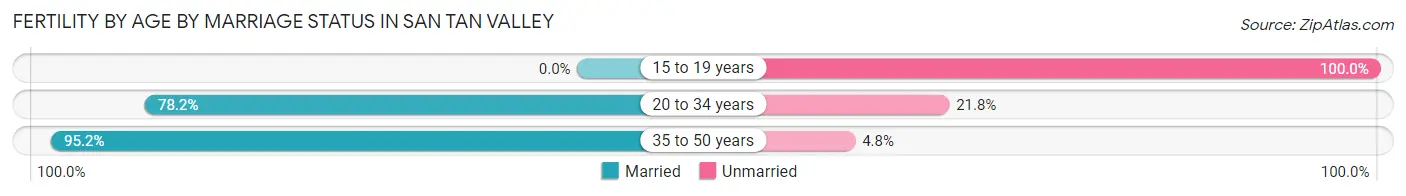
| Age Bracket | Married | Unmarried |
| 15 to 19 years | 0 (0.0%) | 127 (100.0%) |
| 20 to 34 years | 945 (78.2%) | 264 (21.8%) |
| 35 to 50 years | 178 (95.2%) | 9 (4.8%) |
| Total | 1,122 (73.7%) | 401 (26.3%) |
Fertility by Education in San Tan Valley
Average fertility rate in San Tan Valley is 60.0 births per 1,000 women. Women with the education attainment of bachelor's degree have the highest fertility rate of 103.0 births per 1,000 women, while women with the education attainment of high school diploma have the lowest fertility at 9.0 births per 1,000 women. Women with the education attainment of college or associate's degree represent 62.9% of all women with births.
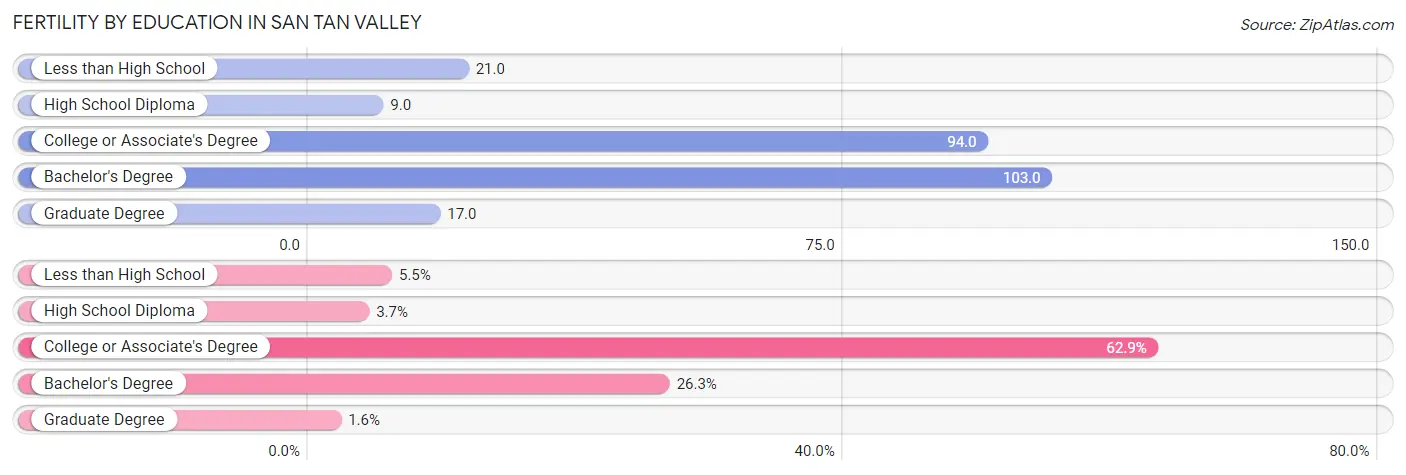
| Educational Attainment | Women with Births | Births / 1,000 Women |
| Less than High School | 83 (5.4%) | 21.0 |
| High School Diploma | 57 (3.7%) | 9.0 |
| College or Associate's Degree | 958 (62.9%) | 94.0 |
| Bachelor's Degree | 400 (26.3%) | 103.0 |
| Graduate Degree | 25 (1.6%) | 17.0 |
| Total | 1,523 (100.0%) | 60.0 |
Fertility by Education by Marriage Status in San Tan Valley
26.3% of women with births in San Tan Valley are unmarried. Women with the educational attainment of graduate degree are most likely to be married with 100.0% of them married at childbirth, while women with the educational attainment of less than high school are least likely to be married with 73.5% of them unmarried at childbirth.
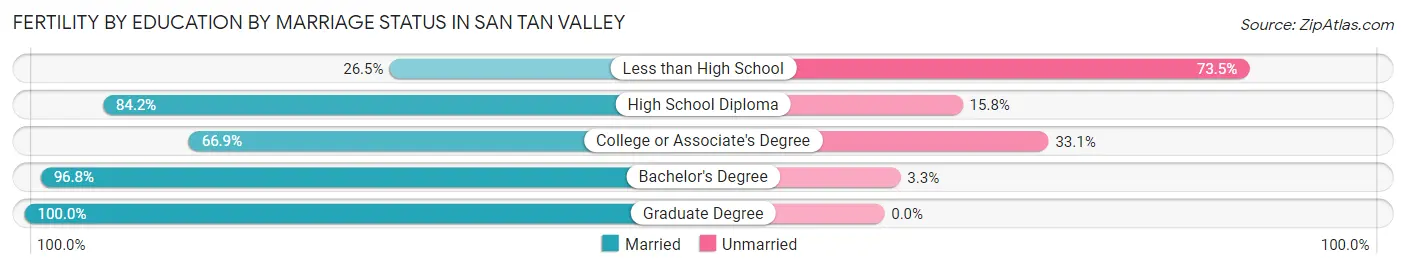
| Educational Attainment | Married | Unmarried |
| Less than High School | 22 (26.5%) | 61 (73.5%) |
| High School Diploma | 48 (84.2%) | 9 (15.8%) |
| College or Associate's Degree | 641 (66.9%) | 317 (33.1%) |
| Bachelor's Degree | 387 (96.8%) | 13 (3.3%) |
| Graduate Degree | 25 (100.0%) | 0 (0.0%) |
| Total | 1,122 (73.7%) | 401 (26.3%) |
Employment Characteristics in San Tan Valley
Employment by Class of Employer in San Tan Valley
Among the 46,868 employed individuals in San Tan Valley, private company employees (34,729 | 74.1%), local government employees (2,866 | 6.1%), and not-for-profit organizations (2,519 | 5.4%) make up the most common classes of employment.
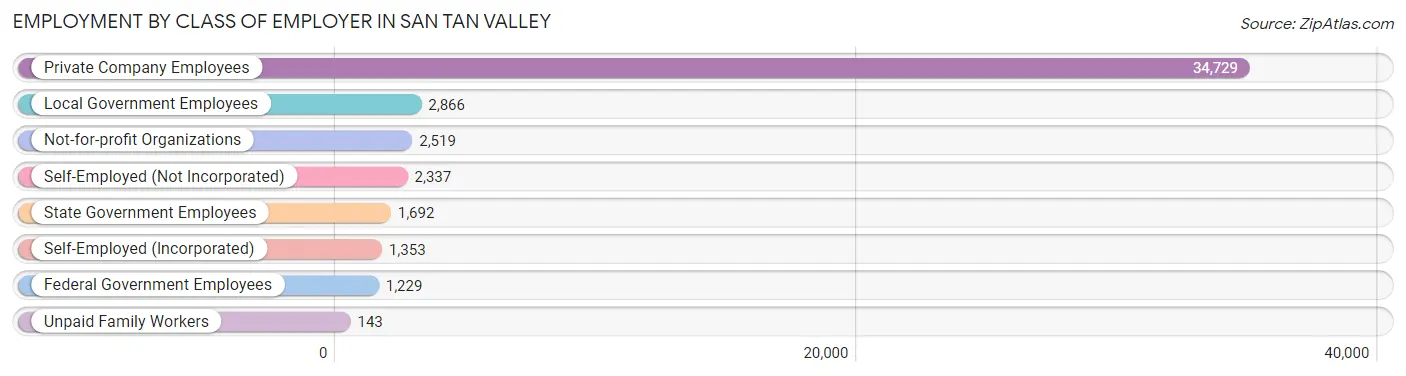
| Employer Class | # Employees | % Employees |
| Private Company Employees | 34,729 | 74.1% |
| Self-Employed (Incorporated) | 1,353 | 2.9% |
| Self-Employed (Not Incorporated) | 2,337 | 5.0% |
| Not-for-profit Organizations | 2,519 | 5.4% |
| Local Government Employees | 2,866 | 6.1% |
| State Government Employees | 1,692 | 3.6% |
| Federal Government Employees | 1,229 | 2.6% |
| Unpaid Family Workers | 143 | 0.3% |
| Total | 46,868 | 100.0% |
Employment Status by Age in San Tan Valley
According to the labor force statistics for San Tan Valley, out of the total population over 16 years of age (75,695), 66.8% or 50,564 individuals are in the labor force, with 4.5% or 2,275 of them unemployed. The age group with the highest labor force participation rate is 45 to 54 years, with 84.1% or 9,535 individuals in the labor force. Within the labor force, the 16 to 19 years age range has the highest percentage of unemployed individuals, with 15.7% or 377 of them being unemployed.
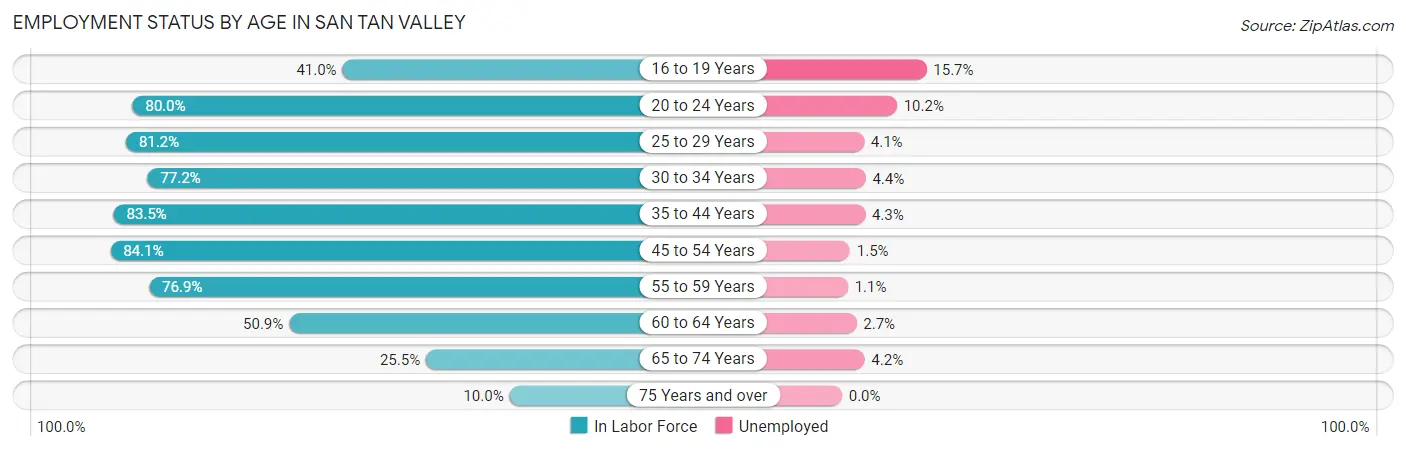
| Age Bracket | In Labor Force | Unemployed |
| 16 to 19 Years | 2,403 (41.0%) | 377 (15.7%) |
| 20 to 24 Years | 5,230 (80.0%) | 533 (10.2%) |
| 25 to 29 Years | 5,165 (81.2%) | 212 (4.1%) |
| 30 to 34 Years | 5,341 (77.2%) | 235 (4.4%) |
| 35 to 44 Years | 13,593 (83.5%) | 584 (4.3%) |
| 45 to 54 Years | 9,535 (84.1%) | 143 (1.5%) |
| 55 to 59 Years | 4,223 (76.9%) | 46 (1.1%) |
| 60 to 64 Years | 2,585 (50.9%) | 70 (2.7%) |
| 65 to 74 Years | 2,122 (25.5%) | 89 (4.2%) |
| 75 Years and over | 351 (10.0%) | 0 (0.0%) |
| Total | 50,564 (66.8%) | 2,275 (4.5%) |
Employment Status by Educational Attainment in San Tan Valley
According to labor force statistics for San Tan Valley, 78.6% of individuals (40,454) out of the total population between 25 and 64 years of age (51,468) are in the labor force, with 3.2% or 1,295 of them being unemployed. The group with the highest labor force participation rate are those with the educational attainment of bachelor's degree or higher, with 82.4% or 9,765 individuals in the labor force. Within the labor force, individuals with high school diploma education have the highest percentage of unemployment, with 3.8% or 409 of them being unemployed.
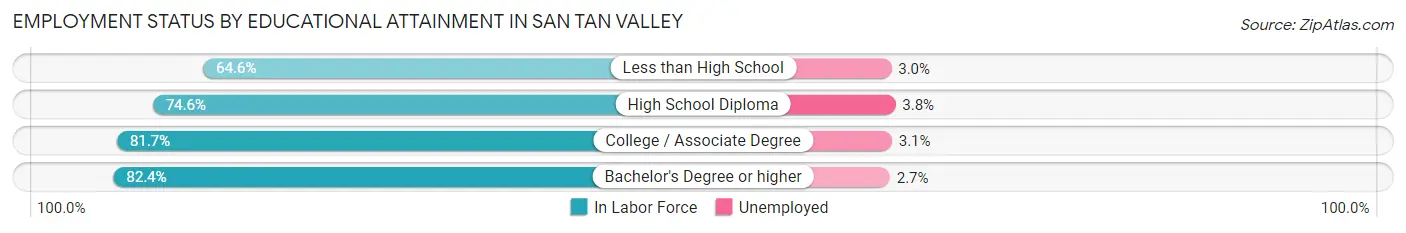
| Educational Attainment | In Labor Force | Unemployed |
| Less than High School | 2,526 (64.6%) | 117 (3.0%) |
| High School Diploma | 10,754 (74.6%) | 548 (3.8%) |
| College / Associate Degree | 17,395 (81.7%) | 660 (3.1%) |
| Bachelor's Degree or higher | 9,765 (82.4%) | 320 (2.7%) |
| Total | 40,454 (78.6%) | 1,647 (3.2%) |
Employment Occupations by Sex in San Tan Valley
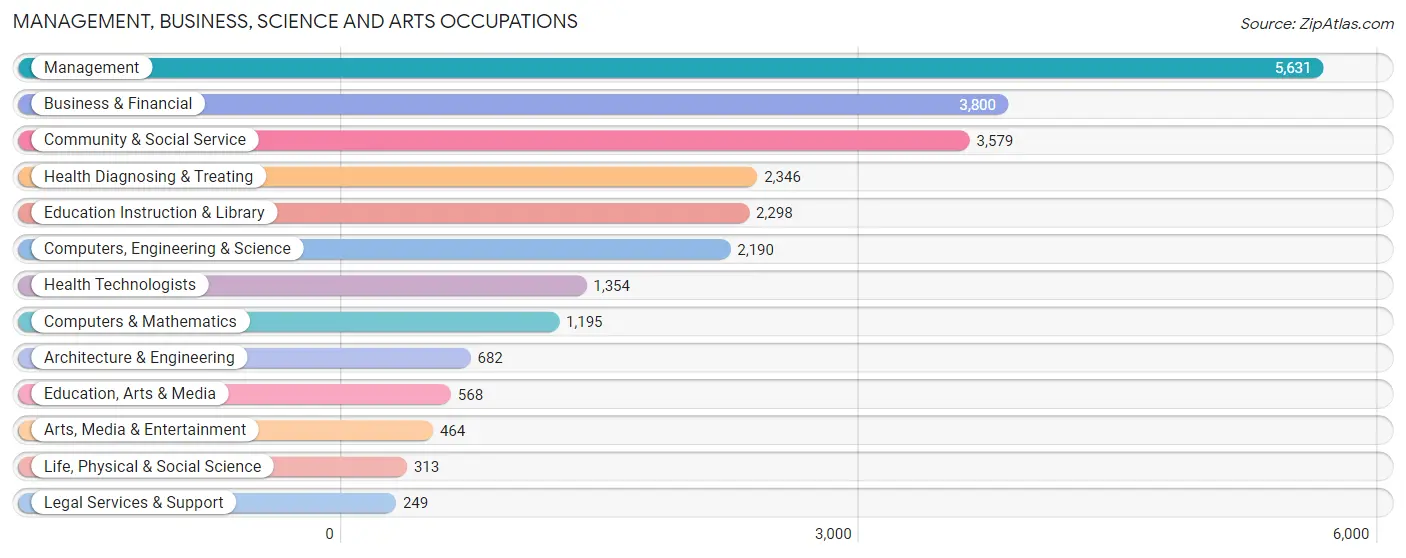
Management, Business, Science and Arts Occupations
The most common Management, Business, Science and Arts occupations in San Tan Valley are Management (5,631 | 11.7%), Business & Financial (3,800 | 7.9%), Community & Social Service (3,579 | 7.4%), Health Diagnosing & Treating (2,346 | 4.9%), and Education Instruction & Library (2,298 | 4.8%).
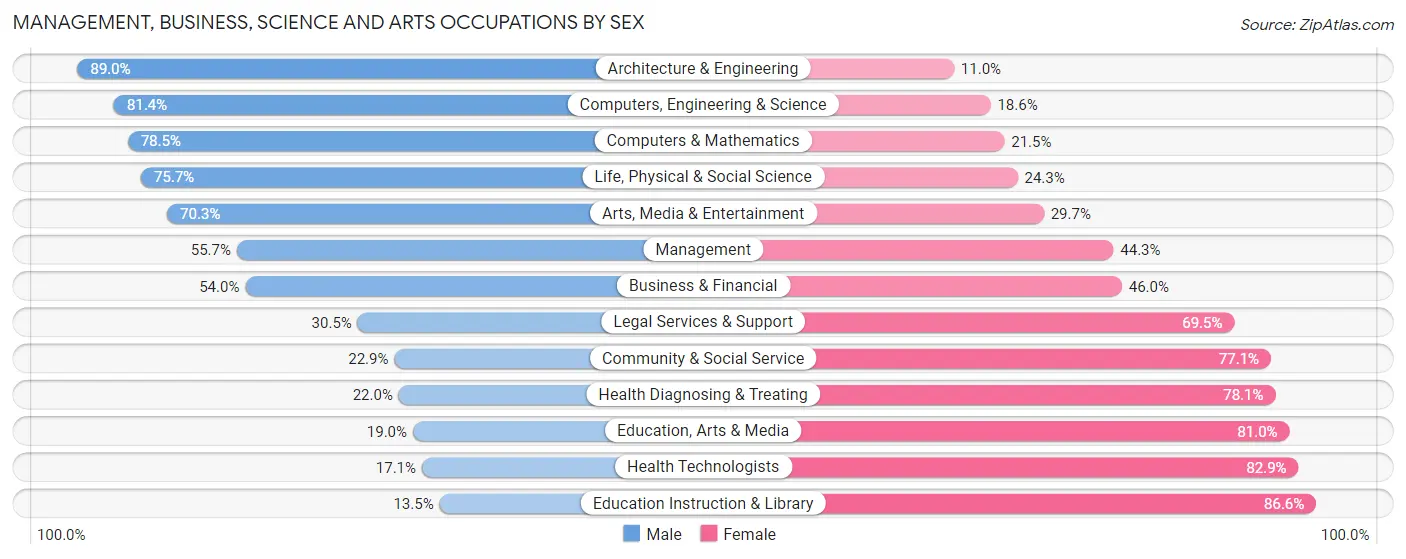
Management, Business, Science and Arts Occupations by Sex
Within the Management, Business, Science and Arts occupations in San Tan Valley, the most male-oriented occupations are Architecture & Engineering (89.0%), Computers, Engineering & Science (81.4%), and Computers & Mathematics (78.5%), while the most female-oriented occupations are Education Instruction & Library (86.6%), Health Technologists (82.9%), and Education, Arts & Media (81.0%).
| Occupation | Male | Female |
| Management | 3,139 (55.7%) | 2,492 (44.3%) |
| Business & Financial | 2,051 (54.0%) | 1,749 (46.0%) |
| Computers, Engineering & Science | 1,782 (81.4%) | 408 (18.6%) |
| Computers & Mathematics | 938 (78.5%) | 257 (21.5%) |
| Architecture & Engineering | 607 (89.0%) | 75 (11.0%) |
| Life, Physical & Social Science | 237 (75.7%) | 76 (24.3%) |
| Community & Social Service | 819 (22.9%) | 2,760 (77.1%) |
| Education, Arts & Media | 108 (19.0%) | 460 (81.0%) |
| Legal Services & Support | 76 (30.5%) | 173 (69.5%) |
| Education Instruction & Library | 309 (13.5%) | 1,989 (86.6%) |
| Arts, Media & Entertainment | 326 (70.3%) | 138 (29.7%) |
| Health Diagnosing & Treating | 515 (22.0%) | 1,831 (78.0%) |
| Health Technologists | 232 (17.1%) | 1,122 (82.9%) |
| Total (Category) | 8,306 (47.3%) | 9,240 (52.7%) |
| Total (Overall) | 25,624 (53.2%) | 22,517 (46.8%) |
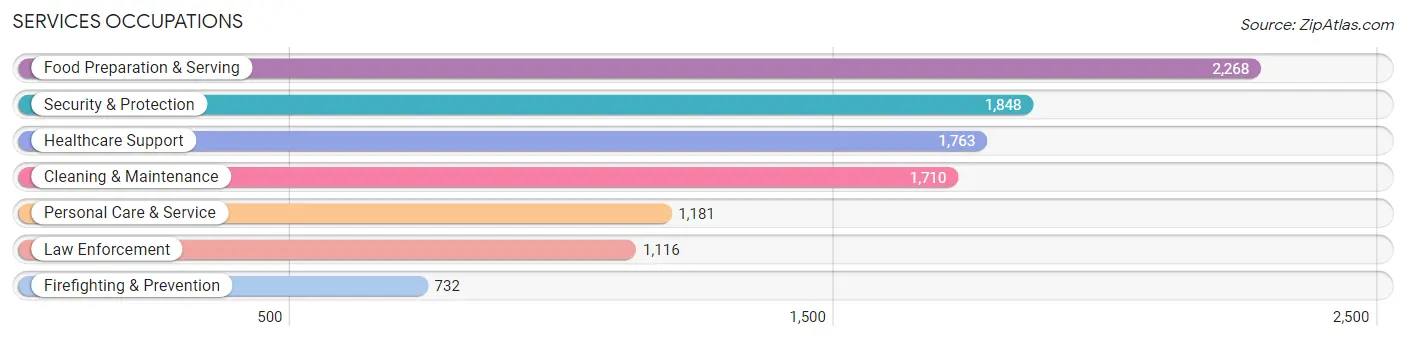
Services Occupations
The most common Services occupations in San Tan Valley are Food Preparation & Serving (2,268 | 4.7%), Security & Protection (1,848 | 3.8%), Healthcare Support (1,763 | 3.7%), Cleaning & Maintenance (1,710 | 3.5%), and Personal Care & Service (1,181 | 2.5%).
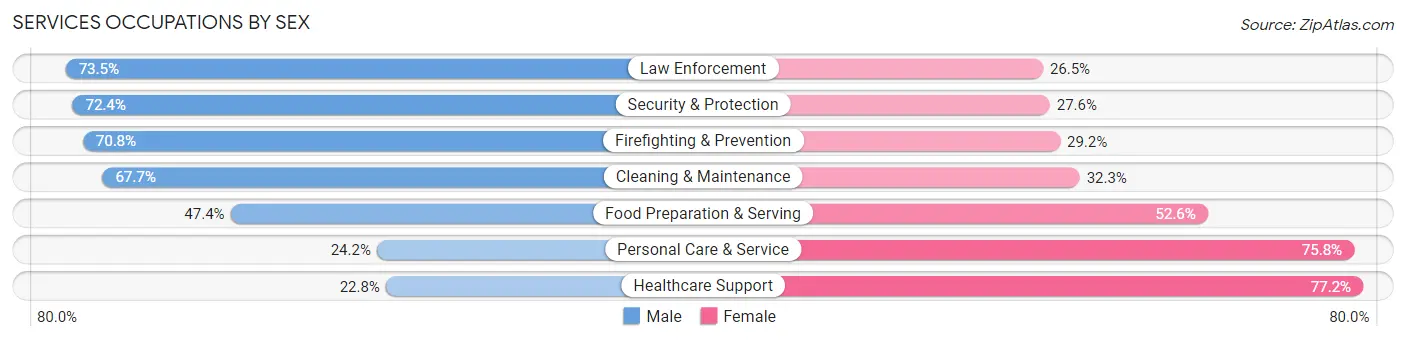
Services Occupations by Sex
Within the Services occupations in San Tan Valley, the most male-oriented occupations are Law Enforcement (73.5%), Security & Protection (72.4%), and Firefighting & Prevention (70.8%), while the most female-oriented occupations are Healthcare Support (77.2%), Personal Care & Service (75.8%), and Food Preparation & Serving (52.6%).
| Occupation | Male | Female |
| Healthcare Support | 402 (22.8%) | 1,361 (77.2%) |
| Security & Protection | 1,338 (72.4%) | 510 (27.6%) |
| Firefighting & Prevention | 518 (70.8%) | 214 (29.2%) |
| Law Enforcement | 820 (73.5%) | 296 (26.5%) |
| Food Preparation & Serving | 1,075 (47.4%) | 1,193 (52.6%) |
| Cleaning & Maintenance | 1,157 (67.7%) | 553 (32.3%) |
| Personal Care & Service | 286 (24.2%) | 895 (75.8%) |
| Total (Category) | 4,258 (48.5%) | 4,512 (51.4%) |
| Total (Overall) | 25,624 (53.2%) | 22,517 (46.8%) |
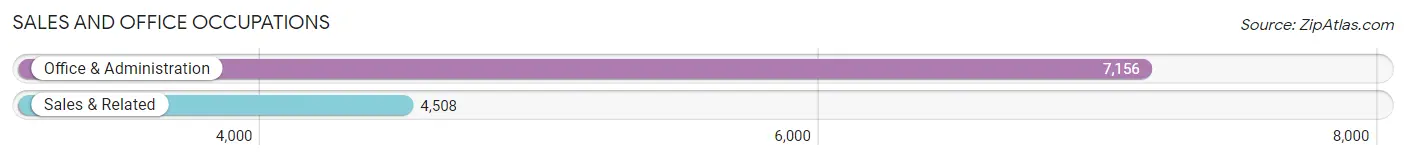
Sales and Office Occupations
The most common Sales and Office occupations in San Tan Valley are Office & Administration (7,156 | 14.9%), and Sales & Related (4,508 | 9.4%).
Sales and Office Occupations by Sex
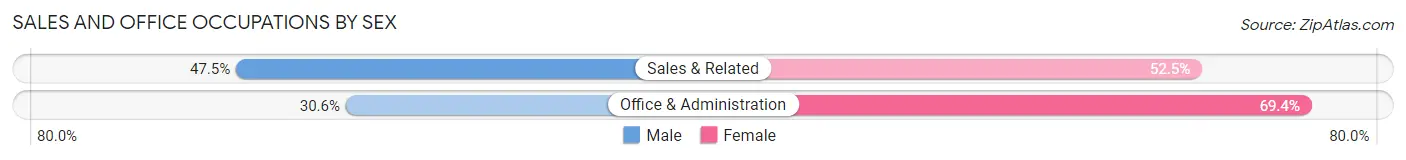
| Occupation | Male | Female |
| Sales & Related | 2,140 (47.5%) | 2,368 (52.5%) |
| Office & Administration | 2,189 (30.6%) | 4,967 (69.4%) |
| Total (Category) | 4,329 (37.1%) | 7,335 (62.9%) |
| Total (Overall) | 25,624 (53.2%) | 22,517 (46.8%) |
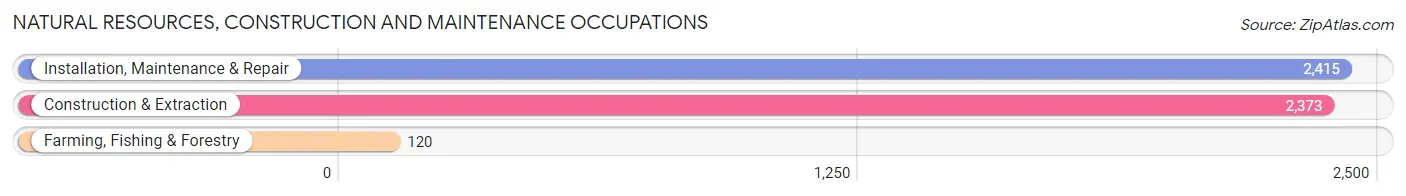
Natural Resources, Construction and Maintenance Occupations
The most common Natural Resources, Construction and Maintenance occupations in San Tan Valley are Installation, Maintenance & Repair (2,415 | 5.0%), Construction & Extraction (2,373 | 4.9%), and Farming, Fishing & Forestry (120 | 0.3%).
Natural Resources, Construction and Maintenance Occupations by Sex
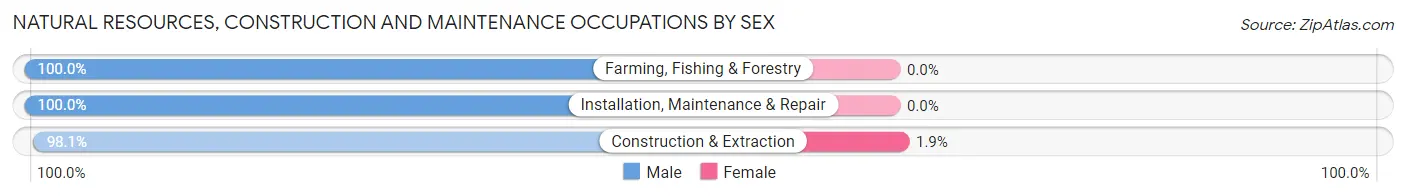
| Occupation | Male | Female |
| Farming, Fishing & Forestry | 120 (100.0%) | 0 (0.0%) |
| Construction & Extraction | 2,328 (98.1%) | 45 (1.9%) |
| Installation, Maintenance & Repair | 2,415 (100.0%) | 0 (0.0%) |
| Total (Category) | 4,863 (99.1%) | 45 (0.9%) |
| Total (Overall) | 25,624 (53.2%) | 22,517 (46.8%) |
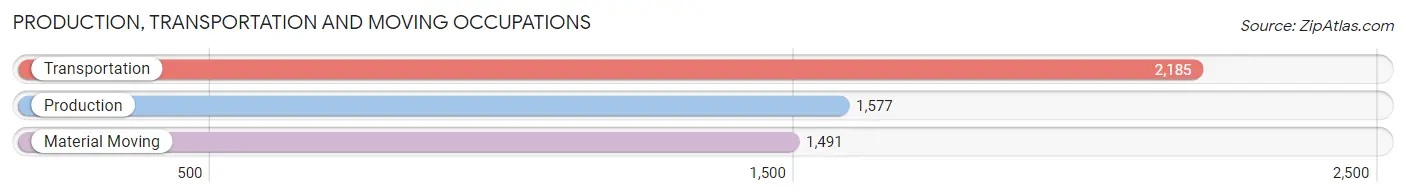
Production, Transportation and Moving Occupations
The most common Production, Transportation and Moving occupations in San Tan Valley are Transportation (2,185 | 4.5%), Production (1,577 | 3.3%), and Material Moving (1,491 | 3.1%).
Production, Transportation and Moving Occupations by Sex
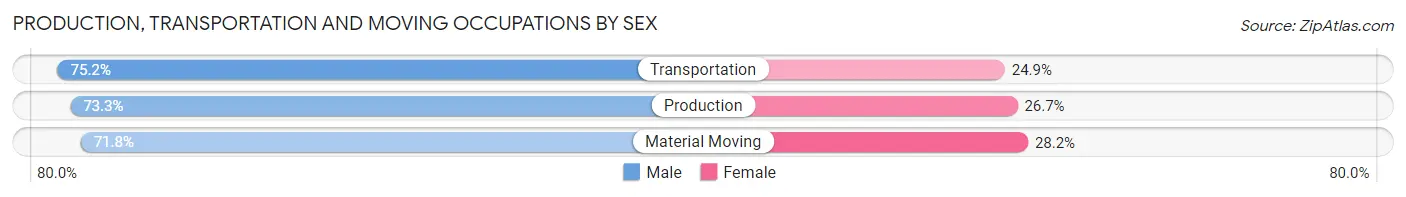
| Occupation | Male | Female |
| Production | 1,156 (73.3%) | 421 (26.7%) |
| Transportation | 1,642 (75.1%) | 543 (24.8%) |
| Material Moving | 1,070 (71.8%) | 421 (28.2%) |
| Total (Category) | 3,868 (73.6%) | 1,385 (26.4%) |
| Total (Overall) | 25,624 (53.2%) | 22,517 (46.8%) |
Employment Industries by Sex in San Tan Valley
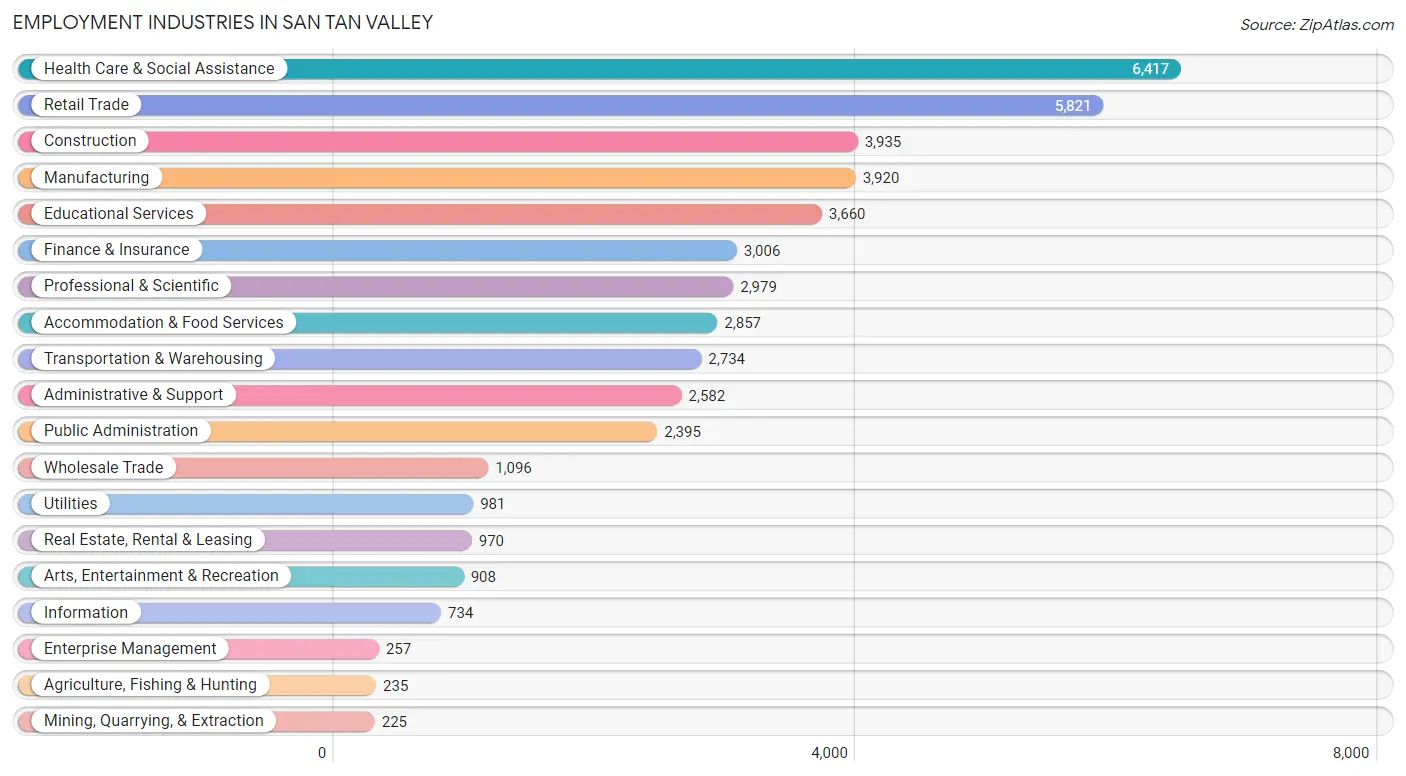
Employment Industries in San Tan Valley
The major employment industries in San Tan Valley include Health Care & Social Assistance (6,417 | 13.3%), Retail Trade (5,821 | 12.1%), Construction (3,935 | 8.2%), Manufacturing (3,920 | 8.1%), and Educational Services (3,660 | 7.6%).
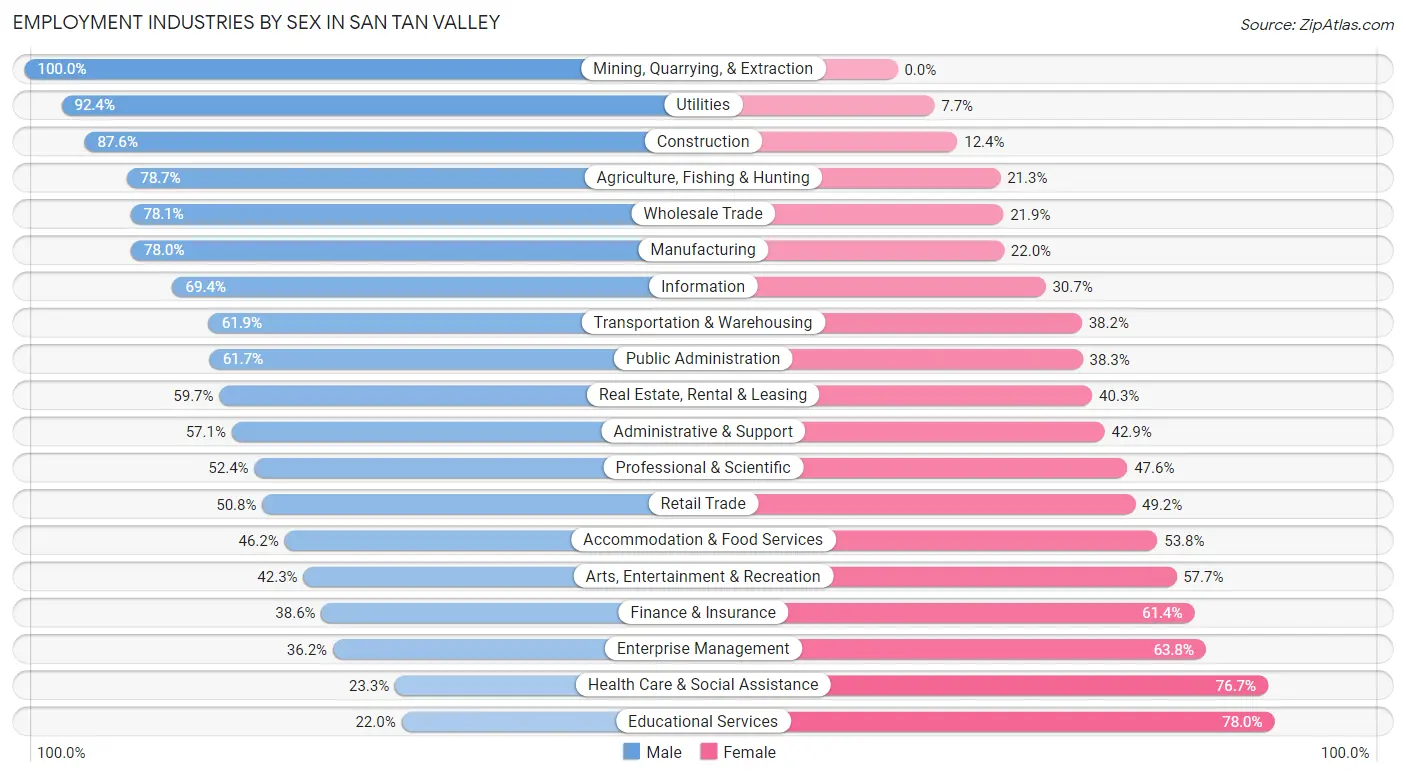
Employment Industries by Sex in San Tan Valley
The San Tan Valley industries that see more men than women are Mining, Quarrying, & Extraction (100.0%), Utilities (92.3%), and Construction (87.6%), whereas the industries that tend to have a higher number of women are Educational Services (78.0%), Health Care & Social Assistance (76.7%), and Enterprise Management (63.8%).
| Industry | Male | Female |
| Agriculture, Fishing & Hunting | 185 (78.7%) | 50 (21.3%) |
| Mining, Quarrying, & Extraction | 225 (100.0%) | 0 (0.0%) |
| Construction | 3,447 (87.6%) | 488 (12.4%) |
| Manufacturing | 3,056 (78.0%) | 864 (22.0%) |
| Wholesale Trade | 856 (78.1%) | 240 (21.9%) |
| Retail Trade | 2,957 (50.8%) | 2,864 (49.2%) |
| Transportation & Warehousing | 1,691 (61.9%) | 1,043 (38.2%) |
| Utilities | 906 (92.3%) | 75 (7.6%) |
| Information | 509 (69.4%) | 225 (30.6%) |
| Finance & Insurance | 1,159 (38.6%) | 1,847 (61.4%) |
| Real Estate, Rental & Leasing | 579 (59.7%) | 391 (40.3%) |
| Professional & Scientific | 1,562 (52.4%) | 1,417 (47.6%) |
| Enterprise Management | 93 (36.2%) | 164 (63.8%) |
| Administrative & Support | 1,475 (57.1%) | 1,107 (42.9%) |
| Educational Services | 805 (22.0%) | 2,855 (78.0%) |
| Health Care & Social Assistance | 1,497 (23.3%) | 4,920 (76.7%) |
| Arts, Entertainment & Recreation | 384 (42.3%) | 524 (57.7%) |
| Accommodation & Food Services | 1,320 (46.2%) | 1,537 (53.8%) |
| Public Administration | 1,477 (61.7%) | 918 (38.3%) |
| Total | 25,624 (53.2%) | 22,517 (46.8%) |
Education in San Tan Valley
School Enrollment in San Tan Valley
The most common levels of schooling among the 27,754 students in San Tan Valley are elementary school (7,037 | 25.4%), high school (6,707 | 24.2%), and middle school (6,588 | 23.7%).
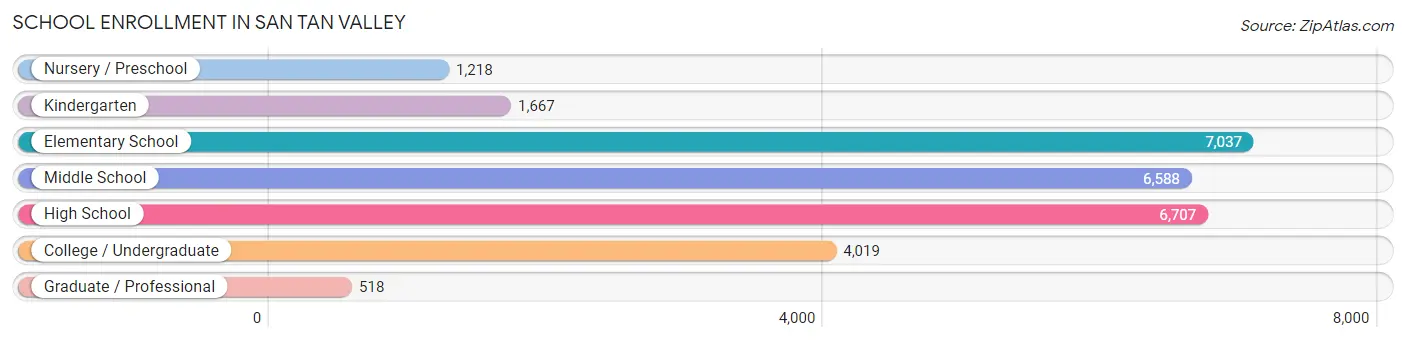
| School Level | # Students | % Students |
| Nursery / Preschool | 1,218 | 4.4% |
| Kindergarten | 1,667 | 6.0% |
| Elementary School | 7,037 | 25.4% |
| Middle School | 6,588 | 23.7% |
| High School | 6,707 | 24.2% |
| College / Undergraduate | 4,019 | 14.5% |
| Graduate / Professional | 518 | 1.9% |
| Total | 27,754 | 100.0% |
School Enrollment by Age by Funding Source in San Tan Valley
Out of a total of 27,754 students who are enrolled in schools in San Tan Valley, 4,968 (17.9%) attend a private institution, while the remaining 22,786 (82.1%) are enrolled in public schools. The age group of 35 years and over has the highest likelihood of being enrolled in private schools, with 362 (41.5% in the age bracket) enrolled. Conversely, the age group of 15 to 17 year olds has the lowest likelihood of being enrolled in a private school, with 4,230 (89.7% in the age bracket) attending a public institution.
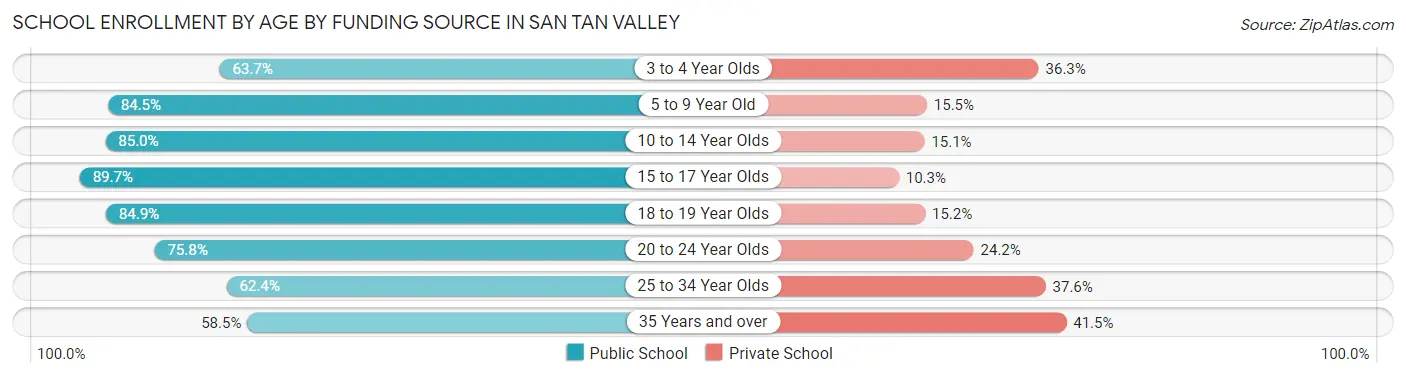
| Age Bracket | Public School | Private School |
| 3 to 4 Year Olds | 677 (63.7%) | 386 (36.3%) |
| 5 to 9 Year Old | 6,769 (84.5%) | 1,242 (15.5%) |
| 10 to 14 Year Olds | 7,124 (85.0%) | 1,262 (15.0%) |
| 15 to 17 Year Olds | 4,230 (89.7%) | 484 (10.3%) |
| 18 to 19 Year Olds | 1,322 (84.9%) | 236 (15.1%) |
| 20 to 24 Year Olds | 1,065 (75.8%) | 340 (24.2%) |
| 25 to 34 Year Olds | 1,088 (62.4%) | 656 (37.6%) |
| 35 Years and over | 511 (58.5%) | 362 (41.5%) |
| Total | 22,786 (82.1%) | 4,968 (17.9%) |
Educational Attainment by Field of Study in San Tan Valley
Business (3,755 | 25.5%), education (1,875 | 12.7%), arts & humanities (1,702 | 11.6%), science & technology (1,254 | 8.5%), and social sciences (846 | 5.7%) are the most common fields of study among 14,728 individuals in San Tan Valley who have obtained a bachelor's degree or higher.
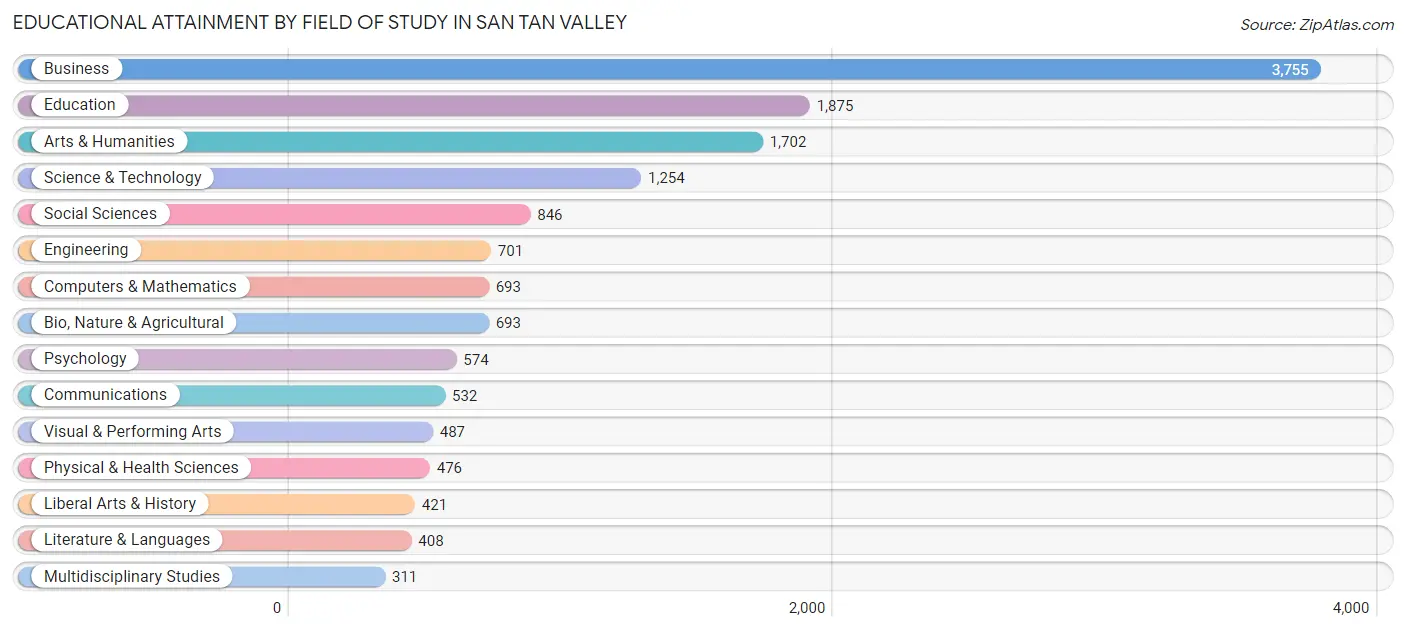
| Field of Study | # Graduates | % Graduates |
| Computers & Mathematics | 693 | 4.7% |
| Bio, Nature & Agricultural | 693 | 4.7% |
| Physical & Health Sciences | 476 | 3.2% |
| Psychology | 574 | 3.9% |
| Social Sciences | 846 | 5.7% |
| Engineering | 701 | 4.8% |
| Multidisciplinary Studies | 311 | 2.1% |
| Science & Technology | 1,254 | 8.5% |
| Business | 3,755 | 25.5% |
| Education | 1,875 | 12.7% |
| Literature & Languages | 408 | 2.8% |
| Liberal Arts & History | 421 | 2.9% |
| Visual & Performing Arts | 487 | 3.3% |
| Communications | 532 | 3.6% |
| Arts & Humanities | 1,702 | 11.6% |
| Total | 14,728 | 100.0% |
Transportation & Commute in San Tan Valley
Vehicle Availability by Sex in San Tan Valley
The most prevalent vehicle ownership categories in San Tan Valley are males with 2 vehicles (11,448, accounting for 45.5%) and females with 2 vehicles (8,044, making up 52.8%).
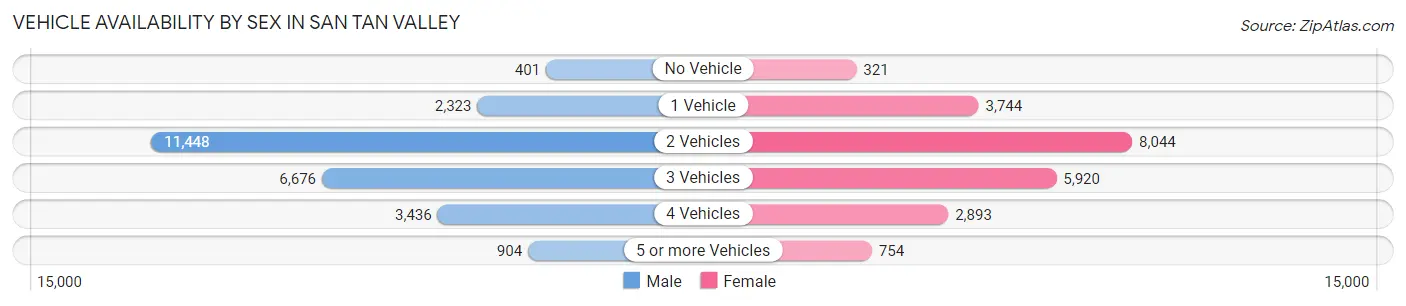
| Vehicles Available | Male | Female |
| No Vehicle | 401 (1.6%) | 321 (1.5%) |
| 1 Vehicle | 2,323 (9.2%) | 3,744 (17.3%) |
| 2 Vehicles | 11,448 (45.5%) | 8,044 (37.1%) |
| 3 Vehicles | 6,676 (26.5%) | 5,920 (27.3%) |
| 4 Vehicles | 3,436 (13.6%) | 2,893 (13.4%) |
| 5 or more Vehicles | 904 (3.6%) | 754 (3.5%) |
| Total | 25,188 (100.0%) | 21,676 (100.0%) |
Commute Time in San Tan Valley
The most frequently occuring commute durations in San Tan Valley are 45 to 59 minutes (10,433 commuters, 25.7%), 60 to 89 minutes (5,522 commuters, 13.6%), and 30 to 34 minutes (5,122 commuters, 12.6%).
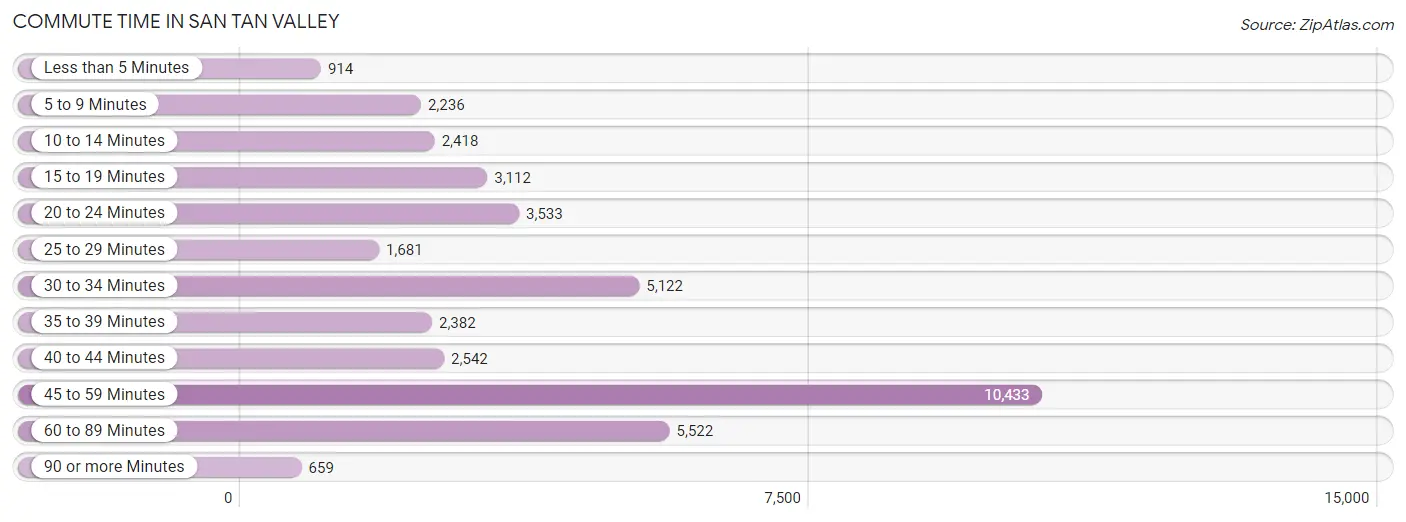
| Commute Time | # Commuters | % Commuters |
| Less than 5 Minutes | 914 | 2.2% |
| 5 to 9 Minutes | 2,236 | 5.5% |
| 10 to 14 Minutes | 2,418 | 6.0% |
| 15 to 19 Minutes | 3,112 | 7.7% |
| 20 to 24 Minutes | 3,533 | 8.7% |
| 25 to 29 Minutes | 1,681 | 4.2% |
| 30 to 34 Minutes | 5,122 | 12.6% |
| 35 to 39 Minutes | 2,382 | 5.9% |
| 40 to 44 Minutes | 2,542 | 6.3% |
| 45 to 59 Minutes | 10,433 | 25.7% |
| 60 to 89 Minutes | 5,522 | 13.6% |
| 90 or more Minutes | 659 | 1.6% |
Commute Time by Sex in San Tan Valley
The most common commute times in San Tan Valley are 45 to 59 minutes (6,405 commuters, 28.3%) for males and 45 to 59 minutes (4,028 commuters, 22.5%) for females.
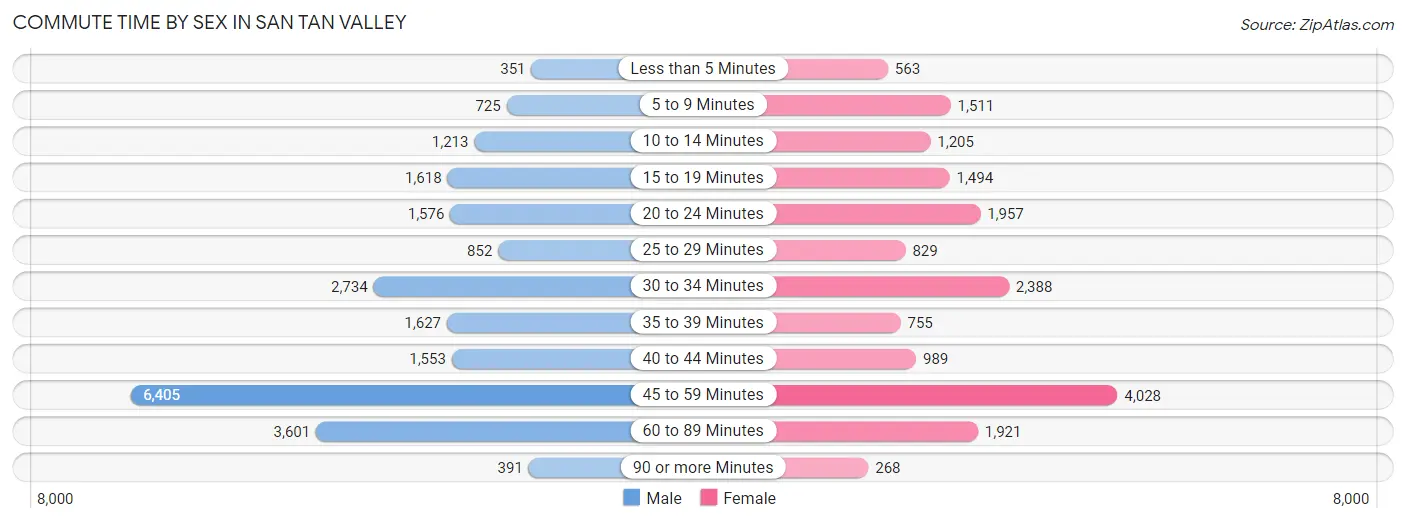
| Commute Time | Male | Female |
| Less than 5 Minutes | 351 (1.5%) | 563 (3.1%) |
| 5 to 9 Minutes | 725 (3.2%) | 1,511 (8.4%) |
| 10 to 14 Minutes | 1,213 (5.4%) | 1,205 (6.7%) |
| 15 to 19 Minutes | 1,618 (7.1%) | 1,494 (8.3%) |
| 20 to 24 Minutes | 1,576 (7.0%) | 1,957 (10.9%) |
| 25 to 29 Minutes | 852 (3.8%) | 829 (4.6%) |
| 30 to 34 Minutes | 2,734 (12.1%) | 2,388 (13.3%) |
| 35 to 39 Minutes | 1,627 (7.2%) | 755 (4.2%) |
| 40 to 44 Minutes | 1,553 (6.9%) | 989 (5.5%) |
| 45 to 59 Minutes | 6,405 (28.3%) | 4,028 (22.5%) |
| 60 to 89 Minutes | 3,601 (15.9%) | 1,921 (10.7%) |
| 90 or more Minutes | 391 (1.7%) | 268 (1.5%) |
Time of Departure to Work by Sex in San Tan Valley
The most frequent times of departure to work in San Tan Valley are 12:00 AM to 4:59 AM (3,616, 16.0%) for males and 7:00 AM to 7:29 AM (2,235, 12.5%) for females.
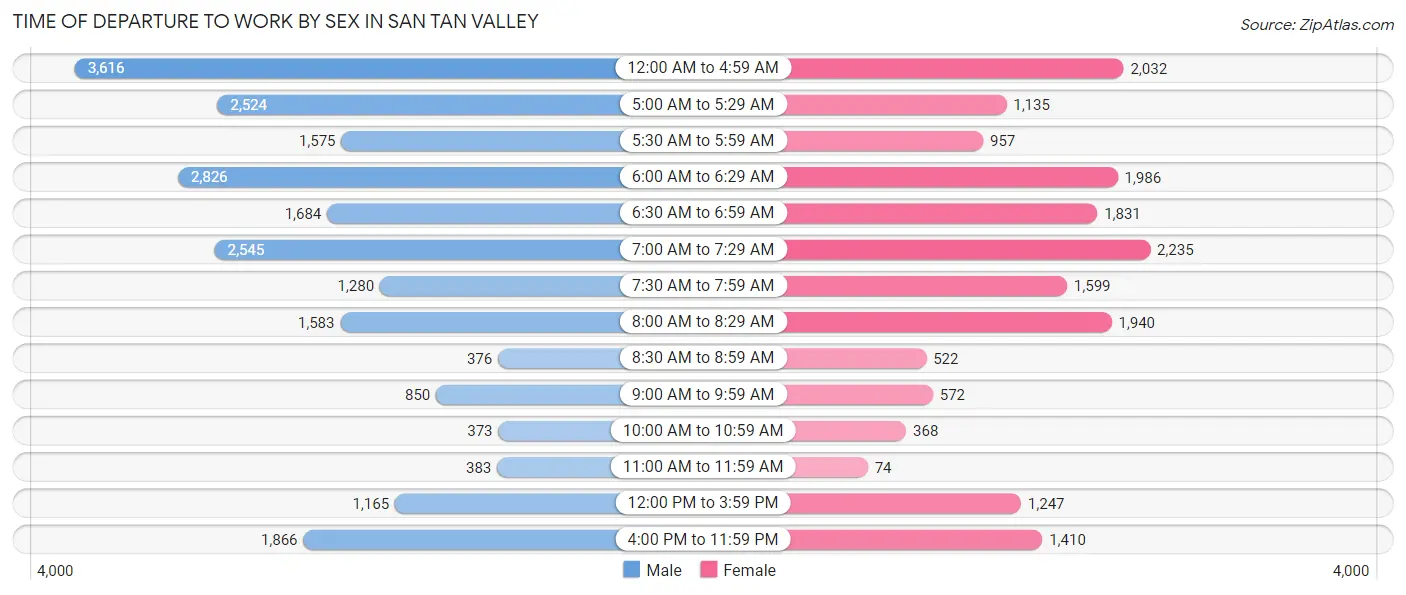
| Time of Departure | Male | Female |
| 12:00 AM to 4:59 AM | 3,616 (16.0%) | 2,032 (11.4%) |
| 5:00 AM to 5:29 AM | 2,524 (11.2%) | 1,135 (6.3%) |
| 5:30 AM to 5:59 AM | 1,575 (7.0%) | 957 (5.3%) |
| 6:00 AM to 6:29 AM | 2,826 (12.5%) | 1,986 (11.1%) |
| 6:30 AM to 6:59 AM | 1,684 (7.4%) | 1,831 (10.2%) |
| 7:00 AM to 7:29 AM | 2,545 (11.2%) | 2,235 (12.5%) |
| 7:30 AM to 7:59 AM | 1,280 (5.7%) | 1,599 (8.9%) |
| 8:00 AM to 8:29 AM | 1,583 (7.0%) | 1,940 (10.8%) |
| 8:30 AM to 8:59 AM | 376 (1.7%) | 522 (2.9%) |
| 9:00 AM to 9:59 AM | 850 (3.7%) | 572 (3.2%) |
| 10:00 AM to 10:59 AM | 373 (1.7%) | 368 (2.1%) |
| 11:00 AM to 11:59 AM | 383 (1.7%) | 74 (0.4%) |
| 12:00 PM to 3:59 PM | 1,165 (5.1%) | 1,247 (7.0%) |
| 4:00 PM to 11:59 PM | 1,866 (8.2%) | 1,410 (7.9%) |
| Total | 22,646 (100.0%) | 17,908 (100.0%) |
Housing Occupancy in San Tan Valley
Occupancy by Ownership in San Tan Valley
Of the total 32,530 dwellings in San Tan Valley, owner-occupied units account for 26,138 (80.3%), while renter-occupied units make up 6,392 (19.7%).
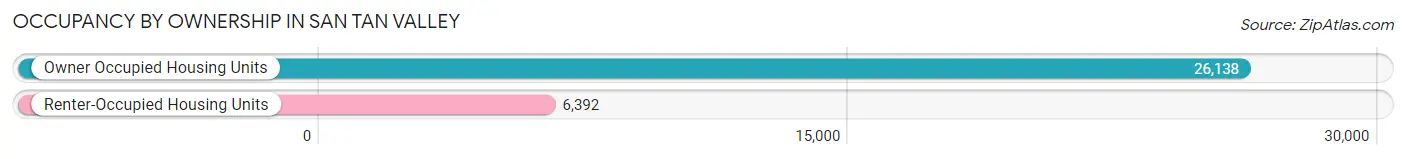
| Occupancy | # Housing Units | % Housing Units |
| Owner Occupied Housing Units | 26,138 | 80.3% |
| Renter-Occupied Housing Units | 6,392 | 19.7% |
| Total Occupied Housing Units | 32,530 | 100.0% |
Occupancy by Household Size in San Tan Valley
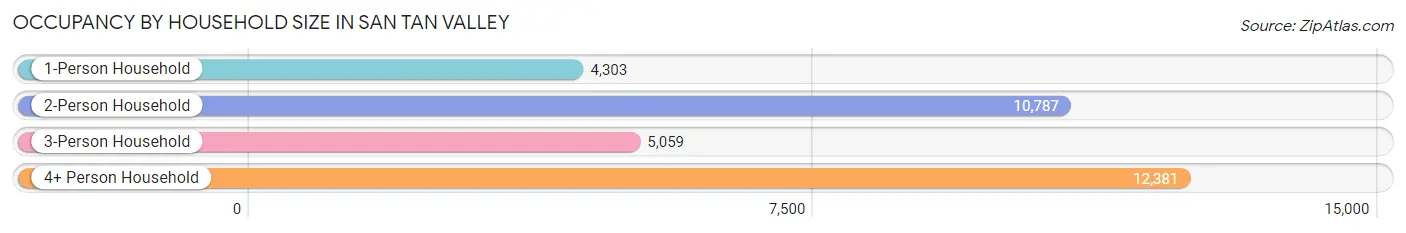
| Household Size | # Housing Units | % Housing Units |
| 1-Person Household | 4,303 | 13.2% |
| 2-Person Household | 10,787 | 33.2% |
| 3-Person Household | 5,059 | 15.5% |
| 4+ Person Household | 12,381 | 38.1% |
| Total Housing Units | 32,530 | 100.0% |
Occupancy by Ownership by Household Size in San Tan Valley
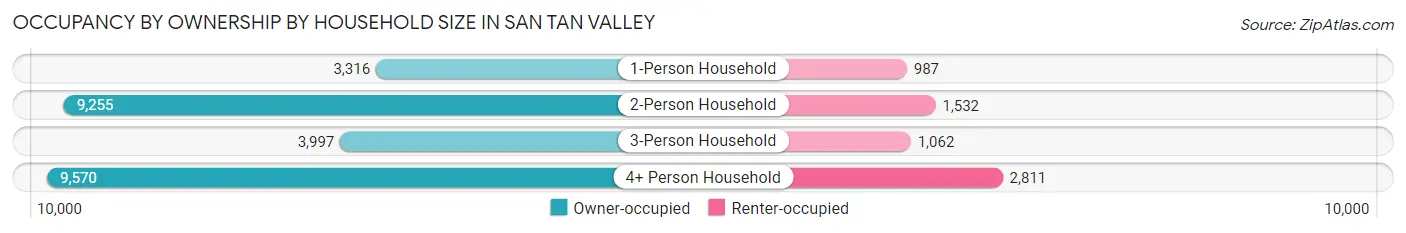
| Household Size | Owner-occupied | Renter-occupied |
| 1-Person Household | 3,316 (77.1%) | 987 (22.9%) |
| 2-Person Household | 9,255 (85.8%) | 1,532 (14.2%) |
| 3-Person Household | 3,997 (79.0%) | 1,062 (21.0%) |
| 4+ Person Household | 9,570 (77.3%) | 2,811 (22.7%) |
| Total Housing Units | 26,138 (80.3%) | 6,392 (19.7%) |
Occupancy by Educational Attainment in San Tan Valley
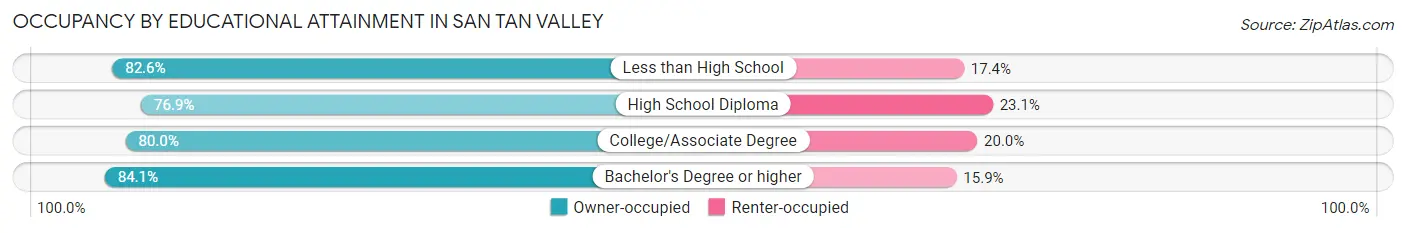
| Household Size | Owner-occupied | Renter-occupied |
| Less than High School | 1,416 (82.6%) | 298 (17.4%) |
| High School Diploma | 6,279 (76.9%) | 1,886 (23.1%) |
| College/Associate Degree | 11,787 (80.0%) | 2,949 (20.0%) |
| Bachelor's Degree or higher | 6,656 (84.1%) | 1,259 (15.9%) |
Occupancy by Age of Householder in San Tan Valley
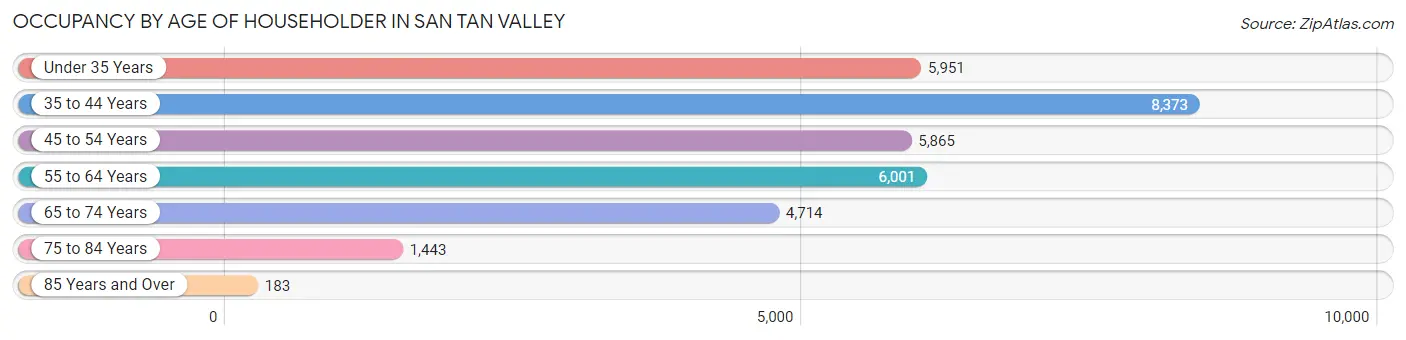
| Age Bracket | # Households | % Households |
| Under 35 Years | 5,951 | 18.3% |
| 35 to 44 Years | 8,373 | 25.7% |
| 45 to 54 Years | 5,865 | 18.0% |
| 55 to 64 Years | 6,001 | 18.4% |
| 65 to 74 Years | 4,714 | 14.5% |
| 75 to 84 Years | 1,443 | 4.4% |
| 85 Years and Over | 183 | 0.6% |
| Total | 32,530 | 100.0% |
Housing Finances in San Tan Valley
Median Income by Occupancy in San Tan Valley
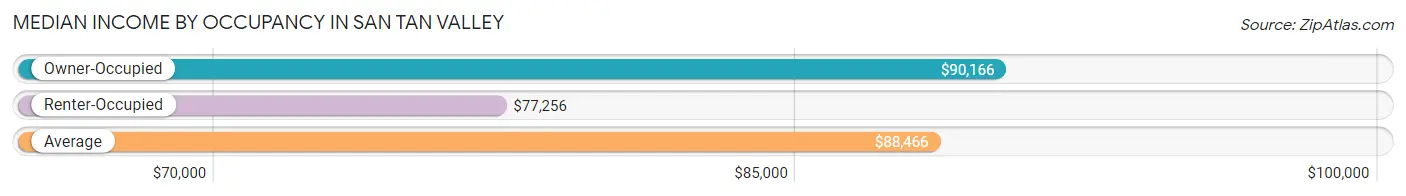
| Occupancy Type | # Households | Median Income |
| Owner-Occupied | 26,138 (80.3%) | $90,166 |
| Renter-Occupied | 6,392 (19.7%) | $77,256 |
| Average | 32,530 (100.0%) | $88,466 |
Occupancy by Householder Income Bracket in San Tan Valley
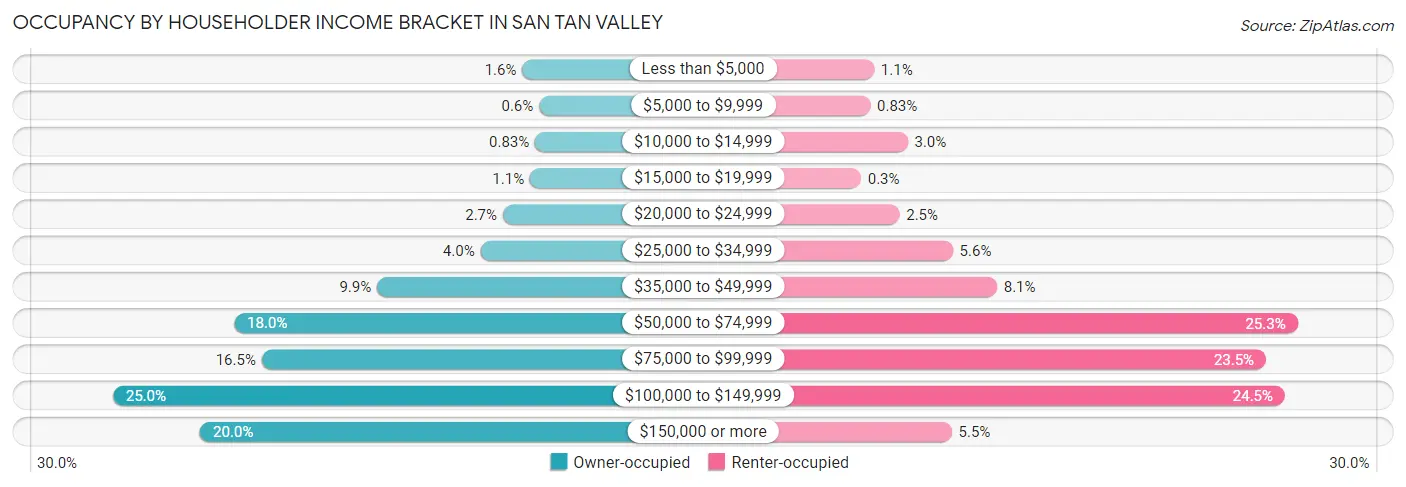
| Income Bracket | Owner-occupied | Renter-occupied |
| Less than $5,000 | 408 (1.6%) | 67 (1.1%) |
| $5,000 to $9,999 | 156 (0.6%) | 53 (0.8%) |
| $10,000 to $14,999 | 217 (0.8%) | 190 (3.0%) |
| $15,000 to $19,999 | 292 (1.1%) | 19 (0.3%) |
| $20,000 to $24,999 | 699 (2.7%) | 160 (2.5%) |
| $25,000 to $34,999 | 1,032 (4.0%) | 355 (5.6%) |
| $35,000 to $49,999 | 2,577 (9.9%) | 516 (8.1%) |
| $50,000 to $74,999 | 4,713 (18.0%) | 1,614 (25.3%) |
| $75,000 to $99,999 | 4,300 (16.5%) | 1,499 (23.4%) |
| $100,000 to $149,999 | 6,524 (25.0%) | 1,568 (24.5%) |
| $150,000 or more | 5,220 (20.0%) | 351 (5.5%) |
| Total | 26,138 (100.0%) | 6,392 (100.0%) |
Monthly Housing Cost Tiers in San Tan Valley
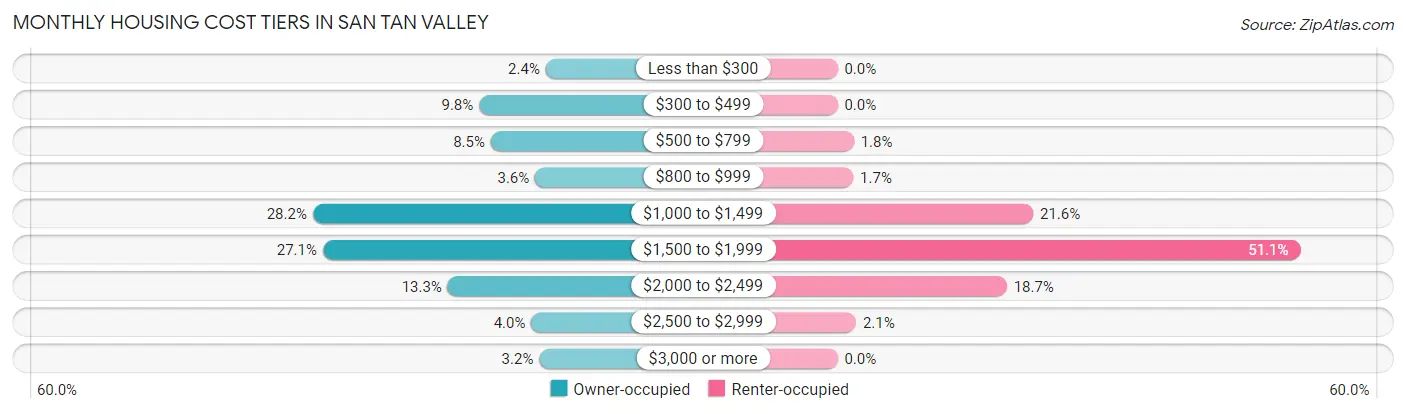
| Monthly Cost | Owner-occupied | Renter-occupied |
| Less than $300 | 635 (2.4%) | 0 (0.0%) |
| $300 to $499 | 2,559 (9.8%) | 0 (0.0%) |
| $500 to $799 | 2,223 (8.5%) | 115 (1.8%) |
| $800 to $999 | 940 (3.6%) | 111 (1.7%) |
| $1,000 to $1,499 | 7,364 (28.2%) | 1,381 (21.6%) |
| $1,500 to $1,999 | 7,074 (27.1%) | 3,269 (51.1%) |
| $2,000 to $2,499 | 3,467 (13.3%) | 1,195 (18.7%) |
| $2,500 to $2,999 | 1,052 (4.0%) | 131 (2.1%) |
| $3,000 or more | 824 (3.2%) | 0 (0.0%) |
| Total | 26,138 (100.0%) | 6,392 (100.0%) |
Physical Housing Characteristics in San Tan Valley
Housing Structures in San Tan Valley
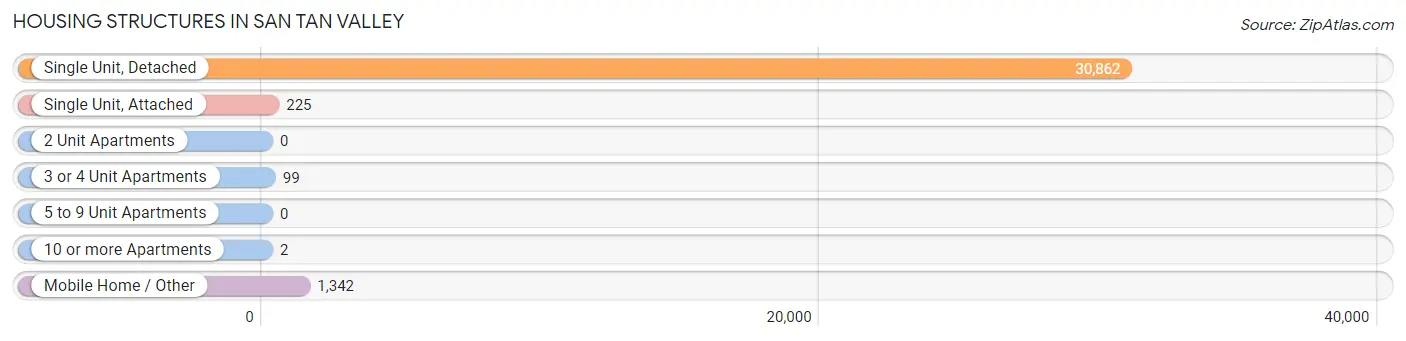
| Structure Type | # Housing Units | % Housing Units |
| Single Unit, Detached | 30,862 | 94.9% |
| Single Unit, Attached | 225 | 0.7% |
| 2 Unit Apartments | 0 | 0.0% |
| 3 or 4 Unit Apartments | 99 | 0.3% |
| 5 to 9 Unit Apartments | 0 | 0.0% |
| 10 or more Apartments | 2 | 0.0% |
| Mobile Home / Other | 1,342 | 4.1% |
| Total | 32,530 | 100.0% |
Housing Structures by Occupancy in San Tan Valley
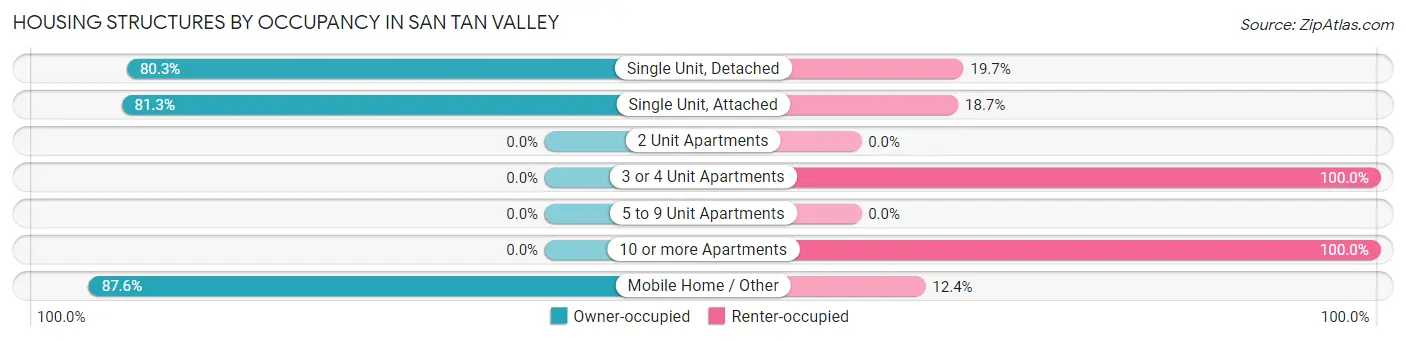
| Structure Type | Owner-occupied | Renter-occupied |
| Single Unit, Detached | 24,779 (80.3%) | 6,083 (19.7%) |
| Single Unit, Attached | 183 (81.3%) | 42 (18.7%) |
| 2 Unit Apartments | 0 (0.0%) | 0 (0.0%) |
| 3 or 4 Unit Apartments | 0 (0.0%) | 99 (100.0%) |
| 5 to 9 Unit Apartments | 0 (0.0%) | 0 (0.0%) |
| 10 or more Apartments | 0 (0.0%) | 2 (100.0%) |
| Mobile Home / Other | 1,176 (87.6%) | 166 (12.4%) |
| Total | 26,138 (80.3%) | 6,392 (19.7%) |
Housing Structures by Number of Rooms in San Tan Valley
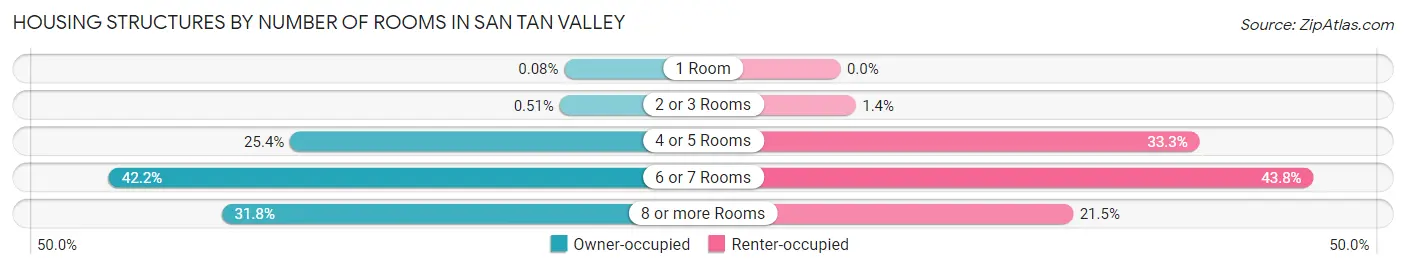
| Number of Rooms | Owner-occupied | Renter-occupied |
| 1 Room | 20 (0.1%) | 0 (0.0%) |
| 2 or 3 Rooms | 133 (0.5%) | 91 (1.4%) |
| 4 or 5 Rooms | 6,649 (25.4%) | 2,126 (33.3%) |
| 6 or 7 Rooms | 11,030 (42.2%) | 2,799 (43.8%) |
| 8 or more Rooms | 8,306 (31.8%) | 1,376 (21.5%) |
| Total | 26,138 (100.0%) | 6,392 (100.0%) |
Housing Structure by Heating Type in San Tan Valley
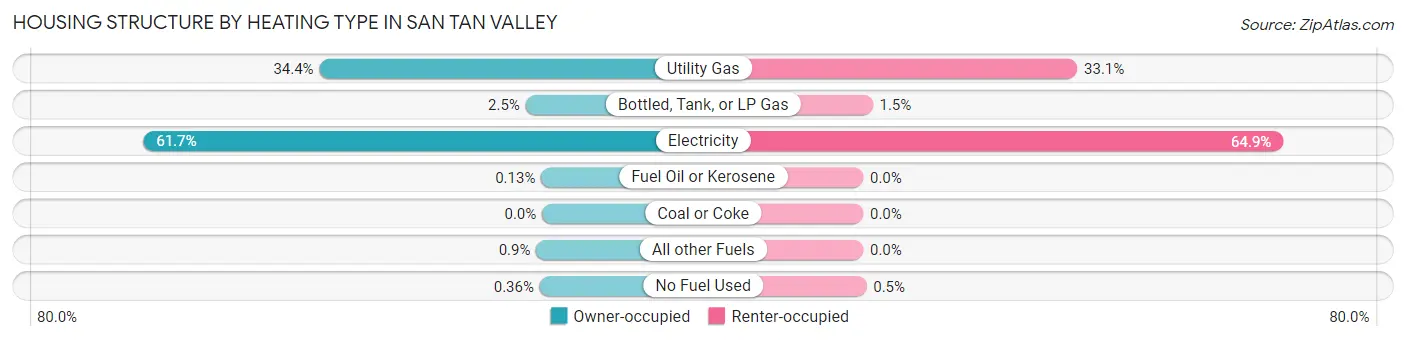
| Heating Type | Owner-occupied | Renter-occupied |
| Utility Gas | 8,998 (34.4%) | 2,115 (33.1%) |
| Bottled, Tank, or LP Gas | 665 (2.5%) | 94 (1.5%) |
| Electricity | 16,113 (61.7%) | 4,151 (64.9%) |
| Fuel Oil or Kerosene | 33 (0.1%) | 0 (0.0%) |
| Coal or Coke | 0 (0.0%) | 0 (0.0%) |
| All other Fuels | 235 (0.9%) | 0 (0.0%) |
| No Fuel Used | 94 (0.4%) | 32 (0.5%) |
| Total | 26,138 (100.0%) | 6,392 (100.0%) |
Household Vehicle Usage in San Tan Valley
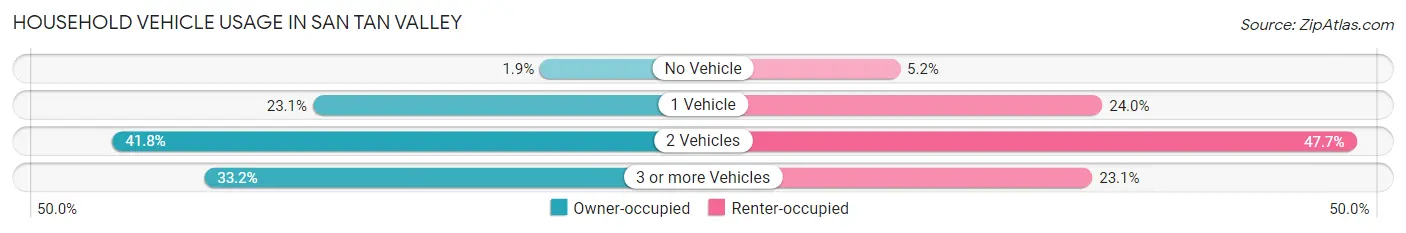
| Vehicles per Household | Owner-occupied | Renter-occupied |
| No Vehicle | 492 (1.9%) | 329 (5.1%) |
| 1 Vehicle | 6,037 (23.1%) | 1,536 (24.0%) |
| 2 Vehicles | 10,925 (41.8%) | 3,051 (47.7%) |
| 3 or more Vehicles | 8,684 (33.2%) | 1,476 (23.1%) |
| Total | 26,138 (100.0%) | 6,392 (100.0%) |
Real Estate & Mortgages in San Tan Valley
Real Estate and Mortgage Overview in San Tan Valley
| Characteristic | Without Mortgage | With Mortgage |
| Housing Units | 4,973 | 21,165 |
| Median Property Value | $286,600 | $308,900 |
| Median Household Income | $72,083 | $4,451 |
| Monthly Housing Costs | $453 | $801 |
| Real Estate Taxes | $1,425 | $756 |
Property Value by Mortgage Status in San Tan Valley
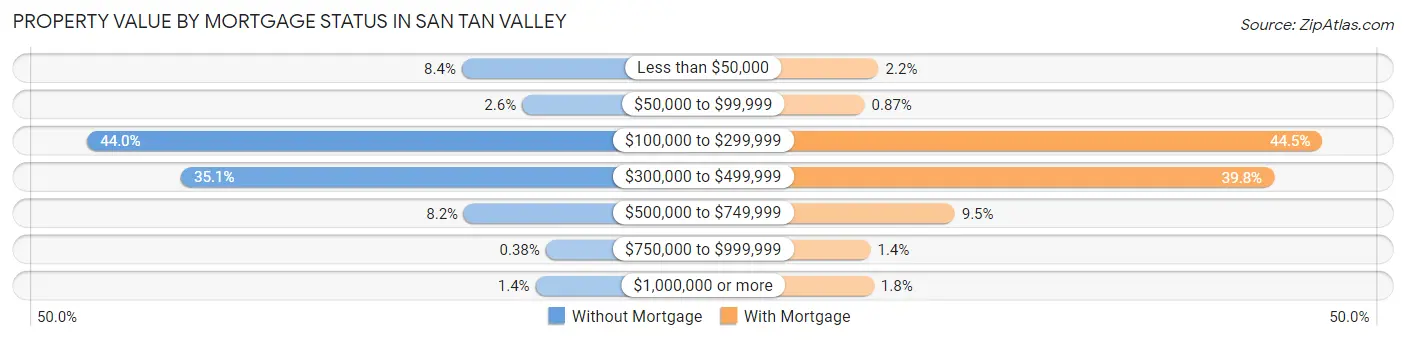
| Property Value | Without Mortgage | With Mortgage |
| Less than $50,000 | 416 (8.4%) | 465 (2.2%) |
| $50,000 to $99,999 | 131 (2.6%) | 185 (0.9%) |
| $100,000 to $299,999 | 2,189 (44.0%) | 9,408 (44.5%) |
| $300,000 to $499,999 | 1,745 (35.1%) | 8,432 (39.8%) |
| $500,000 to $749,999 | 406 (8.2%) | 2,001 (9.5%) |
| $750,000 to $999,999 | 19 (0.4%) | 303 (1.4%) |
| $1,000,000 or more | 67 (1.3%) | 371 (1.8%) |
| Total | 4,973 (100.0%) | 21,165 (100.0%) |
Household Income by Mortgage Status in San Tan Valley
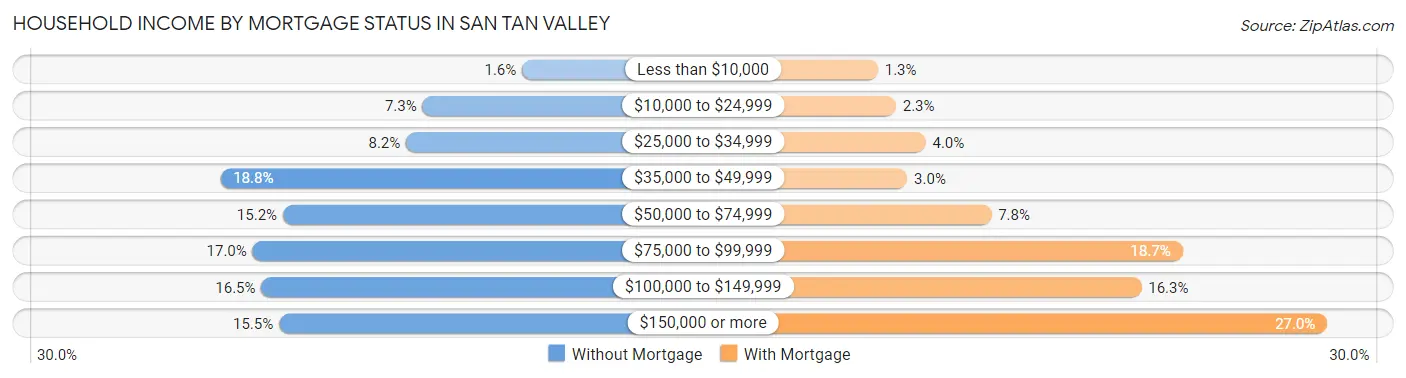
| Household Income | Without Mortgage | With Mortgage |
| Less than $10,000 | 78 (1.6%) | 269 (1.3%) |
| $10,000 to $24,999 | 361 (7.3%) | 486 (2.3%) |
| $25,000 to $34,999 | 408 (8.2%) | 847 (4.0%) |
| $35,000 to $49,999 | 936 (18.8%) | 624 (2.9%) |
| $50,000 to $74,999 | 758 (15.2%) | 1,641 (7.7%) |
| $75,000 to $99,999 | 844 (17.0%) | 3,955 (18.7%) |
| $100,000 to $149,999 | 819 (16.5%) | 3,456 (16.3%) |
| $150,000 or more | 769 (15.5%) | 5,705 (27.0%) |
| Total | 4,973 (100.0%) | 21,165 (100.0%) |
Property Value to Household Income Ratio in San Tan Valley
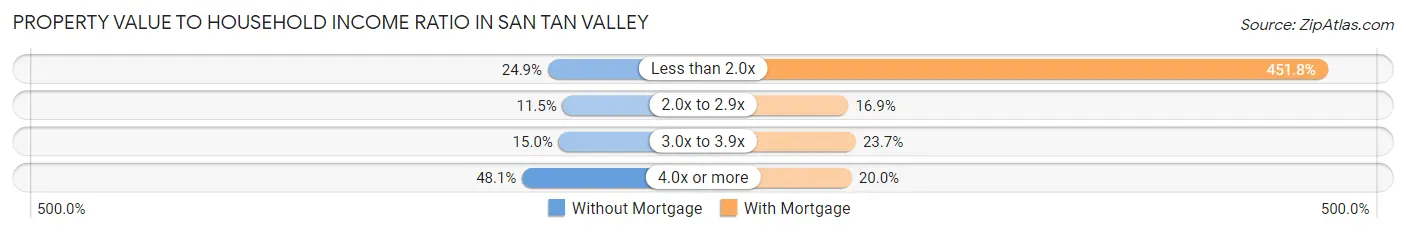
| Value-to-Income Ratio | Without Mortgage | With Mortgage |
| Less than 2.0x | 1,236 (24.8%) | 95,622 (451.8%) |
| 2.0x to 2.9x | 574 (11.5%) | 3,570 (16.9%) |
| 3.0x to 3.9x | 748 (15.0%) | 5,010 (23.7%) |
| 4.0x or more | 2,394 (48.1%) | 4,226 (20.0%) |
| Total | 4,973 (100.0%) | 21,165 (100.0%) |
Real Estate Taxes by Mortgage Status in San Tan Valley
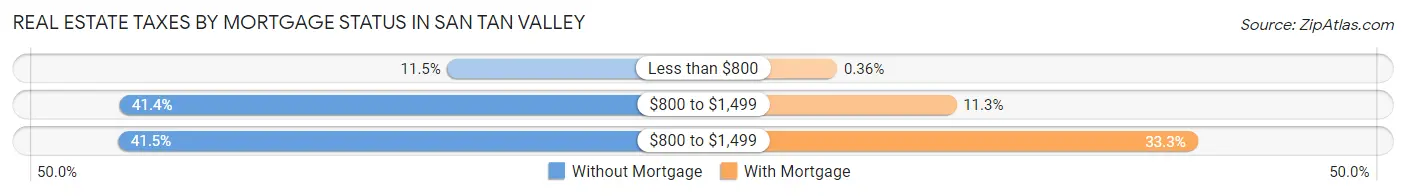
| Property Taxes | Without Mortgage | With Mortgage |
| Less than $800 | 570 (11.5%) | 76 (0.4%) |
| $800 to $1,499 | 2,057 (41.4%) | 2,382 (11.3%) |
| $800 to $1,499 | 2,063 (41.5%) | 7,044 (33.3%) |
| Total | 4,973 (100.0%) | 21,165 (100.0%) |
Health & Disability in San Tan Valley
Health Insurance Coverage by Age in San Tan Valley
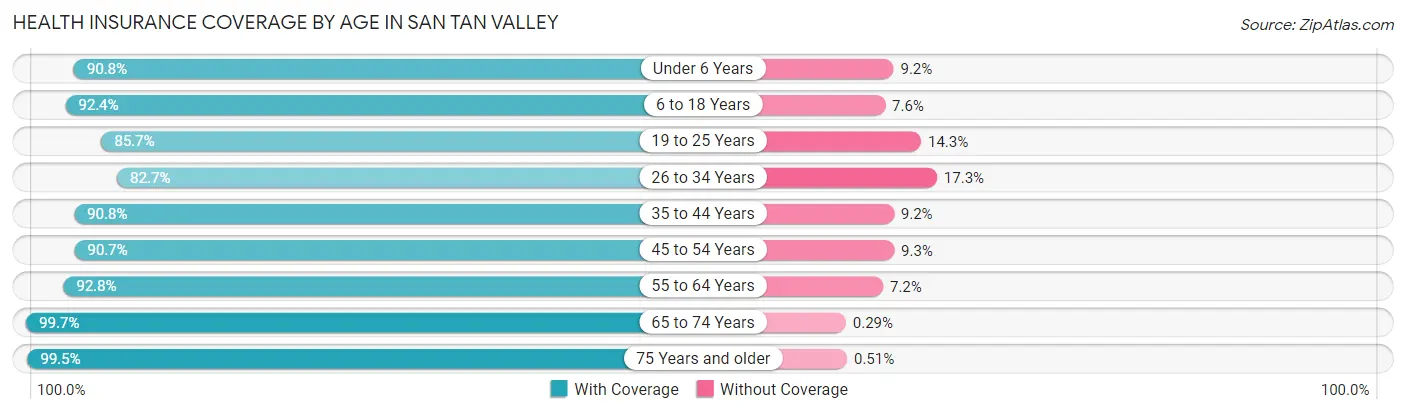
| Age Bracket | With Coverage | Without Coverage |
| Under 6 Years | 7,087 (90.8%) | 716 (9.2%) |
| 6 to 18 Years | 20,772 (92.4%) | 1,711 (7.6%) |
| 19 to 25 Years | 7,662 (85.7%) | 1,280 (14.3%) |
| 26 to 34 Years | 9,813 (82.7%) | 2,048 (17.3%) |
| 35 to 44 Years | 14,747 (90.8%) | 1,502 (9.2%) |
| 45 to 54 Years | 10,285 (90.7%) | 1,053 (9.3%) |
| 55 to 64 Years | 9,808 (92.8%) | 763 (7.2%) |
| 65 to 74 Years | 8,299 (99.7%) | 24 (0.3%) |
| 75 Years and older | 3,488 (99.5%) | 18 (0.5%) |
| Total | 91,961 (91.0%) | 9,115 (9.0%) |
Health Insurance Coverage by Citizenship Status in San Tan Valley
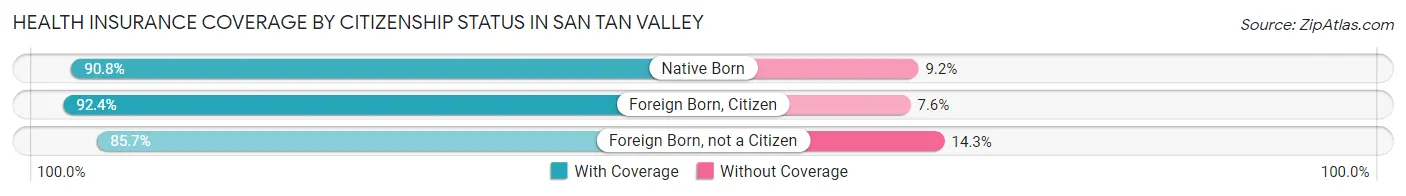
| Citizenship Status | With Coverage | Without Coverage |
| Native Born | 7,087 (90.8%) | 716 (9.2%) |
| Foreign Born, Citizen | 20,772 (92.4%) | 1,711 (7.6%) |
| Foreign Born, not a Citizen | 7,662 (85.7%) | 1,280 (14.3%) |
Health Insurance Coverage by Household Income in San Tan Valley
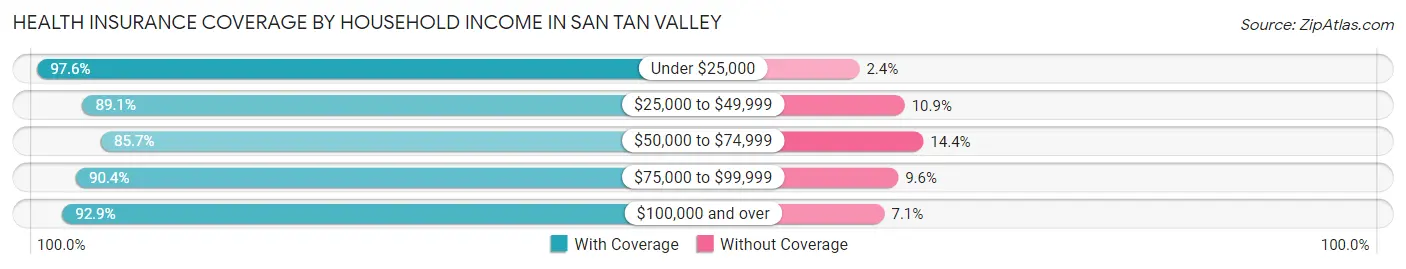
| Household Income | With Coverage | Without Coverage |
| Under $25,000 | 5,228 (97.6%) | 127 (2.4%) |
| $25,000 to $49,999 | 9,245 (89.1%) | 1,126 (10.9%) |
| $50,000 to $74,999 | 16,301 (85.7%) | 2,730 (14.3%) |
| $75,000 to $99,999 | 15,598 (90.4%) | 1,665 (9.6%) |
| $100,000 and over | 45,581 (92.9%) | 3,467 (7.1%) |
Public vs Private Health Insurance Coverage by Age in San Tan Valley
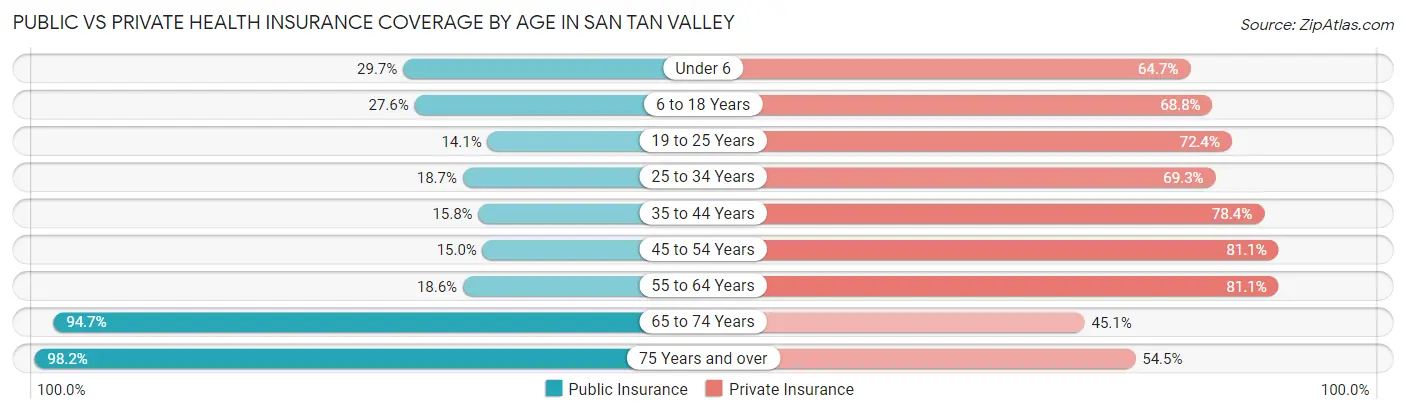
| Age Bracket | Public Insurance | Private Insurance |
| Under 6 | 2,321 (29.7%) | 5,045 (64.6%) |
| 6 to 18 Years | 6,209 (27.6%) | 15,465 (68.8%) |
| 19 to 25 Years | 1,259 (14.1%) | 6,472 (72.4%) |
| 25 to 34 Years | 2,213 (18.7%) | 8,224 (69.3%) |
| 35 to 44 Years | 2,561 (15.8%) | 12,734 (78.4%) |
| 45 to 54 Years | 1,697 (15.0%) | 9,192 (81.1%) |
| 55 to 64 Years | 1,970 (18.6%) | 8,571 (81.1%) |
| 65 to 74 Years | 7,879 (94.7%) | 3,750 (45.1%) |
| 75 Years and over | 3,442 (98.2%) | 1,910 (54.5%) |
| Total | 29,551 (29.2%) | 71,363 (70.6%) |
Disability Status by Sex by Age in San Tan Valley
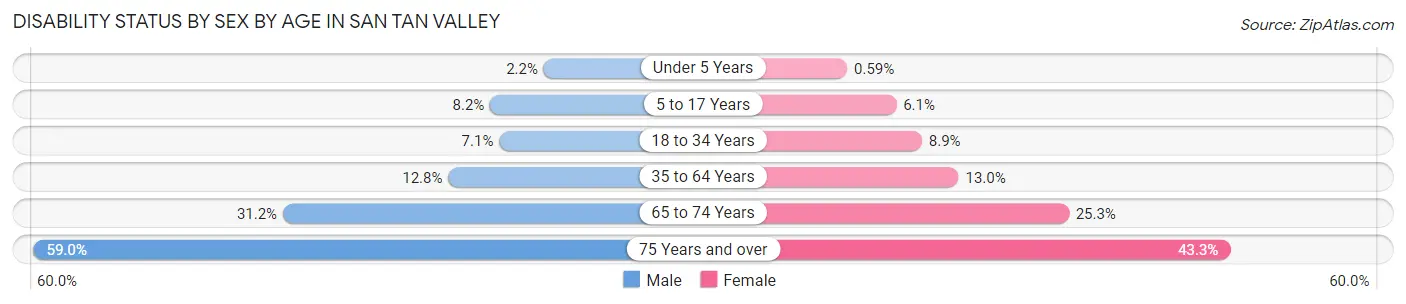
| Age Bracket | Male | Female |
| Under 5 Years | 66 (2.2%) | 20 (0.6%) |
| 5 to 17 Years | 855 (8.2%) | 712 (6.1%) |
| 18 to 34 Years | 820 (7.1%) | 978 (8.9%) |
| 35 to 64 Years | 2,368 (12.8%) | 2,557 (13.0%) |
| 65 to 74 Years | 1,210 (31.2%) | 1,124 (25.3%) |
| 75 Years and over | 1,059 (59.0%) | 740 (43.2%) |
Disability Class by Sex by Age in San Tan Valley
Disability Class: Hearing Difficulty
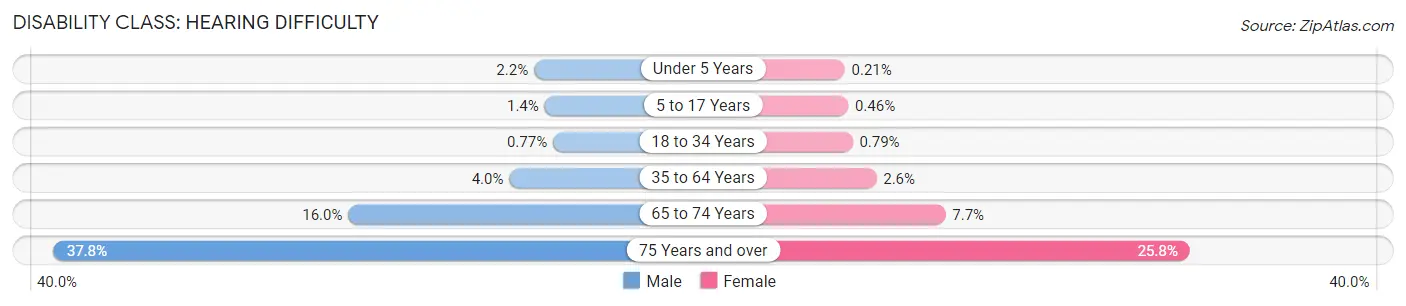
| Age Bracket | Male | Female |
| Under 5 Years | 66 (2.2%) | 7 (0.2%) |
| 5 to 17 Years | 146 (1.4%) | 54 (0.5%) |
| 18 to 34 Years | 89 (0.8%) | 87 (0.8%) |
| 35 to 64 Years | 742 (4.0%) | 504 (2.6%) |
| 65 to 74 Years | 619 (16.0%) | 342 (7.7%) |
| 75 Years and over | 679 (37.8%) | 442 (25.8%) |
Disability Class: Vision Difficulty
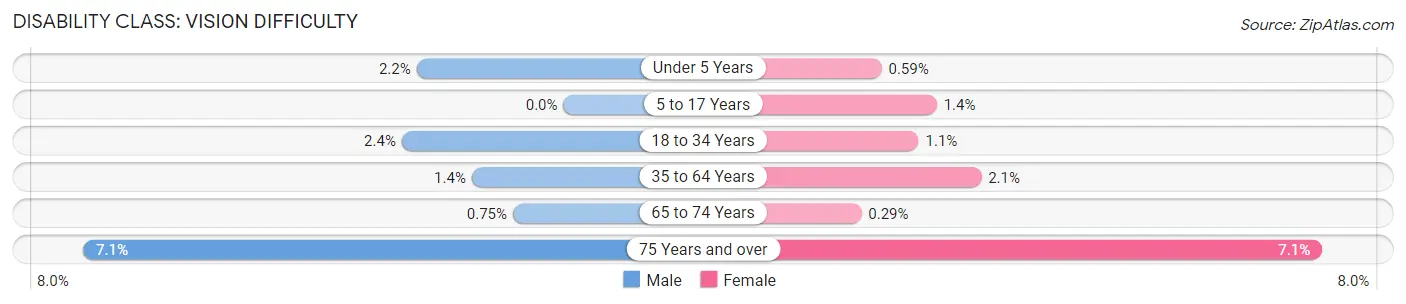
| Age Bracket | Male | Female |
| Under 5 Years | 66 (2.2%) | 20 (0.6%) |
| 5 to 17 Years | 0 (0.0%) | 165 (1.4%) |
| 18 to 34 Years | 276 (2.4%) | 125 (1.1%) |
| 35 to 64 Years | 251 (1.4%) | 407 (2.1%) |
| 65 to 74 Years | 29 (0.7%) | 13 (0.3%) |
| 75 Years and over | 128 (7.1%) | 122 (7.1%) |
Disability Class: Cognitive Difficulty
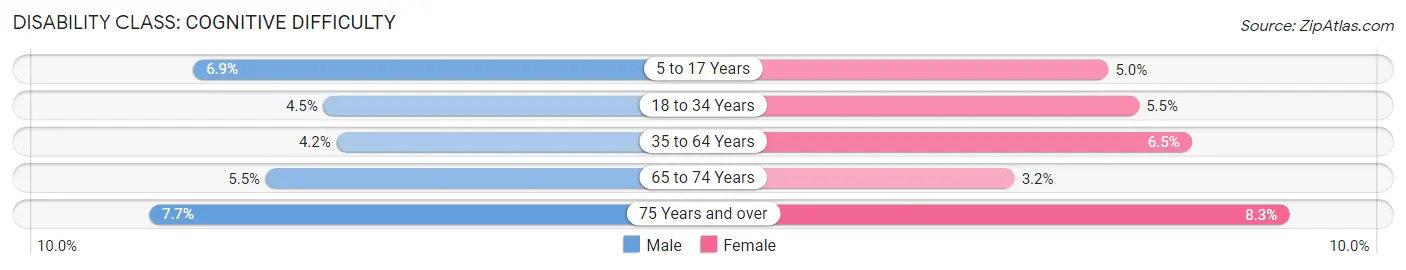
| Age Bracket | Male | Female |
| 5 to 17 Years | 721 (6.9%) | 581 (5.0%) |
| 18 to 34 Years | 511 (4.4%) | 605 (5.5%) |
| 35 to 64 Years | 778 (4.2%) | 1,276 (6.5%) |
| 65 to 74 Years | 214 (5.5%) | 143 (3.2%) |
| 75 Years and over | 138 (7.7%) | 142 (8.3%) |
Disability Class: Ambulatory Difficulty
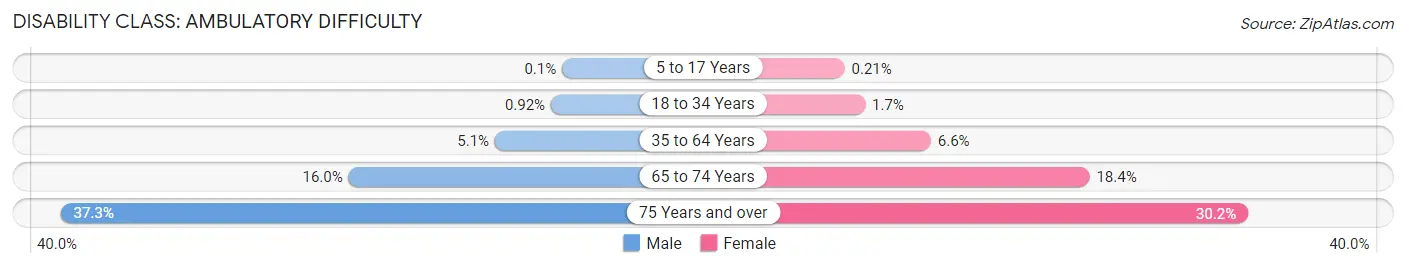
| Age Bracket | Male | Female |
| 5 to 17 Years | 10 (0.1%) | 25 (0.2%) |
| 18 to 34 Years | 106 (0.9%) | 190 (1.7%) |
| 35 to 64 Years | 940 (5.1%) | 1,300 (6.6%) |
| 65 to 74 Years | 618 (16.0%) | 818 (18.4%) |
| 75 Years and over | 670 (37.3%) | 516 (30.2%) |
Disability Class: Self-Care Difficulty
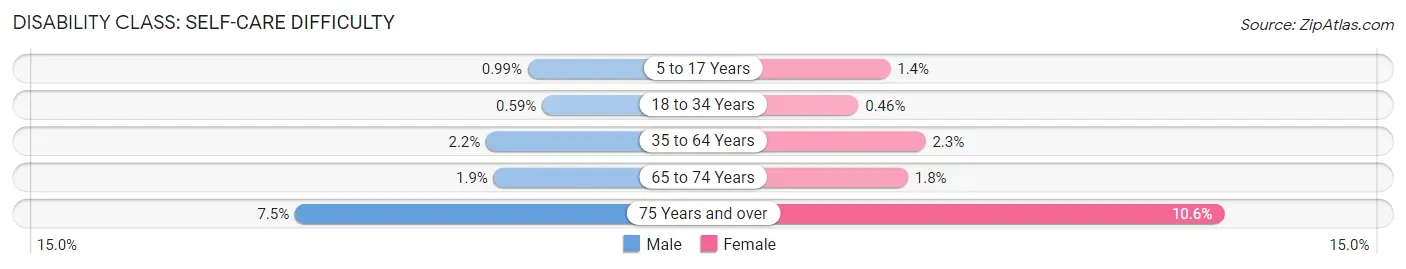
| Age Bracket | Male | Female |
| 5 to 17 Years | 104 (1.0%) | 159 (1.3%) |
| 18 to 34 Years | 68 (0.6%) | 51 (0.5%) |
| 35 to 64 Years | 397 (2.1%) | 459 (2.3%) |
| 65 to 74 Years | 75 (1.9%) | 82 (1.8%) |
| 75 Years and over | 134 (7.5%) | 182 (10.6%) |
Technology Access in San Tan Valley
Computing Device Access in San Tan Valley
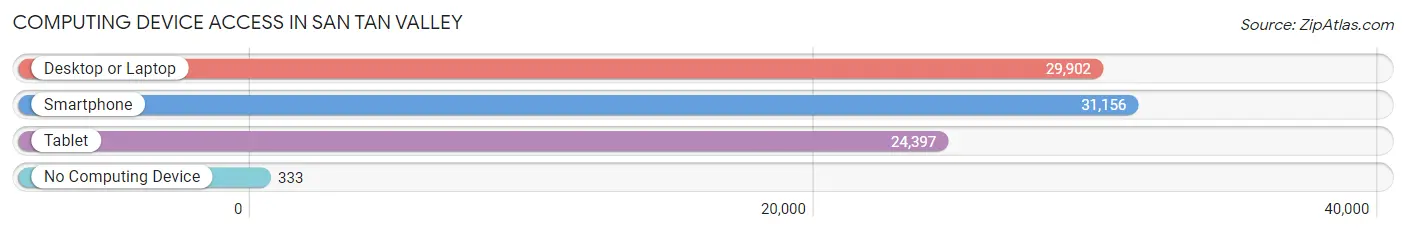
| Device Type | # Households | % Households |
| Desktop or Laptop | 29,902 | 91.9% |
| Smartphone | 31,156 | 95.8% |
| Tablet | 24,397 | 75.0% |
| No Computing Device | 333 | 1.0% |
| Total | 32,530 | 100.0% |
Internet Access in San Tan Valley
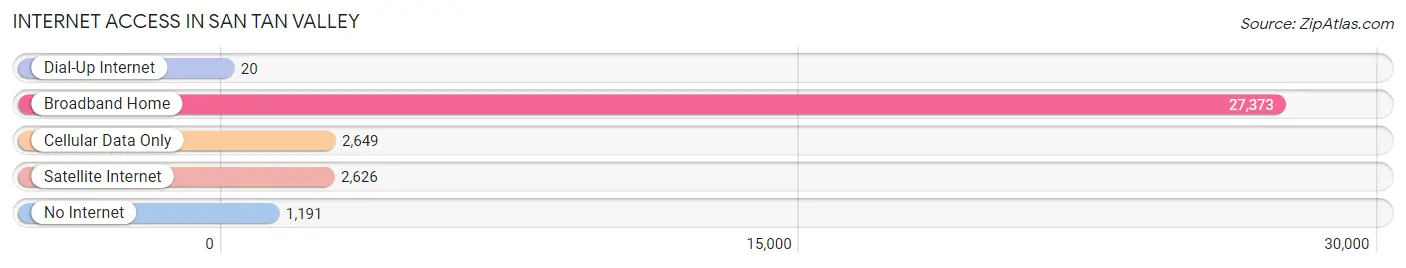
| Internet Type | # Households | % Households |
| Dial-Up Internet | 20 | 0.1% |
| Broadband Home | 27,373 | 84.2% |
| Cellular Data Only | 2,649 | 8.1% |
| Satellite Internet | 2,626 | 8.1% |
| No Internet | 1,191 | 3.7% |
| Total | 32,530 | 100.0% |
San Tan Valley Summary
History
San Tan Valley is a census-designated place (CDP) located in Pinal County, Arizona. It is located in the southeastern part of the Phoenix metropolitan area. The area was originally inhabited by the Hohokam people, who were a Native American tribe that lived in the area from around 300 BC to 1450 AD. The area was then settled by ranchers in the late 1800s. The area was known as Queen Creek until 2009, when it was officially renamed San Tan Valley.
Geography
San Tan Valley is located in the southeastern part of the Phoenix metropolitan area. It is bordered by Queen Creek to the north, Florence to the east, Apache Junction to the south, and the Gila River Indian Community to the west. The area is located in the Sonoran Desert and has an elevation of 1,400 feet. The area has a hot desert climate with hot summers and mild winters.
Economy
San Tan Valley has a diverse economy that is largely based on retail, healthcare, and manufacturing. The area is home to several large employers, including Banner Health, Walmart, and Amazon. The area also has a growing technology sector, with several tech companies located in the area. Additionally, the area is home to several golf courses, which attract tourists from around the region.
Demographics
As of the 2010 census, San Tan Valley had a population of 81,321. The population is largely made up of White (63.2%), Hispanic or Latino (25.2%), and Native American (3.2%) individuals. The median household income in the area is $60,945, and the median age is 33. The area is largely made up of families, with the majority of households having children under the age of 18. The area is also home to a large number of veterans, with 8.3% of the population having served in the military.
Common Questions
What is Per Capita Income in San Tan Valley?
Per Capita income in San Tan Valley is $33,019.
What is the Median Family Income in San Tan Valley?
Median Family Income in San Tan Valley is $91,590.
What is the Median Household income in San Tan Valley?
Median Household Income in San Tan Valley is $88,466.
What is Income or Wage Gap in San Tan Valley?
Income or Wage Gap in San Tan Valley is 33.3%.
Women in San Tan Valley earn 66.7 cents for every dollar earned by a man.
What is Family Income Deficit in San Tan Valley?
Family Income Deficit in San Tan Valley is $12,126.
Families that are below poverty line in San Tan Valley earn $12,126 less on average than the poverty threshold level.
What is Inequality or Gini Index in San Tan Valley?
Inequality or Gini Index in San Tan Valley is 0.35.
What is the Total Population of San Tan Valley?
Total Population of San Tan Valley is 101,207.
What is the Total Male Population of San Tan Valley?
Total Male Population of San Tan Valley is 49,294.
What is the Total Female Population of San Tan Valley?
Total Female Population of San Tan Valley is 51,913.
What is the Ratio of Males per 100 Females in San Tan Valley?
There are 94.96 Males per 100 Females in San Tan Valley.
What is the Ratio of Females per 100 Males in San Tan Valley?
There are 105.31 Females per 100 Males in San Tan Valley.
What is the Median Population Age in San Tan Valley?
Median Population Age in San Tan Valley is 34.7 Years.
What is the Average Family Size in San Tan Valley
Average Family Size in San Tan Valley is 3.4 People.
What is the Average Household Size in San Tan Valley
Average Household Size in San Tan Valley is 3.1 People.
How Large is the Labor Force in San Tan Valley?
There are 50,564 People in the Labor Forcein in San Tan Valley.
What is the Percentage of People in the Labor Force in San Tan Valley?
66.8% of People are in the Labor Force in San Tan Valley.
What is the Unemployment Rate in San Tan Valley?
Unemployment Rate in San Tan Valley is 4.5%.