Oro Valley, AZ Map & Demographics
Oro Valley Map
Oro Valley Overview
$58,527
PER CAPITA INCOME
$119,317
AVG FAMILY INCOME
$101,394
AVG HOUSEHOLD INCOME
35.6%
WAGE / INCOME GAP [ % ]
64.4¢/ $1
WAGE / INCOME GAP [ $ ]
$12,482
FAMILY INCOME DEFICIT
0.44
INEQUALITY / GINI INDEX
47,053
TOTAL POPULATION
22,203
MALE POPULATION
24,850
FEMALE POPULATION
89.35
MALES / 100 FEMALES
111.92
FEMALES / 100 MALES
54.5
MEDIAN AGE
2.7
AVG FAMILY SIZE
2.2
AVG HOUSEHOLD SIZE
19,213
LABOR FORCE [ PEOPLE ]
48.0%
PERCENT IN LABOR FORCE
2.9%
UNEMPLOYMENT RATE
Oro Valley Area Codes
Income in Oro Valley
Income Overview in Oro Valley
Per Capita Income in Oro Valley is $58,527, while median incomes of families and households are $119,317 and $101,394 respectively.
| Characteristic | Number | Measure |
| Per Capita Income | 47,053 | $58,527 |
| Median Family Income | 14,126 | $119,317 |
| Mean Family Income | 14,126 | $150,259 |
| Median Household Income | 21,019 | $101,394 |
| Mean Household Income | 21,019 | $131,530 |
| Income Deficit | 14,126 | $12,482 |
| Wage / Income Gap (%) | 47,053 | 35.65% |
| Wage / Income Gap ($) | 47,053 | 64.35¢ per $1 |
| Gini / Inequality Index | 47,053 | 0.44 |
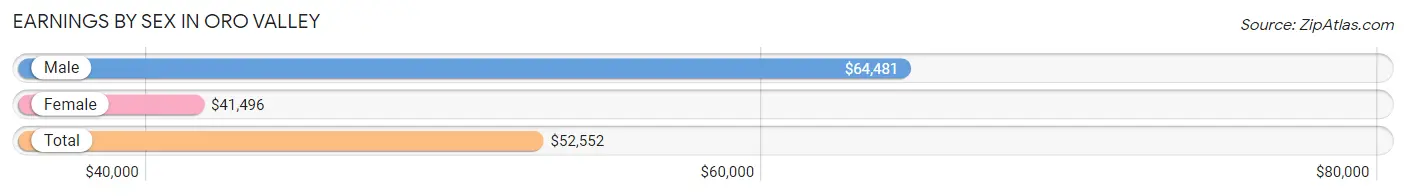
Earnings by Sex in Oro Valley
Average Earnings in Oro Valley are $52,552, $64,481 for men and $41,496 for women, a difference of 35.6%.
| Sex | Number | Average Earnings |
| Male | 10,984 (52.8%) | $64,481 |
| Female | 9,801 (47.1%) | $41,496 |
| Total | 20,785 (100.0%) | $52,552 |
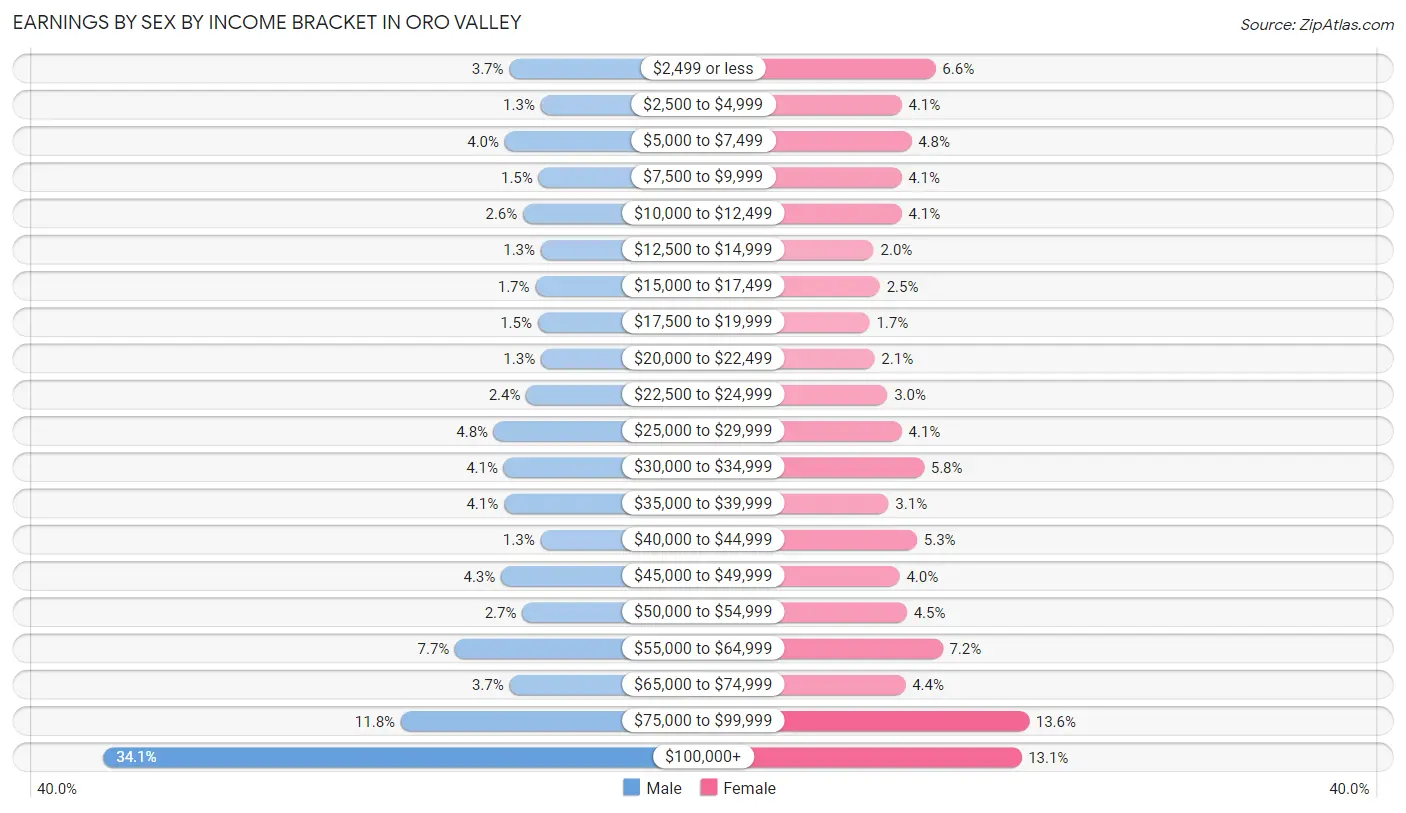
Earnings by Sex by Income Bracket in Oro Valley
The most common earnings brackets in Oro Valley are $100,000+ for men (3,745 | 34.1%) and $75,000 to $99,999 for women (1,337 | 13.6%).
| Income | Male | Female |
| $2,499 or less | 403 (3.7%) | 651 (6.6%) |
| $2,500 to $4,999 | 145 (1.3%) | 402 (4.1%) |
| $5,000 to $7,499 | 441 (4.0%) | 473 (4.8%) |
| $7,500 to $9,999 | 163 (1.5%) | 400 (4.1%) |
| $10,000 to $12,499 | 290 (2.6%) | 402 (4.1%) |
| $12,500 to $14,999 | 144 (1.3%) | 197 (2.0%) |
| $15,000 to $17,499 | 189 (1.7%) | 242 (2.5%) |
| $17,500 to $19,999 | 169 (1.5%) | 167 (1.7%) |
| $20,000 to $22,499 | 143 (1.3%) | 203 (2.1%) |
| $22,500 to $24,999 | 264 (2.4%) | 297 (3.0%) |
| $25,000 to $29,999 | 530 (4.8%) | 403 (4.1%) |
| $30,000 to $34,999 | 449 (4.1%) | 566 (5.8%) |
| $35,000 to $39,999 | 447 (4.1%) | 306 (3.1%) |
| $40,000 to $44,999 | 147 (1.3%) | 515 (5.2%) |
| $45,000 to $49,999 | 471 (4.3%) | 387 (4.0%) |
| $50,000 to $54,999 | 297 (2.7%) | 440 (4.5%) |
| $55,000 to $64,999 | 849 (7.7%) | 703 (7.2%) |
| $65,000 to $74,999 | 402 (3.7%) | 429 (4.4%) |
| $75,000 to $99,999 | 1,296 (11.8%) | 1,337 (13.6%) |
| $100,000+ | 3,745 (34.1%) | 1,281 (13.1%) |
| Total | 10,984 (100.0%) | 9,801 (100.0%) |
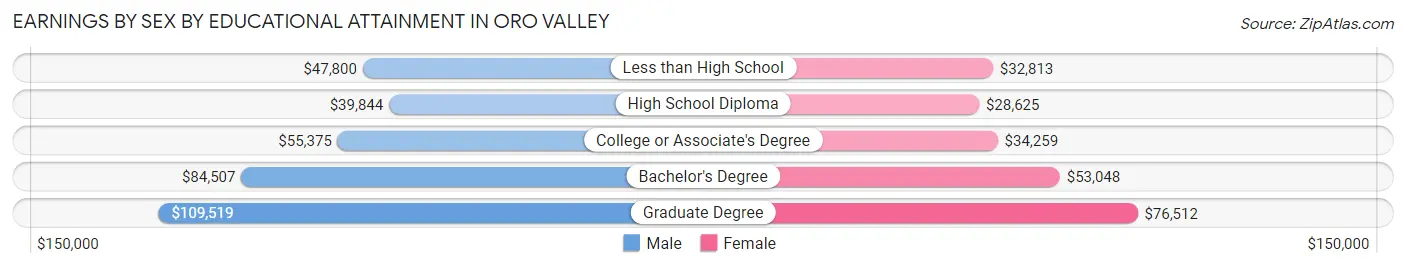
Earnings by Sex by Educational Attainment in Oro Valley
Average earnings in Oro Valley are $74,849 for men and $48,196 for women, a difference of 35.6%. Men with an educational attainment of graduate degree enjoy the highest average annual earnings of $109,519, while those with high school diploma education earn the least with $39,844. Women with an educational attainment of graduate degree earn the most with the average annual earnings of $76,512, while those with high school diploma education have the smallest earnings of $28,625.
| Educational Attainment | Male Income | Female Income |
| Less than High School | $47,800 | $32,813 |
| High School Diploma | $39,844 | $28,625 |
| College or Associate's Degree | $55,375 | $34,259 |
| Bachelor's Degree | $84,507 | $53,048 |
| Graduate Degree | $109,519 | $76,512 |
| Total | $74,849 | $48,196 |
Family Income in Oro Valley
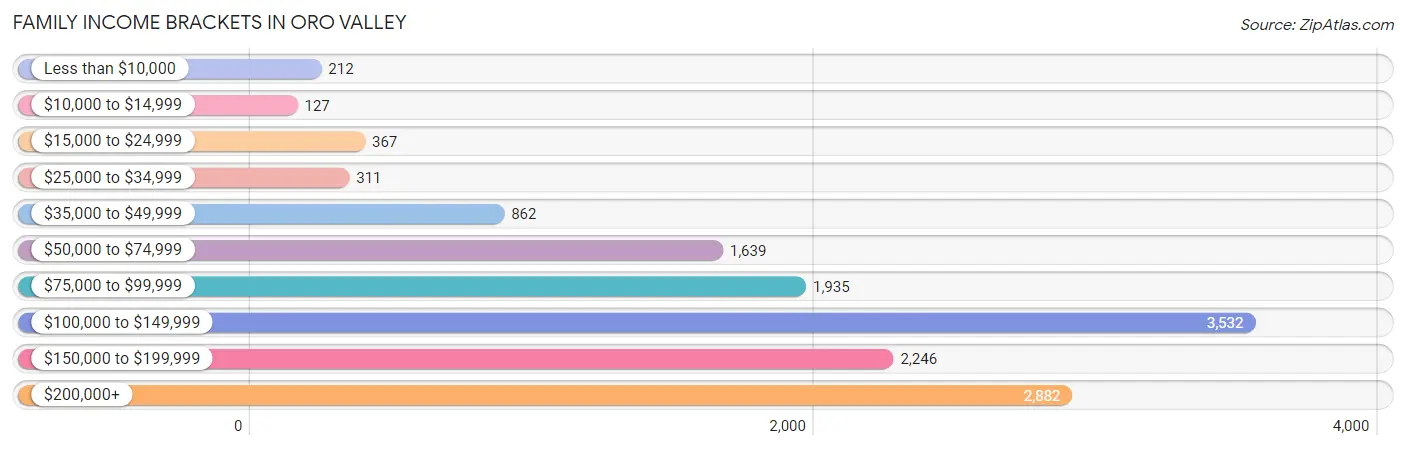
Family Income Brackets in Oro Valley
According to the Oro Valley family income data, there are 3,532 families falling into the $100,000 to $149,999 income range, which is the most common income bracket and makes up 25.0% of all families. Conversely, the $10,000 to $14,999 income bracket is the least frequent group with only 127 families (0.9%) belonging to this category.
| Income Bracket | # Families | % Families |
| Less than $10,000 | 212 | 1.5% |
| $10,000 to $14,999 | 127 | 0.9% |
| $15,000 to $24,999 | 367 | 2.6% |
| $25,000 to $34,999 | 311 | 2.2% |
| $35,000 to $49,999 | 862 | 6.1% |
| $50,000 to $74,999 | 1,639 | 11.6% |
| $75,000 to $99,999 | 1,935 | 13.7% |
| $100,000 to $149,999 | 3,532 | 25.0% |
| $150,000 to $199,999 | 2,246 | 15.9% |
| $200,000+ | 2,882 | 20.4% |
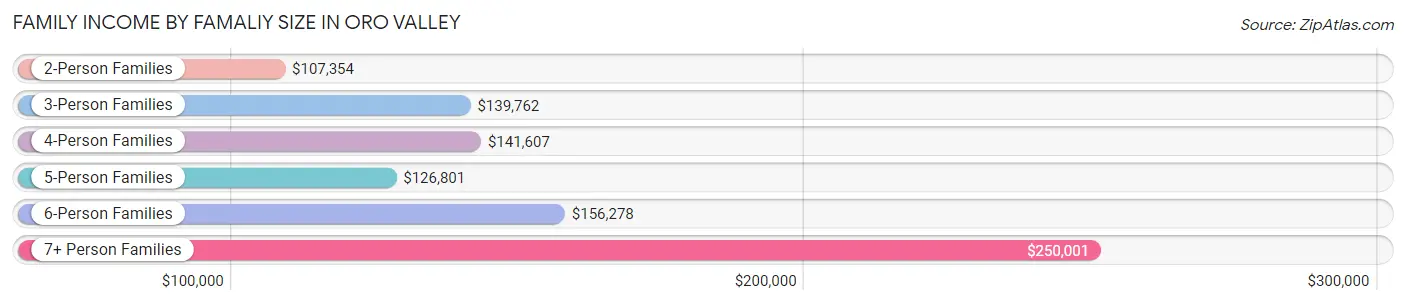
Family Income by Famaliy Size in Oro Valley
7+ person families (74 | 0.5%) account for the highest median family income in Oro Valley with $250,001 per family, while 2-person families (9,082 | 64.3%) have the highest median income of $53,677 per family member.
| Income Bracket | # Families | Median Income |
| 2-Person Families | 9,082 (64.3%) | $107,354 |
| 3-Person Families | 1,998 (14.1%) | $139,762 |
| 4-Person Families | 1,913 (13.5%) | $141,607 |
| 5-Person Families | 785 (5.6%) | $126,801 |
| 6-Person Families | 274 (1.9%) | $156,278 |
| 7+ Person Families | 74 (0.5%) | $250,001 |
| Total | 14,126 (100.0%) | $119,317 |
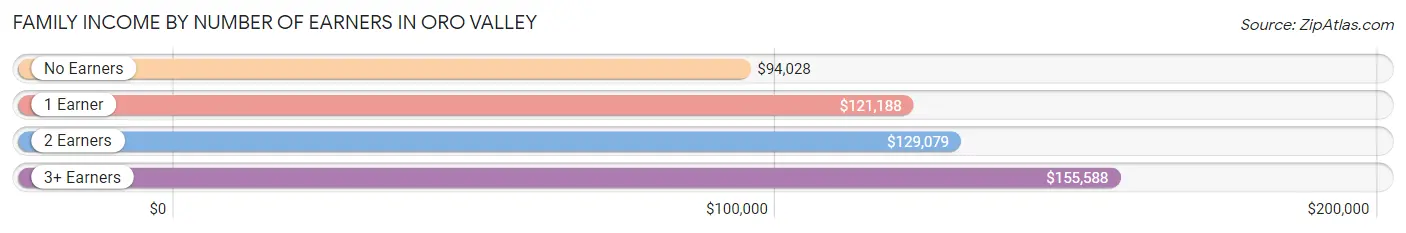
Family Income by Number of Earners in Oro Valley
The median family income in Oro Valley is $119,317, with families comprising 3+ earners (912) having the highest median family income of $155,588, while families with no earners (4,428) have the lowest median family income of $94,028, accounting for 6.5% and 31.4% of families, respectively.
| Number of Earners | # Families | Median Income |
| No Earners | 4,428 (31.4%) | $94,028 |
| 1 Earner | 4,536 (32.1%) | $121,188 |
| 2 Earners | 4,250 (30.1%) | $129,079 |
| 3+ Earners | 912 (6.5%) | $155,588 |
| Total | 14,126 (100.0%) | $119,317 |
Household Income in Oro Valley
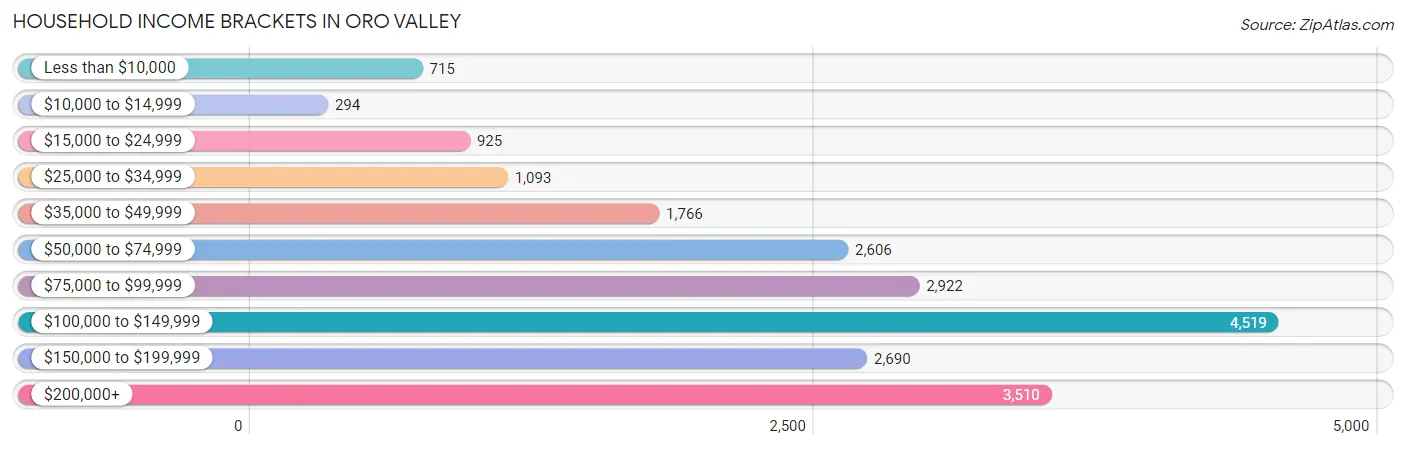
Household Income Brackets in Oro Valley
With 4,519 households falling in the category, the $100,000 to $149,999 income range is the most frequent in Oro Valley, accounting for 21.5% of all households. In contrast, only 294 households (1.4%) fall into the $10,000 to $14,999 income bracket, making it the least populous group.
| Income Bracket | # Households | % Households |
| Less than $10,000 | 715 | 3.4% |
| $10,000 to $14,999 | 294 | 1.4% |
| $15,000 to $24,999 | 925 | 4.4% |
| $25,000 to $34,999 | 1,093 | 5.2% |
| $35,000 to $49,999 | 1,766 | 8.4% |
| $50,000 to $74,999 | 2,606 | 12.4% |
| $75,000 to $99,999 | 2,922 | 13.9% |
| $100,000 to $149,999 | 4,519 | 21.5% |
| $150,000 to $199,999 | 2,690 | 12.8% |
| $200,000+ | 3,510 | 16.7% |
Household Income by Householder Age in Oro Valley
The median household income in Oro Valley is $101,394, with the highest median household income of $129,700 found in the 45 to 64 years age bracket for the primary householder. A total of 6,132 households (29.2%) fall into this category. Meanwhile, the 15 to 24 years age bracket for the primary householder has the lowest median household income of $55,500, with 596 households (2.8%) in this group.
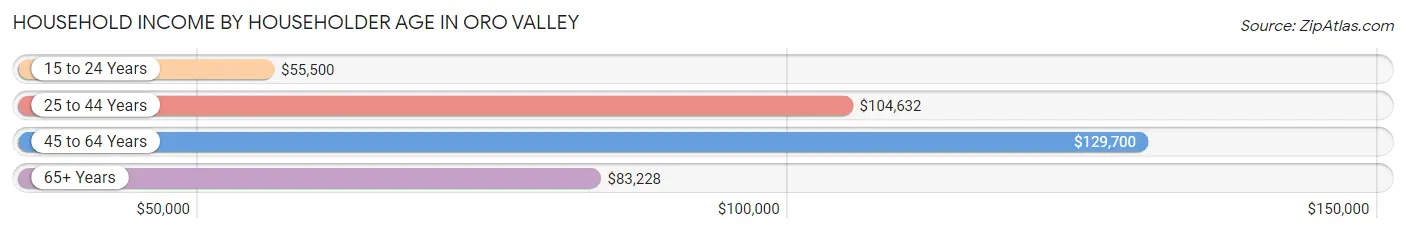
| Income Bracket | # Households | Median Income |
| 15 to 24 Years | 596 (2.8%) | $55,500 |
| 25 to 44 Years | 4,025 (19.2%) | $104,632 |
| 45 to 64 Years | 6,132 (29.2%) | $129,700 |
| 65+ Years | 10,266 (48.8%) | $83,228 |
| Total | 21,019 (100.0%) | $101,394 |
Poverty in Oro Valley
Income Below Poverty by Sex and Age in Oro Valley
With 5.4% poverty level for males and 8.2% for females among the residents of Oro Valley, 12 to 14 year old males and under 5 year old females are the most vulnerable to poverty, with 107 males (12.2%) and 220 females (25.9%) in their respective age groups living below the poverty level.
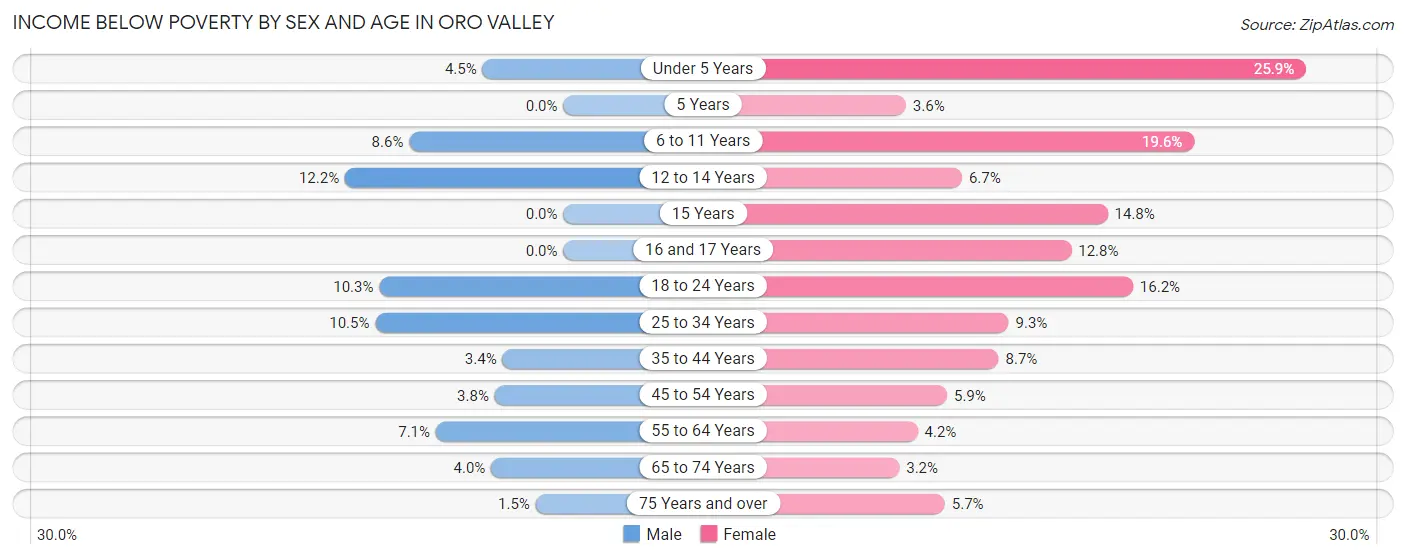
| Age Bracket | Male | Female |
| Under 5 Years | 25 (4.5%) | 220 (25.9%) |
| 5 Years | 0 (0.0%) | 9 (3.6%) |
| 6 to 11 Years | 114 (8.6%) | 338 (19.6%) |
| 12 to 14 Years | 107 (12.2%) | 53 (6.7%) |
| 15 Years | 0 (0.0%) | 37 (14.8%) |
| 16 and 17 Years | 0 (0.0%) | 85 (12.8%) |
| 18 to 24 Years | 124 (10.2%) | 251 (16.2%) |
| 25 to 34 Years | 196 (10.5%) | 162 (9.3%) |
| 35 to 44 Years | 74 (3.4%) | 191 (8.7%) |
| 45 to 54 Years | 86 (3.8%) | 148 (5.9%) |
| 55 to 64 Years | 227 (7.1%) | 149 (4.2%) |
| 65 to 74 Years | 181 (4.0%) | 154 (3.2%) |
| 75 Years and over | 52 (1.5%) | 217 (5.7%) |
| Total | 1,186 (5.4%) | 2,014 (8.2%) |
Income Above Poverty by Sex and Age in Oro Valley
According to the poverty statistics in Oro Valley, males aged 5 years and females aged 65 to 74 years are the age groups that are most secure financially, with 100.0% of males and 96.8% of females in these age groups living above the poverty line.
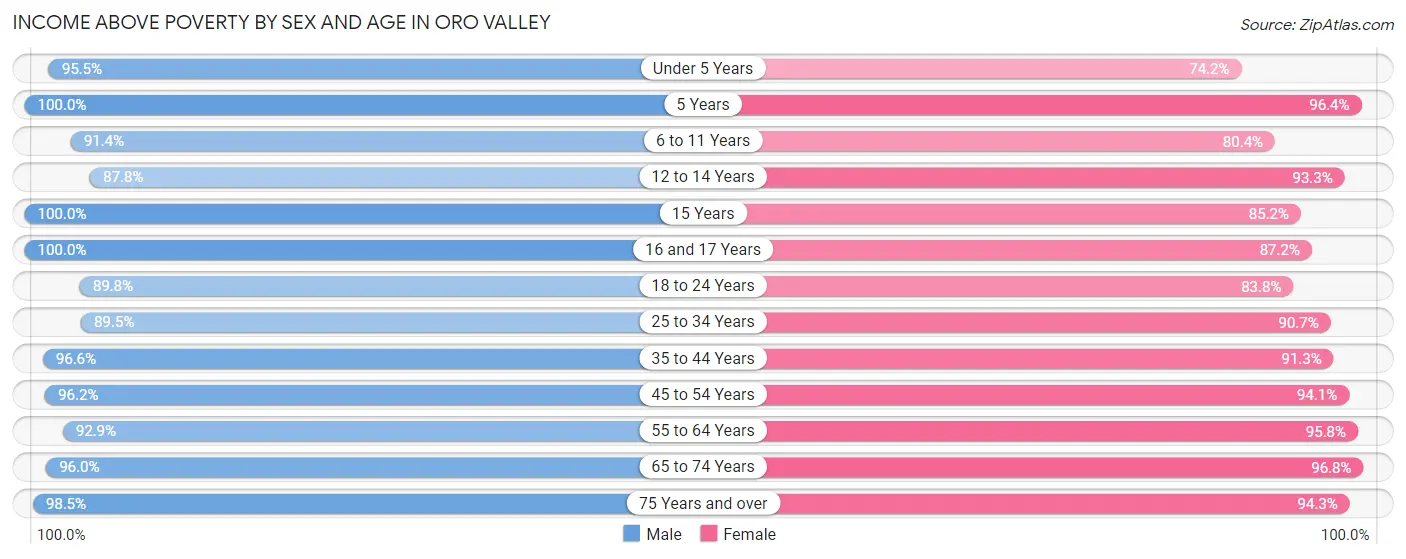
| Age Bracket | Male | Female |
| Under 5 Years | 530 (95.5%) | 631 (74.2%) |
| 5 Years | 135 (100.0%) | 243 (96.4%) |
| 6 to 11 Years | 1,215 (91.4%) | 1,385 (80.4%) |
| 12 to 14 Years | 773 (87.8%) | 739 (93.3%) |
| 15 Years | 169 (100.0%) | 213 (85.2%) |
| 16 and 17 Years | 477 (100.0%) | 580 (87.2%) |
| 18 to 24 Years | 1,086 (89.7%) | 1,297 (83.8%) |
| 25 to 34 Years | 1,676 (89.5%) | 1,582 (90.7%) |
| 35 to 44 Years | 2,112 (96.6%) | 1,997 (91.3%) |
| 45 to 54 Years | 2,165 (96.2%) | 2,378 (94.1%) |
| 55 to 64 Years | 2,970 (92.9%) | 3,381 (95.8%) |
| 65 to 74 Years | 4,318 (96.0%) | 4,655 (96.8%) |
| 75 Years and over | 3,325 (98.5%) | 3,565 (94.3%) |
| Total | 20,951 (94.6%) | 22,646 (91.8%) |
Income Below Poverty Among Married-Couple Families in Oro Valley
The poverty statistics for married-couple families in Oro Valley show that 2.9% or 355 of the total 12,302 families live below the poverty line. Families with 3 or 4 children have the highest poverty rate of 14.0%, comprising of 110 families. On the other hand, families with 5 or more children have the lowest poverty rate of 0.0%, which includes 0 families.
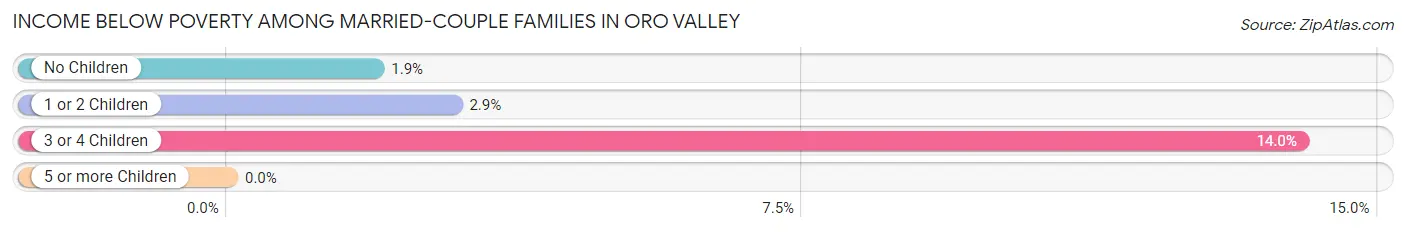
| Children | Above Poverty | Below Poverty |
| No Children | 8,799 (98.1%) | 171 (1.9%) |
| 1 or 2 Children | 2,454 (97.1%) | 74 (2.9%) |
| 3 or 4 Children | 677 (86.0%) | 110 (14.0%) |
| 5 or more Children | 17 (100.0%) | 0 (0.0%) |
| Total | 11,947 (97.1%) | 355 (2.9%) |
Income Below Poverty Among Single-Parent Households in Oro Valley
According to the poverty data in Oro Valley, 8.6% or 53 single-father households and 12.0% or 145 single-mother households are living below the poverty line. Among single-father households, those with 1 or 2 children have the highest poverty rate, with 53 households (13.9%) experiencing poverty. Likewise, among single-mother households, those with 3 or 4 children have the highest poverty rate, with 85 households (61.2%) falling below the poverty line.
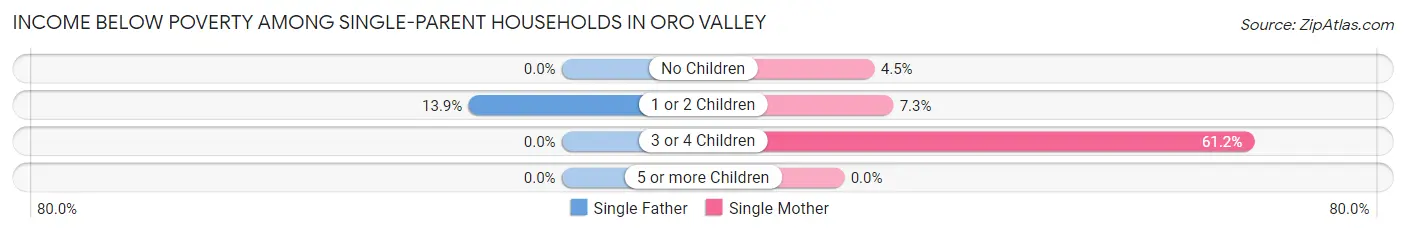
| Children | Single Father | Single Mother |
| No Children | 0 (0.0%) | 29 (4.5%) |
| 1 or 2 Children | 53 (13.9%) | 31 (7.3%) |
| 3 or 4 Children | 0 (0.0%) | 85 (61.2%) |
| 5 or more Children | 0 (0.0%) | 0 (0.0%) |
| Total | 53 (8.6%) | 145 (12.0%) |
Income Below Poverty Among Married-Couple vs Single-Parent Households in Oro Valley
The poverty data for Oro Valley shows that 355 of the married-couple family households (2.9%) and 198 of the single-parent households (10.9%) are living below the poverty level. Within the married-couple family households, those with 3 or 4 children have the highest poverty rate, with 110 households (14.0%) falling below the poverty line. Among the single-parent households, those with 3 or 4 children have the highest poverty rate, with 85 household (57.4%) living below poverty.
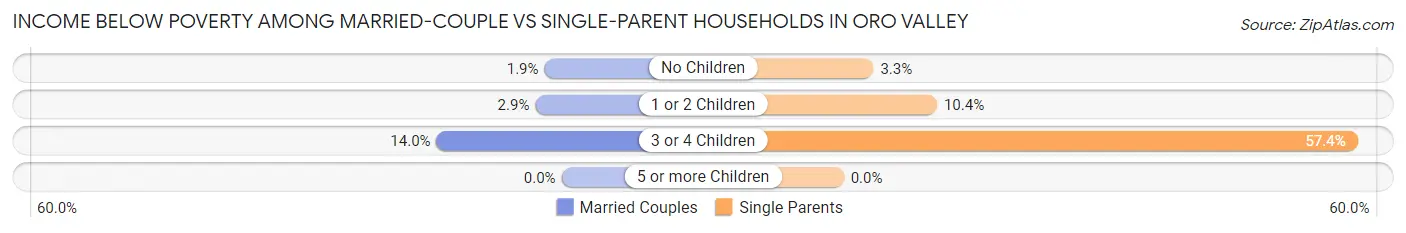
| Children | Married-Couple Families | Single-Parent Households |
| No Children | 171 (1.9%) | 29 (3.3%) |
| 1 or 2 Children | 74 (2.9%) | 84 (10.4%) |
| 3 or 4 Children | 110 (14.0%) | 85 (57.4%) |
| 5 or more Children | 0 (0.0%) | 0 (0.0%) |
| Total | 355 (2.9%) | 198 (10.9%) |
Race in Oro Valley
The most populous races in Oro Valley are White / Caucasian (38,473 | 81.8%), Hispanic or Latino (6,793 | 14.4%), and Two or more Races (4,334 | 9.2%).
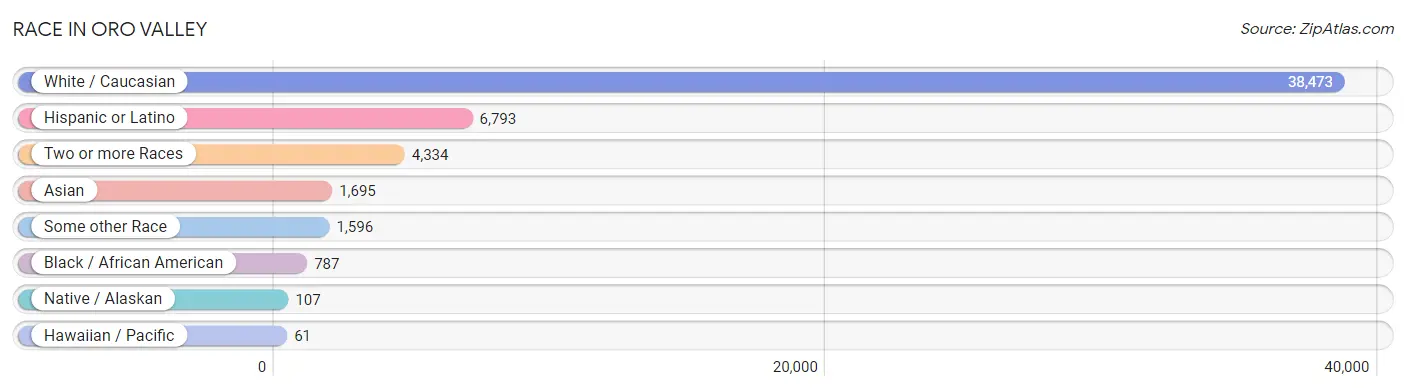
| Race | # Population | % Population |
| Asian | 1,695 | 3.6% |
| Black / African American | 787 | 1.7% |
| Hawaiian / Pacific | 61 | 0.1% |
| Hispanic or Latino | 6,793 | 14.4% |
| Native / Alaskan | 107 | 0.2% |
| White / Caucasian | 38,473 | 81.8% |
| Two or more Races | 4,334 | 9.2% |
| Some other Race | 1,596 | 3.4% |
| Total | 47,053 | 100.0% |
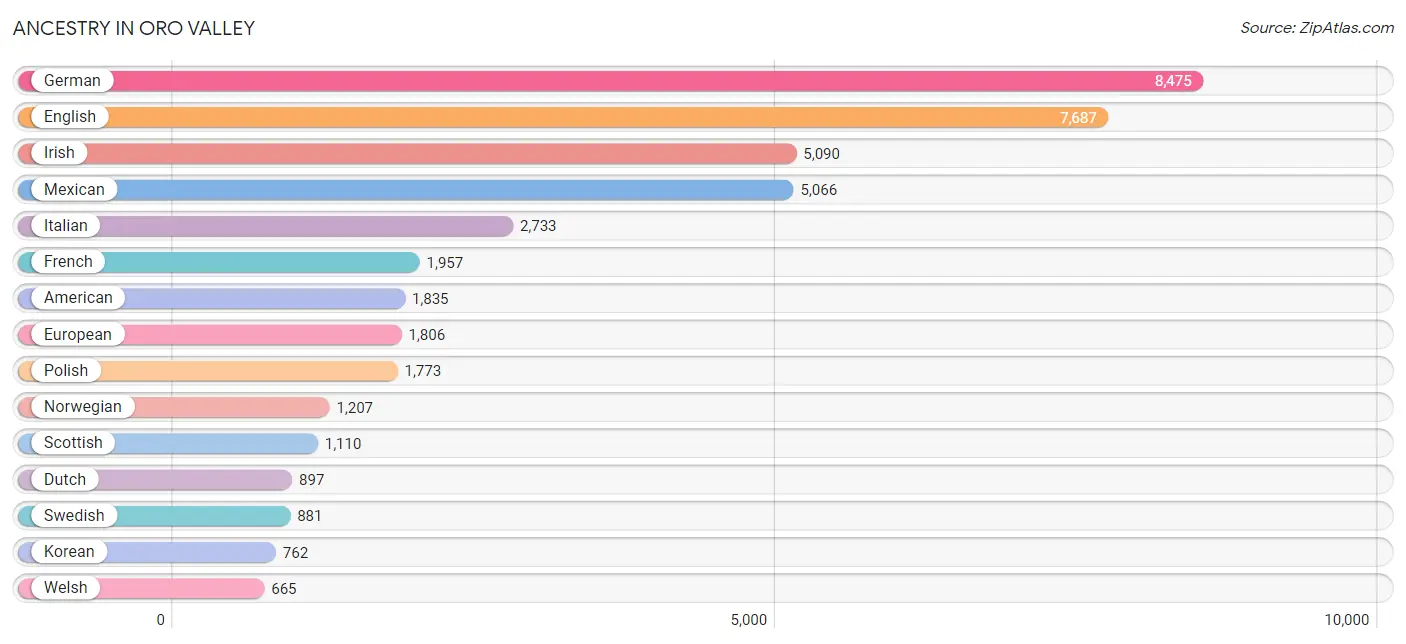
Ancestry in Oro Valley
The most populous ancestries reported in Oro Valley are German (8,475 | 18.0%), English (7,687 | 16.3%), Irish (5,090 | 10.8%), Mexican (5,066 | 10.8%), and Italian (2,733 | 5.8%), together accounting for 61.8% of all Oro Valley residents.
| Ancestry | # Population | % Population |
| African | 28 | 0.1% |
| American | 1,835 | 3.9% |
| Arab | 225 | 0.5% |
| Argentinean | 8 | 0.0% |
| Armenian | 33 | 0.1% |
| Austrian | 82 | 0.2% |
| Basque | 92 | 0.2% |
| Belgian | 44 | 0.1% |
| Bhutanese | 567 | 1.2% |
| Brazilian | 10 | 0.0% |
| British | 580 | 1.2% |
| Bulgarian | 59 | 0.1% |
| Burmese | 225 | 0.5% |
| Cajun | 11 | 0.0% |
| Canadian | 163 | 0.4% |
| Celtic | 10 | 0.0% |
| Central American | 119 | 0.3% |
| Central American Indian | 46 | 0.1% |
| Cherokee | 249 | 0.5% |
| Chickasaw | 12 | 0.0% |
| Chilean | 19 | 0.0% |
| Chippewa | 18 | 0.0% |
| Colombian | 60 | 0.1% |
| Costa Rican | 26 | 0.1% |
| Croatian | 40 | 0.1% |
| Czech | 195 | 0.4% |
| Czechoslovakian | 149 | 0.3% |
| Danish | 290 | 0.6% |
| Delaware | 10 | 0.0% |
| Dutch | 897 | 1.9% |
| Eastern European | 143 | 0.3% |
| English | 7,687 | 16.3% |
| European | 1,806 | 3.8% |
| Filipino | 83 | 0.2% |
| Finnish | 96 | 0.2% |
| French | 1,957 | 4.2% |
| French Canadian | 287 | 0.6% |
| German | 8,475 | 18.0% |
| Greek | 393 | 0.8% |
| Guatemalan | 81 | 0.2% |
| Guyanese | 94 | 0.2% |
| Haitian | 335 | 0.7% |
| Hungarian | 562 | 1.2% |
| Indian (Asian) | 346 | 0.7% |
| Iranian | 117 | 0.3% |
| Irish | 5,090 | 10.8% |
| Iroquois | 44 | 0.1% |
| Israeli | 27 | 0.1% |
| Italian | 2,733 | 5.8% |
| Jordanian | 15 | 0.0% |
| Korean | 762 | 1.6% |
| Laotian | 51 | 0.1% |
| Lebanese | 29 | 0.1% |
| Lithuanian | 209 | 0.4% |
| Luxembourger | 30 | 0.1% |
| Menominee | 12 | 0.0% |
| Mexican | 5,066 | 10.8% |
| Mexican American Indian | 14 | 0.0% |
| Native Hawaiian | 129 | 0.3% |
| Navajo | 6 | 0.0% |
| Nigerian | 42 | 0.1% |
| Northern European | 221 | 0.5% |
| Norwegian | 1,207 | 2.6% |
| Pakistani | 26 | 0.1% |
| Palestinian | 9 | 0.0% |
| Paraguayan | 38 | 0.1% |
| Pennsylvania German | 36 | 0.1% |
| Peruvian | 99 | 0.2% |
| Polish | 1,773 | 3.8% |
| Portuguese | 178 | 0.4% |
| Puerto Rican | 584 | 1.2% |
| Romanian | 99 | 0.2% |
| Russian | 491 | 1.0% |
| Salvadoran | 12 | 0.0% |
| Scandinavian | 346 | 0.7% |
| Scotch-Irish | 654 | 1.4% |
| Scottish | 1,110 | 2.4% |
| Seminole | 6 | 0.0% |
| Serbian | 22 | 0.1% |
| Sioux | 25 | 0.1% |
| Slavic | 30 | 0.1% |
| Slovak | 171 | 0.4% |
| Slovene | 59 | 0.1% |
| South American | 224 | 0.5% |
| Spaniard | 270 | 0.6% |
| Spanish | 240 | 0.5% |
| Sri Lankan | 126 | 0.3% |
| Subsaharan African | 86 | 0.2% |
| Swedish | 881 | 1.9% |
| Swiss | 140 | 0.3% |
| Syrian | 15 | 0.0% |
| Thai | 500 | 1.1% |
| Tohono O'Odham | 17 | 0.0% |
| Turkish | 26 | 0.1% |
| Ukrainian | 248 | 0.5% |
| Vietnamese | 203 | 0.4% |
| Welsh | 665 | 1.4% |
| Yugoslavian | 46 | 0.1% |
| Zimbabwean | 16 | 0.0% | View All 99 Rows |
Immigrants in Oro Valley
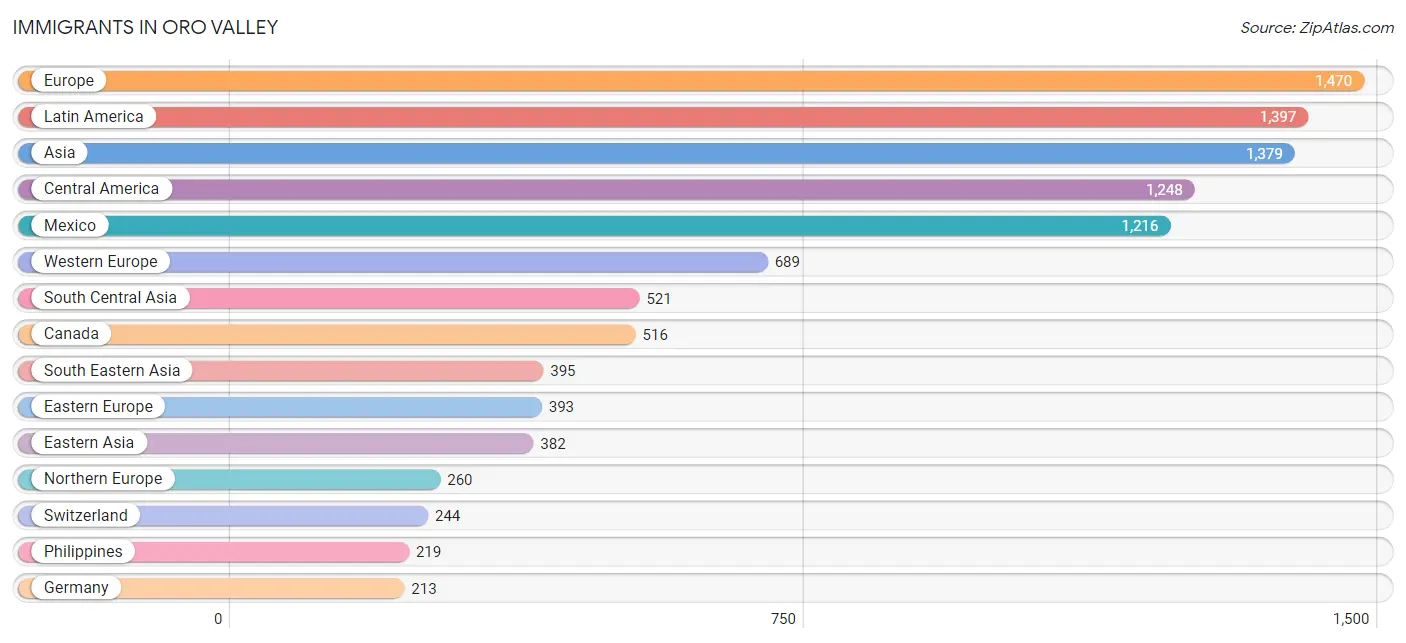
The most numerous immigrant groups reported in Oro Valley came from Europe (1,470 | 3.1%), Latin America (1,397 | 3.0%), Asia (1,379 | 2.9%), Central America (1,248 | 2.6%), and Mexico (1,216 | 2.6%), together accounting for 14.2% of all Oro Valley residents.
| Immigration Origin | # Population | % Population |
| Africa | 148 | 0.3% |
| Argentina | 8 | 0.0% |
| Asia | 1,379 | 2.9% |
| Australia | 27 | 0.1% |
| Bangladesh | 143 | 0.3% |
| Belgium | 10 | 0.0% |
| Brazil | 19 | 0.0% |
| Bulgaria | 16 | 0.0% |
| Canada | 516 | 1.1% |
| Central America | 1,248 | 2.6% |
| Chile | 7 | 0.0% |
| China | 155 | 0.3% |
| Costa Rica | 26 | 0.1% |
| Croatia | 14 | 0.0% |
| Czechoslovakia | 42 | 0.1% |
| Eastern Africa | 31 | 0.1% |
| Eastern Asia | 382 | 0.8% |
| Eastern Europe | 393 | 0.8% |
| Ecuador | 6 | 0.0% |
| Egypt | 90 | 0.2% |
| El Salvador | 6 | 0.0% |
| England | 94 | 0.2% |
| Europe | 1,470 | 3.1% |
| France | 199 | 0.4% |
| Germany | 213 | 0.4% |
| Greece | 95 | 0.2% |
| Guyana | 30 | 0.1% |
| Hungary | 106 | 0.2% |
| India | 194 | 0.4% |
| Indonesia | 20 | 0.0% |
| Iran | 82 | 0.2% |
| Ireland | 35 | 0.1% |
| Israel | 27 | 0.1% |
| Italy | 33 | 0.1% |
| Japan | 122 | 0.3% |
| Jordan | 9 | 0.0% |
| Korea | 105 | 0.2% |
| Latin America | 1,397 | 3.0% |
| Latvia | 9 | 0.0% |
| Lebanon | 18 | 0.0% |
| Mexico | 1,216 | 2.6% |
| Netherlands | 23 | 0.1% |
| Northern Africa | 101 | 0.2% |
| Northern Europe | 260 | 0.5% |
| Oceania | 70 | 0.2% |
| Pakistan | 90 | 0.2% |
| Peru | 79 | 0.2% |
| Philippines | 219 | 0.5% |
| Poland | 75 | 0.2% |
| Romania | 25 | 0.1% |
| Russia | 89 | 0.2% |
| Singapore | 55 | 0.1% |
| South Africa | 16 | 0.0% |
| South America | 149 | 0.3% |
| South Central Asia | 521 | 1.1% |
| South Eastern Asia | 395 | 0.8% |
| Southern Europe | 128 | 0.3% |
| Switzerland | 244 | 0.5% |
| Taiwan | 62 | 0.1% |
| Thailand | 26 | 0.1% |
| Turkey | 12 | 0.0% |
| Ukraine | 17 | 0.0% |
| Uzbekistan | 12 | 0.0% |
| Vietnam | 75 | 0.2% |
| Western Asia | 66 | 0.1% |
| Western Europe | 689 | 1.5% |
| Zimbabwe | 31 | 0.1% | View All 67 Rows |
Sex and Age in Oro Valley
Sex and Age in Oro Valley
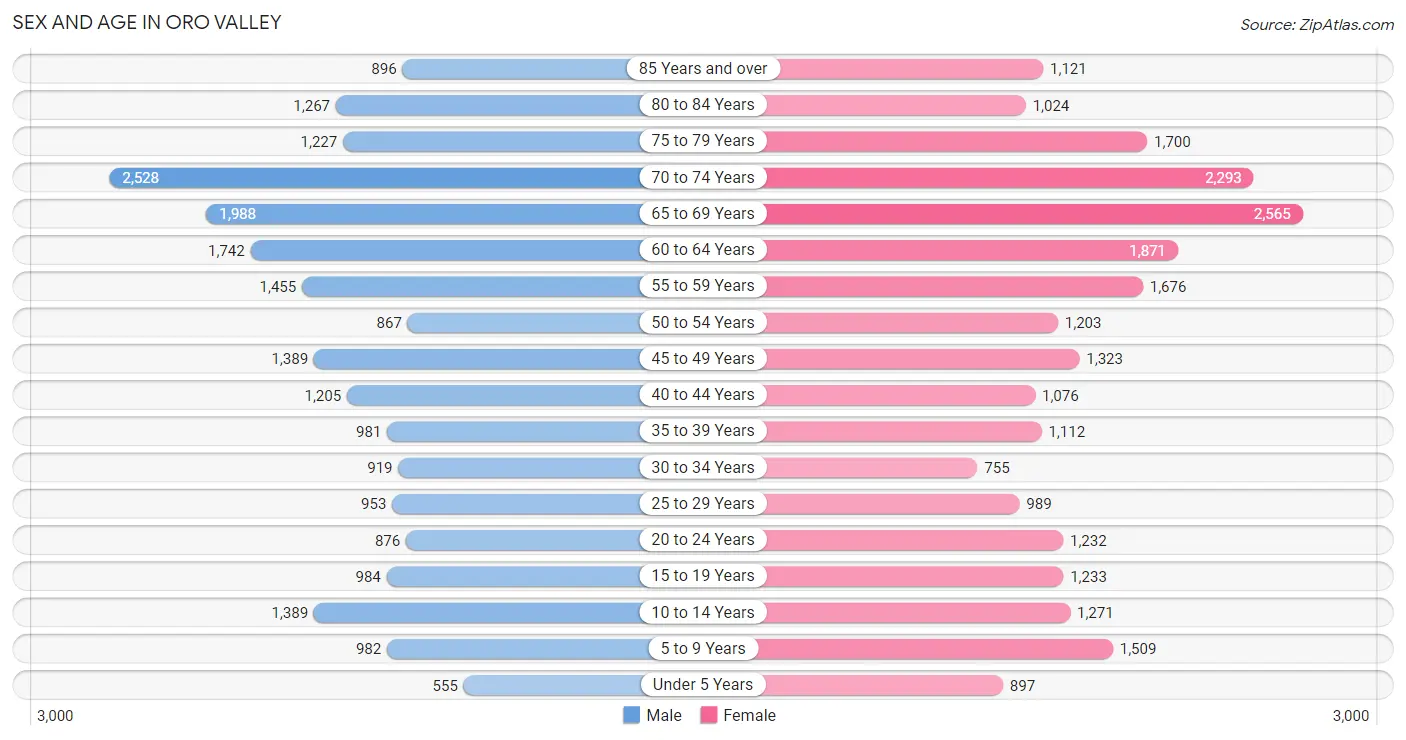
The most populous age groups in Oro Valley are 70 to 74 Years (2,528 | 11.4%) for men and 65 to 69 Years (2,565 | 10.3%) for women.
| Age Bracket | Male | Female |
| Under 5 Years | 555 (2.5%) | 897 (3.6%) |
| 5 to 9 Years | 982 (4.4%) | 1,509 (6.1%) |
| 10 to 14 Years | 1,389 (6.3%) | 1,271 (5.1%) |
| 15 to 19 Years | 984 (4.4%) | 1,233 (5.0%) |
| 20 to 24 Years | 876 (4.0%) | 1,232 (5.0%) |
| 25 to 29 Years | 953 (4.3%) | 989 (4.0%) |
| 30 to 34 Years | 919 (4.1%) | 755 (3.0%) |
| 35 to 39 Years | 981 (4.4%) | 1,112 (4.5%) |
| 40 to 44 Years | 1,205 (5.4%) | 1,076 (4.3%) |
| 45 to 49 Years | 1,389 (6.3%) | 1,323 (5.3%) |
| 50 to 54 Years | 867 (3.9%) | 1,203 (4.8%) |
| 55 to 59 Years | 1,455 (6.6%) | 1,676 (6.7%) |
| 60 to 64 Years | 1,742 (7.9%) | 1,871 (7.5%) |
| 65 to 69 Years | 1,988 (8.9%) | 2,565 (10.3%) |
| 70 to 74 Years | 2,528 (11.4%) | 2,293 (9.2%) |
| 75 to 79 Years | 1,227 (5.5%) | 1,700 (6.8%) |
| 80 to 84 Years | 1,267 (5.7%) | 1,024 (4.1%) |
| 85 Years and over | 896 (4.0%) | 1,121 (4.5%) |
| Total | 22,203 (100.0%) | 24,850 (100.0%) |
Families and Households in Oro Valley
Median Family Size in Oro Valley
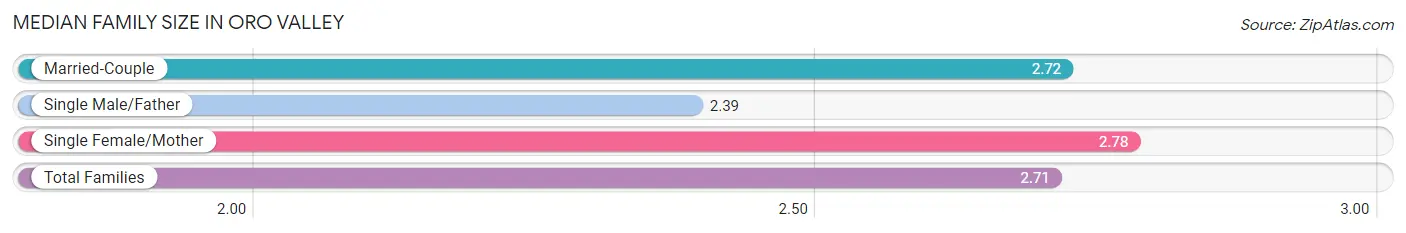
The median family size in Oro Valley is 2.71 persons per family, with single female/mother families (1,208 | 8.6%) accounting for the largest median family size of 2.78 persons per family. On the other hand, single male/father families (616 | 4.4%) represent the smallest median family size with 2.39 persons per family.
| Family Type | # Families | Family Size |
| Married-Couple | 12,302 (87.1%) | 2.72 |
| Single Male/Father | 616 (4.4%) | 2.39 |
| Single Female/Mother | 1,208 (8.6%) | 2.78 |
| Total Families | 14,126 (100.0%) | 2.71 |
Median Household Size in Oro Valley
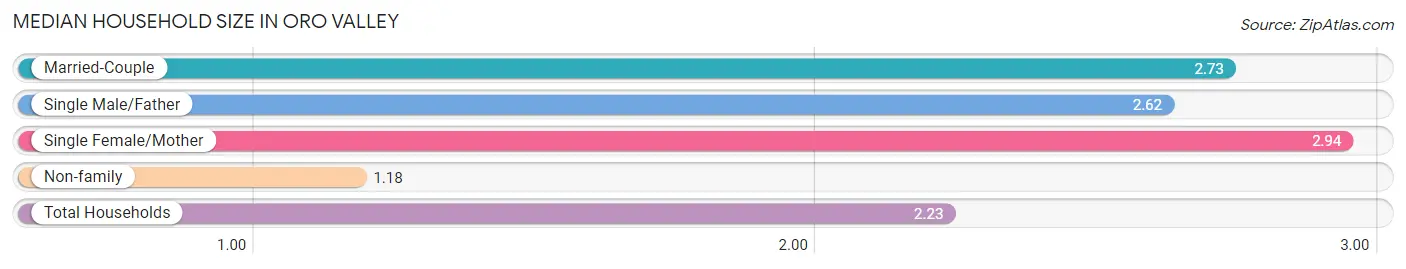
The median household size in Oro Valley is 2.23 persons per household, with single female/mother households (1,208 | 5.8%) accounting for the largest median household size of 2.94 persons per household. non-family households (6,893 | 32.8%) represent the smallest median household size with 1.18 persons per household.
| Household Type | # Households | Household Size |
| Married-Couple | 12,302 (58.5%) | 2.73 |
| Single Male/Father | 616 (2.9%) | 2.62 |
| Single Female/Mother | 1,208 (5.8%) | 2.94 |
| Non-family | 6,893 (32.8%) | 1.18 |
| Total Households | 21,019 (100.0%) | 2.23 |
Household Size by Marriage Status in Oro Valley
Out of a total of 21,019 households in Oro Valley, 14,126 (67.2%) are family households, while 6,893 (32.8%) are nonfamily households. The most numerous type of family households are 2-person households, comprising 8,873, and the most common type of nonfamily households are 1-person households, comprising 5,670.
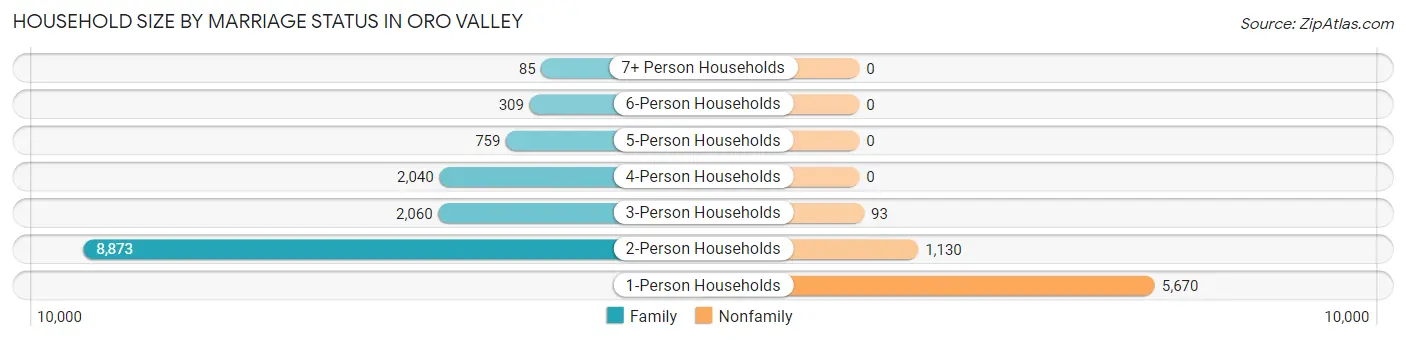
| Household Size | Family Households | Nonfamily Households |
| 1-Person Households | - | 5,670 (27.0%) |
| 2-Person Households | 8,873 (42.2%) | 1,130 (5.4%) |
| 3-Person Households | 2,060 (9.8%) | 93 (0.4%) |
| 4-Person Households | 2,040 (9.7%) | 0 (0.0%) |
| 5-Person Households | 759 (3.6%) | 0 (0.0%) |
| 6-Person Households | 309 (1.5%) | 0 (0.0%) |
| 7+ Person Households | 85 (0.4%) | 0 (0.0%) |
| Total | 14,126 (67.2%) | 6,893 (32.8%) |
Female Fertility in Oro Valley
Fertility by Age in Oro Valley
Average fertility rate in Oro Valley is 32.0 births per 1,000 women. Women in the age bracket of 20 to 34 years have the highest fertility rate with 64.0 births per 1,000 women. Women in the age bracket of 20 to 34 years acount for 73.8% of all women with births.
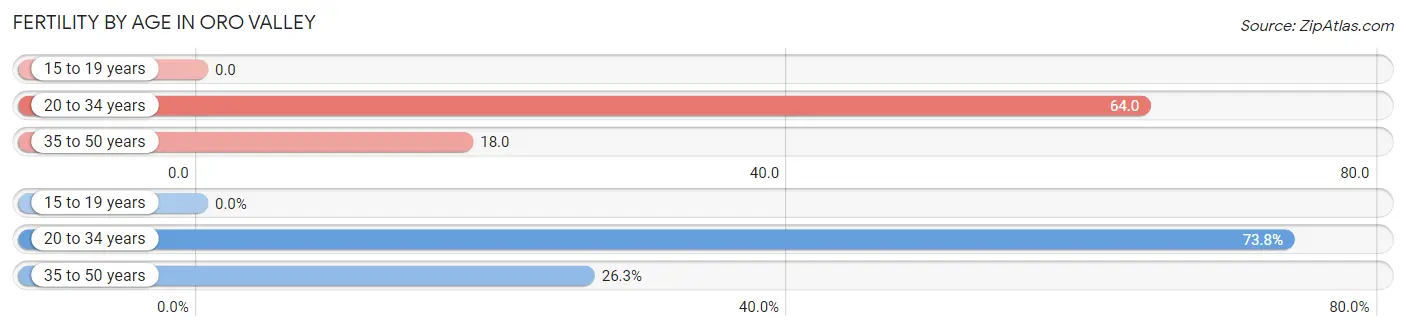
| Age Bracket | Women with Births | Births / 1,000 Women |
| 15 to 19 years | 0 (0.0%) | 0.0 |
| 20 to 34 years | 191 (73.8%) | 64.0 |
| 35 to 50 years | 68 (26.3%) | 18.0 |
| Total | 259 (100.0%) | 32.0 |
Fertility by Age by Marriage Status in Oro Valley
61.0% of women with births (259) in Oro Valley are married. The highest percentage of unmarried women with births falls into 20 to 34 years age bracket with 46.1% of them unmarried at the time of birth, while the lowest percentage of unmarried women with births belong to 35 to 50 years age bracket with 19.1% of them unmarried.
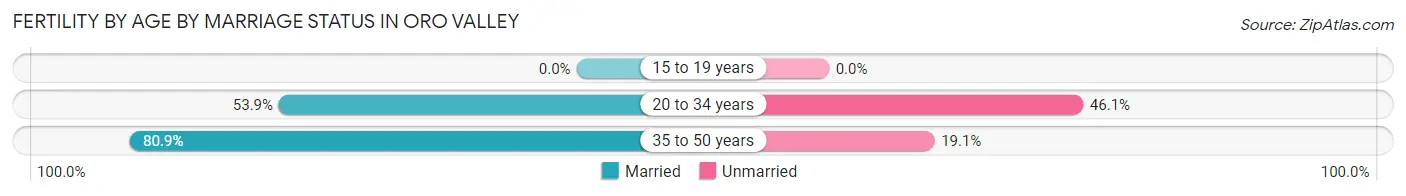
| Age Bracket | Married | Unmarried |
| 15 to 19 years | 0 (0.0%) | 0 (0.0%) |
| 20 to 34 years | 103 (53.9%) | 88 (46.1%) |
| 35 to 50 years | 55 (80.9%) | 13 (19.1%) |
| Total | 158 (61.0%) | 101 (39.0%) |
Fertility by Education in Oro Valley
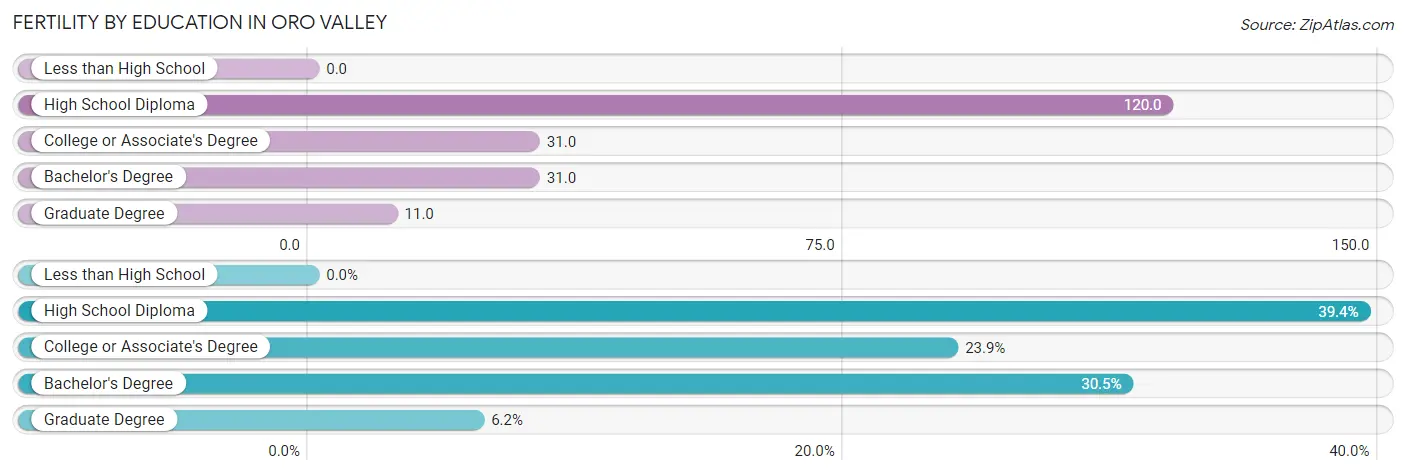
| Educational Attainment | Women with Births | Births / 1,000 Women |
| Less than High School | 0 (0.0%) | 0.0 |
| High School Diploma | 102 (39.4%) | 120.0 |
| College or Associate's Degree | 62 (23.9%) | 31.0 |
| Bachelor's Degree | 79 (30.5%) | 31.0 |
| Graduate Degree | 16 (6.2%) | 11.0 |
| Total | 259 (100.0%) | 32.0 |
Fertility by Education by Marriage Status in Oro Valley
39.0% of women with births in Oro Valley are unmarried. Women with the educational attainment of bachelor's degree are most likely to be married with 100.0% of them married at childbirth, while women with the educational attainment of high school diploma are least likely to be married with 79.4% of them unmarried at childbirth.
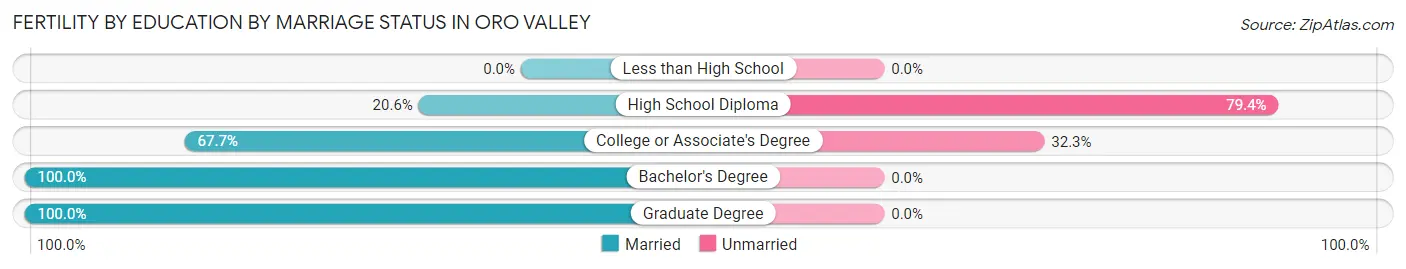
| Educational Attainment | Married | Unmarried |
| Less than High School | 0 (0.0%) | 0 (0.0%) |
| High School Diploma | 21 (20.6%) | 81 (79.4%) |
| College or Associate's Degree | 42 (67.7%) | 20 (32.3%) |
| Bachelor's Degree | 79 (100.0%) | 0 (0.0%) |
| Graduate Degree | 16 (100.0%) | 0 (0.0%) |
| Total | 158 (61.0%) | 101 (39.0%) |
Employment Characteristics in Oro Valley
Employment by Class of Employer in Oro Valley
Among the 17,938 employed individuals in Oro Valley, private company employees (11,234 | 62.6%), not-for-profit organizations (1,371 | 7.6%), and self-employed (not incorporated) (1,357 | 7.6%) make up the most common classes of employment.
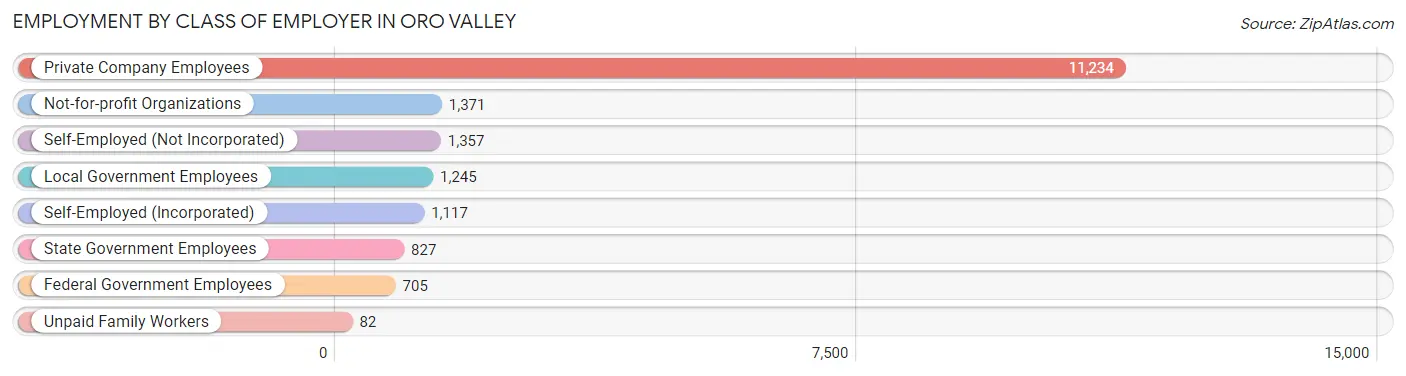
| Employer Class | # Employees | % Employees |
| Private Company Employees | 11,234 | 62.6% |
| Self-Employed (Incorporated) | 1,117 | 6.2% |
| Self-Employed (Not Incorporated) | 1,357 | 7.6% |
| Not-for-profit Organizations | 1,371 | 7.6% |
| Local Government Employees | 1,245 | 6.9% |
| State Government Employees | 827 | 4.6% |
| Federal Government Employees | 705 | 3.9% |
| Unpaid Family Workers | 82 | 0.5% |
| Total | 17,938 | 100.0% |
Employment Status by Age in Oro Valley
According to the labor force statistics for Oro Valley, out of the total population over 16 years of age (40,027), 48.0% or 19,213 individuals are in the labor force, with 2.9% or 557 of them unemployed. The age group with the highest labor force participation rate is 25 to 29 years, with 92.3% or 1,792 individuals in the labor force. Within the labor force, the 16 to 19 years age range has the highest percentage of unemployed individuals, with 15.0% or 96 of them being unemployed.
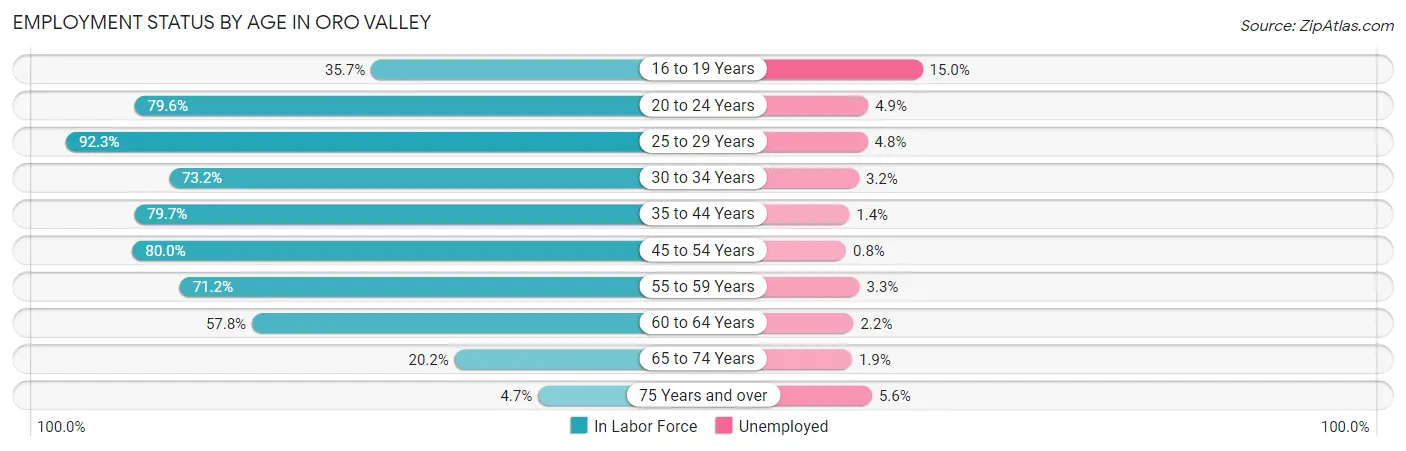
| Age Bracket | In Labor Force | Unemployed |
| 16 to 19 Years | 640 (35.7%) | 96 (15.0%) |
| 20 to 24 Years | 1,678 (79.6%) | 82 (4.9%) |
| 25 to 29 Years | 1,792 (92.3%) | 86 (4.8%) |
| 30 to 34 Years | 1,225 (73.2%) | 39 (3.2%) |
| 35 to 44 Years | 3,486 (79.7%) | 49 (1.4%) |
| 45 to 54 Years | 3,826 (80.0%) | 31 (0.8%) |
| 55 to 59 Years | 2,229 (71.2%) | 74 (3.3%) |
| 60 to 64 Years | 2,088 (57.8%) | 46 (2.2%) |
| 65 to 74 Years | 1,894 (20.2%) | 36 (1.9%) |
| 75 Years and over | 340 (4.7%) | 19 (5.6%) |
| Total | 19,213 (48.0%) | 557 (2.9%) |
Employment Status by Educational Attainment in Oro Valley
According to labor force statistics for Oro Valley, 75.0% of individuals (14,637) out of the total population between 25 and 64 years of age (19,516) are in the labor force, with 2.2% or 322 of them being unemployed. The group with the highest labor force participation rate are those with the educational attainment of bachelor's degree or higher, with 79.6% or 9,060 individuals in the labor force. Within the labor force, individuals with high school diploma education have the highest percentage of unemployment, with 3.2% or 51 of them being unemployed.
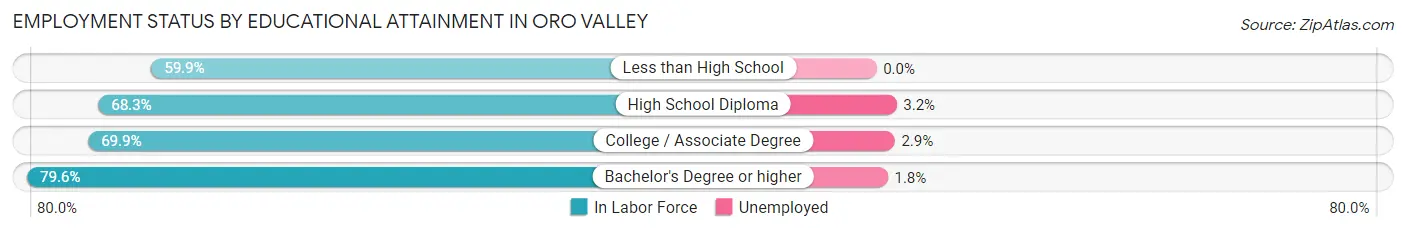
| Educational Attainment | In Labor Force | Unemployed |
| Less than High School | 365 (59.9%) | 0 (0.0%) |
| High School Diploma | 1,595 (68.3%) | 75 (3.2%) |
| College / Associate Degree | 3,628 (69.9%) | 151 (2.9%) |
| Bachelor's Degree or higher | 9,060 (79.6%) | 205 (1.8%) |
| Total | 14,637 (75.0%) | 429 (2.2%) |
Employment Occupations by Sex in Oro Valley
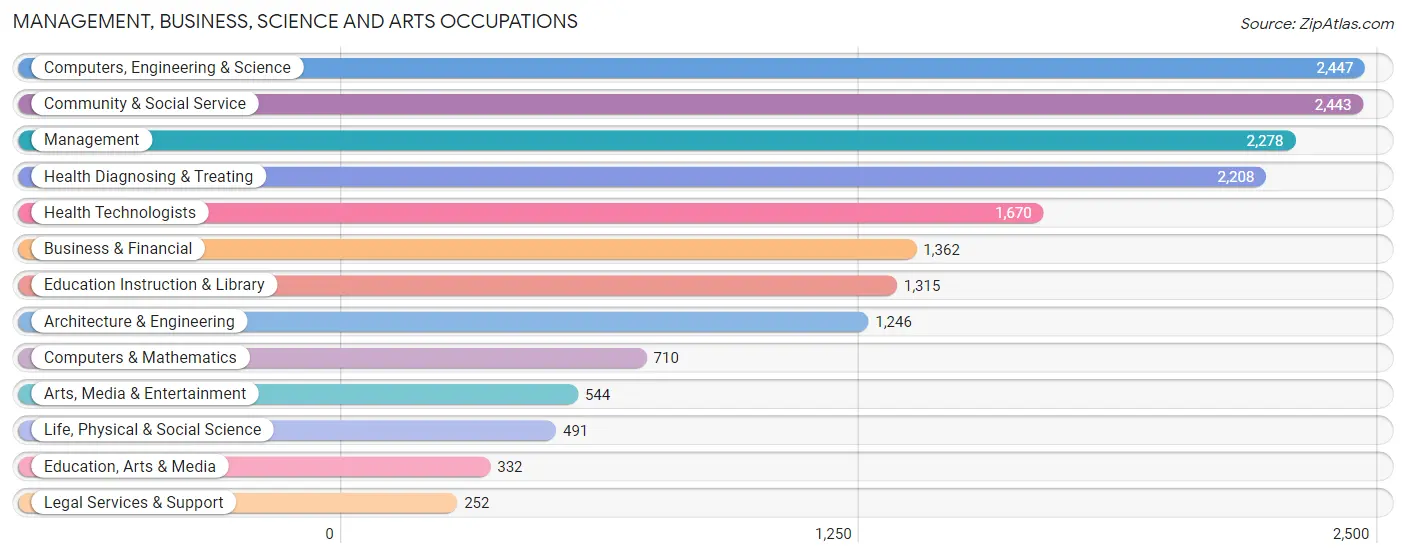
Management, Business, Science and Arts Occupations
The most common Management, Business, Science and Arts occupations in Oro Valley are Computers, Engineering & Science (2,447 | 13.2%), Community & Social Service (2,443 | 13.2%), Management (2,278 | 12.3%), Health Diagnosing & Treating (2,208 | 11.9%), and Health Technologists (1,670 | 9.0%).
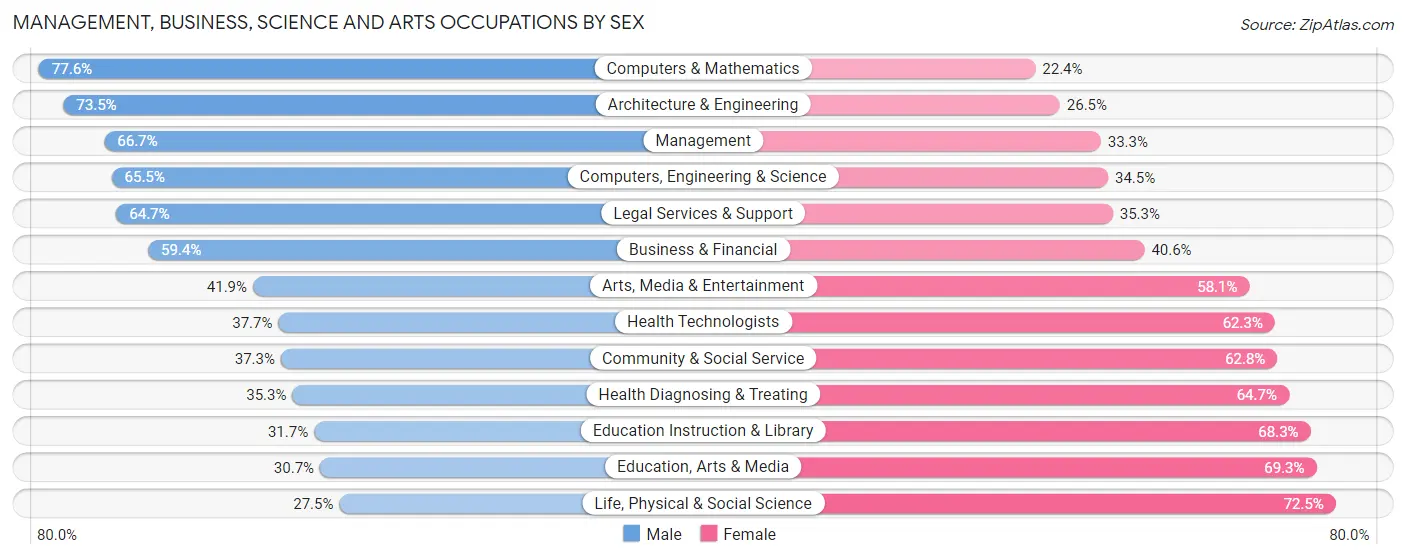
Management, Business, Science and Arts Occupations by Sex
Within the Management, Business, Science and Arts occupations in Oro Valley, the most male-oriented occupations are Computers & Mathematics (77.6%), Architecture & Engineering (73.5%), and Management (66.7%), while the most female-oriented occupations are Life, Physical & Social Science (72.5%), Education, Arts & Media (69.3%), and Education Instruction & Library (68.3%).
| Occupation | Male | Female |
| Management | 1,519 (66.7%) | 759 (33.3%) |
| Business & Financial | 809 (59.4%) | 553 (40.6%) |
| Computers, Engineering & Science | 1,602 (65.5%) | 845 (34.5%) |
| Computers & Mathematics | 551 (77.6%) | 159 (22.4%) |
| Architecture & Engineering | 916 (73.5%) | 330 (26.5%) |
| Life, Physical & Social Science | 135 (27.5%) | 356 (72.5%) |
| Community & Social Service | 910 (37.2%) | 1,533 (62.7%) |
| Education, Arts & Media | 102 (30.7%) | 230 (69.3%) |
| Legal Services & Support | 163 (64.7%) | 89 (35.3%) |
| Education Instruction & Library | 417 (31.7%) | 898 (68.3%) |
| Arts, Media & Entertainment | 228 (41.9%) | 316 (58.1%) |
| Health Diagnosing & Treating | 780 (35.3%) | 1,428 (64.7%) |
| Health Technologists | 629 (37.7%) | 1,041 (62.3%) |
| Total (Category) | 5,620 (52.3%) | 5,118 (47.7%) |
| Total (Overall) | 9,942 (53.6%) | 8,595 (46.4%) |
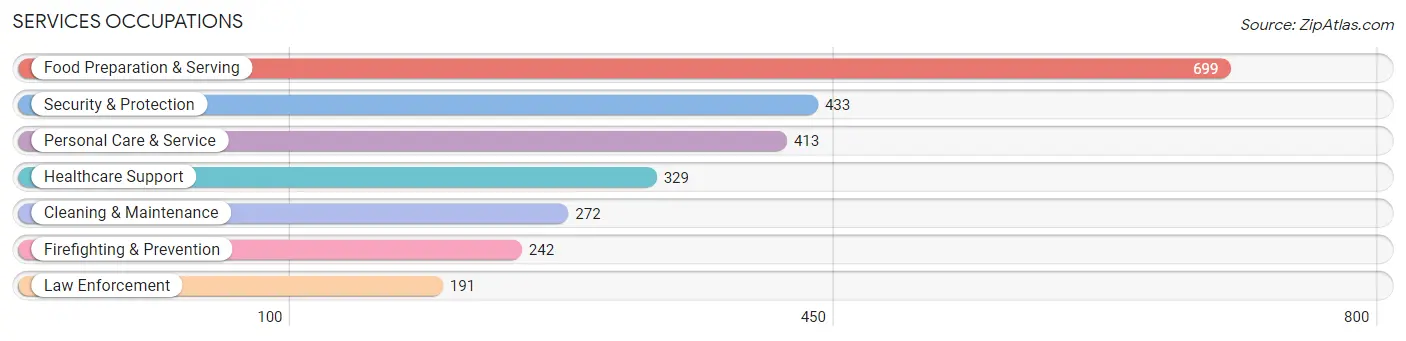
Services Occupations
The most common Services occupations in Oro Valley are Food Preparation & Serving (699 | 3.8%), Security & Protection (433 | 2.3%), Personal Care & Service (413 | 2.2%), Healthcare Support (329 | 1.8%), and Cleaning & Maintenance (272 | 1.5%).
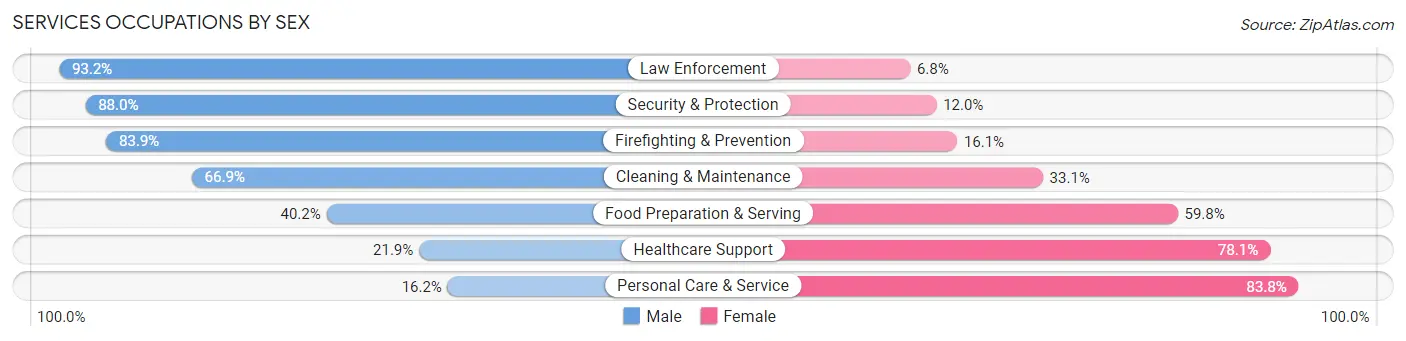
Services Occupations by Sex
Within the Services occupations in Oro Valley, the most male-oriented occupations are Law Enforcement (93.2%), Security & Protection (88.0%), and Firefighting & Prevention (83.9%), while the most female-oriented occupations are Personal Care & Service (83.8%), Healthcare Support (78.1%), and Food Preparation & Serving (59.8%).
| Occupation | Male | Female |
| Healthcare Support | 72 (21.9%) | 257 (78.1%) |
| Security & Protection | 381 (88.0%) | 52 (12.0%) |
| Firefighting & Prevention | 203 (83.9%) | 39 (16.1%) |
| Law Enforcement | 178 (93.2%) | 13 (6.8%) |
| Food Preparation & Serving | 281 (40.2%) | 418 (59.8%) |
| Cleaning & Maintenance | 182 (66.9%) | 90 (33.1%) |
| Personal Care & Service | 67 (16.2%) | 346 (83.8%) |
| Total (Category) | 983 (45.8%) | 1,163 (54.2%) |
| Total (Overall) | 9,942 (53.6%) | 8,595 (46.4%) |
Sales and Office Occupations
The most common Sales and Office occupations in Oro Valley are Sales & Related (1,948 | 10.5%), and Office & Administration (1,810 | 9.8%).
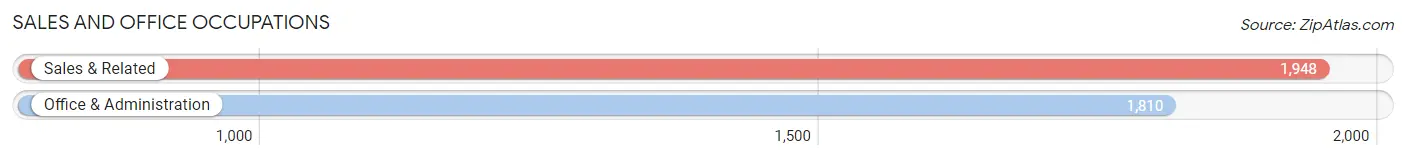
Sales and Office Occupations by Sex

| Occupation | Male | Female |
| Sales & Related | 1,040 (53.4%) | 908 (46.6%) |
| Office & Administration | 613 (33.9%) | 1,197 (66.1%) |
| Total (Category) | 1,653 (44.0%) | 2,105 (56.0%) |
| Total (Overall) | 9,942 (53.6%) | 8,595 (46.4%) |
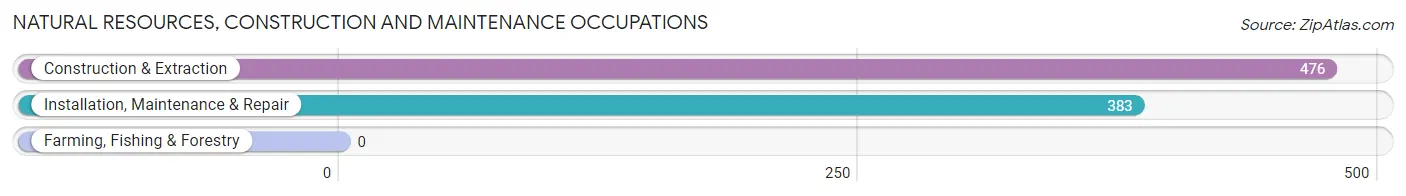
Natural Resources, Construction and Maintenance Occupations
The most common Natural Resources, Construction and Maintenance occupations in Oro Valley are Construction & Extraction (476 | 2.6%), and Installation, Maintenance & Repair (383 | 2.1%).
Natural Resources, Construction and Maintenance Occupations by Sex
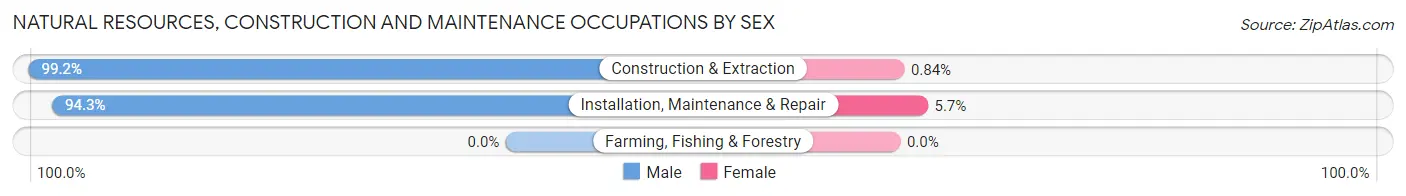
| Occupation | Male | Female |
| Farming, Fishing & Forestry | 0 (0.0%) | 0 (0.0%) |
| Construction & Extraction | 472 (99.2%) | 4 (0.8%) |
| Installation, Maintenance & Repair | 361 (94.3%) | 22 (5.7%) |
| Total (Category) | 833 (97.0%) | 26 (3.0%) |
| Total (Overall) | 9,942 (53.6%) | 8,595 (46.4%) |
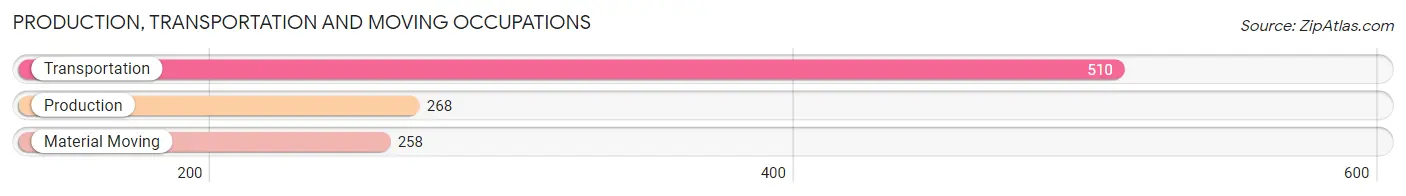
Production, Transportation and Moving Occupations
The most common Production, Transportation and Moving occupations in Oro Valley are Transportation (510 | 2.8%), Production (268 | 1.5%), and Material Moving (258 | 1.4%).
Production, Transportation and Moving Occupations by Sex
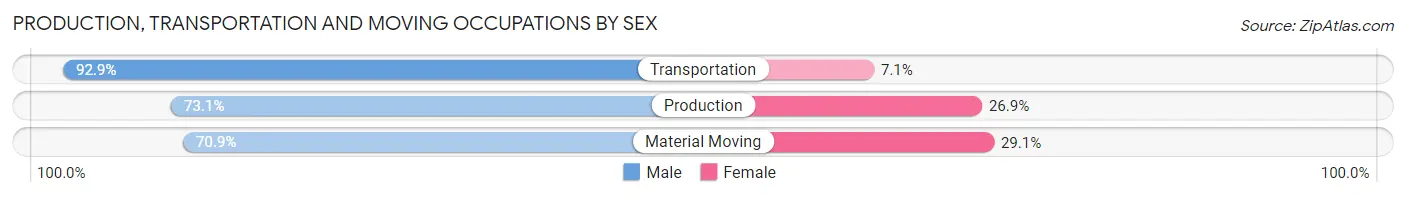
| Occupation | Male | Female |
| Production | 196 (73.1%) | 72 (26.9%) |
| Transportation | 474 (92.9%) | 36 (7.1%) |
| Material Moving | 183 (70.9%) | 75 (29.1%) |
| Total (Category) | 853 (82.3%) | 183 (17.7%) |
| Total (Overall) | 9,942 (53.6%) | 8,595 (46.4%) |
Employment Industries by Sex in Oro Valley
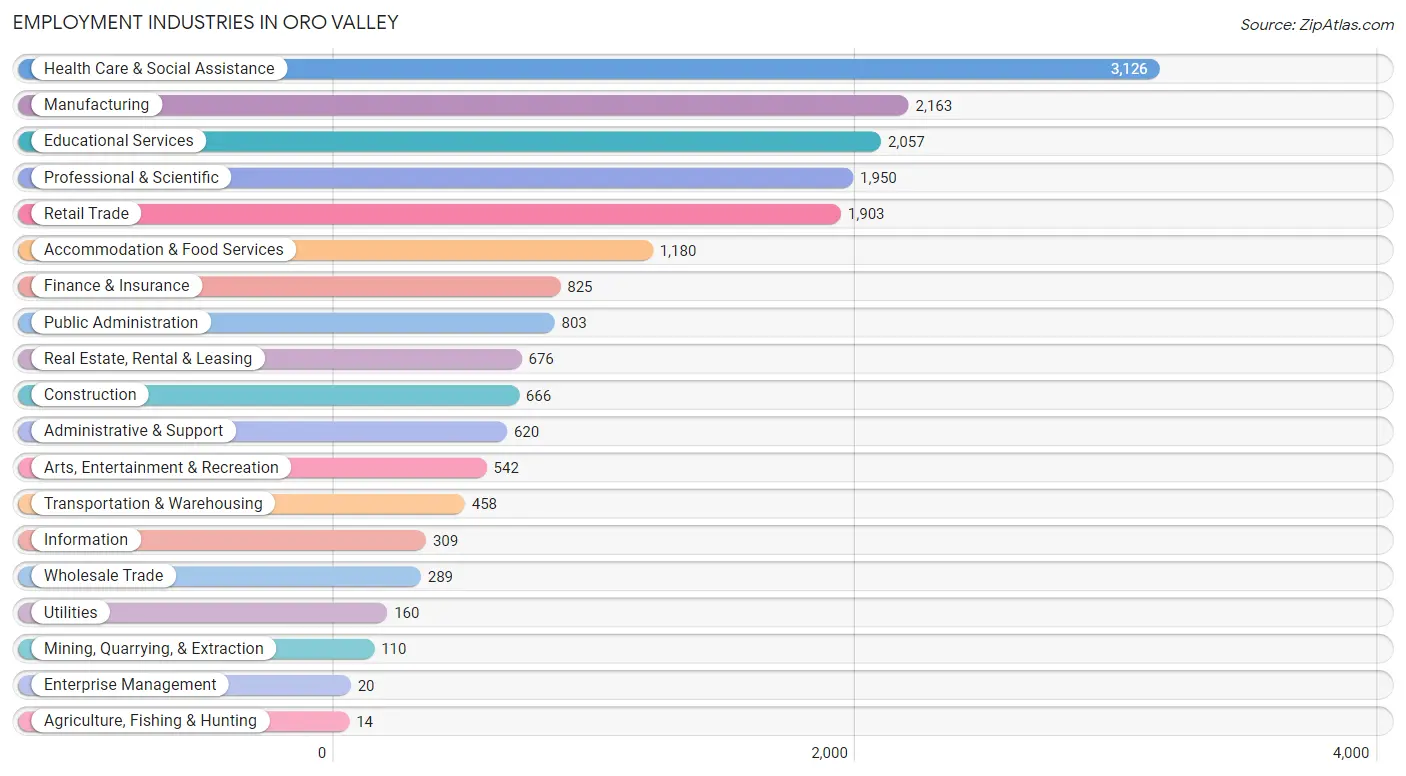
Employment Industries in Oro Valley
The major employment industries in Oro Valley include Health Care & Social Assistance (3,126 | 16.9%), Manufacturing (2,163 | 11.7%), Educational Services (2,057 | 11.1%), Professional & Scientific (1,950 | 10.5%), and Retail Trade (1,903 | 10.3%).
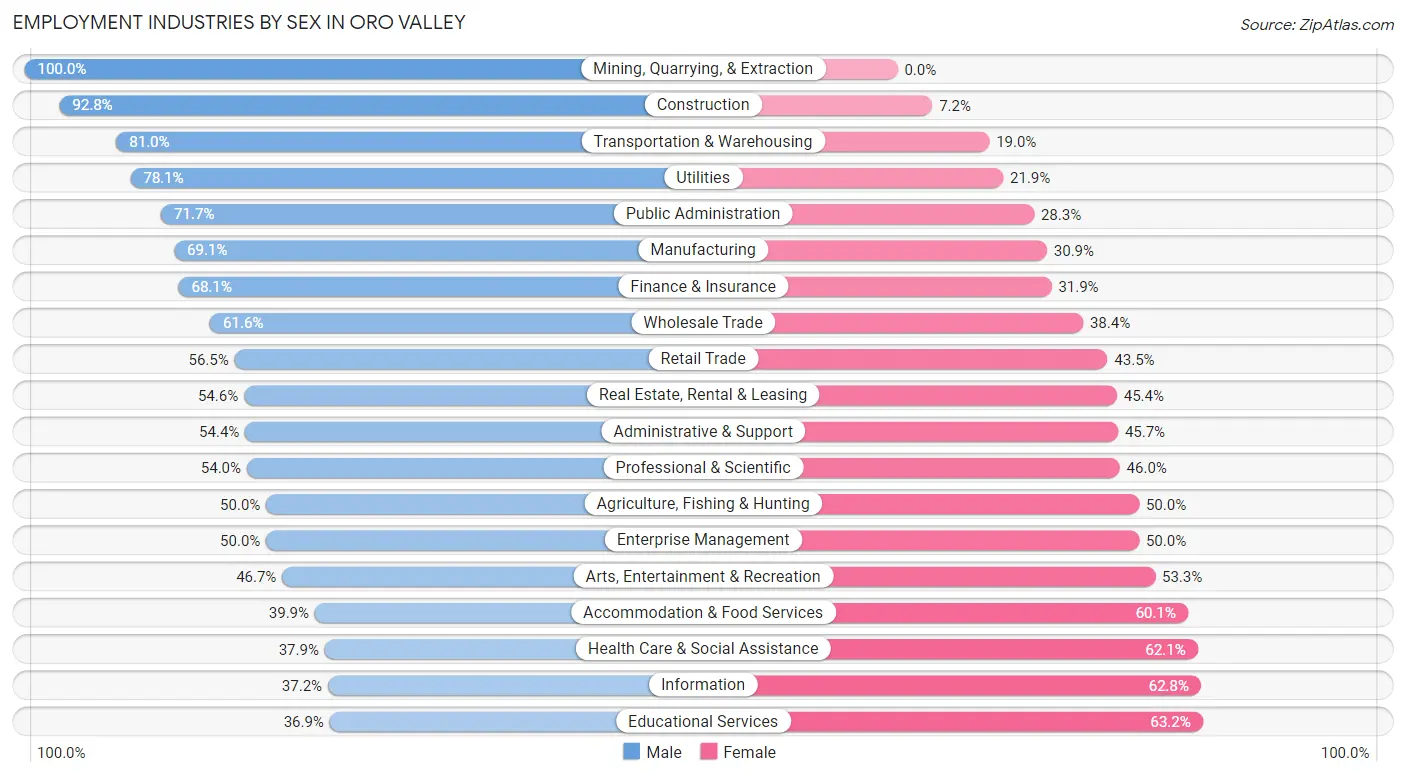
Employment Industries by Sex in Oro Valley
The Oro Valley industries that see more men than women are Mining, Quarrying, & Extraction (100.0%), Construction (92.8%), and Transportation & Warehousing (81.0%), whereas the industries that tend to have a higher number of women are Educational Services (63.1%), Information (62.8%), and Health Care & Social Assistance (62.1%).
| Industry | Male | Female |
| Agriculture, Fishing & Hunting | 7 (50.0%) | 7 (50.0%) |
| Mining, Quarrying, & Extraction | 110 (100.0%) | 0 (0.0%) |
| Construction | 618 (92.8%) | 48 (7.2%) |
| Manufacturing | 1,494 (69.1%) | 669 (30.9%) |
| Wholesale Trade | 178 (61.6%) | 111 (38.4%) |
| Retail Trade | 1,076 (56.5%) | 827 (43.5%) |
| Transportation & Warehousing | 371 (81.0%) | 87 (19.0%) |
| Utilities | 125 (78.1%) | 35 (21.9%) |
| Information | 115 (37.2%) | 194 (62.8%) |
| Finance & Insurance | 562 (68.1%) | 263 (31.9%) |
| Real Estate, Rental & Leasing | 369 (54.6%) | 307 (45.4%) |
| Professional & Scientific | 1,053 (54.0%) | 897 (46.0%) |
| Enterprise Management | 10 (50.0%) | 10 (50.0%) |
| Administrative & Support | 337 (54.3%) | 283 (45.7%) |
| Educational Services | 758 (36.8%) | 1,299 (63.1%) |
| Health Care & Social Assistance | 1,184 (37.9%) | 1,942 (62.1%) |
| Arts, Entertainment & Recreation | 253 (46.7%) | 289 (53.3%) |
| Accommodation & Food Services | 471 (39.9%) | 709 (60.1%) |
| Public Administration | 576 (71.7%) | 227 (28.3%) |
| Total | 9,942 (53.6%) | 8,595 (46.4%) |
Education in Oro Valley
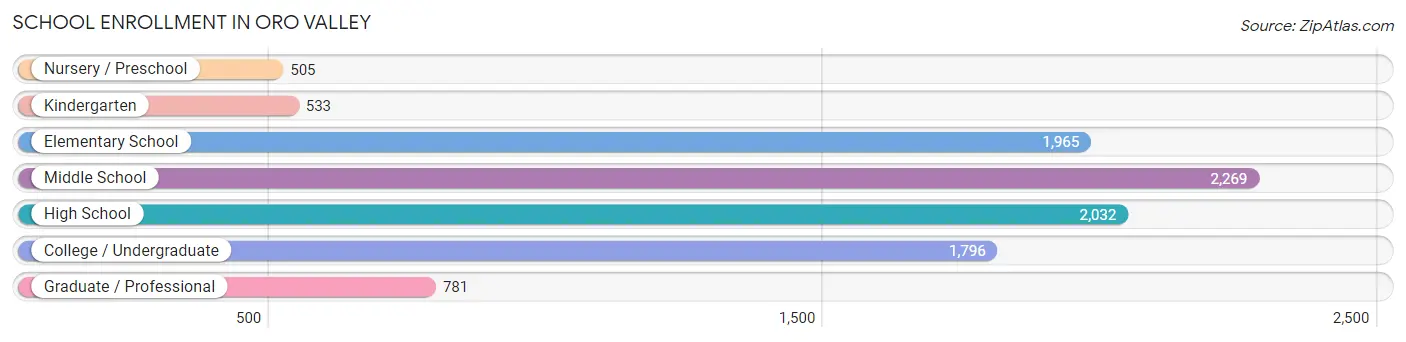
School Enrollment in Oro Valley
The most common levels of schooling among the 9,881 students in Oro Valley are middle school (2,269 | 23.0%), high school (2,032 | 20.6%), and elementary school (1,965 | 19.9%).
| School Level | # Students | % Students |
| Nursery / Preschool | 505 | 5.1% |
| Kindergarten | 533 | 5.4% |
| Elementary School | 1,965 | 19.9% |
| Middle School | 2,269 | 23.0% |
| High School | 2,032 | 20.6% |
| College / Undergraduate | 1,796 | 18.2% |
| Graduate / Professional | 781 | 7.9% |
| Total | 9,881 | 100.0% |
School Enrollment by Age by Funding Source in Oro Valley
Out of a total of 9,881 students who are enrolled in schools in Oro Valley, 1,611 (16.3%) attend a private institution, while the remaining 8,270 (83.7%) are enrolled in public schools. The age group of 3 to 4 year olds has the highest likelihood of being enrolled in private schools, with 281 (64.2% in the age bracket) enrolled. Conversely, the age group of 10 to 14 year olds has the lowest likelihood of being enrolled in a private school, with 2,465 (92.7% in the age bracket) attending a public institution.
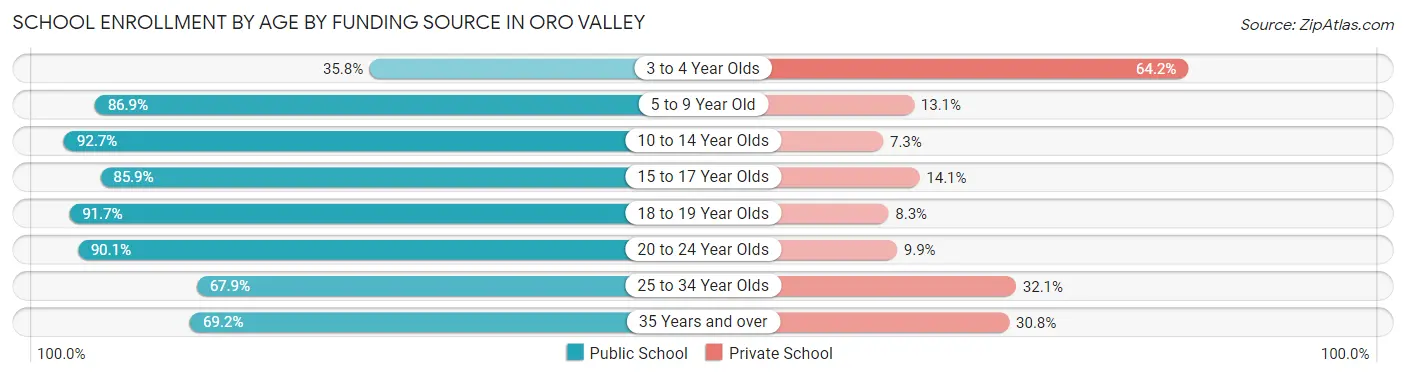
| Age Bracket | Public School | Private School |
| 3 to 4 Year Olds | 157 (35.8%) | 281 (64.2%) |
| 5 to 9 Year Old | 2,048 (86.9%) | 308 (13.1%) |
| 10 to 14 Year Olds | 2,465 (92.7%) | 195 (7.3%) |
| 15 to 17 Year Olds | 1,346 (85.9%) | 221 (14.1%) |
| 18 to 19 Year Olds | 485 (91.7%) | 44 (8.3%) |
| 20 to 24 Year Olds | 710 (90.1%) | 78 (9.9%) |
| 25 to 34 Year Olds | 572 (67.9%) | 270 (32.1%) |
| 35 Years and over | 485 (69.2%) | 216 (30.8%) |
| Total | 8,270 (83.7%) | 1,611 (16.3%) |
Educational Attainment by Field of Study in Oro Valley
Business (3,995 | 18.1%), science & technology (2,857 | 12.9%), education (2,588 | 11.7%), engineering (2,334 | 10.6%), and social sciences (1,836 | 8.3%) are the most common fields of study among 22,111 individuals in Oro Valley who have obtained a bachelor's degree or higher.
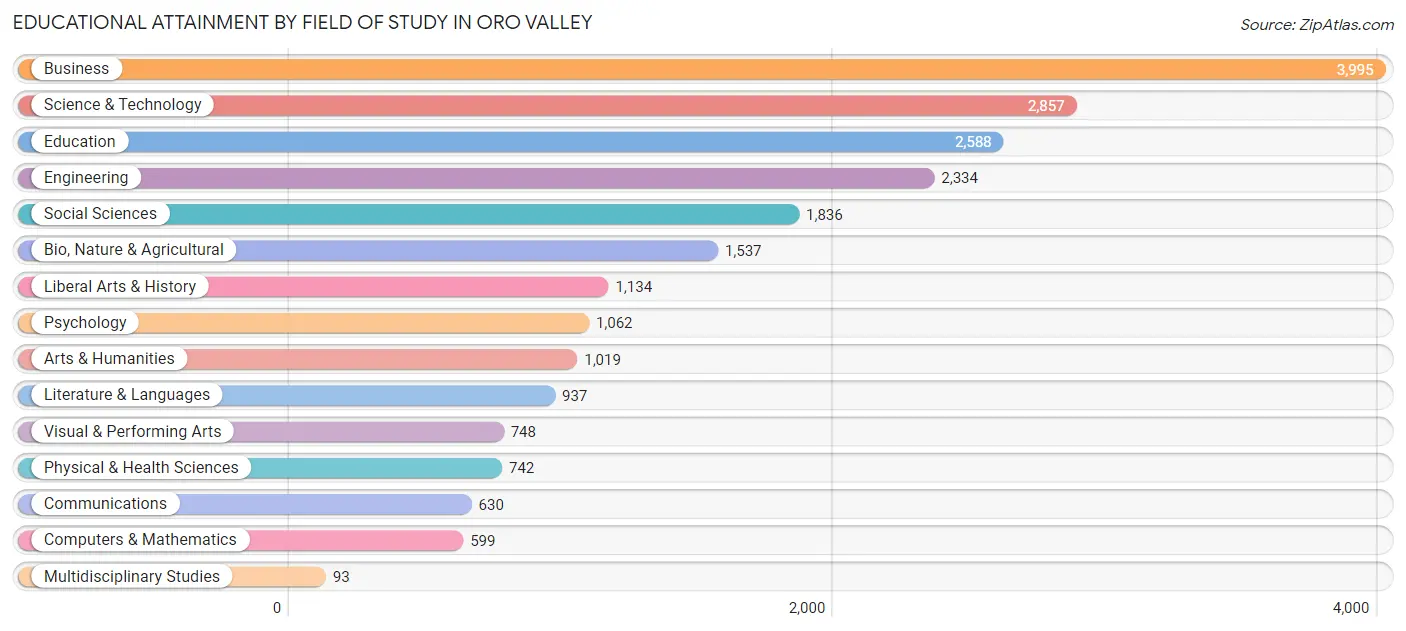
| Field of Study | # Graduates | % Graduates |
| Computers & Mathematics | 599 | 2.7% |
| Bio, Nature & Agricultural | 1,537 | 7.0% |
| Physical & Health Sciences | 742 | 3.4% |
| Psychology | 1,062 | 4.8% |
| Social Sciences | 1,836 | 8.3% |
| Engineering | 2,334 | 10.6% |
| Multidisciplinary Studies | 93 | 0.4% |
| Science & Technology | 2,857 | 12.9% |
| Business | 3,995 | 18.1% |
| Education | 2,588 | 11.7% |
| Literature & Languages | 937 | 4.2% |
| Liberal Arts & History | 1,134 | 5.1% |
| Visual & Performing Arts | 748 | 3.4% |
| Communications | 630 | 2.9% |
| Arts & Humanities | 1,019 | 4.6% |
| Total | 22,111 | 100.0% |
Transportation & Commute in Oro Valley
Vehicle Availability by Sex in Oro Valley
The most prevalent vehicle ownership categories in Oro Valley are males with 2 vehicles (5,141, accounting for 54.1%) and females with 2 vehicles (4,255, making up 61.0%).
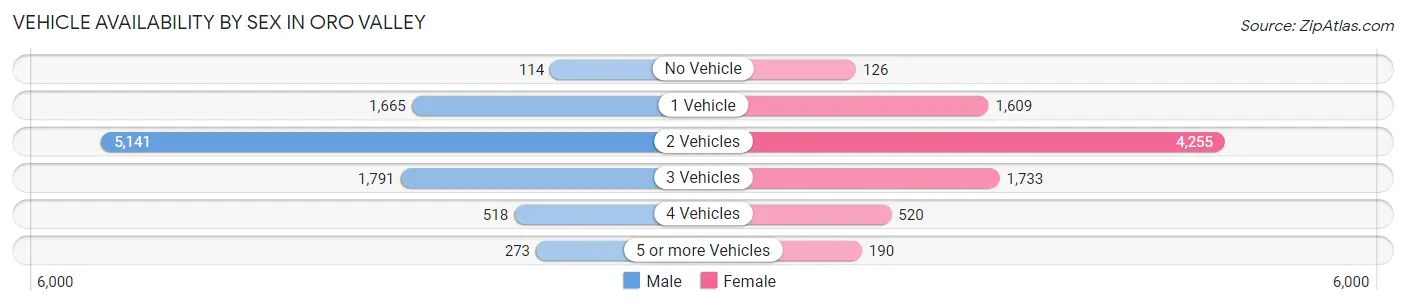
| Vehicles Available | Male | Female |
| No Vehicle | 114 (1.2%) | 126 (1.5%) |
| 1 Vehicle | 1,665 (17.5%) | 1,609 (19.1%) |
| 2 Vehicles | 5,141 (54.1%) | 4,255 (50.5%) |
| 3 Vehicles | 1,791 (18.9%) | 1,733 (20.5%) |
| 4 Vehicles | 518 (5.4%) | 520 (6.2%) |
| 5 or more Vehicles | 273 (2.9%) | 190 (2.2%) |
| Total | 9,502 (100.0%) | 8,433 (100.0%) |
Commute Time in Oro Valley
The most frequently occuring commute durations in Oro Valley are 15 to 19 minutes (2,308 commuters, 15.6%), 20 to 24 minutes (2,054 commuters, 13.9%), and 30 to 34 minutes (1,983 commuters, 13.4%).
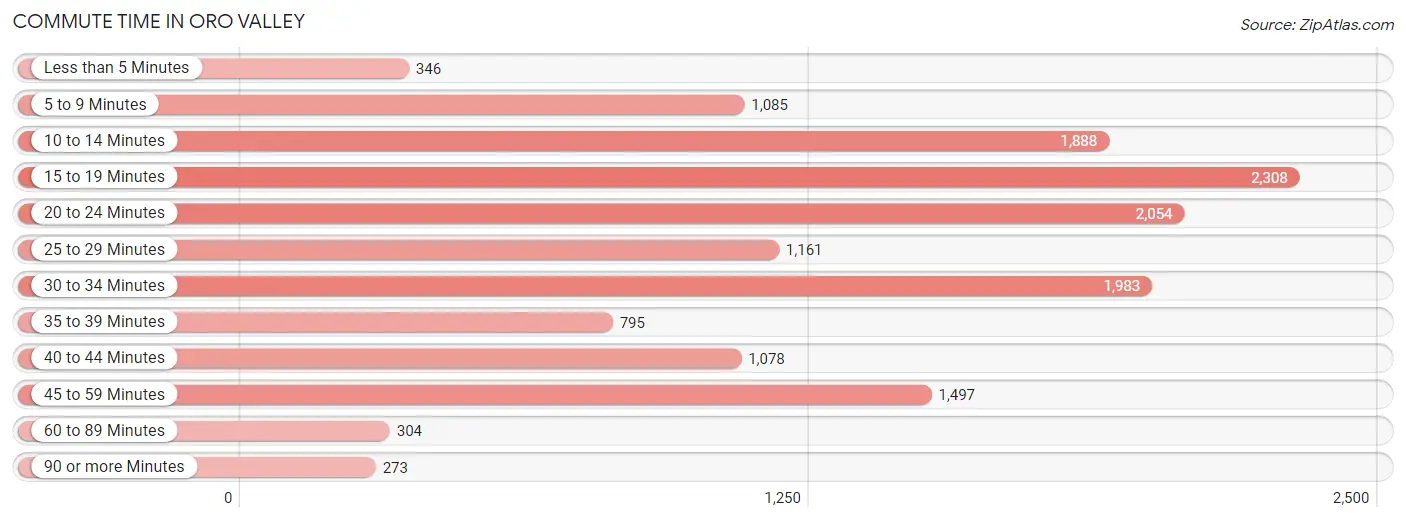
| Commute Time | # Commuters | % Commuters |
| Less than 5 Minutes | 346 | 2.3% |
| 5 to 9 Minutes | 1,085 | 7.3% |
| 10 to 14 Minutes | 1,888 | 12.8% |
| 15 to 19 Minutes | 2,308 | 15.6% |
| 20 to 24 Minutes | 2,054 | 13.9% |
| 25 to 29 Minutes | 1,161 | 7.9% |
| 30 to 34 Minutes | 1,983 | 13.4% |
| 35 to 39 Minutes | 795 | 5.4% |
| 40 to 44 Minutes | 1,078 | 7.3% |
| 45 to 59 Minutes | 1,497 | 10.1% |
| 60 to 89 Minutes | 304 | 2.1% |
| 90 or more Minutes | 273 | 1.8% |
Commute Time by Sex in Oro Valley
The most common commute times in Oro Valley are 30 to 34 minutes (1,050 commuters, 13.5%) for males and 15 to 19 minutes (1,259 commuters, 17.9%) for females.
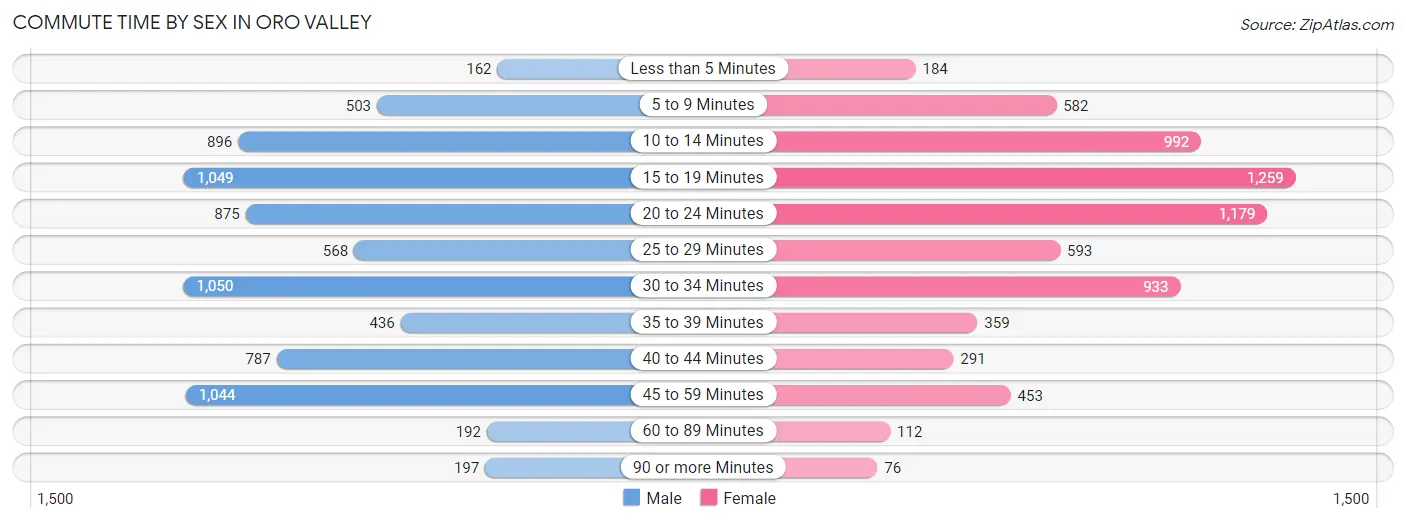
| Commute Time | Male | Female |
| Less than 5 Minutes | 162 (2.1%) | 184 (2.6%) |
| 5 to 9 Minutes | 503 (6.5%) | 582 (8.3%) |
| 10 to 14 Minutes | 896 (11.6%) | 992 (14.1%) |
| 15 to 19 Minutes | 1,049 (13.5%) | 1,259 (17.9%) |
| 20 to 24 Minutes | 875 (11.3%) | 1,179 (16.8%) |
| 25 to 29 Minutes | 568 (7.3%) | 593 (8.5%) |
| 30 to 34 Minutes | 1,050 (13.5%) | 933 (13.3%) |
| 35 to 39 Minutes | 436 (5.6%) | 359 (5.1%) |
| 40 to 44 Minutes | 787 (10.1%) | 291 (4.2%) |
| 45 to 59 Minutes | 1,044 (13.5%) | 453 (6.5%) |
| 60 to 89 Minutes | 192 (2.5%) | 112 (1.6%) |
| 90 or more Minutes | 197 (2.5%) | 76 (1.1%) |
Time of Departure to Work by Sex in Oro Valley
The most frequent times of departure to work in Oro Valley are 7:00 AM to 7:29 AM (1,262, 16.3%) for males and 7:00 AM to 7:29 AM (1,148, 16.4%) for females.
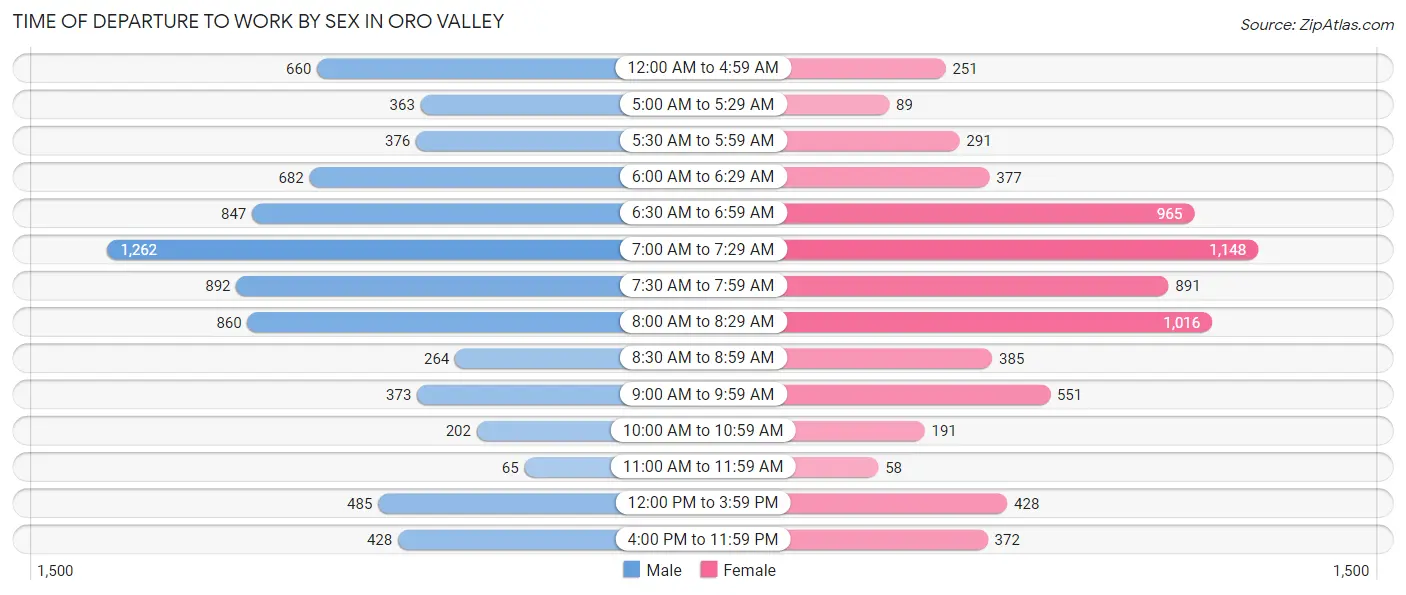
| Time of Departure | Male | Female |
| 12:00 AM to 4:59 AM | 660 (8.5%) | 251 (3.6%) |
| 5:00 AM to 5:29 AM | 363 (4.7%) | 89 (1.3%) |
| 5:30 AM to 5:59 AM | 376 (4.9%) | 291 (4.2%) |
| 6:00 AM to 6:29 AM | 682 (8.8%) | 377 (5.4%) |
| 6:30 AM to 6:59 AM | 847 (10.9%) | 965 (13.8%) |
| 7:00 AM to 7:29 AM | 1,262 (16.3%) | 1,148 (16.4%) |
| 7:30 AM to 7:59 AM | 892 (11.5%) | 891 (12.7%) |
| 8:00 AM to 8:29 AM | 860 (11.1%) | 1,016 (14.5%) |
| 8:30 AM to 8:59 AM | 264 (3.4%) | 385 (5.5%) |
| 9:00 AM to 9:59 AM | 373 (4.8%) | 551 (7.9%) |
| 10:00 AM to 10:59 AM | 202 (2.6%) | 191 (2.7%) |
| 11:00 AM to 11:59 AM | 65 (0.8%) | 58 (0.8%) |
| 12:00 PM to 3:59 PM | 485 (6.2%) | 428 (6.1%) |
| 4:00 PM to 11:59 PM | 428 (5.5%) | 372 (5.3%) |
| Total | 7,759 (100.0%) | 7,013 (100.0%) |
Housing Occupancy in Oro Valley
Occupancy by Ownership in Oro Valley
Of the total 21,019 dwellings in Oro Valley, owner-occupied units account for 16,120 (76.7%), while renter-occupied units make up 4,899 (23.3%).
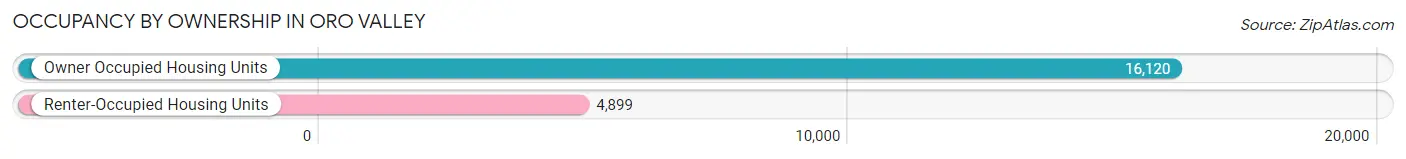
| Occupancy | # Housing Units | % Housing Units |
| Owner Occupied Housing Units | 16,120 | 76.7% |
| Renter-Occupied Housing Units | 4,899 | 23.3% |
| Total Occupied Housing Units | 21,019 | 100.0% |
Occupancy by Household Size in Oro Valley
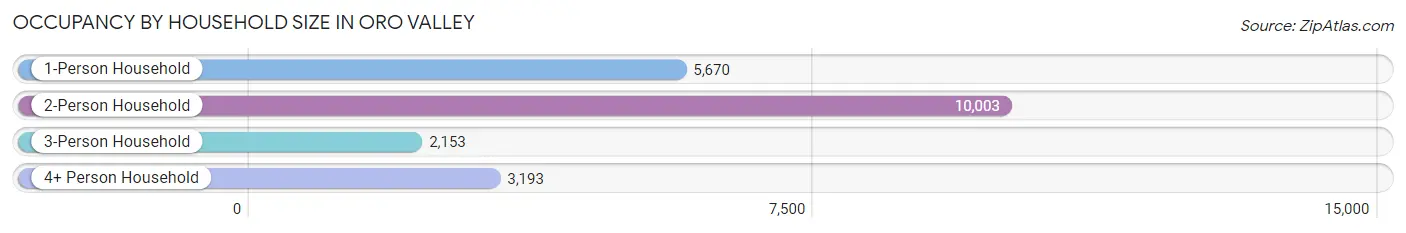
| Household Size | # Housing Units | % Housing Units |
| 1-Person Household | 5,670 | 27.0% |
| 2-Person Household | 10,003 | 47.6% |
| 3-Person Household | 2,153 | 10.2% |
| 4+ Person Household | 3,193 | 15.2% |
| Total Housing Units | 21,019 | 100.0% |
Occupancy by Ownership by Household Size in Oro Valley
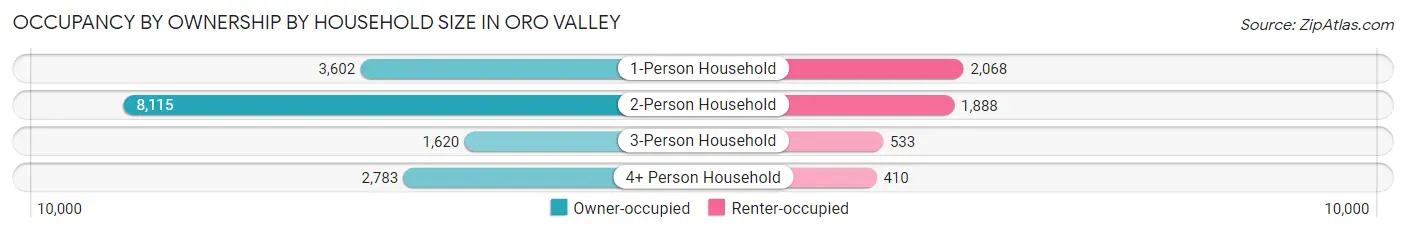
| Household Size | Owner-occupied | Renter-occupied |
| 1-Person Household | 3,602 (63.5%) | 2,068 (36.5%) |
| 2-Person Household | 8,115 (81.1%) | 1,888 (18.9%) |
| 3-Person Household | 1,620 (75.2%) | 533 (24.8%) |
| 4+ Person Household | 2,783 (87.2%) | 410 (12.8%) |
| Total Housing Units | 16,120 (76.7%) | 4,899 (23.3%) |
Occupancy by Educational Attainment in Oro Valley
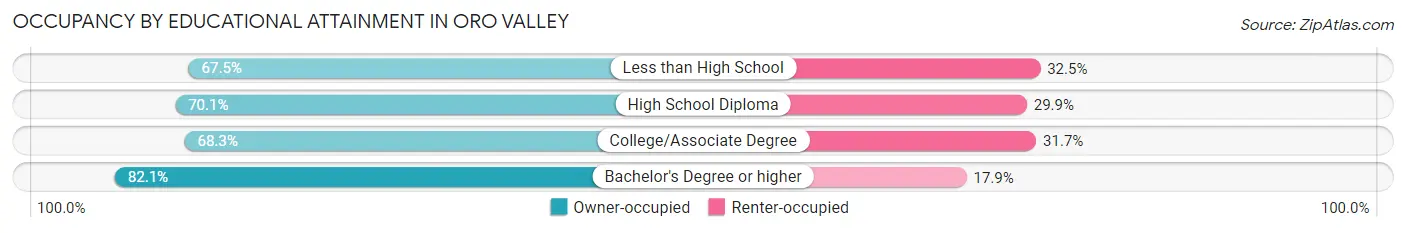
| Household Size | Owner-occupied | Renter-occupied |
| Less than High School | 334 (67.5%) | 161 (32.5%) |
| High School Diploma | 1,446 (70.1%) | 616 (29.9%) |
| College/Associate Degree | 4,032 (68.3%) | 1,873 (31.7%) |
| Bachelor's Degree or higher | 10,308 (82.1%) | 2,249 (17.9%) |
Occupancy by Age of Householder in Oro Valley
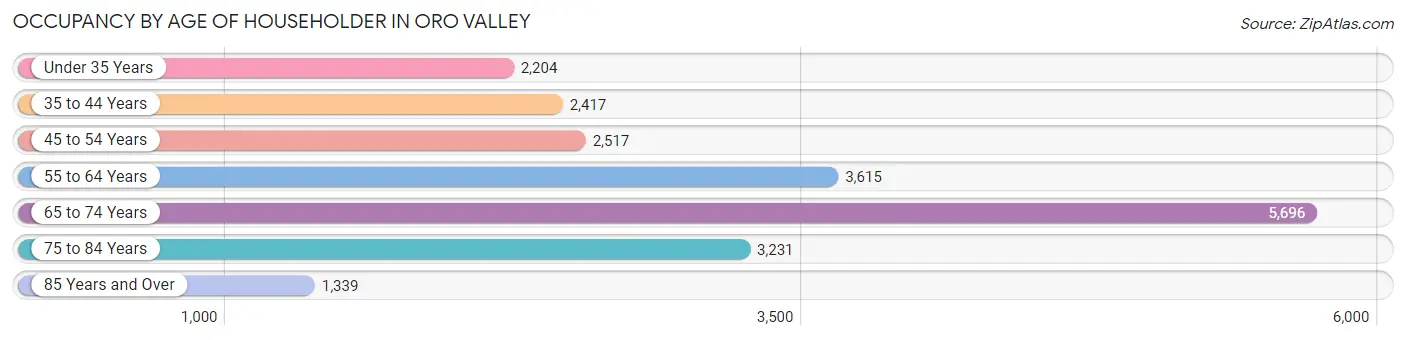
| Age Bracket | # Households | % Households |
| Under 35 Years | 2,204 | 10.5% |
| 35 to 44 Years | 2,417 | 11.5% |
| 45 to 54 Years | 2,517 | 12.0% |
| 55 to 64 Years | 3,615 | 17.2% |
| 65 to 74 Years | 5,696 | 27.1% |
| 75 to 84 Years | 3,231 | 15.4% |
| 85 Years and Over | 1,339 | 6.4% |
| Total | 21,019 | 100.0% |
Housing Finances in Oro Valley
Median Income by Occupancy in Oro Valley
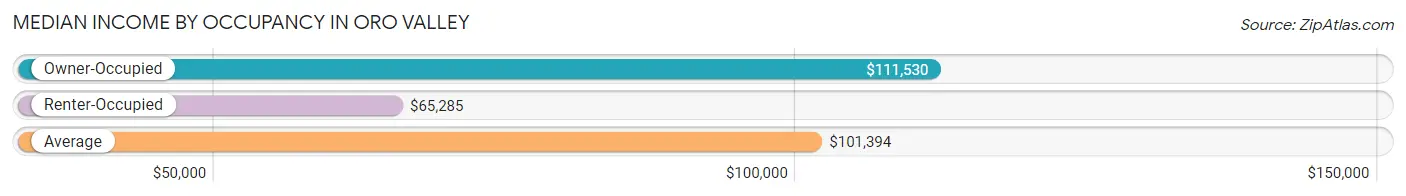
| Occupancy Type | # Households | Median Income |
| Owner-Occupied | 16,120 (76.7%) | $111,530 |
| Renter-Occupied | 4,899 (23.3%) | $65,285 |
| Average | 21,019 (100.0%) | $101,394 |
Occupancy by Householder Income Bracket in Oro Valley
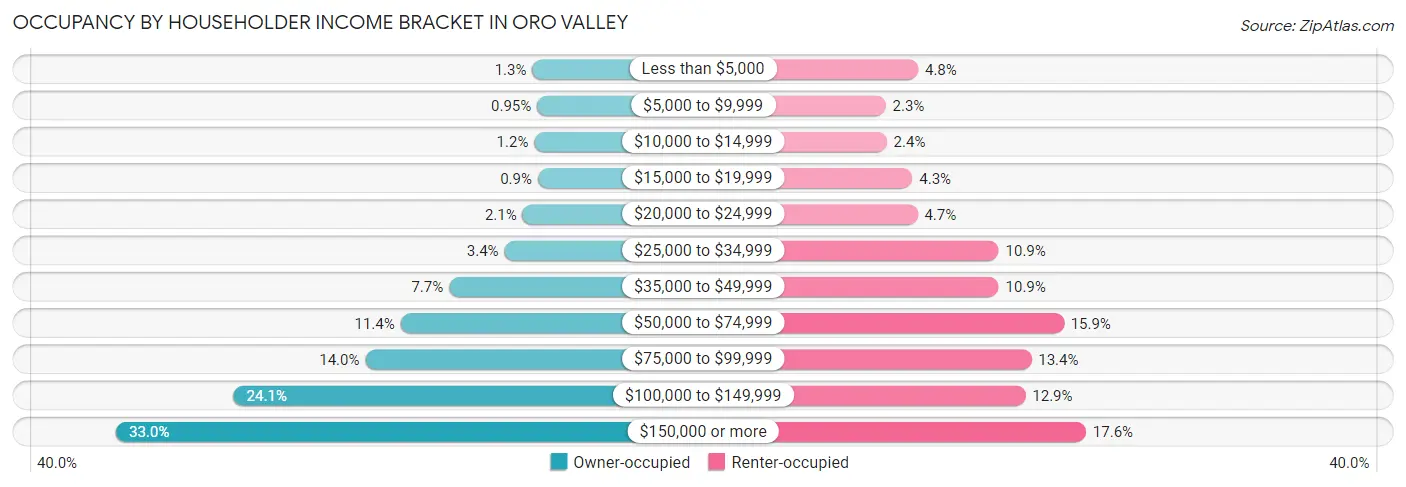
| Income Bracket | Owner-occupied | Renter-occupied |
| Less than $5,000 | 213 (1.3%) | 233 (4.8%) |
| $5,000 to $9,999 | 153 (0.9%) | 112 (2.3%) |
| $10,000 to $14,999 | 188 (1.2%) | 116 (2.4%) |
| $15,000 to $19,999 | 145 (0.9%) | 212 (4.3%) |
| $20,000 to $24,999 | 332 (2.1%) | 231 (4.7%) |
| $25,000 to $34,999 | 555 (3.4%) | 534 (10.9%) |
| $35,000 to $49,999 | 1,235 (7.7%) | 534 (10.9%) |
| $50,000 to $74,999 | 1,831 (11.4%) | 777 (15.9%) |
| $75,000 to $99,999 | 2,264 (14.0%) | 656 (13.4%) |
| $100,000 to $149,999 | 3,880 (24.1%) | 634 (12.9%) |
| $150,000 or more | 5,324 (33.0%) | 860 (17.5%) |
| Total | 16,120 (100.0%) | 4,899 (100.0%) |
Monthly Housing Cost Tiers in Oro Valley
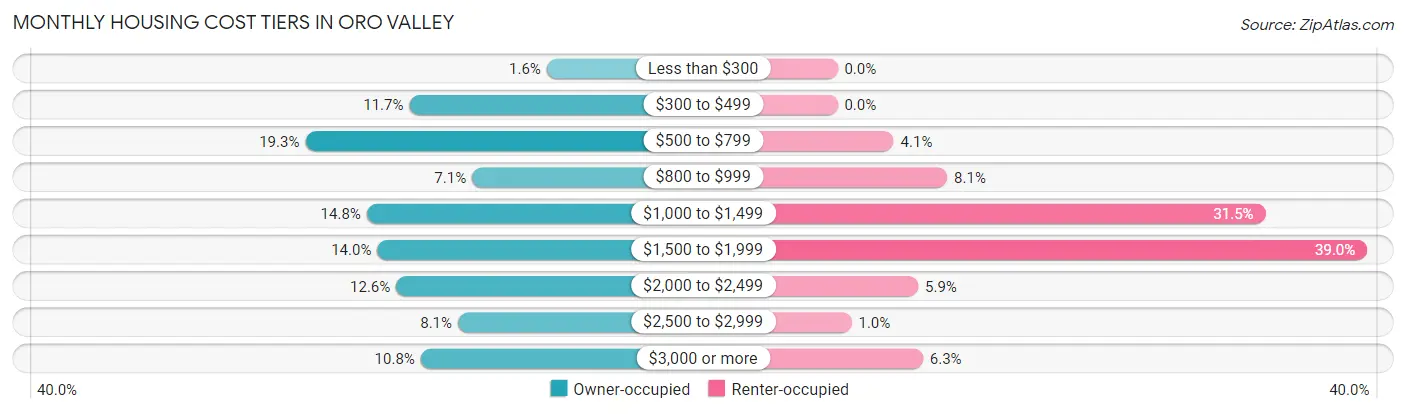
| Monthly Cost | Owner-occupied | Renter-occupied |
| Less than $300 | 250 (1.5%) | 0 (0.0%) |
| $300 to $499 | 1,882 (11.7%) | 0 (0.0%) |
| $500 to $799 | 3,116 (19.3%) | 203 (4.1%) |
| $800 to $999 | 1,136 (7.0%) | 396 (8.1%) |
| $1,000 to $1,499 | 2,387 (14.8%) | 1,544 (31.5%) |
| $1,500 to $1,999 | 2,262 (14.0%) | 1,911 (39.0%) |
| $2,000 to $2,499 | 2,037 (12.6%) | 291 (5.9%) |
| $2,500 to $2,999 | 1,304 (8.1%) | 51 (1.0%) |
| $3,000 or more | 1,746 (10.8%) | 308 (6.3%) |
| Total | 16,120 (100.0%) | 4,899 (100.0%) |
Physical Housing Characteristics in Oro Valley
Housing Structures in Oro Valley
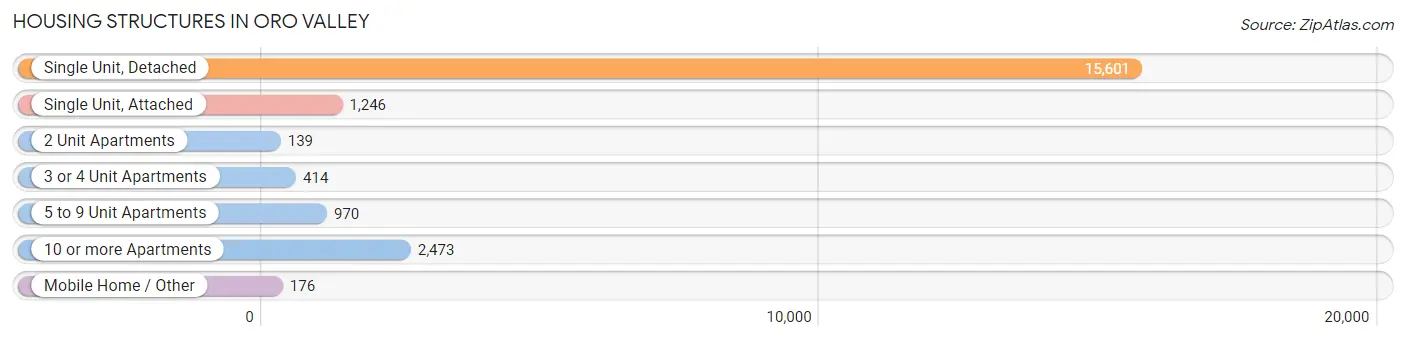
| Structure Type | # Housing Units | % Housing Units |
| Single Unit, Detached | 15,601 | 74.2% |
| Single Unit, Attached | 1,246 | 5.9% |
| 2 Unit Apartments | 139 | 0.7% |
| 3 or 4 Unit Apartments | 414 | 2.0% |
| 5 to 9 Unit Apartments | 970 | 4.6% |
| 10 or more Apartments | 2,473 | 11.8% |
| Mobile Home / Other | 176 | 0.8% |
| Total | 21,019 | 100.0% |
Housing Structures by Occupancy in Oro Valley
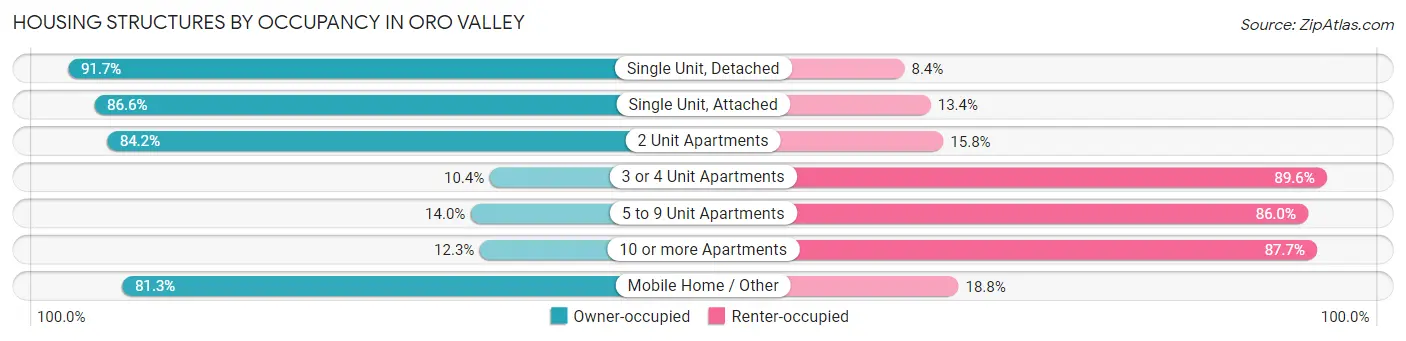
| Structure Type | Owner-occupied | Renter-occupied |
| Single Unit, Detached | 14,298 (91.6%) | 1,303 (8.4%) |
| Single Unit, Attached | 1,079 (86.6%) | 167 (13.4%) |
| 2 Unit Apartments | 117 (84.2%) | 22 (15.8%) |
| 3 or 4 Unit Apartments | 43 (10.4%) | 371 (89.6%) |
| 5 to 9 Unit Apartments | 136 (14.0%) | 834 (86.0%) |
| 10 or more Apartments | 304 (12.3%) | 2,169 (87.7%) |
| Mobile Home / Other | 143 (81.2%) | 33 (18.8%) |
| Total | 16,120 (76.7%) | 4,899 (23.3%) |
Housing Structures by Number of Rooms in Oro Valley
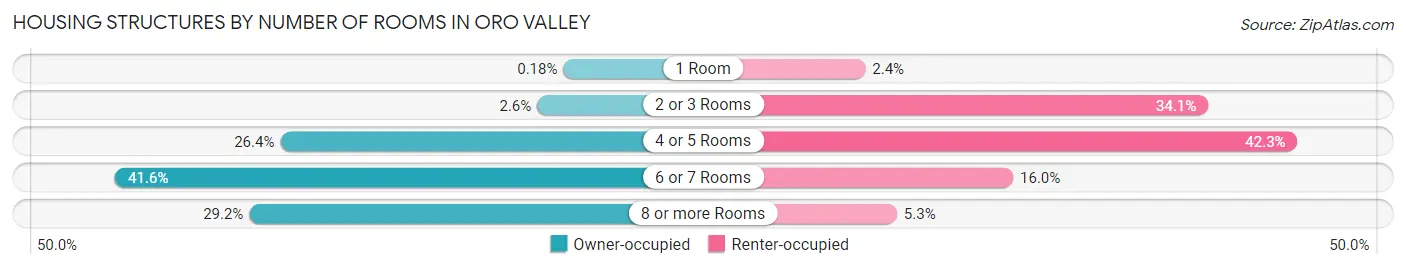
| Number of Rooms | Owner-occupied | Renter-occupied |
| 1 Room | 29 (0.2%) | 115 (2.4%) |
| 2 or 3 Rooms | 419 (2.6%) | 1,668 (34.1%) |
| 4 or 5 Rooms | 4,250 (26.4%) | 2,073 (42.3%) |
| 6 or 7 Rooms | 6,710 (41.6%) | 785 (16.0%) |
| 8 or more Rooms | 4,712 (29.2%) | 258 (5.3%) |
| Total | 16,120 (100.0%) | 4,899 (100.0%) |
Housing Structure by Heating Type in Oro Valley
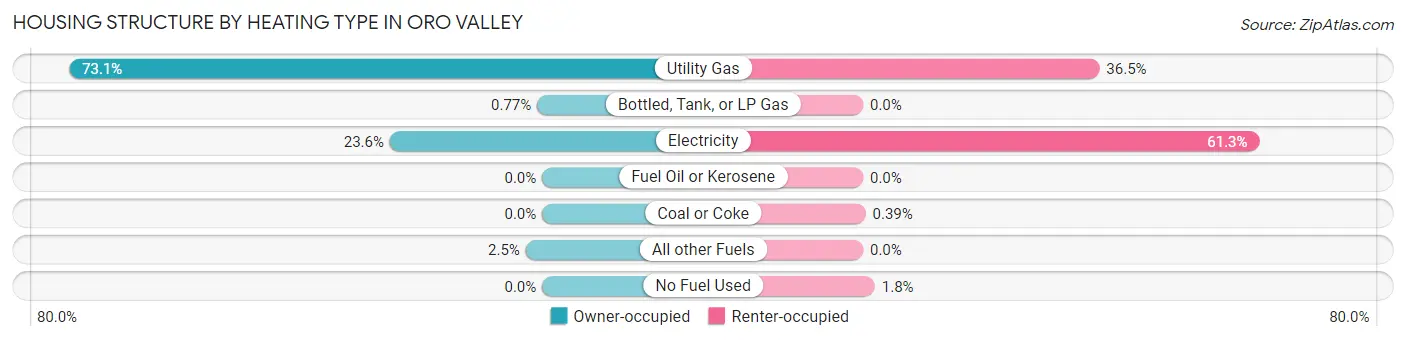
| Heating Type | Owner-occupied | Renter-occupied |
| Utility Gas | 11,790 (73.1%) | 1,790 (36.5%) |
| Bottled, Tank, or LP Gas | 124 (0.8%) | 0 (0.0%) |
| Electricity | 3,796 (23.5%) | 3,001 (61.3%) |
| Fuel Oil or Kerosene | 0 (0.0%) | 0 (0.0%) |
| Coal or Coke | 0 (0.0%) | 19 (0.4%) |
| All other Fuels | 410 (2.5%) | 0 (0.0%) |
| No Fuel Used | 0 (0.0%) | 89 (1.8%) |
| Total | 16,120 (100.0%) | 4,899 (100.0%) |
Household Vehicle Usage in Oro Valley
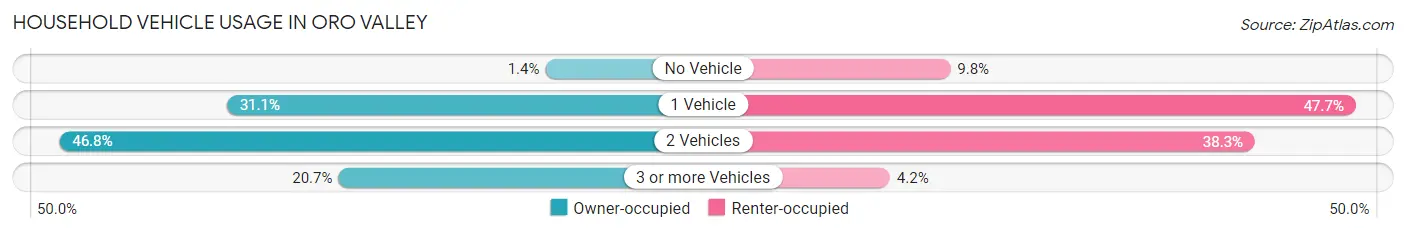
| Vehicles per Household | Owner-occupied | Renter-occupied |
| No Vehicle | 224 (1.4%) | 482 (9.8%) |
| 1 Vehicle | 5,018 (31.1%) | 2,336 (47.7%) |
| 2 Vehicles | 7,538 (46.8%) | 1,875 (38.3%) |
| 3 or more Vehicles | 3,340 (20.7%) | 206 (4.2%) |
| Total | 16,120 (100.0%) | 4,899 (100.0%) |
Real Estate & Mortgages in Oro Valley
Real Estate and Mortgage Overview in Oro Valley
| Characteristic | Without Mortgage | With Mortgage |
| Housing Units | 6,756 | 9,364 |
| Median Property Value | $383,500 | $420,700 |
| Median Household Income | $86,540 | $3,842 |
| Monthly Housing Costs | $595 | $1,737 |
| Real Estate Taxes | $3,402 | $43 |
Property Value by Mortgage Status in Oro Valley
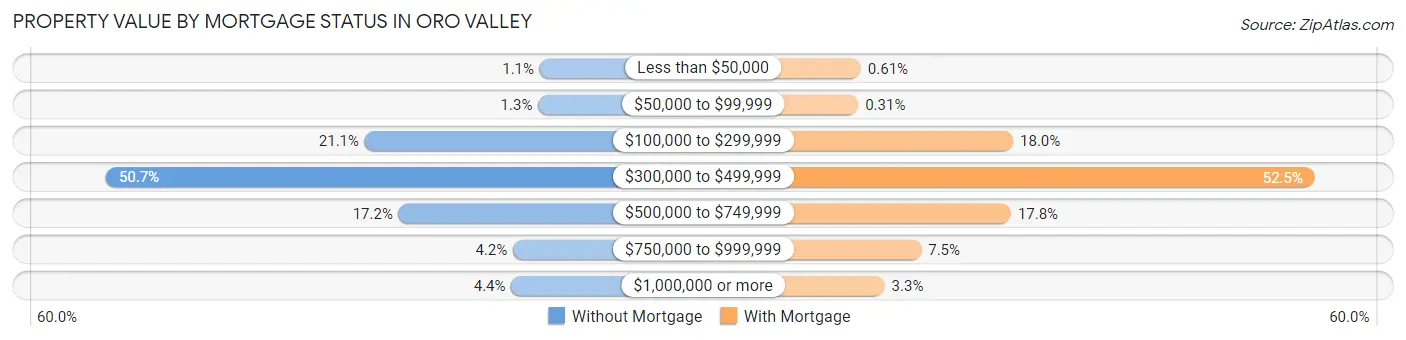
| Property Value | Without Mortgage | With Mortgage |
| Less than $50,000 | 75 (1.1%) | 57 (0.6%) |
| $50,000 to $99,999 | 88 (1.3%) | 29 (0.3%) |
| $100,000 to $299,999 | 1,426 (21.1%) | 1,686 (18.0%) |
| $300,000 to $499,999 | 3,425 (50.7%) | 4,914 (52.5%) |
| $500,000 to $749,999 | 1,165 (17.2%) | 1,663 (17.8%) |
| $750,000 to $999,999 | 282 (4.2%) | 703 (7.5%) |
| $1,000,000 or more | 295 (4.4%) | 312 (3.3%) |
| Total | 6,756 (100.0%) | 9,364 (100.0%) |
Household Income by Mortgage Status in Oro Valley
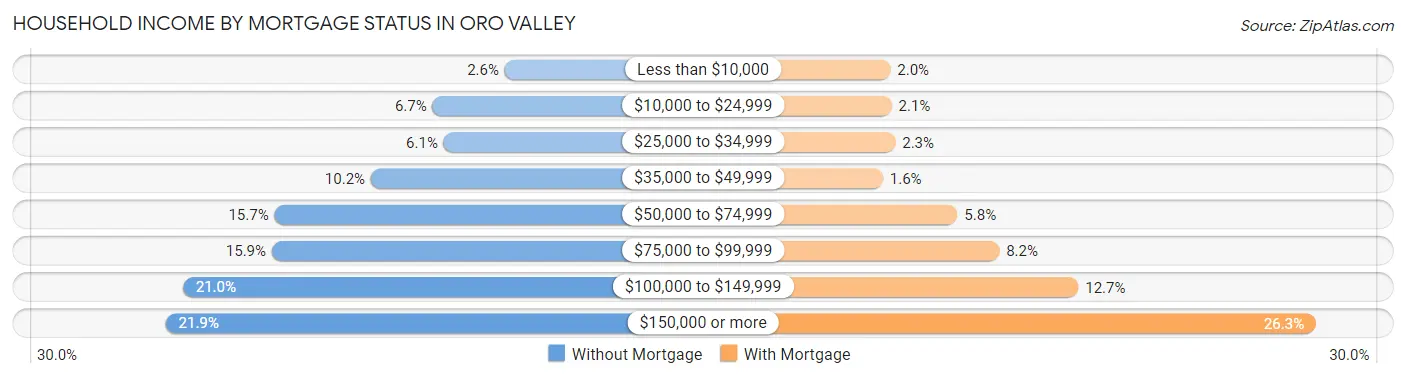
| Household Income | Without Mortgage | With Mortgage |
| Less than $10,000 | 173 (2.6%) | 186 (2.0%) |
| $10,000 to $24,999 | 452 (6.7%) | 193 (2.1%) |
| $25,000 to $34,999 | 409 (6.0%) | 213 (2.3%) |
| $35,000 to $49,999 | 690 (10.2%) | 146 (1.6%) |
| $50,000 to $74,999 | 1,062 (15.7%) | 545 (5.8%) |
| $75,000 to $99,999 | 1,072 (15.9%) | 769 (8.2%) |
| $100,000 to $149,999 | 1,416 (21.0%) | 1,192 (12.7%) |
| $150,000 or more | 1,482 (21.9%) | 2,464 (26.3%) |
| Total | 6,756 (100.0%) | 9,364 (100.0%) |
Property Value to Household Income Ratio in Oro Valley
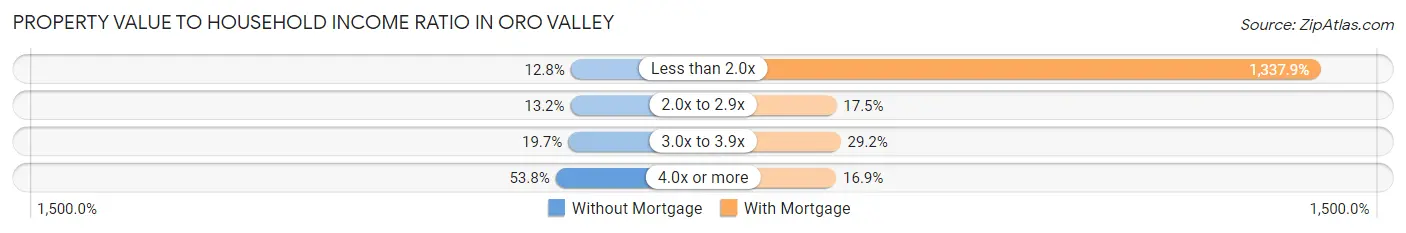
| Value-to-Income Ratio | Without Mortgage | With Mortgage |
| Less than 2.0x | 866 (12.8%) | 125,278 (1,337.9%) |
| 2.0x to 2.9x | 894 (13.2%) | 1,638 (17.5%) |
| 3.0x to 3.9x | 1,329 (19.7%) | 2,734 (29.2%) |
| 4.0x or more | 3,633 (53.8%) | 1,578 (16.9%) |
| Total | 6,756 (100.0%) | 9,364 (100.0%) |
Real Estate Taxes by Mortgage Status in Oro Valley

| Property Taxes | Without Mortgage | With Mortgage |
| Less than $800 | 160 (2.4%) | 38 (0.4%) |
| $800 to $1,499 | 265 (3.9%) | 164 (1.8%) |
| $800 to $1,499 | 6,188 (91.6%) | 722 (7.7%) |
| Total | 6,756 (100.0%) | 9,364 (100.0%) |
Health & Disability in Oro Valley
Health Insurance Coverage by Age in Oro Valley
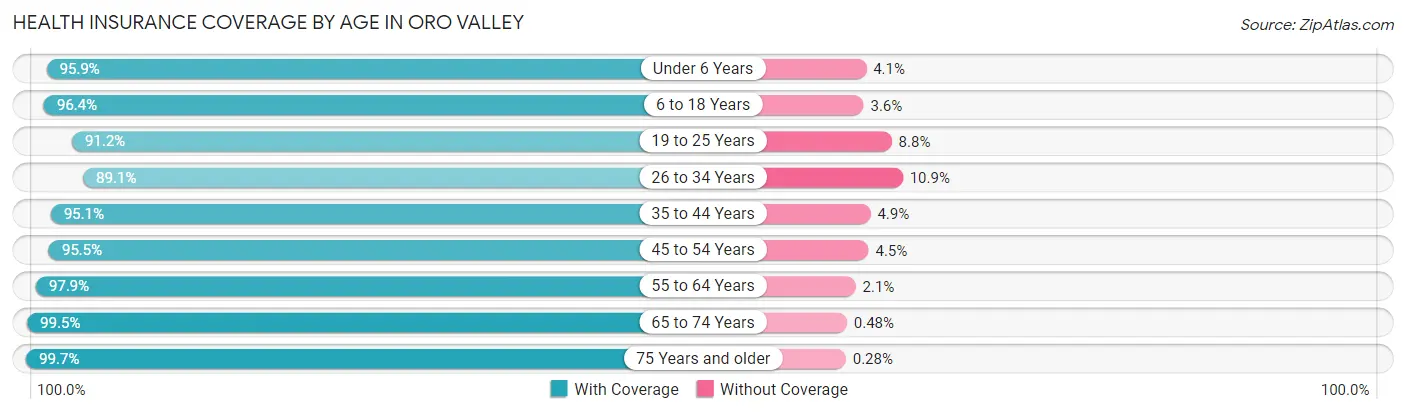
| Age Bracket | With Coverage | Without Coverage |
| Under 6 Years | 1,764 (95.9%) | 75 (4.1%) |
| 6 to 18 Years | 6,359 (96.4%) | 237 (3.6%) |
| 19 to 25 Years | 2,551 (91.2%) | 247 (8.8%) |
| 26 to 34 Years | 2,852 (89.1%) | 349 (10.9%) |
| 35 to 44 Years | 4,153 (95.1%) | 213 (4.9%) |
| 45 to 54 Years | 4,561 (95.5%) | 216 (4.5%) |
| 55 to 64 Years | 6,585 (97.9%) | 142 (2.1%) |
| 65 to 74 Years | 9,263 (99.5%) | 45 (0.5%) |
| 75 Years and older | 7,139 (99.7%) | 20 (0.3%) |
| Total | 45,227 (96.7%) | 1,544 (3.3%) |
Health Insurance Coverage by Citizenship Status in Oro Valley

| Citizenship Status | With Coverage | Without Coverage |
| Native Born | 1,764 (95.9%) | 75 (4.1%) |
| Foreign Born, Citizen | 6,359 (96.4%) | 237 (3.6%) |
| Foreign Born, not a Citizen | 2,551 (91.2%) | 247 (8.8%) |
Health Insurance Coverage by Household Income in Oro Valley
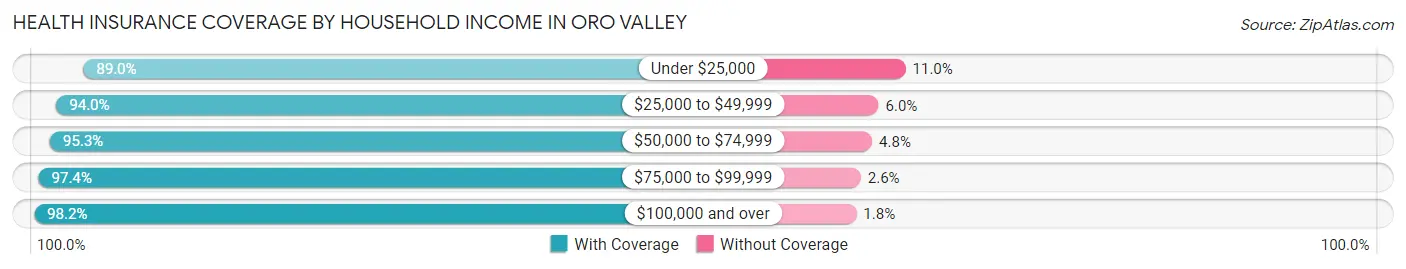
| Household Income | With Coverage | Without Coverage |
| Under $25,000 | 2,996 (89.0%) | 371 (11.0%) |
| $25,000 to $49,999 | 4,405 (94.0%) | 279 (6.0%) |
| $50,000 to $74,999 | 4,749 (95.3%) | 237 (4.8%) |
| $75,000 to $99,999 | 5,811 (97.4%) | 157 (2.6%) |
| $100,000 and over | 27,261 (98.2%) | 500 (1.8%) |
Public vs Private Health Insurance Coverage by Age in Oro Valley
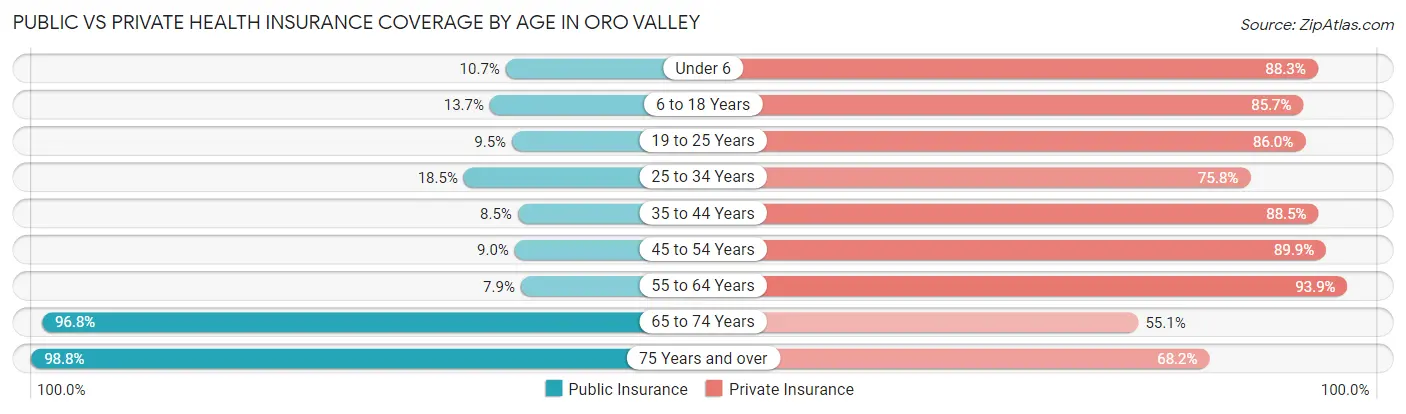
| Age Bracket | Public Insurance | Private Insurance |
| Under 6 | 197 (10.7%) | 1,624 (88.3%) |
| 6 to 18 Years | 901 (13.7%) | 5,651 (85.7%) |
| 19 to 25 Years | 267 (9.5%) | 2,406 (86.0%) |
| 25 to 34 Years | 592 (18.5%) | 2,426 (75.8%) |
| 35 to 44 Years | 370 (8.5%) | 3,862 (88.5%) |
| 45 to 54 Years | 432 (9.0%) | 4,294 (89.9%) |
| 55 to 64 Years | 532 (7.9%) | 6,313 (93.9%) |
| 65 to 74 Years | 9,007 (96.8%) | 5,126 (55.1%) |
| 75 Years and over | 7,071 (98.8%) | 4,883 (68.2%) |
| Total | 19,369 (41.4%) | 36,585 (78.2%) |
Disability Status by Sex by Age in Oro Valley
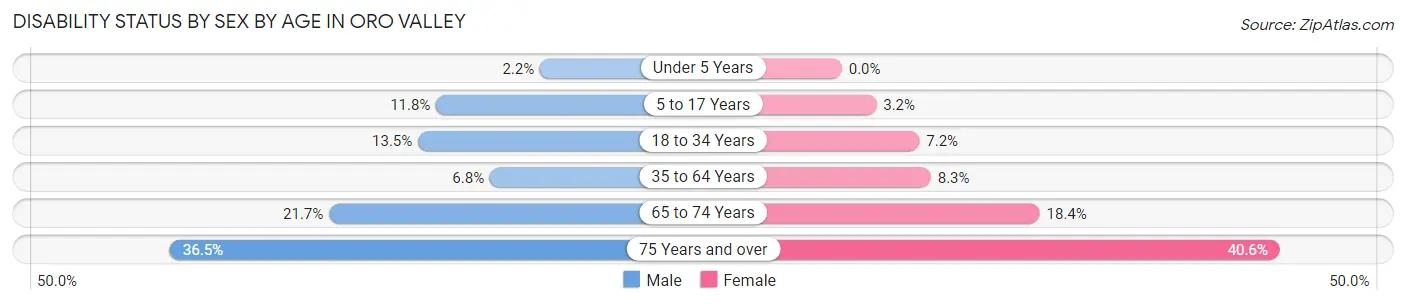
| Age Bracket | Male | Female |
| Under 5 Years | 12 (2.2%) | 0 (0.0%) |
| 5 to 17 Years | 356 (11.8%) | 118 (3.2%) |
| 18 to 34 Years | 408 (13.5%) | 234 (7.2%) |
| 35 to 64 Years | 519 (6.8%) | 681 (8.3%) |
| 65 to 74 Years | 978 (21.7%) | 883 (18.4%) |
| 75 Years and over | 1,233 (36.5%) | 1,537 (40.6%) |
Disability Class by Sex by Age in Oro Valley
Disability Class: Hearing Difficulty
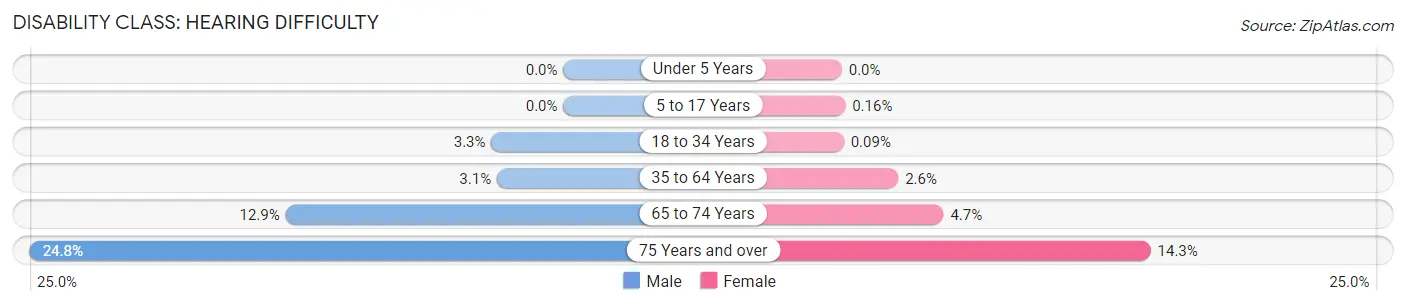
| Age Bracket | Male | Female |
| Under 5 Years | 0 (0.0%) | 0 (0.0%) |
| 5 to 17 Years | 0 (0.0%) | 6 (0.2%) |
| 18 to 34 Years | 101 (3.3%) | 3 (0.1%) |
| 35 to 64 Years | 235 (3.1%) | 216 (2.6%) |
| 65 to 74 Years | 580 (12.9%) | 227 (4.7%) |
| 75 Years and over | 836 (24.8%) | 542 (14.3%) |
Disability Class: Vision Difficulty
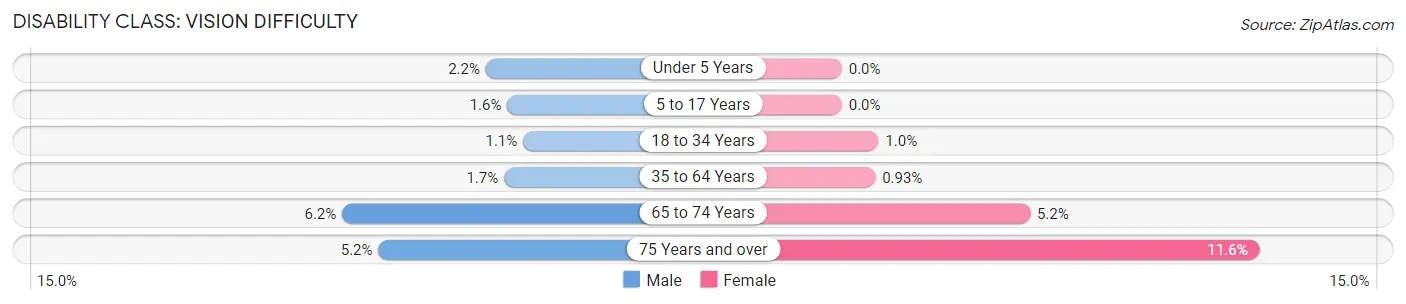
| Age Bracket | Male | Female |
| Under 5 Years | 12 (2.2%) | 0 (0.0%) |
| 5 to 17 Years | 47 (1.6%) | 0 (0.0%) |
| 18 to 34 Years | 34 (1.1%) | 33 (1.0%) |
| 35 to 64 Years | 126 (1.7%) | 77 (0.9%) |
| 65 to 74 Years | 277 (6.2%) | 252 (5.2%) |
| 75 Years and over | 174 (5.1%) | 440 (11.6%) |
Disability Class: Cognitive Difficulty
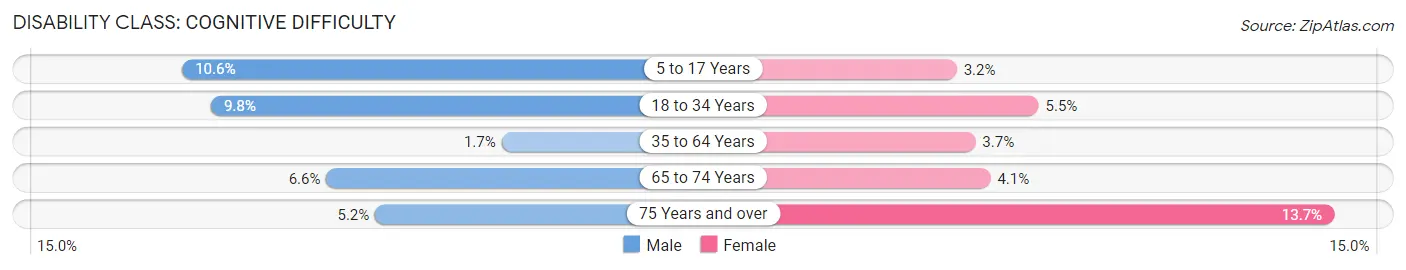
| Age Bracket | Male | Female |
| 5 to 17 Years | 320 (10.6%) | 118 (3.2%) |
| 18 to 34 Years | 297 (9.8%) | 178 (5.5%) |
| 35 to 64 Years | 131 (1.7%) | 307 (3.7%) |
| 65 to 74 Years | 297 (6.6%) | 199 (4.1%) |
| 75 Years and over | 177 (5.2%) | 518 (13.7%) |
Disability Class: Ambulatory Difficulty
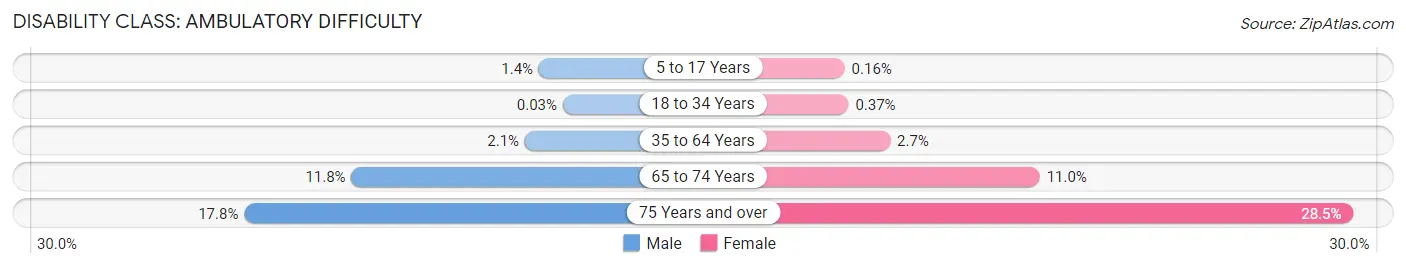
| Age Bracket | Male | Female |
| 5 to 17 Years | 41 (1.4%) | 6 (0.2%) |
| 18 to 34 Years | 1 (0.0%) | 12 (0.4%) |
| 35 to 64 Years | 163 (2.1%) | 222 (2.7%) |
| 65 to 74 Years | 531 (11.8%) | 530 (11.0%) |
| 75 Years and over | 600 (17.8%) | 1,077 (28.5%) |
Disability Class: Self-Care Difficulty
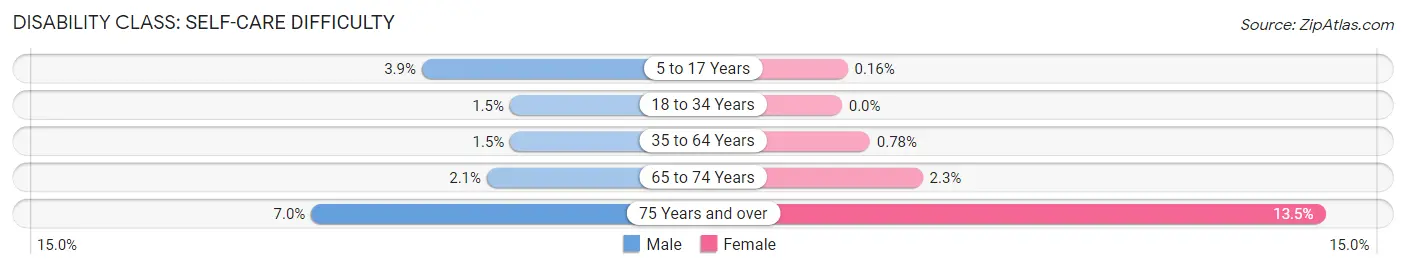
| Age Bracket | Male | Female |
| 5 to 17 Years | 119 (3.9%) | 6 (0.2%) |
| 18 to 34 Years | 45 (1.5%) | 0 (0.0%) |
| 35 to 64 Years | 113 (1.5%) | 64 (0.8%) |
| 65 to 74 Years | 96 (2.1%) | 108 (2.2%) |
| 75 Years and over | 237 (7.0%) | 509 (13.5%) |
Technology Access in Oro Valley
Computing Device Access in Oro Valley
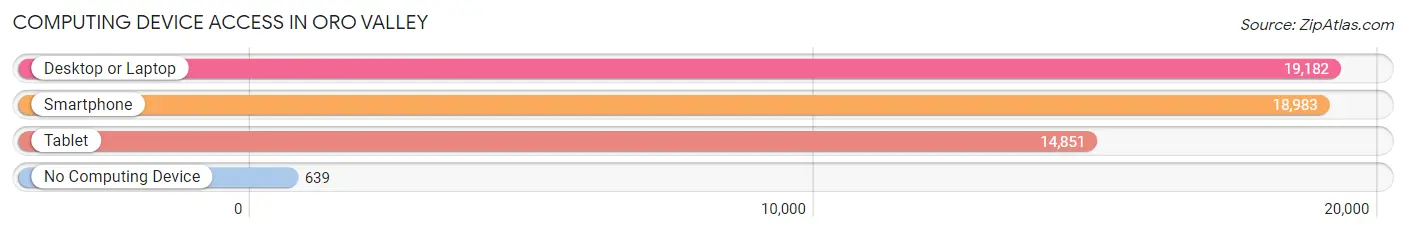
| Device Type | # Households | % Households |
| Desktop or Laptop | 19,182 | 91.3% |
| Smartphone | 18,983 | 90.3% |
| Tablet | 14,851 | 70.7% |
| No Computing Device | 639 | 3.0% |
| Total | 21,019 | 100.0% |
Internet Access in Oro Valley
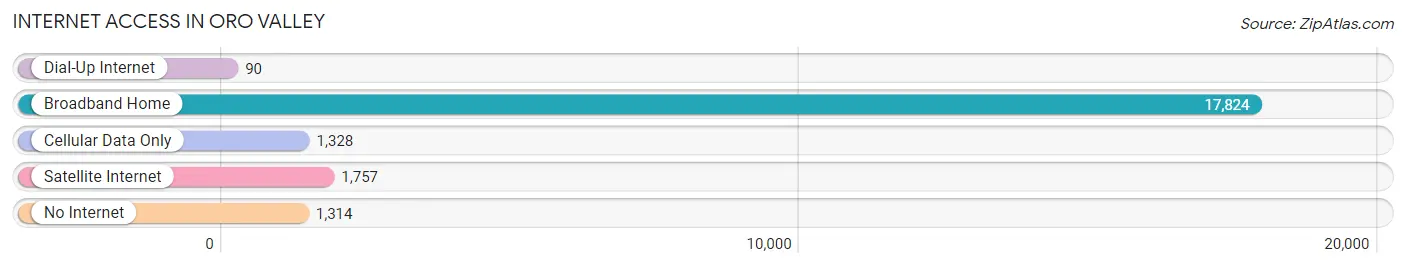
| Internet Type | # Households | % Households |
| Dial-Up Internet | 90 | 0.4% |
| Broadband Home | 17,824 | 84.8% |
| Cellular Data Only | 1,328 | 6.3% |
| Satellite Internet | 1,757 | 8.4% |
| No Internet | 1,314 | 6.2% |
| Total | 21,019 | 100.0% |
Oro Valley Summary
Oro Valley, Arizona is a town located in the northwest corner of Pima County, Arizona. It is situated in the foothills of the Santa Catalina Mountains, approximately 6 miles north of Tucson. The town was incorporated in 1974 and has a population of approximately 44,000 people.
Geography
Oro Valley is located in the Sonoran Desert, which is characterized by hot summers and mild winters. The town is situated at an elevation of 2,620 feet and is surrounded by the Santa Catalina Mountains to the north, the Tortolita Mountains to the west, and the Tucson Mountains to the south. The town is located in the Tucson metropolitan area and is bordered by the towns of Marana, Catalina, and Tucson.
The town is divided into two distinct areas: the eastern portion is primarily residential, while the western portion is primarily commercial. The town is home to several parks, including the Oro Valley Community Park, the Oro Valley Aquatic Center, and the Oro Valley Country Club.
History
Oro Valley was originally inhabited by the Hohokam people, who lived in the area from approximately 300 BC to 1450 AD. The area was later inhabited by the Tohono O’odham people, who lived in the area until the late 19th century.
In the late 19th century, the area was settled by ranchers and farmers, who established the town of Oro Valley. The town was named after the nearby Santa Catalina Mountains, which were known as the “Oro Valley” by the local Native Americans.
In 1974, the town was incorporated and has since grown to become one of the most affluent communities in Arizona.
Economy
Oro Valley is home to a diverse economy, with a variety of industries represented. The town is home to several large employers, including Honeywell, Raytheon, and the University of Arizona. The town is also home to a number of small businesses, including restaurants, retail stores, and professional services.
The town is also home to a number of technology companies, including Oracle, Sanofi, and Ventana Medical Systems. The town is also home to a number of medical facilities, including the Oro Valley Hospital and the Northwest Medical Center.
Demographics
As of the 2010 census, the population of Oro Valley was 44,011. The racial makeup of the town was 87.3% White, 2.2% African American, 0.7% Native American, 4.2% Asian, 0.1% Pacific Islander, 3.2% from other races, and 2.3% from two or more races. Hispanic or Latino of any race were 11.2% of the population.
The median income for a household in the town was $76,845, and the median income for a family was $86,945. The per capita income for the town was $37,945. About 4.2% of families and 5.7% of the population were below the poverty line, including 6.3% of those under age 18 and 4.2% of those age 65 or over.
Conclusion
Oro Valley, Arizona is a town located in the northwest corner of Pima County, Arizona. It is situated in the foothills of the Santa Catalina Mountains, approximately 6 miles north of Tucson. The town was incorporated in 1974 and has a population of approximately 44,000 people. The town is home to a diverse economy, with a variety of industries represented. The town is also home to a number of technology companies, medical facilities, and small businesses. The population of Oro Valley is predominantly White, with a significant Hispanic or Latino population. The median income for a household in the town is $76,845, and the median income for a family is $86,945.
Common Questions
What is Per Capita Income in Oro Valley?
Per Capita income in Oro Valley is $58,527.
What is the Median Family Income in Oro Valley?
Median Family Income in Oro Valley is $119,317.
What is the Median Household income in Oro Valley?
Median Household Income in Oro Valley is $101,394.
What is Income or Wage Gap in Oro Valley?
Income or Wage Gap in Oro Valley is 35.6%.
Women in Oro Valley earn 64.4 cents for every dollar earned by a man.
What is Family Income Deficit in Oro Valley?
Family Income Deficit in Oro Valley is $12,482.
Families that are below poverty line in Oro Valley earn $12,482 less on average than the poverty threshold level.
What is Inequality or Gini Index in Oro Valley?
Inequality or Gini Index in Oro Valley is 0.44.
What is the Total Population of Oro Valley?
Total Population of Oro Valley is 47,053.
What is the Total Male Population of Oro Valley?
Total Male Population of Oro Valley is 22,203.
What is the Total Female Population of Oro Valley?
Total Female Population of Oro Valley is 24,850.
What is the Ratio of Males per 100 Females in Oro Valley?
There are 89.35 Males per 100 Females in Oro Valley.
What is the Ratio of Females per 100 Males in Oro Valley?
There are 111.92 Females per 100 Males in Oro Valley.
What is the Median Population Age in Oro Valley?
Median Population Age in Oro Valley is 54.5 Years.
What is the Average Family Size in Oro Valley
Average Family Size in Oro Valley is 2.7 People.
What is the Average Household Size in Oro Valley
Average Household Size in Oro Valley is 2.2 People.
How Large is the Labor Force in Oro Valley?
There are 19,213 People in the Labor Forcein in Oro Valley.
What is the Percentage of People in the Labor Force in Oro Valley?
48.0% of People are in the Labor Force in Oro Valley.
What is the Unemployment Rate in Oro Valley?
Unemployment Rate in Oro Valley is 2.9%.