Prescott, AZ Map & Demographics
Prescott Map
Prescott Overview
$46,076
PER CAPITA INCOME
$87,600
AVG FAMILY INCOME
$66,330
AVG HOUSEHOLD INCOME
12.4%
WAGE / INCOME GAP [ % ]
87.6¢/ $1
WAGE / INCOME GAP [ $ ]
$9,866
FAMILY INCOME DEFICIT
0.49
INEQUALITY / GINI INDEX
46,054
TOTAL POPULATION
22,622
MALE POPULATION
23,432
FEMALE POPULATION
96.54
MALES / 100 FEMALES
103.58
FEMALES / 100 MALES
60.5
MEDIAN AGE
2.5
AVG FAMILY SIZE
2.0
AVG HOUSEHOLD SIZE
16,951
LABOR FORCE [ PEOPLE ]
41.1%
PERCENT IN LABOR FORCE
5.2%
UNEMPLOYMENT RATE
Income in Prescott
Income Overview in Prescott
Per Capita Income in Prescott is $46,076, while median incomes of families and households are $87,600 and $66,330 respectively.
| Characteristic | Number | Measure |
| Per Capita Income | 46,054 | $46,076 |
| Median Family Income | 12,662 | $87,600 |
| Mean Family Income | 12,662 | $119,836 |
| Median Household Income | 21,803 | $66,330 |
| Mean Household Income | 21,803 | $96,801 |
| Income Deficit | 12,662 | $9,866 |
| Wage / Income Gap (%) | 46,054 | 12.35% |
| Wage / Income Gap ($) | 46,054 | 87.65¢ per $1 |
| Gini / Inequality Index | 46,054 | 0.49 |
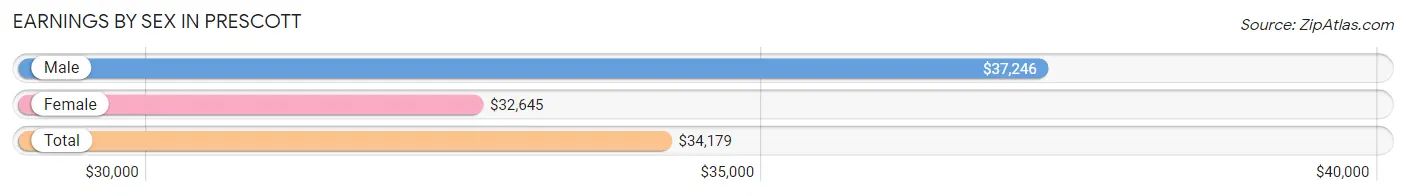
Earnings by Sex in Prescott
Average Earnings in Prescott are $34,179, $37,246 for men and $32,645 for women, a difference of 12.3%.
| Sex | Number | Average Earnings |
| Male | 9,584 (50.8%) | $37,246 |
| Female | 9,269 (49.2%) | $32,645 |
| Total | 18,853 (100.0%) | $34,179 |
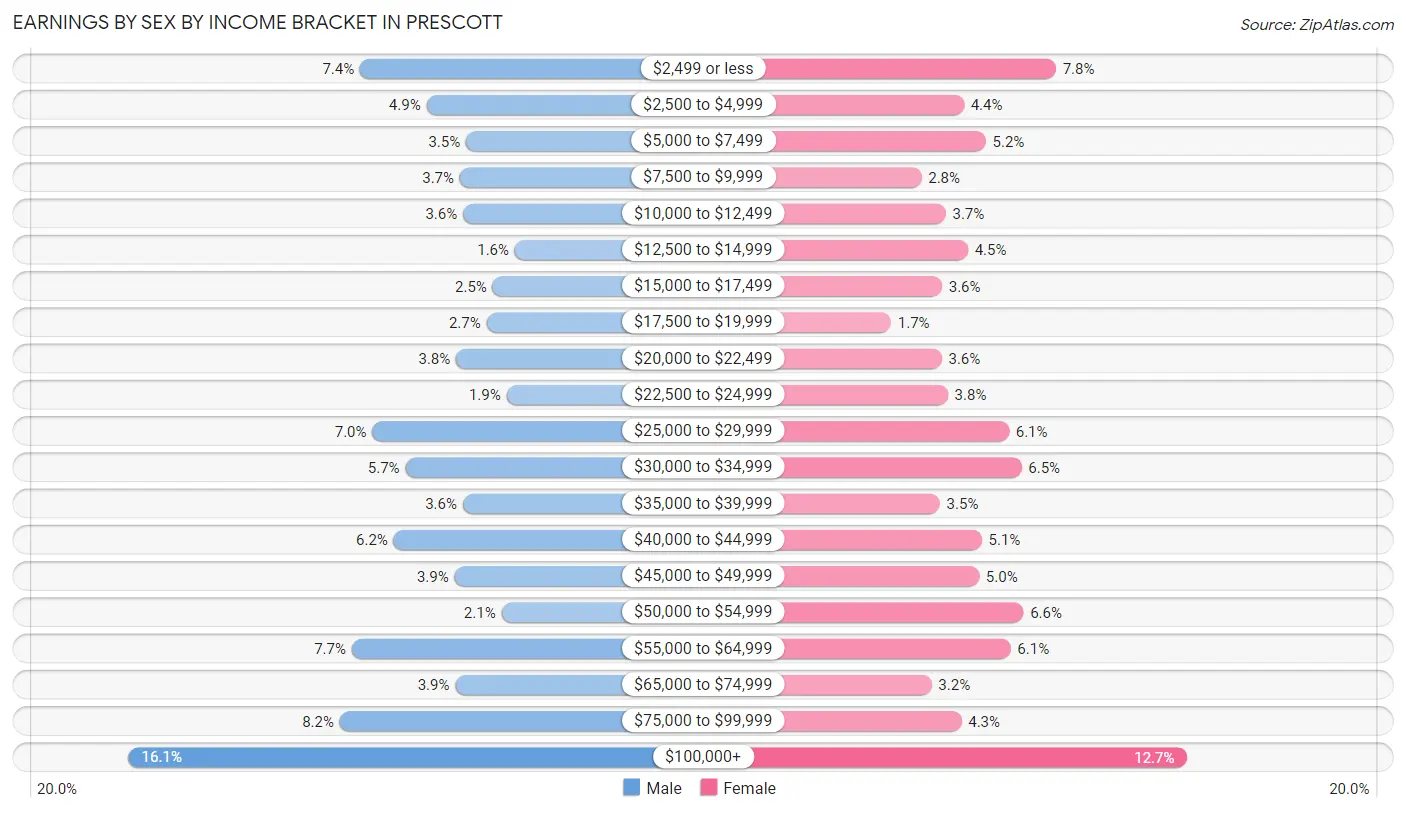
Earnings by Sex by Income Bracket in Prescott
The most common earnings brackets in Prescott are $100,000+ for men (1,543 | 16.1%) and $100,000+ for women (1,179 | 12.7%).
| Income | Male | Female |
| $2,499 or less | 712 (7.4%) | 726 (7.8%) |
| $2,500 to $4,999 | 473 (4.9%) | 406 (4.4%) |
| $5,000 to $7,499 | 332 (3.5%) | 482 (5.2%) |
| $7,500 to $9,999 | 354 (3.7%) | 259 (2.8%) |
| $10,000 to $12,499 | 342 (3.6%) | 343 (3.7%) |
| $12,500 to $14,999 | 156 (1.6%) | 420 (4.5%) |
| $15,000 to $17,499 | 236 (2.5%) | 330 (3.6%) |
| $17,500 to $19,999 | 258 (2.7%) | 153 (1.7%) |
| $20,000 to $22,499 | 367 (3.8%) | 329 (3.5%) |
| $22,500 to $24,999 | 186 (1.9%) | 350 (3.8%) |
| $25,000 to $29,999 | 668 (7.0%) | 563 (6.1%) |
| $30,000 to $34,999 | 549 (5.7%) | 606 (6.5%) |
| $35,000 to $39,999 | 343 (3.6%) | 323 (3.5%) |
| $40,000 to $44,999 | 591 (6.2%) | 468 (5.1%) |
| $45,000 to $49,999 | 373 (3.9%) | 459 (5.0%) |
| $50,000 to $54,999 | 204 (2.1%) | 613 (6.6%) |
| $55,000 to $64,999 | 742 (7.7%) | 568 (6.1%) |
| $65,000 to $74,999 | 370 (3.9%) | 294 (3.2%) |
| $75,000 to $99,999 | 785 (8.2%) | 398 (4.3%) |
| $100,000+ | 1,543 (16.1%) | 1,179 (12.7%) |
| Total | 9,584 (100.0%) | 9,269 (100.0%) |
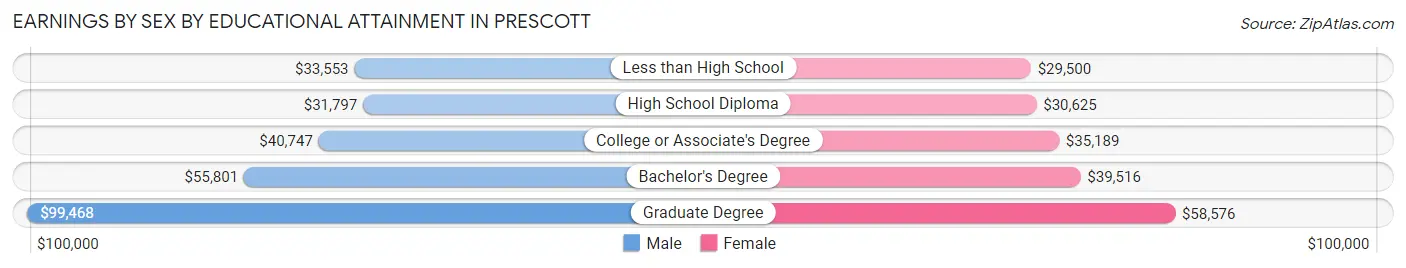
Earnings by Sex by Educational Attainment in Prescott
Average earnings in Prescott are $45,783 for men and $38,864 for women, a difference of 15.1%. Men with an educational attainment of graduate degree enjoy the highest average annual earnings of $99,468, while those with high school diploma education earn the least with $31,797. Women with an educational attainment of graduate degree earn the most with the average annual earnings of $58,576, while those with less than high school education have the smallest earnings of $29,500.
| Educational Attainment | Male Income | Female Income |
| Less than High School | $33,553 | $29,500 |
| High School Diploma | $31,797 | $30,625 |
| College or Associate's Degree | $40,747 | $35,189 |
| Bachelor's Degree | $55,801 | $39,516 |
| Graduate Degree | $99,468 | $58,576 |
| Total | $45,783 | $38,864 |
Family Income in Prescott
Family Income Brackets in Prescott
According to the Prescott family income data, there are 2,520 families falling into the $100,000 to $149,999 income range, which is the most common income bracket and makes up 19.9% of all families. Conversely, the $10,000 to $14,999 income bracket is the least frequent group with only 228 families (1.8%) belonging to this category.
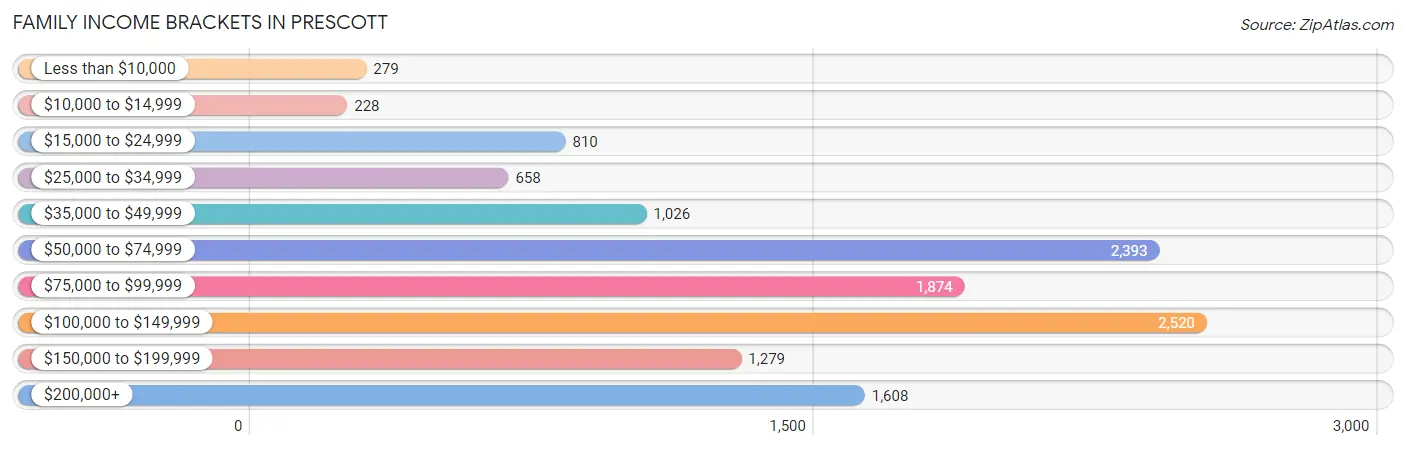
| Income Bracket | # Families | % Families |
| Less than $10,000 | 279 | 2.2% |
| $10,000 to $14,999 | 228 | 1.8% |
| $15,000 to $24,999 | 810 | 6.4% |
| $25,000 to $34,999 | 658 | 5.2% |
| $35,000 to $49,999 | 1,026 | 8.1% |
| $50,000 to $74,999 | 2,393 | 18.9% |
| $75,000 to $99,999 | 1,874 | 14.8% |
| $100,000 to $149,999 | 2,520 | 19.9% |
| $150,000 to $199,999 | 1,279 | 10.1% |
| $200,000+ | 1,608 | 12.7% |
Family Income by Famaliy Size in Prescott
5-person families (381 | 3.0%) account for the highest median family income in Prescott with $121,736 per family, while 2-person families (9,157 | 72.3%) have the highest median income of $40,688 per family member.
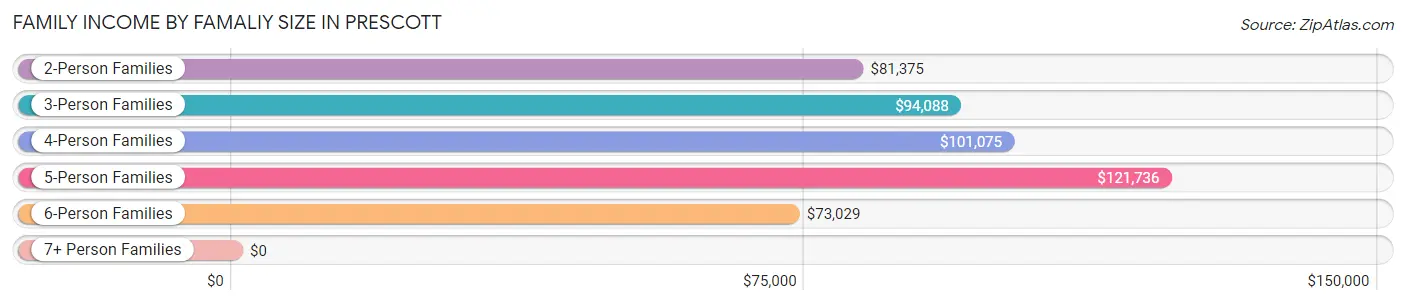
| Income Bracket | # Families | Median Income |
| 2-Person Families | 9,157 (72.3%) | $81,375 |
| 3-Person Families | 1,875 (14.8%) | $94,088 |
| 4-Person Families | 1,107 (8.7%) | $101,075 |
| 5-Person Families | 381 (3.0%) | $121,736 |
| 6-Person Families | 133 (1.1%) | $73,029 |
| 7+ Person Families | 9 (0.1%) | $0 |
| Total | 12,662 (100.0%) | $87,600 |
Family Income by Number of Earners in Prescott
The median family income in Prescott is $87,600, with families comprising 3+ earners (669) having the highest median family income of $152,969, while families with no earners (5,529) have the lowest median family income of $71,396, accounting for 5.3% and 43.7% of families, respectively.
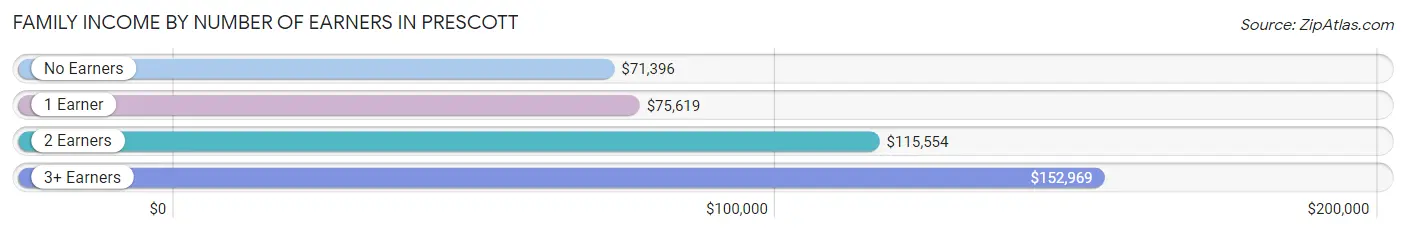
| Number of Earners | # Families | Median Income |
| No Earners | 5,529 (43.7%) | $71,396 |
| 1 Earner | 3,389 (26.8%) | $75,619 |
| 2 Earners | 3,075 (24.3%) | $115,554 |
| 3+ Earners | 669 (5.3%) | $152,969 |
| Total | 12,662 (100.0%) | $87,600 |
Household Income in Prescott
Household Income Brackets in Prescott
With 4,361 households falling in the category, the $50,000 to $74,999 income range is the most frequent in Prescott, accounting for 20.0% of all households. In contrast, only 589 households (2.7%) fall into the $10,000 to $14,999 income bracket, making it the least populous group.
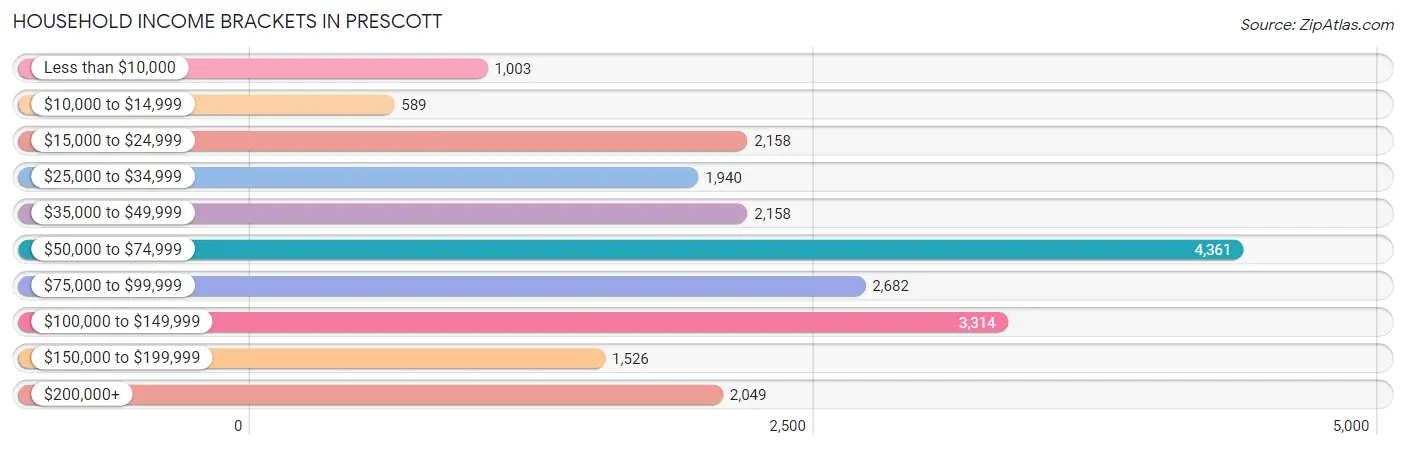
| Income Bracket | # Households | % Households |
| Less than $10,000 | 1,003 | 4.6% |
| $10,000 to $14,999 | 589 | 2.7% |
| $15,000 to $24,999 | 2,158 | 9.9% |
| $25,000 to $34,999 | 1,940 | 8.9% |
| $35,000 to $49,999 | 2,158 | 9.9% |
| $50,000 to $74,999 | 4,361 | 20.0% |
| $75,000 to $99,999 | 2,682 | 12.3% |
| $100,000 to $149,999 | 3,314 | 15.2% |
| $150,000 to $199,999 | 1,526 | 7.0% |
| $200,000+ | 2,049 | 9.4% |
Household Income by Householder Age in Prescott
The median household income in Prescott is $66,330, with the highest median household income of $72,889 found in the 45 to 64 years age bracket for the primary householder. A total of 6,761 households (31.0%) fall into this category. Meanwhile, the 15 to 24 years age bracket for the primary householder has the lowest median household income of $28,589, with 724 households (3.3%) in this group.
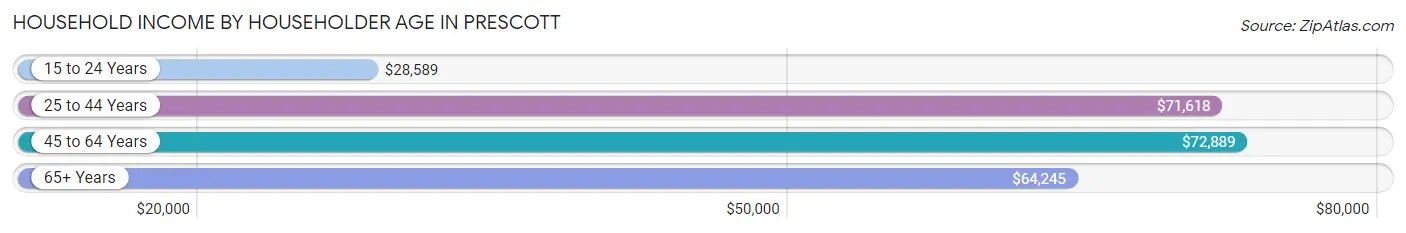
| Income Bracket | # Households | Median Income |
| 15 to 24 Years | 724 (3.3%) | $28,589 |
| 25 to 44 Years | 2,852 (13.1%) | $71,618 |
| 45 to 64 Years | 6,761 (31.0%) | $72,889 |
| 65+ Years | 11,466 (52.6%) | $64,245 |
| Total | 21,803 (100.0%) | $66,330 |
Poverty in Prescott
Income Below Poverty by Sex and Age in Prescott
With 10.9% poverty level for males and 11.7% for females among the residents of Prescott, 18 to 24 year old males and 18 to 24 year old females are the most vulnerable to poverty, with 403 males (32.2%) and 434 females (36.9%) in their respective age groups living below the poverty level.
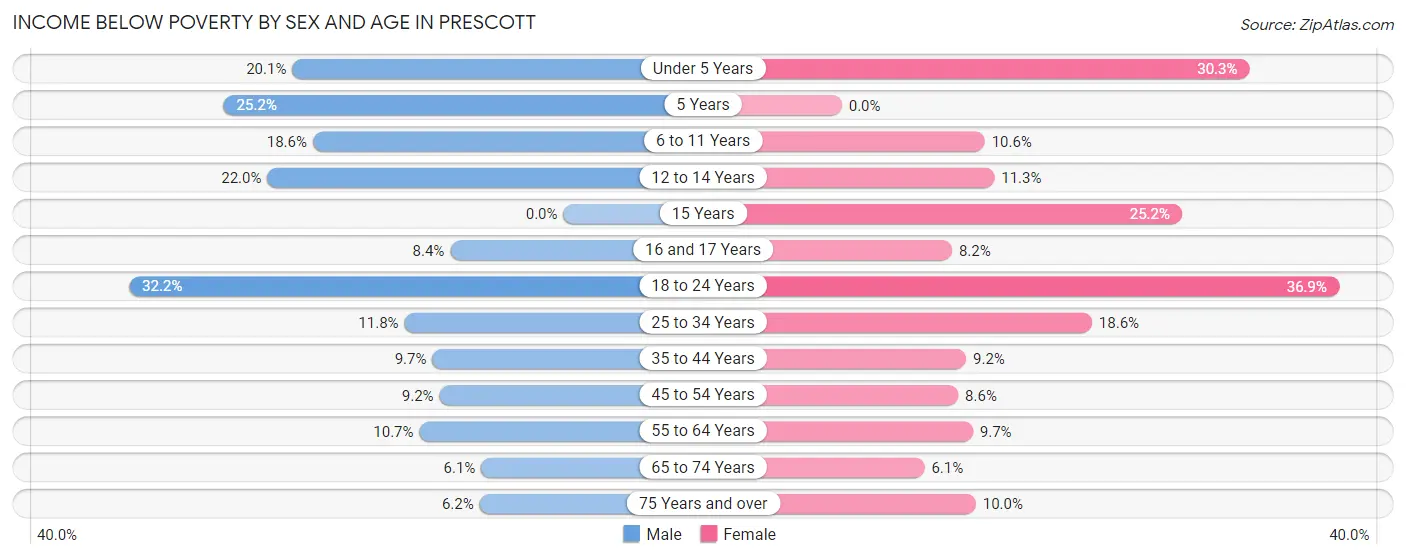
| Age Bracket | Male | Female |
| Under 5 Years | 152 (20.1%) | 219 (30.2%) |
| 5 Years | 27 (25.2%) | 0 (0.0%) |
| 6 to 11 Years | 173 (18.6%) | 78 (10.6%) |
| 12 to 14 Years | 133 (22.0%) | 43 (11.3%) |
| 15 Years | 0 (0.0%) | 53 (25.2%) |
| 16 and 17 Years | 22 (8.4%) | 26 (8.2%) |
| 18 to 24 Years | 403 (32.2%) | 434 (36.9%) |
| 25 to 34 Years | 204 (11.8%) | 371 (18.6%) |
| 35 to 44 Years | 132 (9.7%) | 123 (9.2%) |
| 45 to 54 Years | 168 (9.2%) | 176 (8.6%) |
| 55 to 64 Years | 384 (10.7%) | 406 (9.7%) |
| 65 to 74 Years | 314 (6.1%) | 344 (6.1%) |
| 75 Years and over | 228 (6.2%) | 401 (10.0%) |
| Total | 2,340 (10.9%) | 2,674 (11.7%) |
Income Above Poverty by Sex and Age in Prescott
According to the poverty statistics in Prescott, males aged 15 years and females aged 5 years are the age groups that are most secure financially, with 100.0% of males and 100.0% of females in these age groups living above the poverty line.
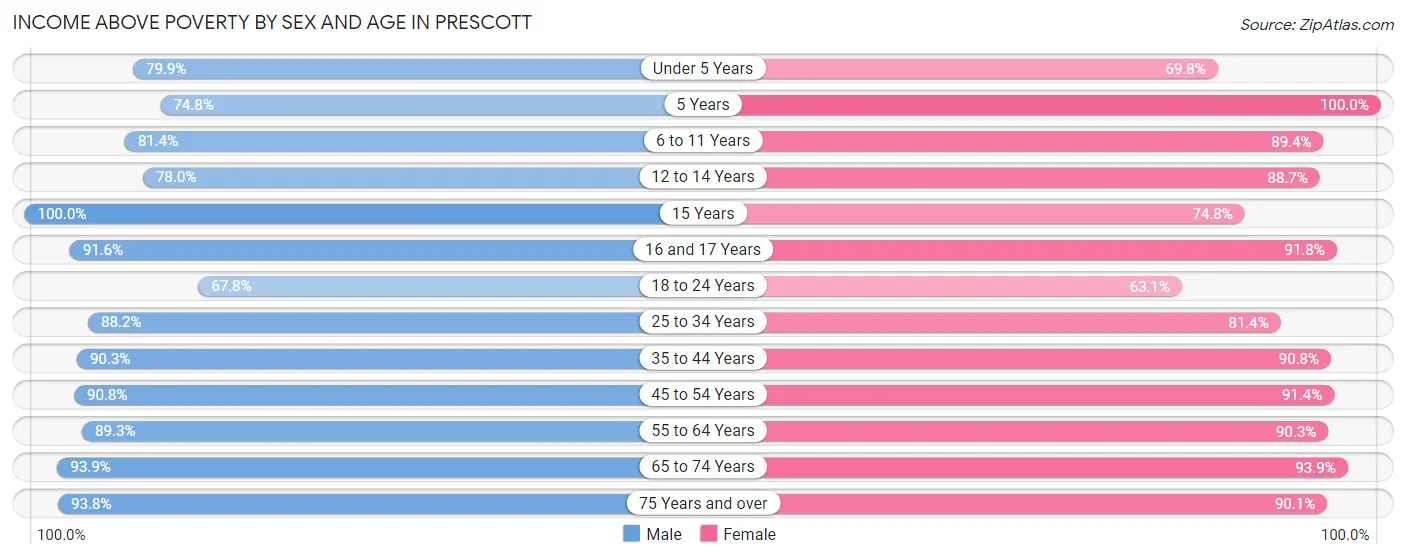
| Age Bracket | Male | Female |
| Under 5 Years | 603 (79.9%) | 505 (69.8%) |
| 5 Years | 80 (74.8%) | 48 (100.0%) |
| 6 to 11 Years | 757 (81.4%) | 657 (89.4%) |
| 12 to 14 Years | 472 (78.0%) | 337 (88.7%) |
| 15 Years | 225 (100.0%) | 157 (74.8%) |
| 16 and 17 Years | 240 (91.6%) | 292 (91.8%) |
| 18 to 24 Years | 847 (67.8%) | 742 (63.1%) |
| 25 to 34 Years | 1,525 (88.2%) | 1,627 (81.4%) |
| 35 to 44 Years | 1,225 (90.3%) | 1,210 (90.8%) |
| 45 to 54 Years | 1,659 (90.8%) | 1,862 (91.4%) |
| 55 to 64 Years | 3,207 (89.3%) | 3,766 (90.3%) |
| 65 to 74 Years | 4,835 (93.9%) | 5,258 (93.9%) |
| 75 Years and over | 3,440 (93.8%) | 3,629 (90.0%) |
| Total | 19,115 (89.1%) | 20,090 (88.2%) |
Income Below Poverty Among Married-Couple Families in Prescott
The poverty statistics for married-couple families in Prescott show that 3.9% or 414 of the total 10,694 families live below the poverty line. Families with 3 or 4 children have the highest poverty rate of 24.6%, comprising of 65 families. On the other hand, families with 5 or more children have the lowest poverty rate of 0.0%, which includes 0 families.
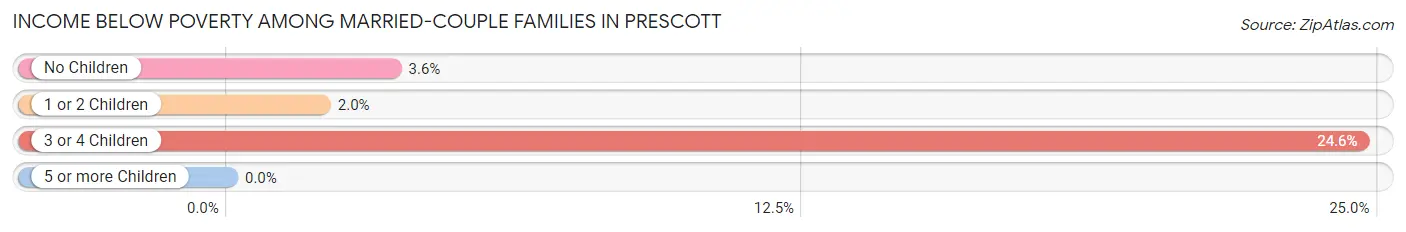
| Children | Above Poverty | Below Poverty |
| No Children | 8,664 (96.4%) | 320 (3.6%) |
| 1 or 2 Children | 1,408 (98.0%) | 29 (2.0%) |
| 3 or 4 Children | 199 (75.4%) | 65 (24.6%) |
| 5 or more Children | 9 (100.0%) | 0 (0.0%) |
| Total | 10,280 (96.1%) | 414 (3.9%) |
Income Below Poverty Among Single-Parent Households in Prescott
According to the poverty data in Prescott, 17.6% or 81 single-father households and 22.5% or 339 single-mother households are living below the poverty line. Among single-father households, those with 1 or 2 children have the highest poverty rate, with 81 households (40.7%) experiencing poverty. Likewise, among single-mother households, those with 3 or 4 children have the highest poverty rate, with 87 households (89.7%) falling below the poverty line.
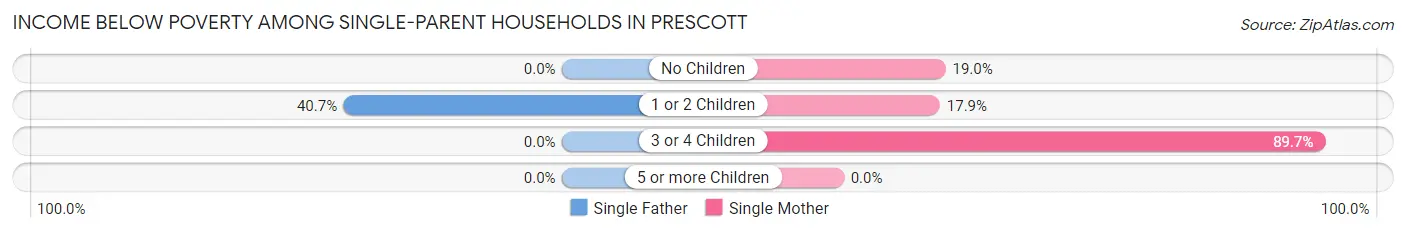
| Children | Single Father | Single Mother |
| No Children | 0 (0.0%) | 123 (19.0%) |
| 1 or 2 Children | 81 (40.7%) | 129 (17.9%) |
| 3 or 4 Children | 0 (0.0%) | 87 (89.7%) |
| 5 or more Children | 0 (0.0%) | 0 (0.0%) |
| Total | 81 (17.6%) | 339 (22.5%) |
Income Below Poverty Among Married-Couple vs Single-Parent Households in Prescott
The poverty data for Prescott shows that 414 of the married-couple family households (3.9%) and 420 of the single-parent households (21.3%) are living below the poverty level. Within the married-couple family households, those with 3 or 4 children have the highest poverty rate, with 65 households (24.6%) falling below the poverty line. Among the single-parent households, those with 3 or 4 children have the highest poverty rate, with 87 household (45.3%) living below poverty.
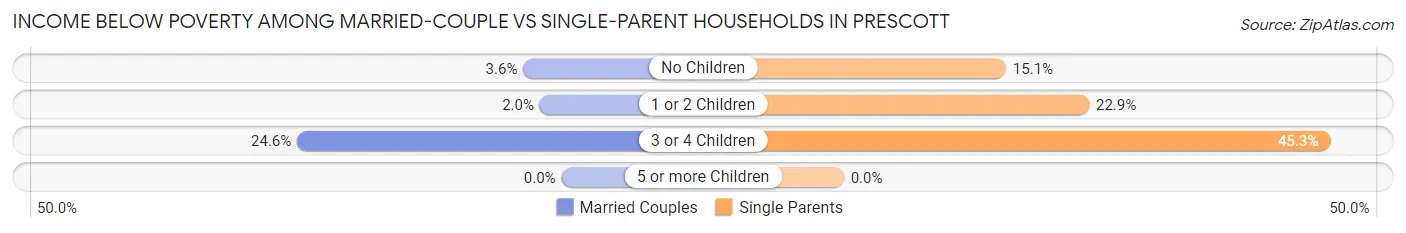
| Children | Married-Couple Families | Single-Parent Households |
| No Children | 320 (3.6%) | 123 (15.1%) |
| 1 or 2 Children | 29 (2.0%) | 210 (22.9%) |
| 3 or 4 Children | 65 (24.6%) | 87 (45.3%) |
| 5 or more Children | 0 (0.0%) | 0 (0.0%) |
| Total | 414 (3.9%) | 420 (21.3%) |
Race in Prescott
The most populous races in Prescott are White / Caucasian (41,085 | 89.2%), Hispanic or Latino (3,987 | 8.7%), and Two or more Races (1,955 | 4.3%).
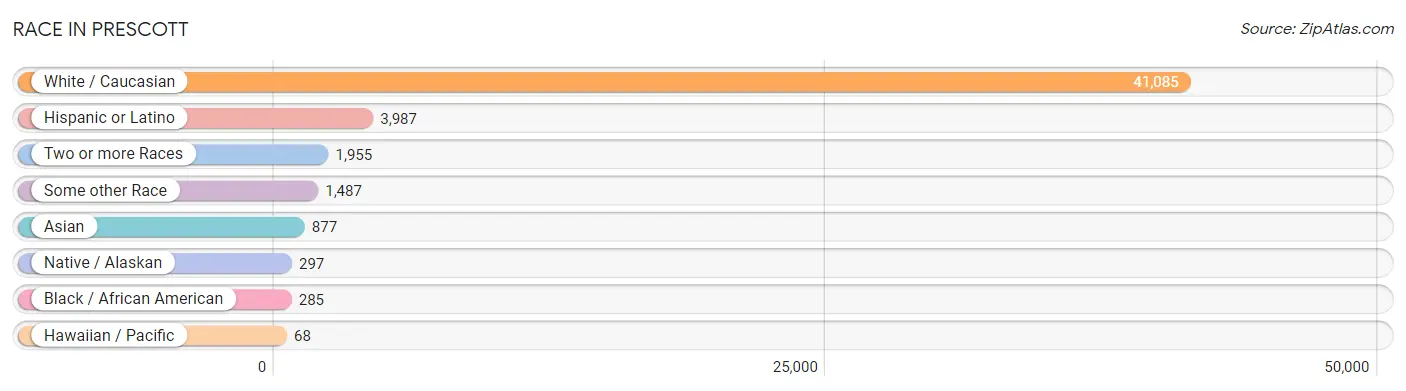
| Race | # Population | % Population |
| Asian | 877 | 1.9% |
| Black / African American | 285 | 0.6% |
| Hawaiian / Pacific | 68 | 0.2% |
| Hispanic or Latino | 3,987 | 8.7% |
| Native / Alaskan | 297 | 0.6% |
| White / Caucasian | 41,085 | 89.2% |
| Two or more Races | 1,955 | 4.3% |
| Some other Race | 1,487 | 3.2% |
| Total | 46,054 | 100.0% |
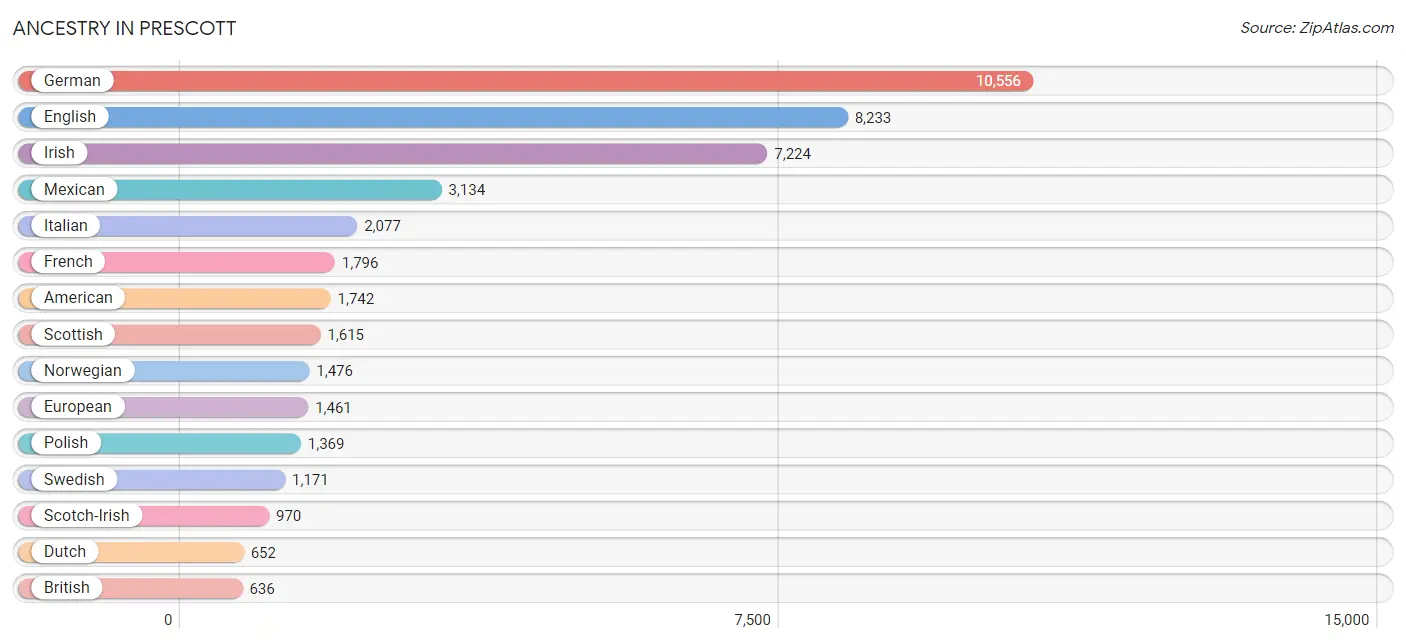
Ancestry in Prescott
The most populous ancestries reported in Prescott are German (10,556 | 22.9%), English (8,233 | 17.9%), Irish (7,224 | 15.7%), Mexican (3,134 | 6.8%), and Italian (2,077 | 4.5%), together accounting for 67.8% of all Prescott residents.
| Ancestry | # Population | % Population |
| Alaska Native | 2 | 0.0% |
| Albanian | 15 | 0.0% |
| American | 1,742 | 3.8% |
| Apache | 5 | 0.0% |
| Arab | 86 | 0.2% |
| Armenian | 73 | 0.2% |
| Australian | 37 | 0.1% |
| Austrian | 73 | 0.2% |
| Belgian | 54 | 0.1% |
| Bhutanese | 188 | 0.4% |
| Blackfeet | 9 | 0.0% |
| Bolivian | 19 | 0.0% |
| Brazilian | 48 | 0.1% |
| British | 636 | 1.4% |
| Burmese | 192 | 0.4% |
| Cajun | 18 | 0.0% |
| Canadian | 88 | 0.2% |
| Celtic | 39 | 0.1% |
| Central American | 38 | 0.1% |
| Cherokee | 158 | 0.3% |
| Chickasaw | 7 | 0.0% |
| Chippewa | 12 | 0.0% |
| Choctaw | 111 | 0.2% |
| Colombian | 6 | 0.0% |
| Costa Rican | 13 | 0.0% |
| Cree | 8 | 0.0% |
| Creek | 33 | 0.1% |
| Croatian | 76 | 0.2% |
| Cuban | 48 | 0.1% |
| Czech | 220 | 0.5% |
| Czechoslovakian | 67 | 0.2% |
| Danish | 321 | 0.7% |
| Dutch | 652 | 1.4% |
| Eastern European | 278 | 0.6% |
| Ecuadorian | 14 | 0.0% |
| English | 8,233 | 17.9% |
| Estonian | 35 | 0.1% |
| European | 1,461 | 3.2% |
| Fijian | 51 | 0.1% |
| Finnish | 67 | 0.2% |
| French | 1,796 | 3.9% |
| French Canadian | 116 | 0.3% |
| German | 10,556 | 22.9% |
| Greek | 166 | 0.4% |
| Guatemalan | 9 | 0.0% |
| Hopi | 36 | 0.1% |
| Hungarian | 272 | 0.6% |
| Indian (Asian) | 385 | 0.8% |
| Iranian | 17 | 0.0% |
| Irish | 7,224 | 15.7% |
| Iroquois | 6 | 0.0% |
| Israeli | 10 | 0.0% |
| Italian | 2,077 | 4.5% |
| Jamaican | 8 | 0.0% |
| Korean | 346 | 0.7% |
| Latvian | 16 | 0.0% |
| Lebanese | 86 | 0.2% |
| Lithuanian | 126 | 0.3% |
| Mexican | 3,134 | 6.8% |
| Native Hawaiian | 147 | 0.3% |
| Navajo | 206 | 0.4% |
| Northern European | 192 | 0.4% |
| Norwegian | 1,476 | 3.2% |
| Pakistani | 129 | 0.3% |
| Pennsylvania German | 14 | 0.0% |
| Polish | 1,369 | 3.0% |
| Portuguese | 259 | 0.6% |
| Puerto Rican | 57 | 0.1% |
| Romanian | 34 | 0.1% |
| Russian | 309 | 0.7% |
| Salvadoran | 16 | 0.0% |
| Scandinavian | 222 | 0.5% |
| Scotch-Irish | 970 | 2.1% |
| Scottish | 1,615 | 3.5% |
| Serbian | 51 | 0.1% |
| Slovak | 92 | 0.2% |
| Slovene | 27 | 0.1% |
| South American | 39 | 0.1% |
| Soviet Union | 12 | 0.0% |
| Spaniard | 199 | 0.4% |
| Spanish | 210 | 0.5% |
| Sri Lankan | 51 | 0.1% |
| Swedish | 1,171 | 2.5% |
| Swiss | 165 | 0.4% |
| Thai | 116 | 0.3% |
| Tlingit-Haida | 36 | 0.1% |
| Turkish | 40 | 0.1% |
| Ukrainian | 123 | 0.3% |
| Welsh | 539 | 1.2% |
| West Indian | 19 | 0.0% |
| Yugoslavian | 55 | 0.1% | View All 91 Rows |
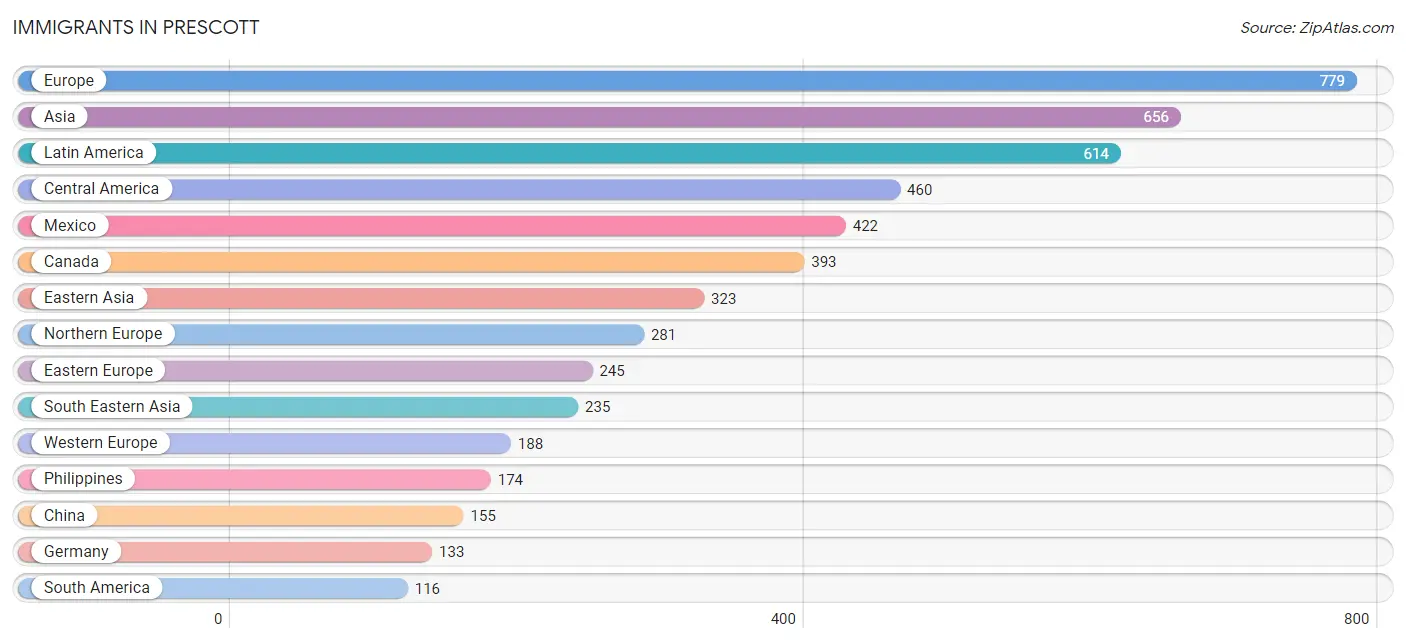
Immigrants in Prescott
The most numerous immigrant groups reported in Prescott came from Europe (779 | 1.7%), Asia (656 | 1.4%), Latin America (614 | 1.3%), Central America (460 | 1.0%), and Mexico (422 | 0.9%), together accounting for 6.4% of all Prescott residents.
| Immigration Origin | # Population | % Population |
| Africa | 25 | 0.1% |
| Albania | 15 | 0.0% |
| Argentina | 40 | 0.1% |
| Armenia | 24 | 0.1% |
| Asia | 656 | 1.4% |
| Australia | 31 | 0.1% |
| Belize | 13 | 0.0% |
| Bolivia | 19 | 0.0% |
| Bosnia and Herzegovina | 16 | 0.0% |
| Brazil | 26 | 0.1% |
| Canada | 393 | 0.9% |
| Caribbean | 38 | 0.1% |
| Central America | 460 | 1.0% |
| China | 155 | 0.3% |
| Cuba | 30 | 0.1% |
| Denmark | 41 | 0.1% |
| Eastern Africa | 6 | 0.0% |
| Eastern Asia | 323 | 0.7% |
| Eastern Europe | 245 | 0.5% |
| Ecuador | 14 | 0.0% |
| El Salvador | 16 | 0.0% |
| England | 79 | 0.2% |
| Ethiopia | 6 | 0.0% |
| Europe | 779 | 1.7% |
| France | 1 | 0.0% |
| Germany | 133 | 0.3% |
| Ghana | 9 | 0.0% |
| Guatemala | 9 | 0.0% |
| Guyana | 17 | 0.0% |
| India | 47 | 0.1% |
| Ireland | 47 | 0.1% |
| Italy | 64 | 0.1% |
| Jamaica | 8 | 0.0% |
| Japan | 71 | 0.2% |
| Korea | 97 | 0.2% |
| Latin America | 614 | 1.3% |
| Lebanon | 16 | 0.0% |
| Mexico | 422 | 0.9% |
| Netherlands | 34 | 0.1% |
| Northern Europe | 281 | 0.6% |
| Oceania | 31 | 0.1% |
| Philippines | 174 | 0.4% |
| Poland | 28 | 0.1% |
| Romania | 14 | 0.0% |
| Russia | 88 | 0.2% |
| Scotland | 33 | 0.1% |
| Serbia | 35 | 0.1% |
| South America | 116 | 0.3% |
| South Central Asia | 47 | 0.1% |
| South Eastern Asia | 235 | 0.5% |
| Southern Europe | 65 | 0.1% |
| Spain | 1 | 0.0% |
| Sweden | 20 | 0.0% |
| Switzerland | 20 | 0.0% |
| Taiwan | 9 | 0.0% |
| Thailand | 10 | 0.0% |
| Ukraine | 37 | 0.1% |
| Vietnam | 51 | 0.1% |
| Western Africa | 19 | 0.0% |
| Western Asia | 40 | 0.1% |
| Western Europe | 188 | 0.4% | View All 61 Rows |
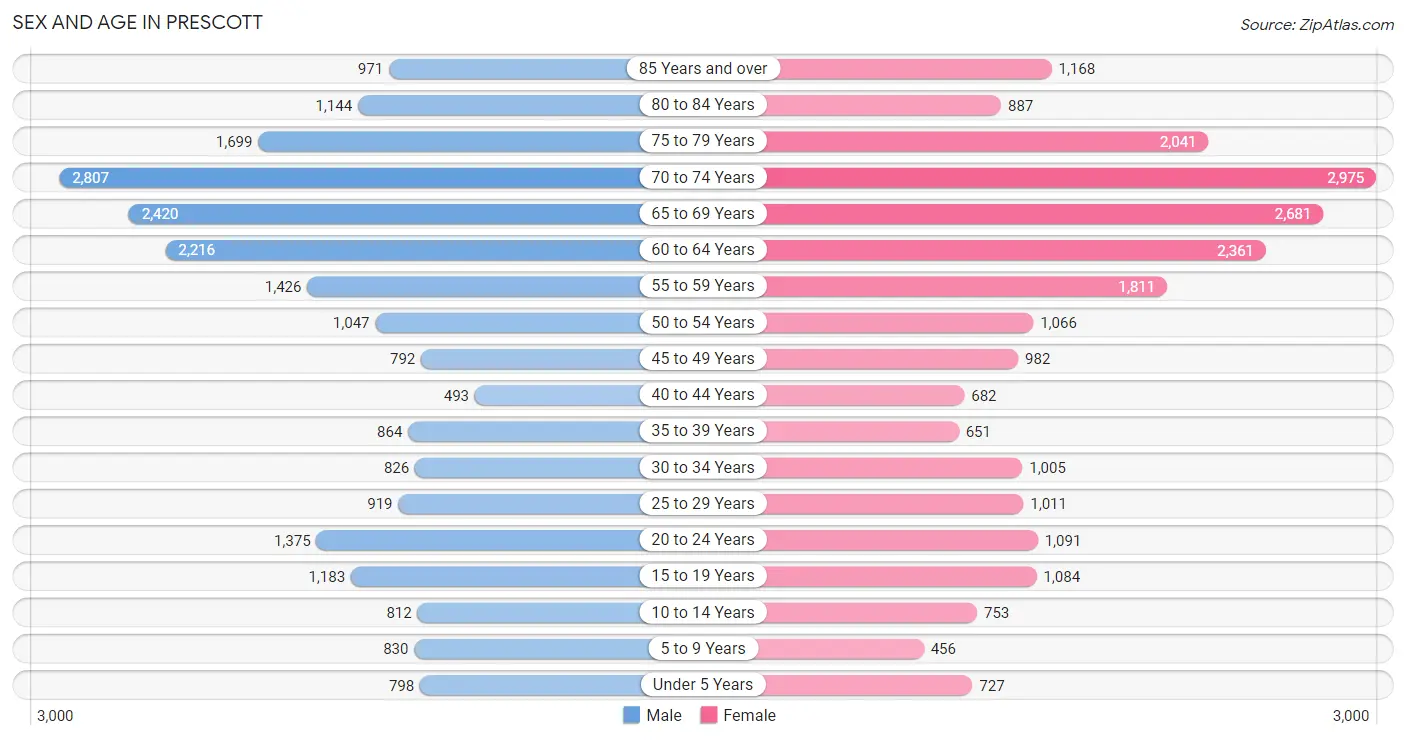
Sex and Age in Prescott
Sex and Age in Prescott
The most populous age groups in Prescott are 70 to 74 Years (2,807 | 12.4%) for men and 70 to 74 Years (2,975 | 12.7%) for women.
| Age Bracket | Male | Female |
| Under 5 Years | 798 (3.5%) | 727 (3.1%) |
| 5 to 9 Years | 830 (3.7%) | 456 (1.9%) |
| 10 to 14 Years | 812 (3.6%) | 753 (3.2%) |
| 15 to 19 Years | 1,183 (5.2%) | 1,084 (4.6%) |
| 20 to 24 Years | 1,375 (6.1%) | 1,091 (4.7%) |
| 25 to 29 Years | 919 (4.1%) | 1,011 (4.3%) |
| 30 to 34 Years | 826 (3.6%) | 1,005 (4.3%) |
| 35 to 39 Years | 864 (3.8%) | 651 (2.8%) |
| 40 to 44 Years | 493 (2.2%) | 682 (2.9%) |
| 45 to 49 Years | 792 (3.5%) | 982 (4.2%) |
| 50 to 54 Years | 1,047 (4.6%) | 1,066 (4.5%) |
| 55 to 59 Years | 1,426 (6.3%) | 1,811 (7.7%) |
| 60 to 64 Years | 2,216 (9.8%) | 2,361 (10.1%) |
| 65 to 69 Years | 2,420 (10.7%) | 2,681 (11.4%) |
| 70 to 74 Years | 2,807 (12.4%) | 2,975 (12.7%) |
| 75 to 79 Years | 1,699 (7.5%) | 2,041 (8.7%) |
| 80 to 84 Years | 1,144 (5.1%) | 887 (3.8%) |
| 85 Years and over | 971 (4.3%) | 1,168 (5.0%) |
| Total | 22,622 (100.0%) | 23,432 (100.0%) |
Families and Households in Prescott
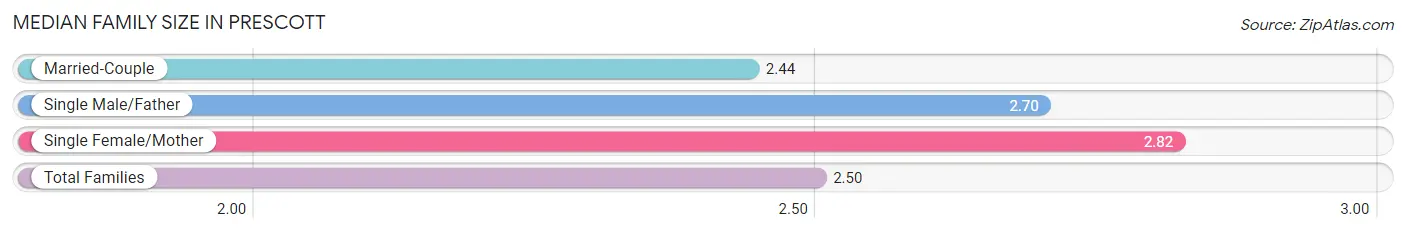
Median Family Size in Prescott
The median family size in Prescott is 2.50 persons per family, with single female/mother families (1,508 | 11.9%) accounting for the largest median family size of 2.82 persons per family. On the other hand, married-couple families (10,694 | 84.5%) represent the smallest median family size with 2.44 persons per family.
| Family Type | # Families | Family Size |
| Married-Couple | 10,694 (84.5%) | 2.44 |
| Single Male/Father | 460 (3.6%) | 2.70 |
| Single Female/Mother | 1,508 (11.9%) | 2.82 |
| Total Families | 12,662 (100.0%) | 2.50 |
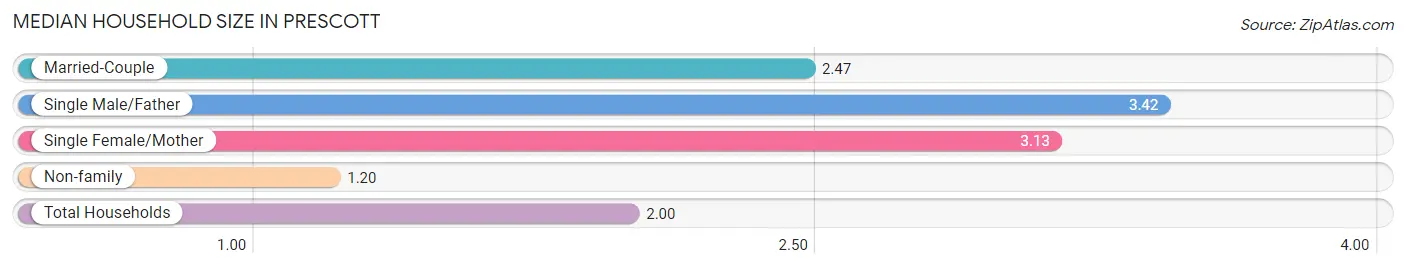
Median Household Size in Prescott
The median household size in Prescott is 2.00 persons per household, with single male/father households (460 | 2.1%) accounting for the largest median household size of 3.42 persons per household. non-family households (9,141 | 41.9%) represent the smallest median household size with 1.20 persons per household.
| Household Type | # Households | Household Size |
| Married-Couple | 10,694 (49.0%) | 2.47 |
| Single Male/Father | 460 (2.1%) | 3.42 |
| Single Female/Mother | 1,508 (6.9%) | 3.13 |
| Non-family | 9,141 (41.9%) | 1.20 |
| Total Households | 21,803 (100.0%) | 2.00 |
Household Size by Marriage Status in Prescott
Out of a total of 21,803 households in Prescott, 12,662 (58.1%) are family households, while 9,141 (41.9%) are nonfamily households. The most numerous type of family households are 2-person households, comprising 8,939, and the most common type of nonfamily households are 1-person households, comprising 7,490.
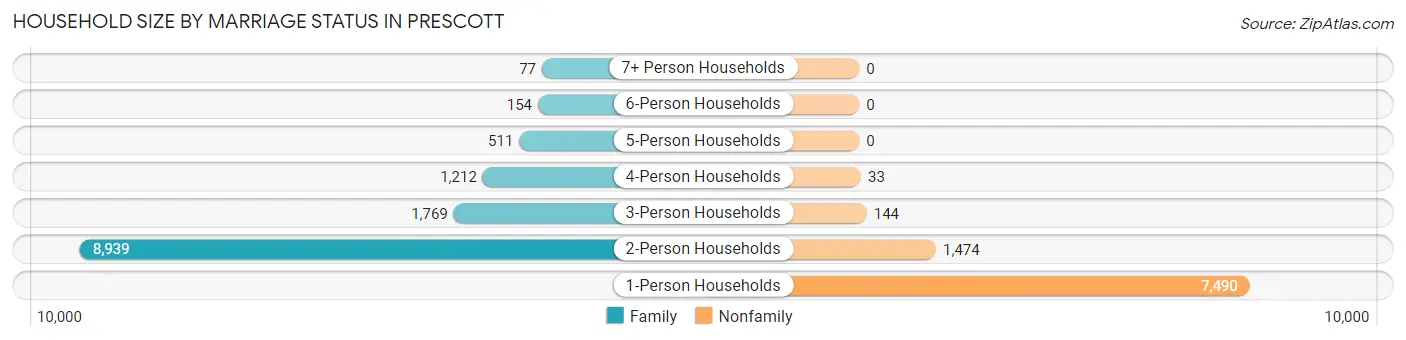
| Household Size | Family Households | Nonfamily Households |
| 1-Person Households | - | 7,490 (34.4%) |
| 2-Person Households | 8,939 (41.0%) | 1,474 (6.8%) |
| 3-Person Households | 1,769 (8.1%) | 144 (0.7%) |
| 4-Person Households | 1,212 (5.6%) | 33 (0.2%) |
| 5-Person Households | 511 (2.3%) | 0 (0.0%) |
| 6-Person Households | 154 (0.7%) | 0 (0.0%) |
| 7+ Person Households | 77 (0.4%) | 0 (0.0%) |
| Total | 12,662 (58.1%) | 9,141 (41.9%) |
Female Fertility in Prescott
Fertility by Age in Prescott
Average fertility rate in Prescott is 49.0 births per 1,000 women. Women in the age bracket of 20 to 34 years have the highest fertility rate with 85.0 births per 1,000 women. Women in the age bracket of 20 to 34 years acount for 81.0% of all women with births.
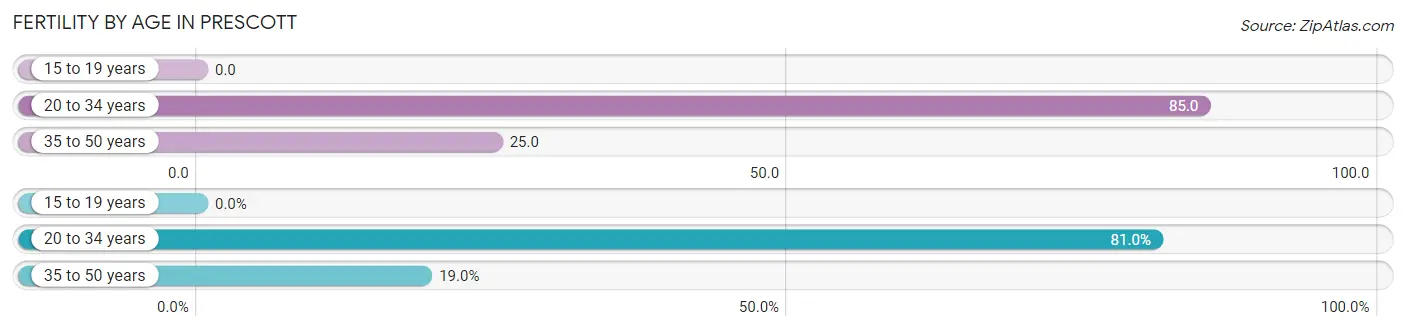
| Age Bracket | Women with Births | Births / 1,000 Women |
| 15 to 19 years | 0 (0.0%) | 0.0 |
| 20 to 34 years | 264 (81.0%) | 85.0 |
| 35 to 50 years | 62 (19.0%) | 25.0 |
| Total | 326 (100.0%) | 49.0 |
Fertility by Age by Marriage Status in Prescott
55.8% of women with births (326) in Prescott are married. The highest percentage of unmarried women with births falls into 35 to 50 years age bracket with 71.0% of them unmarried at the time of birth, while the lowest percentage of unmarried women with births belong to 20 to 34 years age bracket with 37.9% of them unmarried.
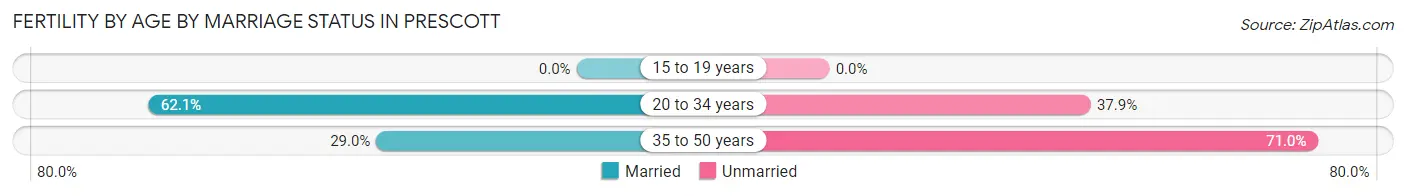
| Age Bracket | Married | Unmarried |
| 15 to 19 years | 0 (0.0%) | 0 (0.0%) |
| 20 to 34 years | 164 (62.1%) | 100 (37.9%) |
| 35 to 50 years | 18 (29.0%) | 44 (71.0%) |
| Total | 182 (55.8%) | 144 (44.2%) |
Fertility by Education in Prescott
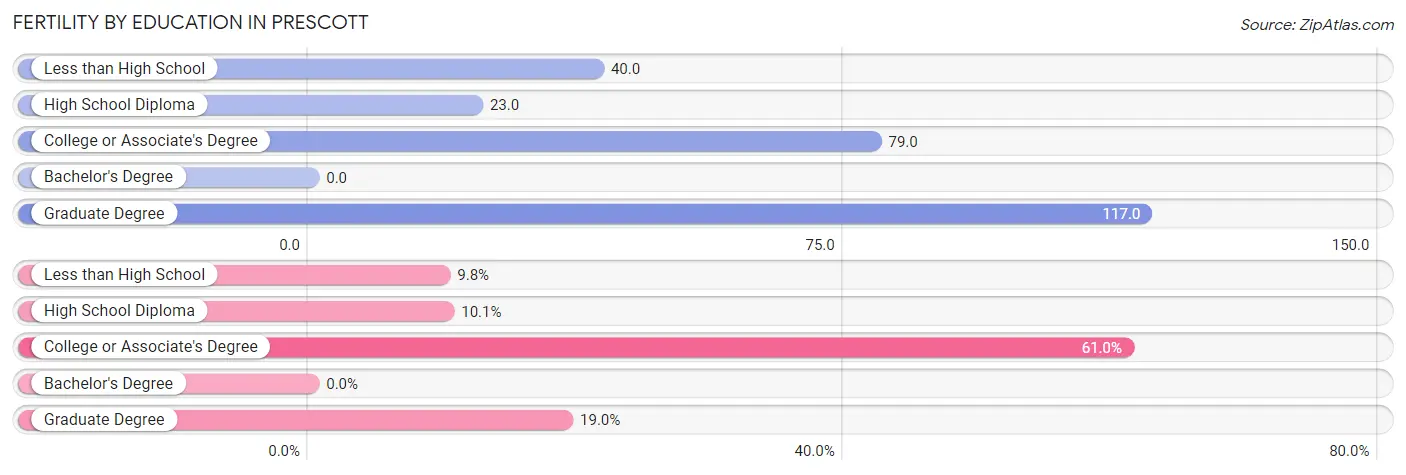
| Educational Attainment | Women with Births | Births / 1,000 Women |
| Less than High School | 32 (9.8%) | 40.0 |
| High School Diploma | 33 (10.1%) | 23.0 |
| College or Associate's Degree | 199 (61.0%) | 79.0 |
| Bachelor's Degree | 0 (0.0%) | 0.0 |
| Graduate Degree | 62 (19.0%) | 117.0 |
| Total | 326 (100.0%) | 49.0 |
Fertility by Education by Marriage Status in Prescott
44.2% of women with births in Prescott are unmarried. Women with the educational attainment of graduate degree are most likely to be married with 100.0% of them married at childbirth, while women with the educational attainment of less than high school are least likely to be married with 100.0% of them unmarried at childbirth.
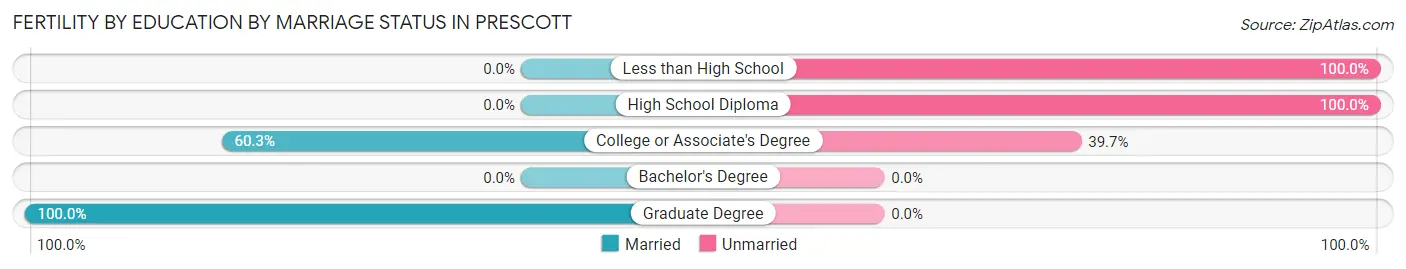
| Educational Attainment | Married | Unmarried |
| Less than High School | 0 (0.0%) | 32 (100.0%) |
| High School Diploma | 0 (0.0%) | 33 (100.0%) |
| College or Associate's Degree | 120 (60.3%) | 79 (39.7%) |
| Bachelor's Degree | 0 (0.0%) | 0 (0.0%) |
| Graduate Degree | 62 (100.0%) | 0 (0.0%) |
| Total | 182 (55.8%) | 144 (44.2%) |
Employment Characteristics in Prescott
Employment by Class of Employer in Prescott
Among the 15,777 employed individuals in Prescott, private company employees (8,965 | 56.8%), not-for-profit organizations (1,832 | 11.6%), and self-employed (not incorporated) (1,630 | 10.3%) make up the most common classes of employment.
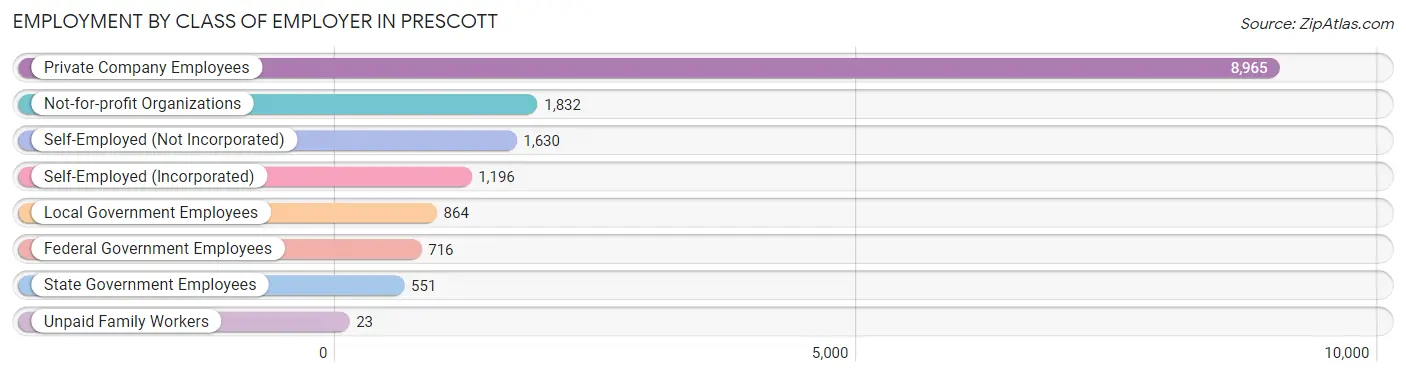
| Employer Class | # Employees | % Employees |
| Private Company Employees | 8,965 | 56.8% |
| Self-Employed (Incorporated) | 1,196 | 7.6% |
| Self-Employed (Not Incorporated) | 1,630 | 10.3% |
| Not-for-profit Organizations | 1,832 | 11.6% |
| Local Government Employees | 864 | 5.5% |
| State Government Employees | 551 | 3.5% |
| Federal Government Employees | 716 | 4.5% |
| Unpaid Family Workers | 23 | 0.2% |
| Total | 15,777 | 100.0% |
Employment Status by Age in Prescott
According to the labor force statistics for Prescott, out of the total population over 16 years of age (41,243), 41.1% or 16,951 individuals are in the labor force, with 5.2% or 881 of them unemployed. The age group with the highest labor force participation rate is 35 to 44 years, with 85.9% or 2,311 individuals in the labor force. Within the labor force, the 75 years and over age range has the highest percentage of unemployed individuals, with 18.5% or 75 of them being unemployed.
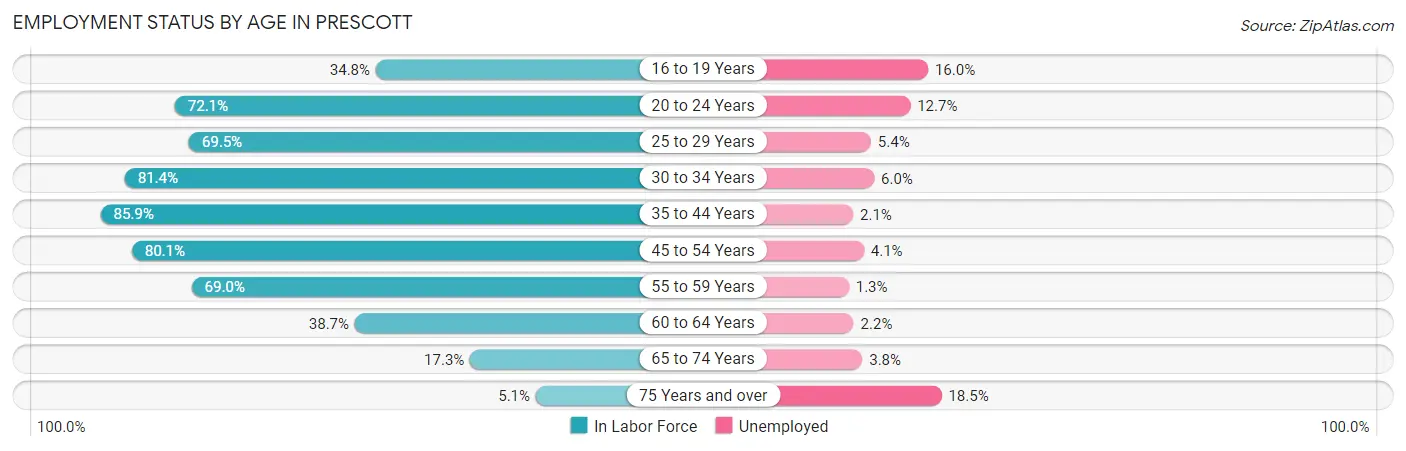
| Age Bracket | In Labor Force | Unemployed |
| 16 to 19 Years | 638 (34.8%) | 102 (16.0%) |
| 20 to 24 Years | 1,778 (72.1%) | 226 (12.7%) |
| 25 to 29 Years | 1,341 (69.5%) | 72 (5.4%) |
| 30 to 34 Years | 1,490 (81.4%) | 89 (6.0%) |
| 35 to 44 Years | 2,311 (85.9%) | 49 (2.1%) |
| 45 to 54 Years | 3,113 (80.1%) | 128 (4.1%) |
| 55 to 59 Years | 2,234 (69.0%) | 29 (1.3%) |
| 60 to 64 Years | 1,771 (38.7%) | 39 (2.2%) |
| 65 to 74 Years | 1,883 (17.3%) | 72 (3.8%) |
| 75 Years and over | 403 (5.1%) | 75 (18.5%) |
| Total | 16,951 (41.1%) | 881 (5.2%) |
Employment Status by Educational Attainment in Prescott
According to labor force statistics for Prescott, 67.5% of individuals (12,253) out of the total population between 25 and 64 years of age (18,152) are in the labor force, with 3.3% or 404 of them being unemployed. The group with the highest labor force participation rate are those with the educational attainment of college / associate degree, with 69.0% or 4,822 individuals in the labor force. Within the labor force, individuals with less than high school education have the highest percentage of unemployment, with 10.6% or 49 of them being unemployed.
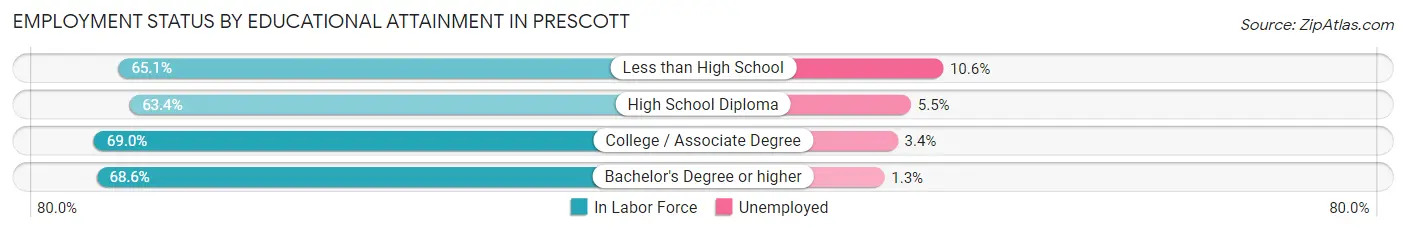
| Educational Attainment | In Labor Force | Unemployed |
| Less than High School | 464 (65.1%) | 76 (10.6%) |
| High School Diploma | 2,391 (63.4%) | 207 (5.5%) |
| College / Associate Degree | 4,822 (69.0%) | 238 (3.4%) |
| Bachelor's Degree or higher | 4,581 (68.6%) | 87 (1.3%) |
| Total | 12,253 (67.5%) | 599 (3.3%) |
Employment Occupations by Sex in Prescott
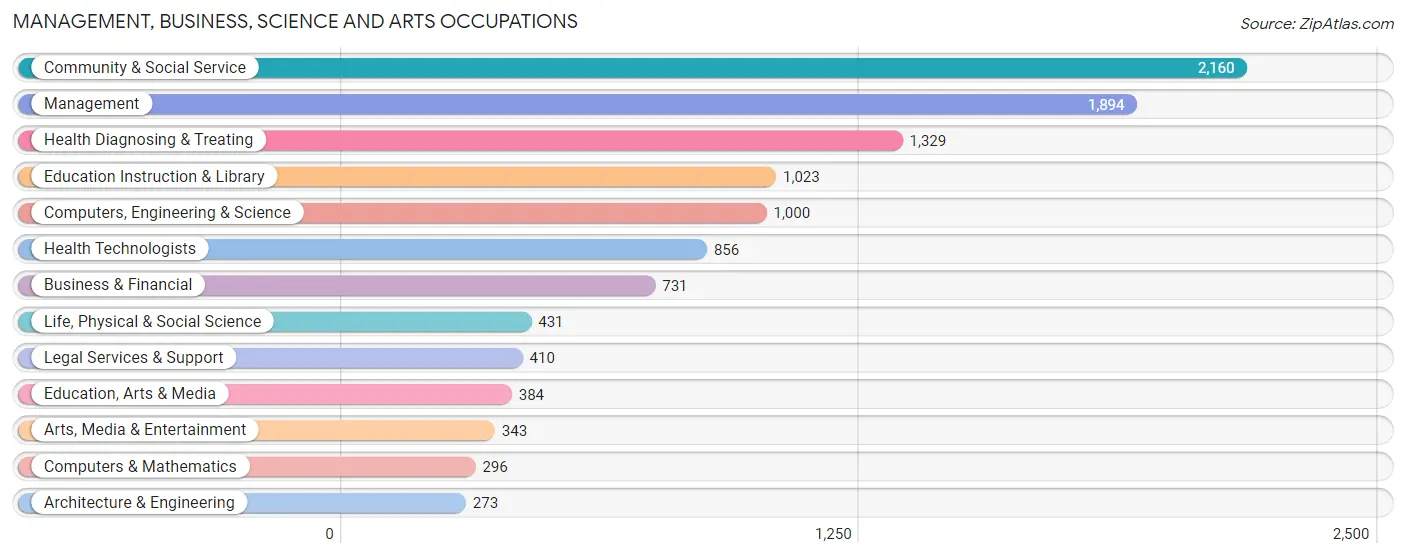
Management, Business, Science and Arts Occupations
The most common Management, Business, Science and Arts occupations in Prescott are Community & Social Service (2,160 | 13.5%), Management (1,894 | 11.8%), Health Diagnosing & Treating (1,329 | 8.3%), Education Instruction & Library (1,023 | 6.4%), and Computers, Engineering & Science (1,000 | 6.2%).
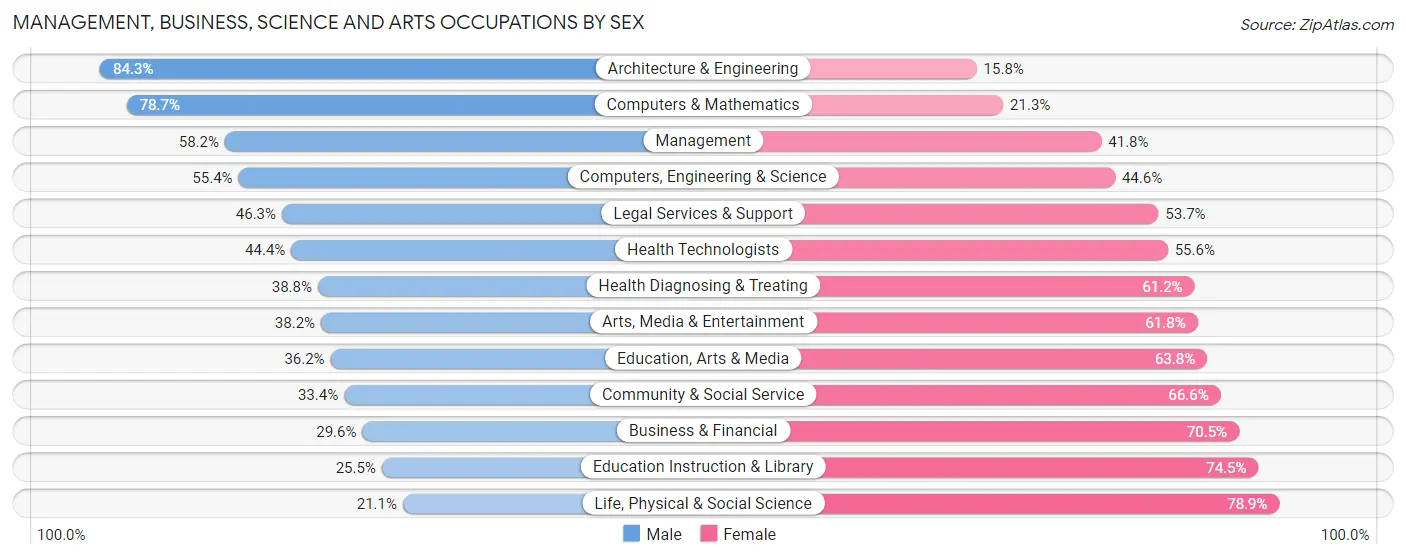
Management, Business, Science and Arts Occupations by Sex
Within the Management, Business, Science and Arts occupations in Prescott, the most male-oriented occupations are Architecture & Engineering (84.3%), Computers & Mathematics (78.7%), and Management (58.2%), while the most female-oriented occupations are Life, Physical & Social Science (78.9%), Education Instruction & Library (74.5%), and Business & Financial (70.5%).
| Occupation | Male | Female |
| Management | 1,103 (58.2%) | 791 (41.8%) |
| Business & Financial | 216 (29.5%) | 515 (70.5%) |
| Computers, Engineering & Science | 554 (55.4%) | 446 (44.6%) |
| Computers & Mathematics | 233 (78.7%) | 63 (21.3%) |
| Architecture & Engineering | 230 (84.3%) | 43 (15.8%) |
| Life, Physical & Social Science | 91 (21.1%) | 340 (78.9%) |
| Community & Social Service | 721 (33.4%) | 1,439 (66.6%) |
| Education, Arts & Media | 139 (36.2%) | 245 (63.8%) |
| Legal Services & Support | 190 (46.3%) | 220 (53.7%) |
| Education Instruction & Library | 261 (25.5%) | 762 (74.5%) |
| Arts, Media & Entertainment | 131 (38.2%) | 212 (61.8%) |
| Health Diagnosing & Treating | 516 (38.8%) | 813 (61.2%) |
| Health Technologists | 380 (44.4%) | 476 (55.6%) |
| Total (Category) | 3,110 (43.7%) | 4,004 (56.3%) |
| Total (Overall) | 8,044 (50.2%) | 7,984 (49.8%) |
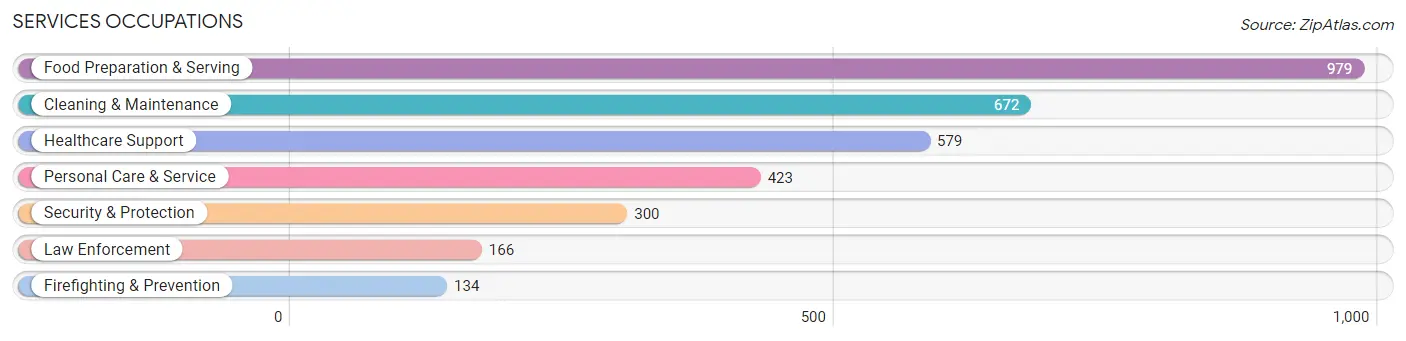
Services Occupations
The most common Services occupations in Prescott are Food Preparation & Serving (979 | 6.1%), Cleaning & Maintenance (672 | 4.2%), Healthcare Support (579 | 3.6%), Personal Care & Service (423 | 2.6%), and Security & Protection (300 | 1.9%).
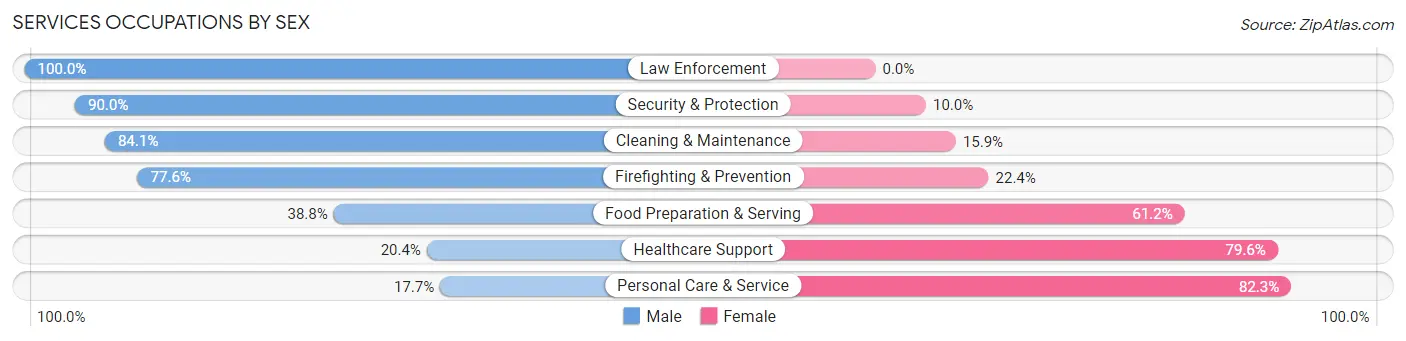
Services Occupations by Sex
Within the Services occupations in Prescott, the most male-oriented occupations are Law Enforcement (100.0%), Security & Protection (90.0%), and Cleaning & Maintenance (84.1%), while the most female-oriented occupations are Personal Care & Service (82.3%), Healthcare Support (79.6%), and Food Preparation & Serving (61.2%).
| Occupation | Male | Female |
| Healthcare Support | 118 (20.4%) | 461 (79.6%) |
| Security & Protection | 270 (90.0%) | 30 (10.0%) |
| Firefighting & Prevention | 104 (77.6%) | 30 (22.4%) |
| Law Enforcement | 166 (100.0%) | 0 (0.0%) |
| Food Preparation & Serving | 380 (38.8%) | 599 (61.2%) |
| Cleaning & Maintenance | 565 (84.1%) | 107 (15.9%) |
| Personal Care & Service | 75 (17.7%) | 348 (82.3%) |
| Total (Category) | 1,408 (47.7%) | 1,545 (52.3%) |
| Total (Overall) | 8,044 (50.2%) | 7,984 (49.8%) |
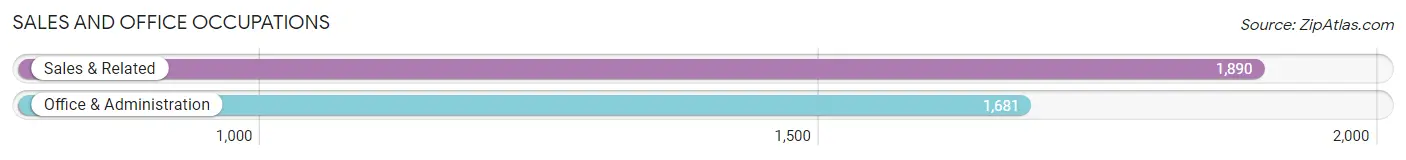
Sales and Office Occupations
The most common Sales and Office occupations in Prescott are Sales & Related (1,890 | 11.8%), and Office & Administration (1,681 | 10.5%).
Sales and Office Occupations by Sex
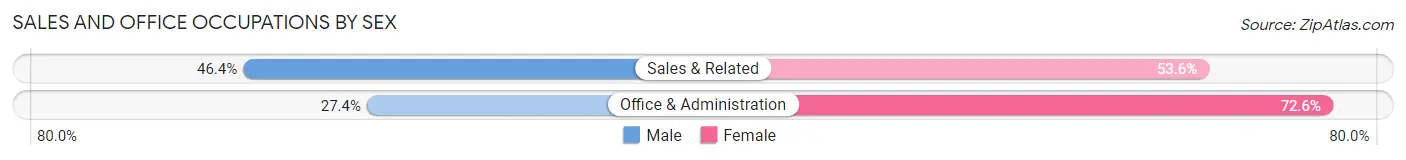
| Occupation | Male | Female |
| Sales & Related | 877 (46.4%) | 1,013 (53.6%) |
| Office & Administration | 460 (27.4%) | 1,221 (72.6%) |
| Total (Category) | 1,337 (37.4%) | 2,234 (62.6%) |
| Total (Overall) | 8,044 (50.2%) | 7,984 (49.8%) |
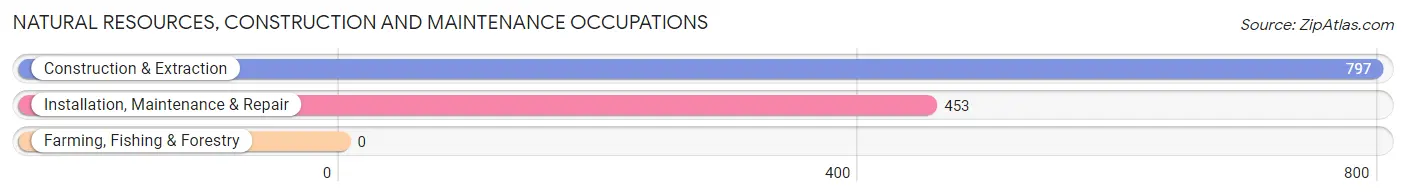
Natural Resources, Construction and Maintenance Occupations
The most common Natural Resources, Construction and Maintenance occupations in Prescott are Construction & Extraction (797 | 5.0%), and Installation, Maintenance & Repair (453 | 2.8%).
Natural Resources, Construction and Maintenance Occupations by Sex
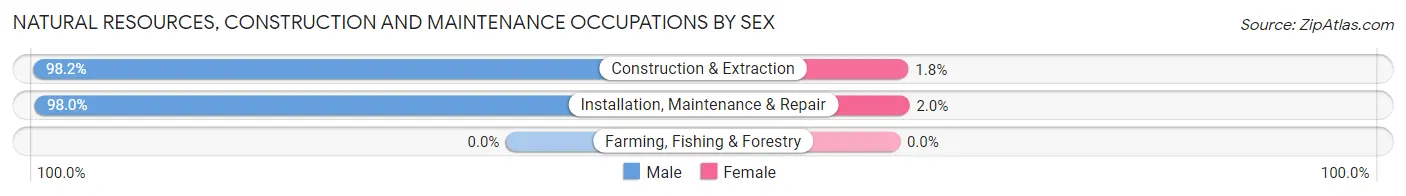
| Occupation | Male | Female |
| Farming, Fishing & Forestry | 0 (0.0%) | 0 (0.0%) |
| Construction & Extraction | 783 (98.2%) | 14 (1.8%) |
| Installation, Maintenance & Repair | 444 (98.0%) | 9 (2.0%) |
| Total (Category) | 1,227 (98.2%) | 23 (1.8%) |
| Total (Overall) | 8,044 (50.2%) | 7,984 (49.8%) |
Production, Transportation and Moving Occupations
The most common Production, Transportation and Moving occupations in Prescott are Transportation (403 | 2.5%), Production (393 | 2.5%), and Material Moving (344 | 2.1%).
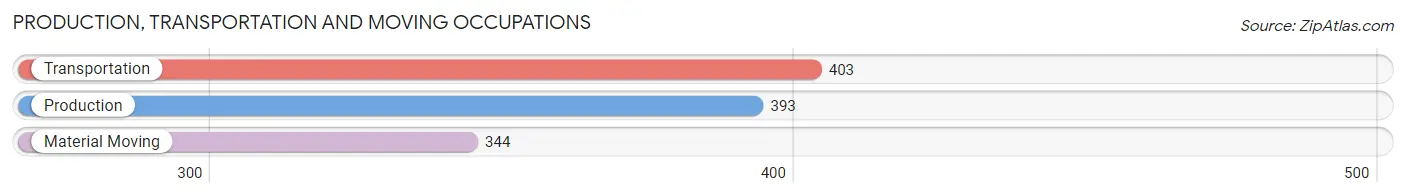
Production, Transportation and Moving Occupations by Sex
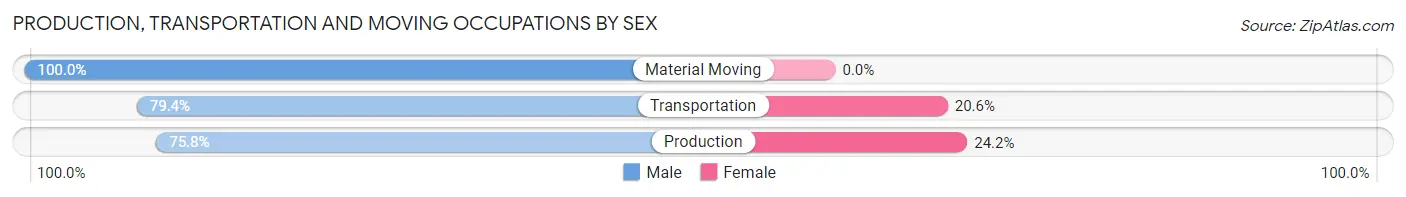
| Occupation | Male | Female |
| Production | 298 (75.8%) | 95 (24.2%) |
| Transportation | 320 (79.4%) | 83 (20.6%) |
| Material Moving | 344 (100.0%) | 0 (0.0%) |
| Total (Category) | 962 (84.4%) | 178 (15.6%) |
| Total (Overall) | 8,044 (50.2%) | 7,984 (49.8%) |
Employment Industries by Sex in Prescott
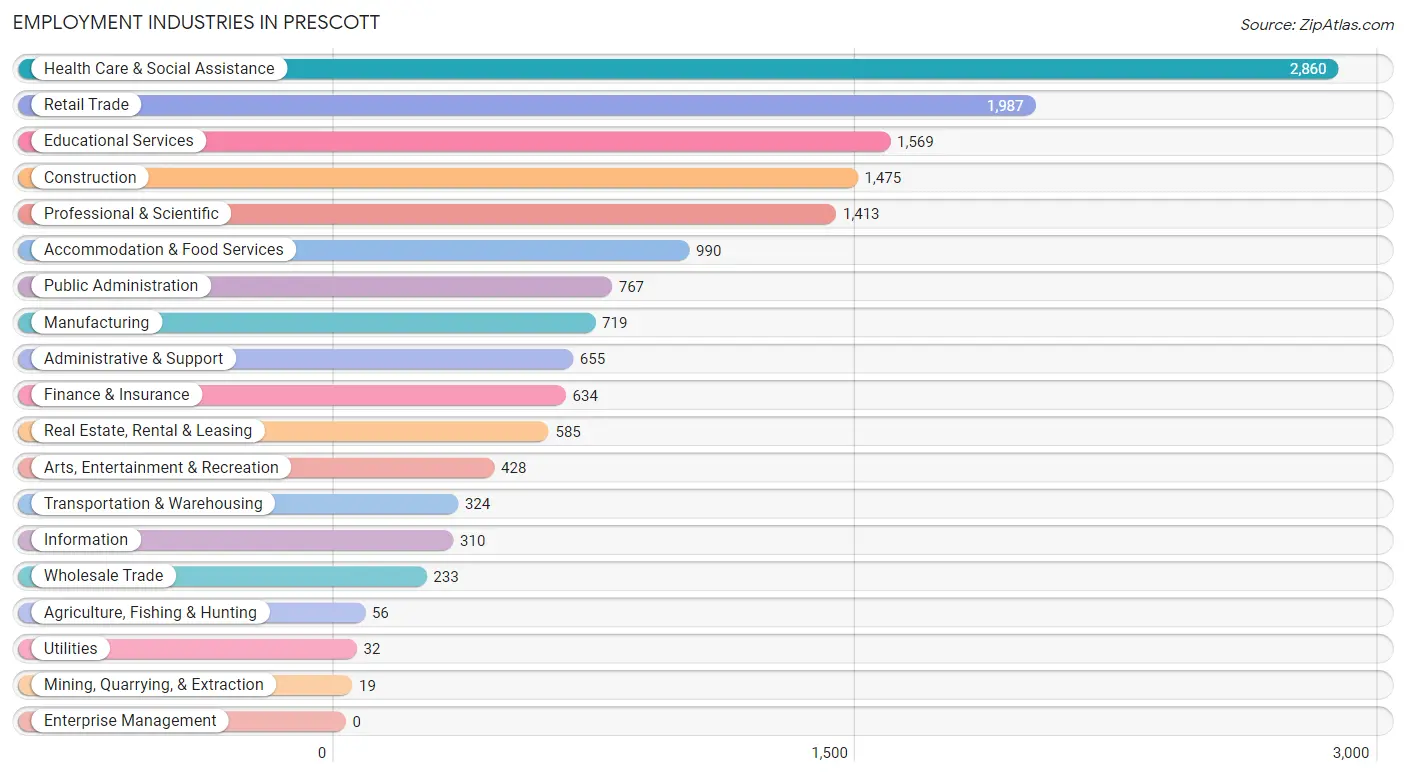
Employment Industries in Prescott
The major employment industries in Prescott include Health Care & Social Assistance (2,860 | 17.8%), Retail Trade (1,987 | 12.4%), Educational Services (1,569 | 9.8%), Construction (1,475 | 9.2%), and Professional & Scientific (1,413 | 8.8%).
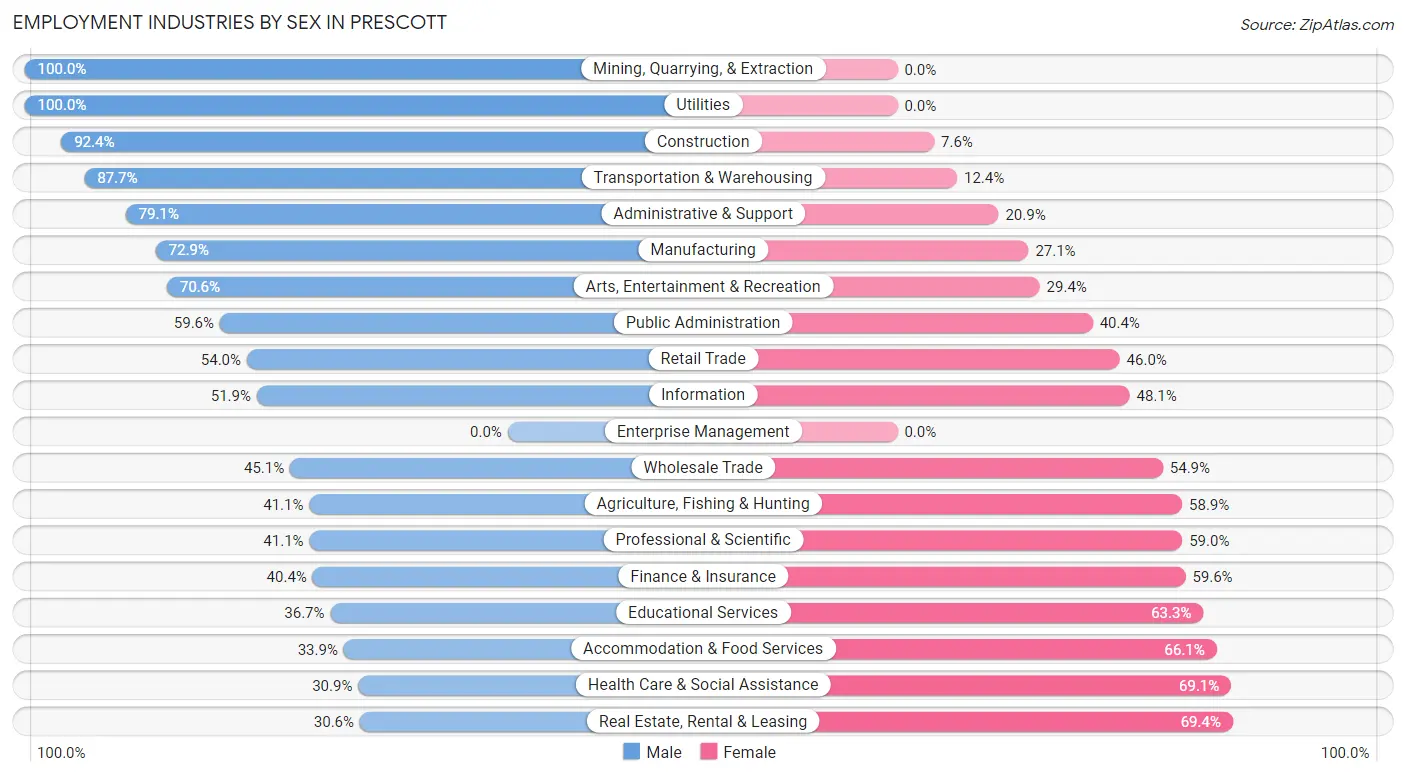
Employment Industries by Sex in Prescott
The Prescott industries that see more men than women are Mining, Quarrying, & Extraction (100.0%), Utilities (100.0%), and Construction (92.4%), whereas the industries that tend to have a higher number of women are Real Estate, Rental & Leasing (69.4%), Health Care & Social Assistance (69.1%), and Accommodation & Food Services (66.1%).
| Industry | Male | Female |
| Agriculture, Fishing & Hunting | 23 (41.1%) | 33 (58.9%) |
| Mining, Quarrying, & Extraction | 19 (100.0%) | 0 (0.0%) |
| Construction | 1,363 (92.4%) | 112 (7.6%) |
| Manufacturing | 524 (72.9%) | 195 (27.1%) |
| Wholesale Trade | 105 (45.1%) | 128 (54.9%) |
| Retail Trade | 1,073 (54.0%) | 914 (46.0%) |
| Transportation & Warehousing | 284 (87.6%) | 40 (12.3%) |
| Utilities | 32 (100.0%) | 0 (0.0%) |
| Information | 161 (51.9%) | 149 (48.1%) |
| Finance & Insurance | 256 (40.4%) | 378 (59.6%) |
| Real Estate, Rental & Leasing | 179 (30.6%) | 406 (69.4%) |
| Professional & Scientific | 580 (41.0%) | 833 (59.0%) |
| Enterprise Management | 0 (0.0%) | 0 (0.0%) |
| Administrative & Support | 518 (79.1%) | 137 (20.9%) |
| Educational Services | 576 (36.7%) | 993 (63.3%) |
| Health Care & Social Assistance | 885 (30.9%) | 1,975 (69.1%) |
| Arts, Entertainment & Recreation | 302 (70.6%) | 126 (29.4%) |
| Accommodation & Food Services | 336 (33.9%) | 654 (66.1%) |
| Public Administration | 457 (59.6%) | 310 (40.4%) |
| Total | 8,044 (50.2%) | 7,984 (49.8%) |
Education in Prescott
School Enrollment in Prescott
The most common levels of schooling among the 8,086 students in Prescott are college / undergraduate (3,261 | 40.3%), middle school (1,394 | 17.2%), and high school (1,260 | 15.6%).
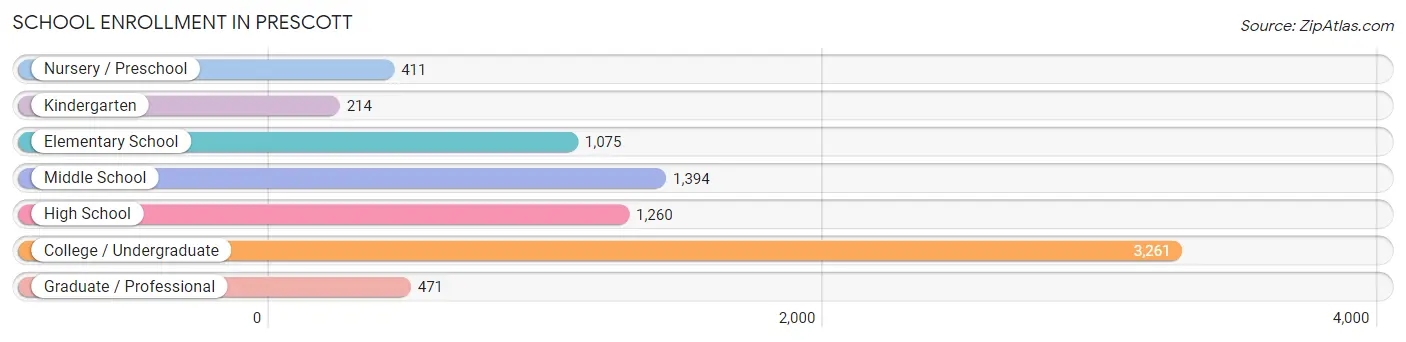
| School Level | # Students | % Students |
| Nursery / Preschool | 411 | 5.1% |
| Kindergarten | 214 | 2.6% |
| Elementary School | 1,075 | 13.3% |
| Middle School | 1,394 | 17.2% |
| High School | 1,260 | 15.6% |
| College / Undergraduate | 3,261 | 40.3% |
| Graduate / Professional | 471 | 5.8% |
| Total | 8,086 | 100.0% |
School Enrollment by Age by Funding Source in Prescott
Out of a total of 8,086 students who are enrolled in schools in Prescott, 2,361 (29.2%) attend a private institution, while the remaining 5,725 (70.8%) are enrolled in public schools. The age group of 20 to 24 year olds has the highest likelihood of being enrolled in private schools, with 914 (62.1% in the age bracket) enrolled. Conversely, the age group of 5 to 9 year old has the lowest likelihood of being enrolled in a private school, with 1,242 (97.3% in the age bracket) attending a public institution.
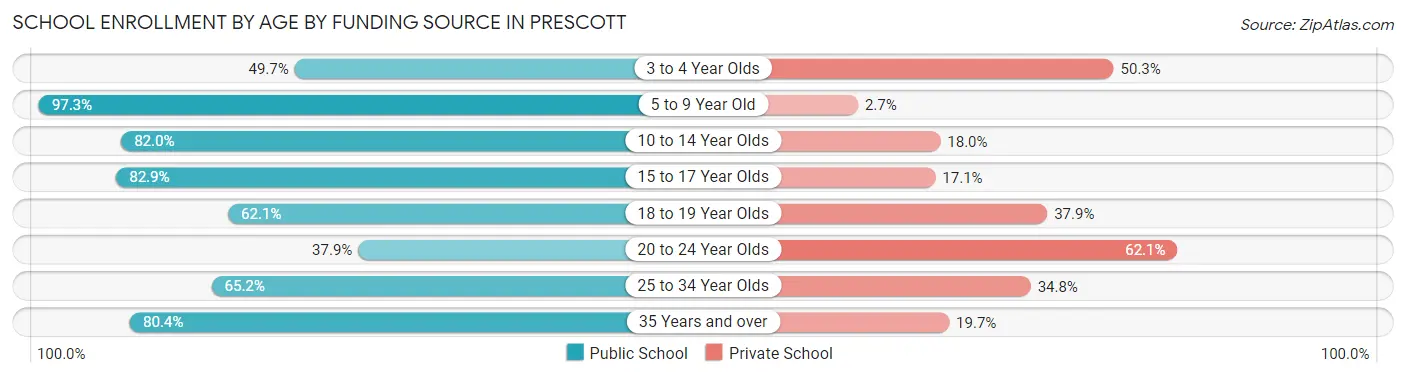
| Age Bracket | Public School | Private School |
| 3 to 4 Year Olds | 175 (49.7%) | 177 (50.3%) |
| 5 to 9 Year Old | 1,242 (97.3%) | 34 (2.7%) |
| 10 to 14 Year Olds | 1,270 (82.0%) | 279 (18.0%) |
| 15 to 17 Year Olds | 810 (82.9%) | 167 (17.1%) |
| 18 to 19 Year Olds | 699 (62.1%) | 427 (37.9%) |
| 20 to 24 Year Olds | 557 (37.9%) | 914 (62.1%) |
| 25 to 34 Year Olds | 419 (65.2%) | 224 (34.8%) |
| 35 Years and over | 556 (80.3%) | 136 (19.7%) |
| Total | 5,725 (70.8%) | 2,361 (29.2%) |
Educational Attainment by Field of Study in Prescott
Business (2,786 | 17.3%), education (2,092 | 13.0%), science & technology (1,981 | 12.3%), arts & humanities (1,266 | 7.9%), and social sciences (1,252 | 7.8%) are the most common fields of study among 16,086 individuals in Prescott who have obtained a bachelor's degree or higher.
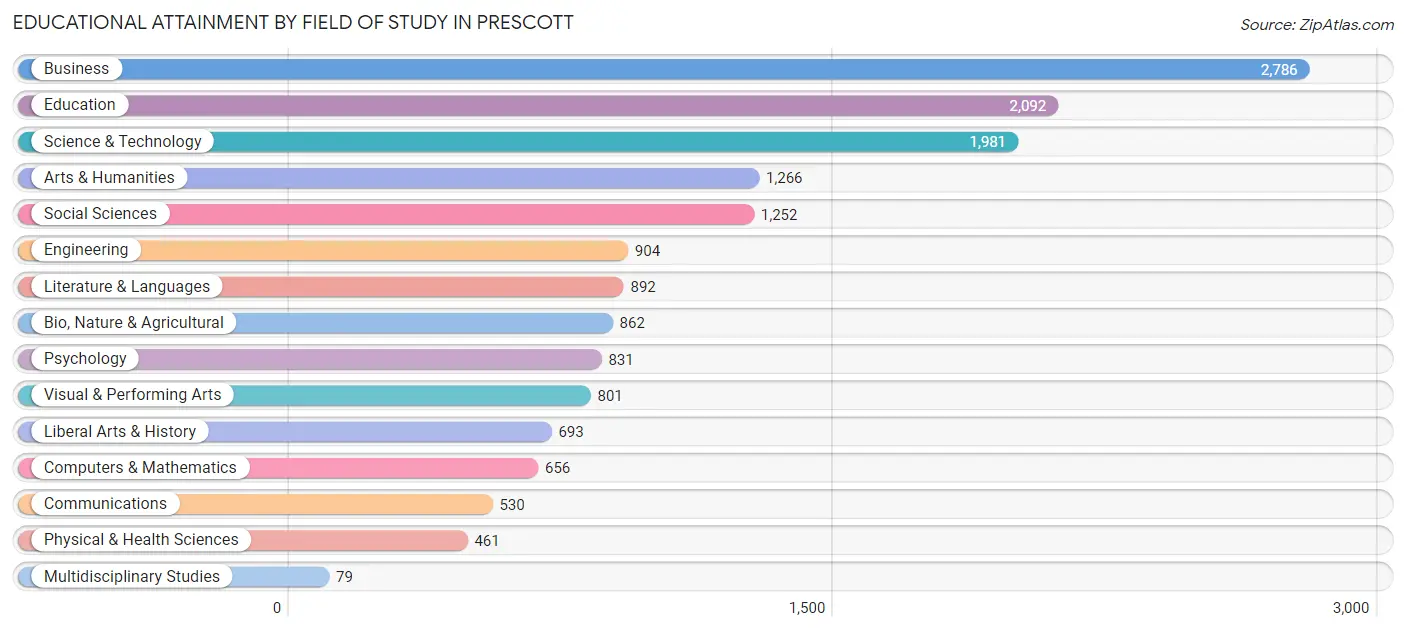
| Field of Study | # Graduates | % Graduates |
| Computers & Mathematics | 656 | 4.1% |
| Bio, Nature & Agricultural | 862 | 5.4% |
| Physical & Health Sciences | 461 | 2.9% |
| Psychology | 831 | 5.2% |
| Social Sciences | 1,252 | 7.8% |
| Engineering | 904 | 5.6% |
| Multidisciplinary Studies | 79 | 0.5% |
| Science & Technology | 1,981 | 12.3% |
| Business | 2,786 | 17.3% |
| Education | 2,092 | 13.0% |
| Literature & Languages | 892 | 5.6% |
| Liberal Arts & History | 693 | 4.3% |
| Visual & Performing Arts | 801 | 5.0% |
| Communications | 530 | 3.3% |
| Arts & Humanities | 1,266 | 7.9% |
| Total | 16,086 | 100.0% |
Transportation & Commute in Prescott
Vehicle Availability by Sex in Prescott
The most prevalent vehicle ownership categories in Prescott are males with 2 vehicles (3,230, accounting for 41.7%) and females with 2 vehicles (3,083, making up 42.2%).
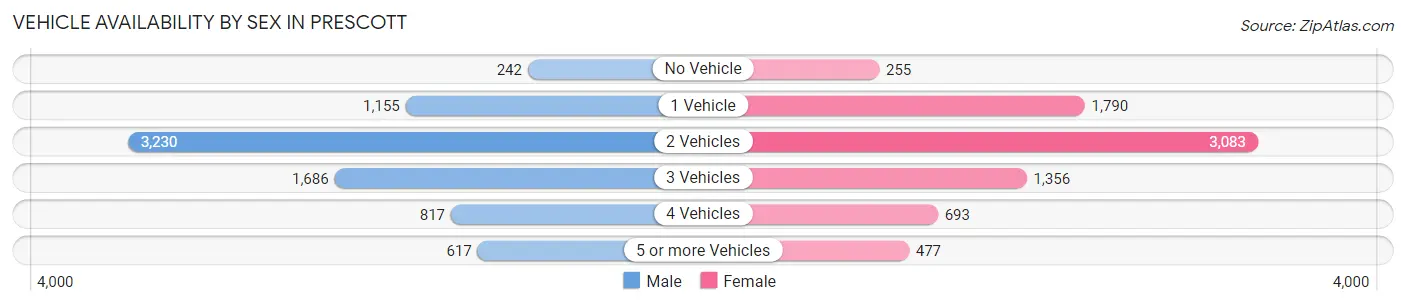
| Vehicles Available | Male | Female |
| No Vehicle | 242 (3.1%) | 255 (3.3%) |
| 1 Vehicle | 1,155 (14.9%) | 1,790 (23.4%) |
| 2 Vehicles | 3,230 (41.7%) | 3,083 (40.3%) |
| 3 Vehicles | 1,686 (21.8%) | 1,356 (17.7%) |
| 4 Vehicles | 817 (10.5%) | 693 (9.0%) |
| 5 or more Vehicles | 617 (8.0%) | 477 (6.2%) |
| Total | 7,747 (100.0%) | 7,654 (100.0%) |
Commute Time in Prescott
The most frequently occuring commute durations in Prescott are 5 to 9 minutes (3,465 commuters, 24.5%), 10 to 14 minutes (2,839 commuters, 20.1%), and 15 to 19 minutes (2,748 commuters, 19.4%).
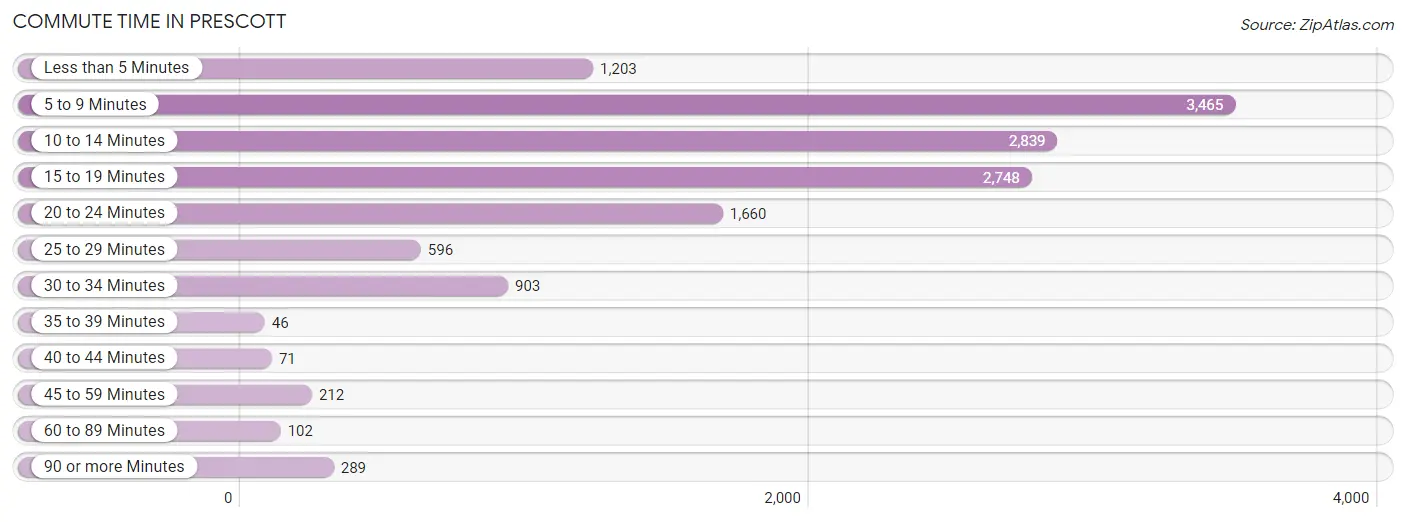
| Commute Time | # Commuters | % Commuters |
| Less than 5 Minutes | 1,203 | 8.5% |
| 5 to 9 Minutes | 3,465 | 24.5% |
| 10 to 14 Minutes | 2,839 | 20.1% |
| 15 to 19 Minutes | 2,748 | 19.4% |
| 20 to 24 Minutes | 1,660 | 11.7% |
| 25 to 29 Minutes | 596 | 4.2% |
| 30 to 34 Minutes | 903 | 6.4% |
| 35 to 39 Minutes | 46 | 0.3% |
| 40 to 44 Minutes | 71 | 0.5% |
| 45 to 59 Minutes | 212 | 1.5% |
| 60 to 89 Minutes | 102 | 0.7% |
| 90 or more Minutes | 289 | 2.0% |
Commute Time by Sex in Prescott
The most common commute times in Prescott are 5 to 9 minutes (1,713 commuters, 23.9%) for males and 5 to 9 minutes (1,752 commuters, 25.2%) for females.
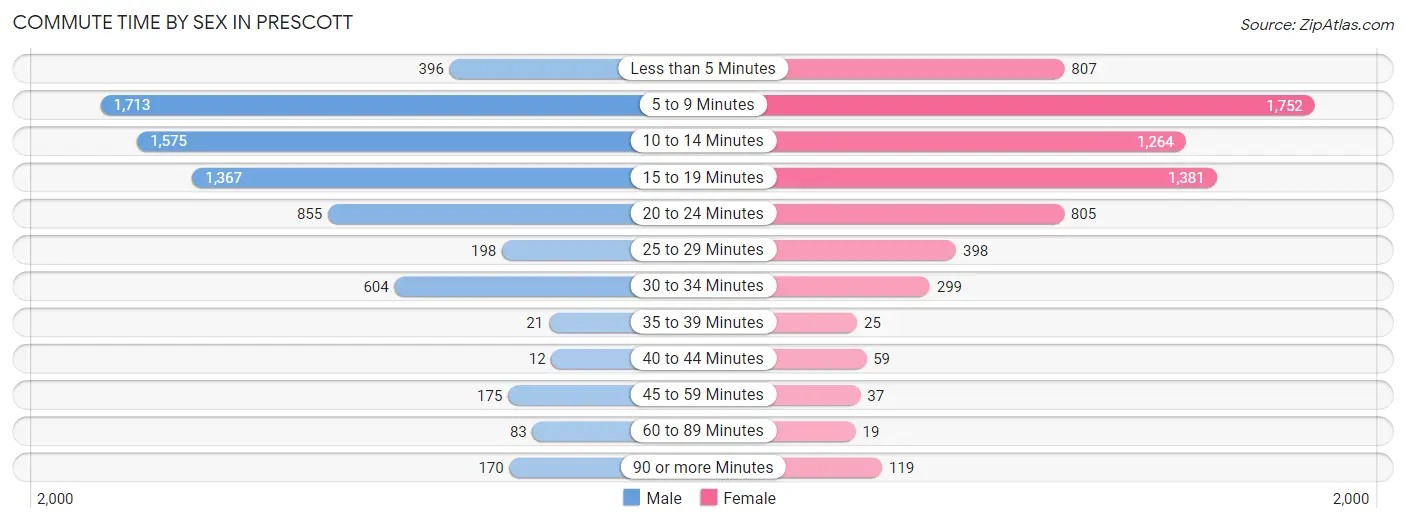
| Commute Time | Male | Female |
| Less than 5 Minutes | 396 (5.5%) | 807 (11.6%) |
| 5 to 9 Minutes | 1,713 (23.9%) | 1,752 (25.2%) |
| 10 to 14 Minutes | 1,575 (22.0%) | 1,264 (18.1%) |
| 15 to 19 Minutes | 1,367 (19.1%) | 1,381 (19.8%) |
| 20 to 24 Minutes | 855 (11.9%) | 805 (11.6%) |
| 25 to 29 Minutes | 198 (2.8%) | 398 (5.7%) |
| 30 to 34 Minutes | 604 (8.4%) | 299 (4.3%) |
| 35 to 39 Minutes | 21 (0.3%) | 25 (0.4%) |
| 40 to 44 Minutes | 12 (0.2%) | 59 (0.9%) |
| 45 to 59 Minutes | 175 (2.4%) | 37 (0.5%) |
| 60 to 89 Minutes | 83 (1.2%) | 19 (0.3%) |
| 90 or more Minutes | 170 (2.4%) | 119 (1.7%) |
Time of Departure to Work by Sex in Prescott
The most frequent times of departure to work in Prescott are 7:30 AM to 7:59 AM (1,045, 14.6%) for males and 7:30 AM to 7:59 AM (1,071, 15.4%) for females.
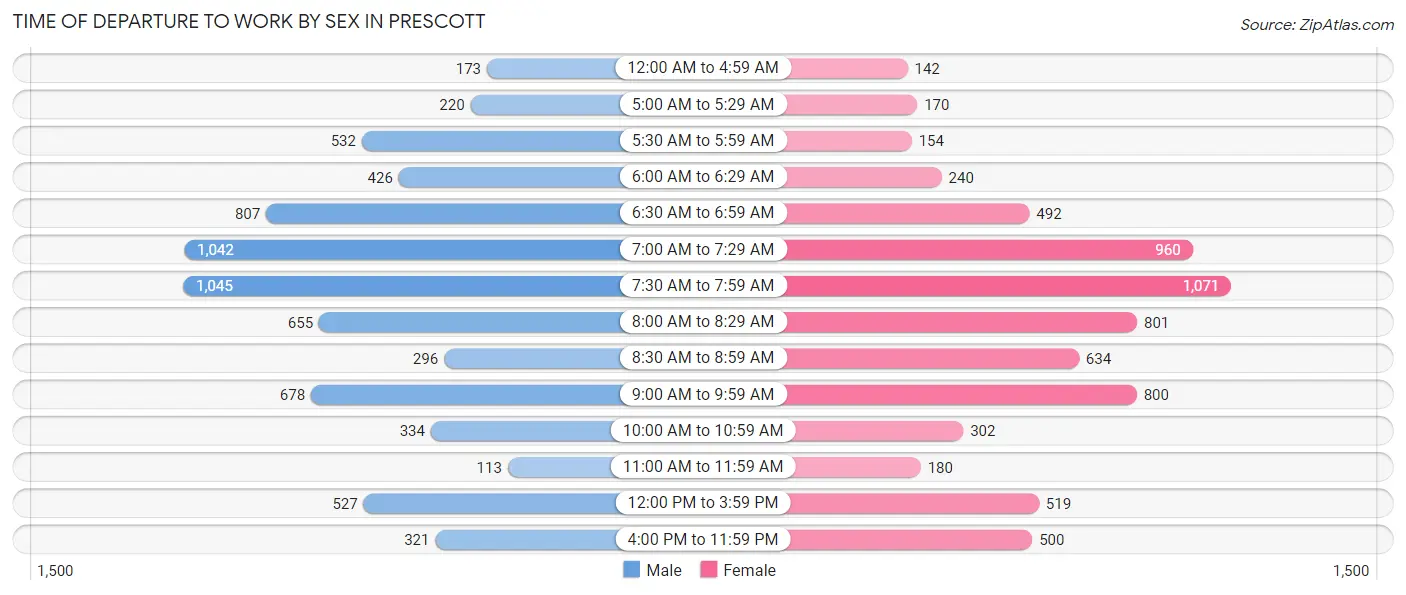
| Time of Departure | Male | Female |
| 12:00 AM to 4:59 AM | 173 (2.4%) | 142 (2.0%) |
| 5:00 AM to 5:29 AM | 220 (3.1%) | 170 (2.4%) |
| 5:30 AM to 5:59 AM | 532 (7.4%) | 154 (2.2%) |
| 6:00 AM to 6:29 AM | 426 (5.9%) | 240 (3.5%) |
| 6:30 AM to 6:59 AM | 807 (11.3%) | 492 (7.1%) |
| 7:00 AM to 7:29 AM | 1,042 (14.5%) | 960 (13.8%) |
| 7:30 AM to 7:59 AM | 1,045 (14.6%) | 1,071 (15.4%) |
| 8:00 AM to 8:29 AM | 655 (9.1%) | 801 (11.5%) |
| 8:30 AM to 8:59 AM | 296 (4.1%) | 634 (9.1%) |
| 9:00 AM to 9:59 AM | 678 (9.5%) | 800 (11.5%) |
| 10:00 AM to 10:59 AM | 334 (4.7%) | 302 (4.3%) |
| 11:00 AM to 11:59 AM | 113 (1.6%) | 180 (2.6%) |
| 12:00 PM to 3:59 PM | 527 (7.3%) | 519 (7.4%) |
| 4:00 PM to 11:59 PM | 321 (4.5%) | 500 (7.2%) |
| Total | 7,169 (100.0%) | 6,965 (100.0%) |
Housing Occupancy in Prescott
Occupancy by Ownership in Prescott
Of the total 21,803 dwellings in Prescott, owner-occupied units account for 15,125 (69.4%), while renter-occupied units make up 6,678 (30.6%).
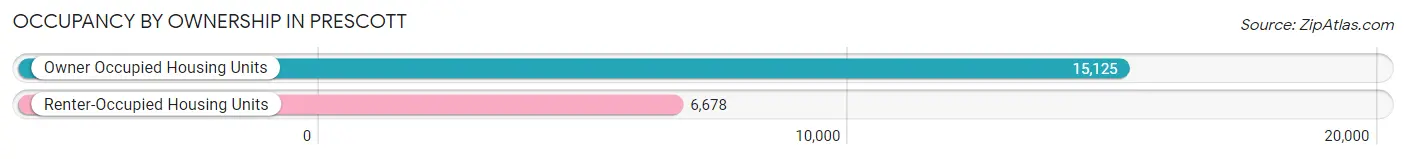
| Occupancy | # Housing Units | % Housing Units |
| Owner Occupied Housing Units | 15,125 | 69.4% |
| Renter-Occupied Housing Units | 6,678 | 30.6% |
| Total Occupied Housing Units | 21,803 | 100.0% |
Occupancy by Household Size in Prescott
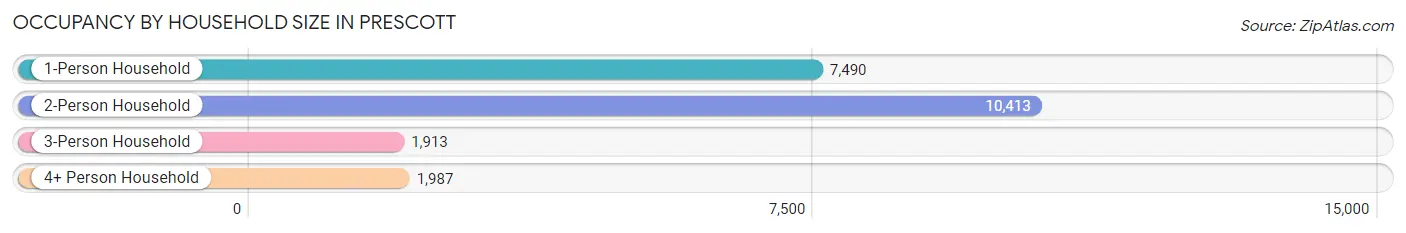
| Household Size | # Housing Units | % Housing Units |
| 1-Person Household | 7,490 | 34.4% |
| 2-Person Household | 10,413 | 47.8% |
| 3-Person Household | 1,913 | 8.8% |
| 4+ Person Household | 1,987 | 9.1% |
| Total Housing Units | 21,803 | 100.0% |
Occupancy by Ownership by Household Size in Prescott
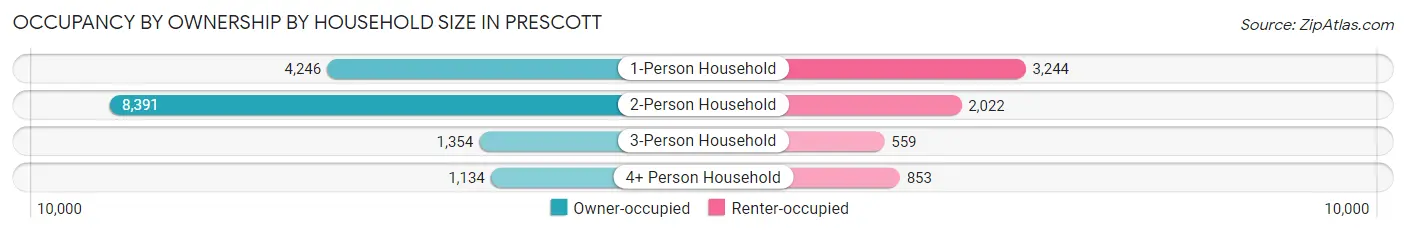
| Household Size | Owner-occupied | Renter-occupied |
| 1-Person Household | 4,246 (56.7%) | 3,244 (43.3%) |
| 2-Person Household | 8,391 (80.6%) | 2,022 (19.4%) |
| 3-Person Household | 1,354 (70.8%) | 559 (29.2%) |
| 4+ Person Household | 1,134 (57.1%) | 853 (42.9%) |
| Total Housing Units | 15,125 (69.4%) | 6,678 (30.6%) |
Occupancy by Educational Attainment in Prescott
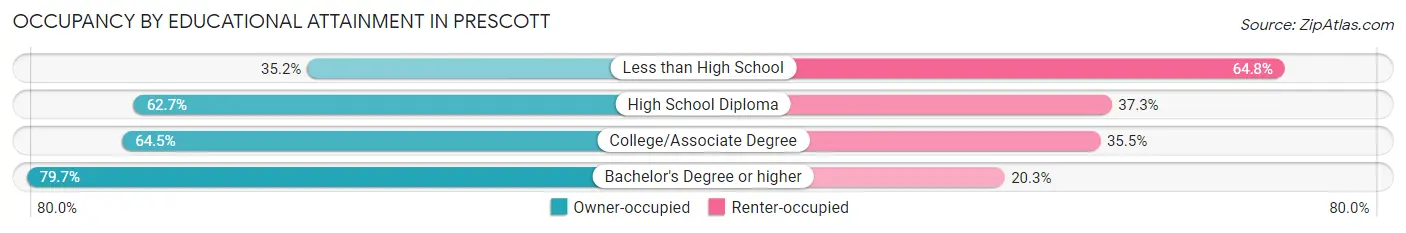
| Household Size | Owner-occupied | Renter-occupied |
| Less than High School | 350 (35.2%) | 645 (64.8%) |
| High School Diploma | 1,978 (62.7%) | 1,177 (37.3%) |
| College/Associate Degree | 5,396 (64.5%) | 2,970 (35.5%) |
| Bachelor's Degree or higher | 7,401 (79.7%) | 1,886 (20.3%) |
Occupancy by Age of Householder in Prescott
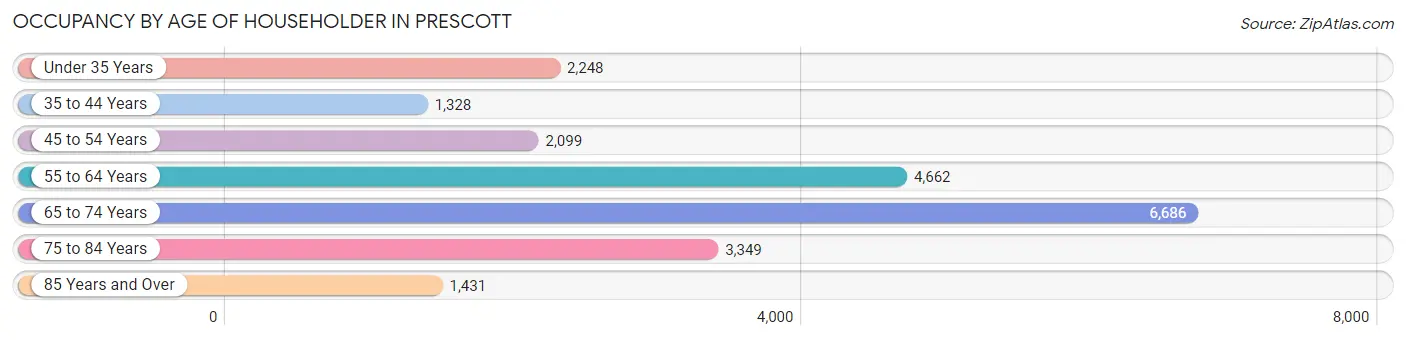
| Age Bracket | # Households | % Households |
| Under 35 Years | 2,248 | 10.3% |
| 35 to 44 Years | 1,328 | 6.1% |
| 45 to 54 Years | 2,099 | 9.6% |
| 55 to 64 Years | 4,662 | 21.4% |
| 65 to 74 Years | 6,686 | 30.7% |
| 75 to 84 Years | 3,349 | 15.4% |
| 85 Years and Over | 1,431 | 6.6% |
| Total | 21,803 | 100.0% |
Housing Finances in Prescott
Median Income by Occupancy in Prescott
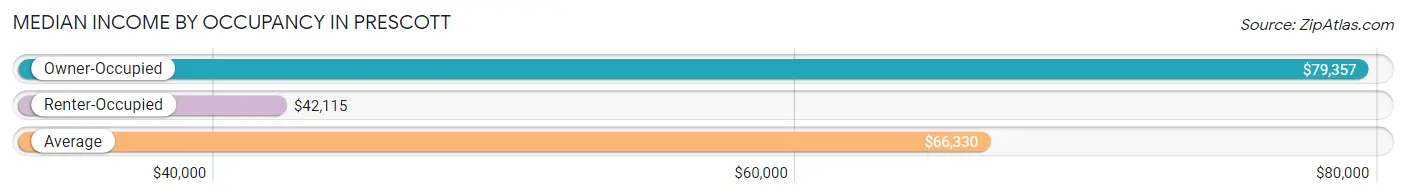
| Occupancy Type | # Households | Median Income |
| Owner-Occupied | 15,125 (69.4%) | $79,357 |
| Renter-Occupied | 6,678 (30.6%) | $42,115 |
| Average | 21,803 (100.0%) | $66,330 |
Occupancy by Householder Income Bracket in Prescott
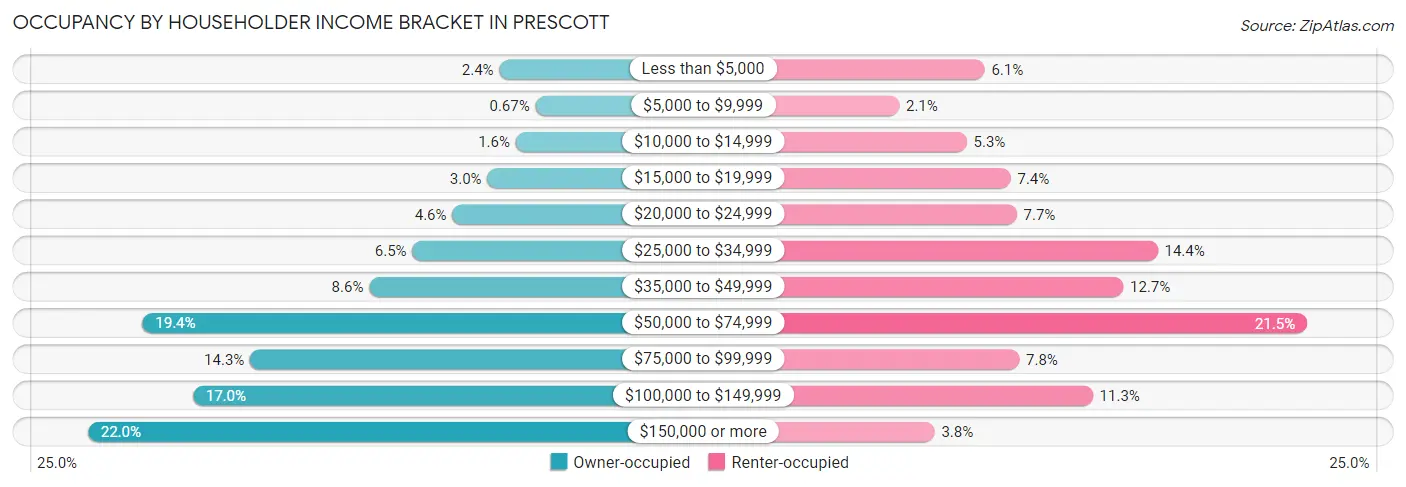
| Income Bracket | Owner-occupied | Renter-occupied |
| Less than $5,000 | 361 (2.4%) | 410 (6.1%) |
| $5,000 to $9,999 | 101 (0.7%) | 138 (2.1%) |
| $10,000 to $14,999 | 244 (1.6%) | 353 (5.3%) |
| $15,000 to $19,999 | 447 (3.0%) | 493 (7.4%) |
| $20,000 to $24,999 | 701 (4.6%) | 512 (7.7%) |
| $25,000 to $34,999 | 988 (6.5%) | 960 (14.4%) |
| $35,000 to $49,999 | 1,299 (8.6%) | 851 (12.7%) |
| $50,000 to $74,999 | 2,932 (19.4%) | 1,436 (21.5%) |
| $75,000 to $99,999 | 2,157 (14.3%) | 520 (7.8%) |
| $100,000 to $149,999 | 2,569 (17.0%) | 754 (11.3%) |
| $150,000 or more | 3,326 (22.0%) | 251 (3.8%) |
| Total | 15,125 (100.0%) | 6,678 (100.0%) |
Monthly Housing Cost Tiers in Prescott
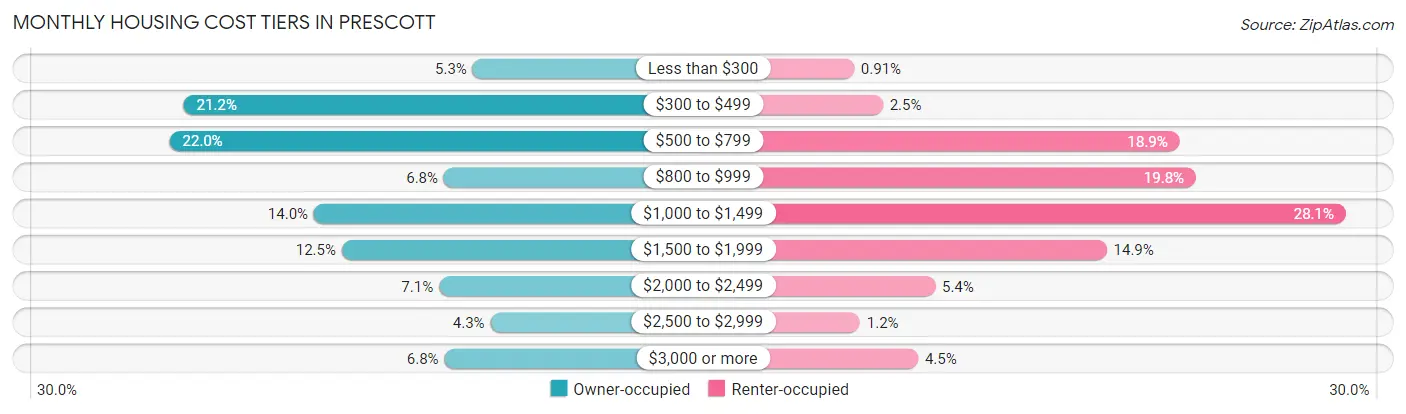
| Monthly Cost | Owner-occupied | Renter-occupied |
| Less than $300 | 794 (5.2%) | 61 (0.9%) |
| $300 to $499 | 3,210 (21.2%) | 167 (2.5%) |
| $500 to $799 | 3,327 (22.0%) | 1,262 (18.9%) |
| $800 to $999 | 1,034 (6.8%) | 1,322 (19.8%) |
| $1,000 to $1,499 | 2,121 (14.0%) | 1,875 (28.1%) |
| $1,500 to $1,999 | 1,888 (12.5%) | 993 (14.9%) |
| $2,000 to $2,499 | 1,075 (7.1%) | 360 (5.4%) |
| $2,500 to $2,999 | 646 (4.3%) | 83 (1.2%) |
| $3,000 or more | 1,030 (6.8%) | 297 (4.4%) |
| Total | 15,125 (100.0%) | 6,678 (100.0%) |
Physical Housing Characteristics in Prescott
Housing Structures in Prescott
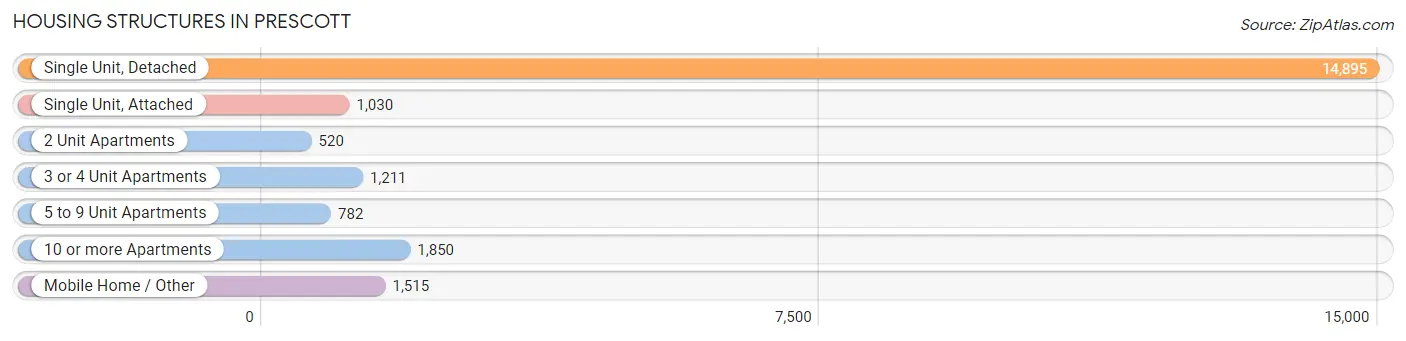
| Structure Type | # Housing Units | % Housing Units |
| Single Unit, Detached | 14,895 | 68.3% |
| Single Unit, Attached | 1,030 | 4.7% |
| 2 Unit Apartments | 520 | 2.4% |
| 3 or 4 Unit Apartments | 1,211 | 5.6% |
| 5 to 9 Unit Apartments | 782 | 3.6% |
| 10 or more Apartments | 1,850 | 8.5% |
| Mobile Home / Other | 1,515 | 7.0% |
| Total | 21,803 | 100.0% |
Housing Structures by Occupancy in Prescott
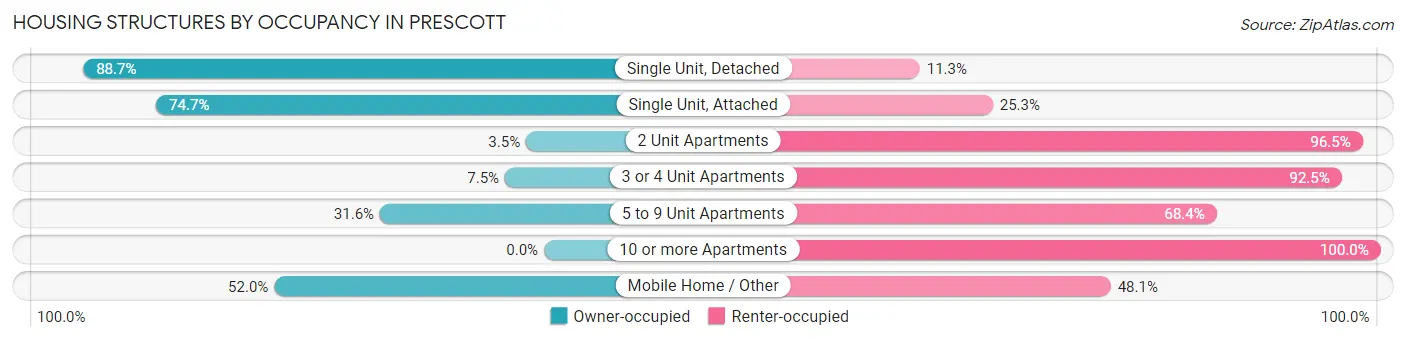
| Structure Type | Owner-occupied | Renter-occupied |
| Single Unit, Detached | 13,213 (88.7%) | 1,682 (11.3%) |
| Single Unit, Attached | 769 (74.7%) | 261 (25.3%) |
| 2 Unit Apartments | 18 (3.5%) | 502 (96.5%) |
| 3 or 4 Unit Apartments | 91 (7.5%) | 1,120 (92.5%) |
| 5 to 9 Unit Apartments | 247 (31.6%) | 535 (68.4%) |
| 10 or more Apartments | 0 (0.0%) | 1,850 (100.0%) |
| Mobile Home / Other | 787 (51.9%) | 728 (48.0%) |
| Total | 15,125 (69.4%) | 6,678 (30.6%) |
Housing Structures by Number of Rooms in Prescott
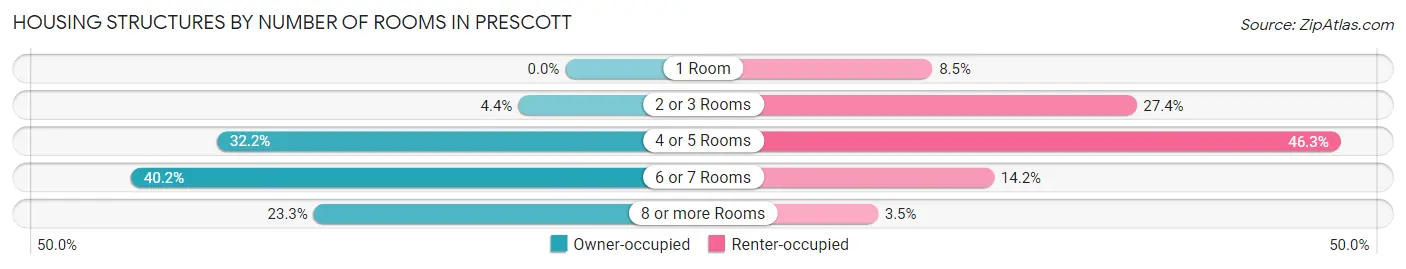
| Number of Rooms | Owner-occupied | Renter-occupied |
| 1 Room | 0 (0.0%) | 570 (8.5%) |
| 2 or 3 Rooms | 658 (4.3%) | 1,831 (27.4%) |
| 4 or 5 Rooms | 4,872 (32.2%) | 3,092 (46.3%) |
| 6 or 7 Rooms | 6,076 (40.2%) | 951 (14.2%) |
| 8 or more Rooms | 3,519 (23.3%) | 234 (3.5%) |
| Total | 15,125 (100.0%) | 6,678 (100.0%) |
Housing Structure by Heating Type in Prescott
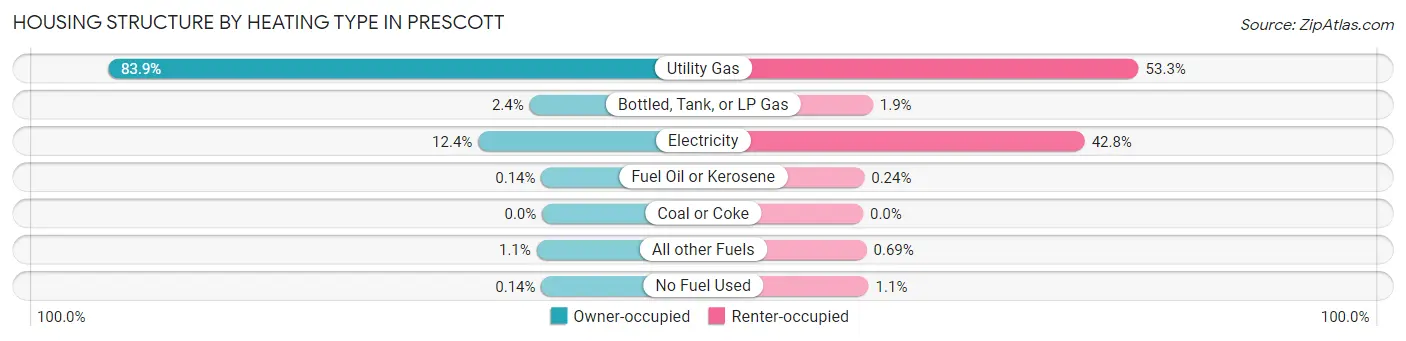
| Heating Type | Owner-occupied | Renter-occupied |
| Utility Gas | 12,688 (83.9%) | 3,557 (53.3%) |
| Bottled, Tank, or LP Gas | 366 (2.4%) | 127 (1.9%) |
| Electricity | 1,869 (12.4%) | 2,860 (42.8%) |
| Fuel Oil or Kerosene | 21 (0.1%) | 16 (0.2%) |
| Coal or Coke | 0 (0.0%) | 0 (0.0%) |
| All other Fuels | 160 (1.1%) | 46 (0.7%) |
| No Fuel Used | 21 (0.1%) | 72 (1.1%) |
| Total | 15,125 (100.0%) | 6,678 (100.0%) |
Household Vehicle Usage in Prescott
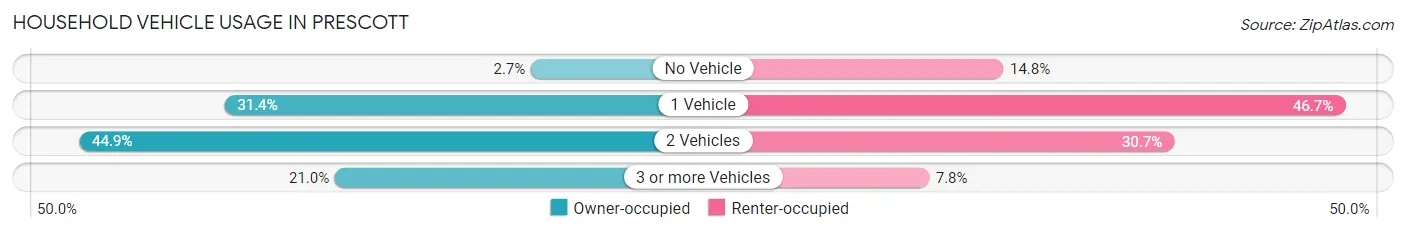
| Vehicles per Household | Owner-occupied | Renter-occupied |
| No Vehicle | 411 (2.7%) | 986 (14.8%) |
| 1 Vehicle | 4,741 (31.4%) | 3,117 (46.7%) |
| 2 Vehicles | 6,793 (44.9%) | 2,052 (30.7%) |
| 3 or more Vehicles | 3,180 (21.0%) | 523 (7.8%) |
| Total | 15,125 (100.0%) | 6,678 (100.0%) |
Real Estate & Mortgages in Prescott
Real Estate and Mortgage Overview in Prescott
| Characteristic | Without Mortgage | With Mortgage |
| Housing Units | 7,624 | 7,501 |
| Median Property Value | $477,000 | $470,100 |
| Median Household Income | $67,182 | $1,951 |
| Monthly Housing Costs | $493 | $1,008 |
| Real Estate Taxes | $1,936 | $119 |
Property Value by Mortgage Status in Prescott
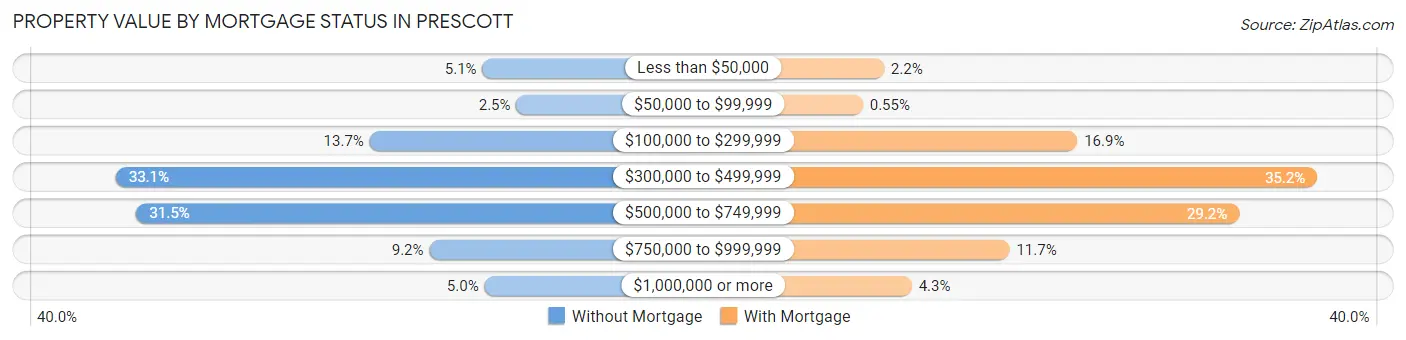
| Property Value | Without Mortgage | With Mortgage |
| Less than $50,000 | 390 (5.1%) | 162 (2.2%) |
| $50,000 to $99,999 | 193 (2.5%) | 41 (0.5%) |
| $100,000 to $299,999 | 1,045 (13.7%) | 1,267 (16.9%) |
| $300,000 to $499,999 | 2,520 (33.1%) | 2,638 (35.2%) |
| $500,000 to $749,999 | 2,400 (31.5%) | 2,192 (29.2%) |
| $750,000 to $999,999 | 698 (9.2%) | 880 (11.7%) |
| $1,000,000 or more | 378 (5.0%) | 321 (4.3%) |
| Total | 7,624 (100.0%) | 7,501 (100.0%) |
Household Income by Mortgage Status in Prescott
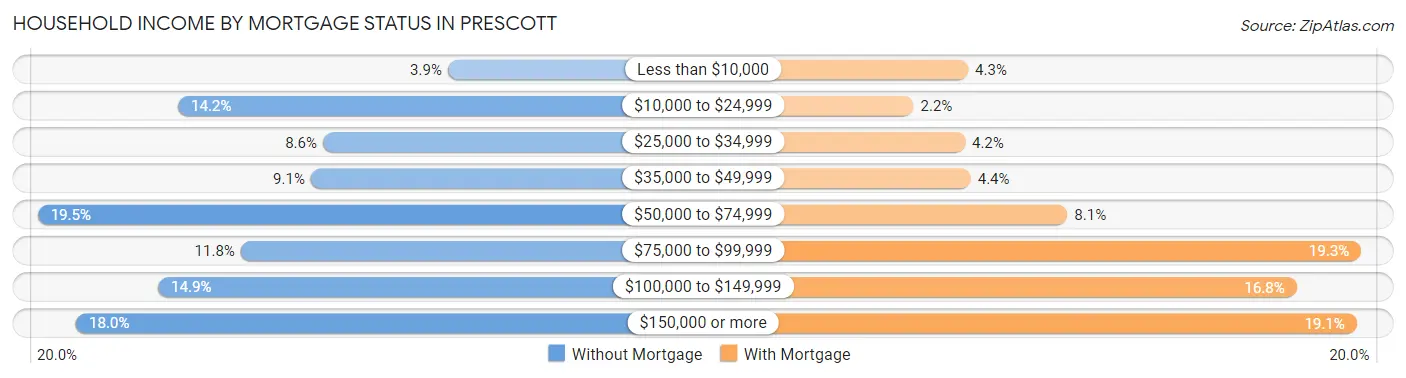
| Household Income | Without Mortgage | With Mortgage |
| Less than $10,000 | 296 (3.9%) | 322 (4.3%) |
| $10,000 to $24,999 | 1,079 (14.1%) | 166 (2.2%) |
| $25,000 to $34,999 | 659 (8.6%) | 313 (4.2%) |
| $35,000 to $49,999 | 694 (9.1%) | 329 (4.4%) |
| $50,000 to $74,999 | 1,487 (19.5%) | 605 (8.1%) |
| $75,000 to $99,999 | 897 (11.8%) | 1,445 (19.3%) |
| $100,000 to $149,999 | 1,137 (14.9%) | 1,260 (16.8%) |
| $150,000 or more | 1,375 (18.0%) | 1,432 (19.1%) |
| Total | 7,624 (100.0%) | 7,501 (100.0%) |
Property Value to Household Income Ratio in Prescott
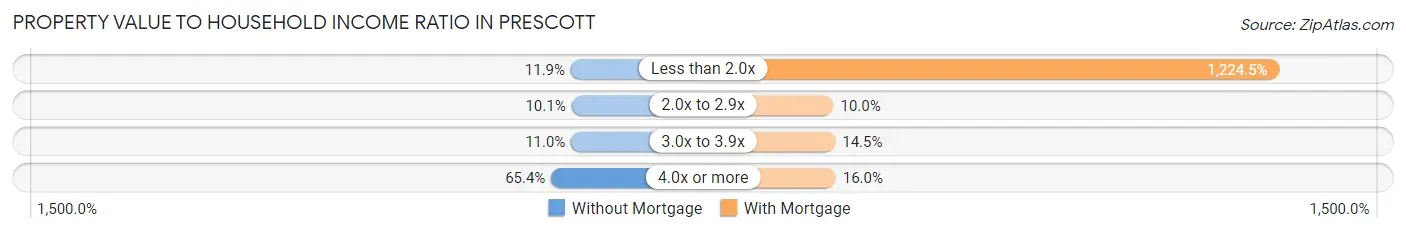
| Value-to-Income Ratio | Without Mortgage | With Mortgage |
| Less than 2.0x | 907 (11.9%) | 91,848 (1,224.5%) |
| 2.0x to 2.9x | 772 (10.1%) | 750 (10.0%) |
| 3.0x to 3.9x | 837 (11.0%) | 1,090 (14.5%) |
| 4.0x or more | 4,989 (65.4%) | 1,202 (16.0%) |
| Total | 7,624 (100.0%) | 7,501 (100.0%) |
Real Estate Taxes by Mortgage Status in Prescott
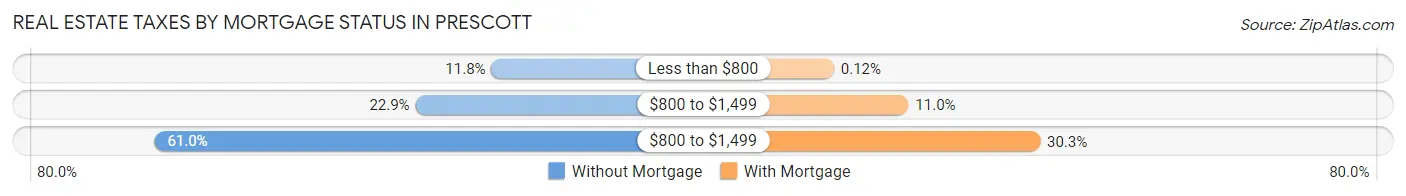
| Property Taxes | Without Mortgage | With Mortgage |
| Less than $800 | 899 (11.8%) | 9 (0.1%) |
| $800 to $1,499 | 1,745 (22.9%) | 826 (11.0%) |
| $800 to $1,499 | 4,652 (61.0%) | 2,269 (30.2%) |
| Total | 7,624 (100.0%) | 7,501 (100.0%) |
Health & Disability in Prescott
Health Insurance Coverage by Age in Prescott
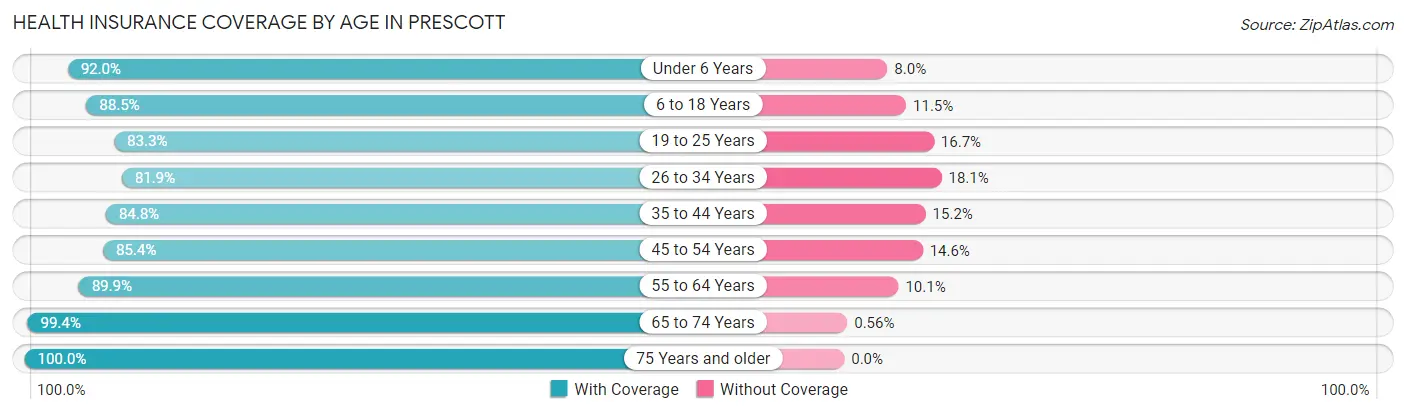
| Age Bracket | With Coverage | Without Coverage |
| Under 6 Years | 1,566 (92.0%) | 137 (8.0%) |
| 6 to 18 Years | 3,884 (88.5%) | 506 (11.5%) |
| 19 to 25 Years | 2,747 (83.3%) | 551 (16.7%) |
| 26 to 34 Years | 2,795 (81.9%) | 619 (18.1%) |
| 35 to 44 Years | 2,282 (84.8%) | 408 (15.2%) |
| 45 to 54 Years | 3,288 (85.4%) | 563 (14.6%) |
| 55 to 64 Years | 6,979 (89.9%) | 784 (10.1%) |
| 65 to 74 Years | 10,691 (99.4%) | 60 (0.6%) |
| 75 Years and older | 7,698 (100.0%) | 0 (0.0%) |
| Total | 41,930 (92.0%) | 3,628 (8.0%) |
Health Insurance Coverage by Citizenship Status in Prescott
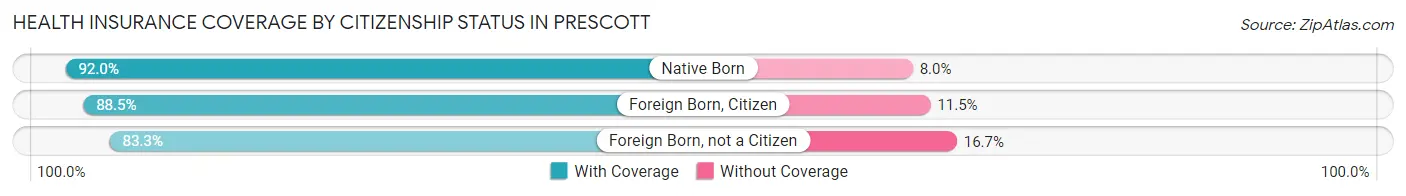
| Citizenship Status | With Coverage | Without Coverage |
| Native Born | 1,566 (92.0%) | 137 (8.0%) |
| Foreign Born, Citizen | 3,884 (88.5%) | 506 (11.5%) |
| Foreign Born, not a Citizen | 2,747 (83.3%) | 551 (16.7%) |
Health Insurance Coverage by Household Income in Prescott
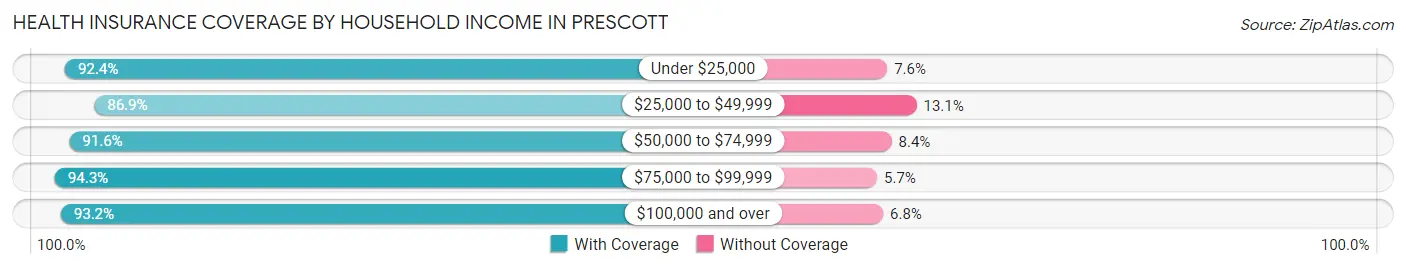
| Household Income | With Coverage | Without Coverage |
| Under $25,000 | 5,302 (92.4%) | 434 (7.6%) |
| $25,000 to $49,999 | 6,040 (86.9%) | 908 (13.1%) |
| $50,000 to $74,999 | 8,035 (91.6%) | 737 (8.4%) |
| $75,000 to $99,999 | 5,213 (94.3%) | 314 (5.7%) |
| $100,000 and over | 15,506 (93.2%) | 1,132 (6.8%) |
Public vs Private Health Insurance Coverage by Age in Prescott
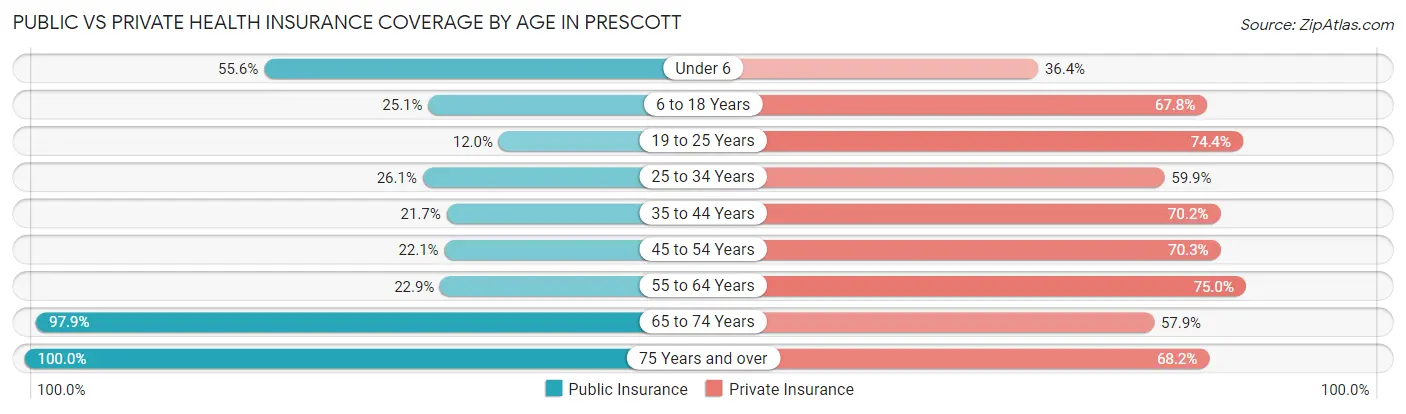
| Age Bracket | Public Insurance | Private Insurance |
| Under 6 | 946 (55.5%) | 620 (36.4%) |
| 6 to 18 Years | 1,100 (25.1%) | 2,976 (67.8%) |
| 19 to 25 Years | 395 (12.0%) | 2,455 (74.4%) |
| 25 to 34 Years | 891 (26.1%) | 2,044 (59.9%) |
| 35 to 44 Years | 583 (21.7%) | 1,889 (70.2%) |
| 45 to 54 Years | 850 (22.1%) | 2,706 (70.3%) |
| 55 to 64 Years | 1,775 (22.9%) | 5,820 (75.0%) |
| 65 to 74 Years | 10,521 (97.9%) | 6,229 (57.9%) |
| 75 Years and over | 7,698 (100.0%) | 5,249 (68.2%) |
| Total | 24,759 (54.3%) | 29,988 (65.8%) |
Disability Status by Sex by Age in Prescott
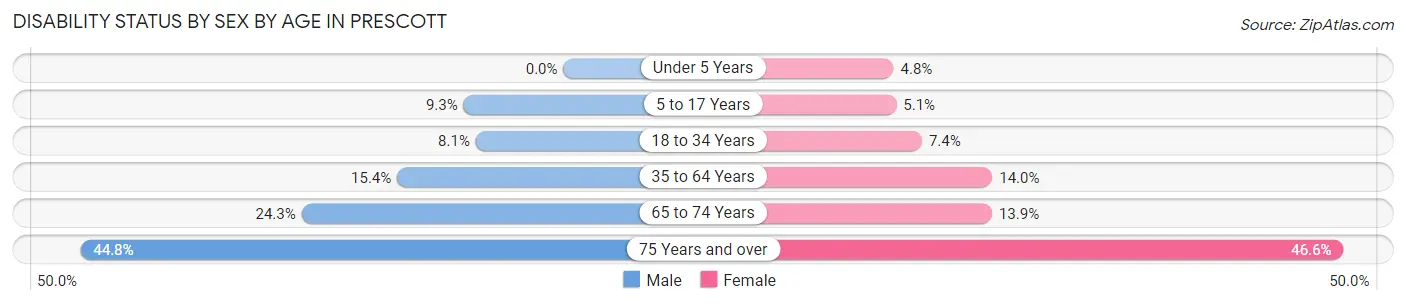
| Age Bracket | Male | Female |
| Under 5 Years | 0 (0.0%) | 35 (4.8%) |
| 5 to 17 Years | 198 (9.3%) | 88 (5.1%) |
| 18 to 34 Years | 309 (8.1%) | 268 (7.4%) |
| 35 to 64 Years | 1,043 (15.4%) | 1,054 (14.0%) |
| 65 to 74 Years | 1,251 (24.3%) | 781 (13.9%) |
| 75 Years and over | 1,644 (44.8%) | 1,876 (46.6%) |
Disability Class by Sex by Age in Prescott
Disability Class: Hearing Difficulty
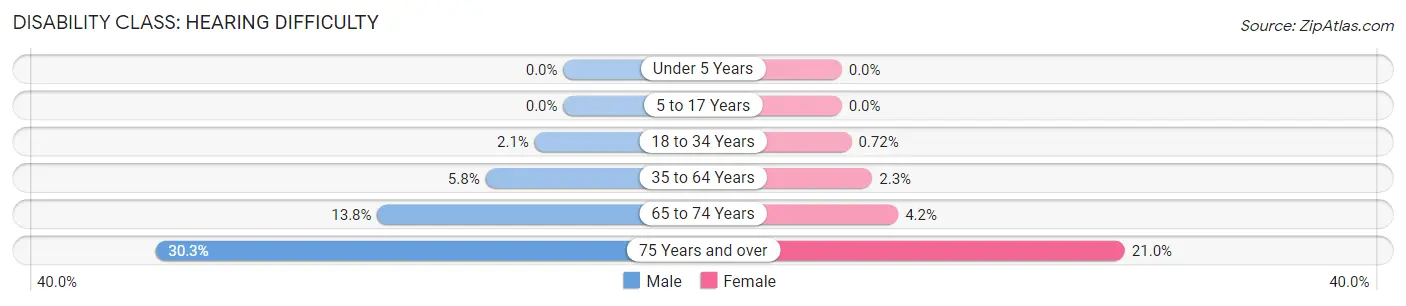
| Age Bracket | Male | Female |
| Under 5 Years | 0 (0.0%) | 0 (0.0%) |
| 5 to 17 Years | 0 (0.0%) | 0 (0.0%) |
| 18 to 34 Years | 81 (2.1%) | 26 (0.7%) |
| 35 to 64 Years | 391 (5.8%) | 171 (2.3%) |
| 65 to 74 Years | 711 (13.8%) | 235 (4.2%) |
| 75 Years and over | 1,111 (30.3%) | 847 (21.0%) |
Disability Class: Vision Difficulty
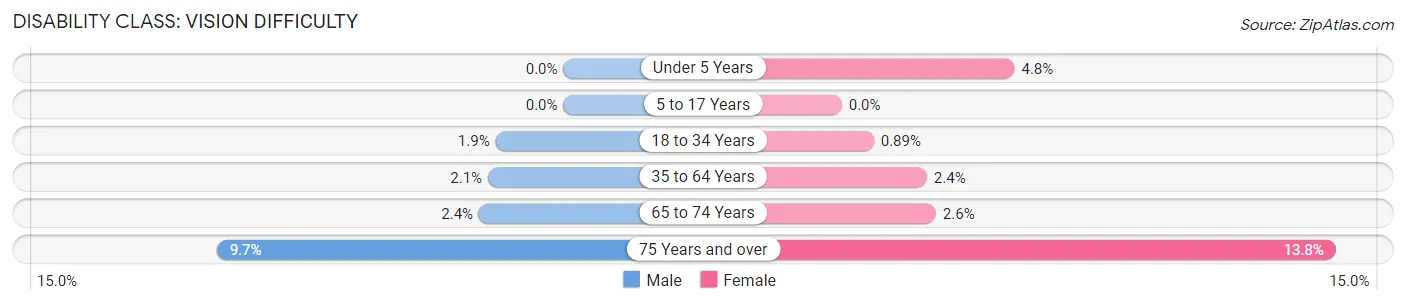
| Age Bracket | Male | Female |
| Under 5 Years | 0 (0.0%) | 35 (4.8%) |
| 5 to 17 Years | 0 (0.0%) | 0 (0.0%) |
| 18 to 34 Years | 72 (1.9%) | 32 (0.9%) |
| 35 to 64 Years | 142 (2.1%) | 179 (2.4%) |
| 65 to 74 Years | 121 (2.4%) | 147 (2.6%) |
| 75 Years and over | 354 (9.7%) | 554 (13.8%) |
Disability Class: Cognitive Difficulty
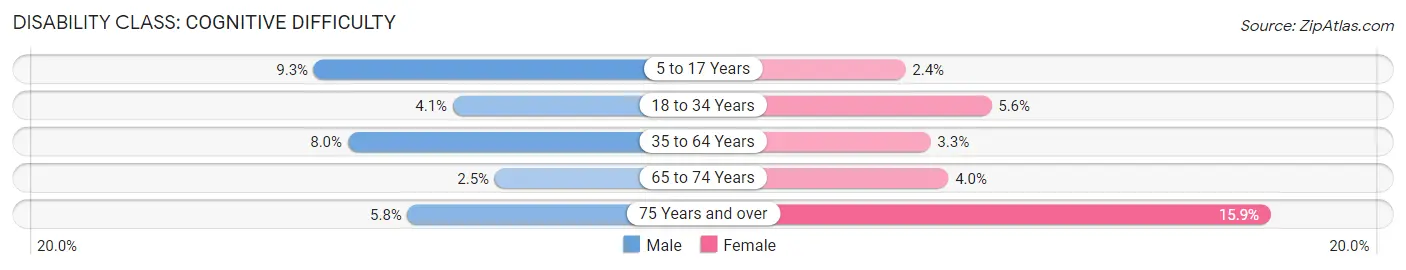
| Age Bracket | Male | Female |
| 5 to 17 Years | 198 (9.3%) | 41 (2.4%) |
| 18 to 34 Years | 156 (4.1%) | 200 (5.6%) |
| 35 to 64 Years | 541 (8.0%) | 248 (3.3%) |
| 65 to 74 Years | 131 (2.5%) | 221 (4.0%) |
| 75 Years and over | 212 (5.8%) | 642 (15.9%) |
Disability Class: Ambulatory Difficulty
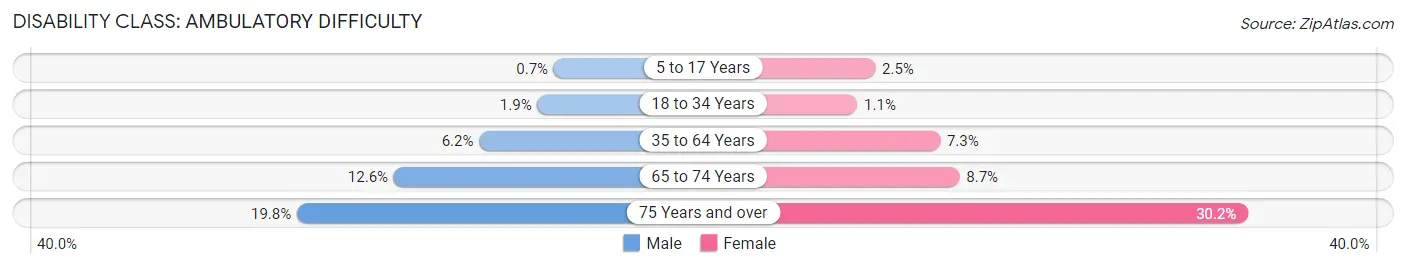
| Age Bracket | Male | Female |
| 5 to 17 Years | 15 (0.7%) | 43 (2.5%) |
| 18 to 34 Years | 73 (1.9%) | 41 (1.1%) |
| 35 to 64 Years | 422 (6.2%) | 550 (7.3%) |
| 65 to 74 Years | 648 (12.6%) | 489 (8.7%) |
| 75 Years and over | 725 (19.8%) | 1,216 (30.2%) |
Disability Class: Self-Care Difficulty
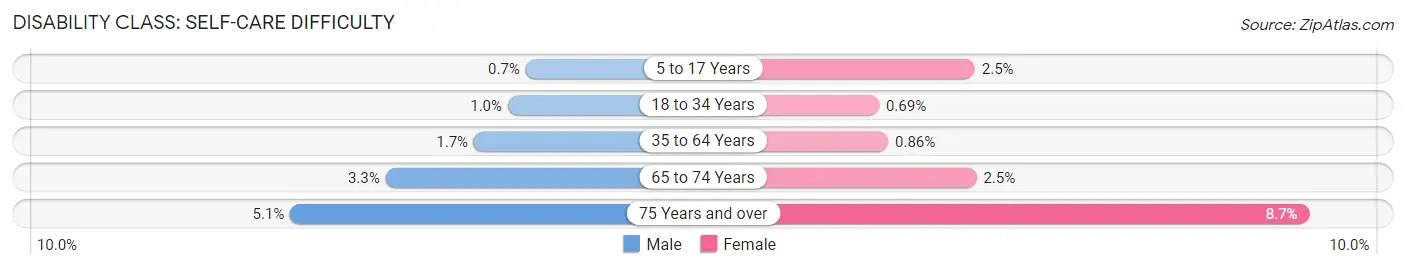
| Age Bracket | Male | Female |
| 5 to 17 Years | 15 (0.7%) | 43 (2.5%) |
| 18 to 34 Years | 39 (1.0%) | 25 (0.7%) |
| 35 to 64 Years | 112 (1.7%) | 65 (0.9%) |
| 65 to 74 Years | 170 (3.3%) | 140 (2.5%) |
| 75 Years and over | 186 (5.1%) | 350 (8.7%) |
Technology Access in Prescott
Computing Device Access in Prescott
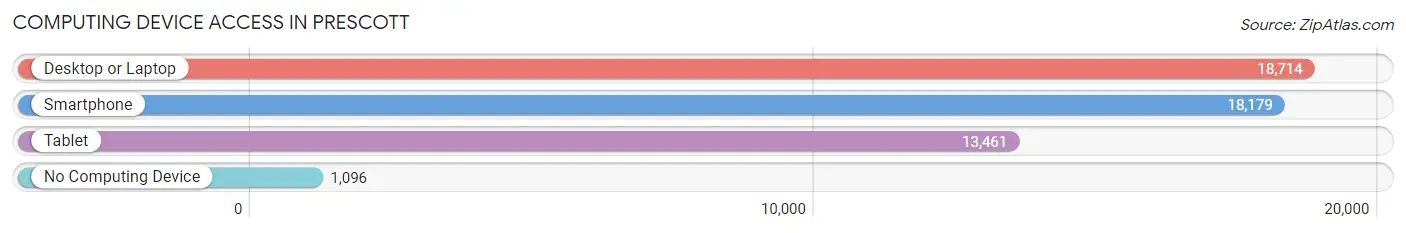
| Device Type | # Households | % Households |
| Desktop or Laptop | 18,714 | 85.8% |
| Smartphone | 18,179 | 83.4% |
| Tablet | 13,461 | 61.7% |
| No Computing Device | 1,096 | 5.0% |
| Total | 21,803 | 100.0% |
Internet Access in Prescott
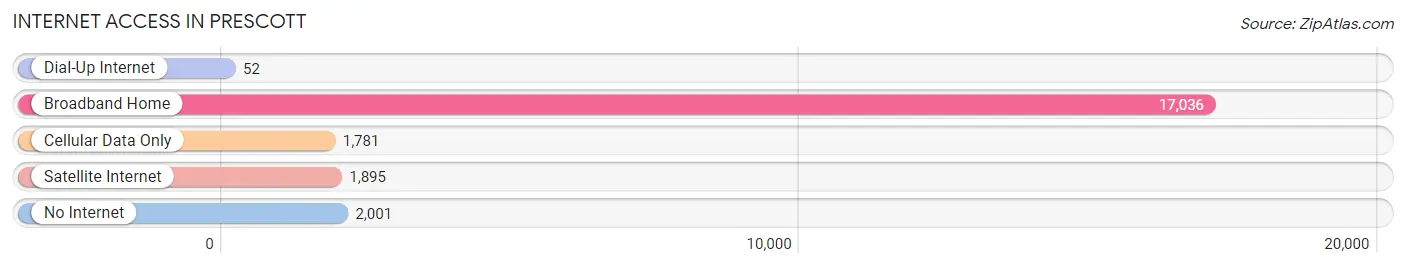
| Internet Type | # Households | % Households |
| Dial-Up Internet | 52 | 0.2% |
| Broadband Home | 17,036 | 78.1% |
| Cellular Data Only | 1,781 | 8.2% |
| Satellite Internet | 1,895 | 8.7% |
| No Internet | 2,001 | 9.2% |
| Total | 21,803 | 100.0% |
Prescott Summary
Prescott, Arizona is a city located in Yavapai County in the north-central part of the state. It is the county seat and the most populous city in the county. The city is situated in the Bradshaw Mountains at an elevation of 5,400 feet, and is approximately 90 miles north of Phoenix. Prescott is known for its mild climate, outdoor recreation, and historic downtown.
History
Prescott was founded in 1864 by William “Bucky” O’Neill, a former Confederate soldier and Arizona territorial governor. The city was named after William Hickling Prescott, a historian and author. The city was originally a mining camp, and the area was known for its gold and silver deposits. In 1877, the Arizona Territorial Legislature established the city as the county seat of Yavapai County.
In the late 19th century, Prescott became a popular destination for tourists and health seekers. The city was known for its mild climate and clean air, and many people came to the area to escape the heat of the desert. The city also became a popular destination for wealthy ranchers and businessmen.
Geography
Prescott is located in the Bradshaw Mountains, a range of mountains in the north-central part of Arizona. The city is situated at an elevation of 5,400 feet, and is approximately 90 miles north of Phoenix. The city is surrounded by the Prescott National Forest, which covers an area of 1.25 million acres. The city is also located near the Granite Dells, a geological formation of granite boulders.
The city has a total area of 41.3 square miles, of which 40.9 square miles is land and 0.4 square miles is water. The city is located in a semi-arid climate zone, and receives an average of 12 inches of precipitation per year.
Economy
Prescott’s economy is largely based on tourism, healthcare, and government services. The city is home to several major employers, including Yavapai Regional Medical Center, Embry-Riddle Aeronautical University, and the Prescott Unified School District. The city is also home to several major retail stores, including Walmart, Home Depot, and Target.
The city is also home to several major manufacturing companies, including Arizona Pacific Wood Preserving, Inc., and Prescott Valley Manufacturing. The city is also home to several major technology companies, including Intel, Microsoft, and Oracle.
Demographics
As of the 2010 census, Prescott had a population of 39,843. The racial makeup of the city was 87.2% White, 1.2% African American, 1.3% Native American, 0.9% Asian, 0.1% Pacific Islander, 6.7% from other races, and 2.6% from two or more races. Hispanic or Latino of any race were 15.2% of the population.
The median income for a household in the city was $41,919, and the median income for a family was $50,945. The per capita income for the city was $23,945. About 11.2% of families and 15.3% of the population were below the poverty line, including 22.2% of those under age 18 and 8.2% of those age 65 or over.
Common Questions
What is Per Capita Income in Prescott?
Per Capita income in Prescott is $46,076.
What is the Median Family Income in Prescott?
Median Family Income in Prescott is $87,600.
What is the Median Household income in Prescott?
Median Household Income in Prescott is $66,330.
What is Income or Wage Gap in Prescott?
Income or Wage Gap in Prescott is 12.4%.
Women in Prescott earn 87.6 cents for every dollar earned by a man.
What is Family Income Deficit in Prescott?
Family Income Deficit in Prescott is $9,866.
Families that are below poverty line in Prescott earn $9,866 less on average than the poverty threshold level.
What is Inequality or Gini Index in Prescott?
Inequality or Gini Index in Prescott is 0.49.
What is the Total Population of Prescott?
Total Population of Prescott is 46,054.
What is the Total Male Population of Prescott?
Total Male Population of Prescott is 22,622.
What is the Total Female Population of Prescott?
Total Female Population of Prescott is 23,432.
What is the Ratio of Males per 100 Females in Prescott?
There are 96.54 Males per 100 Females in Prescott.
What is the Ratio of Females per 100 Males in Prescott?
There are 103.58 Females per 100 Males in Prescott.
What is the Median Population Age in Prescott?
Median Population Age in Prescott is 60.5 Years.
What is the Average Family Size in Prescott
Average Family Size in Prescott is 2.5 People.
What is the Average Household Size in Prescott
Average Household Size in Prescott is 2.0 People.
How Large is the Labor Force in Prescott?
There are 16,951 People in the Labor Forcein in Prescott.
What is the Percentage of People in the Labor Force in Prescott?
41.1% of People are in the Labor Force in Prescott.
What is the Unemployment Rate in Prescott?
Unemployment Rate in Prescott is 5.2%.