Casas Adobes, AZ Map & Demographics
Casas Adobes Map
Casas Adobes Overview
$43,457
PER CAPITA INCOME
$94,630
AVG FAMILY INCOME
$75,997
AVG HOUSEHOLD INCOME
30.2%
WAGE / INCOME GAP [ % ]
69.8¢/ $1
WAGE / INCOME GAP [ $ ]
$11,571
FAMILY INCOME DEFICIT
0.42
INEQUALITY / GINI INDEX
69,917
TOTAL POPULATION
33,635
MALE POPULATION
36,282
FEMALE POPULATION
92.70
MALES / 100 FEMALES
107.87
FEMALES / 100 MALES
43.0
MEDIAN AGE
2.9
AVG FAMILY SIZE
2.3
AVG HOUSEHOLD SIZE
36,405
LABOR FORCE [ PEOPLE ]
61.0%
PERCENT IN LABOR FORCE
4.9%
UNEMPLOYMENT RATE
Income in Casas Adobes
Income Overview in Casas Adobes
Per Capita Income in Casas Adobes is $43,457, while median incomes of families and households are $94,630 and $75,997 respectively.
| Characteristic | Number | Measure |
| Per Capita Income | 69,917 | $43,457 |
| Median Family Income | 18,213 | $94,630 |
| Mean Family Income | 18,213 | $113,472 |
| Median Household Income | 30,186 | $75,997 |
| Mean Household Income | 30,186 | $97,272 |
| Income Deficit | 18,213 | $11,571 |
| Wage / Income Gap (%) | 69,917 | 30.16% |
| Wage / Income Gap ($) | 69,917 | 69.84¢ per $1 |
| Gini / Inequality Index | 69,917 | 0.42 |
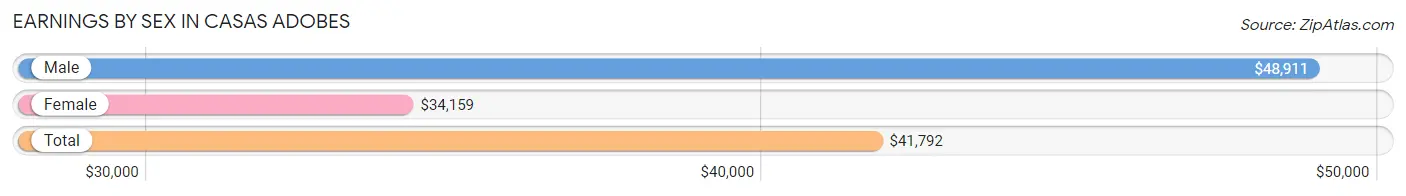
Earnings by Sex in Casas Adobes
Average Earnings in Casas Adobes are $41,792, $48,911 for men and $34,159 for women, a difference of 30.2%.
| Sex | Number | Average Earnings |
| Male | 19,587 (51.8%) | $48,911 |
| Female | 18,207 (48.2%) | $34,159 |
| Total | 37,794 (100.0%) | $41,792 |
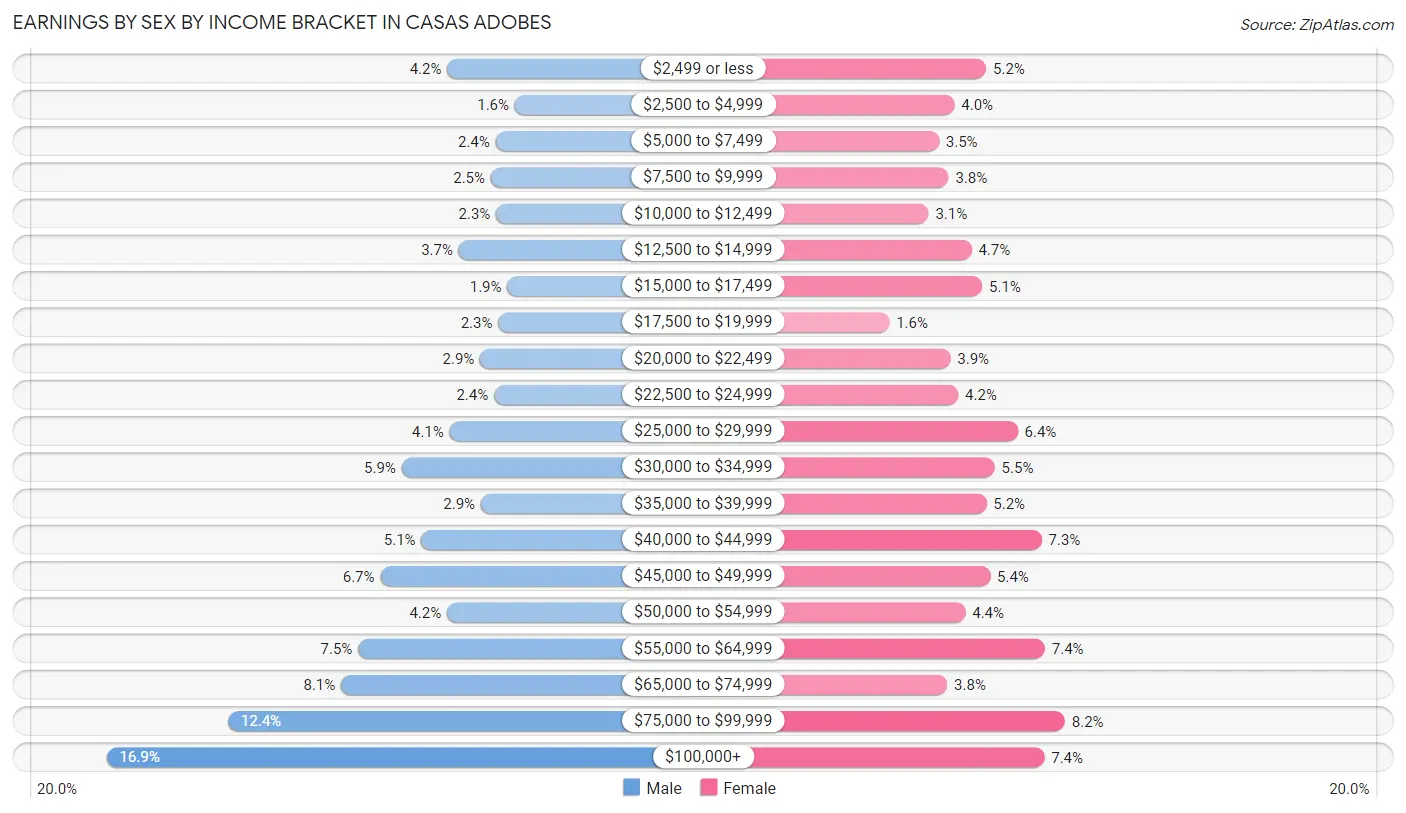
Earnings by Sex by Income Bracket in Casas Adobes
The most common earnings brackets in Casas Adobes are $100,000+ for men (3,317 | 16.9%) and $75,000 to $99,999 for women (1,488 | 8.2%).
| Income | Male | Female |
| $2,499 or less | 815 (4.2%) | 950 (5.2%) |
| $2,500 to $4,999 | 320 (1.6%) | 733 (4.0%) |
| $5,000 to $7,499 | 460 (2.4%) | 629 (3.5%) |
| $7,500 to $9,999 | 495 (2.5%) | 694 (3.8%) |
| $10,000 to $12,499 | 457 (2.3%) | 558 (3.1%) |
| $12,500 to $14,999 | 730 (3.7%) | 851 (4.7%) |
| $15,000 to $17,499 | 375 (1.9%) | 923 (5.1%) |
| $17,500 to $19,999 | 440 (2.2%) | 290 (1.6%) |
| $20,000 to $22,499 | 574 (2.9%) | 707 (3.9%) |
| $22,500 to $24,999 | 472 (2.4%) | 760 (4.2%) |
| $25,000 to $29,999 | 799 (4.1%) | 1,165 (6.4%) |
| $30,000 to $34,999 | 1,150 (5.9%) | 1,009 (5.5%) |
| $35,000 to $39,999 | 568 (2.9%) | 952 (5.2%) |
| $40,000 to $44,999 | 1,005 (5.1%) | 1,329 (7.3%) |
| $45,000 to $49,999 | 1,306 (6.7%) | 977 (5.4%) |
| $50,000 to $54,999 | 817 (4.2%) | 809 (4.4%) |
| $55,000 to $64,999 | 1,469 (7.5%) | 1,351 (7.4%) |
| $65,000 to $74,999 | 1,594 (8.1%) | 685 (3.8%) |
| $75,000 to $99,999 | 2,424 (12.4%) | 1,488 (8.2%) |
| $100,000+ | 3,317 (16.9%) | 1,347 (7.4%) |
| Total | 19,587 (100.0%) | 18,207 (100.0%) |
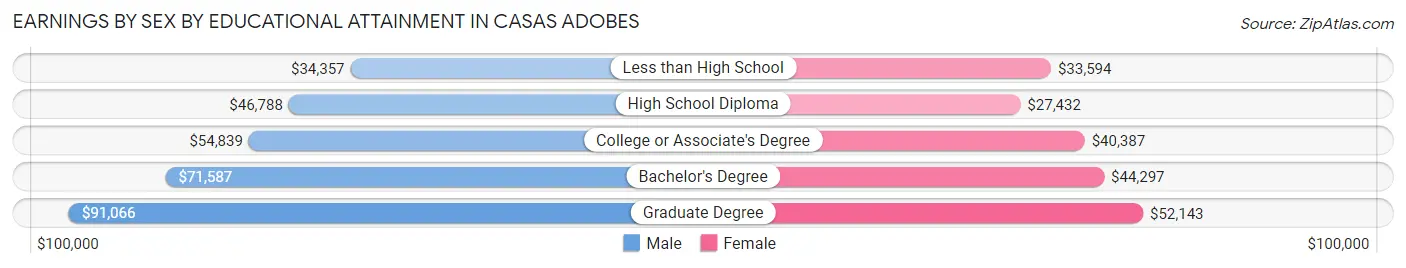
Earnings by Sex by Educational Attainment in Casas Adobes
Average earnings in Casas Adobes are $57,926 for men and $40,753 for women, a difference of 29.6%. Men with an educational attainment of graduate degree enjoy the highest average annual earnings of $91,066, while those with less than high school education earn the least with $34,357. Women with an educational attainment of graduate degree earn the most with the average annual earnings of $52,143, while those with high school diploma education have the smallest earnings of $27,432.
| Educational Attainment | Male Income | Female Income |
| Less than High School | $34,357 | $33,594 |
| High School Diploma | $46,788 | $27,432 |
| College or Associate's Degree | $54,839 | $40,387 |
| Bachelor's Degree | $71,587 | $44,297 |
| Graduate Degree | $91,066 | $52,143 |
| Total | $57,926 | $40,753 |
Family Income in Casas Adobes
Family Income Brackets in Casas Adobes
According to the Casas Adobes family income data, there are 4,663 families falling into the $100,000 to $149,999 income range, which is the most common income bracket and makes up 25.6% of all families. Conversely, the $10,000 to $14,999 income bracket is the least frequent group with only 127 families (0.7%) belonging to this category.
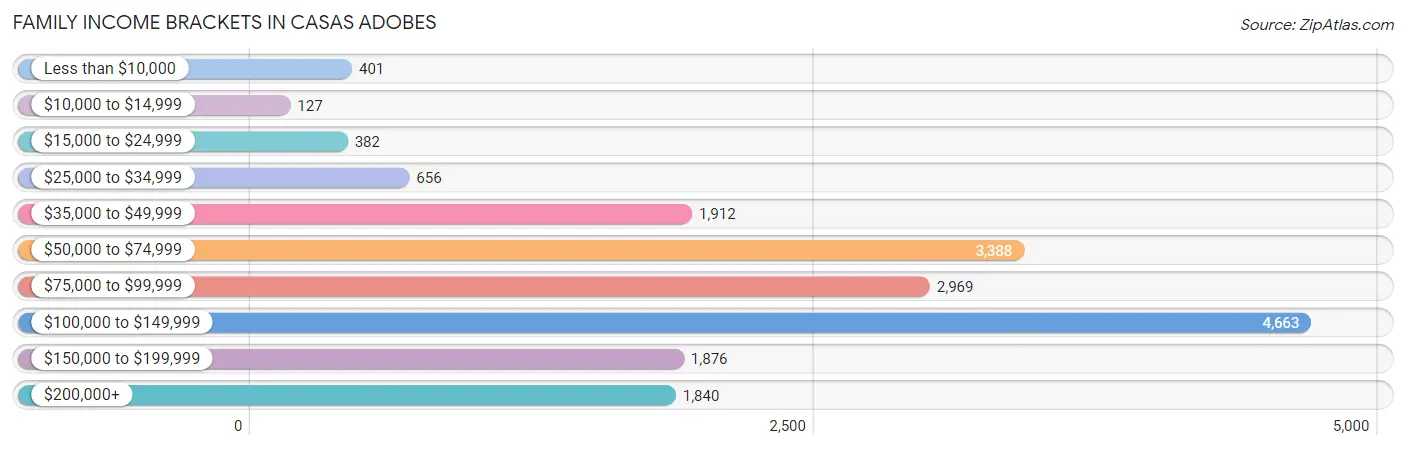
| Income Bracket | # Families | % Families |
| Less than $10,000 | 401 | 2.2% |
| $10,000 to $14,999 | 127 | 0.7% |
| $15,000 to $24,999 | 382 | 2.1% |
| $25,000 to $34,999 | 656 | 3.6% |
| $35,000 to $49,999 | 1,912 | 10.5% |
| $50,000 to $74,999 | 3,388 | 18.6% |
| $75,000 to $99,999 | 2,969 | 16.3% |
| $100,000 to $149,999 | 4,663 | 25.6% |
| $150,000 to $199,999 | 1,876 | 10.3% |
| $200,000+ | 1,840 | 10.1% |
Family Income by Famaliy Size in Casas Adobes
6-person families (340 | 1.9%) account for the highest median family income in Casas Adobes with $123,854 per family, while 2-person families (10,158 | 55.8%) have the highest median income of $41,467 per family member.
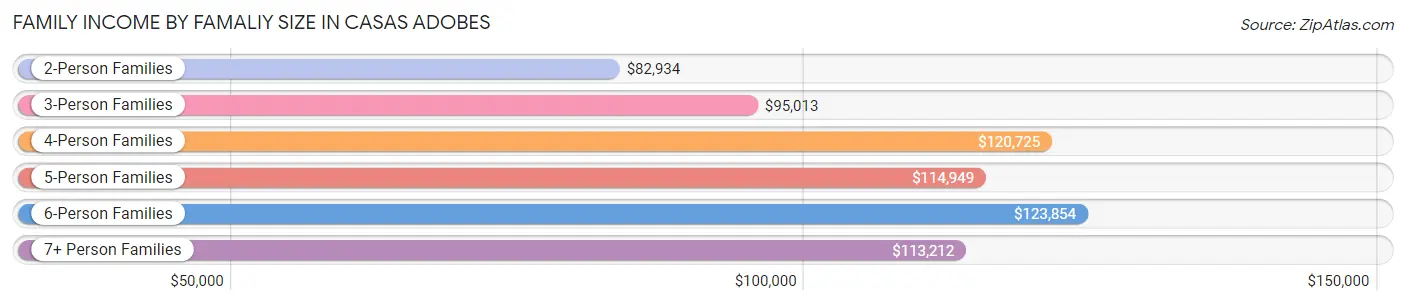
| Income Bracket | # Families | Median Income |
| 2-Person Families | 10,158 (55.8%) | $82,934 |
| 3-Person Families | 4,030 (22.1%) | $95,013 |
| 4-Person Families | 2,396 (13.2%) | $120,725 |
| 5-Person Families | 1,128 (6.2%) | $114,949 |
| 6-Person Families | 340 (1.9%) | $123,854 |
| 7+ Person Families | 161 (0.9%) | $113,212 |
| Total | 18,213 (100.0%) | $94,630 |
Family Income by Number of Earners in Casas Adobes
The median family income in Casas Adobes is $94,630, with families comprising 3+ earners (1,664) having the highest median family income of $131,087, while families with no earners (3,183) have the lowest median family income of $65,777, accounting for 9.1% and 17.5% of families, respectively.
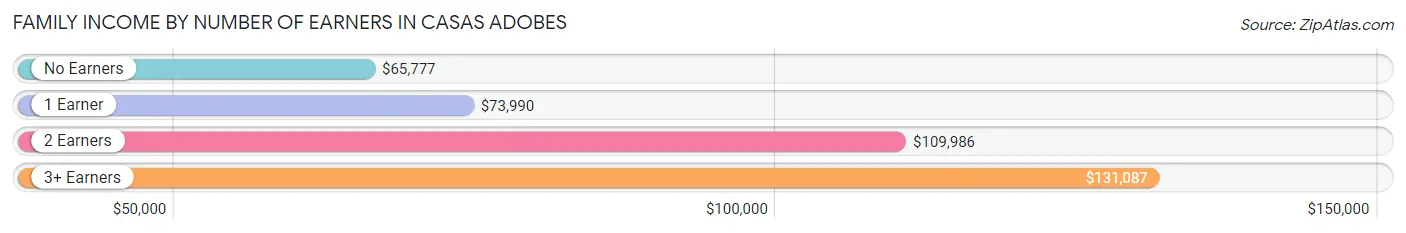
| Number of Earners | # Families | Median Income |
| No Earners | 3,183 (17.5%) | $65,777 |
| 1 Earner | 6,094 (33.5%) | $73,990 |
| 2 Earners | 7,272 (39.9%) | $109,986 |
| 3+ Earners | 1,664 (9.1%) | $131,087 |
| Total | 18,213 (100.0%) | $94,630 |
Household Income in Casas Adobes
Household Income Brackets in Casas Adobes
With 5,886 households falling in the category, the $50,000 to $74,999 income range is the most frequent in Casas Adobes, accounting for 19.5% of all households. In contrast, only 755 households (2.5%) fall into the $10,000 to $14,999 income bracket, making it the least populous group.
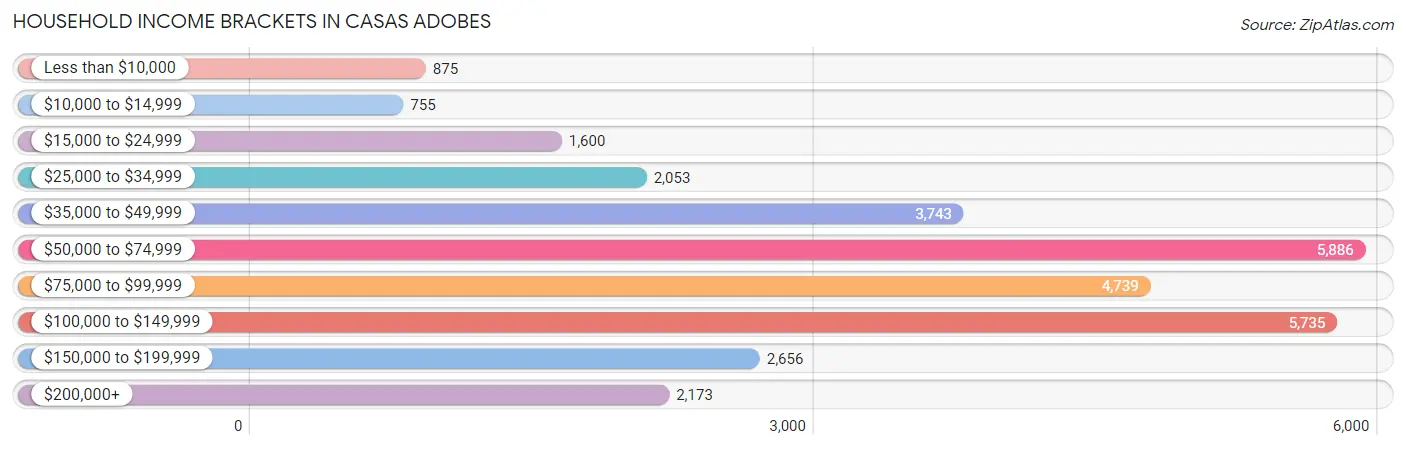
| Income Bracket | # Households | % Households |
| Less than $10,000 | 875 | 2.9% |
| $10,000 to $14,999 | 755 | 2.5% |
| $15,000 to $24,999 | 1,600 | 5.3% |
| $25,000 to $34,999 | 2,053 | 6.8% |
| $35,000 to $49,999 | 3,743 | 12.4% |
| $50,000 to $74,999 | 5,886 | 19.5% |
| $75,000 to $99,999 | 4,739 | 15.7% |
| $100,000 to $149,999 | 5,735 | 19.0% |
| $150,000 to $199,999 | 2,656 | 8.8% |
| $200,000+ | 2,173 | 7.2% |
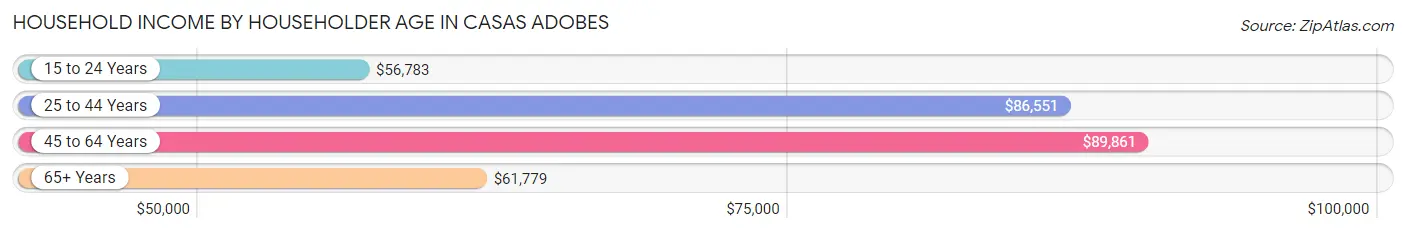
Household Income by Householder Age in Casas Adobes
The median household income in Casas Adobes is $75,997, with the highest median household income of $89,861 found in the 45 to 64 years age bracket for the primary householder. A total of 9,953 households (33.0%) fall into this category. Meanwhile, the 15 to 24 years age bracket for the primary householder has the lowest median household income of $56,783, with 1,931 households (6.4%) in this group.
| Income Bracket | # Households | Median Income |
| 15 to 24 Years | 1,931 (6.4%) | $56,783 |
| 25 to 44 Years | 8,616 (28.5%) | $86,551 |
| 45 to 64 Years | 9,953 (33.0%) | $89,861 |
| 65+ Years | 9,686 (32.1%) | $61,779 |
| Total | 30,186 (100.0%) | $75,997 |
Poverty in Casas Adobes
Income Below Poverty by Sex and Age in Casas Adobes
With 6.5% poverty level for males and 7.4% for females among the residents of Casas Adobes, under 5 year old males and 6 to 11 year old females are the most vulnerable to poverty, with 196 males (12.9%) and 180 females (12.1%) in their respective age groups living below the poverty level.
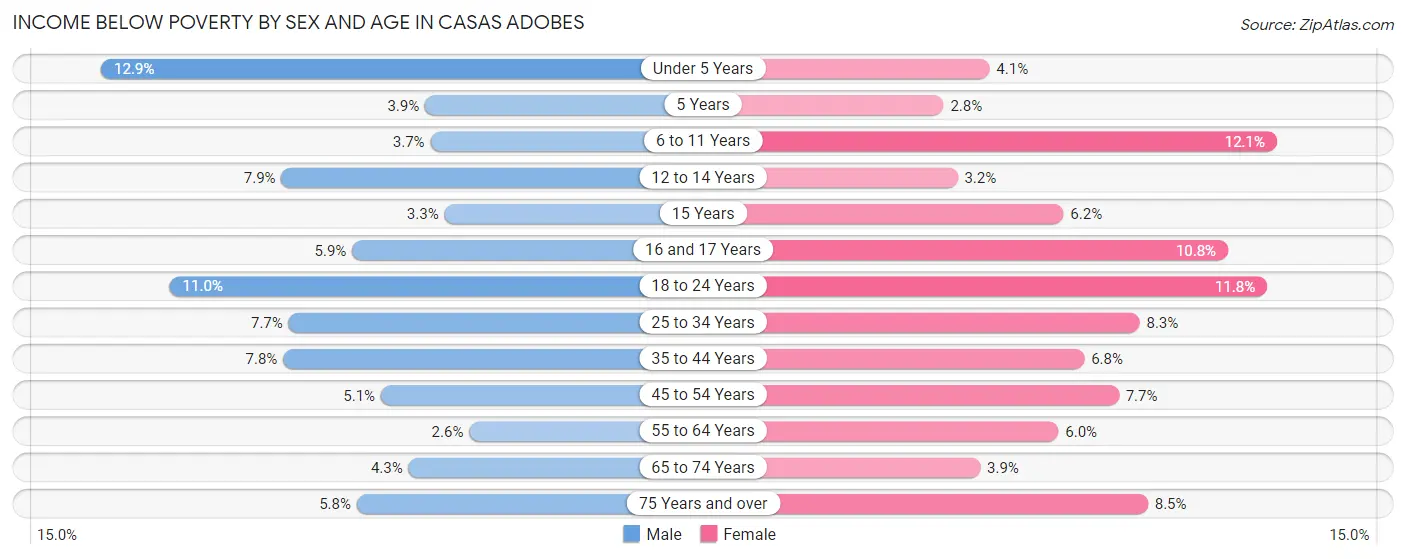
| Age Bracket | Male | Female |
| Under 5 Years | 196 (12.9%) | 67 (4.1%) |
| 5 Years | 10 (3.8%) | 6 (2.8%) |
| 6 to 11 Years | 74 (3.7%) | 180 (12.1%) |
| 12 to 14 Years | 99 (7.9%) | 28 (3.2%) |
| 15 Years | 11 (3.3%) | 29 (6.2%) |
| 16 and 17 Years | 48 (5.9%) | 73 (10.7%) |
| 18 to 24 Years | 465 (11.0%) | 396 (11.8%) |
| 25 to 34 Years | 367 (7.6%) | 403 (8.3%) |
| 35 to 44 Years | 278 (7.8%) | 272 (6.8%) |
| 45 to 54 Years | 183 (5.1%) | 304 (7.7%) |
| 55 to 64 Years | 115 (2.6%) | 298 (6.0%) |
| 65 to 74 Years | 153 (4.3%) | 174 (3.8%) |
| 75 Years and over | 164 (5.8%) | 383 (8.5%) |
| Total | 2,163 (6.5%) | 2,613 (7.4%) |
Income Above Poverty by Sex and Age in Casas Adobes
According to the poverty statistics in Casas Adobes, males aged 55 to 64 years and females aged 5 years are the age groups that are most secure financially, with 97.4% of males and 97.2% of females in these age groups living above the poverty line.
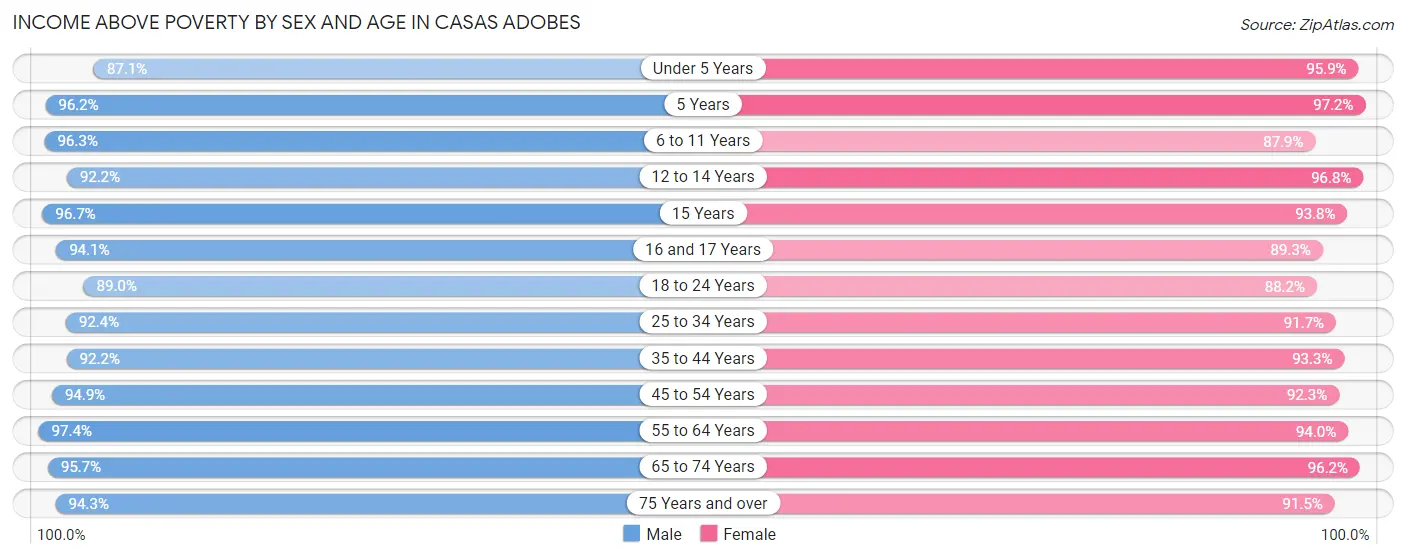
| Age Bracket | Male | Female |
| Under 5 Years | 1,327 (87.1%) | 1,565 (95.9%) |
| 5 Years | 250 (96.2%) | 206 (97.2%) |
| 6 to 11 Years | 1,924 (96.3%) | 1,306 (87.9%) |
| 12 to 14 Years | 1,162 (92.1%) | 841 (96.8%) |
| 15 Years | 321 (96.7%) | 441 (93.8%) |
| 16 and 17 Years | 769 (94.1%) | 606 (89.2%) |
| 18 to 24 Years | 3,779 (89.0%) | 2,950 (88.2%) |
| 25 to 34 Years | 4,433 (92.3%) | 4,456 (91.7%) |
| 35 to 44 Years | 3,288 (92.2%) | 3,758 (93.2%) |
| 45 to 54 Years | 3,418 (94.9%) | 3,639 (92.3%) |
| 55 to 64 Years | 4,266 (97.4%) | 4,645 (94.0%) |
| 65 to 74 Years | 3,393 (95.7%) | 4,345 (96.2%) |
| 75 Years and over | 2,688 (94.3%) | 4,113 (91.5%) |
| Total | 31,018 (93.5%) | 32,871 (92.6%) |
Income Below Poverty Among Married-Couple Families in Casas Adobes
The poverty statistics for married-couple families in Casas Adobes show that 2.3% or 303 of the total 13,434 families live below the poverty line. Families with 5 or more children have the highest poverty rate of 11.1%, comprising of 9 families. On the other hand, families with no children have the lowest poverty rate of 1.5%, which includes 133 families.
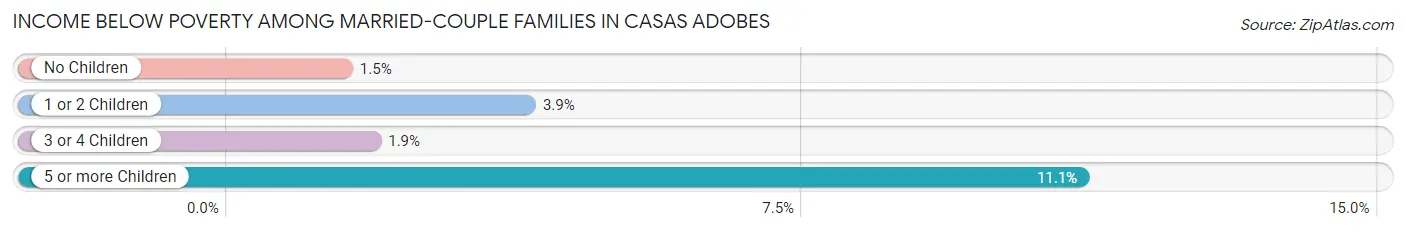
| Children | Above Poverty | Below Poverty |
| No Children | 8,722 (98.5%) | 133 (1.5%) |
| 1 or 2 Children | 3,655 (96.1%) | 148 (3.9%) |
| 3 or 4 Children | 682 (98.1%) | 13 (1.9%) |
| 5 or more Children | 72 (88.9%) | 9 (11.1%) |
| Total | 13,131 (97.7%) | 303 (2.3%) |
Income Below Poverty Among Single-Parent Households in Casas Adobes
According to the poverty data in Casas Adobes, 13.2% or 192 single-father households and 8.6% or 285 single-mother households are living below the poverty line. Among single-father households, those with 1 or 2 children have the highest poverty rate, with 103 households (14.0%) experiencing poverty. Likewise, among single-mother households, those with 5 or more children have the highest poverty rate, with 26 households (78.8%) falling below the poverty line.
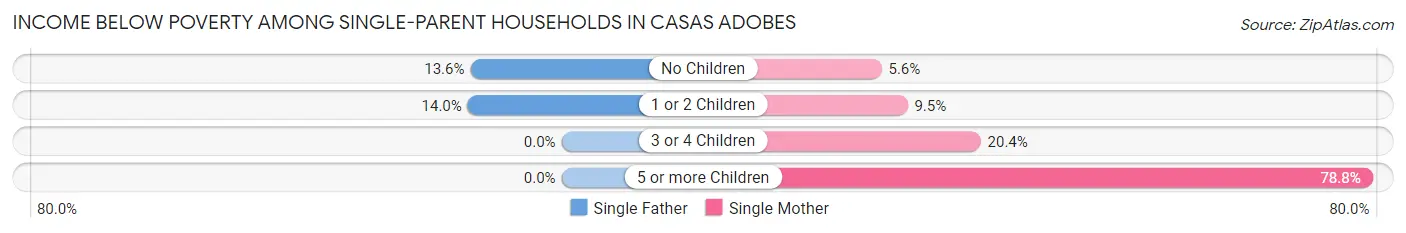
| Children | Single Father | Single Mother |
| No Children | 89 (13.6%) | 94 (5.6%) |
| 1 or 2 Children | 103 (14.0%) | 145 (9.5%) |
| 3 or 4 Children | 0 (0.0%) | 20 (20.4%) |
| 5 or more Children | 0 (0.0%) | 26 (78.8%) |
| Total | 192 (13.2%) | 285 (8.6%) |
Income Below Poverty Among Married-Couple vs Single-Parent Households in Casas Adobes
The poverty data for Casas Adobes shows that 303 of the married-couple family households (2.3%) and 477 of the single-parent households (10.0%) are living below the poverty level. Within the married-couple family households, those with 5 or more children have the highest poverty rate, with 9 households (11.1%) falling below the poverty line. Among the single-parent households, those with 5 or more children have the highest poverty rate, with 26 household (78.8%) living below poverty.
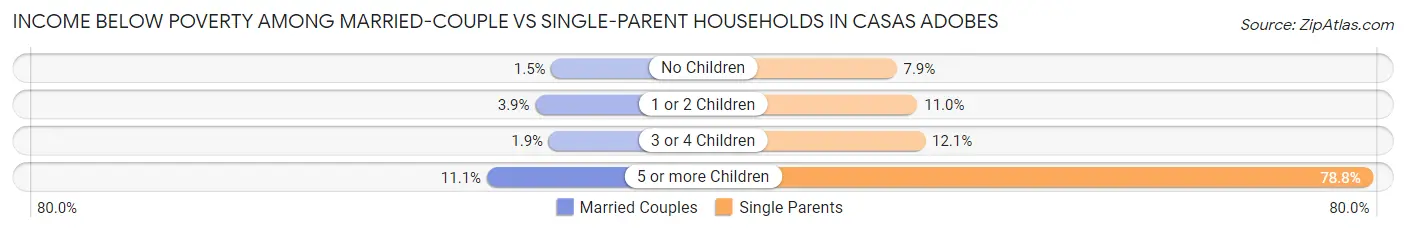
| Children | Married-Couple Families | Single-Parent Households |
| No Children | 133 (1.5%) | 183 (7.9%) |
| 1 or 2 Children | 148 (3.9%) | 248 (11.0%) |
| 3 or 4 Children | 13 (1.9%) | 20 (12.1%) |
| 5 or more Children | 9 (11.1%) | 26 (78.8%) |
| Total | 303 (2.3%) | 477 (10.0%) |
Race in Casas Adobes
The most populous races in Casas Adobes are White / Caucasian (51,990 | 74.4%), Hispanic or Latino (17,689 | 25.3%), and Two or more Races (9,269 | 13.3%).
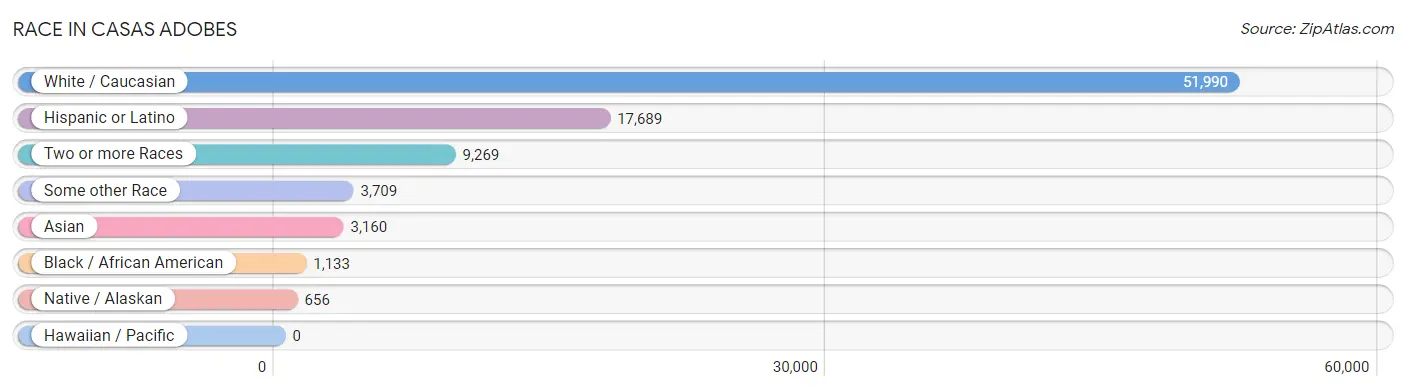
| Race | # Population | % Population |
| Asian | 3,160 | 4.5% |
| Black / African American | 1,133 | 1.6% |
| Hawaiian / Pacific | 0 | 0.0% |
| Hispanic or Latino | 17,689 | 25.3% |
| Native / Alaskan | 656 | 0.9% |
| White / Caucasian | 51,990 | 74.4% |
| Two or more Races | 9,269 | 13.3% |
| Some other Race | 3,709 | 5.3% |
| Total | 69,917 | 100.0% |
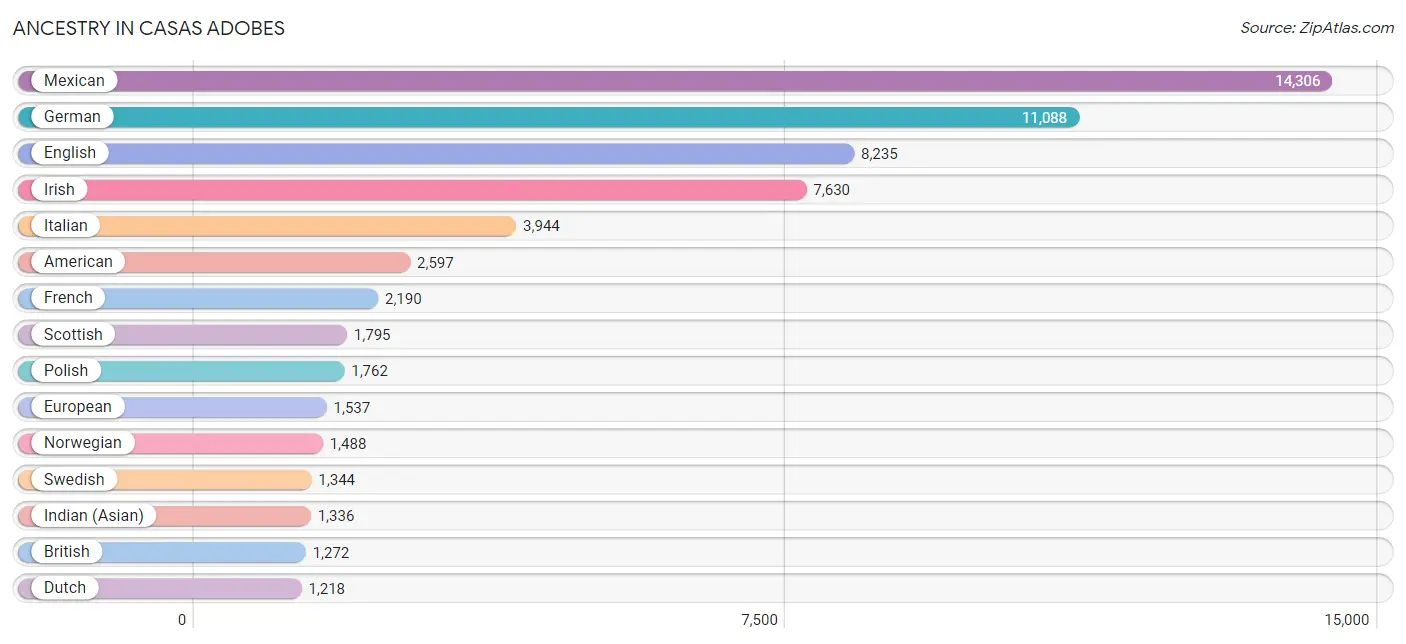
Ancestry in Casas Adobes
The most populous ancestries reported in Casas Adobes are Mexican (14,306 | 20.5%), German (11,088 | 15.9%), English (8,235 | 11.8%), Irish (7,630 | 10.9%), and Italian (3,944 | 5.6%), together accounting for 64.6% of all Casas Adobes residents.
| Ancestry | # Population | % Population |
| African | 52 | 0.1% |
| Albanian | 10 | 0.0% |
| Aleut | 28 | 0.0% |
| American | 2,597 | 3.7% |
| Apache | 106 | 0.2% |
| Arab | 569 | 0.8% |
| Argentinean | 8 | 0.0% |
| Armenian | 40 | 0.1% |
| Assyrian / Chaldean / Syriac | 24 | 0.0% |
| Australian | 20 | 0.0% |
| Austrian | 258 | 0.4% |
| Basque | 233 | 0.3% |
| Belgian | 99 | 0.1% |
| Bhutanese | 380 | 0.5% |
| Blackfeet | 18 | 0.0% |
| Brazilian | 30 | 0.0% |
| British | 1,272 | 1.8% |
| Bulgarian | 23 | 0.0% |
| Burmese | 487 | 0.7% |
| Canadian | 248 | 0.4% |
| Celtic | 6 | 0.0% |
| Central American | 287 | 0.4% |
| Central American Indian | 350 | 0.5% |
| Cherokee | 562 | 0.8% |
| Cheyenne | 5 | 0.0% |
| Chilean | 128 | 0.2% |
| Chippewa | 79 | 0.1% |
| Choctaw | 52 | 0.1% |
| Colombian | 337 | 0.5% |
| Comanche | 7 | 0.0% |
| Croatian | 31 | 0.0% |
| Cuban | 173 | 0.3% |
| Czech | 616 | 0.9% |
| Czechoslovakian | 104 | 0.2% |
| Danish | 272 | 0.4% |
| Dominican | 17 | 0.0% |
| Dutch | 1,218 | 1.7% |
| Eastern European | 349 | 0.5% |
| Ecuadorian | 115 | 0.2% |
| Egyptian | 6 | 0.0% |
| English | 8,235 | 11.8% |
| Estonian | 6 | 0.0% |
| European | 1,537 | 2.2% |
| Finnish | 267 | 0.4% |
| French | 2,190 | 3.1% |
| French Canadian | 487 | 0.7% |
| German | 11,088 | 15.9% |
| Greek | 982 | 1.4% |
| Guatemalan | 88 | 0.1% |
| Guyanese | 5 | 0.0% |
| Haitian | 9 | 0.0% |
| Hungarian | 210 | 0.3% |
| Icelander | 8 | 0.0% |
| Indian (Asian) | 1,336 | 1.9% |
| Iranian | 32 | 0.1% |
| Irish | 7,630 | 10.9% |
| Iroquois | 2 | 0.0% |
| Italian | 3,944 | 5.6% |
| Jamaican | 7 | 0.0% |
| Japanese | 15 | 0.0% |
| Kenyan | 36 | 0.1% |
| Kiowa | 13 | 0.0% |
| Korean | 694 | 1.0% |
| Laotian | 31 | 0.0% |
| Latvian | 4 | 0.0% |
| Lebanese | 110 | 0.2% |
| Lithuanian | 125 | 0.2% |
| Luxembourger | 15 | 0.0% |
| Macedonian | 127 | 0.2% |
| Maltese | 8 | 0.0% |
| Mexican | 14,306 | 20.5% |
| Mexican American Indian | 108 | 0.2% |
| Native Hawaiian | 53 | 0.1% |
| Navajo | 176 | 0.3% |
| Nicaraguan | 52 | 0.1% |
| Northern European | 332 | 0.5% |
| Norwegian | 1,488 | 2.1% |
| Okinawan | 14 | 0.0% |
| Ottawa | 29 | 0.0% |
| Pakistani | 152 | 0.2% |
| Palestinian | 36 | 0.1% |
| Panamanian | 52 | 0.1% |
| Pennsylvania German | 46 | 0.1% |
| Peruvian | 83 | 0.1% |
| Polish | 1,762 | 2.5% |
| Portuguese | 122 | 0.2% |
| Pueblo | 27 | 0.0% |
| Puerto Rican | 1,113 | 1.6% |
| Romanian | 52 | 0.1% |
| Russian | 522 | 0.7% |
| Salvadoran | 72 | 0.1% |
| Samoan | 62 | 0.1% |
| Scandinavian | 385 | 0.5% |
| Scotch-Irish | 851 | 1.2% |
| Scottish | 1,795 | 2.6% |
| Serbian | 31 | 0.0% |
| Sioux | 117 | 0.2% |
| Slavic | 28 | 0.0% |
| Slovak | 65 | 0.1% |
| Slovene | 27 | 0.0% |
| South African | 8 | 0.0% |
| South American | 671 | 1.0% |
| Soviet Union | 13 | 0.0% |
| Spaniard | 403 | 0.6% |
| Spanish | 305 | 0.4% |
| Sri Lankan | 422 | 0.6% |
| Subsaharan African | 114 | 0.2% |
| Swedish | 1,344 | 1.9% |
| Swiss | 309 | 0.4% |
| Syrian | 151 | 0.2% |
| Thai | 882 | 1.3% |
| Tohono O'Odham | 11 | 0.0% |
| Trinidadian and Tobagonian | 14 | 0.0% |
| Turkish | 18 | 0.0% |
| Ukrainian | 107 | 0.2% |
| Ute | 7 | 0.0% |
| Welsh | 690 | 1.0% |
| Yaqui | 485 | 0.7% |
| Yugoslavian | 82 | 0.1% | View All 119 Rows |
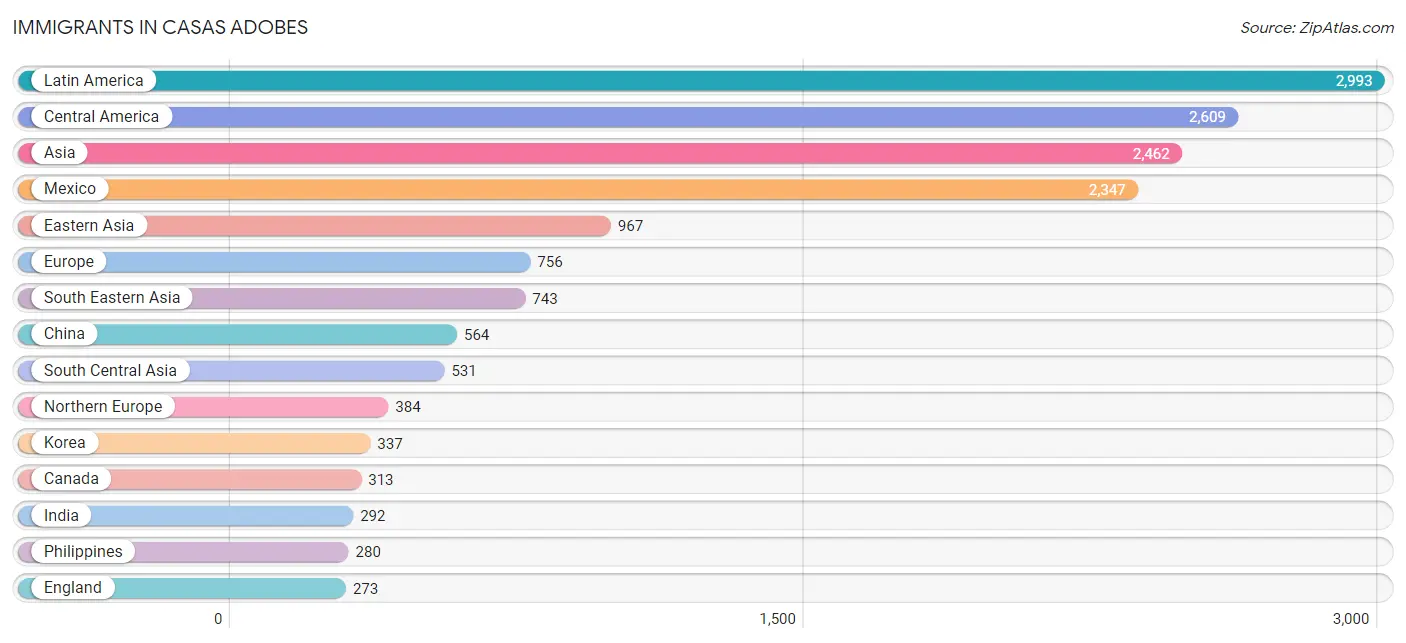
Immigrants in Casas Adobes
The most numerous immigrant groups reported in Casas Adobes came from Latin America (2,993 | 4.3%), Central America (2,609 | 3.7%), Asia (2,462 | 3.5%), Mexico (2,347 | 3.4%), and Eastern Asia (967 | 1.4%), together accounting for 16.3% of all Casas Adobes residents.
| Immigration Origin | # Population | % Population |
| Africa | 94 | 0.1% |
| Albania | 10 | 0.0% |
| Asia | 2,462 | 3.5% |
| Australia | 9 | 0.0% |
| Bahamas | 20 | 0.0% |
| Brazil | 14 | 0.0% |
| Bulgaria | 23 | 0.0% |
| Cambodia | 40 | 0.1% |
| Canada | 313 | 0.4% |
| Caribbean | 122 | 0.2% |
| Central America | 2,609 | 3.7% |
| Chile | 46 | 0.1% |
| China | 564 | 0.8% |
| Colombia | 178 | 0.3% |
| Congo | 3 | 0.0% |
| Cuba | 71 | 0.1% |
| Eastern Africa | 27 | 0.0% |
| Eastern Asia | 967 | 1.4% |
| Eastern Europe | 147 | 0.2% |
| Ecuador | 13 | 0.0% |
| Egypt | 15 | 0.0% |
| El Salvador | 160 | 0.2% |
| England | 273 | 0.4% |
| Europe | 756 | 1.1% |
| France | 9 | 0.0% |
| Germany | 123 | 0.2% |
| Greece | 13 | 0.0% |
| Guyana | 7 | 0.0% |
| Honduras | 57 | 0.1% |
| Hong Kong | 56 | 0.1% |
| India | 292 | 0.4% |
| Indonesia | 11 | 0.0% |
| Iran | 42 | 0.1% |
| Iraq | 8 | 0.0% |
| Ireland | 24 | 0.0% |
| Jamaica | 16 | 0.0% |
| Japan | 66 | 0.1% |
| Kenya | 27 | 0.0% |
| Korea | 337 | 0.5% |
| Laos | 83 | 0.1% |
| Latin America | 2,993 | 4.3% |
| Lebanon | 48 | 0.1% |
| Liberia | 13 | 0.0% |
| Malaysia | 6 | 0.0% |
| Mexico | 2,347 | 3.4% |
| Middle Africa | 3 | 0.0% |
| Moldova | 12 | 0.0% |
| Nepal | 30 | 0.0% |
| Netherlands | 11 | 0.0% |
| North Macedonia | 64 | 0.1% |
| Northern Africa | 15 | 0.0% |
| Northern Europe | 384 | 0.5% |
| Oceania | 9 | 0.0% |
| Pakistan | 97 | 0.1% |
| Panama | 45 | 0.1% |
| Peru | 4 | 0.0% |
| Philippines | 280 | 0.4% |
| Poland | 8 | 0.0% |
| Romania | 6 | 0.0% |
| Russia | 11 | 0.0% |
| Scotland | 10 | 0.0% |
| Serbia | 7 | 0.0% |
| Singapore | 12 | 0.0% |
| South Africa | 26 | 0.0% |
| South America | 262 | 0.4% |
| South Central Asia | 531 | 0.8% |
| South Eastern Asia | 743 | 1.1% |
| Southern Europe | 48 | 0.1% |
| Spain | 35 | 0.1% |
| Sri Lanka | 17 | 0.0% |
| Sweden | 11 | 0.0% |
| Switzerland | 34 | 0.1% |
| Syria | 76 | 0.1% |
| Thailand | 120 | 0.2% |
| Trinidad and Tobago | 6 | 0.0% |
| Turkey | 39 | 0.1% |
| Uzbekistan | 33 | 0.1% |
| Vietnam | 191 | 0.3% |
| Western Africa | 13 | 0.0% |
| Western Asia | 185 | 0.3% |
| Western Europe | 177 | 0.3% | View All 81 Rows |
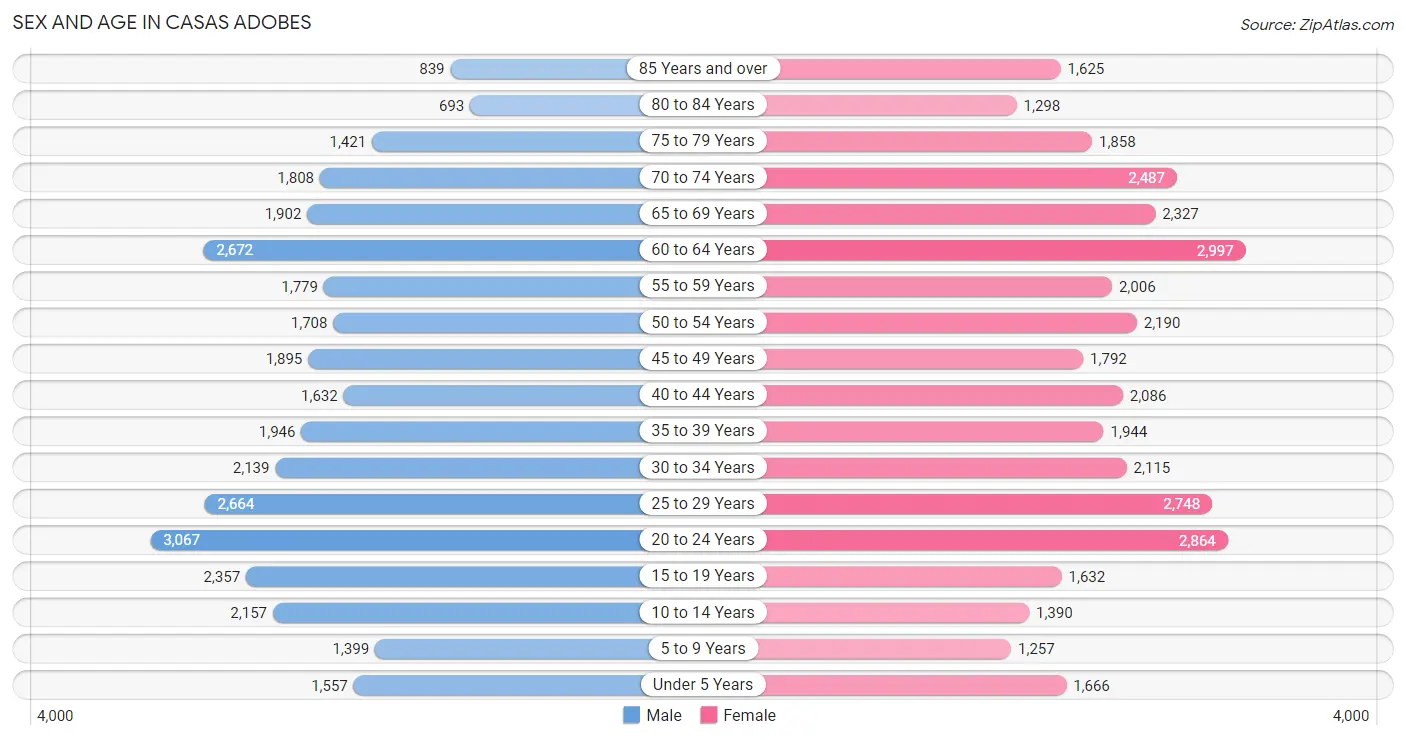
Sex and Age in Casas Adobes
Sex and Age in Casas Adobes
The most populous age groups in Casas Adobes are 20 to 24 Years (3,067 | 9.1%) for men and 60 to 64 Years (2,997 | 8.3%) for women.
| Age Bracket | Male | Female |
| Under 5 Years | 1,557 (4.6%) | 1,666 (4.6%) |
| 5 to 9 Years | 1,399 (4.2%) | 1,257 (3.5%) |
| 10 to 14 Years | 2,157 (6.4%) | 1,390 (3.8%) |
| 15 to 19 Years | 2,357 (7.0%) | 1,632 (4.5%) |
| 20 to 24 Years | 3,067 (9.1%) | 2,864 (7.9%) |
| 25 to 29 Years | 2,664 (7.9%) | 2,748 (7.6%) |
| 30 to 34 Years | 2,139 (6.4%) | 2,115 (5.8%) |
| 35 to 39 Years | 1,946 (5.8%) | 1,944 (5.4%) |
| 40 to 44 Years | 1,632 (4.9%) | 2,086 (5.8%) |
| 45 to 49 Years | 1,895 (5.6%) | 1,792 (4.9%) |
| 50 to 54 Years | 1,708 (5.1%) | 2,190 (6.0%) |
| 55 to 59 Years | 1,779 (5.3%) | 2,006 (5.5%) |
| 60 to 64 Years | 2,672 (7.9%) | 2,997 (8.3%) |
| 65 to 69 Years | 1,902 (5.7%) | 2,327 (6.4%) |
| 70 to 74 Years | 1,808 (5.4%) | 2,487 (6.9%) |
| 75 to 79 Years | 1,421 (4.2%) | 1,858 (5.1%) |
| 80 to 84 Years | 693 (2.1%) | 1,298 (3.6%) |
| 85 Years and over | 839 (2.5%) | 1,625 (4.5%) |
| Total | 33,635 (100.0%) | 36,282 (100.0%) |
Families and Households in Casas Adobes
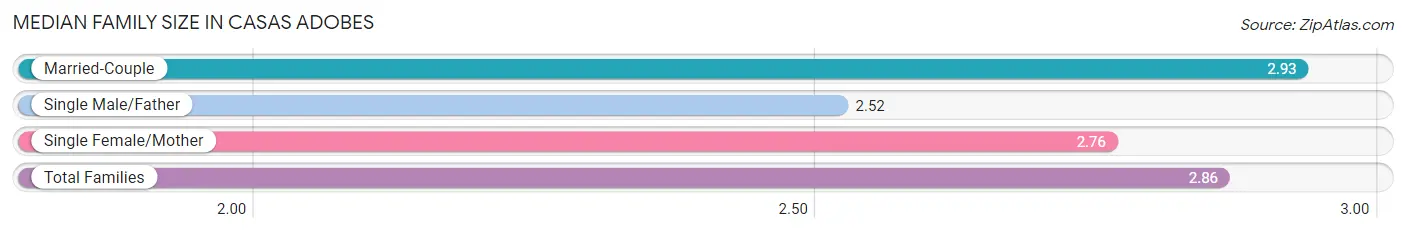
Median Family Size in Casas Adobes
The median family size in Casas Adobes is 2.86 persons per family, with married-couple families (13,434 | 73.8%) accounting for the largest median family size of 2.93 persons per family. On the other hand, single male/father families (1,458 | 8.0%) represent the smallest median family size with 2.52 persons per family.
| Family Type | # Families | Family Size |
| Married-Couple | 13,434 (73.8%) | 2.93 |
| Single Male/Father | 1,458 (8.0%) | 2.52 |
| Single Female/Mother | 3,321 (18.2%) | 2.76 |
| Total Families | 18,213 (100.0%) | 2.86 |
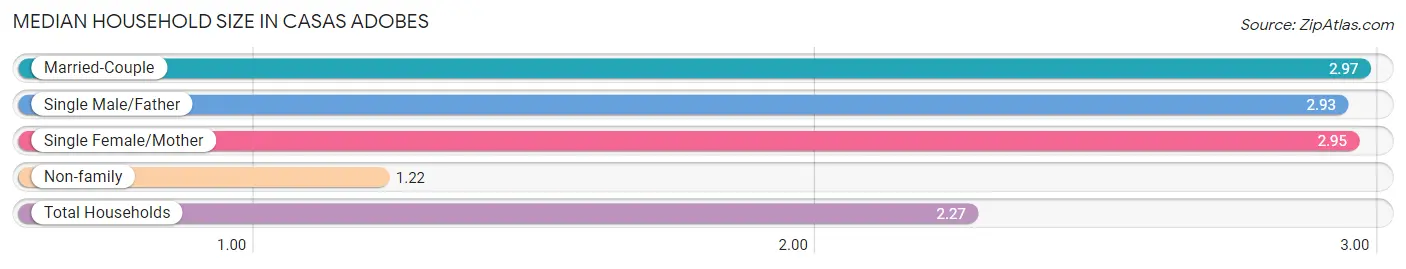
Median Household Size in Casas Adobes
The median household size in Casas Adobes is 2.27 persons per household, with married-couple households (13,434 | 44.5%) accounting for the largest median household size of 2.97 persons per household. non-family households (11,973 | 39.7%) represent the smallest median household size with 1.22 persons per household.
| Household Type | # Households | Household Size |
| Married-Couple | 13,434 (44.5%) | 2.97 |
| Single Male/Father | 1,458 (4.8%) | 2.93 |
| Single Female/Mother | 3,321 (11.0%) | 2.95 |
| Non-family | 11,973 (39.7%) | 1.22 |
| Total Households | 30,186 (100.0%) | 2.27 |
Household Size by Marriage Status in Casas Adobes
Out of a total of 30,186 households in Casas Adobes, 18,213 (60.3%) are family households, while 11,973 (39.7%) are nonfamily households. The most numerous type of family households are 2-person households, comprising 9,311, and the most common type of nonfamily households are 1-person households, comprising 9,694.
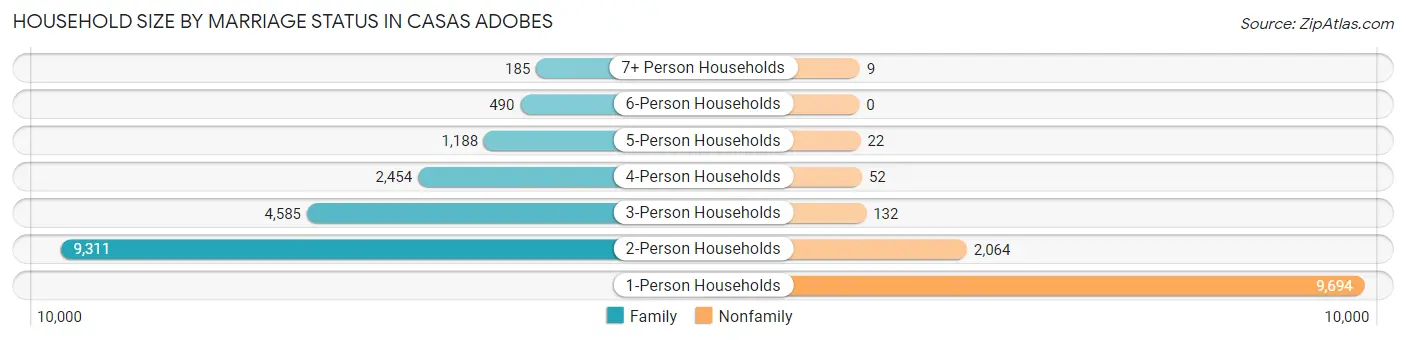
| Household Size | Family Households | Nonfamily Households |
| 1-Person Households | - | 9,694 (32.1%) |
| 2-Person Households | 9,311 (30.8%) | 2,064 (6.8%) |
| 3-Person Households | 4,585 (15.2%) | 132 (0.4%) |
| 4-Person Households | 2,454 (8.1%) | 52 (0.2%) |
| 5-Person Households | 1,188 (3.9%) | 22 (0.1%) |
| 6-Person Households | 490 (1.6%) | 0 (0.0%) |
| 7+ Person Households | 185 (0.6%) | 9 (0.0%) |
| Total | 18,213 (60.3%) | 11,973 (39.7%) |
Female Fertility in Casas Adobes
Fertility by Age in Casas Adobes
Average fertility rate in Casas Adobes is 50.0 births per 1,000 women. Women in the age bracket of 20 to 34 years have the highest fertility rate with 92.0 births per 1,000 women. Women in the age bracket of 20 to 34 years acount for 89.6% of all women with births.
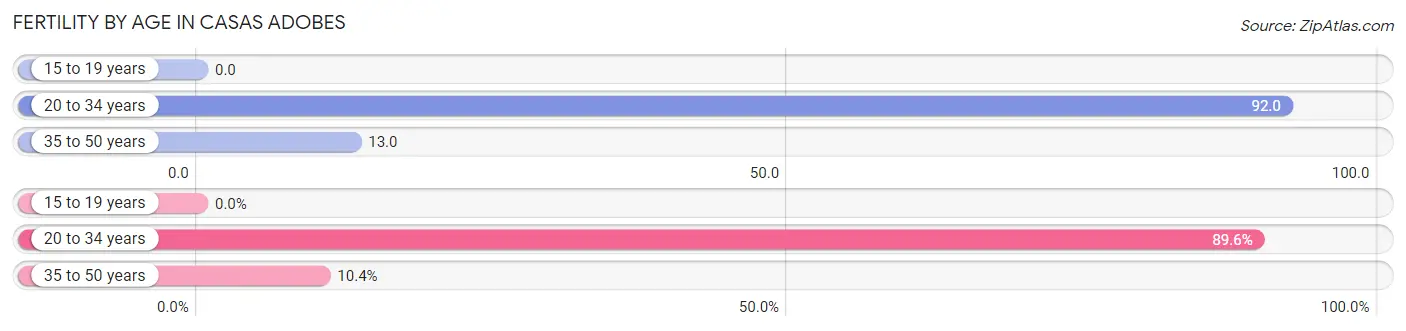
| Age Bracket | Women with Births | Births / 1,000 Women |
| 15 to 19 years | 0 (0.0%) | 0.0 |
| 20 to 34 years | 708 (89.6%) | 92.0 |
| 35 to 50 years | 82 (10.4%) | 13.0 |
| Total | 790 (100.0%) | 50.0 |
Fertility by Age by Marriage Status in Casas Adobes
68.9% of women with births (790) in Casas Adobes are married. The highest percentage of unmarried women with births falls into 20 to 34 years age bracket with 32.1% of them unmarried at the time of birth, while the lowest percentage of unmarried women with births belong to 35 to 50 years age bracket with 23.2% of them unmarried.
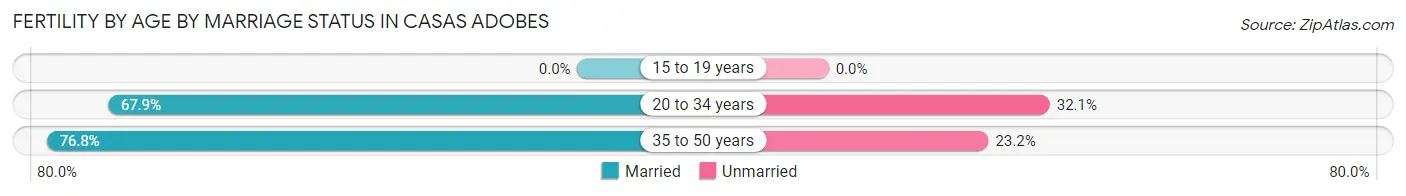
| Age Bracket | Married | Unmarried |
| 15 to 19 years | 0 (0.0%) | 0 (0.0%) |
| 20 to 34 years | 481 (67.9%) | 227 (32.1%) |
| 35 to 50 years | 63 (76.8%) | 19 (23.2%) |
| Total | 544 (68.9%) | 246 (31.1%) |
Fertility by Education in Casas Adobes
Average fertility rate in Casas Adobes is 50.0 births per 1,000 women. Women with the education attainment of high school diploma have the highest fertility rate of 78.0 births per 1,000 women, while women with the education attainment of graduate degree have the lowest fertility at 23.0 births per 1,000 women. Women with the education attainment of bachelor's degree represent 35.6% of all women with births.
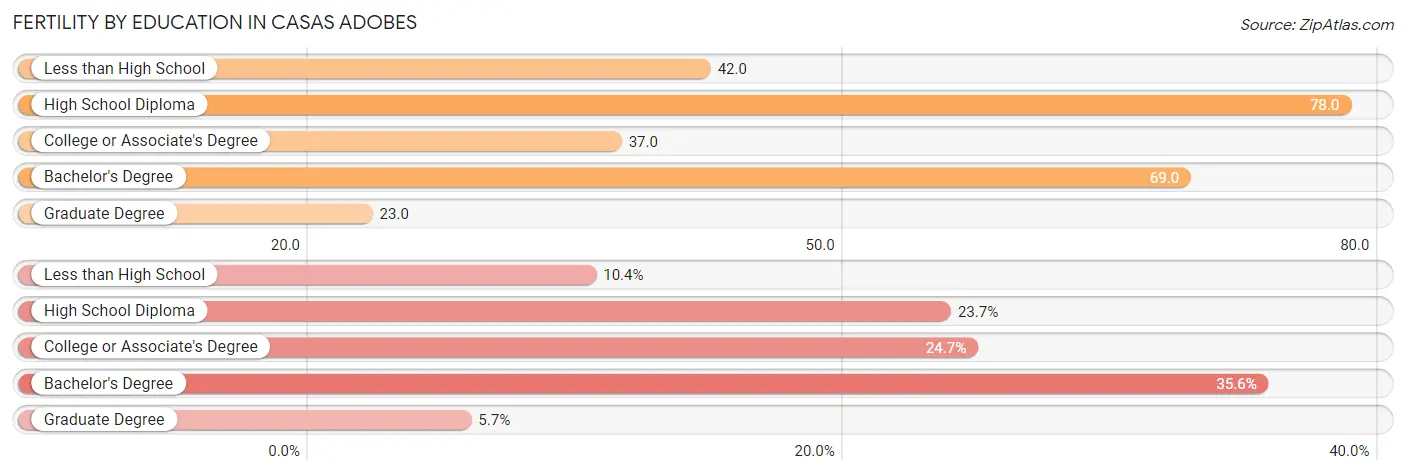
| Educational Attainment | Women with Births | Births / 1,000 Women |
| Less than High School | 82 (10.4%) | 42.0 |
| High School Diploma | 187 (23.7%) | 78.0 |
| College or Associate's Degree | 195 (24.7%) | 37.0 |
| Bachelor's Degree | 281 (35.6%) | 69.0 |
| Graduate Degree | 45 (5.7%) | 23.0 |
| Total | 790 (100.0%) | 50.0 |
Fertility by Education by Marriage Status in Casas Adobes
31.1% of women with births in Casas Adobes are unmarried. Women with the educational attainment of graduate degree are most likely to be married with 100.0% of them married at childbirth, while women with the educational attainment of less than high school are least likely to be married with 100.0% of them unmarried at childbirth.
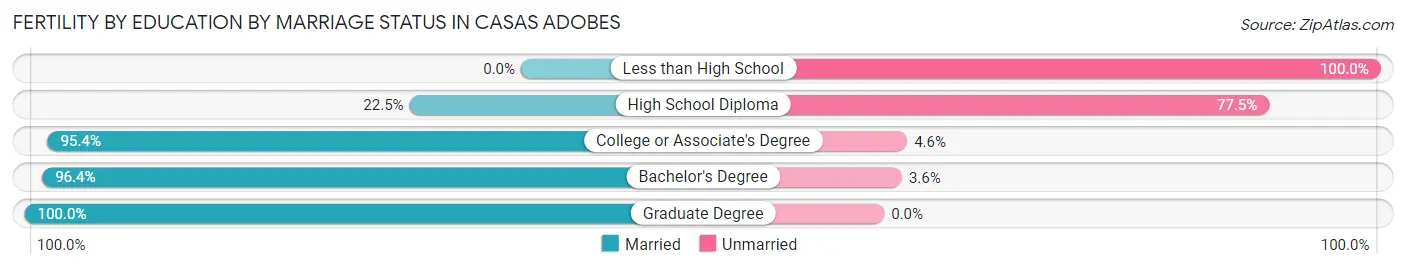
| Educational Attainment | Married | Unmarried |
| Less than High School | 0 (0.0%) | 82 (100.0%) |
| High School Diploma | 42 (22.5%) | 145 (77.5%) |
| College or Associate's Degree | 186 (95.4%) | 9 (4.6%) |
| Bachelor's Degree | 271 (96.4%) | 10 (3.6%) |
| Graduate Degree | 45 (100.0%) | 0 (0.0%) |
| Total | 544 (68.9%) | 246 (31.1%) |
Employment Characteristics in Casas Adobes
Employment by Class of Employer in Casas Adobes
Among the 33,968 employed individuals in Casas Adobes, private company employees (22,830 | 67.2%), not-for-profit organizations (2,585 | 7.6%), and local government employees (2,341 | 6.9%) make up the most common classes of employment.
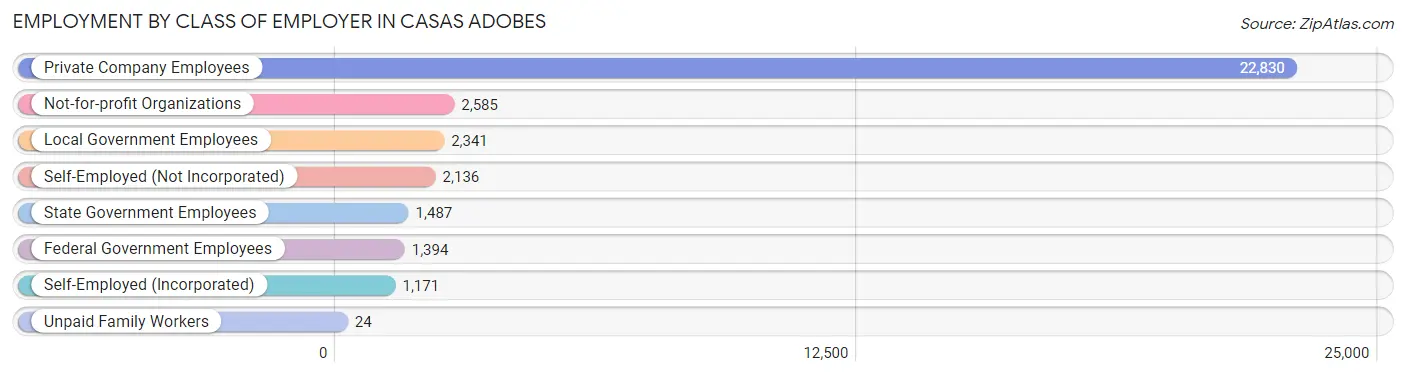
| Employer Class | # Employees | % Employees |
| Private Company Employees | 22,830 | 67.2% |
| Self-Employed (Incorporated) | 1,171 | 3.5% |
| Self-Employed (Not Incorporated) | 2,136 | 6.3% |
| Not-for-profit Organizations | 2,585 | 7.6% |
| Local Government Employees | 2,341 | 6.9% |
| State Government Employees | 1,487 | 4.4% |
| Federal Government Employees | 1,394 | 4.1% |
| Unpaid Family Workers | 24 | 0.1% |
| Total | 33,968 | 100.0% |
Employment Status by Age in Casas Adobes
According to the labor force statistics for Casas Adobes, out of the total population over 16 years of age (59,680), 61.0% or 36,405 individuals are in the labor force, with 4.9% or 1,784 of them unemployed. The age group with the highest labor force participation rate is 20 to 24 years, with 89.3% or 5,296 individuals in the labor force. Within the labor force, the 16 to 19 years age range has the highest percentage of unemployed individuals, with 13.6% or 199 of them being unemployed.
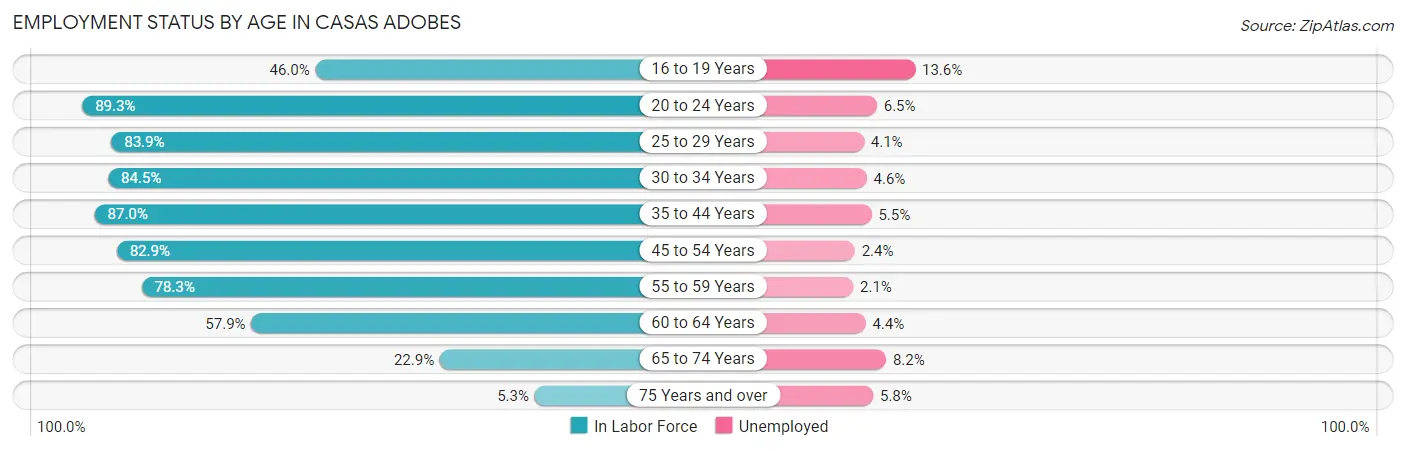
| Age Bracket | In Labor Force | Unemployed |
| 16 to 19 Years | 1,462 (46.0%) | 199 (13.6%) |
| 20 to 24 Years | 5,296 (89.3%) | 344 (6.5%) |
| 25 to 29 Years | 4,541 (83.9%) | 186 (4.1%) |
| 30 to 34 Years | 3,595 (84.5%) | 165 (4.6%) |
| 35 to 44 Years | 6,619 (87.0%) | 364 (5.5%) |
| 45 to 54 Years | 6,288 (82.9%) | 151 (2.4%) |
| 55 to 59 Years | 2,964 (78.3%) | 62 (2.1%) |
| 60 to 64 Years | 3,282 (57.9%) | 144 (4.4%) |
| 65 to 74 Years | 1,952 (22.9%) | 160 (8.2%) |
| 75 Years and over | 410 (5.3%) | 24 (5.8%) |
| Total | 36,405 (61.0%) | 1,784 (4.9%) |
Employment Status by Educational Attainment in Casas Adobes
According to labor force statistics for Casas Adobes, 79.5% of individuals (27,279) out of the total population between 25 and 64 years of age (34,313) are in the labor force, with 4.0% or 1,091 of them being unemployed. The group with the highest labor force participation rate are those with the educational attainment of bachelor's degree or higher, with 84.5% or 11,438 individuals in the labor force. Within the labor force, individuals with high school diploma education have the highest percentage of unemployment, with 7.6% or 367 of them being unemployed.
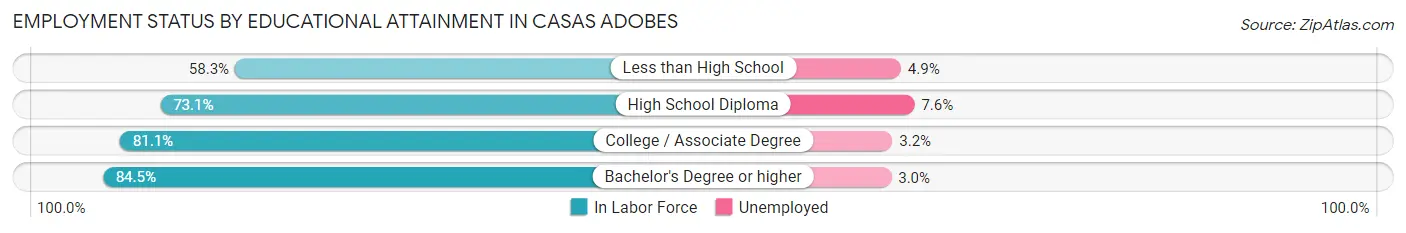
| Educational Attainment | In Labor Force | Unemployed |
| Less than High School | 1,193 (58.3%) | 100 (4.9%) |
| High School Diploma | 4,823 (73.1%) | 501 (7.6%) |
| College / Associate Degree | 9,840 (81.1%) | 388 (3.2%) |
| Bachelor's Degree or higher | 11,438 (84.5%) | 406 (3.0%) |
| Total | 27,279 (79.5%) | 1,373 (4.0%) |
Employment Occupations by Sex in Casas Adobes
Management, Business, Science and Arts Occupations
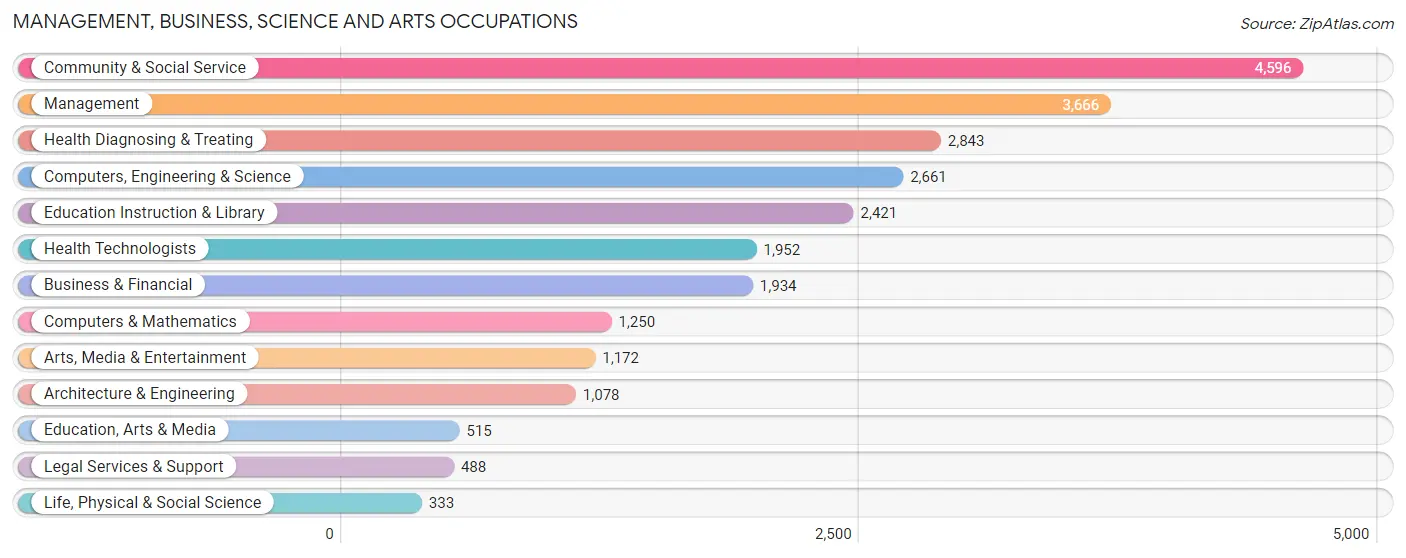
The most common Management, Business, Science and Arts occupations in Casas Adobes are Community & Social Service (4,596 | 13.4%), Management (3,666 | 10.7%), Health Diagnosing & Treating (2,843 | 8.3%), Computers, Engineering & Science (2,661 | 7.8%), and Education Instruction & Library (2,421 | 7.1%).
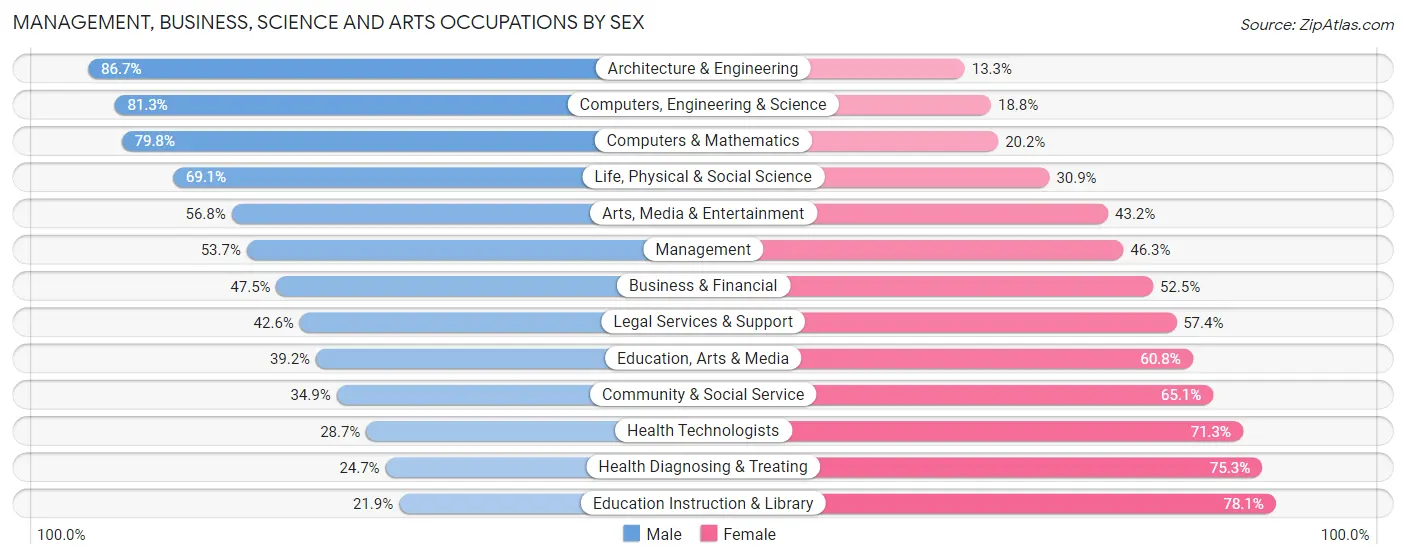
Management, Business, Science and Arts Occupations by Sex
Within the Management, Business, Science and Arts occupations in Casas Adobes, the most male-oriented occupations are Architecture & Engineering (86.7%), Computers, Engineering & Science (81.2%), and Computers & Mathematics (79.8%), while the most female-oriented occupations are Education Instruction & Library (78.1%), Health Diagnosing & Treating (75.3%), and Health Technologists (71.3%).
| Occupation | Male | Female |
| Management | 1,967 (53.7%) | 1,699 (46.3%) |
| Business & Financial | 918 (47.5%) | 1,016 (52.5%) |
| Computers, Engineering & Science | 2,162 (81.2%) | 499 (18.8%) |
| Computers & Mathematics | 997 (79.8%) | 253 (20.2%) |
| Architecture & Engineering | 935 (86.7%) | 143 (13.3%) |
| Life, Physical & Social Science | 230 (69.1%) | 103 (30.9%) |
| Community & Social Service | 1,606 (34.9%) | 2,990 (65.1%) |
| Education, Arts & Media | 202 (39.2%) | 313 (60.8%) |
| Legal Services & Support | 208 (42.6%) | 280 (57.4%) |
| Education Instruction & Library | 530 (21.9%) | 1,891 (78.1%) |
| Arts, Media & Entertainment | 666 (56.8%) | 506 (43.2%) |
| Health Diagnosing & Treating | 703 (24.7%) | 2,140 (75.3%) |
| Health Technologists | 561 (28.7%) | 1,391 (71.3%) |
| Total (Category) | 7,356 (46.9%) | 8,344 (53.1%) |
| Total (Overall) | 17,727 (51.7%) | 16,565 (48.3%) |
Services Occupations
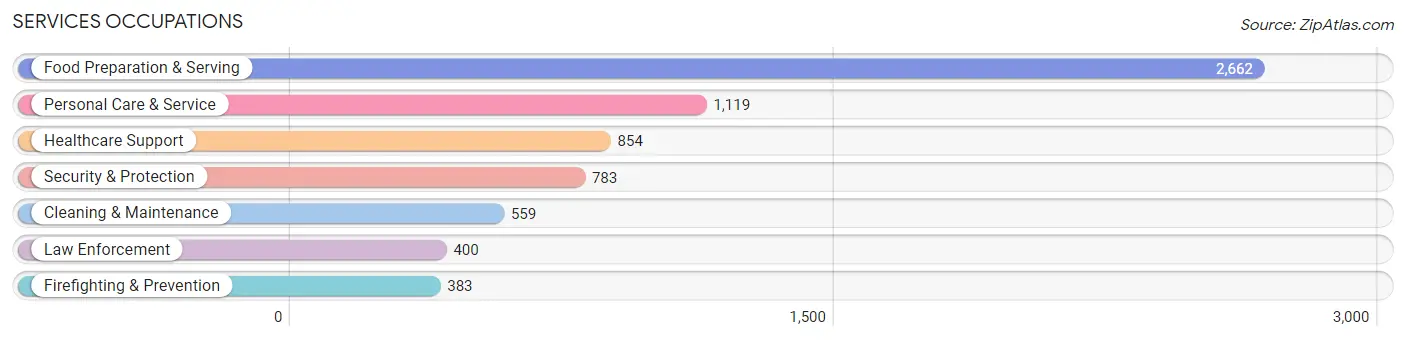
The most common Services occupations in Casas Adobes are Food Preparation & Serving (2,662 | 7.8%), Personal Care & Service (1,119 | 3.3%), Healthcare Support (854 | 2.5%), Security & Protection (783 | 2.3%), and Cleaning & Maintenance (559 | 1.6%).
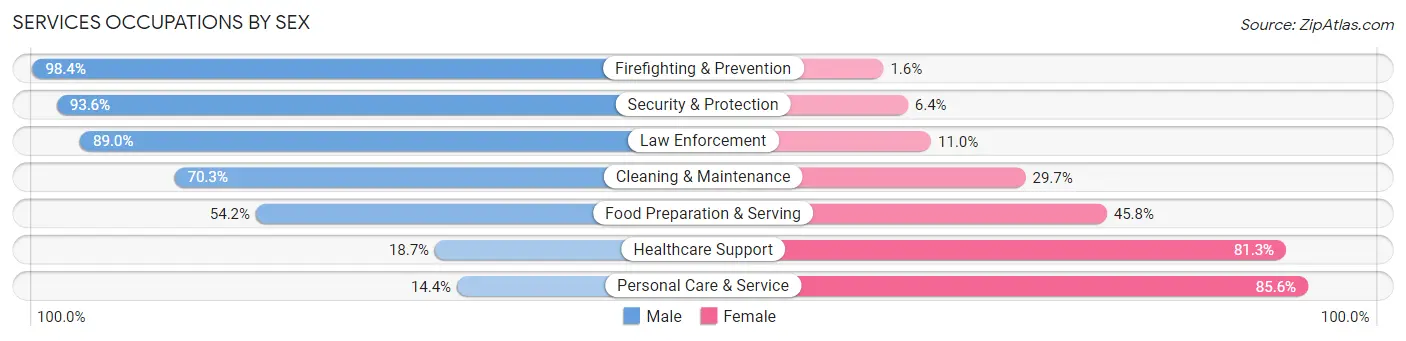
Services Occupations by Sex
Within the Services occupations in Casas Adobes, the most male-oriented occupations are Firefighting & Prevention (98.4%), Security & Protection (93.6%), and Law Enforcement (89.0%), while the most female-oriented occupations are Personal Care & Service (85.6%), Healthcare Support (81.3%), and Food Preparation & Serving (45.8%).
| Occupation | Male | Female |
| Healthcare Support | 160 (18.7%) | 694 (81.3%) |
| Security & Protection | 733 (93.6%) | 50 (6.4%) |
| Firefighting & Prevention | 377 (98.4%) | 6 (1.6%) |
| Law Enforcement | 356 (89.0%) | 44 (11.0%) |
| Food Preparation & Serving | 1,443 (54.2%) | 1,219 (45.8%) |
| Cleaning & Maintenance | 393 (70.3%) | 166 (29.7%) |
| Personal Care & Service | 161 (14.4%) | 958 (85.6%) |
| Total (Category) | 2,890 (48.3%) | 3,087 (51.6%) |
| Total (Overall) | 17,727 (51.7%) | 16,565 (48.3%) |
Sales and Office Occupations
The most common Sales and Office occupations in Casas Adobes are Sales & Related (3,727 | 10.9%), and Office & Administration (3,670 | 10.7%).
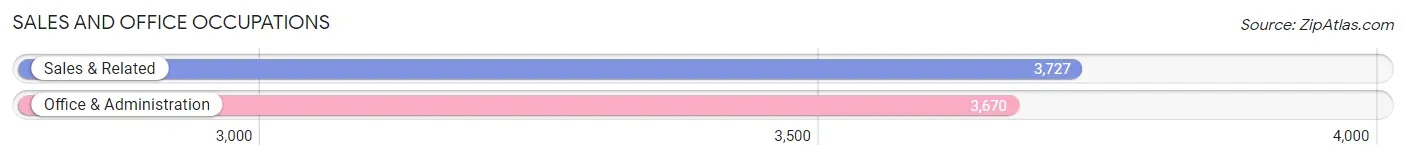
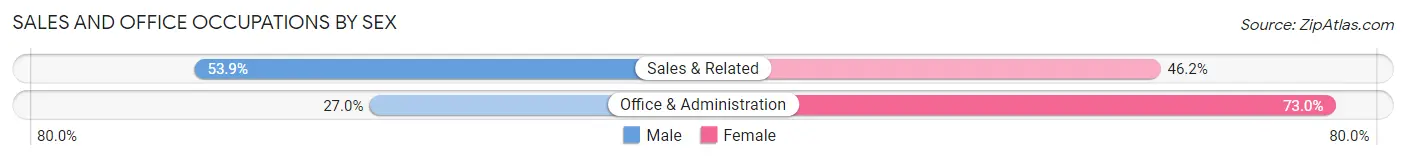
Sales and Office Occupations by Sex
| Occupation | Male | Female |
| Sales & Related | 2,007 (53.8%) | 1,720 (46.2%) |
| Office & Administration | 990 (27.0%) | 2,680 (73.0%) |
| Total (Category) | 2,997 (40.5%) | 4,400 (59.5%) |
| Total (Overall) | 17,727 (51.7%) | 16,565 (48.3%) |
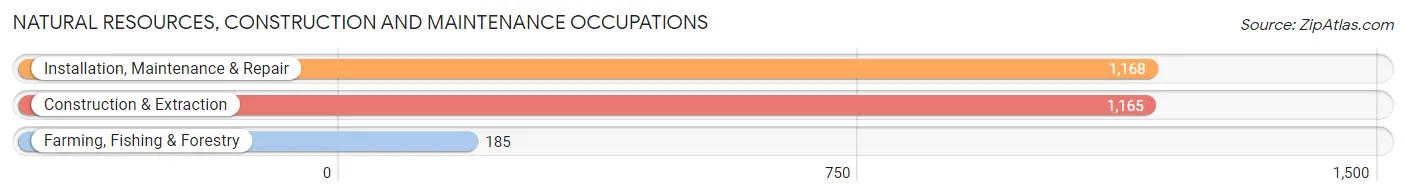
Natural Resources, Construction and Maintenance Occupations
The most common Natural Resources, Construction and Maintenance occupations in Casas Adobes are Installation, Maintenance & Repair (1,168 | 3.4%), Construction & Extraction (1,165 | 3.4%), and Farming, Fishing & Forestry (185 | 0.5%).
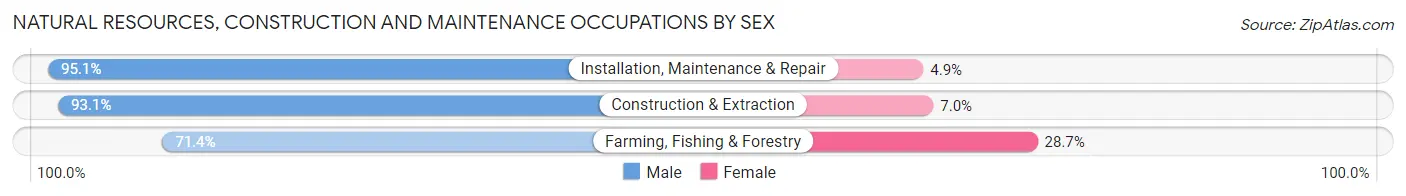
Natural Resources, Construction and Maintenance Occupations by Sex
| Occupation | Male | Female |
| Farming, Fishing & Forestry | 132 (71.4%) | 53 (28.6%) |
| Construction & Extraction | 1,084 (93.0%) | 81 (7.0%) |
| Installation, Maintenance & Repair | 1,111 (95.1%) | 57 (4.9%) |
| Total (Category) | 2,327 (92.4%) | 191 (7.6%) |
| Total (Overall) | 17,727 (51.7%) | 16,565 (48.3%) |
Production, Transportation and Moving Occupations
The most common Production, Transportation and Moving occupations in Casas Adobes are Transportation (979 | 2.9%), Production (902 | 2.6%), and Material Moving (819 | 2.4%).
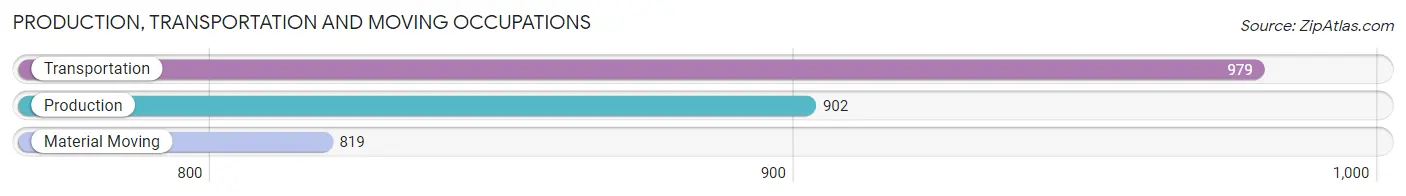
Production, Transportation and Moving Occupations by Sex
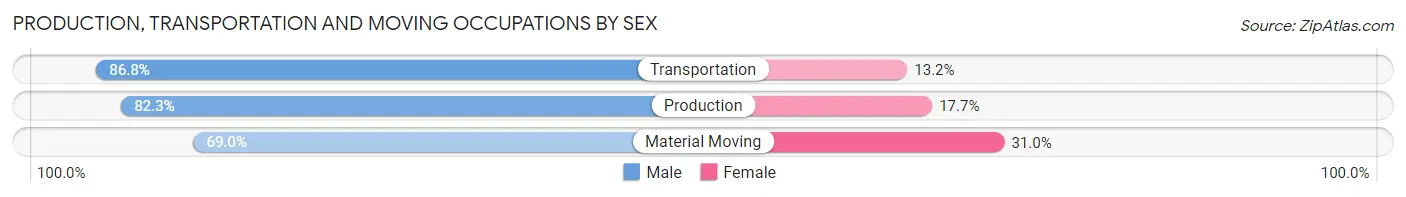
| Occupation | Male | Female |
| Production | 742 (82.3%) | 160 (17.7%) |
| Transportation | 850 (86.8%) | 129 (13.2%) |
| Material Moving | 565 (69.0%) | 254 (31.0%) |
| Total (Category) | 2,157 (79.9%) | 543 (20.1%) |
| Total (Overall) | 17,727 (51.7%) | 16,565 (48.3%) |
Employment Industries by Sex in Casas Adobes
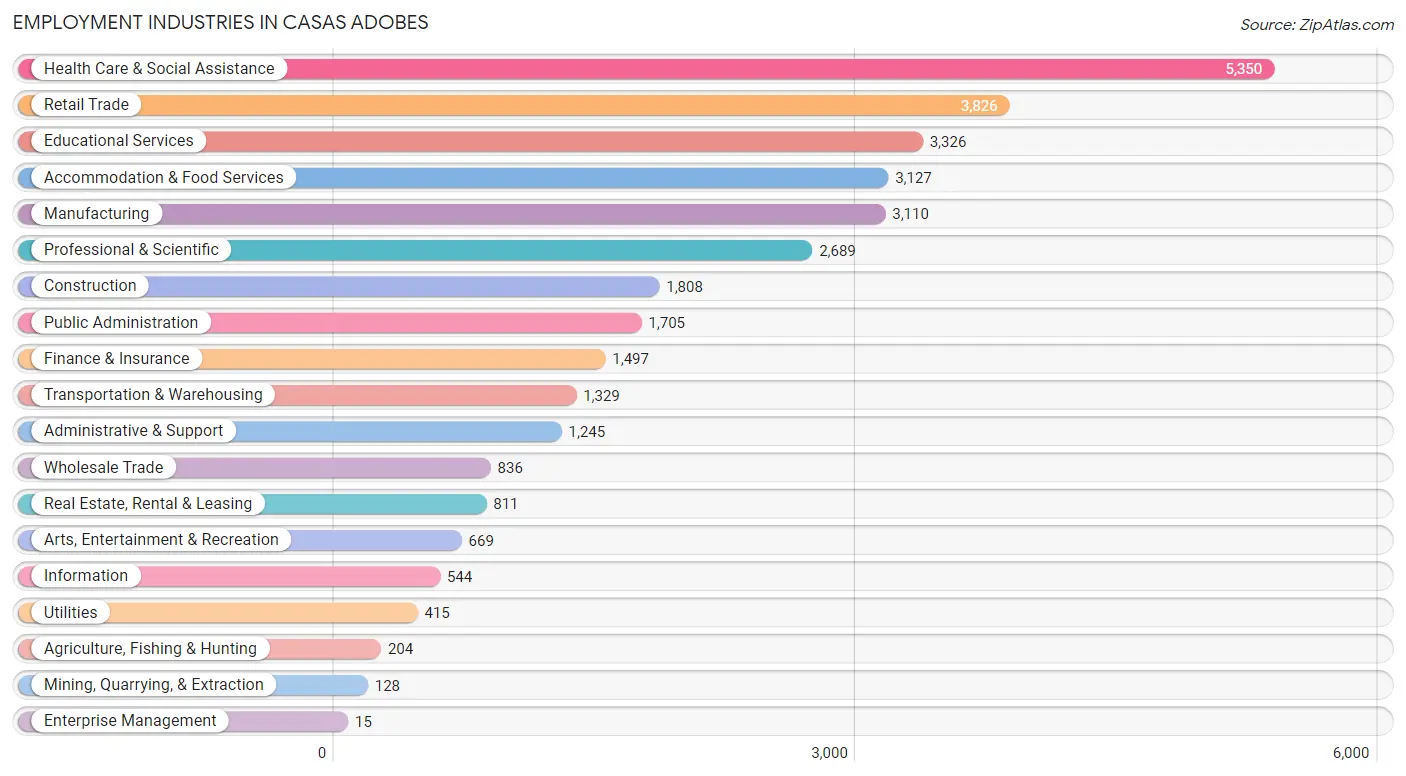
Employment Industries in Casas Adobes
The major employment industries in Casas Adobes include Health Care & Social Assistance (5,350 | 15.6%), Retail Trade (3,826 | 11.2%), Educational Services (3,326 | 9.7%), Accommodation & Food Services (3,127 | 9.1%), and Manufacturing (3,110 | 9.1%).
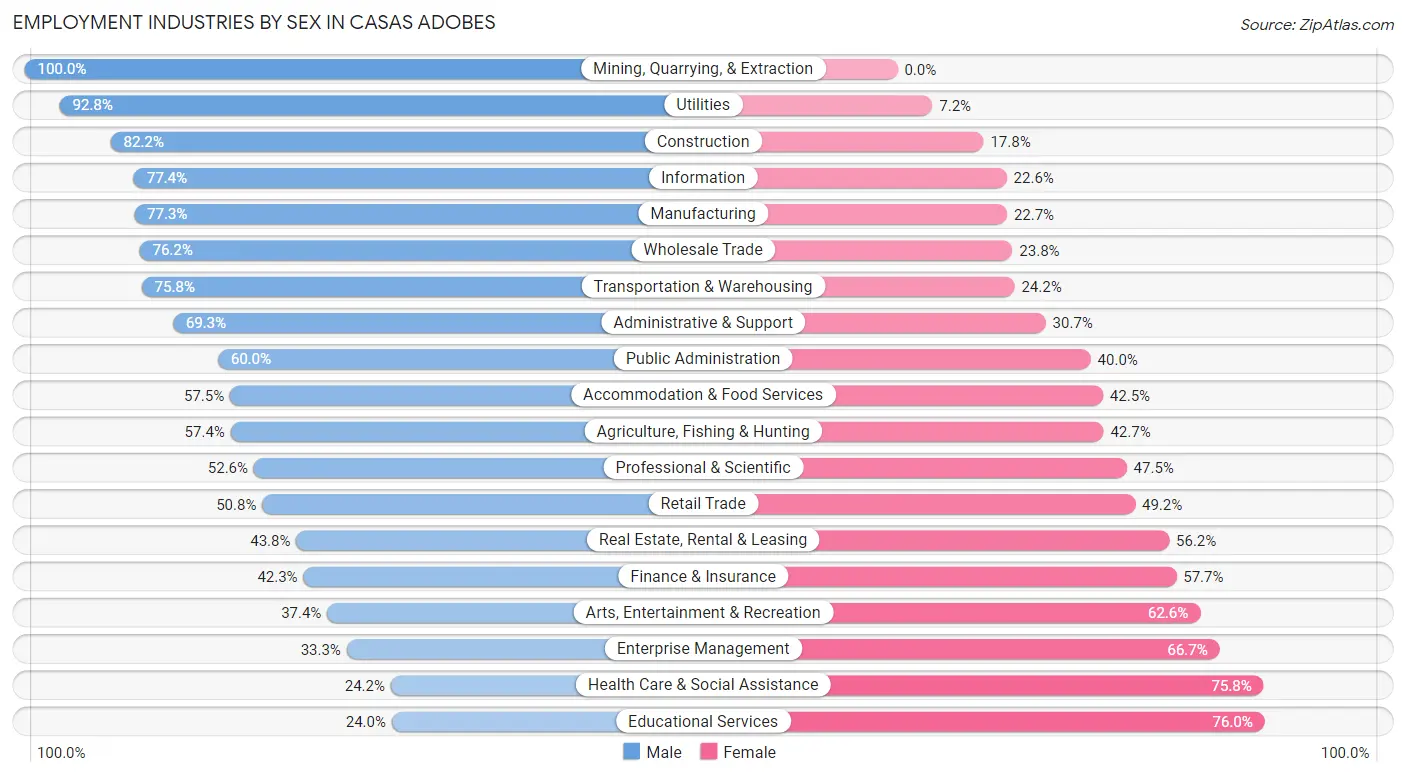
Employment Industries by Sex in Casas Adobes
The Casas Adobes industries that see more men than women are Mining, Quarrying, & Extraction (100.0%), Utilities (92.8%), and Construction (82.2%), whereas the industries that tend to have a higher number of women are Educational Services (76.0%), Health Care & Social Assistance (75.8%), and Enterprise Management (66.7%).
| Industry | Male | Female |
| Agriculture, Fishing & Hunting | 117 (57.4%) | 87 (42.6%) |
| Mining, Quarrying, & Extraction | 128 (100.0%) | 0 (0.0%) |
| Construction | 1,486 (82.2%) | 322 (17.8%) |
| Manufacturing | 2,405 (77.3%) | 705 (22.7%) |
| Wholesale Trade | 637 (76.2%) | 199 (23.8%) |
| Retail Trade | 1,944 (50.8%) | 1,882 (49.2%) |
| Transportation & Warehousing | 1,007 (75.8%) | 322 (24.2%) |
| Utilities | 385 (92.8%) | 30 (7.2%) |
| Information | 421 (77.4%) | 123 (22.6%) |
| Finance & Insurance | 633 (42.3%) | 864 (57.7%) |
| Real Estate, Rental & Leasing | 355 (43.8%) | 456 (56.2%) |
| Professional & Scientific | 1,413 (52.5%) | 1,276 (47.4%) |
| Enterprise Management | 5 (33.3%) | 10 (66.7%) |
| Administrative & Support | 863 (69.3%) | 382 (30.7%) |
| Educational Services | 798 (24.0%) | 2,528 (76.0%) |
| Health Care & Social Assistance | 1,295 (24.2%) | 4,055 (75.8%) |
| Arts, Entertainment & Recreation | 250 (37.4%) | 419 (62.6%) |
| Accommodation & Food Services | 1,797 (57.5%) | 1,330 (42.5%) |
| Public Administration | 1,023 (60.0%) | 682 (40.0%) |
| Total | 17,727 (51.7%) | 16,565 (48.3%) |
Education in Casas Adobes
School Enrollment in Casas Adobes
The most common levels of schooling among the 14,208 students in Casas Adobes are college / undergraduate (3,849 | 27.1%), high school (3,199 | 22.5%), and middle school (2,802 | 19.7%).
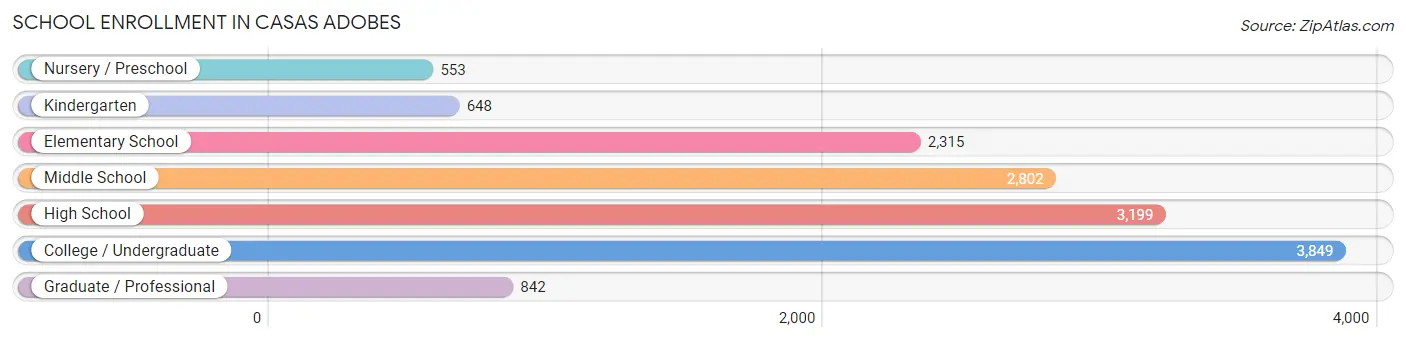
| School Level | # Students | % Students |
| Nursery / Preschool | 553 | 3.9% |
| Kindergarten | 648 | 4.6% |
| Elementary School | 2,315 | 16.3% |
| Middle School | 2,802 | 19.7% |
| High School | 3,199 | 22.5% |
| College / Undergraduate | 3,849 | 27.1% |
| Graduate / Professional | 842 | 5.9% |
| Total | 14,208 | 100.0% |
School Enrollment by Age by Funding Source in Casas Adobes
Out of a total of 14,208 students who are enrolled in schools in Casas Adobes, 2,103 (14.8%) attend a private institution, while the remaining 12,105 (85.2%) are enrolled in public schools. The age group of 3 to 4 year olds has the highest likelihood of being enrolled in private schools, with 188 (38.5% in the age bracket) enrolled. Conversely, the age group of 15 to 17 year olds has the lowest likelihood of being enrolled in a private school, with 2,021 (90.5% in the age bracket) attending a public institution.
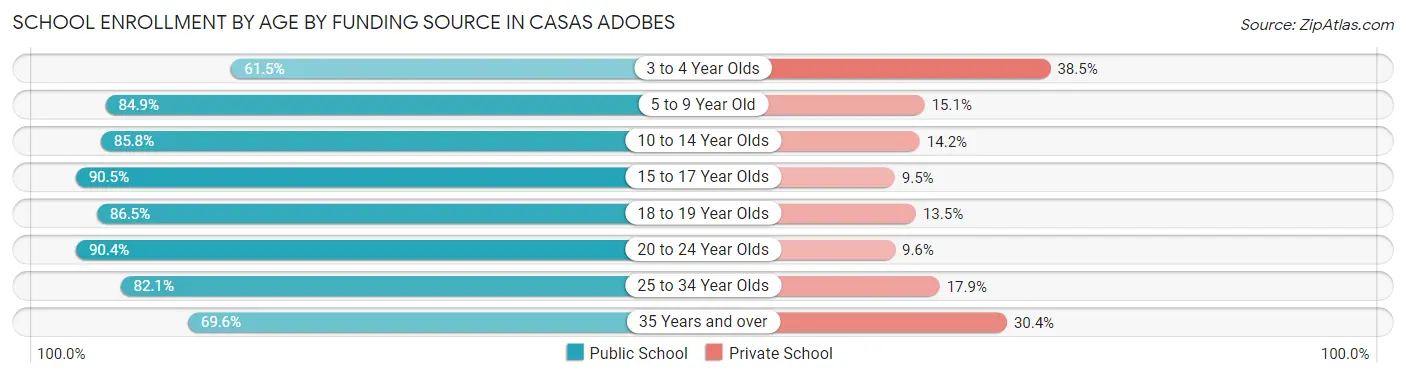
| Age Bracket | Public School | Private School |
| 3 to 4 Year Olds | 300 (61.5%) | 188 (38.5%) |
| 5 to 9 Year Old | 2,192 (84.9%) | 390 (15.1%) |
| 10 to 14 Year Olds | 3,026 (85.8%) | 501 (14.2%) |
| 15 to 17 Year Olds | 2,021 (90.5%) | 213 (9.5%) |
| 18 to 19 Year Olds | 1,028 (86.5%) | 160 (13.5%) |
| 20 to 24 Year Olds | 2,127 (90.4%) | 225 (9.6%) |
| 25 to 34 Year Olds | 909 (82.1%) | 198 (17.9%) |
| 35 Years and over | 508 (69.6%) | 222 (30.4%) |
| Total | 12,105 (85.2%) | 2,103 (14.8%) |
Educational Attainment by Field of Study in Casas Adobes
Business (3,417 | 15.8%), education (2,808 | 13.0%), science & technology (2,089 | 9.7%), engineering (1,932 | 8.9%), and bio, nature & agricultural (1,838 | 8.5%) are the most common fields of study among 21,608 individuals in Casas Adobes who have obtained a bachelor's degree or higher.
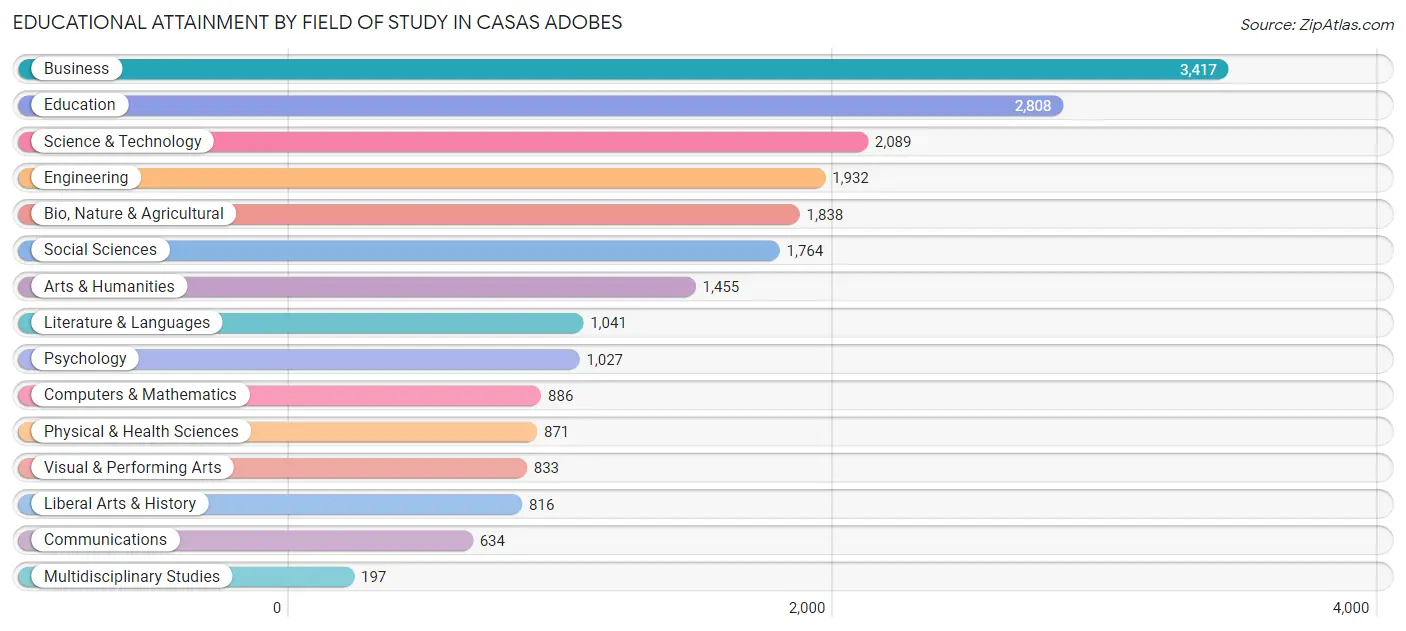
| Field of Study | # Graduates | % Graduates |
| Computers & Mathematics | 886 | 4.1% |
| Bio, Nature & Agricultural | 1,838 | 8.5% |
| Physical & Health Sciences | 871 | 4.0% |
| Psychology | 1,027 | 4.8% |
| Social Sciences | 1,764 | 8.2% |
| Engineering | 1,932 | 8.9% |
| Multidisciplinary Studies | 197 | 0.9% |
| Science & Technology | 2,089 | 9.7% |
| Business | 3,417 | 15.8% |
| Education | 2,808 | 13.0% |
| Literature & Languages | 1,041 | 4.8% |
| Liberal Arts & History | 816 | 3.8% |
| Visual & Performing Arts | 833 | 3.9% |
| Communications | 634 | 2.9% |
| Arts & Humanities | 1,455 | 6.7% |
| Total | 21,608 | 100.0% |
Transportation & Commute in Casas Adobes
Vehicle Availability by Sex in Casas Adobes
The most prevalent vehicle ownership categories in Casas Adobes are males with 2 vehicles (8,255, accounting for 46.5%) and females with 2 vehicles (7,319, making up 51.0%).
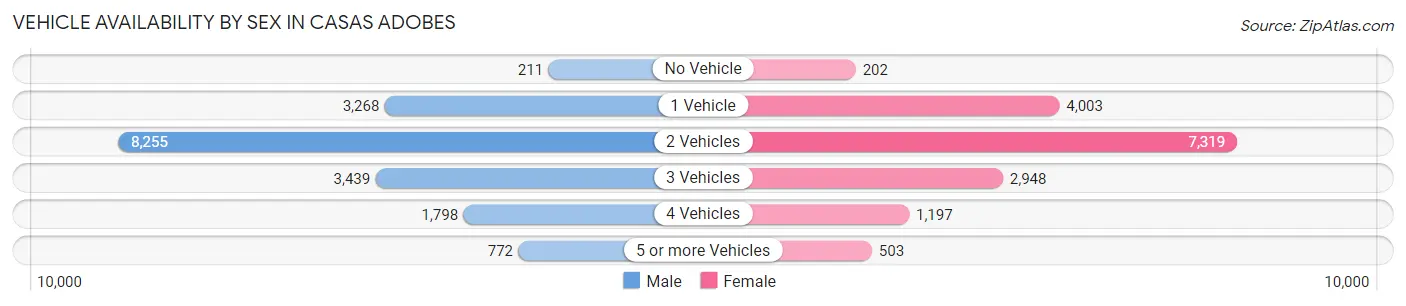
| Vehicles Available | Male | Female |
| No Vehicle | 211 (1.2%) | 202 (1.3%) |
| 1 Vehicle | 3,268 (18.4%) | 4,003 (24.7%) |
| 2 Vehicles | 8,255 (46.5%) | 7,319 (45.3%) |
| 3 Vehicles | 3,439 (19.4%) | 2,948 (18.2%) |
| 4 Vehicles | 1,798 (10.1%) | 1,197 (7.4%) |
| 5 or more Vehicles | 772 (4.3%) | 503 (3.1%) |
| Total | 17,743 (100.0%) | 16,172 (100.0%) |
Commute Time in Casas Adobes
The most frequently occuring commute durations in Casas Adobes are 20 to 24 minutes (5,177 commuters, 17.2%), 30 to 34 minutes (5,038 commuters, 16.7%), and 15 to 19 minutes (4,754 commuters, 15.8%).
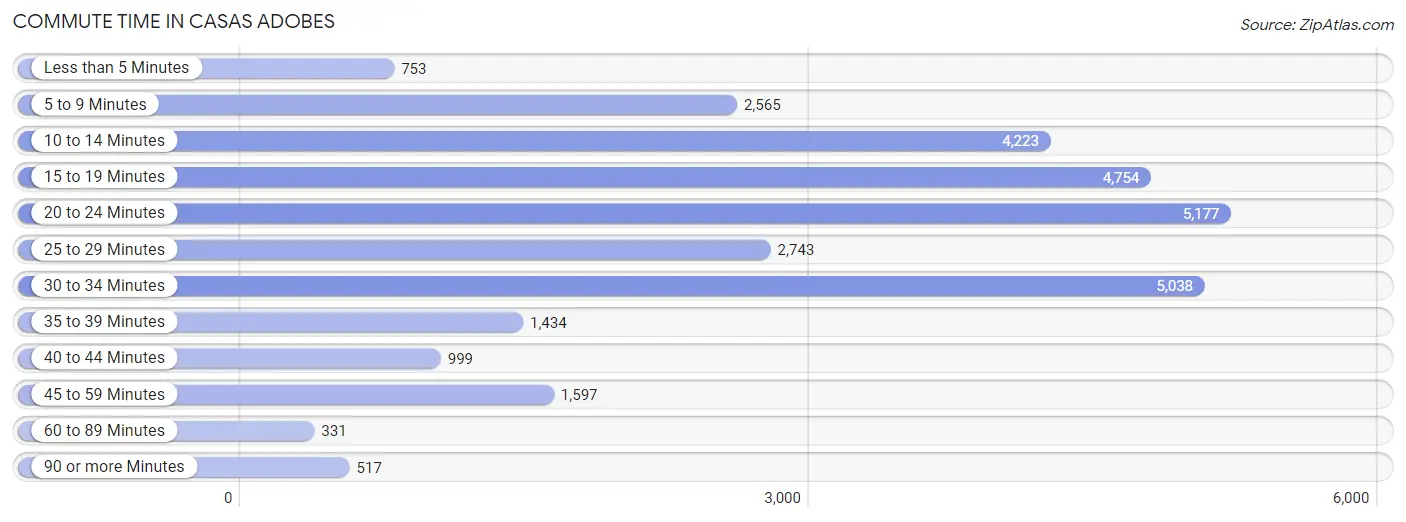
| Commute Time | # Commuters | % Commuters |
| Less than 5 Minutes | 753 | 2.5% |
| 5 to 9 Minutes | 2,565 | 8.5% |
| 10 to 14 Minutes | 4,223 | 14.0% |
| 15 to 19 Minutes | 4,754 | 15.8% |
| 20 to 24 Minutes | 5,177 | 17.2% |
| 25 to 29 Minutes | 2,743 | 9.1% |
| 30 to 34 Minutes | 5,038 | 16.7% |
| 35 to 39 Minutes | 1,434 | 4.8% |
| 40 to 44 Minutes | 999 | 3.3% |
| 45 to 59 Minutes | 1,597 | 5.3% |
| 60 to 89 Minutes | 331 | 1.1% |
| 90 or more Minutes | 517 | 1.7% |
Commute Time by Sex in Casas Adobes
The most common commute times in Casas Adobes are 20 to 24 minutes (3,131 commuters, 19.4%) for males and 10 to 14 minutes (2,590 commuters, 18.5%) for females.
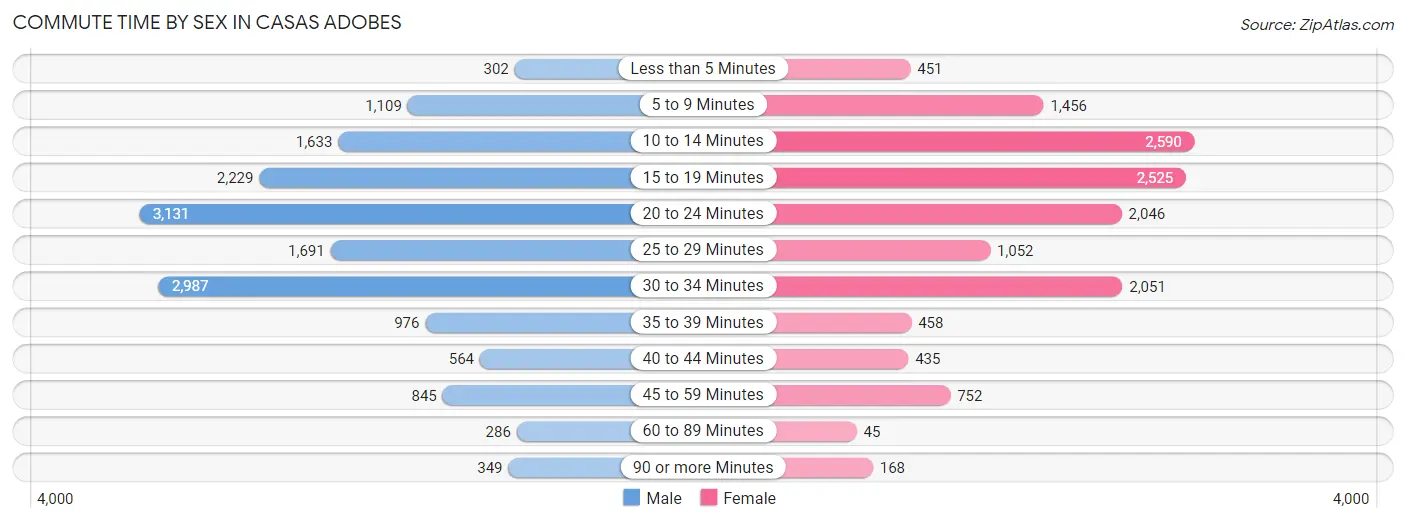
| Commute Time | Male | Female |
| Less than 5 Minutes | 302 (1.9%) | 451 (3.2%) |
| 5 to 9 Minutes | 1,109 (6.9%) | 1,456 (10.4%) |
| 10 to 14 Minutes | 1,633 (10.1%) | 2,590 (18.5%) |
| 15 to 19 Minutes | 2,229 (13.8%) | 2,525 (18.0%) |
| 20 to 24 Minutes | 3,131 (19.4%) | 2,046 (14.6%) |
| 25 to 29 Minutes | 1,691 (10.5%) | 1,052 (7.5%) |
| 30 to 34 Minutes | 2,987 (18.5%) | 2,051 (14.6%) |
| 35 to 39 Minutes | 976 (6.1%) | 458 (3.3%) |
| 40 to 44 Minutes | 564 (3.5%) | 435 (3.1%) |
| 45 to 59 Minutes | 845 (5.2%) | 752 (5.4%) |
| 60 to 89 Minutes | 286 (1.8%) | 45 (0.3%) |
| 90 or more Minutes | 349 (2.2%) | 168 (1.2%) |
Time of Departure to Work by Sex in Casas Adobes
The most frequent times of departure to work in Casas Adobes are 7:00 AM to 7:29 AM (2,027, 12.6%) for males and 7:00 AM to 7:29 AM (2,183, 15.6%) for females.
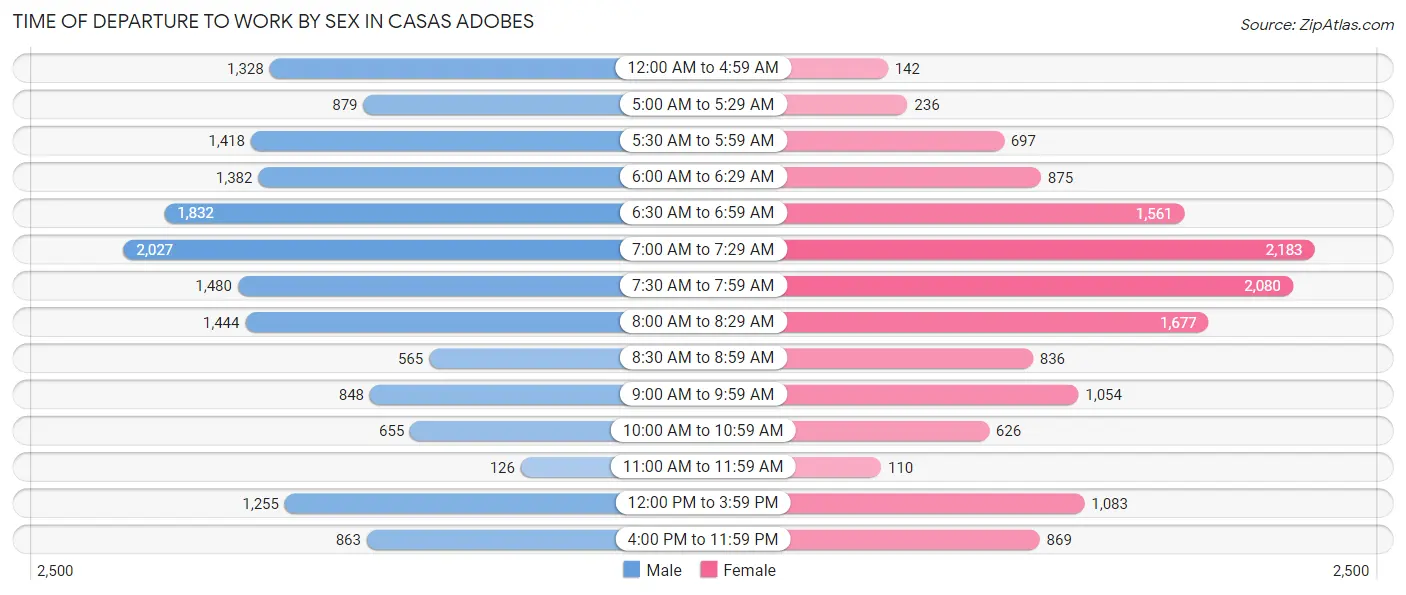
| Time of Departure | Male | Female |
| 12:00 AM to 4:59 AM | 1,328 (8.3%) | 142 (1.0%) |
| 5:00 AM to 5:29 AM | 879 (5.5%) | 236 (1.7%) |
| 5:30 AM to 5:59 AM | 1,418 (8.8%) | 697 (5.0%) |
| 6:00 AM to 6:29 AM | 1,382 (8.6%) | 875 (6.2%) |
| 6:30 AM to 6:59 AM | 1,832 (11.4%) | 1,561 (11.1%) |
| 7:00 AM to 7:29 AM | 2,027 (12.6%) | 2,183 (15.6%) |
| 7:30 AM to 7:59 AM | 1,480 (9.2%) | 2,080 (14.8%) |
| 8:00 AM to 8:29 AM | 1,444 (9.0%) | 1,677 (11.9%) |
| 8:30 AM to 8:59 AM | 565 (3.5%) | 836 (6.0%) |
| 9:00 AM to 9:59 AM | 848 (5.3%) | 1,054 (7.5%) |
| 10:00 AM to 10:59 AM | 655 (4.1%) | 626 (4.5%) |
| 11:00 AM to 11:59 AM | 126 (0.8%) | 110 (0.8%) |
| 12:00 PM to 3:59 PM | 1,255 (7.8%) | 1,083 (7.7%) |
| 4:00 PM to 11:59 PM | 863 (5.4%) | 869 (6.2%) |
| Total | 16,102 (100.0%) | 14,029 (100.0%) |
Housing Occupancy in Casas Adobes
Occupancy by Ownership in Casas Adobes
Of the total 30,186 dwellings in Casas Adobes, owner-occupied units account for 19,810 (65.6%), while renter-occupied units make up 10,376 (34.4%).
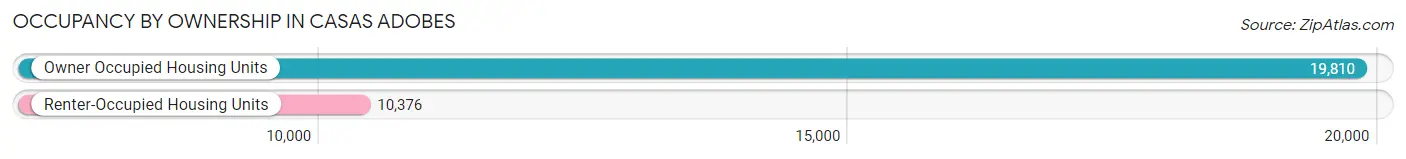
| Occupancy | # Housing Units | % Housing Units |
| Owner Occupied Housing Units | 19,810 | 65.6% |
| Renter-Occupied Housing Units | 10,376 | 34.4% |
| Total Occupied Housing Units | 30,186 | 100.0% |
Occupancy by Household Size in Casas Adobes
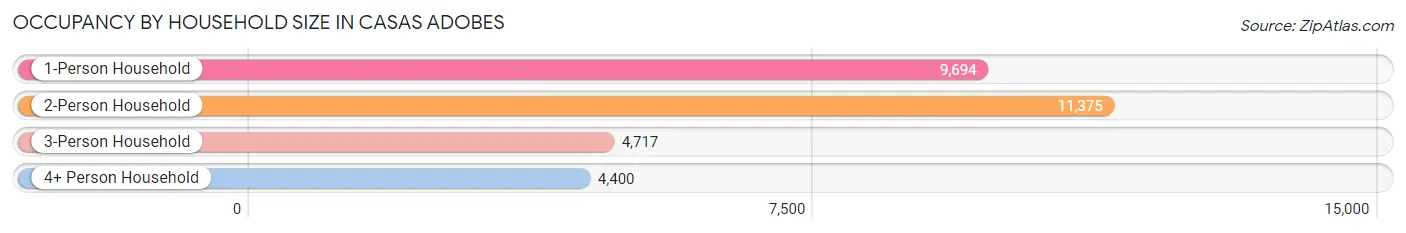
| Household Size | # Housing Units | % Housing Units |
| 1-Person Household | 9,694 | 32.1% |
| 2-Person Household | 11,375 | 37.7% |
| 3-Person Household | 4,717 | 15.6% |
| 4+ Person Household | 4,400 | 14.6% |
| Total Housing Units | 30,186 | 100.0% |
Occupancy by Ownership by Household Size in Casas Adobes
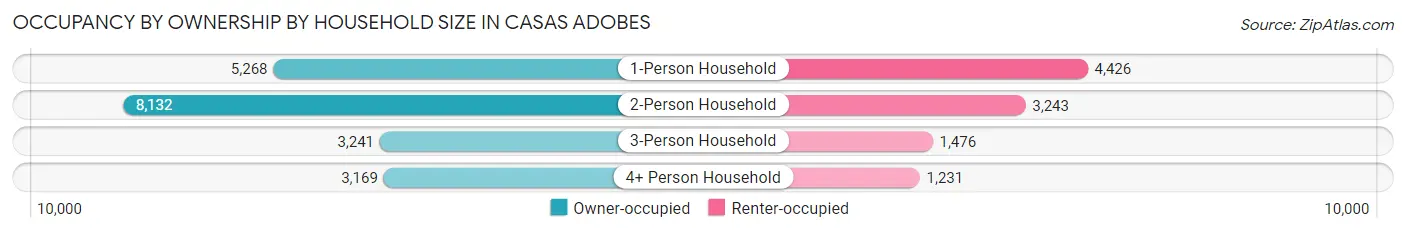
| Household Size | Owner-occupied | Renter-occupied |
| 1-Person Household | 5,268 (54.3%) | 4,426 (45.7%) |
| 2-Person Household | 8,132 (71.5%) | 3,243 (28.5%) |
| 3-Person Household | 3,241 (68.7%) | 1,476 (31.3%) |
| 4+ Person Household | 3,169 (72.0%) | 1,231 (28.0%) |
| Total Housing Units | 19,810 (65.6%) | 10,376 (34.4%) |
Occupancy by Educational Attainment in Casas Adobes
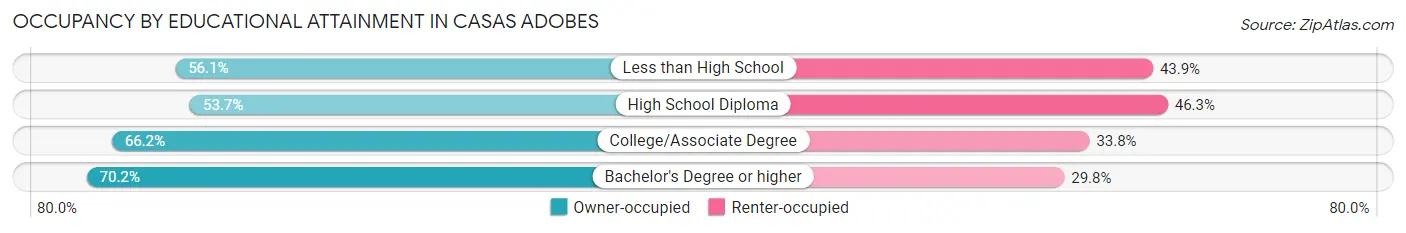
| Household Size | Owner-occupied | Renter-occupied |
| Less than High School | 772 (56.1%) | 604 (43.9%) |
| High School Diploma | 2,320 (53.7%) | 1,997 (46.3%) |
| College/Associate Degree | 7,731 (66.2%) | 3,953 (33.8%) |
| Bachelor's Degree or higher | 8,987 (70.2%) | 3,822 (29.8%) |
Occupancy by Age of Householder in Casas Adobes
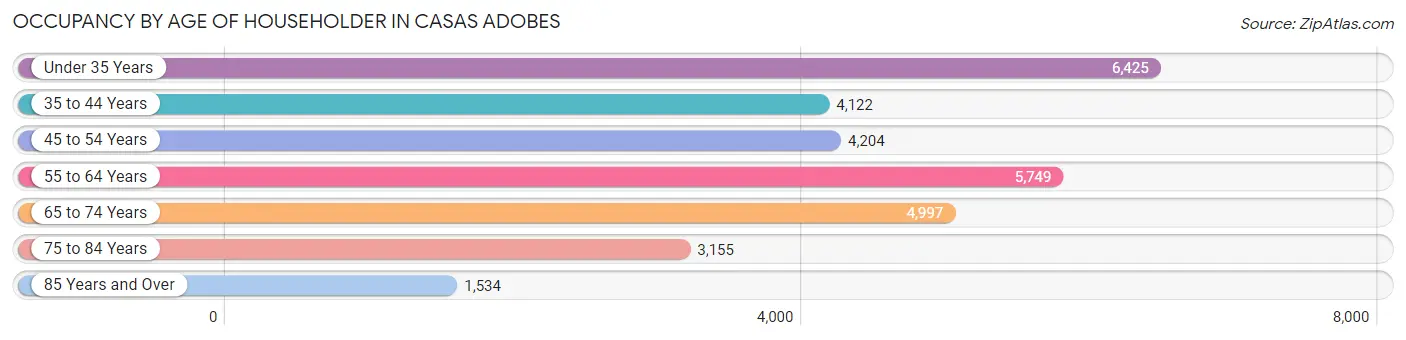
| Age Bracket | # Households | % Households |
| Under 35 Years | 6,425 | 21.3% |
| 35 to 44 Years | 4,122 | 13.7% |
| 45 to 54 Years | 4,204 | 13.9% |
| 55 to 64 Years | 5,749 | 19.1% |
| 65 to 74 Years | 4,997 | 16.6% |
| 75 to 84 Years | 3,155 | 10.4% |
| 85 Years and Over | 1,534 | 5.1% |
| Total | 30,186 | 100.0% |
Housing Finances in Casas Adobes
Median Income by Occupancy in Casas Adobes
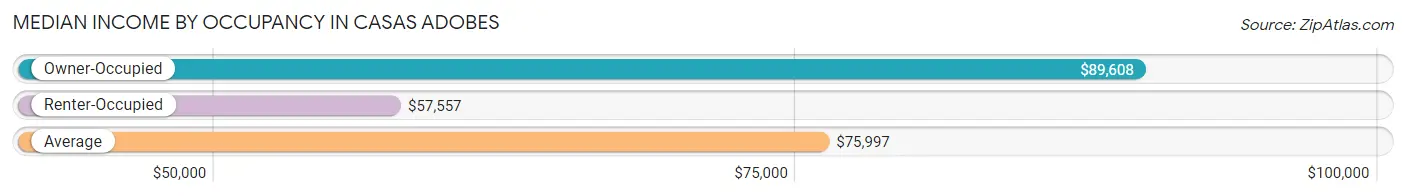
| Occupancy Type | # Households | Median Income |
| Owner-Occupied | 19,810 (65.6%) | $89,608 |
| Renter-Occupied | 10,376 (34.4%) | $57,557 |
| Average | 30,186 (100.0%) | $75,997 |
Occupancy by Householder Income Bracket in Casas Adobes
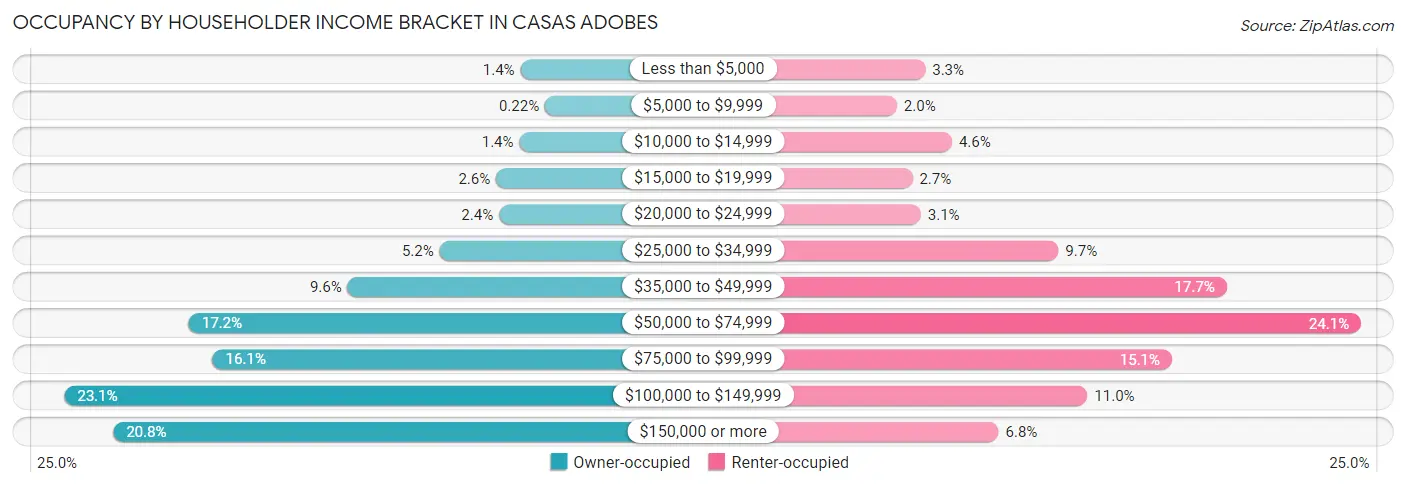
| Income Bracket | Owner-occupied | Renter-occupied |
| Less than $5,000 | 276 (1.4%) | 345 (3.3%) |
| $5,000 to $9,999 | 43 (0.2%) | 204 (2.0%) |
| $10,000 to $14,999 | 286 (1.4%) | 476 (4.6%) |
| $15,000 to $19,999 | 505 (2.5%) | 281 (2.7%) |
| $20,000 to $24,999 | 478 (2.4%) | 323 (3.1%) |
| $25,000 to $34,999 | 1,038 (5.2%) | 1,002 (9.7%) |
| $35,000 to $49,999 | 1,906 (9.6%) | 1,833 (17.7%) |
| $50,000 to $74,999 | 3,403 (17.2%) | 2,497 (24.1%) |
| $75,000 to $99,999 | 3,179 (16.1%) | 1,563 (15.1%) |
| $100,000 to $149,999 | 4,579 (23.1%) | 1,145 (11.0%) |
| $150,000 or more | 4,117 (20.8%) | 707 (6.8%) |
| Total | 19,810 (100.0%) | 10,376 (100.0%) |
Monthly Housing Cost Tiers in Casas Adobes
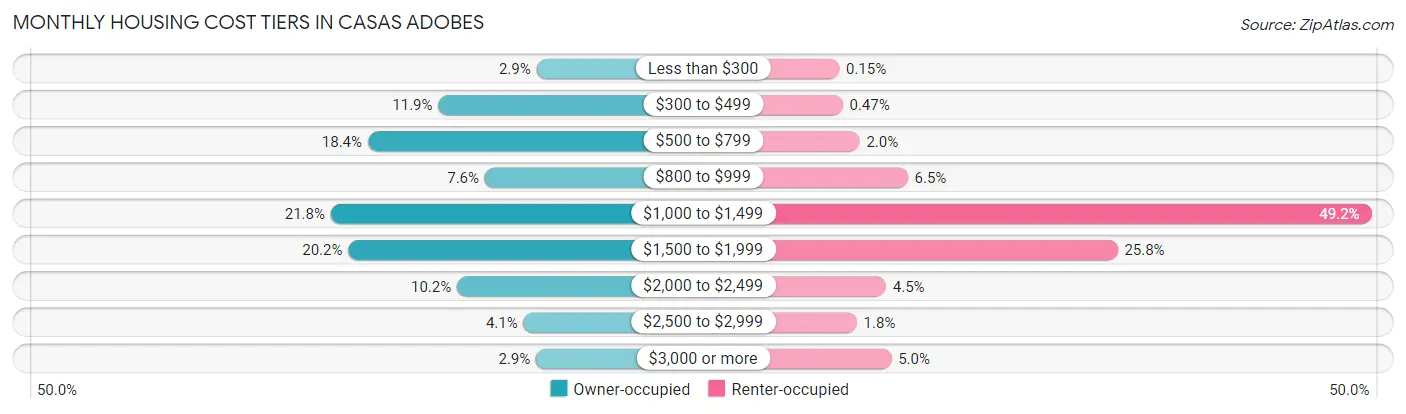
| Monthly Cost | Owner-occupied | Renter-occupied |
| Less than $300 | 568 (2.9%) | 16 (0.2%) |
| $300 to $499 | 2,360 (11.9%) | 49 (0.5%) |
| $500 to $799 | 3,645 (18.4%) | 211 (2.0%) |
| $800 to $999 | 1,512 (7.6%) | 670 (6.5%) |
| $1,000 to $1,499 | 4,321 (21.8%) | 5,101 (49.2%) |
| $1,500 to $1,999 | 4,002 (20.2%) | 2,675 (25.8%) |
| $2,000 to $2,499 | 2,018 (10.2%) | 463 (4.5%) |
| $2,500 to $2,999 | 806 (4.1%) | 184 (1.8%) |
| $3,000 or more | 578 (2.9%) | 514 (5.0%) |
| Total | 19,810 (100.0%) | 10,376 (100.0%) |
Physical Housing Characteristics in Casas Adobes
Housing Structures in Casas Adobes
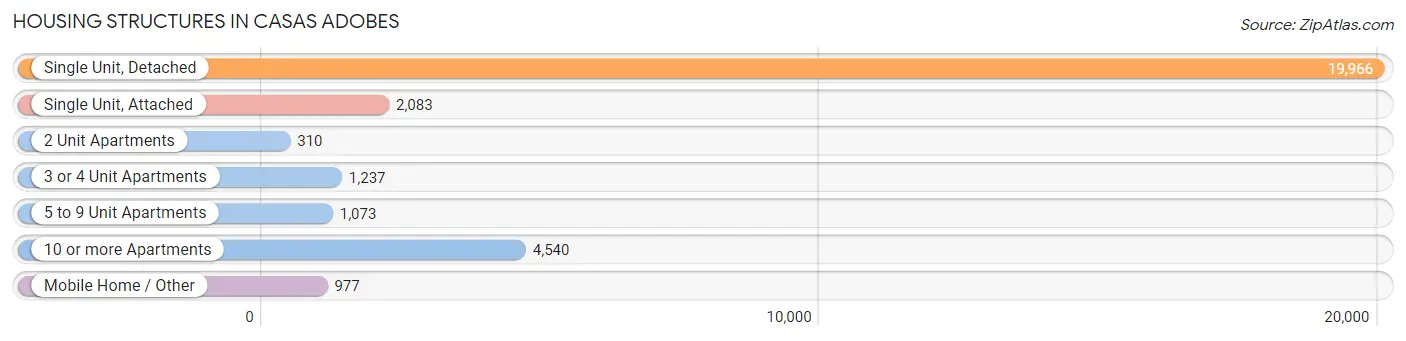
| Structure Type | # Housing Units | % Housing Units |
| Single Unit, Detached | 19,966 | 66.1% |
| Single Unit, Attached | 2,083 | 6.9% |
| 2 Unit Apartments | 310 | 1.0% |
| 3 or 4 Unit Apartments | 1,237 | 4.1% |
| 5 to 9 Unit Apartments | 1,073 | 3.5% |
| 10 or more Apartments | 4,540 | 15.0% |
| Mobile Home / Other | 977 | 3.2% |
| Total | 30,186 | 100.0% |
Housing Structures by Occupancy in Casas Adobes
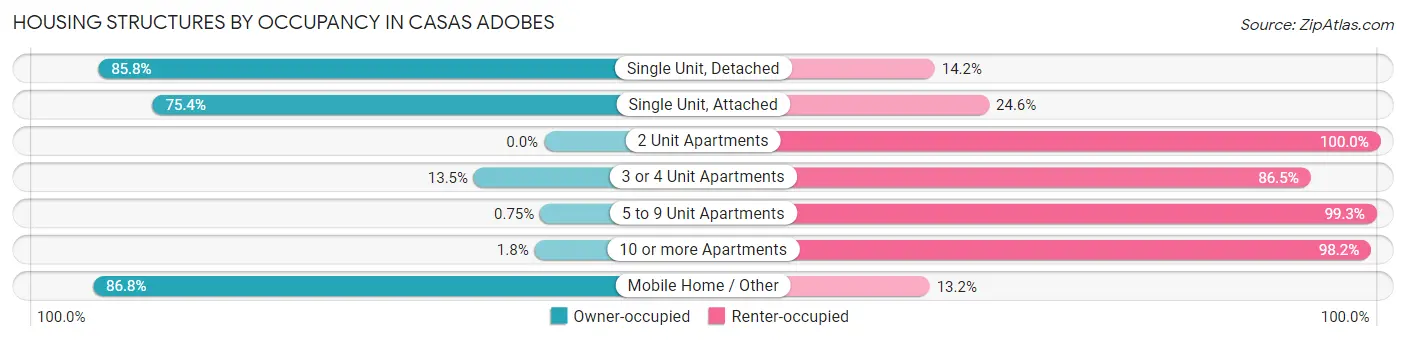
| Structure Type | Owner-occupied | Renter-occupied |
| Single Unit, Detached | 17,134 (85.8%) | 2,832 (14.2%) |
| Single Unit, Attached | 1,570 (75.4%) | 513 (24.6%) |
| 2 Unit Apartments | 0 (0.0%) | 310 (100.0%) |
| 3 or 4 Unit Apartments | 167 (13.5%) | 1,070 (86.5%) |
| 5 to 9 Unit Apartments | 8 (0.7%) | 1,065 (99.3%) |
| 10 or more Apartments | 83 (1.8%) | 4,457 (98.2%) |
| Mobile Home / Other | 848 (86.8%) | 129 (13.2%) |
| Total | 19,810 (65.6%) | 10,376 (34.4%) |
Housing Structures by Number of Rooms in Casas Adobes
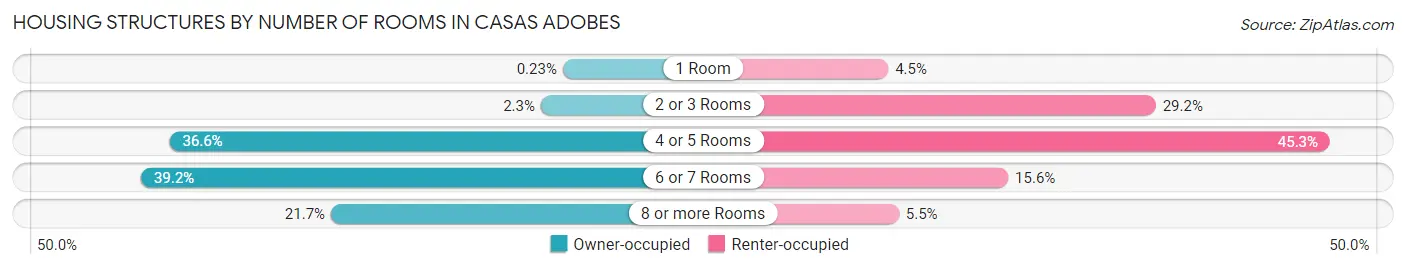
| Number of Rooms | Owner-occupied | Renter-occupied |
| 1 Room | 46 (0.2%) | 464 (4.5%) |
| 2 or 3 Rooms | 447 (2.3%) | 3,031 (29.2%) |
| 4 or 5 Rooms | 7,251 (36.6%) | 4,701 (45.3%) |
| 6 or 7 Rooms | 7,774 (39.2%) | 1,614 (15.6%) |
| 8 or more Rooms | 4,292 (21.7%) | 566 (5.4%) |
| Total | 19,810 (100.0%) | 10,376 (100.0%) |
Housing Structure by Heating Type in Casas Adobes
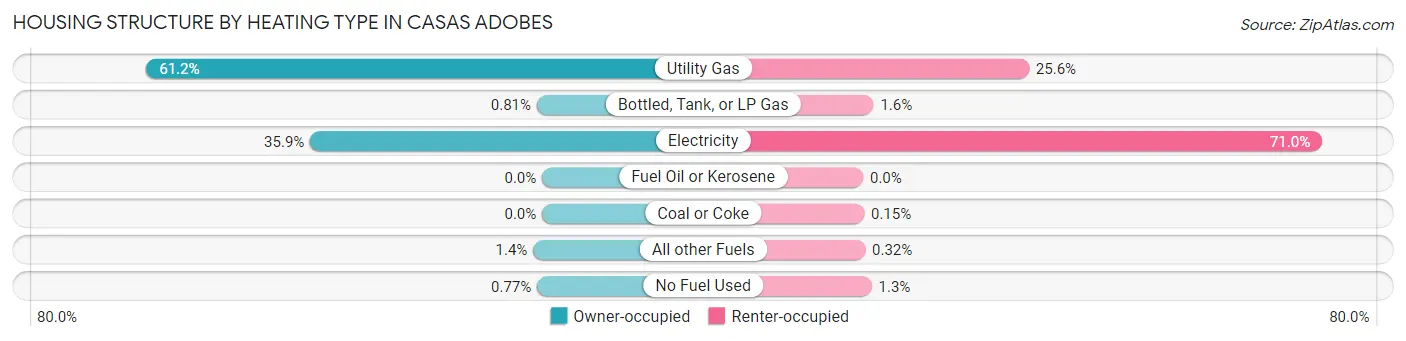
| Heating Type | Owner-occupied | Renter-occupied |
| Utility Gas | 12,120 (61.2%) | 2,660 (25.6%) |
| Bottled, Tank, or LP Gas | 161 (0.8%) | 167 (1.6%) |
| Electricity | 7,103 (35.9%) | 7,363 (71.0%) |
| Fuel Oil or Kerosene | 0 (0.0%) | 0 (0.0%) |
| Coal or Coke | 0 (0.0%) | 16 (0.2%) |
| All other Fuels | 274 (1.4%) | 33 (0.3%) |
| No Fuel Used | 152 (0.8%) | 137 (1.3%) |
| Total | 19,810 (100.0%) | 10,376 (100.0%) |
Household Vehicle Usage in Casas Adobes
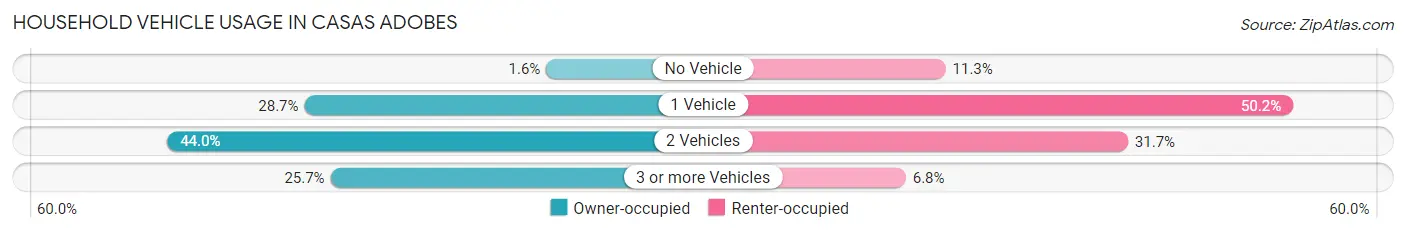
| Vehicles per Household | Owner-occupied | Renter-occupied |
| No Vehicle | 312 (1.6%) | 1,170 (11.3%) |
| 1 Vehicle | 5,678 (28.7%) | 5,209 (50.2%) |
| 2 Vehicles | 8,720 (44.0%) | 3,289 (31.7%) |
| 3 or more Vehicles | 5,100 (25.7%) | 708 (6.8%) |
| Total | 19,810 (100.0%) | 10,376 (100.0%) |
Real Estate & Mortgages in Casas Adobes
Real Estate and Mortgage Overview in Casas Adobes
| Characteristic | Without Mortgage | With Mortgage |
| Housing Units | 7,214 | 12,596 |
| Median Property Value | $271,300 | $285,300 |
| Median Household Income | $68,971 | $2,952 |
| Monthly Housing Costs | $551 | $578 |
| Real Estate Taxes | $2,632 | $280 |
Property Value by Mortgage Status in Casas Adobes
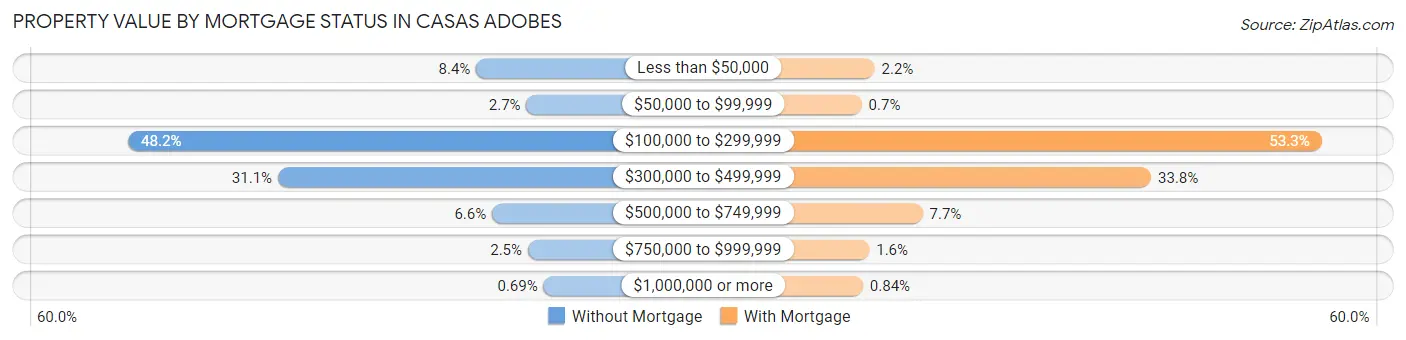
| Property Value | Without Mortgage | With Mortgage |
| Less than $50,000 | 605 (8.4%) | 275 (2.2%) |
| $50,000 to $99,999 | 191 (2.6%) | 88 (0.7%) |
| $100,000 to $299,999 | 3,474 (48.2%) | 6,709 (53.3%) |
| $300,000 to $499,999 | 2,240 (31.0%) | 4,255 (33.8%) |
| $500,000 to $749,999 | 475 (6.6%) | 965 (7.7%) |
| $750,000 to $999,999 | 179 (2.5%) | 198 (1.6%) |
| $1,000,000 or more | 50 (0.7%) | 106 (0.8%) |
| Total | 7,214 (100.0%) | 12,596 (100.0%) |
Household Income by Mortgage Status in Casas Adobes
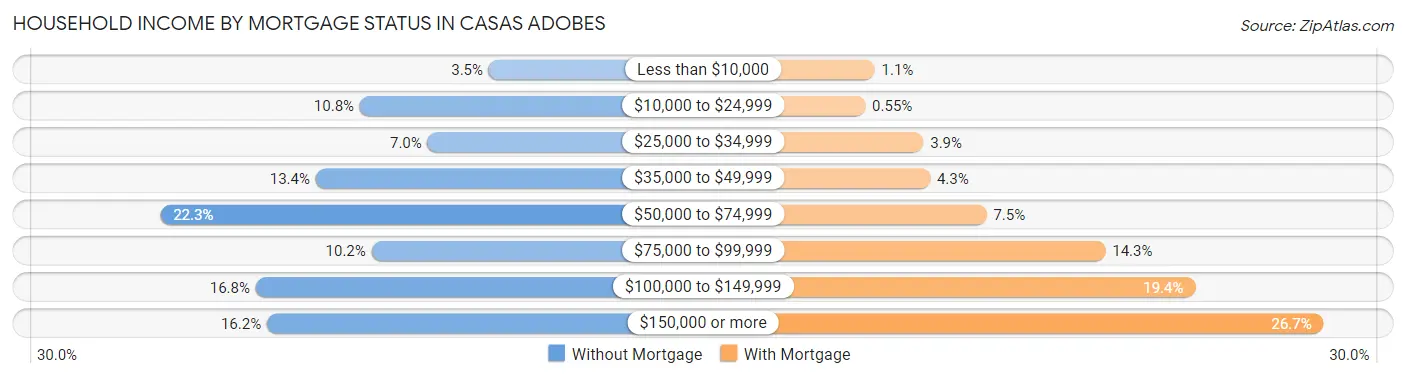
| Household Income | Without Mortgage | With Mortgage |
| Less than $10,000 | 250 (3.5%) | 137 (1.1%) |
| $10,000 to $24,999 | 782 (10.8%) | 69 (0.5%) |
| $25,000 to $34,999 | 503 (7.0%) | 487 (3.9%) |
| $35,000 to $49,999 | 964 (13.4%) | 535 (4.3%) |
| $50,000 to $74,999 | 1,605 (22.3%) | 942 (7.5%) |
| $75,000 to $99,999 | 734 (10.2%) | 1,798 (14.3%) |
| $100,000 to $149,999 | 1,211 (16.8%) | 2,445 (19.4%) |
| $150,000 or more | 1,165 (16.2%) | 3,368 (26.7%) |
| Total | 7,214 (100.0%) | 12,596 (100.0%) |
Property Value to Household Income Ratio in Casas Adobes
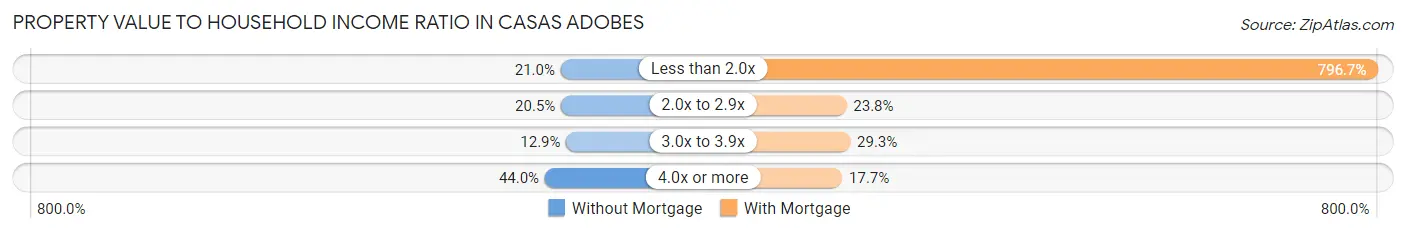
| Value-to-Income Ratio | Without Mortgage | With Mortgage |
| Less than 2.0x | 1,512 (21.0%) | 100,348 (796.7%) |
| 2.0x to 2.9x | 1,475 (20.4%) | 3,003 (23.8%) |
| 3.0x to 3.9x | 928 (12.9%) | 3,690 (29.3%) |
| 4.0x or more | 3,174 (44.0%) | 2,227 (17.7%) |
| Total | 7,214 (100.0%) | 12,596 (100.0%) |
Real Estate Taxes by Mortgage Status in Casas Adobes
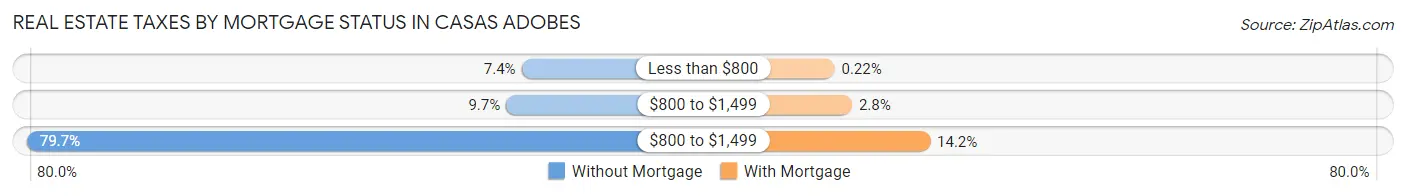
| Property Taxes | Without Mortgage | With Mortgage |
| Less than $800 | 534 (7.4%) | 28 (0.2%) |
| $800 to $1,499 | 696 (9.7%) | 349 (2.8%) |
| $800 to $1,499 | 5,748 (79.7%) | 1,786 (14.2%) |
| Total | 7,214 (100.0%) | 12,596 (100.0%) |
Health & Disability in Casas Adobes
Health Insurance Coverage by Age in Casas Adobes
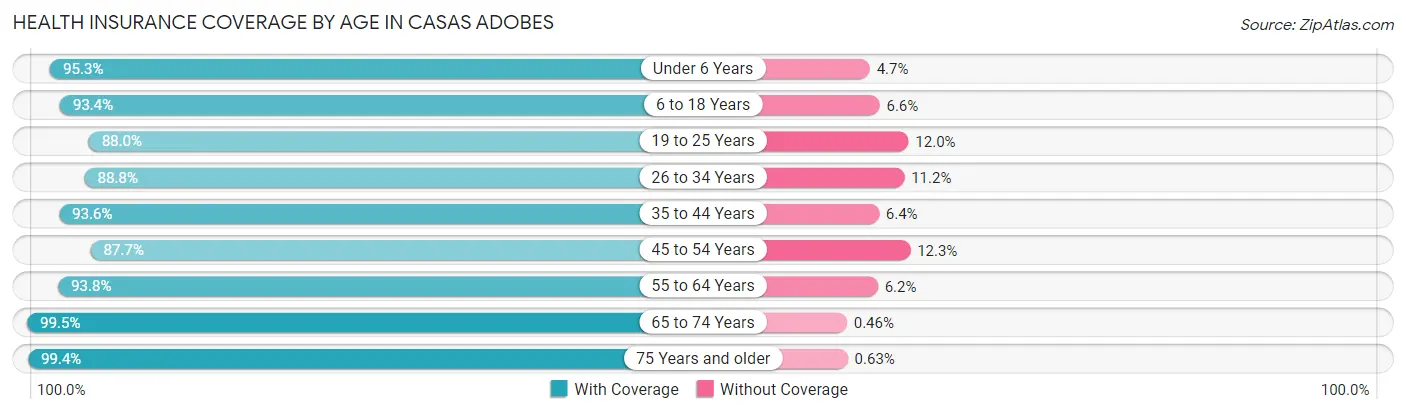
| Age Bracket | With Coverage | Without Coverage |
| Under 6 Years | 3,540 (95.3%) | 176 (4.7%) |
| 6 to 18 Years | 8,091 (93.4%) | 569 (6.6%) |
| 19 to 25 Years | 6,645 (88.0%) | 903 (12.0%) |
| 26 to 34 Years | 7,754 (88.8%) | 976 (11.2%) |
| 35 to 44 Years | 7,077 (93.6%) | 487 (6.4%) |
| 45 to 54 Years | 6,607 (87.7%) | 926 (12.3%) |
| 55 to 64 Years | 8,743 (93.8%) | 581 (6.2%) |
| 65 to 74 Years | 8,028 (99.5%) | 37 (0.5%) |
| 75 Years and older | 7,302 (99.4%) | 46 (0.6%) |
| Total | 63,787 (93.1%) | 4,701 (6.9%) |
Health Insurance Coverage by Citizenship Status in Casas Adobes
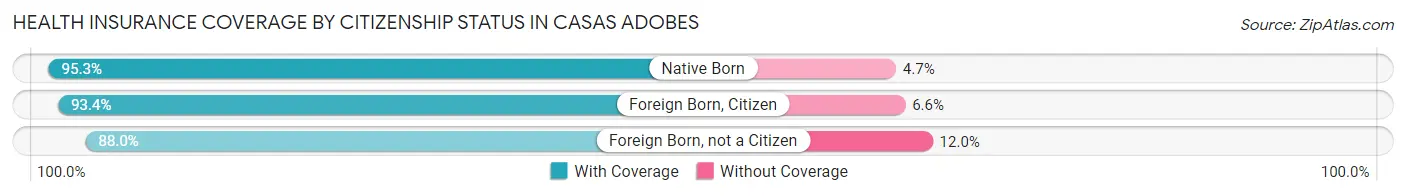
| Citizenship Status | With Coverage | Without Coverage |
| Native Born | 3,540 (95.3%) | 176 (4.7%) |
| Foreign Born, Citizen | 8,091 (93.4%) | 569 (6.6%) |
| Foreign Born, not a Citizen | 6,645 (88.0%) | 903 (12.0%) |
Health Insurance Coverage by Household Income in Casas Adobes
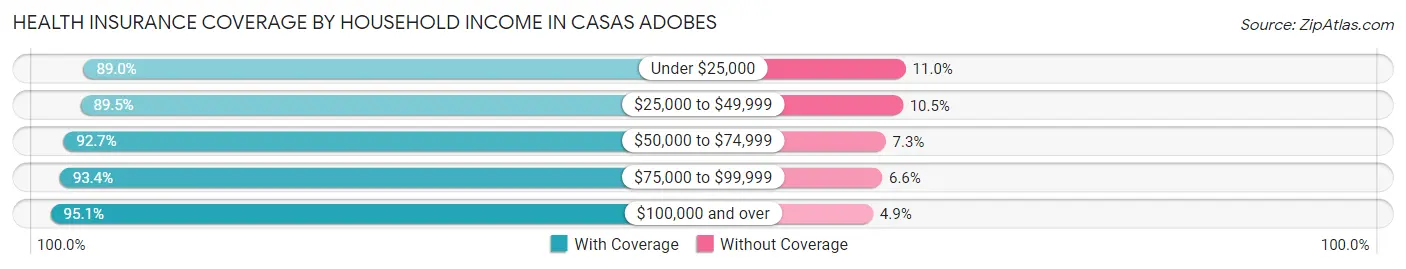
| Household Income | With Coverage | Without Coverage |
| Under $25,000 | 4,162 (89.0%) | 516 (11.0%) |
| $25,000 to $49,999 | 9,085 (89.5%) | 1,063 (10.5%) |
| $50,000 to $74,999 | 10,900 (92.7%) | 855 (7.3%) |
| $75,000 to $99,999 | 10,843 (93.4%) | 766 (6.6%) |
| $100,000 and over | 28,561 (95.1%) | 1,468 (4.9%) |
Public vs Private Health Insurance Coverage by Age in Casas Adobes
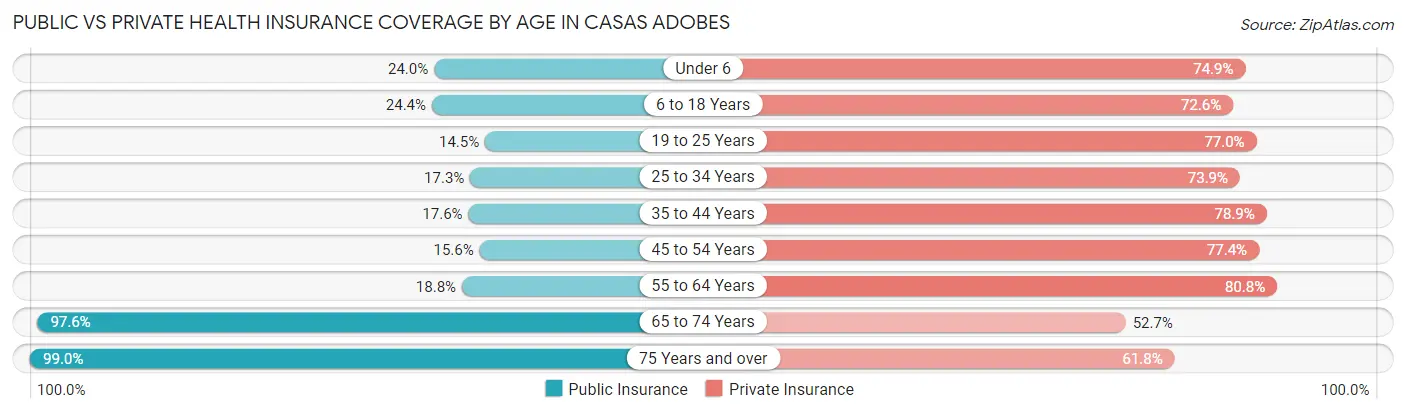
| Age Bracket | Public Insurance | Private Insurance |
| Under 6 | 892 (24.0%) | 2,783 (74.9%) |
| 6 to 18 Years | 2,114 (24.4%) | 6,289 (72.6%) |
| 19 to 25 Years | 1,097 (14.5%) | 5,809 (77.0%) |
| 25 to 34 Years | 1,510 (17.3%) | 6,450 (73.9%) |
| 35 to 44 Years | 1,333 (17.6%) | 5,964 (78.8%) |
| 45 to 54 Years | 1,172 (15.6%) | 5,832 (77.4%) |
| 55 to 64 Years | 1,756 (18.8%) | 7,532 (80.8%) |
| 65 to 74 Years | 7,872 (97.6%) | 4,250 (52.7%) |
| 75 Years and over | 7,272 (99.0%) | 4,538 (61.8%) |
| Total | 25,018 (36.5%) | 49,447 (72.2%) |
Disability Status by Sex by Age in Casas Adobes
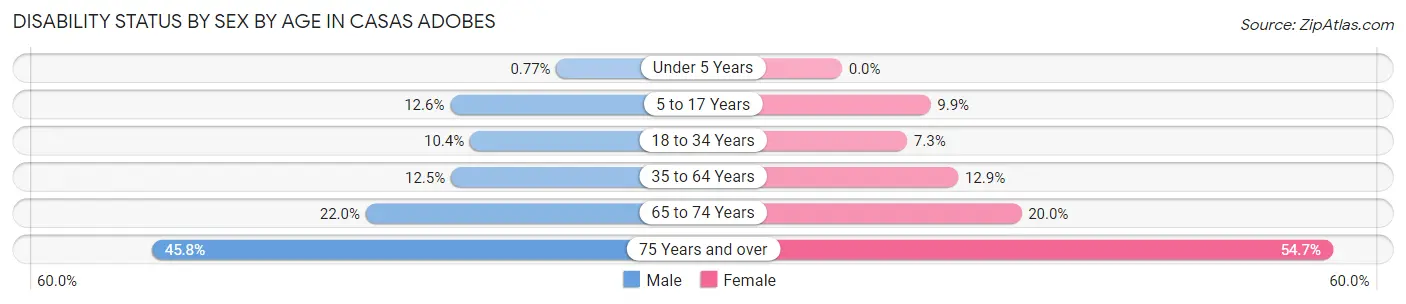
| Age Bracket | Male | Female |
| Under 5 Years | 12 (0.8%) | 0 (0.0%) |
| 5 to 17 Years | 590 (12.6%) | 374 (9.9%) |
| 18 to 34 Years | 914 (10.4%) | 592 (7.2%) |
| 35 to 64 Years | 1,439 (12.5%) | 1,671 (12.9%) |
| 65 to 74 Years | 780 (22.0%) | 903 (20.0%) |
| 75 Years and over | 1,307 (45.8%) | 2,458 (54.7%) |
Disability Class by Sex by Age in Casas Adobes
Disability Class: Hearing Difficulty
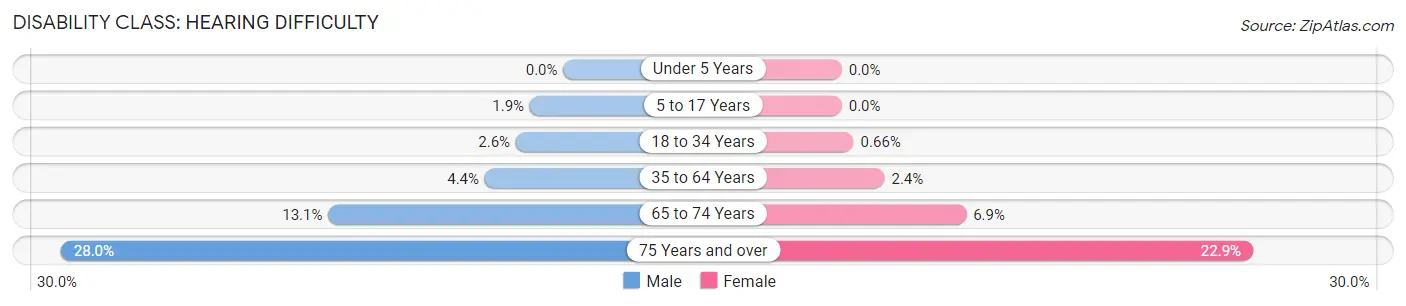
| Age Bracket | Male | Female |
| Under 5 Years | 0 (0.0%) | 0 (0.0%) |
| 5 to 17 Years | 87 (1.9%) | 0 (0.0%) |
| 18 to 34 Years | 232 (2.6%) | 54 (0.7%) |
| 35 to 64 Years | 503 (4.4%) | 307 (2.4%) |
| 65 to 74 Years | 464 (13.1%) | 313 (6.9%) |
| 75 Years and over | 798 (28.0%) | 1,029 (22.9%) |
Disability Class: Vision Difficulty
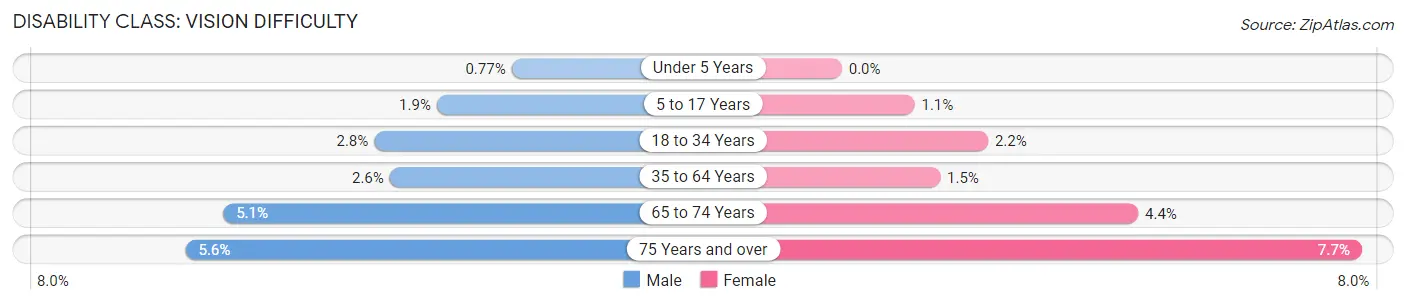
| Age Bracket | Male | Female |
| Under 5 Years | 12 (0.8%) | 0 (0.0%) |
| 5 to 17 Years | 88 (1.9%) | 41 (1.1%) |
| 18 to 34 Years | 247 (2.8%) | 177 (2.2%) |
| 35 to 64 Years | 297 (2.6%) | 188 (1.5%) |
| 65 to 74 Years | 179 (5.1%) | 199 (4.4%) |
| 75 Years and over | 160 (5.6%) | 347 (7.7%) |
Disability Class: Cognitive Difficulty
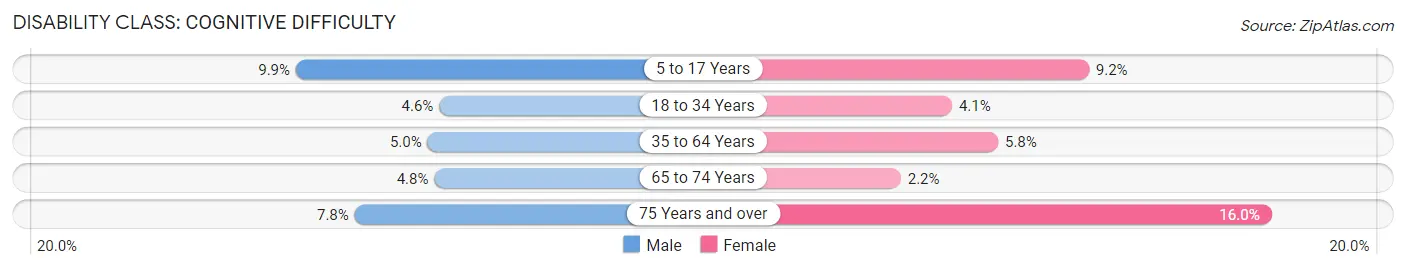
| Age Bracket | Male | Female |
| 5 to 17 Years | 465 (9.9%) | 348 (9.2%) |
| 18 to 34 Years | 405 (4.6%) | 334 (4.1%) |
| 35 to 64 Years | 580 (5.0%) | 749 (5.8%) |
| 65 to 74 Years | 170 (4.8%) | 99 (2.2%) |
| 75 Years and over | 221 (7.7%) | 717 (16.0%) |
Disability Class: Ambulatory Difficulty
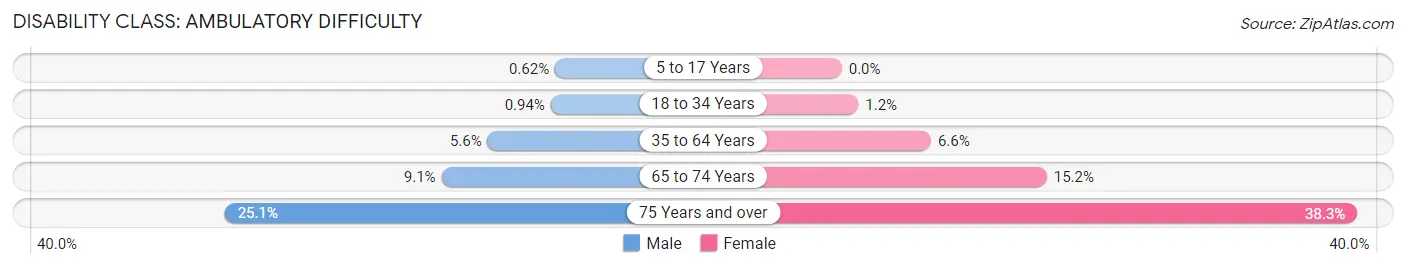
| Age Bracket | Male | Female |
| 5 to 17 Years | 29 (0.6%) | 0 (0.0%) |
| 18 to 34 Years | 83 (0.9%) | 100 (1.2%) |
| 35 to 64 Years | 648 (5.6%) | 855 (6.6%) |
| 65 to 74 Years | 321 (9.0%) | 688 (15.2%) |
| 75 Years and over | 717 (25.1%) | 1,720 (38.3%) |
Disability Class: Self-Care Difficulty
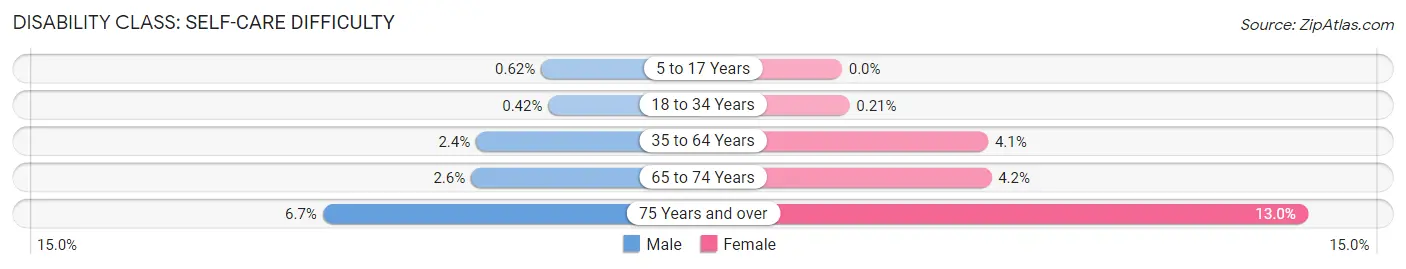
| Age Bracket | Male | Female |
| 5 to 17 Years | 29 (0.6%) | 0 (0.0%) |
| 18 to 34 Years | 37 (0.4%) | 17 (0.2%) |
| 35 to 64 Years | 280 (2.4%) | 526 (4.1%) |
| 65 to 74 Years | 91 (2.6%) | 188 (4.2%) |
| 75 Years and over | 191 (6.7%) | 583 (13.0%) |
Technology Access in Casas Adobes
Computing Device Access in Casas Adobes
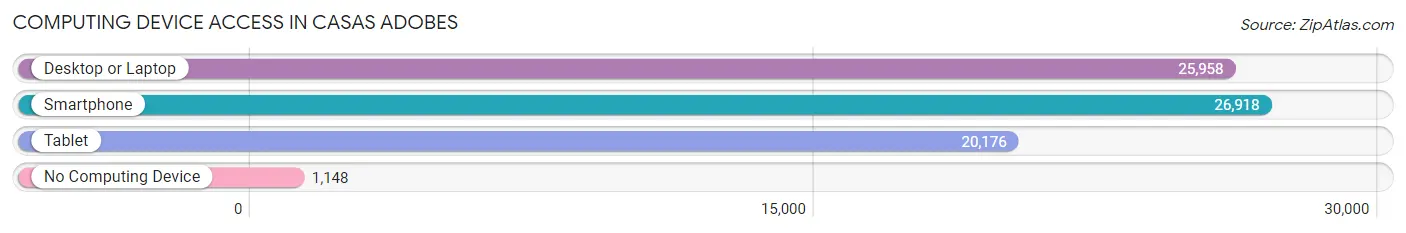
| Device Type | # Households | % Households |
| Desktop or Laptop | 25,958 | 86.0% |
| Smartphone | 26,918 | 89.2% |
| Tablet | 20,176 | 66.8% |
| No Computing Device | 1,148 | 3.8% |
| Total | 30,186 | 100.0% |
Internet Access in Casas Adobes
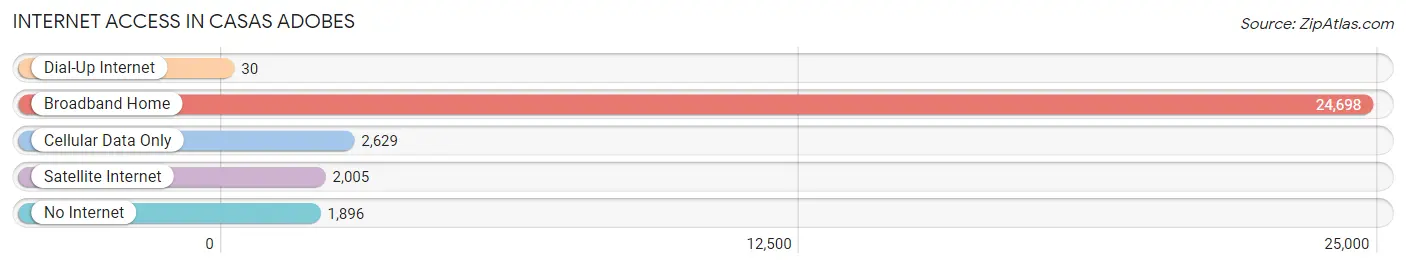
| Internet Type | # Households | % Households |
| Dial-Up Internet | 30 | 0.1% |
| Broadband Home | 24,698 | 81.8% |
| Cellular Data Only | 2,629 | 8.7% |
| Satellite Internet | 2,005 | 6.6% |
| No Internet | 1,896 | 6.3% |
| Total | 30,186 | 100.0% |
Casas Adobes Summary
Casas Adobes is a census-designated place (CDP) located in Pima County, Arizona, United States. The population was 66,795 at the 2010 census. Casas Adobes is located in the northern part of Tucson and is one of the largest and oldest suburbs of the city. It is bordered by the city of Tucson to the south, the town of Oro Valley to the north, and the town of Marana to the west.
History
Casas Adobes was founded in the late 1940s by a group of developers who wanted to create a master-planned community in the Tucson area. The developers purchased a large tract of land and divided it into individual lots. The name Casas Adobes was chosen to reflect the Spanish-style architecture of the homes that were built in the area.
The first homes in Casas Adobes were built in the 1950s and the area quickly grew in popularity. By the 1960s, Casas Adobes had become one of the most desirable places to live in the Tucson area. The area continued to grow throughout the 1970s and 1980s, and by the 1990s, Casas Adobes had become one of the largest and most affluent suburbs of Tucson.
Geography
Casas Adobes is located at 32°17'25" North, 111°2'17" West (32.290278, -111.038333). According to the United States Census Bureau, the CDP has a total area of 16.3 square miles (42.2 km2), all land.
Economy
Casas Adobes is home to a variety of businesses, including retail stores, restaurants, and professional services. The area is also home to several large employers, including the University of Arizona, Raytheon, and Davis-Monthan Air Force Base.
Demographics
As of the 2010 census, there were 66,795 people, 25,945 households, and 17,945 families residing in the CDP. The population density was 4,093.3 people per square mile (1,579.2/km2). There were 27,845 housing units at an average density of 1,711.2 per square mile (661.2/km2). The racial makeup of the CDP was 79.2% White, 4.2% African American, 0.7% Native American, 4.2% Asian, 0.1% Pacific Islander, 8.3% from other races, and 3.3% from two or more races. Hispanic or Latino of any race were 22.2% of the population.
There were 25,945 households, out of which 28.3% had children under the age of 18 living with them, 54.2% were married couples living together, 10.2% had a female householder with no husband present, and 30.7% were non-families. 24.2% of all households were made up of individuals, and 9.2% had someone living alone who was 65 years of age or older. The average household size was 2.56 and the average family size was 3.06.
In the CDP, the population was spread out, with 23.2% under the age of 18, 8.2% from 18 to 24, 25.2% from 25 to 44, 28.2% from 45 to 64, and 15.2% who were 65 years of age or older. The median age was 40 years. For every 100 females, there were 94.2 males. For every 100 females age 18 and over, there were 91.2 males.
The median income for a household in the CDP was $50,945, and the median income for a family was $59,945. Males had a median income of $41,945 versus $31,945 for females. The per capita income for the CDP was $25,945. About 5.2% of families and 7.2% of the population were below the poverty line, including 9.2% of those under age 18 and 5.2% of those age 65 or over.
Common Questions
What is Per Capita Income in Casas Adobes?
Per Capita income in Casas Adobes is $43,457.
What is the Median Family Income in Casas Adobes?
Median Family Income in Casas Adobes is $94,630.
What is the Median Household income in Casas Adobes?
Median Household Income in Casas Adobes is $75,997.
What is Income or Wage Gap in Casas Adobes?
Income or Wage Gap in Casas Adobes is 30.2%.
Women in Casas Adobes earn 69.8 cents for every dollar earned by a man.
What is Family Income Deficit in Casas Adobes?
Family Income Deficit in Casas Adobes is $11,571.
Families that are below poverty line in Casas Adobes earn $11,571 less on average than the poverty threshold level.
What is Inequality or Gini Index in Casas Adobes?
Inequality or Gini Index in Casas Adobes is 0.42.
What is the Total Population of Casas Adobes?
Total Population of Casas Adobes is 69,917.
What is the Total Male Population of Casas Adobes?
Total Male Population of Casas Adobes is 33,635.
What is the Total Female Population of Casas Adobes?
Total Female Population of Casas Adobes is 36,282.
What is the Ratio of Males per 100 Females in Casas Adobes?
There are 92.70 Males per 100 Females in Casas Adobes.
What is the Ratio of Females per 100 Males in Casas Adobes?
There are 107.87 Females per 100 Males in Casas Adobes.
What is the Median Population Age in Casas Adobes?
Median Population Age in Casas Adobes is 43.0 Years.
What is the Average Family Size in Casas Adobes
Average Family Size in Casas Adobes is 2.9 People.
What is the Average Household Size in Casas Adobes
Average Household Size in Casas Adobes is 2.3 People.
How Large is the Labor Force in Casas Adobes?
There are 36,405 People in the Labor Forcein in Casas Adobes.
What is the Percentage of People in the Labor Force in Casas Adobes?
61.0% of People are in the Labor Force in Casas Adobes.
What is the Unemployment Rate in Casas Adobes?
Unemployment Rate in Casas Adobes is 4.9%.