Flagstaff, AZ Map & Demographics
Flagstaff Map
Flagstaff Overview
$32,124
PER CAPITA INCOME
$89,827
AVG FAMILY INCOME
$65,652
AVG HOUSEHOLD INCOME
27.1%
WAGE / INCOME GAP [ % ]
72.9¢/ $1
WAGE / INCOME GAP [ $ ]
$11,189
FAMILY INCOME DEFICIT
0.47
INEQUALITY / GINI INDEX
76,177
TOTAL POPULATION
38,213
MALE POPULATION
37,964
FEMALE POPULATION
100.66
MALES / 100 FEMALES
99.35
FEMALES / 100 MALES
25.9
MEDIAN AGE
3.0
AVG FAMILY SIZE
2.4
AVG HOUSEHOLD SIZE
42,189
LABOR FORCE [ PEOPLE ]
65.5%
PERCENT IN LABOR FORCE
6.6%
UNEMPLOYMENT RATE
Income in Flagstaff
Income Overview in Flagstaff
Per Capita Income in Flagstaff is $32,124, while median incomes of families and households are $89,827 and $65,652 respectively.
| Characteristic | Number | Measure |
| Per Capita Income | 76,177 | $32,124 |
| Median Family Income | 13,824 | $89,827 |
| Mean Family Income | 13,824 | $117,343 |
| Median Household Income | 27,062 | $65,652 |
| Mean Household Income | 27,062 | $89,033 |
| Income Deficit | 13,824 | $11,189 |
| Wage / Income Gap (%) | 76,177 | 27.05% |
| Wage / Income Gap ($) | 76,177 | 72.95¢ per $1 |
| Gini / Inequality Index | 76,177 | 0.47 |
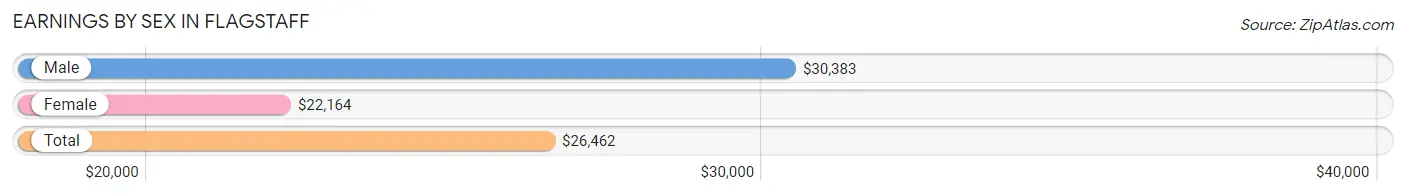
Earnings by Sex in Flagstaff
Average Earnings in Flagstaff are $26,462, $30,383 for men and $22,164 for women, a difference of 27.1%.
| Sex | Number | Average Earnings |
| Male | 24,117 (50.9%) | $30,383 |
| Female | 23,302 (49.1%) | $22,164 |
| Total | 47,419 (100.0%) | $26,462 |
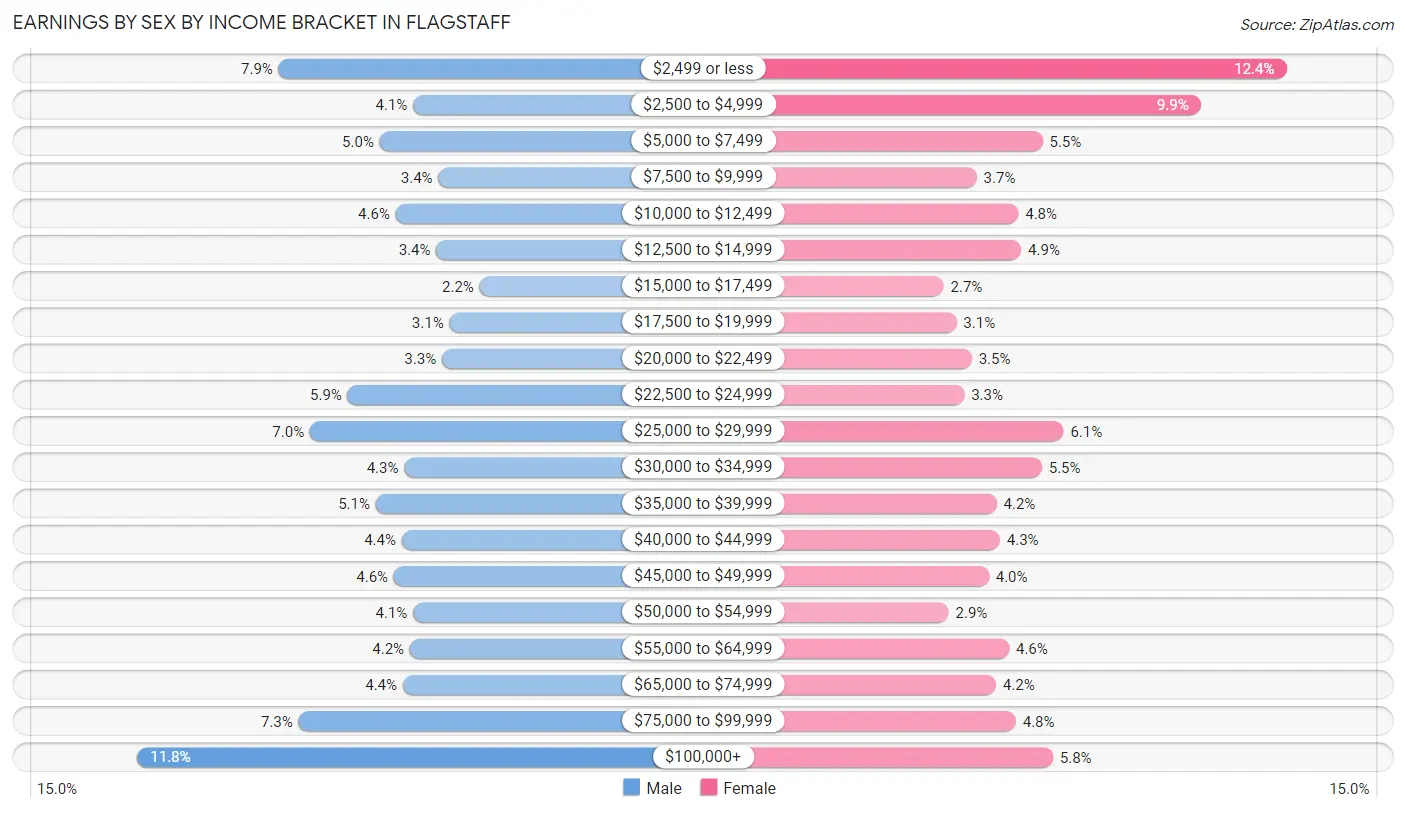
Earnings by Sex by Income Bracket in Flagstaff
The most common earnings brackets in Flagstaff are $100,000+ for men (2,853 | 11.8%) and $2,499 or less for women (2,878 | 12.3%).
| Income | Male | Female |
| $2,499 or less | 1,896 (7.9%) | 2,878 (12.3%) |
| $2,500 to $4,999 | 984 (4.1%) | 2,317 (9.9%) |
| $5,000 to $7,499 | 1,211 (5.0%) | 1,281 (5.5%) |
| $7,500 to $9,999 | 812 (3.4%) | 850 (3.6%) |
| $10,000 to $12,499 | 1,103 (4.6%) | 1,123 (4.8%) |
| $12,500 to $14,999 | 827 (3.4%) | 1,142 (4.9%) |
| $15,000 to $17,499 | 532 (2.2%) | 633 (2.7%) |
| $17,500 to $19,999 | 739 (3.1%) | 718 (3.1%) |
| $20,000 to $22,499 | 788 (3.3%) | 819 (3.5%) |
| $22,500 to $24,999 | 1,428 (5.9%) | 769 (3.3%) |
| $25,000 to $29,999 | 1,683 (7.0%) | 1,420 (6.1%) |
| $30,000 to $34,999 | 1,044 (4.3%) | 1,276 (5.5%) |
| $35,000 to $39,999 | 1,238 (5.1%) | 982 (4.2%) |
| $40,000 to $44,999 | 1,060 (4.4%) | 1,002 (4.3%) |
| $45,000 to $49,999 | 1,115 (4.6%) | 930 (4.0%) |
| $50,000 to $54,999 | 983 (4.1%) | 667 (2.9%) |
| $55,000 to $64,999 | 1,006 (4.2%) | 1,062 (4.6%) |
| $65,000 to $74,999 | 1,054 (4.4%) | 977 (4.2%) |
| $75,000 to $99,999 | 1,761 (7.3%) | 1,106 (4.8%) |
| $100,000+ | 2,853 (11.8%) | 1,350 (5.8%) |
| Total | 24,117 (100.0%) | 23,302 (100.0%) |
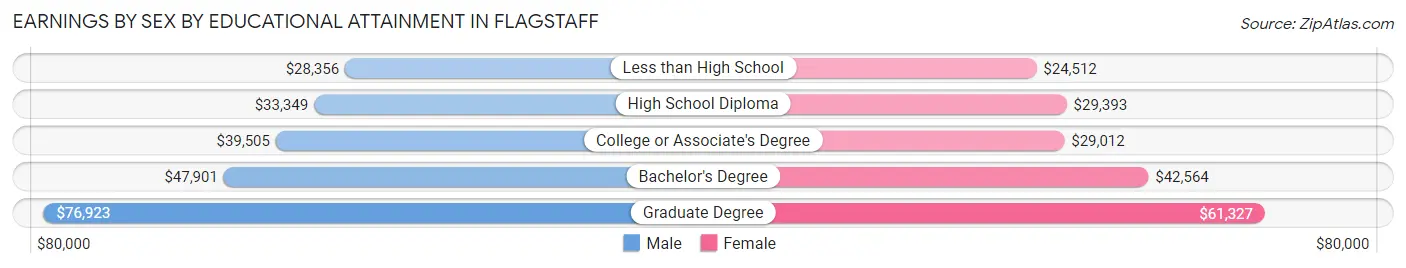
Earnings by Sex by Educational Attainment in Flagstaff
Average earnings in Flagstaff are $46,280 for men and $40,610 for women, a difference of 12.2%. Men with an educational attainment of graduate degree enjoy the highest average annual earnings of $76,923, while those with less than high school education earn the least with $28,356. Women with an educational attainment of graduate degree earn the most with the average annual earnings of $61,327, while those with less than high school education have the smallest earnings of $24,512.
| Educational Attainment | Male Income | Female Income |
| Less than High School | $28,356 | $24,512 |
| High School Diploma | $33,349 | $29,393 |
| College or Associate's Degree | $39,505 | $29,012 |
| Bachelor's Degree | $47,901 | $42,564 |
| Graduate Degree | $76,923 | $61,327 |
| Total | $46,280 | $40,610 |
Family Income in Flagstaff
Family Income Brackets in Flagstaff
According to the Flagstaff family income data, there are 3,014 families falling into the $100,000 to $149,999 income range, which is the most common income bracket and makes up 21.8% of all families. Conversely, the $10,000 to $14,999 income bracket is the least frequent group with only 180 families (1.3%) belonging to this category.
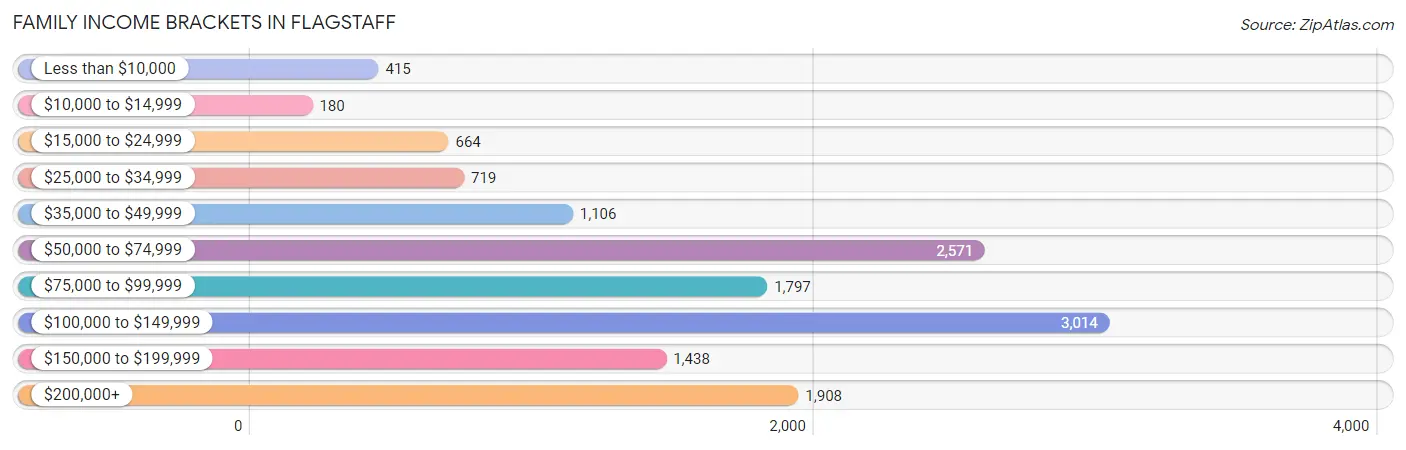
| Income Bracket | # Families | % Families |
| Less than $10,000 | 415 | 3.0% |
| $10,000 to $14,999 | 180 | 1.3% |
| $15,000 to $24,999 | 664 | 4.8% |
| $25,000 to $34,999 | 719 | 5.2% |
| $35,000 to $49,999 | 1,106 | 8.0% |
| $50,000 to $74,999 | 2,571 | 18.6% |
| $75,000 to $99,999 | 1,797 | 13.0% |
| $100,000 to $149,999 | 3,014 | 21.8% |
| $150,000 to $199,999 | 1,438 | 10.4% |
| $200,000+ | 1,908 | 13.8% |
Family Income by Famaliy Size in Flagstaff
5-person families (947 | 6.9%) account for the highest median family income in Flagstaff with $134,401 per family, while 2-person families (7,121 | 51.5%) have the highest median income of $38,218 per family member.
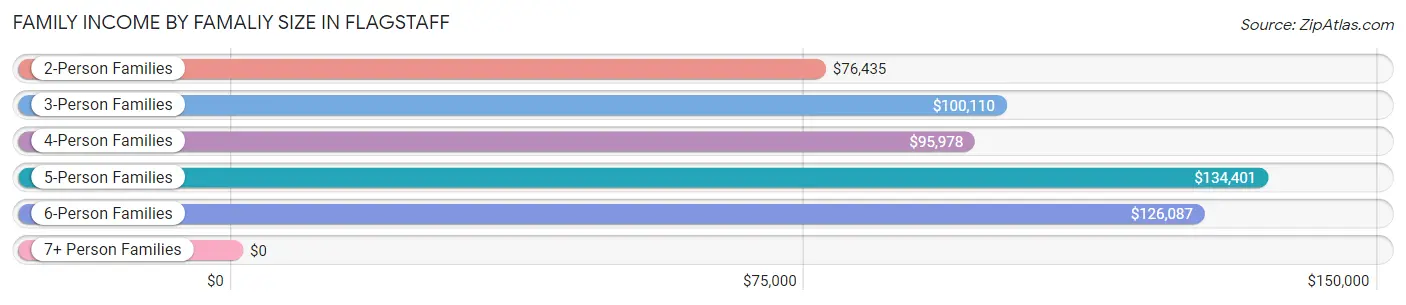
| Income Bracket | # Families | Median Income |
| 2-Person Families | 7,121 (51.5%) | $76,435 |
| 3-Person Families | 2,431 (17.6%) | $100,110 |
| 4-Person Families | 2,768 (20.0%) | $95,978 |
| 5-Person Families | 947 (6.9%) | $134,401 |
| 6-Person Families | 304 (2.2%) | $126,087 |
| 7+ Person Families | 253 (1.8%) | $0 |
| Total | 13,824 (100.0%) | $89,827 |
Family Income by Number of Earners in Flagstaff
The median family income in Flagstaff is $89,827, with families comprising 3+ earners (1,482) having the highest median family income of $146,849, while families with 1 earner (4,325) have the lowest median family income of $63,858, accounting for 10.7% and 31.3% of families, respectively.
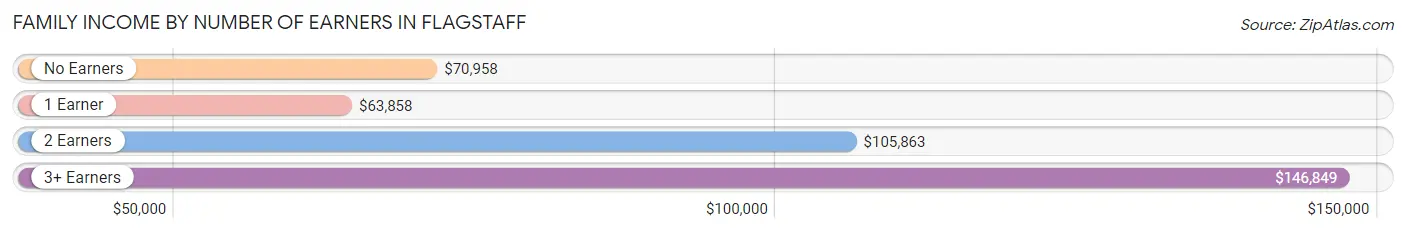
| Number of Earners | # Families | Median Income |
| No Earners | 1,510 (10.9%) | $70,958 |
| 1 Earner | 4,325 (31.3%) | $63,858 |
| 2 Earners | 6,507 (47.1%) | $105,863 |
| 3+ Earners | 1,482 (10.7%) | $146,849 |
| Total | 13,824 (100.0%) | $89,827 |
Household Income in Flagstaff
Household Income Brackets in Flagstaff
With 5,304 households falling in the category, the $50,000 to $74,999 income range is the most frequent in Flagstaff, accounting for 19.6% of all households. In contrast, only 1,272 households (4.7%) fall into the $10,000 to $14,999 income bracket, making it the least populous group.
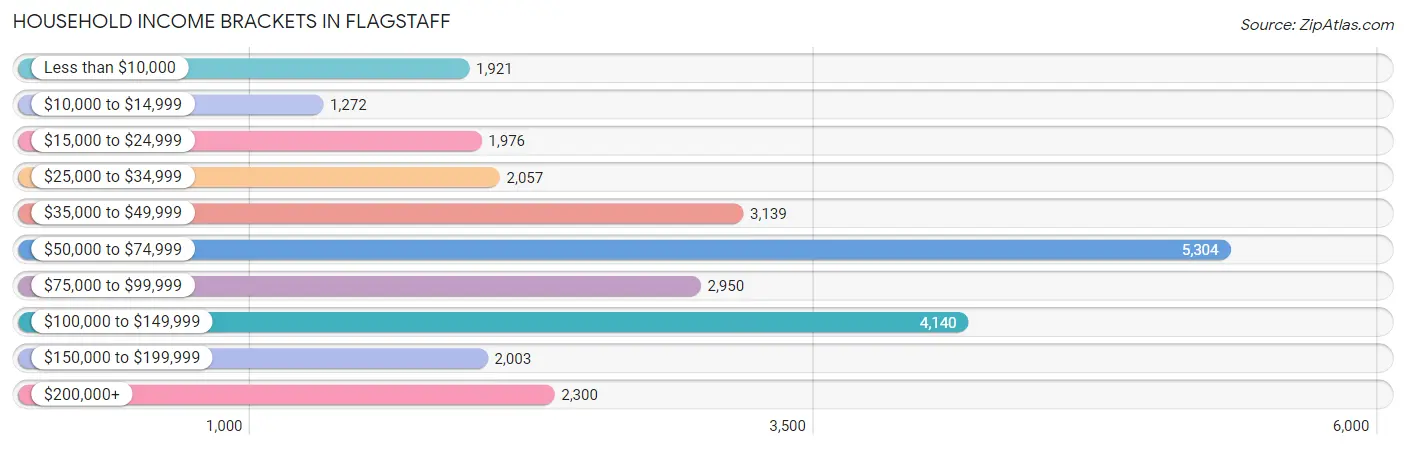
| Income Bracket | # Households | % Households |
| Less than $10,000 | 1,921 | 7.1% |
| $10,000 to $14,999 | 1,272 | 4.7% |
| $15,000 to $24,999 | 1,976 | 7.3% |
| $25,000 to $34,999 | 2,057 | 7.6% |
| $35,000 to $49,999 | 3,139 | 11.6% |
| $50,000 to $74,999 | 5,304 | 19.6% |
| $75,000 to $99,999 | 2,950 | 10.9% |
| $100,000 to $149,999 | 4,140 | 15.3% |
| $150,000 to $199,999 | 2,003 | 7.4% |
| $200,000+ | 2,300 | 8.5% |
Household Income by Householder Age in Flagstaff
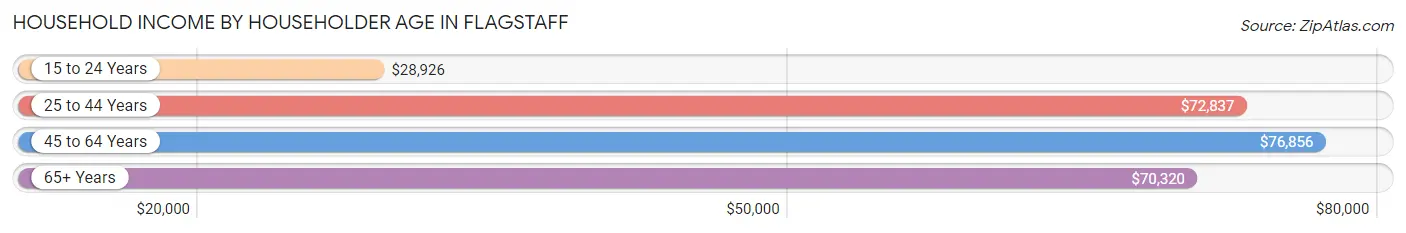
The median household income in Flagstaff is $65,652, with the highest median household income of $76,856 found in the 45 to 64 years age bracket for the primary householder. A total of 7,402 households (27.4%) fall into this category. Meanwhile, the 15 to 24 years age bracket for the primary householder has the lowest median household income of $28,926, with 4,804 households (17.7%) in this group.
| Income Bracket | # Households | Median Income |
| 15 to 24 Years | 4,804 (17.7%) | $28,926 |
| 25 to 44 Years | 10,497 (38.8%) | $72,837 |
| 45 to 64 Years | 7,402 (27.4%) | $76,856 |
| 65+ Years | 4,359 (16.1%) | $70,320 |
| Total | 27,062 (100.0%) | $65,652 |
Poverty in Flagstaff
Income Below Poverty by Sex and Age in Flagstaff
With 16.3% poverty level for males and 21.7% for females among the residents of Flagstaff, 18 to 24 year old males and 18 to 24 year old females are the most vulnerable to poverty, with 2,824 males (40.8%) and 3,576 females (53.5%) in their respective age groups living below the poverty level.
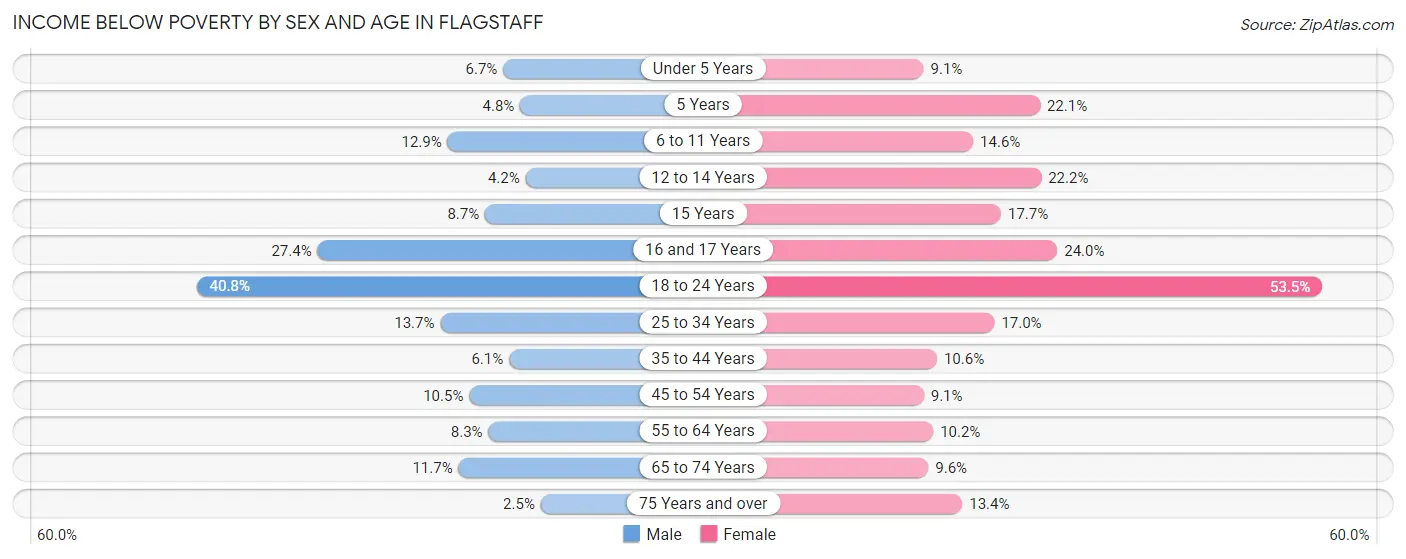
| Age Bracket | Male | Female |
| Under 5 Years | 103 (6.7%) | 137 (9.1%) |
| 5 Years | 31 (4.8%) | 81 (22.1%) |
| 6 to 11 Years | 304 (12.9%) | 316 (14.6%) |
| 12 to 14 Years | 46 (4.2%) | 207 (22.2%) |
| 15 Years | 56 (8.7%) | 58 (17.7%) |
| 16 and 17 Years | 230 (27.4%) | 138 (24.0%) |
| 18 to 24 Years | 2,824 (40.8%) | 3,576 (53.5%) |
| 25 to 34 Years | 834 (13.7%) | 840 (17.0%) |
| 35 to 44 Years | 271 (6.0%) | 413 (10.6%) |
| 45 to 54 Years | 339 (10.5%) | 276 (9.1%) |
| 55 to 64 Years | 256 (8.3%) | 316 (10.2%) |
| 65 to 74 Years | 267 (11.7%) | 232 (9.6%) |
| 75 Years and over | 25 (2.5%) | 150 (13.4%) |
| Total | 5,586 (16.3%) | 6,740 (21.7%) |
Income Above Poverty by Sex and Age in Flagstaff
According to the poverty statistics in Flagstaff, males aged 75 years and over and females aged under 5 years are the age groups that are most secure financially, with 97.5% of males and 90.9% of females in these age groups living above the poverty line.
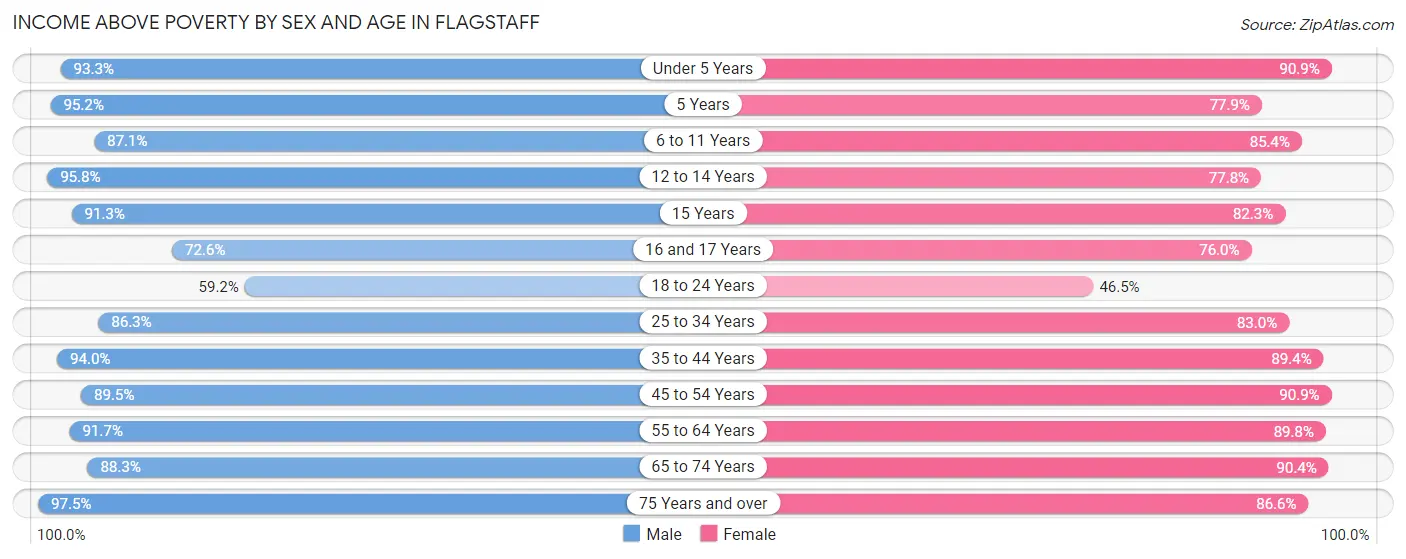
| Age Bracket | Male | Female |
| Under 5 Years | 1,435 (93.3%) | 1,367 (90.9%) |
| 5 Years | 614 (95.2%) | 286 (77.9%) |
| 6 to 11 Years | 2,052 (87.1%) | 1,844 (85.4%) |
| 12 to 14 Years | 1,047 (95.8%) | 725 (77.8%) |
| 15 Years | 586 (91.3%) | 269 (82.3%) |
| 16 and 17 Years | 610 (72.6%) | 437 (76.0%) |
| 18 to 24 Years | 4,091 (59.2%) | 3,111 (46.5%) |
| 25 to 34 Years | 5,255 (86.3%) | 4,102 (83.0%) |
| 35 to 44 Years | 4,208 (94.0%) | 3,483 (89.4%) |
| 45 to 54 Years | 2,897 (89.5%) | 2,748 (90.9%) |
| 55 to 64 Years | 2,812 (91.7%) | 2,787 (89.8%) |
| 65 to 74 Years | 2,018 (88.3%) | 2,174 (90.4%) |
| 75 Years and over | 968 (97.5%) | 968 (86.6%) |
| Total | 28,593 (83.7%) | 24,301 (78.3%) |
Income Below Poverty Among Married-Couple Families in Flagstaff
The poverty statistics for married-couple families in Flagstaff show that 2.8% or 291 of the total 10,354 families live below the poverty line. Families with 1 or 2 children have the highest poverty rate of 3.9%, comprising of 142 families. On the other hand, families with 3 or 4 children have the lowest poverty rate of 0.0%, which includes 0 families.
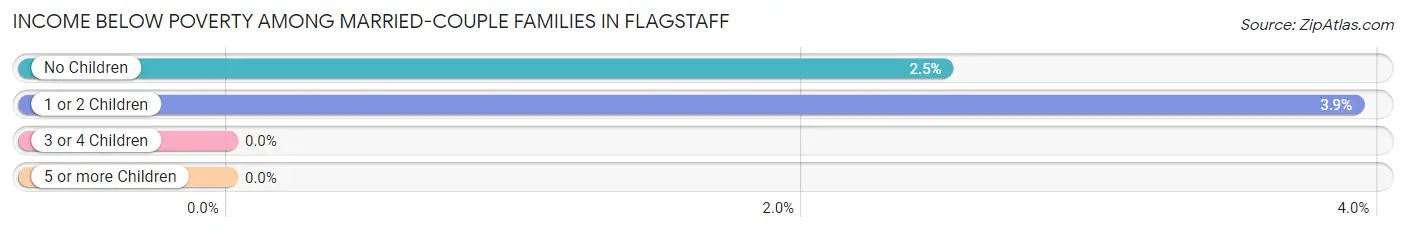
| Children | Above Poverty | Below Poverty |
| No Children | 5,843 (97.5%) | 149 (2.5%) |
| 1 or 2 Children | 3,479 (96.1%) | 142 (3.9%) |
| 3 or 4 Children | 683 (100.0%) | 0 (0.0%) |
| 5 or more Children | 58 (100.0%) | 0 (0.0%) |
| Total | 10,063 (97.2%) | 291 (2.8%) |
Income Below Poverty Among Single-Parent Households in Flagstaff
According to the poverty data in Flagstaff, 6.9% or 82 single-father households and 27.3% or 622 single-mother households are living below the poverty line. Among single-father households, those with no children have the highest poverty rate, with 64 households (9.3%) experiencing poverty. Likewise, among single-mother households, those with 5 or more children have the highest poverty rate, with 37 households (45.1%) falling below the poverty line.
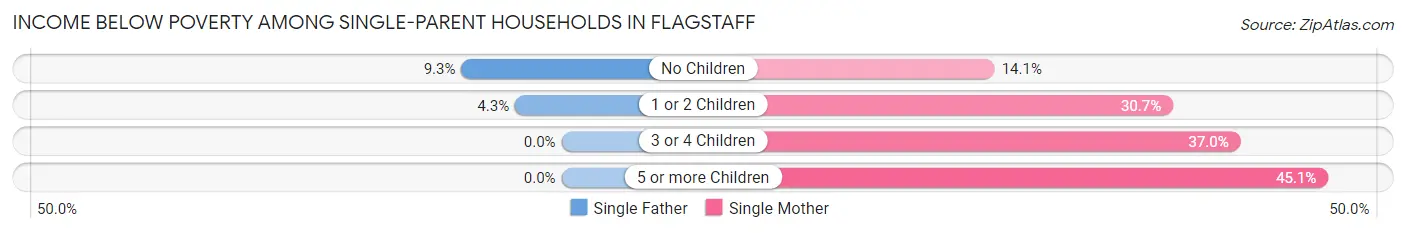
| Children | Single Father | Single Mother |
| No Children | 64 (9.3%) | 102 (14.1%) |
| 1 or 2 Children | 18 (4.3%) | 296 (30.7%) |
| 3 or 4 Children | 0 (0.0%) | 187 (37.0%) |
| 5 or more Children | 0 (0.0%) | 37 (45.1%) |
| Total | 82 (6.9%) | 622 (27.3%) |
Income Below Poverty Among Married-Couple vs Single-Parent Households in Flagstaff
The poverty data for Flagstaff shows that 291 of the married-couple family households (2.8%) and 704 of the single-parent households (20.3%) are living below the poverty level. Within the married-couple family households, those with 1 or 2 children have the highest poverty rate, with 142 households (3.9%) falling below the poverty line. Among the single-parent households, those with 5 or more children have the highest poverty rate, with 37 household (45.1%) living below poverty.
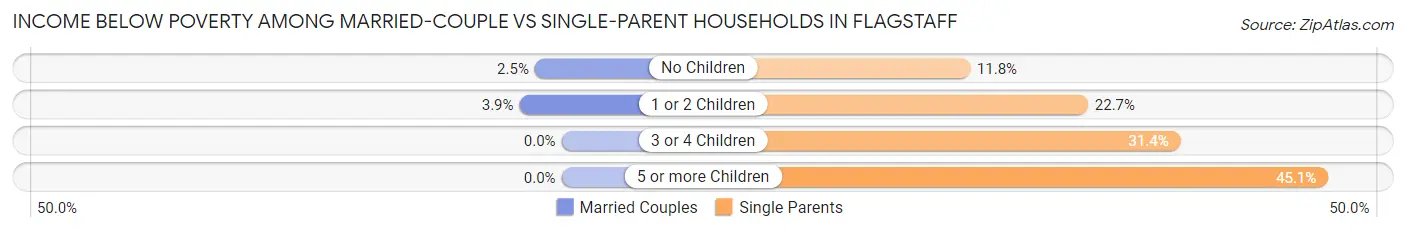
| Children | Married-Couple Families | Single-Parent Households |
| No Children | 149 (2.5%) | 166 (11.8%) |
| 1 or 2 Children | 142 (3.9%) | 314 (22.7%) |
| 3 or 4 Children | 0 (0.0%) | 187 (31.4%) |
| 5 or more Children | 0 (0.0%) | 37 (45.1%) |
| Total | 291 (2.8%) | 704 (20.3%) |
Race in Flagstaff
The most populous races in Flagstaff are White / Caucasian (52,570 | 69.0%), Hispanic or Latino (14,587 | 19.2%), and Native / Alaskan (7,616 | 10.0%).
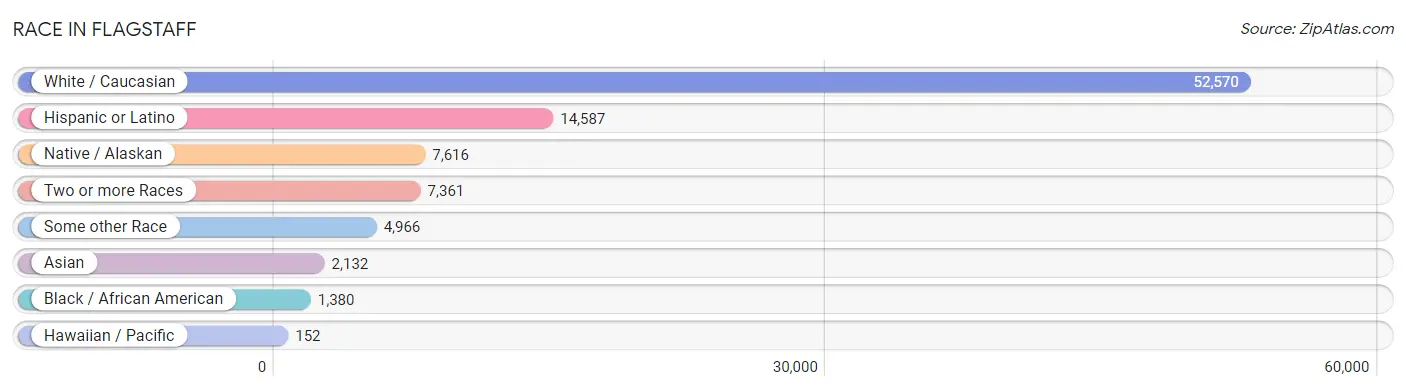
| Race | # Population | % Population |
| Asian | 2,132 | 2.8% |
| Black / African American | 1,380 | 1.8% |
| Hawaiian / Pacific | 152 | 0.2% |
| Hispanic or Latino | 14,587 | 19.2% |
| Native / Alaskan | 7,616 | 10.0% |
| White / Caucasian | 52,570 | 69.0% |
| Two or more Races | 7,361 | 9.7% |
| Some other Race | 4,966 | 6.5% |
| Total | 76,177 | 100.0% |
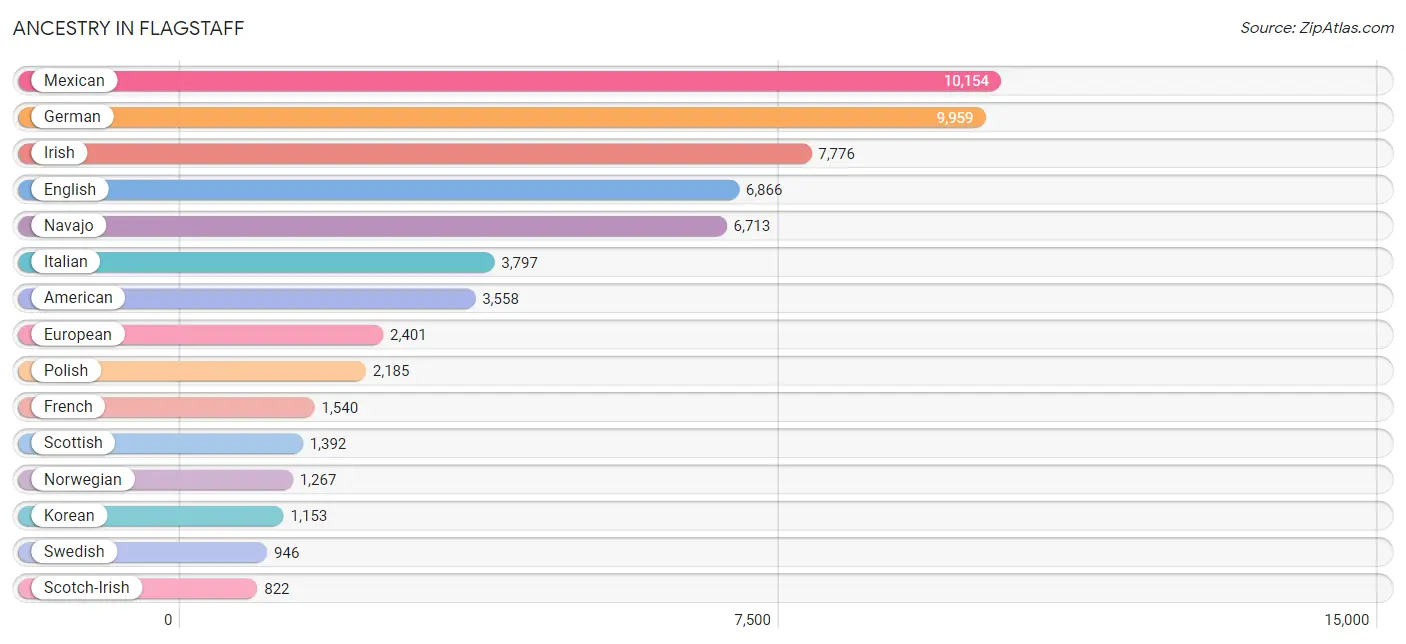
Ancestry in Flagstaff
The most populous ancestries reported in Flagstaff are Mexican (10,154 | 13.3%), German (9,959 | 13.1%), Irish (7,776 | 10.2%), English (6,866 | 9.0%), and Navajo (6,713 | 8.8%), together accounting for 54.4% of all Flagstaff residents.
| Ancestry | # Population | % Population |
| Afghan | 38 | 0.1% |
| African | 69 | 0.1% |
| Alaska Native | 9 | 0.0% |
| Alaskan Athabascan | 53 | 0.1% |
| Albanian | 19 | 0.0% |
| American | 3,558 | 4.7% |
| Apache | 327 | 0.4% |
| Arab | 270 | 0.4% |
| Argentinean | 16 | 0.0% |
| Armenian | 83 | 0.1% |
| Assyrian / Chaldean / Syriac | 5 | 0.0% |
| Australian | 9 | 0.0% |
| Austrian | 157 | 0.2% |
| Basque | 9 | 0.0% |
| Belgian | 46 | 0.1% |
| Bhutanese | 492 | 0.6% |
| Blackfeet | 92 | 0.1% |
| Bolivian | 8 | 0.0% |
| Brazilian | 98 | 0.1% |
| British | 621 | 0.8% |
| Burmese | 404 | 0.5% |
| Canadian | 182 | 0.2% |
| Central American | 437 | 0.6% |
| Central American Indian | 169 | 0.2% |
| Cherokee | 335 | 0.4% |
| Chilean | 31 | 0.0% |
| Chippewa | 141 | 0.2% |
| Choctaw | 155 | 0.2% |
| Colombian | 293 | 0.4% |
| Creek | 29 | 0.0% |
| Croatian | 36 | 0.1% |
| Cuban | 276 | 0.4% |
| Czech | 334 | 0.4% |
| Czechoslovakian | 83 | 0.1% |
| Danish | 305 | 0.4% |
| Dominican | 95 | 0.1% |
| Dutch | 697 | 0.9% |
| Eastern European | 313 | 0.4% |
| Ecuadorian | 15 | 0.0% |
| English | 6,866 | 9.0% |
| European | 2,401 | 3.2% |
| Filipino | 43 | 0.1% |
| Finnish | 352 | 0.5% |
| French | 1,540 | 2.0% |
| French Canadian | 321 | 0.4% |
| German | 9,959 | 13.1% |
| Greek | 172 | 0.2% |
| Guamanian / Chamorro | 74 | 0.1% |
| Guatemalan | 171 | 0.2% |
| Haitian | 59 | 0.1% |
| Honduran | 108 | 0.1% |
| Hopi | 757 | 1.0% |
| Hungarian | 199 | 0.3% |
| Indian (Asian) | 618 | 0.8% |
| Iranian | 74 | 0.1% |
| Irish | 7,776 | 10.2% |
| Iroquois | 3 | 0.0% |
| Israeli | 31 | 0.0% |
| Italian | 3,797 | 5.0% |
| Jamaican | 119 | 0.2% |
| Jordanian | 29 | 0.0% |
| Kenyan | 19 | 0.0% |
| Korean | 1,153 | 1.5% |
| Laotian | 34 | 0.0% |
| Latvian | 35 | 0.1% |
| Lebanese | 82 | 0.1% |
| Lithuanian | 99 | 0.1% |
| Macedonian | 8 | 0.0% |
| Malaysian | 9 | 0.0% |
| Mexican | 10,154 | 13.3% |
| Mexican American Indian | 200 | 0.3% |
| Mongolian | 13 | 0.0% |
| Native Hawaiian | 175 | 0.2% |
| Navajo | 6,713 | 8.8% |
| Nicaraguan | 21 | 0.0% |
| Nigerian | 30 | 0.0% |
| Northern European | 201 | 0.3% |
| Norwegian | 1,267 | 1.7% |
| Paiute | 8 | 0.0% |
| Pakistani | 80 | 0.1% |
| Panamanian | 91 | 0.1% |
| Pennsylvania German | 15 | 0.0% |
| Peruvian | 197 | 0.3% |
| Polish | 2,185 | 2.9% |
| Portuguese | 223 | 0.3% |
| Potawatomi | 17 | 0.0% |
| Pueblo | 267 | 0.4% |
| Puerto Rican | 344 | 0.4% |
| Romanian | 110 | 0.1% |
| Russian | 541 | 0.7% |
| Salvadoran | 46 | 0.1% |
| Samoan | 112 | 0.2% |
| Scandinavian | 365 | 0.5% |
| Scotch-Irish | 822 | 1.1% |
| Scottish | 1,392 | 1.8% |
| Serbian | 35 | 0.1% |
| Sierra Leonean | 3 | 0.0% |
| Sioux | 125 | 0.2% |
| Slavic | 61 | 0.1% |
| Slovak | 169 | 0.2% |
| Somali | 32 | 0.0% |
| South African | 34 | 0.0% |
| South American | 634 | 0.8% |
| South American Indian | 501 | 0.7% |
| Spaniard | 310 | 0.4% |
| Spanish | 768 | 1.0% |
| Sri Lankan | 156 | 0.2% |
| Subsaharan African | 195 | 0.3% |
| Swedish | 946 | 1.2% |
| Swiss | 204 | 0.3% |
| Thai | 474 | 0.6% |
| Tohono O'Odham | 66 | 0.1% |
| Ugandan | 8 | 0.0% |
| Ukrainian | 250 | 0.3% |
| Ute | 10 | 0.0% |
| Venezuelan | 74 | 0.1% |
| Welsh | 577 | 0.8% |
| West Indian | 72 | 0.1% |
| Yaqui | 26 | 0.0% |
| Yugoslavian | 42 | 0.1% |
| Yuman | 73 | 0.1% |
| Yup'ik | 15 | 0.0% | View All 122 Rows |
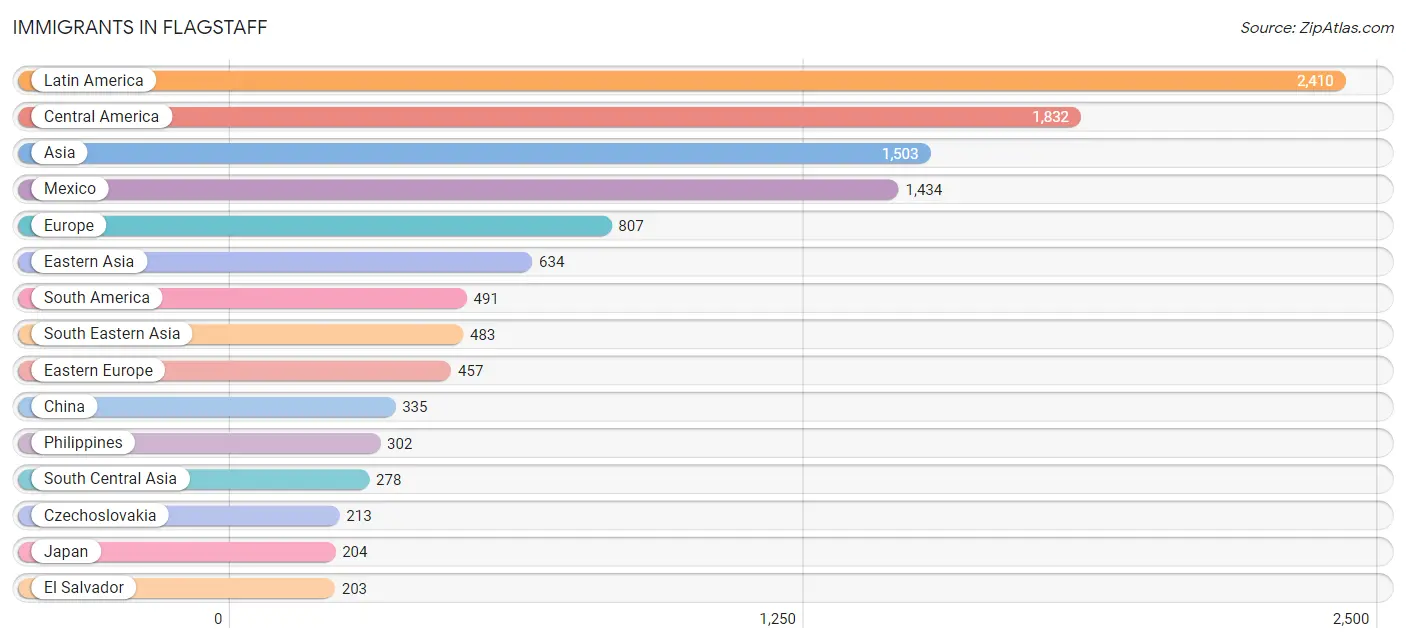
Immigrants in Flagstaff
The most numerous immigrant groups reported in Flagstaff came from Latin America (2,410 | 3.2%), Central America (1,832 | 2.4%), Asia (1,503 | 2.0%), Mexico (1,434 | 1.9%), and Europe (807 | 1.1%), together accounting for 10.5% of all Flagstaff residents.
| Immigration Origin | # Population | % Population |
| Afghanistan | 18 | 0.0% |
| Africa | 96 | 0.1% |
| Asia | 1,503 | 2.0% |
| Australia | 10 | 0.0% |
| Belgium | 21 | 0.0% |
| Bolivia | 16 | 0.0% |
| Brazil | 119 | 0.2% |
| Canada | 187 | 0.3% |
| Caribbean | 87 | 0.1% |
| Central America | 1,832 | 2.4% |
| Chile | 31 | 0.0% |
| China | 335 | 0.4% |
| Colombia | 152 | 0.2% |
| Cuba | 5 | 0.0% |
| Czechoslovakia | 213 | 0.3% |
| Denmark | 1 | 0.0% |
| Eastern Africa | 56 | 0.1% |
| Eastern Asia | 634 | 0.8% |
| Eastern Europe | 457 | 0.6% |
| Ecuador | 15 | 0.0% |
| Egypt | 6 | 0.0% |
| El Salvador | 203 | 0.3% |
| England | 20 | 0.0% |
| Ethiopia | 32 | 0.0% |
| Europe | 807 | 1.1% |
| France | 70 | 0.1% |
| Germany | 54 | 0.1% |
| Guatemala | 169 | 0.2% |
| Haiti | 8 | 0.0% |
| Hong Kong | 15 | 0.0% |
| India | 112 | 0.2% |
| Iran | 19 | 0.0% |
| Ireland | 41 | 0.1% |
| Italy | 15 | 0.0% |
| Jamaica | 27 | 0.0% |
| Japan | 204 | 0.3% |
| Kenya | 11 | 0.0% |
| Korea | 95 | 0.1% |
| Latin America | 2,410 | 3.2% |
| Lebanon | 11 | 0.0% |
| Mexico | 1,434 | 1.9% |
| Middle Africa | 8 | 0.0% |
| Moldova | 14 | 0.0% |
| Nepal | 14 | 0.0% |
| Netherlands | 27 | 0.0% |
| Northern Africa | 6 | 0.0% |
| Northern Europe | 144 | 0.2% |
| Oceania | 17 | 0.0% |
| Pakistan | 62 | 0.1% |
| Panama | 26 | 0.0% |
| Peru | 150 | 0.2% |
| Philippines | 302 | 0.4% |
| Poland | 38 | 0.1% |
| Romania | 37 | 0.1% |
| Russia | 90 | 0.1% |
| Saudi Arabia | 97 | 0.1% |
| Scotland | 6 | 0.0% |
| Serbia | 17 | 0.0% |
| Sierra Leone | 3 | 0.0% |
| South Africa | 23 | 0.0% |
| South America | 491 | 0.6% |
| South Central Asia | 278 | 0.4% |
| South Eastern Asia | 483 | 0.6% |
| Southern Europe | 34 | 0.0% |
| Spain | 19 | 0.0% |
| Sri Lanka | 53 | 0.1% |
| Sweden | 32 | 0.0% |
| Taiwan | 11 | 0.0% |
| Thailand | 80 | 0.1% |
| Trinidad and Tobago | 47 | 0.1% |
| Ukraine | 48 | 0.1% |
| Uruguay | 8 | 0.0% |
| Vietnam | 101 | 0.1% |
| Western Africa | 3 | 0.0% |
| Western Asia | 108 | 0.1% |
| Western Europe | 172 | 0.2% |
| Zimbabwe | 7 | 0.0% | View All 77 Rows |
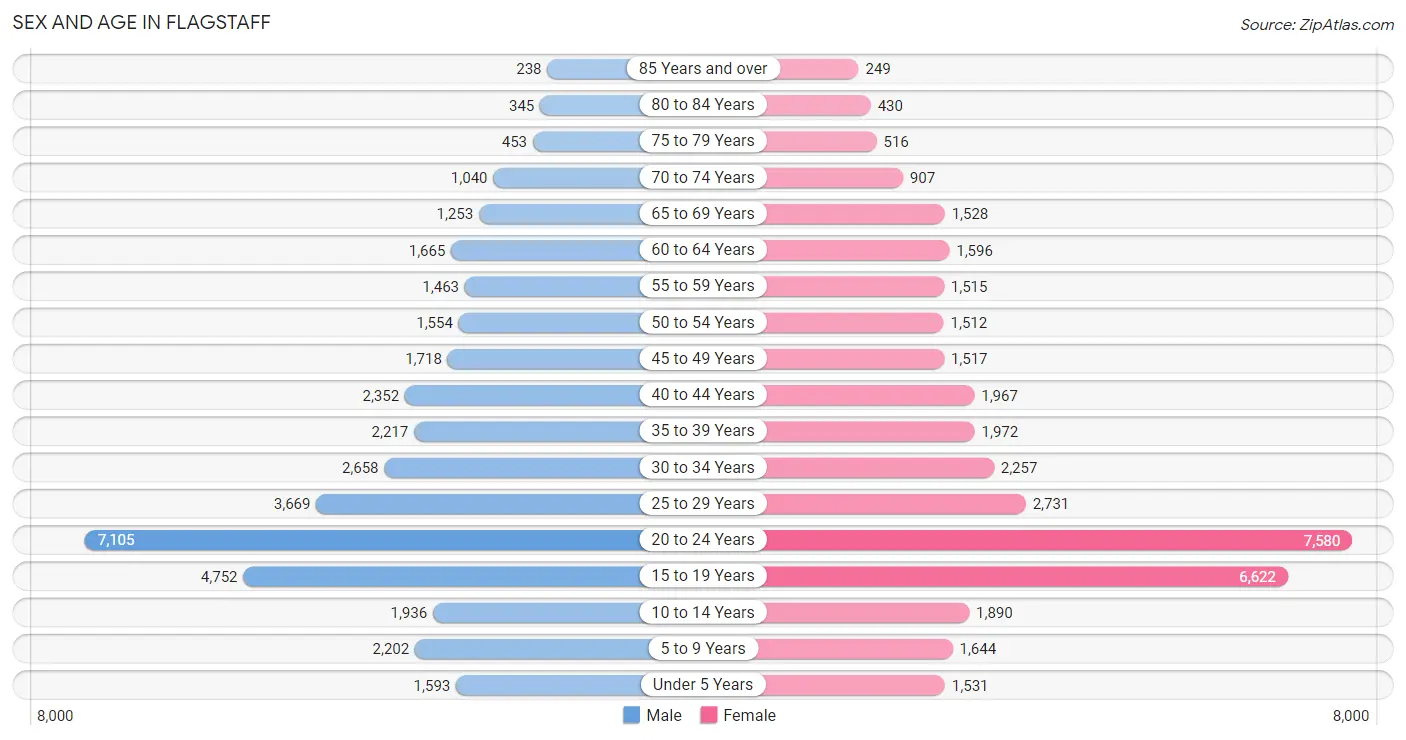
Sex and Age in Flagstaff
Sex and Age in Flagstaff
The most populous age groups in Flagstaff are 20 to 24 Years (7,105 | 18.6%) for men and 20 to 24 Years (7,580 | 20.0%) for women.
| Age Bracket | Male | Female |
| Under 5 Years | 1,593 (4.2%) | 1,531 (4.0%) |
| 5 to 9 Years | 2,202 (5.8%) | 1,644 (4.3%) |
| 10 to 14 Years | 1,936 (5.1%) | 1,890 (5.0%) |
| 15 to 19 Years | 4,752 (12.4%) | 6,622 (17.4%) |
| 20 to 24 Years | 7,105 (18.6%) | 7,580 (20.0%) |
| 25 to 29 Years | 3,669 (9.6%) | 2,731 (7.2%) |
| 30 to 34 Years | 2,658 (7.0%) | 2,257 (5.9%) |
| 35 to 39 Years | 2,217 (5.8%) | 1,972 (5.2%) |
| 40 to 44 Years | 2,352 (6.1%) | 1,967 (5.2%) |
| 45 to 49 Years | 1,718 (4.5%) | 1,517 (4.0%) |
| 50 to 54 Years | 1,554 (4.1%) | 1,512 (4.0%) |
| 55 to 59 Years | 1,463 (3.8%) | 1,515 (4.0%) |
| 60 to 64 Years | 1,665 (4.4%) | 1,596 (4.2%) |
| 65 to 69 Years | 1,253 (3.3%) | 1,528 (4.0%) |
| 70 to 74 Years | 1,040 (2.7%) | 907 (2.4%) |
| 75 to 79 Years | 453 (1.2%) | 516 (1.4%) |
| 80 to 84 Years | 345 (0.9%) | 430 (1.1%) |
| 85 Years and over | 238 (0.6%) | 249 (0.7%) |
| Total | 38,213 (100.0%) | 37,964 (100.0%) |
Families and Households in Flagstaff
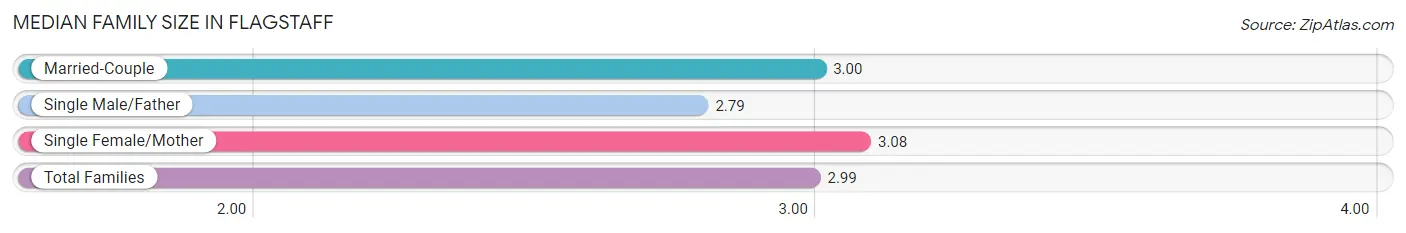
Median Family Size in Flagstaff
The median family size in Flagstaff is 2.99 persons per family, with single female/mother families (2,278 | 16.5%) accounting for the largest median family size of 3.08 persons per family. On the other hand, single male/father families (1,192 | 8.6%) represent the smallest median family size with 2.79 persons per family.
| Family Type | # Families | Family Size |
| Married-Couple | 10,354 (74.9%) | 3.00 |
| Single Male/Father | 1,192 (8.6%) | 2.79 |
| Single Female/Mother | 2,278 (16.5%) | 3.08 |
| Total Families | 13,824 (100.0%) | 2.99 |
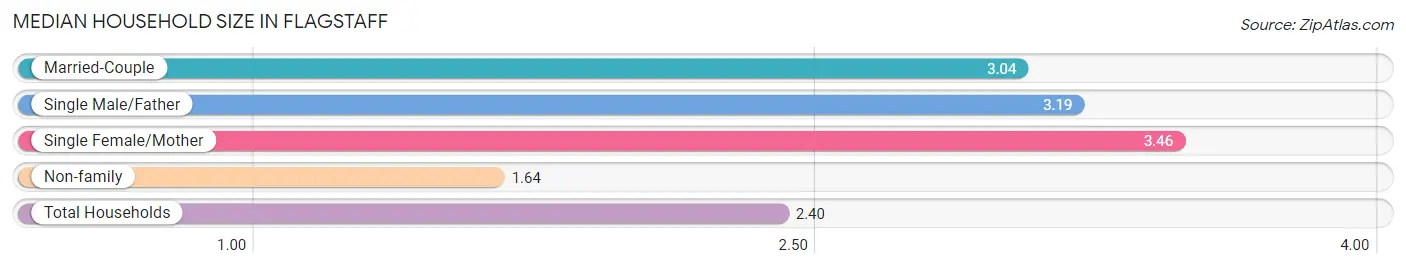
Median Household Size in Flagstaff
The median household size in Flagstaff is 2.40 persons per household, with single female/mother households (2,278 | 8.4%) accounting for the largest median household size of 3.46 persons per household. non-family households (13,238 | 48.9%) represent the smallest median household size with 1.64 persons per household.
| Household Type | # Households | Household Size |
| Married-Couple | 10,354 (38.3%) | 3.04 |
| Single Male/Father | 1,192 (4.4%) | 3.19 |
| Single Female/Mother | 2,278 (8.4%) | 3.46 |
| Non-family | 13,238 (48.9%) | 1.64 |
| Total Households | 27,062 (100.0%) | 2.40 |
Household Size by Marriage Status in Flagstaff
Out of a total of 27,062 households in Flagstaff, 13,824 (51.1%) are family households, while 13,238 (48.9%) are nonfamily households. The most numerous type of family households are 2-person households, comprising 6,315, and the most common type of nonfamily households are 1-person households, comprising 7,440.
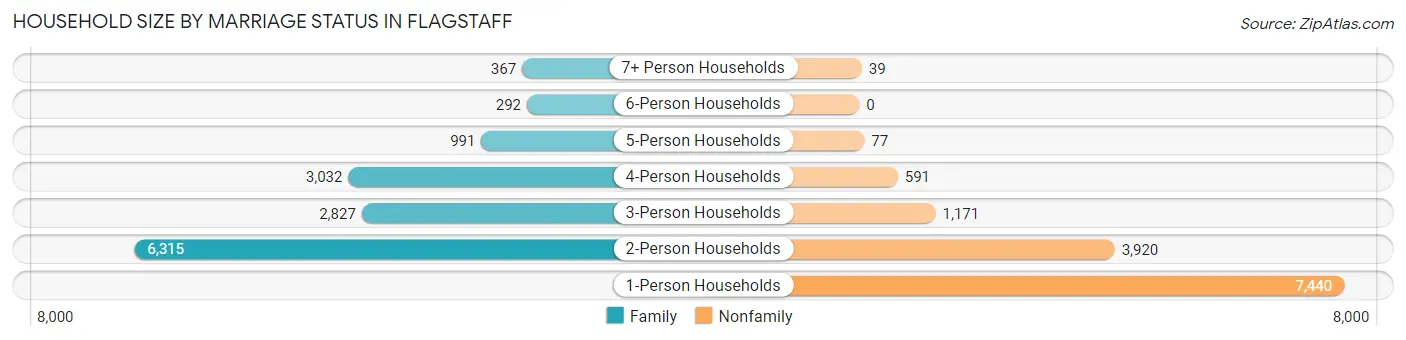
| Household Size | Family Households | Nonfamily Households |
| 1-Person Households | - | 7,440 (27.5%) |
| 2-Person Households | 6,315 (23.3%) | 3,920 (14.5%) |
| 3-Person Households | 2,827 (10.4%) | 1,171 (4.3%) |
| 4-Person Households | 3,032 (11.2%) | 591 (2.2%) |
| 5-Person Households | 991 (3.7%) | 77 (0.3%) |
| 6-Person Households | 292 (1.1%) | 0 (0.0%) |
| 7+ Person Households | 367 (1.4%) | 39 (0.1%) |
| Total | 13,824 (51.1%) | 13,238 (48.9%) |
Female Fertility in Flagstaff
Fertility by Age in Flagstaff
Average fertility rate in Flagstaff is 20.0 births per 1,000 women. Women in the age bracket of 20 to 34 years have the highest fertility rate with 30.0 births per 1,000 women. Women in the age bracket of 20 to 34 years acount for 76.3% of all women with births.
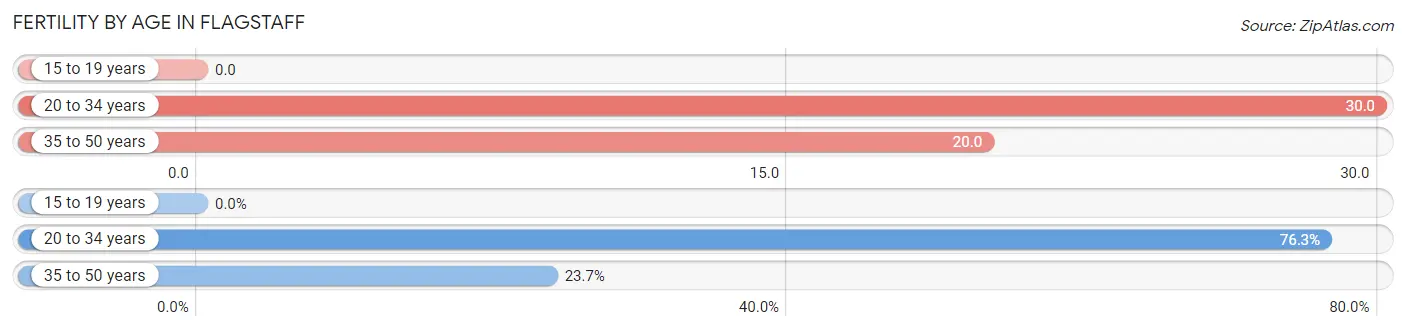
| Age Bracket | Women with Births | Births / 1,000 Women |
| 15 to 19 years | 0 (0.0%) | 0.0 |
| 20 to 34 years | 376 (76.3%) | 30.0 |
| 35 to 50 years | 117 (23.7%) | 20.0 |
| Total | 493 (100.0%) | 20.0 |
Fertility by Age by Marriage Status in Flagstaff
73.0% of women with births (493) in Flagstaff are married. The highest percentage of unmarried women with births falls into 20 to 34 years age bracket with 27.1% of them unmarried at the time of birth, while the lowest percentage of unmarried women with births belong to 35 to 50 years age bracket with 26.5% of them unmarried.
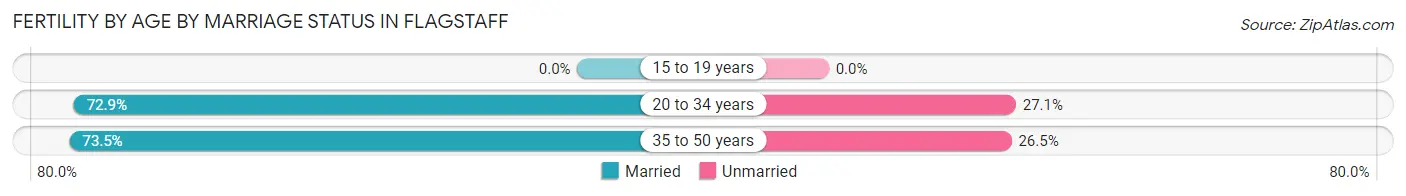
| Age Bracket | Married | Unmarried |
| 15 to 19 years | 0 (0.0%) | 0 (0.0%) |
| 20 to 34 years | 274 (72.9%) | 102 (27.1%) |
| 35 to 50 years | 86 (73.5%) | 31 (26.5%) |
| Total | 360 (73.0%) | 133 (27.0%) |
Fertility by Education in Flagstaff
Average fertility rate in Flagstaff is 20.0 births per 1,000 women. Women with the education attainment of graduate degree have the highest fertility rate of 46.0 births per 1,000 women, while women with the education attainment of less than high school have the lowest fertility at 6.0 births per 1,000 women. Women with the education attainment of bachelor's degree represent 40.2% of all women with births.
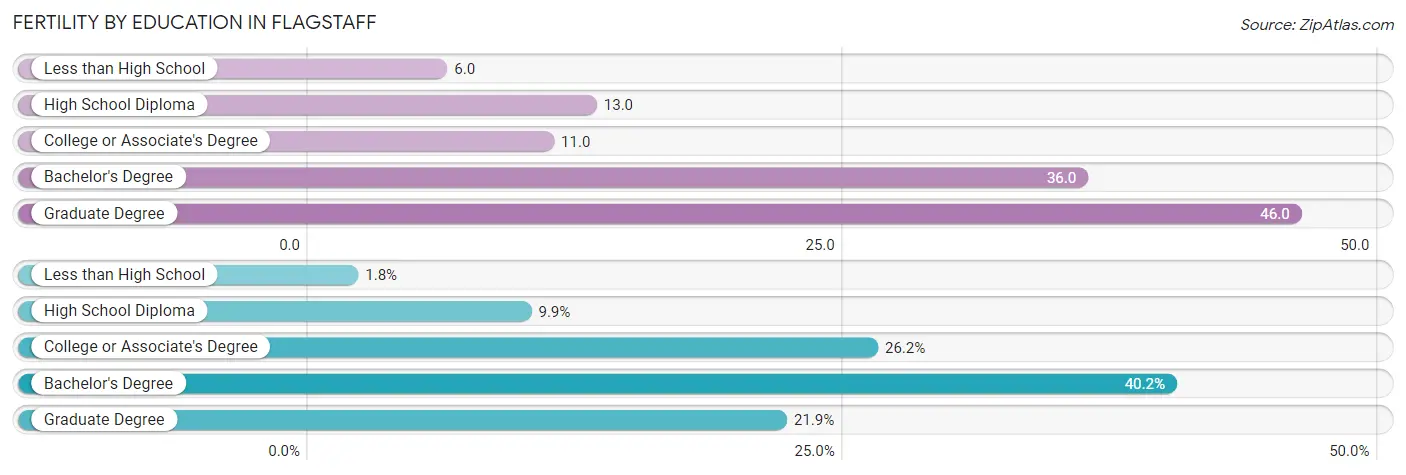
| Educational Attainment | Women with Births | Births / 1,000 Women |
| Less than High School | 9 (1.8%) | 6.0 |
| High School Diploma | 49 (9.9%) | 13.0 |
| College or Associate's Degree | 129 (26.2%) | 11.0 |
| Bachelor's Degree | 198 (40.2%) | 36.0 |
| Graduate Degree | 108 (21.9%) | 46.0 |
| Total | 493 (100.0%) | 20.0 |
Fertility by Education by Marriage Status in Flagstaff
27.0% of women with births in Flagstaff are unmarried. Women with the educational attainment of graduate degree are most likely to be married with 100.0% of them married at childbirth, while women with the educational attainment of less than high school are least likely to be married with 100.0% of them unmarried at childbirth.
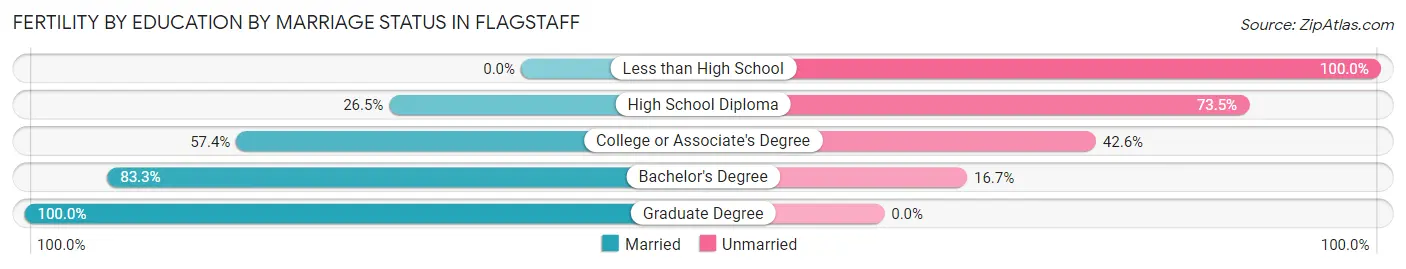
| Educational Attainment | Married | Unmarried |
| Less than High School | 0 (0.0%) | 9 (100.0%) |
| High School Diploma | 13 (26.5%) | 36 (73.5%) |
| College or Associate's Degree | 74 (57.4%) | 55 (42.6%) |
| Bachelor's Degree | 165 (83.3%) | 33 (16.7%) |
| Graduate Degree | 108 (100.0%) | 0 (0.0%) |
| Total | 360 (73.0%) | 133 (27.0%) |
Employment Characteristics in Flagstaff
Employment by Class of Employer in Flagstaff
Among the 38,047 employed individuals in Flagstaff, private company employees (22,640 | 59.5%), not-for-profit organizations (4,206 | 11.1%), and state government employees (4,078 | 10.7%) make up the most common classes of employment.
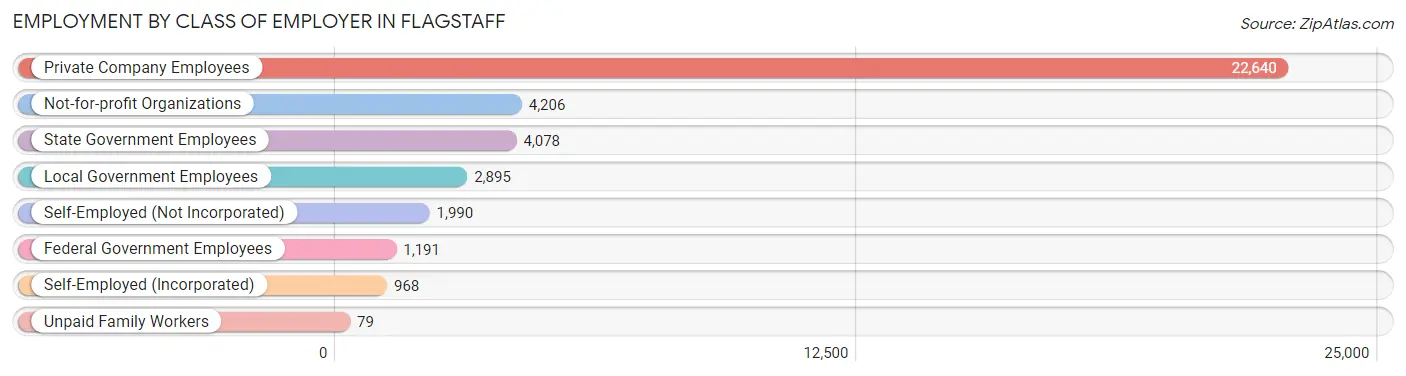
| Employer Class | # Employees | % Employees |
| Private Company Employees | 22,640 | 59.5% |
| Self-Employed (Incorporated) | 968 | 2.5% |
| Self-Employed (Not Incorporated) | 1,990 | 5.2% |
| Not-for-profit Organizations | 4,206 | 11.1% |
| Local Government Employees | 2,895 | 7.6% |
| State Government Employees | 4,078 | 10.7% |
| Federal Government Employees | 1,191 | 3.1% |
| Unpaid Family Workers | 79 | 0.2% |
| Total | 38,047 | 100.0% |
Employment Status by Age in Flagstaff
According to the labor force statistics for Flagstaff, out of the total population over 16 years of age (64,411), 65.5% or 42,189 individuals are in the labor force, with 6.6% or 2,784 of them unemployed. The age group with the highest labor force participation rate is 35 to 44 years, with 86.3% or 7,342 individuals in the labor force. Within the labor force, the 16 to 19 years age range has the highest percentage of unemployed individuals, with 22.9% or 960 of them being unemployed.
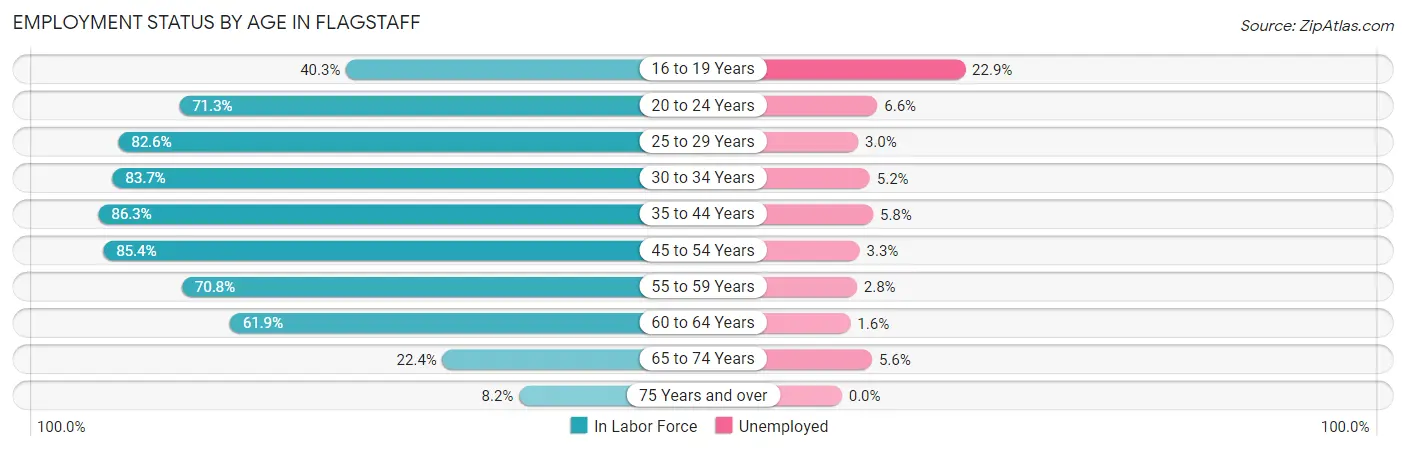
| Age Bracket | In Labor Force | Unemployed |
| 16 to 19 Years | 4,193 (40.3%) | 960 (22.9%) |
| 20 to 24 Years | 10,470 (71.3%) | 691 (6.6%) |
| 25 to 29 Years | 5,286 (82.6%) | 159 (3.0%) |
| 30 to 34 Years | 4,114 (83.7%) | 214 (5.2%) |
| 35 to 44 Years | 7,342 (86.3%) | 426 (5.8%) |
| 45 to 54 Years | 5,381 (85.4%) | 178 (3.3%) |
| 55 to 59 Years | 2,108 (70.8%) | 59 (2.8%) |
| 60 to 64 Years | 2,019 (61.9%) | 32 (1.6%) |
| 65 to 74 Years | 1,059 (22.4%) | 59 (5.6%) |
| 75 Years and over | 183 (8.2%) | 0 (0.0%) |
| Total | 42,189 (65.5%) | 2,784 (6.6%) |
Employment Status by Educational Attainment in Flagstaff
According to labor force statistics for Flagstaff, 81.1% of individuals (26,246) out of the total population between 25 and 64 years of age (32,363) are in the labor force, with 4.1% or 1,076 of them being unemployed. The group with the highest labor force participation rate are those with the educational attainment of bachelor's degree or higher, with 83.2% or 14,265 individuals in the labor force. Within the labor force, individuals with high school diploma education have the highest percentage of unemployment, with 5.3% or 184 of them being unemployed.
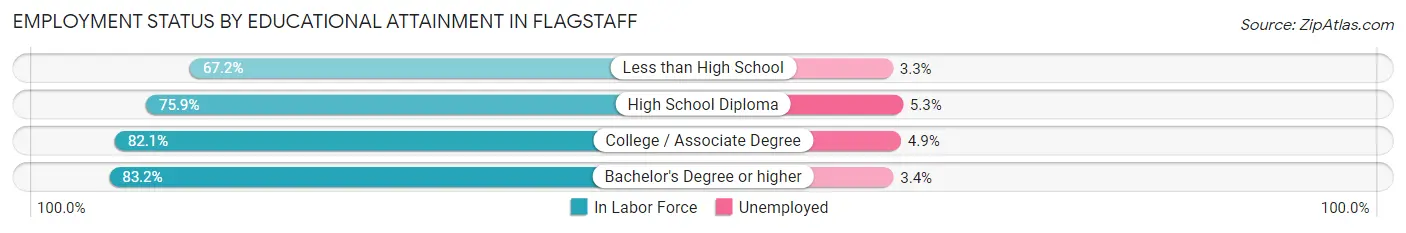
| Educational Attainment | In Labor Force | Unemployed |
| Less than High School | 1,054 (67.2%) | 52 (3.3%) |
| High School Diploma | 3,474 (75.9%) | 243 (5.3%) |
| College / Associate Degree | 7,448 (82.1%) | 445 (4.9%) |
| Bachelor's Degree or higher | 14,265 (83.2%) | 583 (3.4%) |
| Total | 26,246 (81.1%) | 1,327 (4.1%) |
Employment Occupations by Sex in Flagstaff
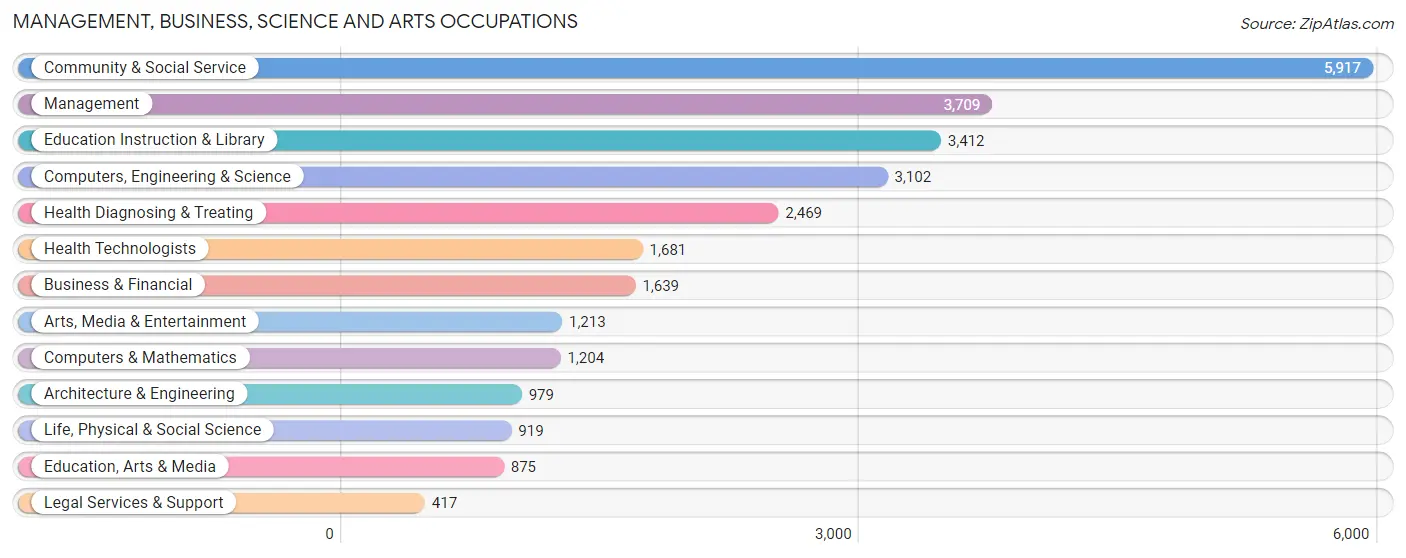
Management, Business, Science and Arts Occupations
The most common Management, Business, Science and Arts occupations in Flagstaff are Community & Social Service (5,917 | 15.0%), Management (3,709 | 9.4%), Education Instruction & Library (3,412 | 8.7%), Computers, Engineering & Science (3,102 | 7.9%), and Health Diagnosing & Treating (2,469 | 6.3%).
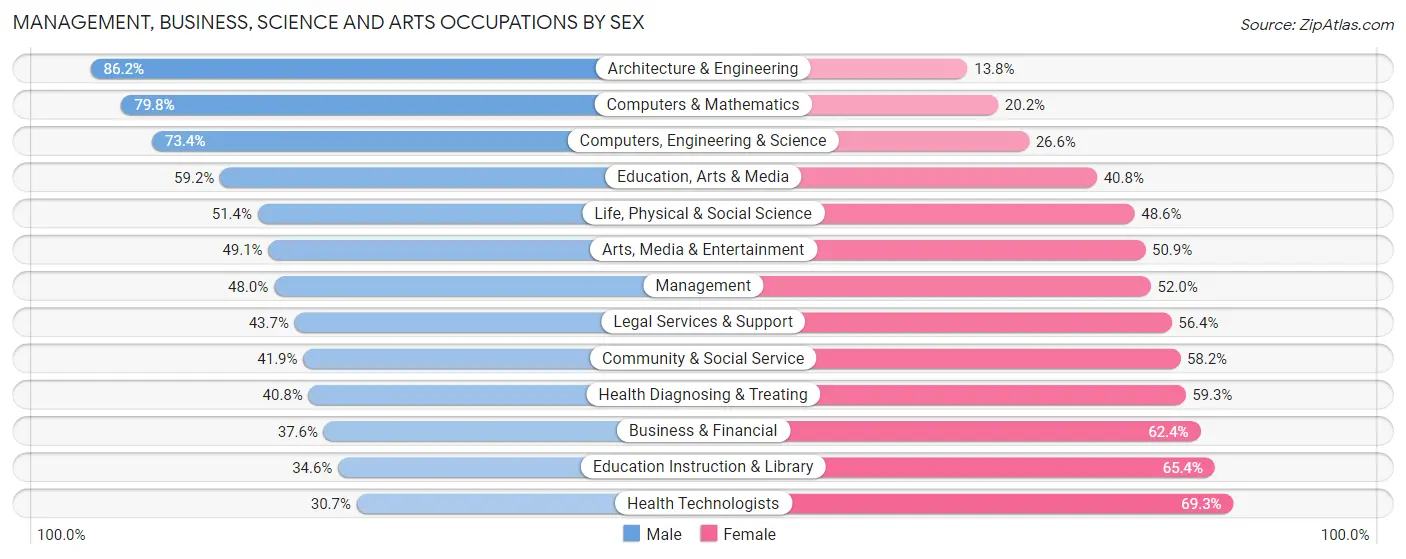
Management, Business, Science and Arts Occupations by Sex
Within the Management, Business, Science and Arts occupations in Flagstaff, the most male-oriented occupations are Architecture & Engineering (86.2%), Computers & Mathematics (79.8%), and Computers, Engineering & Science (73.4%), while the most female-oriented occupations are Health Technologists (69.3%), Education Instruction & Library (65.4%), and Business & Financial (62.4%).
| Occupation | Male | Female |
| Management | 1,779 (48.0%) | 1,930 (52.0%) |
| Business & Financial | 616 (37.6%) | 1,023 (62.4%) |
| Computers, Engineering & Science | 2,277 (73.4%) | 825 (26.6%) |
| Computers & Mathematics | 961 (79.8%) | 243 (20.2%) |
| Architecture & Engineering | 844 (86.2%) | 135 (13.8%) |
| Life, Physical & Social Science | 472 (51.4%) | 447 (48.6%) |
| Community & Social Service | 2,476 (41.8%) | 3,441 (58.2%) |
| Education, Arts & Media | 518 (59.2%) | 357 (40.8%) |
| Legal Services & Support | 182 (43.6%) | 235 (56.4%) |
| Education Instruction & Library | 1,180 (34.6%) | 2,232 (65.4%) |
| Arts, Media & Entertainment | 596 (49.1%) | 617 (50.9%) |
| Health Diagnosing & Treating | 1,006 (40.7%) | 1,463 (59.3%) |
| Health Technologists | 516 (30.7%) | 1,165 (69.3%) |
| Total (Category) | 8,154 (48.4%) | 8,682 (51.6%) |
| Total (Overall) | 20,414 (51.9%) | 18,920 (48.1%) |
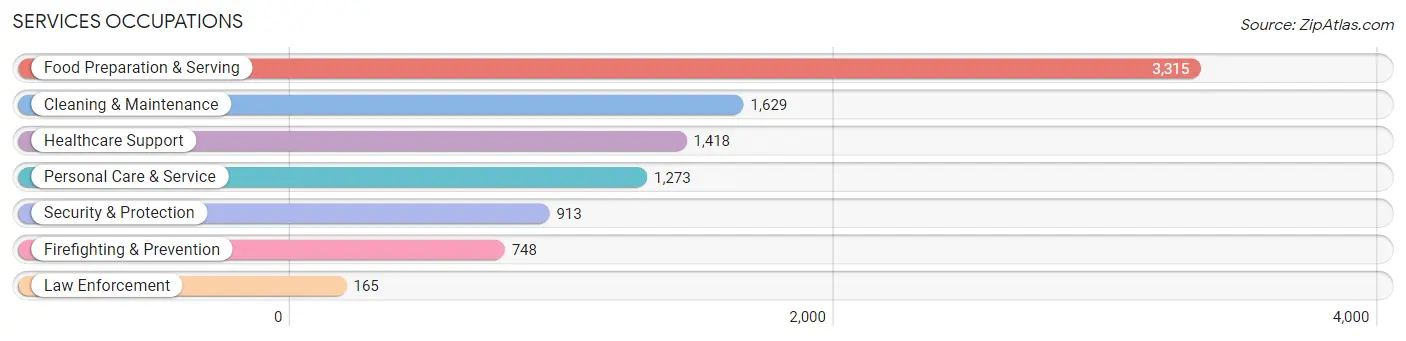
Services Occupations
The most common Services occupations in Flagstaff are Food Preparation & Serving (3,315 | 8.4%), Cleaning & Maintenance (1,629 | 4.1%), Healthcare Support (1,418 | 3.6%), Personal Care & Service (1,273 | 3.2%), and Security & Protection (913 | 2.3%).
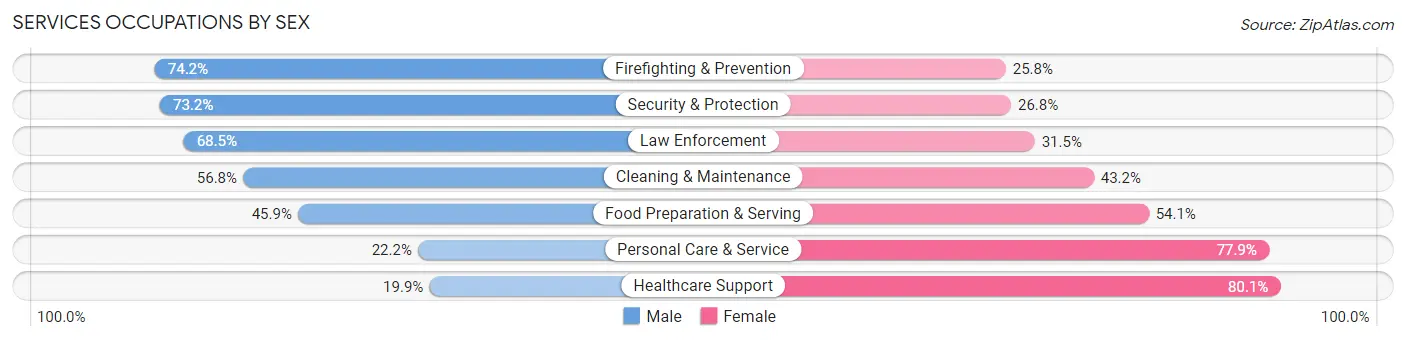
Services Occupations by Sex
Within the Services occupations in Flagstaff, the most male-oriented occupations are Firefighting & Prevention (74.2%), Security & Protection (73.2%), and Law Enforcement (68.5%), while the most female-oriented occupations are Healthcare Support (80.1%), Personal Care & Service (77.8%), and Food Preparation & Serving (54.1%).
| Occupation | Male | Female |
| Healthcare Support | 282 (19.9%) | 1,136 (80.1%) |
| Security & Protection | 668 (73.2%) | 245 (26.8%) |
| Firefighting & Prevention | 555 (74.2%) | 193 (25.8%) |
| Law Enforcement | 113 (68.5%) | 52 (31.5%) |
| Food Preparation & Serving | 1,522 (45.9%) | 1,793 (54.1%) |
| Cleaning & Maintenance | 925 (56.8%) | 704 (43.2%) |
| Personal Care & Service | 282 (22.2%) | 991 (77.8%) |
| Total (Category) | 3,679 (43.0%) | 4,869 (57.0%) |
| Total (Overall) | 20,414 (51.9%) | 18,920 (48.1%) |
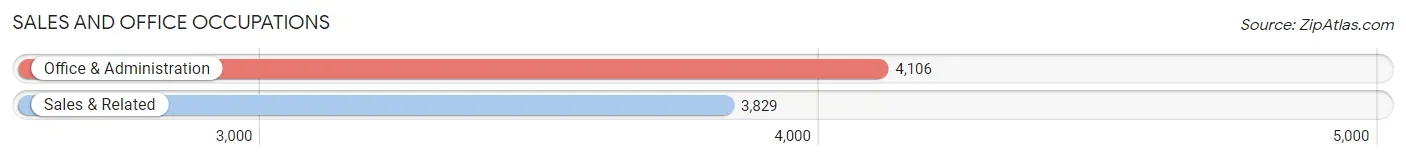
Sales and Office Occupations
The most common Sales and Office occupations in Flagstaff are Office & Administration (4,106 | 10.4%), and Sales & Related (3,829 | 9.7%).
Sales and Office Occupations by Sex
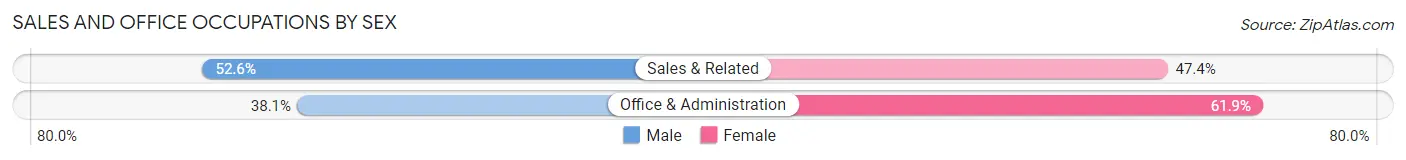
| Occupation | Male | Female |
| Sales & Related | 2,015 (52.6%) | 1,814 (47.4%) |
| Office & Administration | 1,565 (38.1%) | 2,541 (61.9%) |
| Total (Category) | 3,580 (45.1%) | 4,355 (54.9%) |
| Total (Overall) | 20,414 (51.9%) | 18,920 (48.1%) |
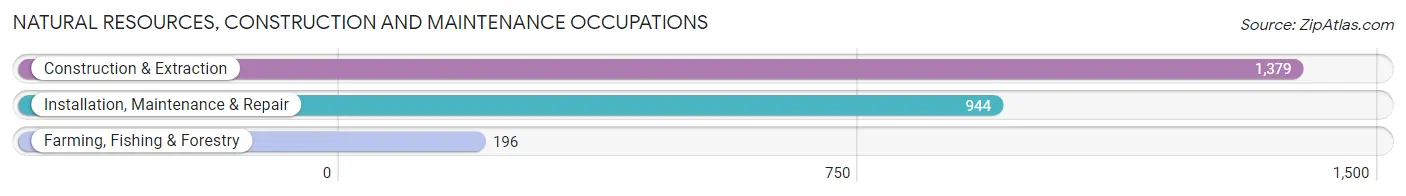
Natural Resources, Construction and Maintenance Occupations
The most common Natural Resources, Construction and Maintenance occupations in Flagstaff are Construction & Extraction (1,379 | 3.5%), Installation, Maintenance & Repair (944 | 2.4%), and Farming, Fishing & Forestry (196 | 0.5%).
Natural Resources, Construction and Maintenance Occupations by Sex
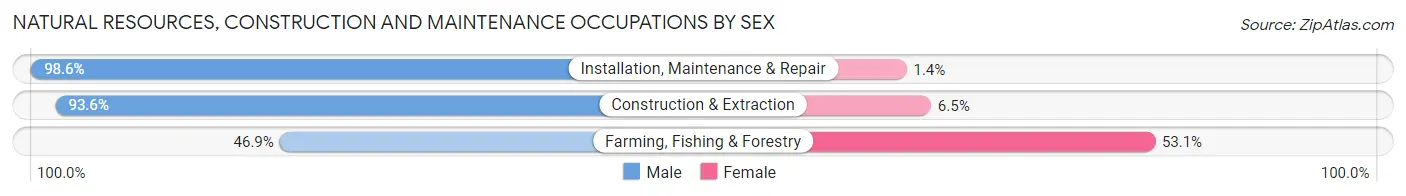
| Occupation | Male | Female |
| Farming, Fishing & Forestry | 92 (46.9%) | 104 (53.1%) |
| Construction & Extraction | 1,290 (93.5%) | 89 (6.5%) |
| Installation, Maintenance & Repair | 931 (98.6%) | 13 (1.4%) |
| Total (Category) | 2,313 (91.8%) | 206 (8.2%) |
| Total (Overall) | 20,414 (51.9%) | 18,920 (48.1%) |
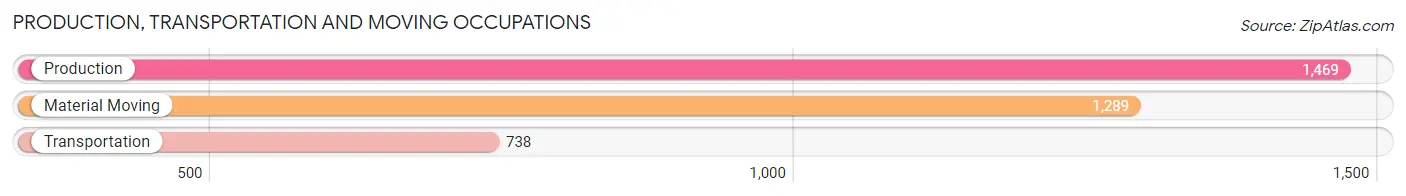
Production, Transportation and Moving Occupations
The most common Production, Transportation and Moving occupations in Flagstaff are Production (1,469 | 3.7%), Material Moving (1,289 | 3.3%), and Transportation (738 | 1.9%).
Production, Transportation and Moving Occupations by Sex
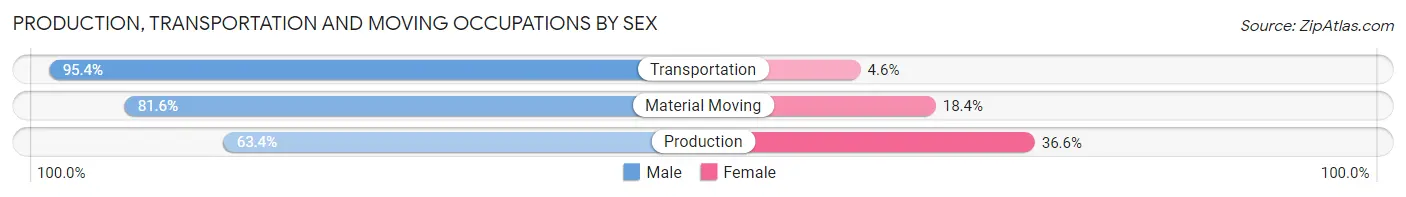
| Occupation | Male | Female |
| Production | 932 (63.4%) | 537 (36.6%) |
| Transportation | 704 (95.4%) | 34 (4.6%) |
| Material Moving | 1,052 (81.6%) | 237 (18.4%) |
| Total (Category) | 2,688 (76.9%) | 808 (23.1%) |
| Total (Overall) | 20,414 (51.9%) | 18,920 (48.1%) |
Employment Industries by Sex in Flagstaff
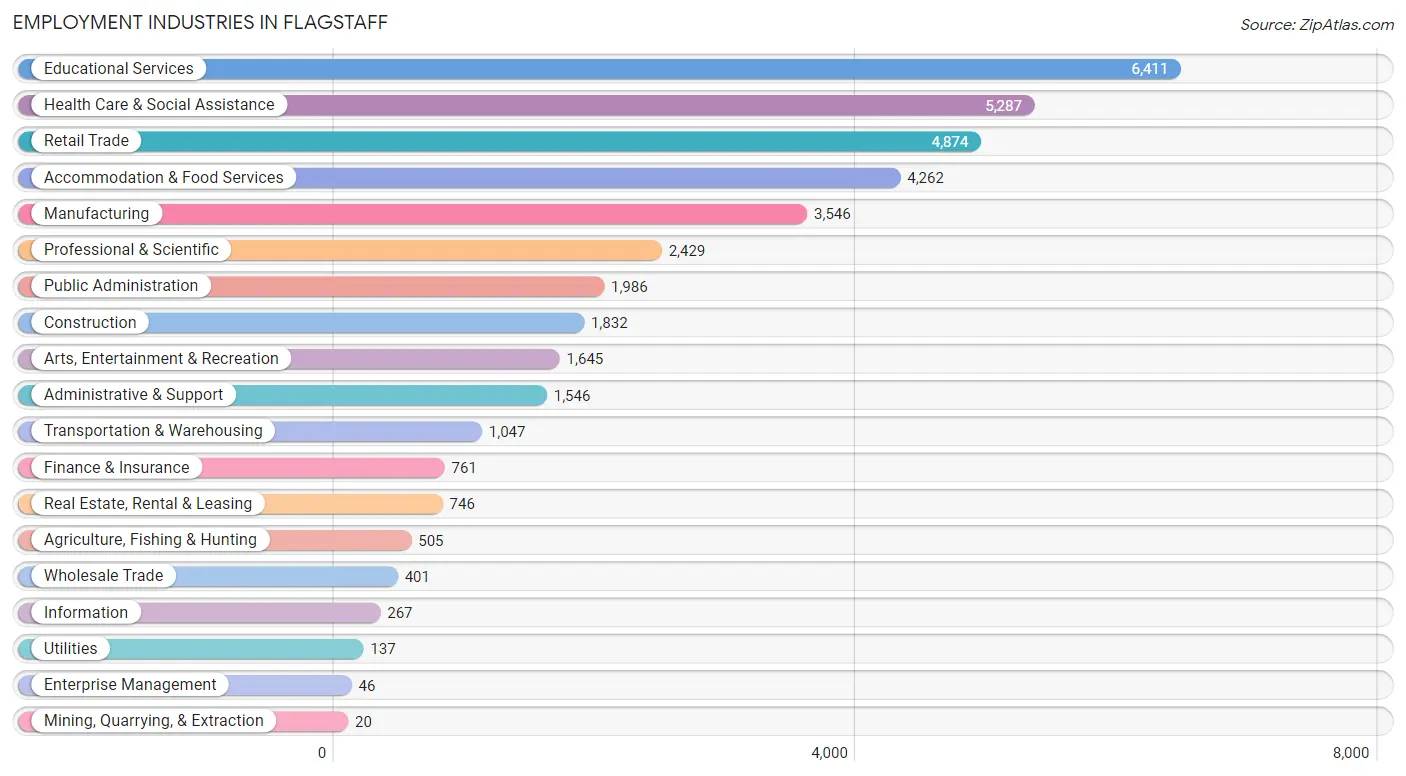
Employment Industries in Flagstaff
The major employment industries in Flagstaff include Educational Services (6,411 | 16.3%), Health Care & Social Assistance (5,287 | 13.4%), Retail Trade (4,874 | 12.4%), Accommodation & Food Services (4,262 | 10.8%), and Manufacturing (3,546 | 9.0%).
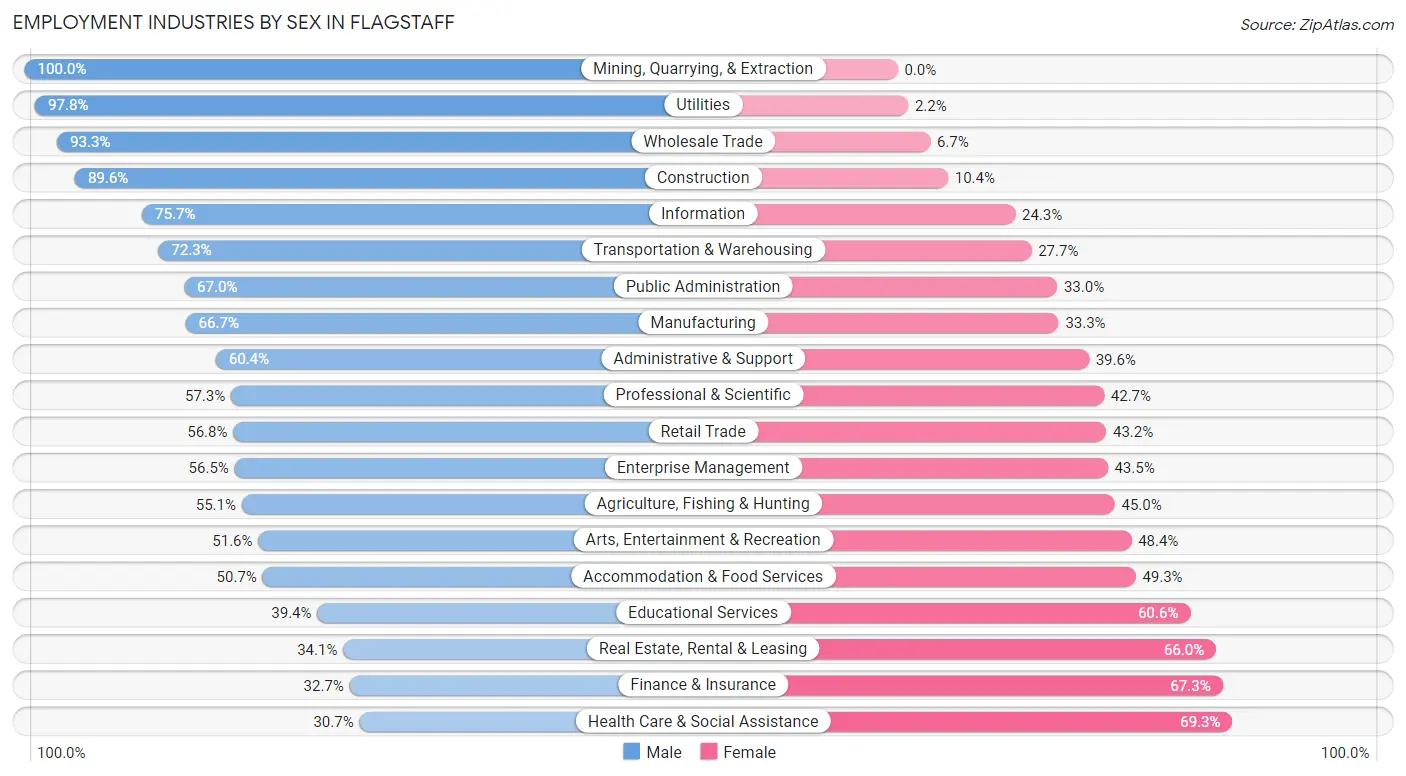
Employment Industries by Sex in Flagstaff
The Flagstaff industries that see more men than women are Mining, Quarrying, & Extraction (100.0%), Utilities (97.8%), and Wholesale Trade (93.3%), whereas the industries that tend to have a higher number of women are Health Care & Social Assistance (69.3%), Finance & Insurance (67.3%), and Real Estate, Rental & Leasing (65.9%).
| Industry | Male | Female |
| Agriculture, Fishing & Hunting | 278 (55.0%) | 227 (45.0%) |
| Mining, Quarrying, & Extraction | 20 (100.0%) | 0 (0.0%) |
| Construction | 1,641 (89.6%) | 191 (10.4%) |
| Manufacturing | 2,364 (66.7%) | 1,182 (33.3%) |
| Wholesale Trade | 374 (93.3%) | 27 (6.7%) |
| Retail Trade | 2,769 (56.8%) | 2,105 (43.2%) |
| Transportation & Warehousing | 757 (72.3%) | 290 (27.7%) |
| Utilities | 134 (97.8%) | 3 (2.2%) |
| Information | 202 (75.7%) | 65 (24.3%) |
| Finance & Insurance | 249 (32.7%) | 512 (67.3%) |
| Real Estate, Rental & Leasing | 254 (34.1%) | 492 (65.9%) |
| Professional & Scientific | 1,391 (57.3%) | 1,038 (42.7%) |
| Enterprise Management | 26 (56.5%) | 20 (43.5%) |
| Administrative & Support | 934 (60.4%) | 612 (39.6%) |
| Educational Services | 2,526 (39.4%) | 3,885 (60.6%) |
| Health Care & Social Assistance | 1,622 (30.7%) | 3,665 (69.3%) |
| Arts, Entertainment & Recreation | 849 (51.6%) | 796 (48.4%) |
| Accommodation & Food Services | 2,162 (50.7%) | 2,100 (49.3%) |
| Public Administration | 1,330 (67.0%) | 656 (33.0%) |
| Total | 20,414 (51.9%) | 18,920 (48.1%) |
Education in Flagstaff
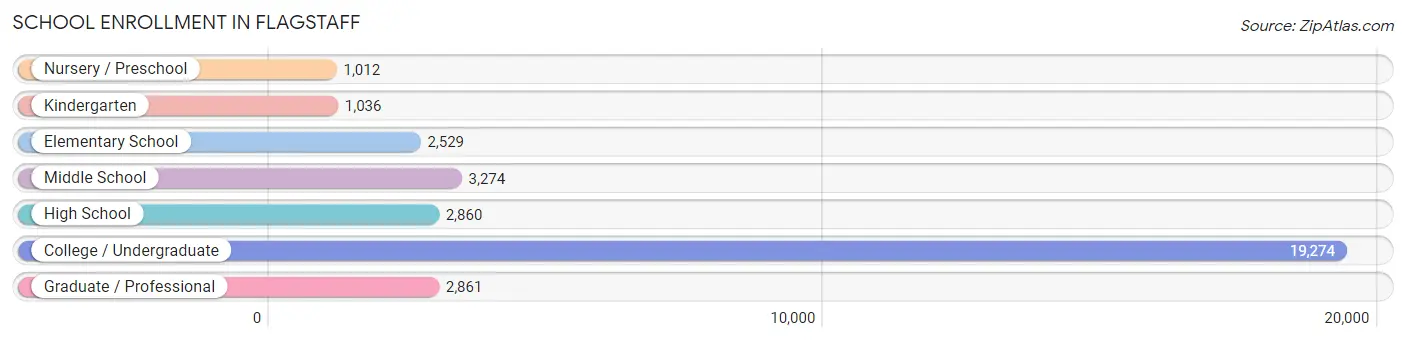
School Enrollment in Flagstaff
The most common levels of schooling among the 32,846 students in Flagstaff are college / undergraduate (19,274 | 58.7%), middle school (3,274 | 10.0%), and graduate / professional (2,861 | 8.7%).
| School Level | # Students | % Students |
| Nursery / Preschool | 1,012 | 3.1% |
| Kindergarten | 1,036 | 3.2% |
| Elementary School | 2,529 | 7.7% |
| Middle School | 3,274 | 10.0% |
| High School | 2,860 | 8.7% |
| College / Undergraduate | 19,274 | 58.7% |
| Graduate / Professional | 2,861 | 8.7% |
| Total | 32,846 | 100.0% |
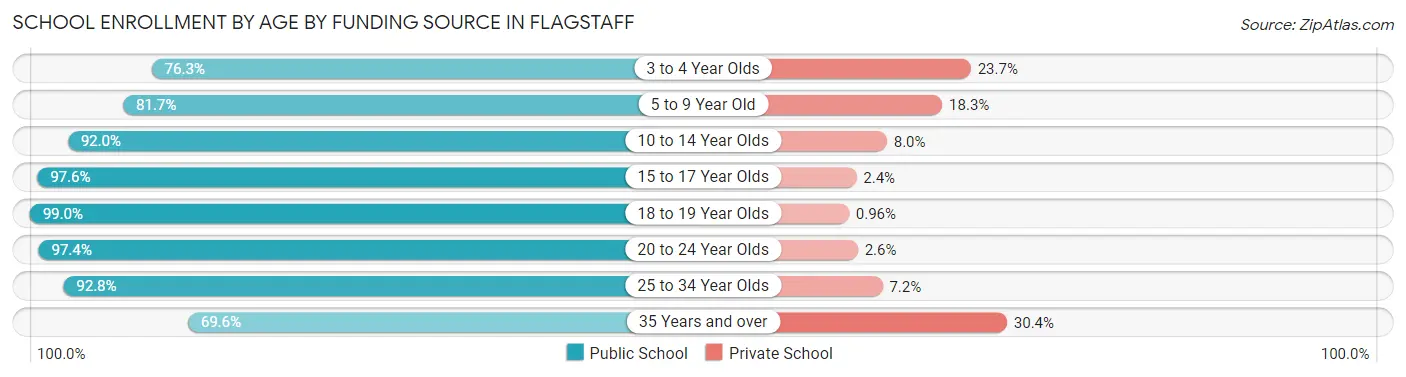
School Enrollment by Age by Funding Source in Flagstaff
Out of a total of 32,846 students who are enrolled in schools in Flagstaff, 2,069 (6.3%) attend a private institution, while the remaining 30,777 (93.7%) are enrolled in public schools. The age group of 35 years and over has the highest likelihood of being enrolled in private schools, with 349 (30.4% in the age bracket) enrolled. Conversely, the age group of 18 to 19 year olds has the lowest likelihood of being enrolled in a private school, with 8,347 (99.0% in the age bracket) attending a public institution.
| Age Bracket | Public School | Private School |
| 3 to 4 Year Olds | 458 (76.3%) | 142 (23.7%) |
| 5 to 9 Year Old | 2,948 (81.7%) | 662 (18.3%) |
| 10 to 14 Year Olds | 3,503 (92.0%) | 306 (8.0%) |
| 15 to 17 Year Olds | 2,313 (97.6%) | 56 (2.4%) |
| 18 to 19 Year Olds | 8,347 (99.0%) | 81 (1.0%) |
| 20 to 24 Year Olds | 9,907 (97.4%) | 265 (2.6%) |
| 25 to 34 Year Olds | 2,514 (92.8%) | 196 (7.2%) |
| 35 Years and over | 799 (69.6%) | 349 (30.4%) |
| Total | 30,777 (93.7%) | 2,069 (6.3%) |
Educational Attainment by Field of Study in Flagstaff
Education (2,615 | 11.5%), business (2,489 | 10.9%), science & technology (2,403 | 10.5%), social sciences (2,186 | 9.6%), and bio, nature & agricultural (2,103 | 9.2%) are the most common fields of study among 22,824 individuals in Flagstaff who have obtained a bachelor's degree or higher.
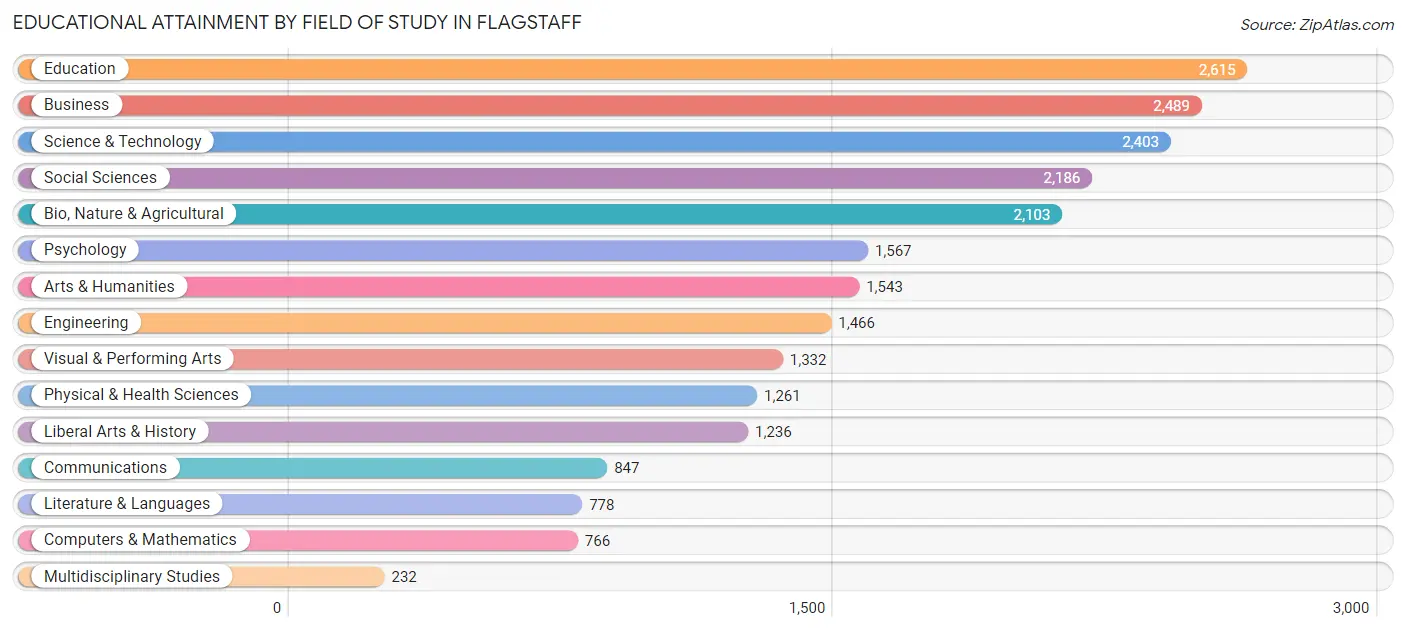
| Field of Study | # Graduates | % Graduates |
| Computers & Mathematics | 766 | 3.4% |
| Bio, Nature & Agricultural | 2,103 | 9.2% |
| Physical & Health Sciences | 1,261 | 5.5% |
| Psychology | 1,567 | 6.9% |
| Social Sciences | 2,186 | 9.6% |
| Engineering | 1,466 | 6.4% |
| Multidisciplinary Studies | 232 | 1.0% |
| Science & Technology | 2,403 | 10.5% |
| Business | 2,489 | 10.9% |
| Education | 2,615 | 11.5% |
| Literature & Languages | 778 | 3.4% |
| Liberal Arts & History | 1,236 | 5.4% |
| Visual & Performing Arts | 1,332 | 5.8% |
| Communications | 847 | 3.7% |
| Arts & Humanities | 1,543 | 6.8% |
| Total | 22,824 | 100.0% |
Transportation & Commute in Flagstaff
Vehicle Availability by Sex in Flagstaff
The most prevalent vehicle ownership categories in Flagstaff are males with 2 vehicles (7,340, accounting for 39.3%) and females with 2 vehicles (7,021, making up 45.5%).
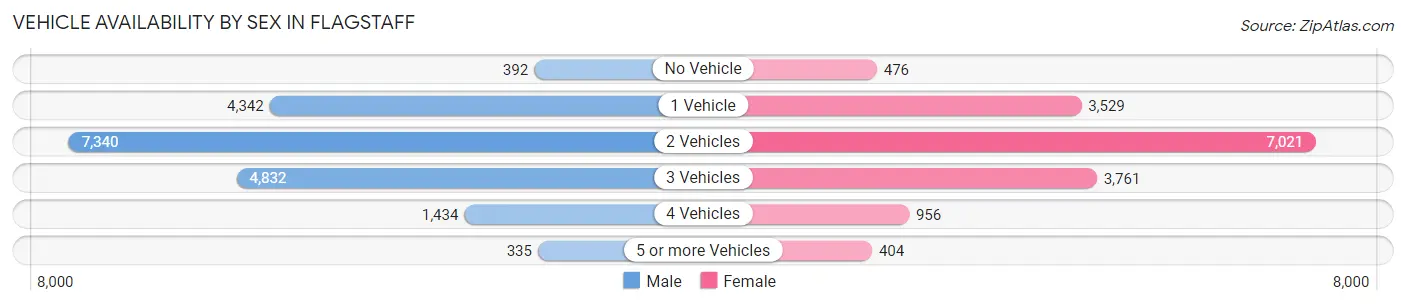
| Vehicles Available | Male | Female |
| No Vehicle | 392 (2.1%) | 476 (2.9%) |
| 1 Vehicle | 4,342 (23.3%) | 3,529 (21.9%) |
| 2 Vehicles | 7,340 (39.3%) | 7,021 (43.5%) |
| 3 Vehicles | 4,832 (25.9%) | 3,761 (23.3%) |
| 4 Vehicles | 1,434 (7.7%) | 956 (5.9%) |
| 5 or more Vehicles | 335 (1.8%) | 404 (2.5%) |
| Total | 18,675 (100.0%) | 16,147 (100.0%) |
Commute Time in Flagstaff
The most frequently occuring commute durations in Flagstaff are 10 to 14 minutes (9,987 commuters, 29.2%), 15 to 19 minutes (7,623 commuters, 22.3%), and 5 to 9 minutes (7,059 commuters, 20.7%).
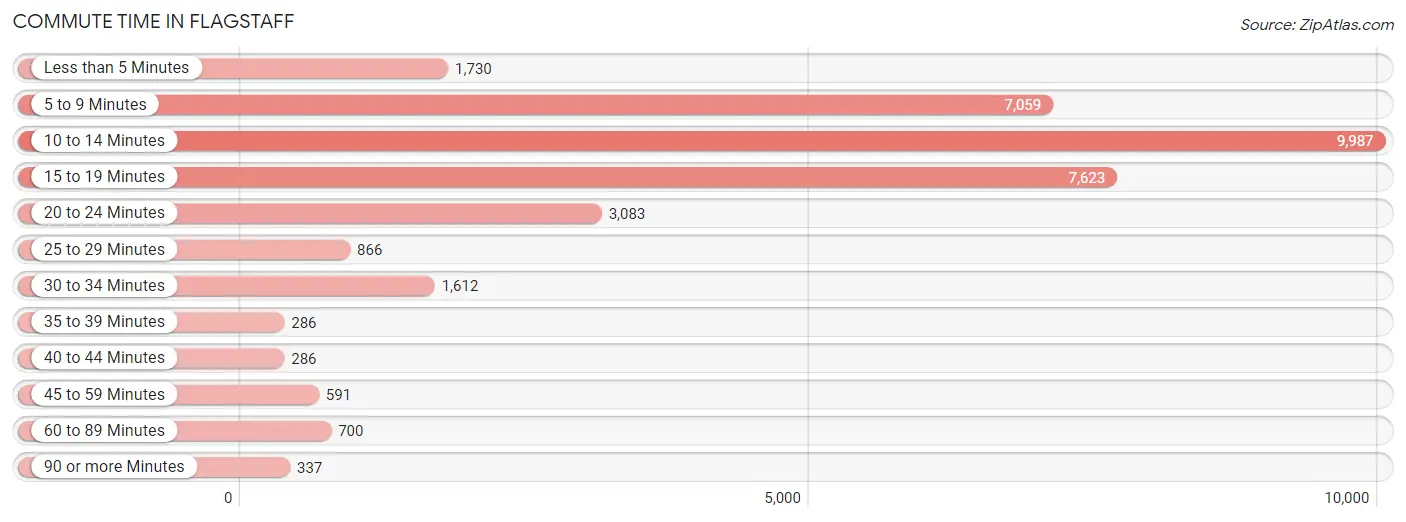
| Commute Time | # Commuters | % Commuters |
| Less than 5 Minutes | 1,730 | 5.1% |
| 5 to 9 Minutes | 7,059 | 20.7% |
| 10 to 14 Minutes | 9,987 | 29.2% |
| 15 to 19 Minutes | 7,623 | 22.3% |
| 20 to 24 Minutes | 3,083 | 9.0% |
| 25 to 29 Minutes | 866 | 2.5% |
| 30 to 34 Minutes | 1,612 | 4.7% |
| 35 to 39 Minutes | 286 | 0.8% |
| 40 to 44 Minutes | 286 | 0.8% |
| 45 to 59 Minutes | 591 | 1.7% |
| 60 to 89 Minutes | 700 | 2.1% |
| 90 or more Minutes | 337 | 1.0% |
Commute Time by Sex in Flagstaff
The most common commute times in Flagstaff are 10 to 14 minutes (5,451 commuters, 29.9%) for males and 10 to 14 minutes (4,536 commuters, 28.4%) for females.
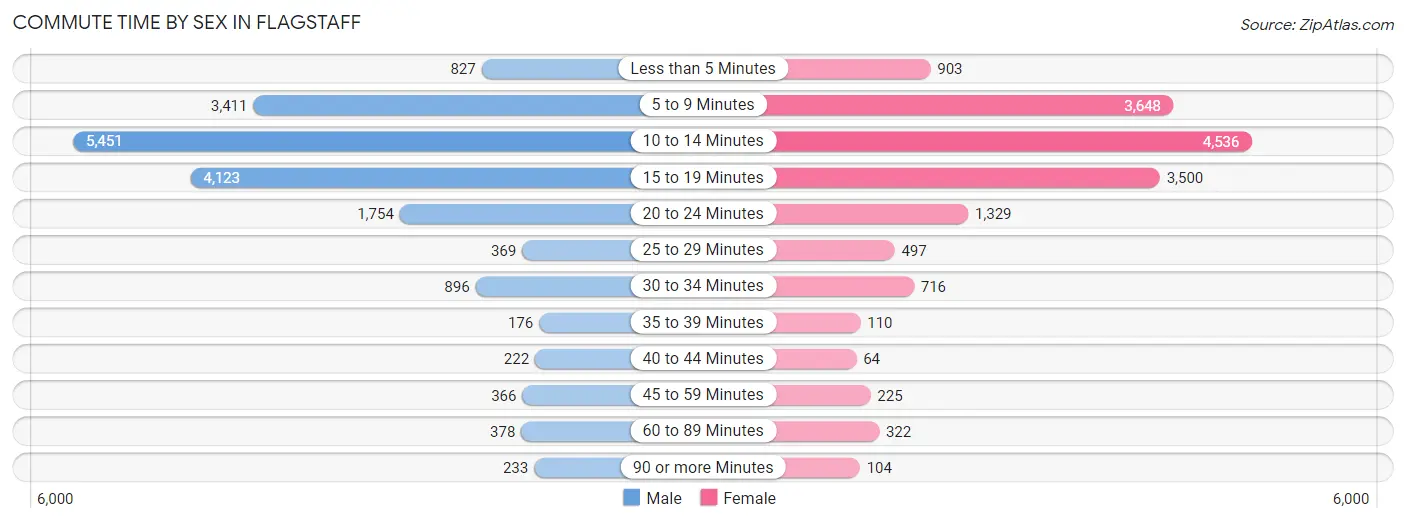
| Commute Time | Male | Female |
| Less than 5 Minutes | 827 (4.5%) | 903 (5.7%) |
| 5 to 9 Minutes | 3,411 (18.7%) | 3,648 (22.9%) |
| 10 to 14 Minutes | 5,451 (29.9%) | 4,536 (28.4%) |
| 15 to 19 Minutes | 4,123 (22.7%) | 3,500 (21.9%) |
| 20 to 24 Minutes | 1,754 (9.6%) | 1,329 (8.3%) |
| 25 to 29 Minutes | 369 (2.0%) | 497 (3.1%) |
| 30 to 34 Minutes | 896 (4.9%) | 716 (4.5%) |
| 35 to 39 Minutes | 176 (1.0%) | 110 (0.7%) |
| 40 to 44 Minutes | 222 (1.2%) | 64 (0.4%) |
| 45 to 59 Minutes | 366 (2.0%) | 225 (1.4%) |
| 60 to 89 Minutes | 378 (2.1%) | 322 (2.0%) |
| 90 or more Minutes | 233 (1.3%) | 104 (0.6%) |
Time of Departure to Work by Sex in Flagstaff
The most frequent times of departure to work in Flagstaff are 7:30 AM to 7:59 AM (3,018, 16.6%) for males and 7:30 AM to 7:59 AM (2,808, 17.6%) for females.
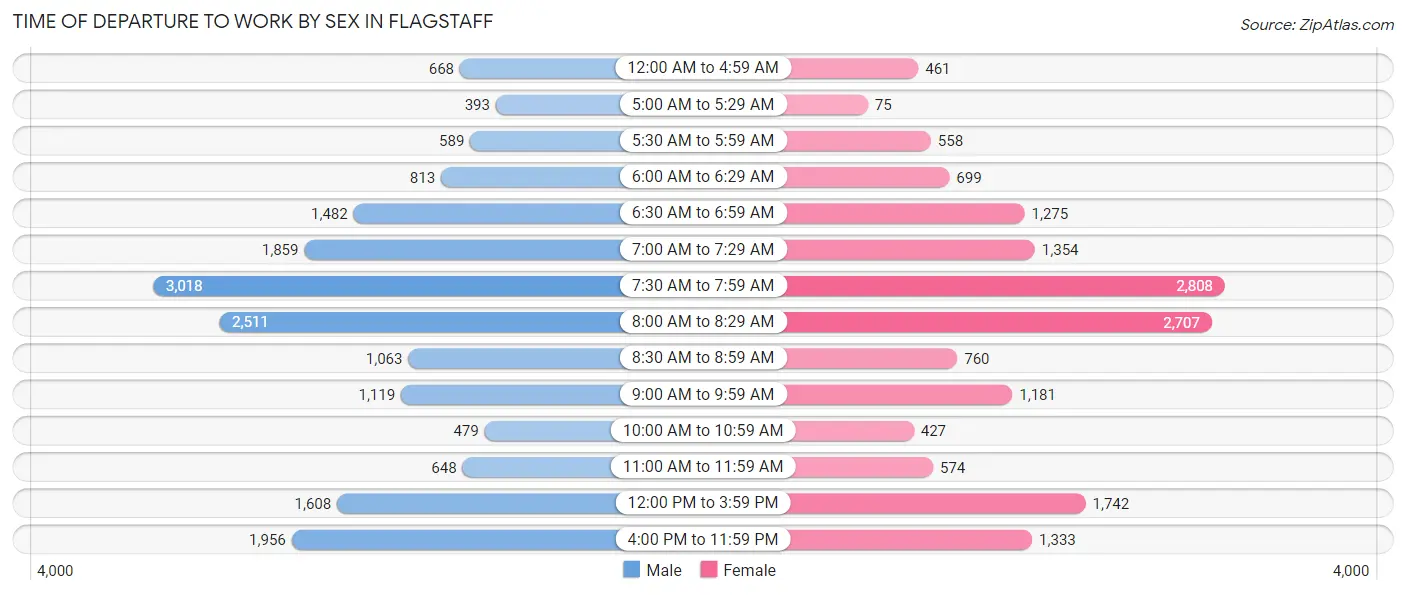
| Time of Departure | Male | Female |
| 12:00 AM to 4:59 AM | 668 (3.7%) | 461 (2.9%) |
| 5:00 AM to 5:29 AM | 393 (2.2%) | 75 (0.5%) |
| 5:30 AM to 5:59 AM | 589 (3.2%) | 558 (3.5%) |
| 6:00 AM to 6:29 AM | 813 (4.5%) | 699 (4.4%) |
| 6:30 AM to 6:59 AM | 1,482 (8.1%) | 1,275 (8.0%) |
| 7:00 AM to 7:29 AM | 1,859 (10.2%) | 1,354 (8.5%) |
| 7:30 AM to 7:59 AM | 3,018 (16.6%) | 2,808 (17.6%) |
| 8:00 AM to 8:29 AM | 2,511 (13.8%) | 2,707 (17.0%) |
| 8:30 AM to 8:59 AM | 1,063 (5.8%) | 760 (4.8%) |
| 9:00 AM to 9:59 AM | 1,119 (6.1%) | 1,181 (7.4%) |
| 10:00 AM to 10:59 AM | 479 (2.6%) | 427 (2.7%) |
| 11:00 AM to 11:59 AM | 648 (3.6%) | 574 (3.6%) |
| 12:00 PM to 3:59 PM | 1,608 (8.8%) | 1,742 (10.9%) |
| 4:00 PM to 11:59 PM | 1,956 (10.7%) | 1,333 (8.4%) |
| Total | 18,206 (100.0%) | 15,954 (100.0%) |
Housing Occupancy in Flagstaff
Occupancy by Ownership in Flagstaff
Of the total 27,062 dwellings in Flagstaff, owner-occupied units account for 11,668 (43.1%), while renter-occupied units make up 15,394 (56.9%).
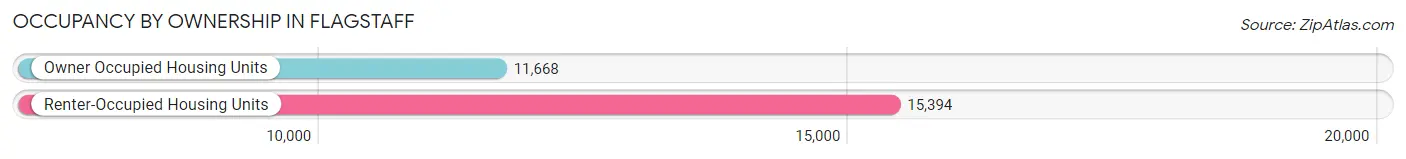
| Occupancy | # Housing Units | % Housing Units |
| Owner Occupied Housing Units | 11,668 | 43.1% |
| Renter-Occupied Housing Units | 15,394 | 56.9% |
| Total Occupied Housing Units | 27,062 | 100.0% |
Occupancy by Household Size in Flagstaff
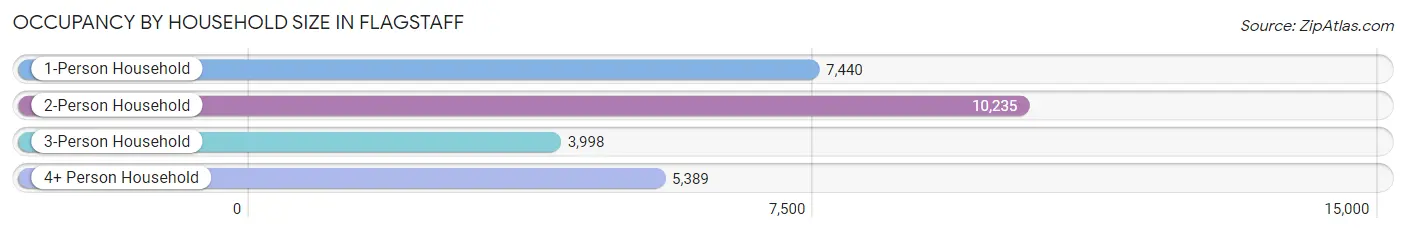
| Household Size | # Housing Units | % Housing Units |
| 1-Person Household | 7,440 | 27.5% |
| 2-Person Household | 10,235 | 37.8% |
| 3-Person Household | 3,998 | 14.8% |
| 4+ Person Household | 5,389 | 19.9% |
| Total Housing Units | 27,062 | 100.0% |
Occupancy by Ownership by Household Size in Flagstaff
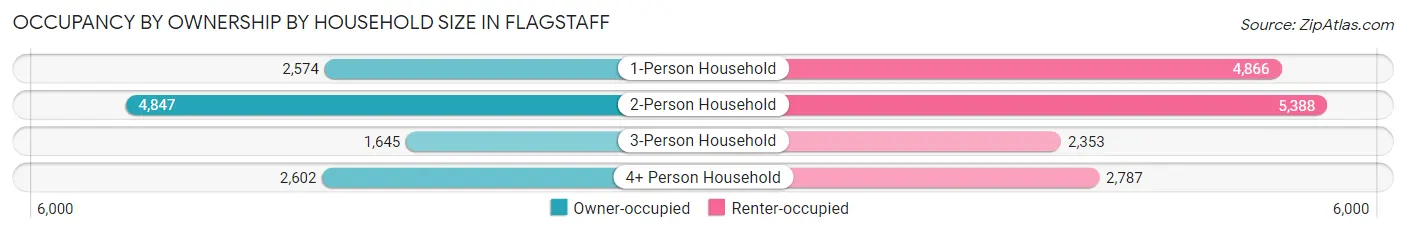
| Household Size | Owner-occupied | Renter-occupied |
| 1-Person Household | 2,574 (34.6%) | 4,866 (65.4%) |
| 2-Person Household | 4,847 (47.4%) | 5,388 (52.6%) |
| 3-Person Household | 1,645 (41.1%) | 2,353 (58.9%) |
| 4+ Person Household | 2,602 (48.3%) | 2,787 (51.7%) |
| Total Housing Units | 11,668 (43.1%) | 15,394 (56.9%) |
Occupancy by Educational Attainment in Flagstaff
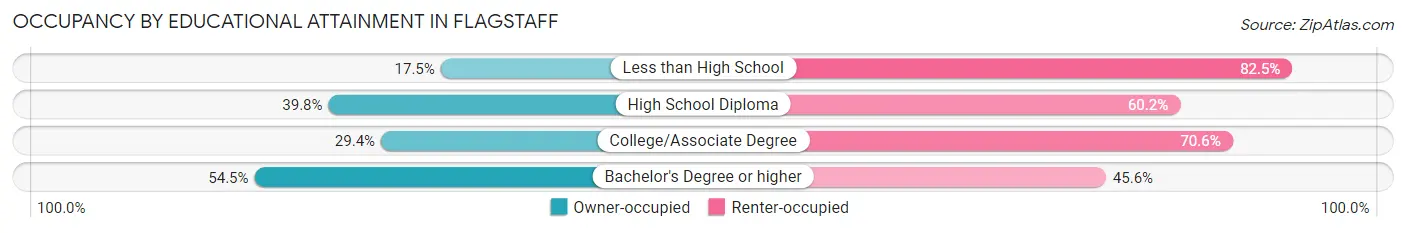
| Household Size | Owner-occupied | Renter-occupied |
| Less than High School | 143 (17.5%) | 673 (82.5%) |
| High School Diploma | 1,328 (39.8%) | 2,011 (60.2%) |
| College/Associate Degree | 2,664 (29.4%) | 6,409 (70.6%) |
| Bachelor's Degree or higher | 7,533 (54.4%) | 6,301 (45.6%) |
Occupancy by Age of Householder in Flagstaff
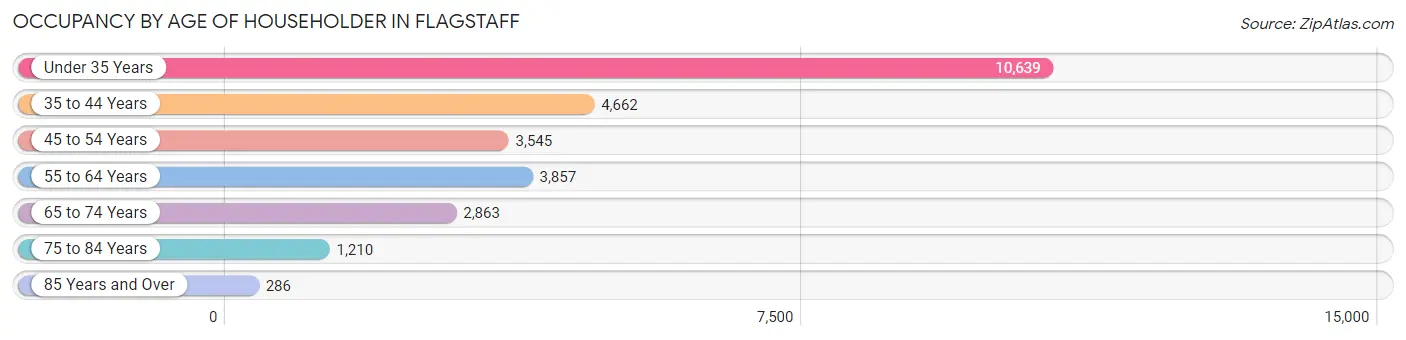
| Age Bracket | # Households | % Households |
| Under 35 Years | 10,639 | 39.3% |
| 35 to 44 Years | 4,662 | 17.2% |
| 45 to 54 Years | 3,545 | 13.1% |
| 55 to 64 Years | 3,857 | 14.2% |
| 65 to 74 Years | 2,863 | 10.6% |
| 75 to 84 Years | 1,210 | 4.5% |
| 85 Years and Over | 286 | 1.1% |
| Total | 27,062 | 100.0% |
Housing Finances in Flagstaff
Median Income by Occupancy in Flagstaff
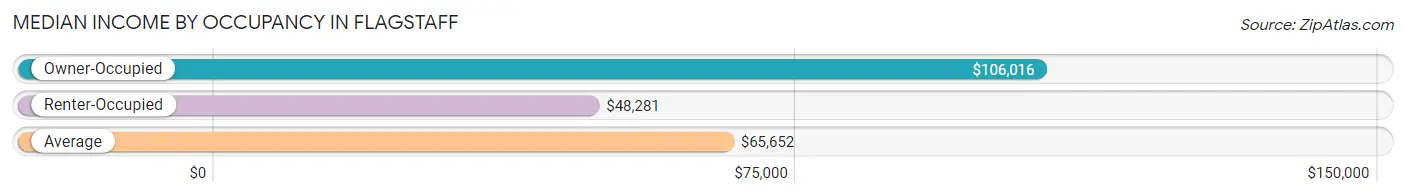
| Occupancy Type | # Households | Median Income |
| Owner-Occupied | 11,668 (43.1%) | $106,016 |
| Renter-Occupied | 15,394 (56.9%) | $48,281 |
| Average | 27,062 (100.0%) | $65,652 |
Occupancy by Householder Income Bracket in Flagstaff
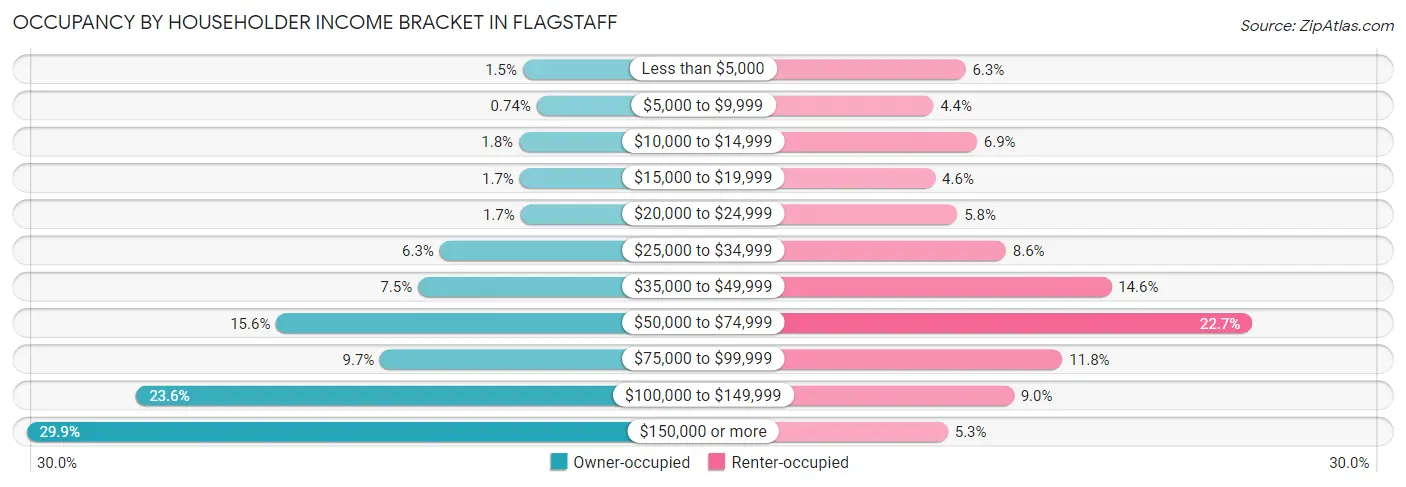
| Income Bracket | Owner-occupied | Renter-occupied |
| Less than $5,000 | 178 (1.5%) | 966 (6.3%) |
| $5,000 to $9,999 | 86 (0.7%) | 683 (4.4%) |
| $10,000 to $14,999 | 204 (1.8%) | 1,067 (6.9%) |
| $15,000 to $19,999 | 200 (1.7%) | 700 (4.5%) |
| $20,000 to $24,999 | 194 (1.7%) | 895 (5.8%) |
| $25,000 to $34,999 | 733 (6.3%) | 1,322 (8.6%) |
| $35,000 to $49,999 | 878 (7.5%) | 2,249 (14.6%) |
| $50,000 to $74,999 | 1,822 (15.6%) | 3,488 (22.7%) |
| $75,000 to $99,999 | 1,129 (9.7%) | 1,820 (11.8%) |
| $100,000 to $149,999 | 2,756 (23.6%) | 1,392 (9.0%) |
| $150,000 or more | 3,488 (29.9%) | 812 (5.3%) |
| Total | 11,668 (100.0%) | 15,394 (100.0%) |
Monthly Housing Cost Tiers in Flagstaff
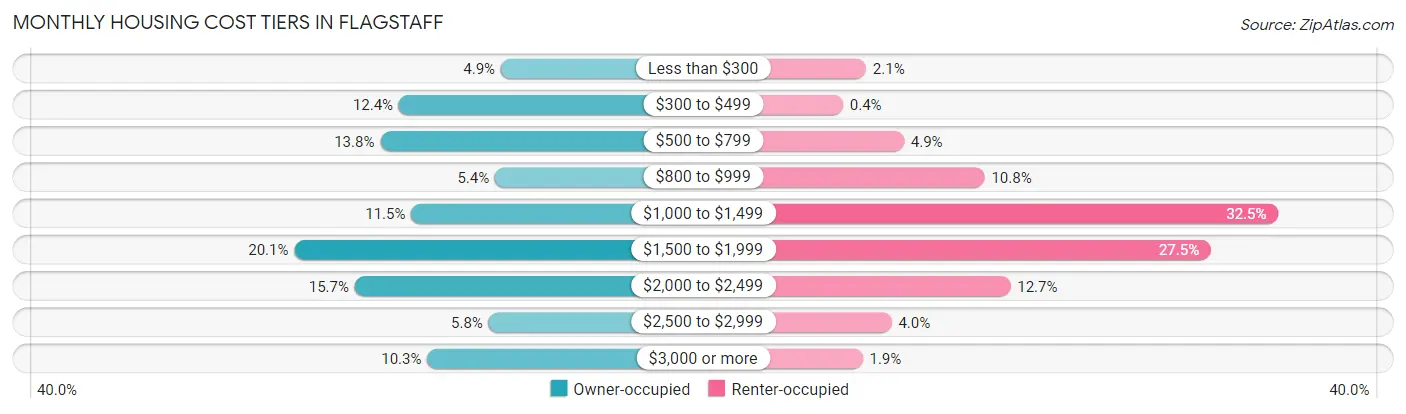
| Monthly Cost | Owner-occupied | Renter-occupied |
| Less than $300 | 574 (4.9%) | 324 (2.1%) |
| $300 to $499 | 1,450 (12.4%) | 62 (0.4%) |
| $500 to $799 | 1,611 (13.8%) | 753 (4.9%) |
| $800 to $999 | 624 (5.3%) | 1,667 (10.8%) |
| $1,000 to $1,499 | 1,344 (11.5%) | 4,999 (32.5%) |
| $1,500 to $1,999 | 2,350 (20.1%) | 4,235 (27.5%) |
| $2,000 to $2,499 | 1,829 (15.7%) | 1,959 (12.7%) |
| $2,500 to $2,999 | 679 (5.8%) | 613 (4.0%) |
| $3,000 or more | 1,207 (10.3%) | 285 (1.8%) |
| Total | 11,668 (100.0%) | 15,394 (100.0%) |
Physical Housing Characteristics in Flagstaff
Housing Structures in Flagstaff
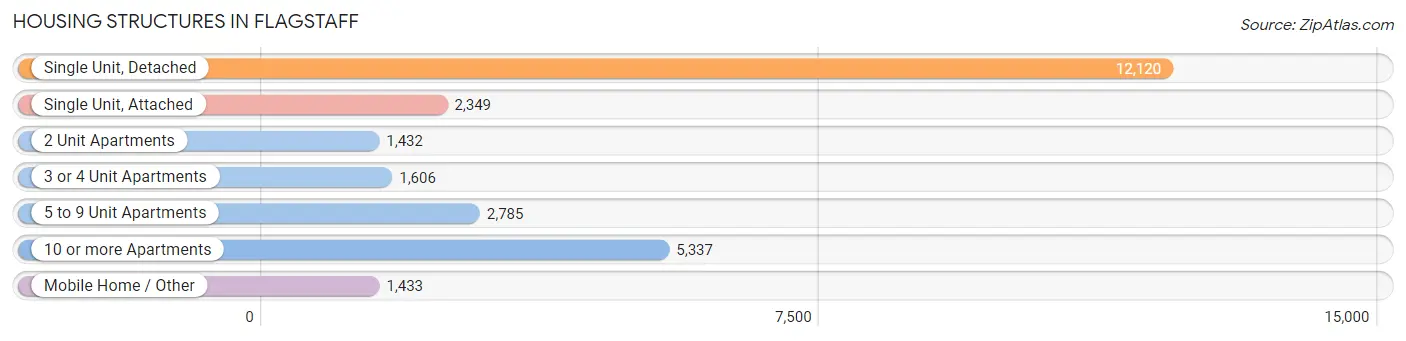
| Structure Type | # Housing Units | % Housing Units |
| Single Unit, Detached | 12,120 | 44.8% |
| Single Unit, Attached | 2,349 | 8.7% |
| 2 Unit Apartments | 1,432 | 5.3% |
| 3 or 4 Unit Apartments | 1,606 | 5.9% |
| 5 to 9 Unit Apartments | 2,785 | 10.3% |
| 10 or more Apartments | 5,337 | 19.7% |
| Mobile Home / Other | 1,433 | 5.3% |
| Total | 27,062 | 100.0% |
Housing Structures by Occupancy in Flagstaff
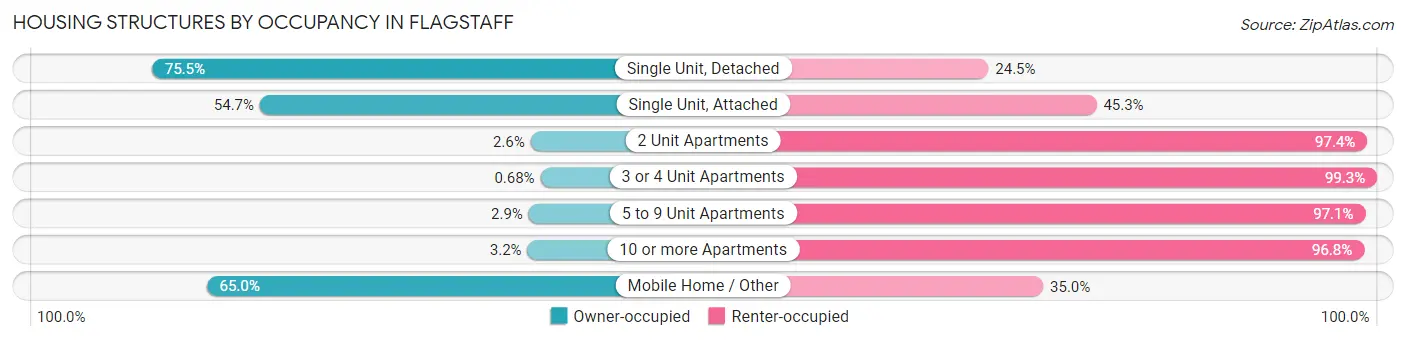
| Structure Type | Owner-occupied | Renter-occupied |
| Single Unit, Detached | 9,152 (75.5%) | 2,968 (24.5%) |
| Single Unit, Attached | 1,285 (54.7%) | 1,064 (45.3%) |
| 2 Unit Apartments | 37 (2.6%) | 1,395 (97.4%) |
| 3 or 4 Unit Apartments | 11 (0.7%) | 1,595 (99.3%) |
| 5 to 9 Unit Apartments | 82 (2.9%) | 2,703 (97.1%) |
| 10 or more Apartments | 170 (3.2%) | 5,167 (96.8%) |
| Mobile Home / Other | 931 (65.0%) | 502 (35.0%) |
| Total | 11,668 (43.1%) | 15,394 (56.9%) |
Housing Structures by Number of Rooms in Flagstaff
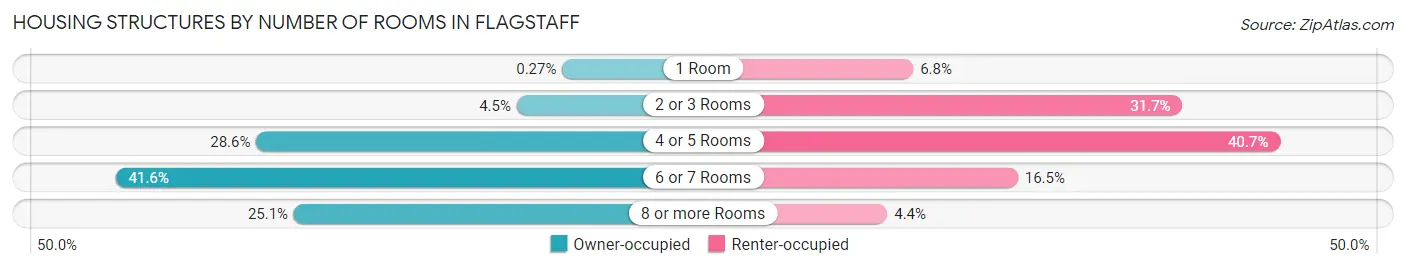
| Number of Rooms | Owner-occupied | Renter-occupied |
| 1 Room | 32 (0.3%) | 1,044 (6.8%) |
| 2 or 3 Rooms | 523 (4.5%) | 4,876 (31.7%) |
| 4 or 5 Rooms | 3,333 (28.6%) | 6,268 (40.7%) |
| 6 or 7 Rooms | 4,853 (41.6%) | 2,532 (16.5%) |
| 8 or more Rooms | 2,927 (25.1%) | 674 (4.4%) |
| Total | 11,668 (100.0%) | 15,394 (100.0%) |
Housing Structure by Heating Type in Flagstaff
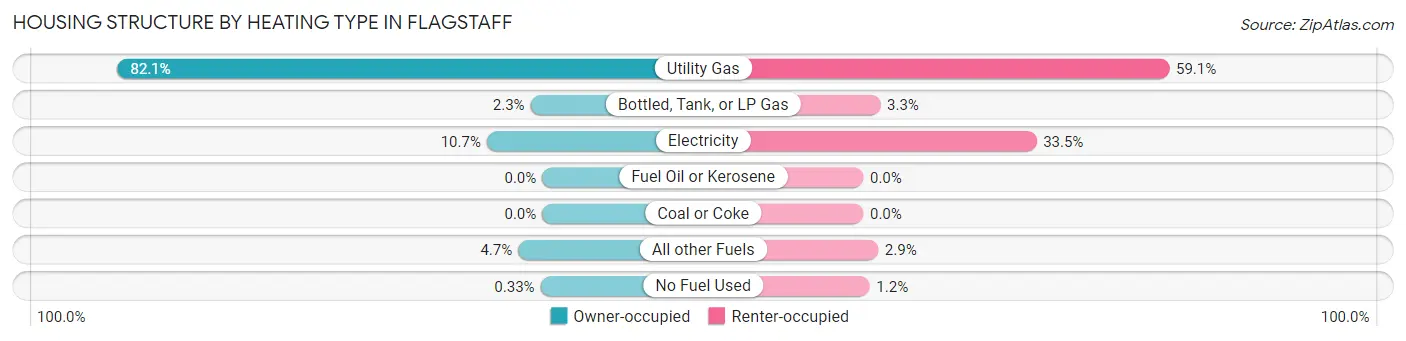
| Heating Type | Owner-occupied | Renter-occupied |
| Utility Gas | 9,576 (82.1%) | 9,103 (59.1%) |
| Bottled, Tank, or LP Gas | 263 (2.2%) | 508 (3.3%) |
| Electricity | 1,248 (10.7%) | 5,151 (33.5%) |
| Fuel Oil or Kerosene | 0 (0.0%) | 0 (0.0%) |
| Coal or Coke | 0 (0.0%) | 0 (0.0%) |
| All other Fuels | 542 (4.6%) | 442 (2.9%) |
| No Fuel Used | 39 (0.3%) | 190 (1.2%) |
| Total | 11,668 (100.0%) | 15,394 (100.0%) |
Household Vehicle Usage in Flagstaff
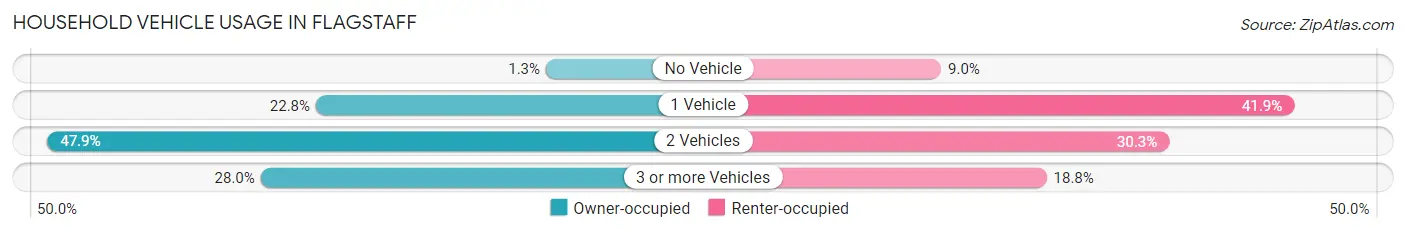
| Vehicles per Household | Owner-occupied | Renter-occupied |
| No Vehicle | 156 (1.3%) | 1,383 (9.0%) |
| 1 Vehicle | 2,661 (22.8%) | 6,455 (41.9%) |
| 2 Vehicles | 5,587 (47.9%) | 4,658 (30.3%) |
| 3 or more Vehicles | 3,264 (28.0%) | 2,898 (18.8%) |
| Total | 11,668 (100.0%) | 15,394 (100.0%) |
Real Estate & Mortgages in Flagstaff
Real Estate and Mortgage Overview in Flagstaff
| Characteristic | Without Mortgage | With Mortgage |
| Housing Units | 4,042 | 7,626 |
| Median Property Value | $442,800 | $476,700 |
| Median Household Income | $72,989 | $2,730 |
| Monthly Housing Costs | $511 | $1,189 |
| Real Estate Taxes | $2,148 | $109 |
Property Value by Mortgage Status in Flagstaff
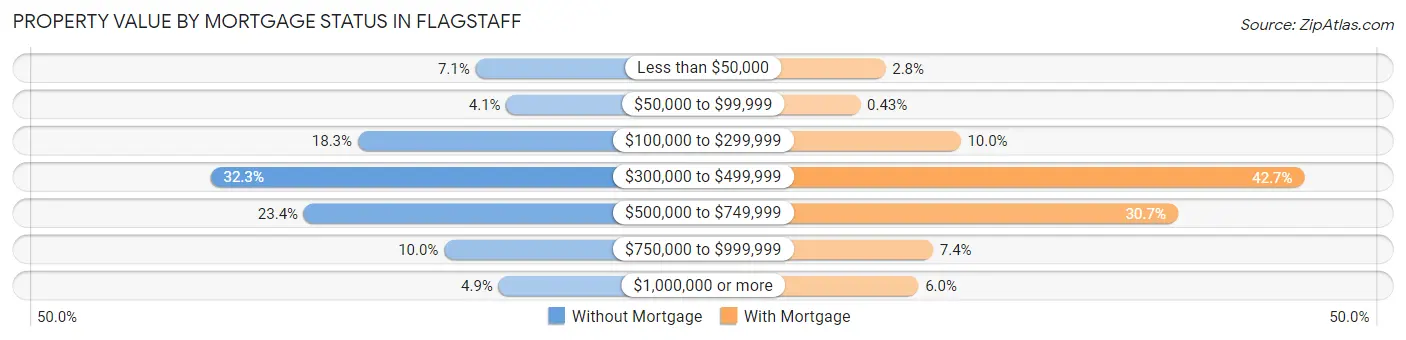
| Property Value | Without Mortgage | With Mortgage |
| Less than $50,000 | 285 (7.0%) | 216 (2.8%) |
| $50,000 to $99,999 | 166 (4.1%) | 33 (0.4%) |
| $100,000 to $299,999 | 738 (18.3%) | 762 (10.0%) |
| $300,000 to $499,999 | 1,305 (32.3%) | 3,259 (42.7%) |
| $500,000 to $749,999 | 946 (23.4%) | 2,340 (30.7%) |
| $750,000 to $999,999 | 406 (10.0%) | 561 (7.4%) |
| $1,000,000 or more | 196 (4.9%) | 455 (6.0%) |
| Total | 4,042 (100.0%) | 7,626 (100.0%) |
Household Income by Mortgage Status in Flagstaff
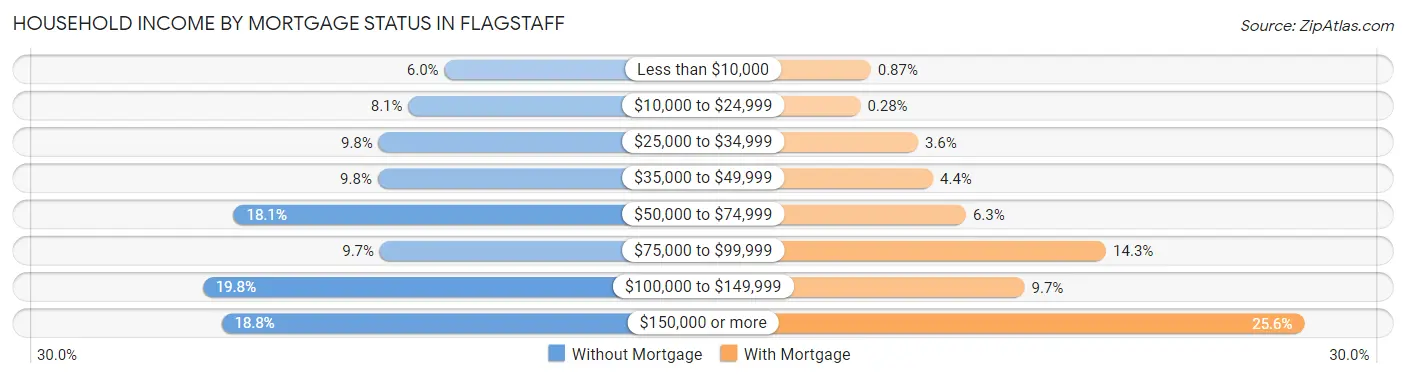
| Household Income | Without Mortgage | With Mortgage |
| Less than $10,000 | 243 (6.0%) | 66 (0.9%) |
| $10,000 to $24,999 | 326 (8.1%) | 21 (0.3%) |
| $25,000 to $34,999 | 395 (9.8%) | 272 (3.6%) |
| $35,000 to $49,999 | 397 (9.8%) | 338 (4.4%) |
| $50,000 to $74,999 | 730 (18.1%) | 481 (6.3%) |
| $75,000 to $99,999 | 392 (9.7%) | 1,092 (14.3%) |
| $100,000 to $149,999 | 801 (19.8%) | 737 (9.7%) |
| $150,000 or more | 758 (18.8%) | 1,955 (25.6%) |
| Total | 4,042 (100.0%) | 7,626 (100.0%) |
Property Value to Household Income Ratio in Flagstaff
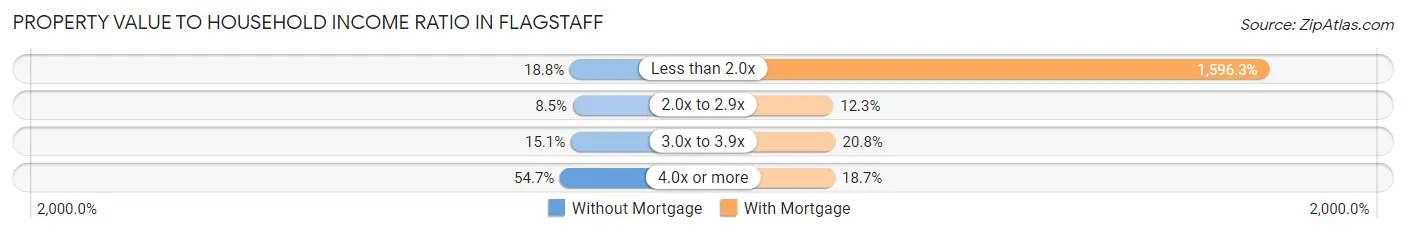
| Value-to-Income Ratio | Without Mortgage | With Mortgage |
| Less than 2.0x | 759 (18.8%) | 121,731 (1,596.3%) |
| 2.0x to 2.9x | 344 (8.5%) | 934 (12.2%) |
| 3.0x to 3.9x | 610 (15.1%) | 1,586 (20.8%) |
| 4.0x or more | 2,209 (54.6%) | 1,423 (18.7%) |
| Total | 4,042 (100.0%) | 7,626 (100.0%) |
Real Estate Taxes by Mortgage Status in Flagstaff
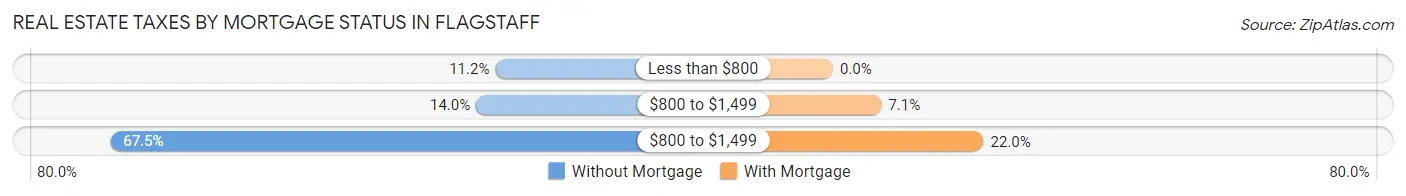
| Property Taxes | Without Mortgage | With Mortgage |
| Less than $800 | 454 (11.2%) | 0 (0.0%) |
| $800 to $1,499 | 567 (14.0%) | 539 (7.1%) |
| $800 to $1,499 | 2,727 (67.5%) | 1,678 (22.0%) |
| Total | 4,042 (100.0%) | 7,626 (100.0%) |
Health & Disability in Flagstaff
Health Insurance Coverage by Age in Flagstaff
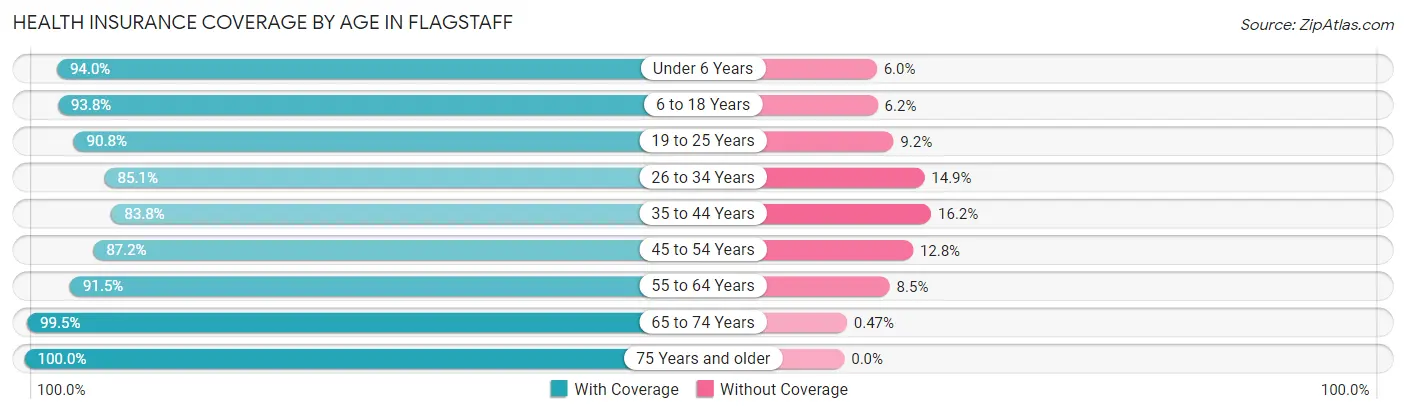
| Age Bracket | With Coverage | Without Coverage |
| Under 6 Years | 3,886 (94.0%) | 250 (6.0%) |
| 6 to 18 Years | 12,640 (93.8%) | 839 (6.2%) |
| 19 to 25 Years | 18,693 (90.8%) | 1,884 (9.2%) |
| 26 to 34 Years | 8,248 (85.1%) | 1,448 (14.9%) |
| 35 to 44 Years | 7,036 (83.8%) | 1,359 (16.2%) |
| 45 to 54 Years | 5,459 (87.2%) | 801 (12.8%) |
| 55 to 64 Years | 5,649 (91.5%) | 522 (8.5%) |
| 65 to 74 Years | 4,669 (99.5%) | 22 (0.5%) |
| 75 Years and older | 2,111 (100.0%) | 0 (0.0%) |
| Total | 68,391 (90.6%) | 7,125 (9.4%) |
Health Insurance Coverage by Citizenship Status in Flagstaff
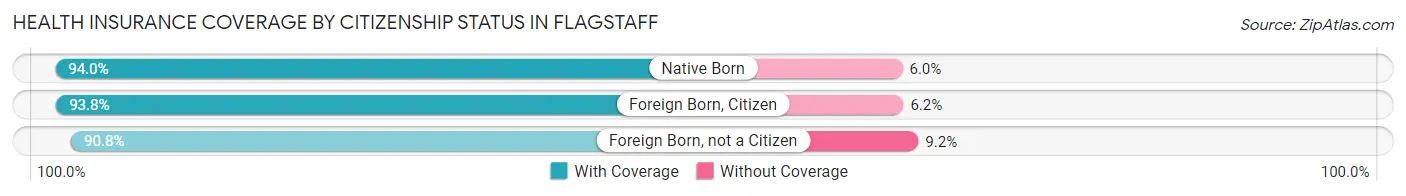
| Citizenship Status | With Coverage | Without Coverage |
| Native Born | 3,886 (94.0%) | 250 (6.0%) |
| Foreign Born, Citizen | 12,640 (93.8%) | 839 (6.2%) |
| Foreign Born, not a Citizen | 18,693 (90.8%) | 1,884 (9.2%) |
Health Insurance Coverage by Household Income in Flagstaff
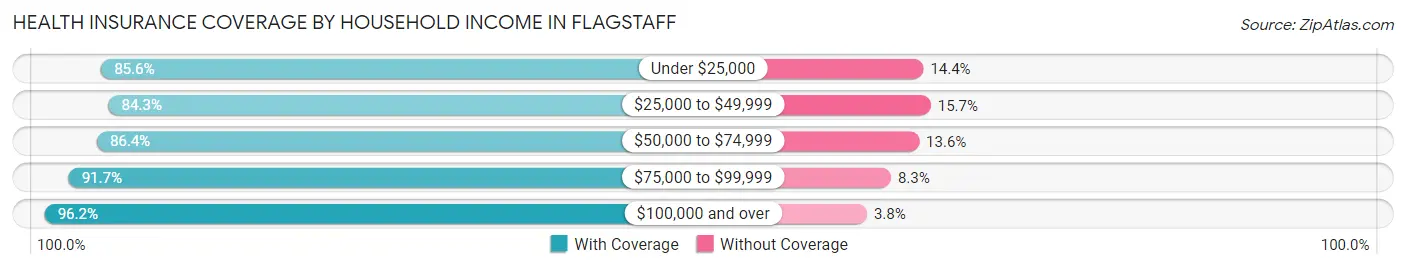
| Household Income | With Coverage | Without Coverage |
| Under $25,000 | 7,609 (85.6%) | 1,276 (14.4%) |
| $25,000 to $49,999 | 9,043 (84.3%) | 1,689 (15.7%) |
| $50,000 to $74,999 | 10,691 (86.4%) | 1,677 (13.6%) |
| $75,000 to $99,999 | 7,398 (91.7%) | 667 (8.3%) |
| $100,000 and over | 23,931 (96.2%) | 939 (3.8%) |
Public vs Private Health Insurance Coverage by Age in Flagstaff
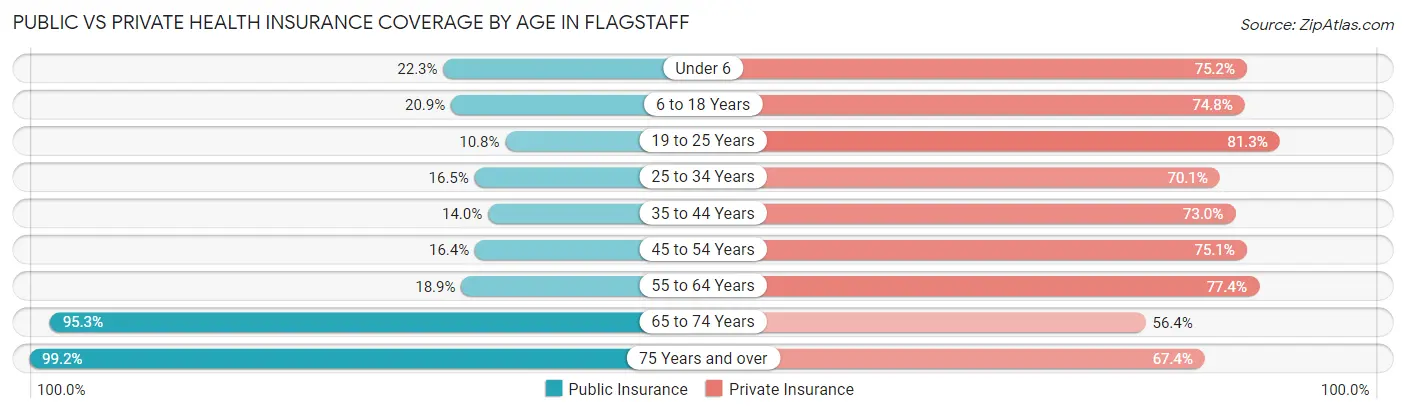
| Age Bracket | Public Insurance | Private Insurance |
| Under 6 | 921 (22.3%) | 3,109 (75.2%) |
| 6 to 18 Years | 2,811 (20.8%) | 10,076 (74.8%) |
| 19 to 25 Years | 2,217 (10.8%) | 16,718 (81.2%) |
| 25 to 34 Years | 1,597 (16.5%) | 6,799 (70.1%) |
| 35 to 44 Years | 1,174 (14.0%) | 6,128 (73.0%) |
| 45 to 54 Years | 1,026 (16.4%) | 4,704 (75.1%) |
| 55 to 64 Years | 1,169 (18.9%) | 4,775 (77.4%) |
| 65 to 74 Years | 4,472 (95.3%) | 2,645 (56.4%) |
| 75 Years and over | 2,093 (99.2%) | 1,422 (67.4%) |
| Total | 17,480 (23.2%) | 56,376 (74.7%) |
Disability Status by Sex by Age in Flagstaff
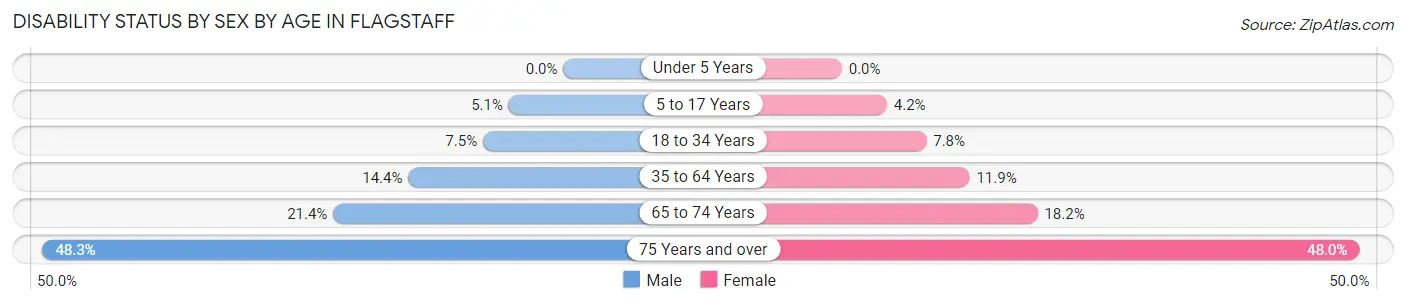
| Age Bracket | Male | Female |
| Under 5 Years | 0 (0.0%) | 0 (0.0%) |
| 5 to 17 Years | 285 (5.1%) | 188 (4.2%) |
| 18 to 34 Years | 1,226 (7.5%) | 1,426 (7.8%) |
| 35 to 64 Years | 1,551 (14.4%) | 1,191 (11.8%) |
| 65 to 74 Years | 488 (21.4%) | 437 (18.2%) |
| 75 Years and over | 480 (48.3%) | 537 (48.0%) |
Disability Class by Sex by Age in Flagstaff
Disability Class: Hearing Difficulty
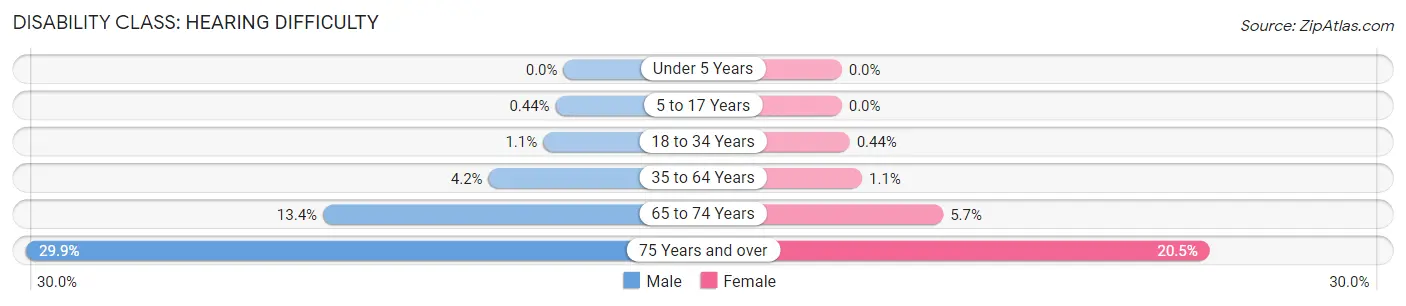
| Age Bracket | Male | Female |
| Under 5 Years | 0 (0.0%) | 0 (0.0%) |
| 5 to 17 Years | 25 (0.4%) | 0 (0.0%) |
| 18 to 34 Years | 185 (1.1%) | 80 (0.4%) |
| 35 to 64 Years | 449 (4.2%) | 114 (1.1%) |
| 65 to 74 Years | 306 (13.4%) | 136 (5.7%) |
| 75 Years and over | 297 (29.9%) | 229 (20.5%) |
Disability Class: Vision Difficulty
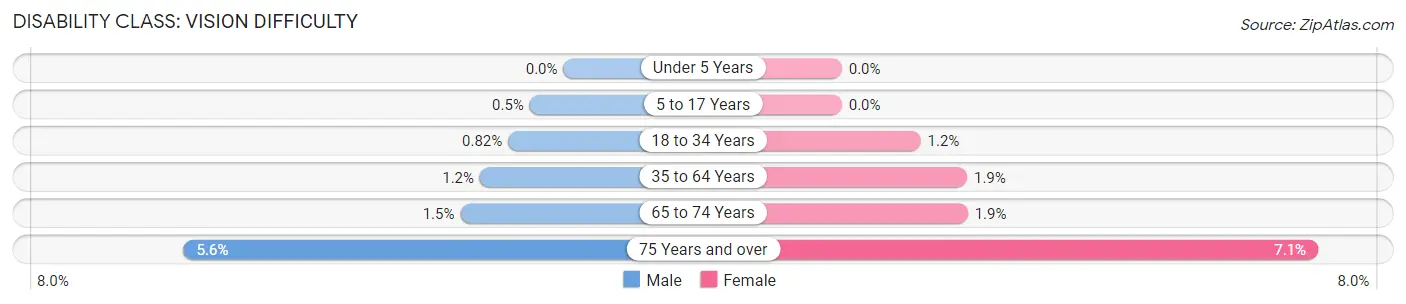
| Age Bracket | Male | Female |
| Under 5 Years | 0 (0.0%) | 0 (0.0%) |
| 5 to 17 Years | 28 (0.5%) | 0 (0.0%) |
| 18 to 34 Years | 135 (0.8%) | 213 (1.2%) |
| 35 to 64 Years | 134 (1.2%) | 187 (1.9%) |
| 65 to 74 Years | 35 (1.5%) | 45 (1.9%) |
| 75 Years and over | 56 (5.6%) | 79 (7.1%) |
Disability Class: Cognitive Difficulty
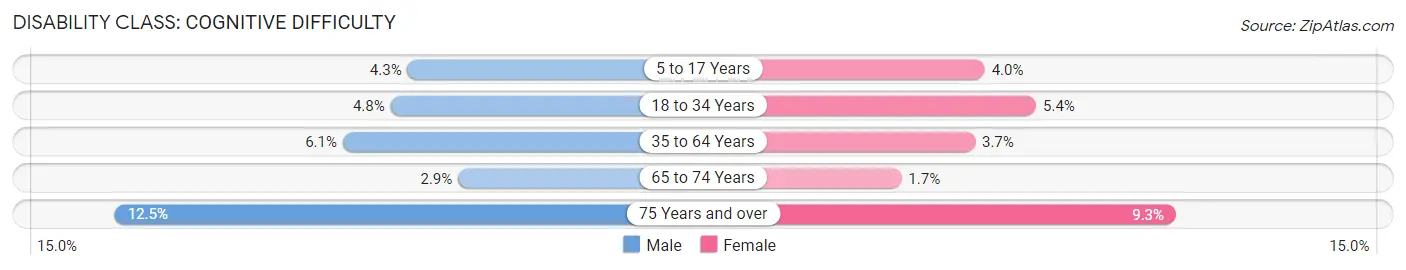
| Age Bracket | Male | Female |
| 5 to 17 Years | 244 (4.3%) | 179 (4.0%) |
| 18 to 34 Years | 790 (4.8%) | 985 (5.4%) |
| 35 to 64 Years | 662 (6.1%) | 373 (3.7%) |
| 65 to 74 Years | 67 (2.9%) | 40 (1.7%) |
| 75 Years and over | 124 (12.5%) | 104 (9.3%) |
Disability Class: Ambulatory Difficulty
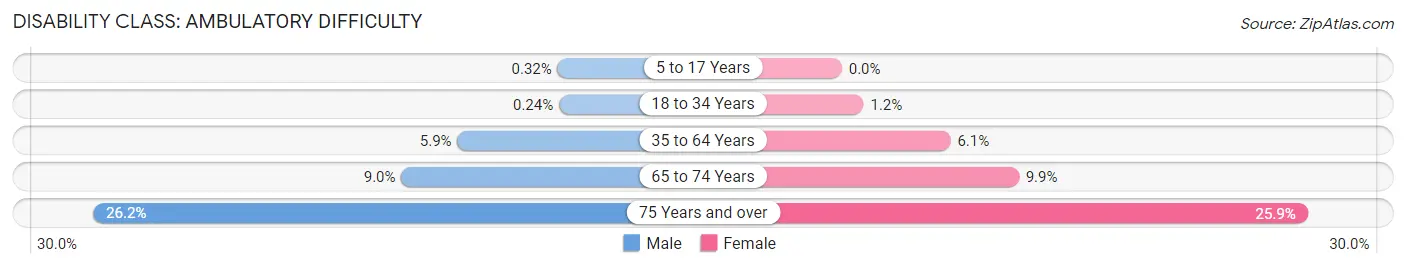
| Age Bracket | Male | Female |
| 5 to 17 Years | 18 (0.3%) | 0 (0.0%) |
| 18 to 34 Years | 39 (0.2%) | 220 (1.2%) |
| 35 to 64 Years | 636 (5.9%) | 608 (6.0%) |
| 65 to 74 Years | 206 (9.0%) | 237 (9.9%) |
| 75 Years and over | 260 (26.2%) | 290 (25.9%) |
Disability Class: Self-Care Difficulty
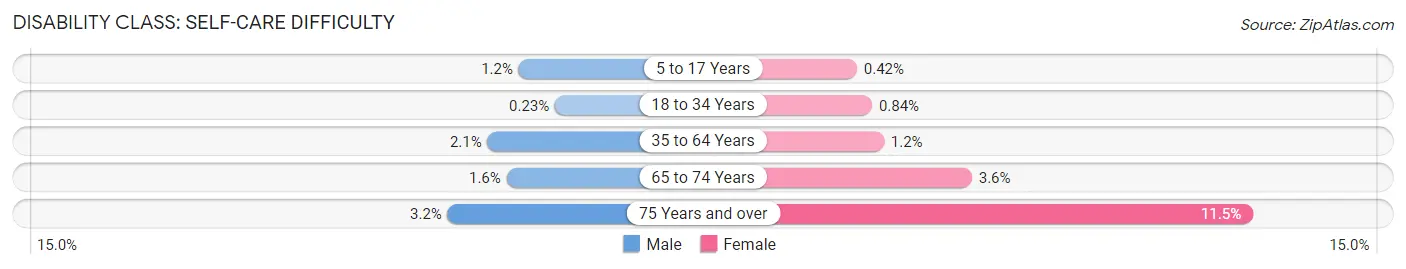
| Age Bracket | Male | Female |
| 5 to 17 Years | 70 (1.2%) | 19 (0.4%) |
| 18 to 34 Years | 38 (0.2%) | 153 (0.8%) |
| 35 to 64 Years | 227 (2.1%) | 118 (1.2%) |
| 65 to 74 Years | 36 (1.6%) | 87 (3.6%) |
| 75 Years and over | 32 (3.2%) | 128 (11.5%) |
Technology Access in Flagstaff
Computing Device Access in Flagstaff
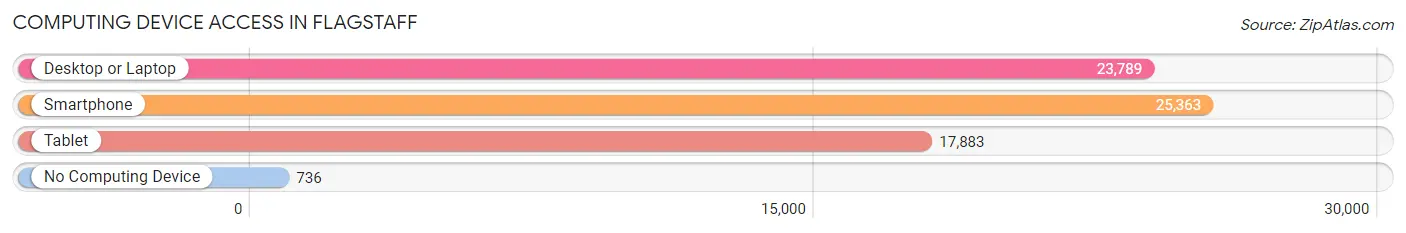
| Device Type | # Households | % Households |
| Desktop or Laptop | 23,789 | 87.9% |
| Smartphone | 25,363 | 93.7% |
| Tablet | 17,883 | 66.1% |
| No Computing Device | 736 | 2.7% |
| Total | 27,062 | 100.0% |
Internet Access in Flagstaff
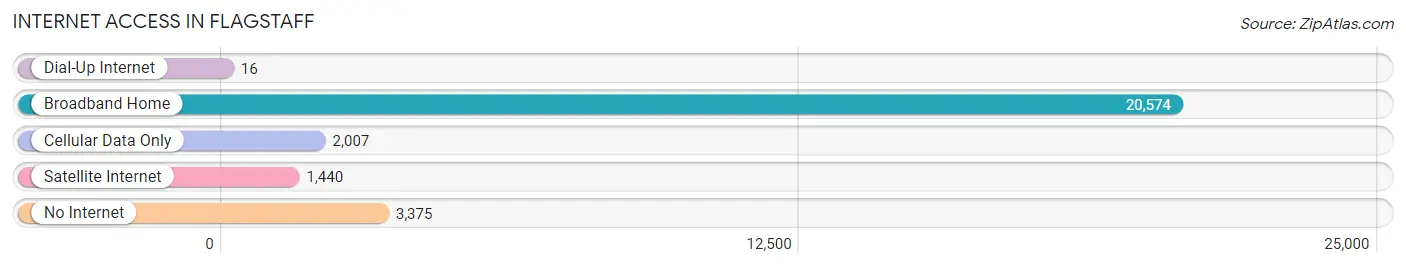
| Internet Type | # Households | % Households |
| Dial-Up Internet | 16 | 0.1% |
| Broadband Home | 20,574 | 76.0% |
| Cellular Data Only | 2,007 | 7.4% |
| Satellite Internet | 1,440 | 5.3% |
| No Internet | 3,375 | 12.5% |
| Total | 27,062 | 100.0% |
Flagstaff Summary
Flagstaff, Arizona is a city located in the northern part of the state, in Coconino County. It is the county seat and the largest city in the county. Flagstaff is located at an elevation of 6,910 feet, making it the highest city in the United States. The city is located in the Coconino National Forest and is surrounded by the San Francisco Peaks, the highest mountain range in Arizona. Flagstaff is a popular tourist destination due to its proximity to the Grand Canyon, the Petrified Forest National Park, and the Navajo Nation.
History
Flagstaff was founded in 1876 by a group of settlers led by William R. Bradford. The settlers were looking for a place to build a railroad station and chose the area due to its high elevation and its proximity to the Grand Canyon. The city was named after a flagpole that was erected in the area by the settlers.
The city quickly grew and by the early 1900s, it had become a major hub for the lumber and railroad industries. The city was also home to a number of educational institutions, including Northern Arizona University, which was founded in 1899.
In the 1950s, Flagstaff began to experience a population boom due to the development of the Grand Canyon National Park and the establishment of the Lowell Observatory. The city also became a popular tourist destination due to its proximity to the Grand Canyon and other nearby attractions.
Geography
Flagstaff is located in the northern part of Arizona, in Coconino County. It is situated at an elevation of 6,910 feet, making it the highest city in the United States. The city is surrounded by the San Francisco Peaks, the highest mountain range in Arizona. Flagstaff is located in the Coconino National Forest and is close to the Grand Canyon, the Petrified Forest National Park, and the Navajo Nation.
The city has a total area of 64.2 square miles, of which 62.2 square miles is land and 2.0 square miles is water. Flagstaff has a semi-arid climate, with hot summers and cold winters. The average annual temperature is 52.2 degrees Fahrenheit.
Economy
Flagstaff’s economy is largely based on tourism, education, and government services. The city is home to Northern Arizona University, which is the largest employer in the city. Other major employers include the Flagstaff Medical Center, the Flagstaff Unified School District, and the Coconino County government.
The city is also a popular tourist destination due to its proximity to the Grand Canyon, the Petrified Forest National Park, and the Navajo Nation. Flagstaff is home to a number of attractions, including the Lowell Observatory, the Museum of Northern Arizona, and the Flagstaff Symphony Orchestra.
Demographics
As of the 2010 census, Flagstaff had a population of 65,870. The racial makeup of the city was 73.2% White, 2.2% African American, 1.3% Native American, 1.9% Asian, 0.2% Pacific Islander, 17.3% from other races, and 4.1% from two or more races. Hispanic or Latino of any race were 30.2% of the population.
The median income for a household in Flagstaff was $45,945, and the median income for a family was $54,817. The per capita income for the city was $25,845. About 15.2% of the population was below the poverty line.
Flagstaff is a diverse city with a rich history and a vibrant economy. The city is home to a number of educational institutions, attractions, and businesses, making it a popular tourist destination. Flagstaff is also surrounded by the San Francisco Peaks and the Coconino National Forest, making it a great place to explore the outdoors.
Common Questions
What is Per Capita Income in Flagstaff?
Per Capita income in Flagstaff is $32,124.
What is the Median Family Income in Flagstaff?
Median Family Income in Flagstaff is $89,827.
What is the Median Household income in Flagstaff?
Median Household Income in Flagstaff is $65,652.
What is Income or Wage Gap in Flagstaff?
Income or Wage Gap in Flagstaff is 27.1%.
Women in Flagstaff earn 72.9 cents for every dollar earned by a man.
What is Family Income Deficit in Flagstaff?
Family Income Deficit in Flagstaff is $11,189.
Families that are below poverty line in Flagstaff earn $11,189 less on average than the poverty threshold level.
What is Inequality or Gini Index in Flagstaff?
Inequality or Gini Index in Flagstaff is 0.47.
What is the Total Population of Flagstaff?
Total Population of Flagstaff is 76,177.
What is the Total Male Population of Flagstaff?
Total Male Population of Flagstaff is 38,213.
What is the Total Female Population of Flagstaff?
Total Female Population of Flagstaff is 37,964.
What is the Ratio of Males per 100 Females in Flagstaff?
There are 100.66 Males per 100 Females in Flagstaff.
What is the Ratio of Females per 100 Males in Flagstaff?
There are 99.35 Females per 100 Males in Flagstaff.
What is the Median Population Age in Flagstaff?
Median Population Age in Flagstaff is 25.9 Years.
What is the Average Family Size in Flagstaff
Average Family Size in Flagstaff is 3.0 People.
What is the Average Household Size in Flagstaff
Average Household Size in Flagstaff is 2.4 People.
How Large is the Labor Force in Flagstaff?
There are 42,189 People in the Labor Forcein in Flagstaff.
What is the Percentage of People in the Labor Force in Flagstaff?
65.5% of People are in the Labor Force in Flagstaff.
What is the Unemployment Rate in Flagstaff?
Unemployment Rate in Flagstaff is 6.6%.