Maricopa County, AZ Map & Demographics
Maricopa County Map
Maricopa County Overview
$41,533
PER CAPITA INCOME
$94,672
AVG FAMILY INCOME
$80,675
AVG HOUSEHOLD INCOME
21.1%
WAGE / INCOME GAP [ % ]
78.9¢/ $1
WAGE / INCOME GAP [ $ ]
$11,849
FAMILY INCOME DEFICIT
0.46
INEQUALITY / GINI INDEX
4,430,871
TOTAL POPULATION
2,208,150
MALE POPULATION
2,222,721
FEMALE POPULATION
99.34
MALES / 100 FEMALES
100.66
FEMALES / 100 MALES
37.1
MEDIAN AGE
3.2
AVG FAMILY SIZE
2.6
AVG HOUSEHOLD SIZE
2,292,514
LABOR FORCE [ PEOPLE ]
65.0%
PERCENT IN LABOR FORCE
4.8%
UNEMPLOYMENT RATE
Income in Maricopa County
Income Overview in Maricopa County
Per Capita Income in Maricopa County is $41,533, while median incomes of families and households are $94,672 and $80,675 respectively.
| Characteristic | Number | Measure |
| Per Capita Income | 4,430,871 | $41,533 |
| Median Family Income | 1,091,800 | $94,672 |
| Mean Family Income | 1,091,800 | $123,680 |
| Median Household Income | 1,665,560 | $80,675 |
| Mean Household Income | 1,665,560 | $108,596 |
| Income Deficit | 1,091,800 | $11,849 |
| Wage / Income Gap (%) | 4,430,871 | 21.08% |
| Wage / Income Gap ($) | 4,430,871 | 78.92¢ per $1 |
| Gini / Inequality Index | 4,430,871 | 0.46 |
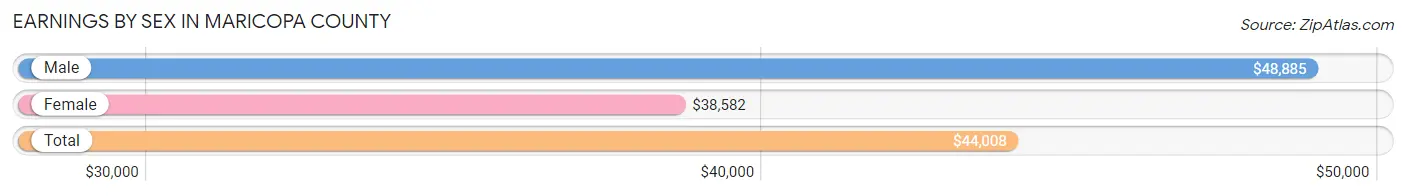
Earnings by Sex in Maricopa County
Average Earnings in Maricopa County are $44,008, $48,885 for men and $38,582 for women, a difference of 21.1%.
| Sex | Number | Average Earnings |
| Male | 1,274,947 (53.9%) | $48,885 |
| Female | 1,089,893 (46.1%) | $38,582 |
| Total | 2,364,840 (100.0%) | $44,008 |
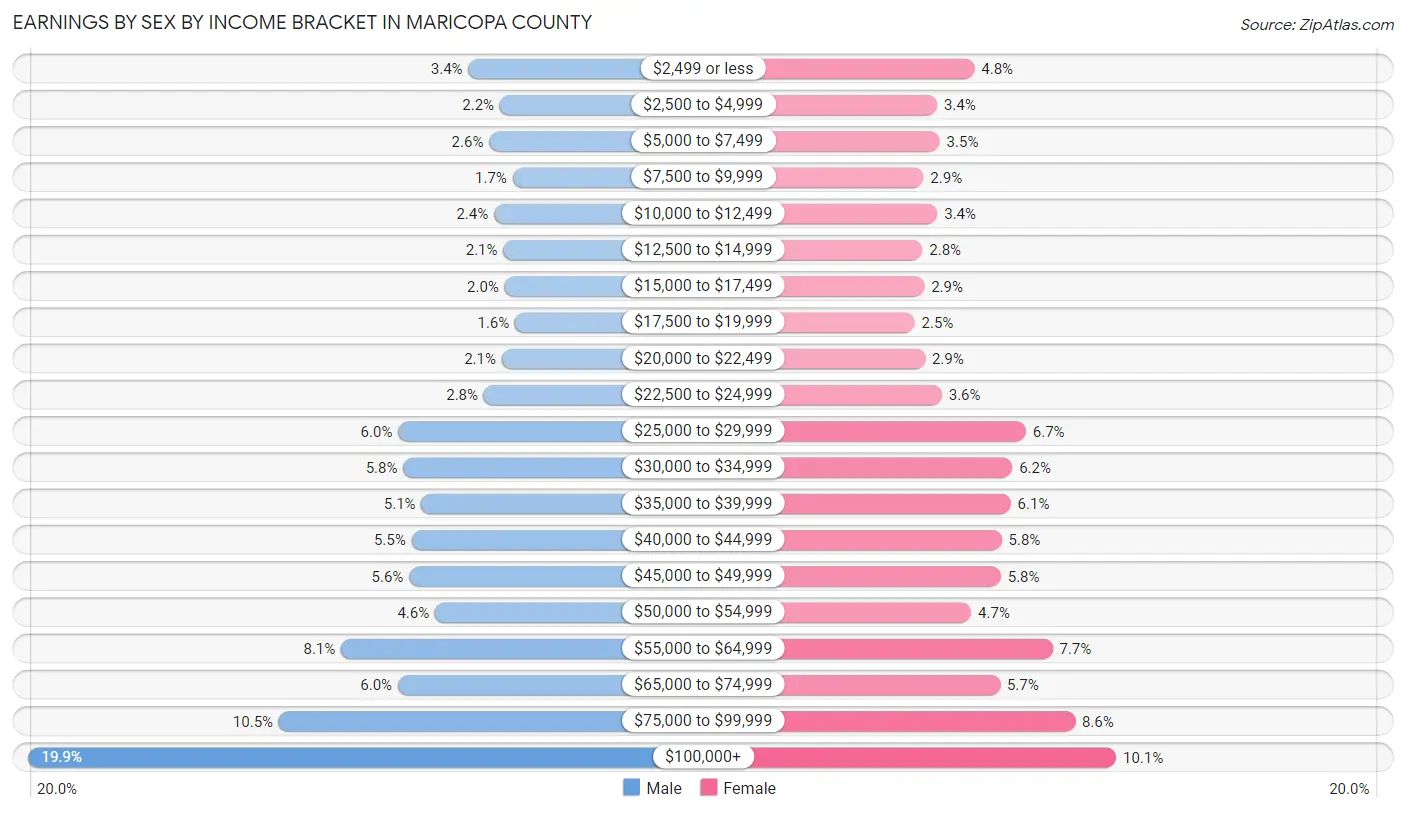
Earnings by Sex by Income Bracket in Maricopa County
The most common earnings brackets in Maricopa County are $100,000+ for men (253,049 | 19.9%) and $100,000+ for women (109,987 | 10.1%).
| Income | Male | Female |
| $2,499 or less | 42,908 (3.4%) | 52,073 (4.8%) |
| $2,500 to $4,999 | 27,916 (2.2%) | 36,784 (3.4%) |
| $5,000 to $7,499 | 33,033 (2.6%) | 37,968 (3.5%) |
| $7,500 to $9,999 | 21,778 (1.7%) | 31,234 (2.9%) |
| $10,000 to $12,499 | 30,731 (2.4%) | 36,901 (3.4%) |
| $12,500 to $14,999 | 26,252 (2.1%) | 30,817 (2.8%) |
| $15,000 to $17,499 | 25,607 (2.0%) | 31,610 (2.9%) |
| $17,500 to $19,999 | 20,671 (1.6%) | 27,635 (2.5%) |
| $20,000 to $22,499 | 27,090 (2.1%) | 31,886 (2.9%) |
| $22,500 to $24,999 | 35,593 (2.8%) | 38,778 (3.6%) |
| $25,000 to $29,999 | 76,445 (6.0%) | 73,172 (6.7%) |
| $30,000 to $34,999 | 74,092 (5.8%) | 67,617 (6.2%) |
| $35,000 to $39,999 | 65,407 (5.1%) | 66,875 (6.1%) |
| $40,000 to $44,999 | 70,125 (5.5%) | 63,196 (5.8%) |
| $45,000 to $49,999 | 71,300 (5.6%) | 62,906 (5.8%) |
| $50,000 to $54,999 | 58,962 (4.6%) | 50,772 (4.7%) |
| $55,000 to $64,999 | 103,831 (8.1%) | 83,987 (7.7%) |
| $65,000 to $74,999 | 76,663 (6.0%) | 62,523 (5.7%) |
| $75,000 to $99,999 | 133,494 (10.5%) | 93,172 (8.6%) |
| $100,000+ | 253,049 (19.9%) | 109,987 (10.1%) |
| Total | 1,274,947 (100.0%) | 1,089,893 (100.0%) |
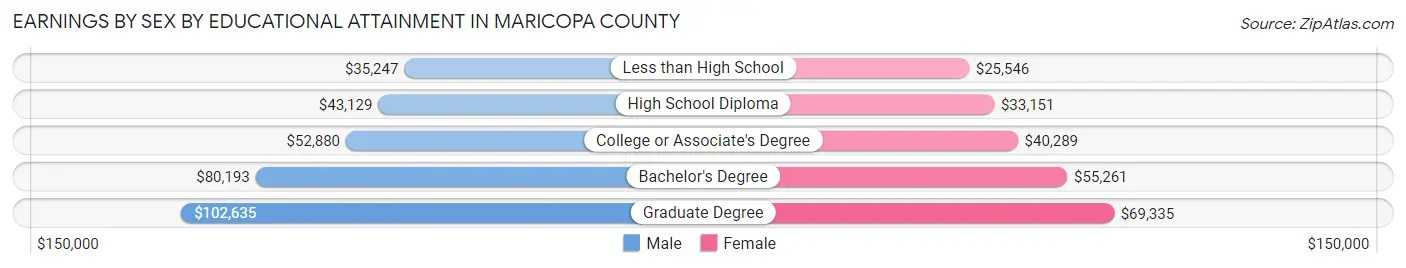
Earnings by Sex by Educational Attainment in Maricopa County
Average earnings in Maricopa County are $55,885 for men and $43,931 for women, a difference of 21.4%. Men with an educational attainment of graduate degree enjoy the highest average annual earnings of $102,635, while those with less than high school education earn the least with $35,247. Women with an educational attainment of graduate degree earn the most with the average annual earnings of $69,335, while those with less than high school education have the smallest earnings of $25,546.
| Educational Attainment | Male Income | Female Income |
| Less than High School | $35,247 | $25,546 |
| High School Diploma | $43,129 | $33,151 |
| College or Associate's Degree | $52,880 | $40,289 |
| Bachelor's Degree | $80,193 | $55,261 |
| Graduate Degree | $102,635 | $69,335 |
| Total | $55,885 | $43,931 |
Family Income in Maricopa County
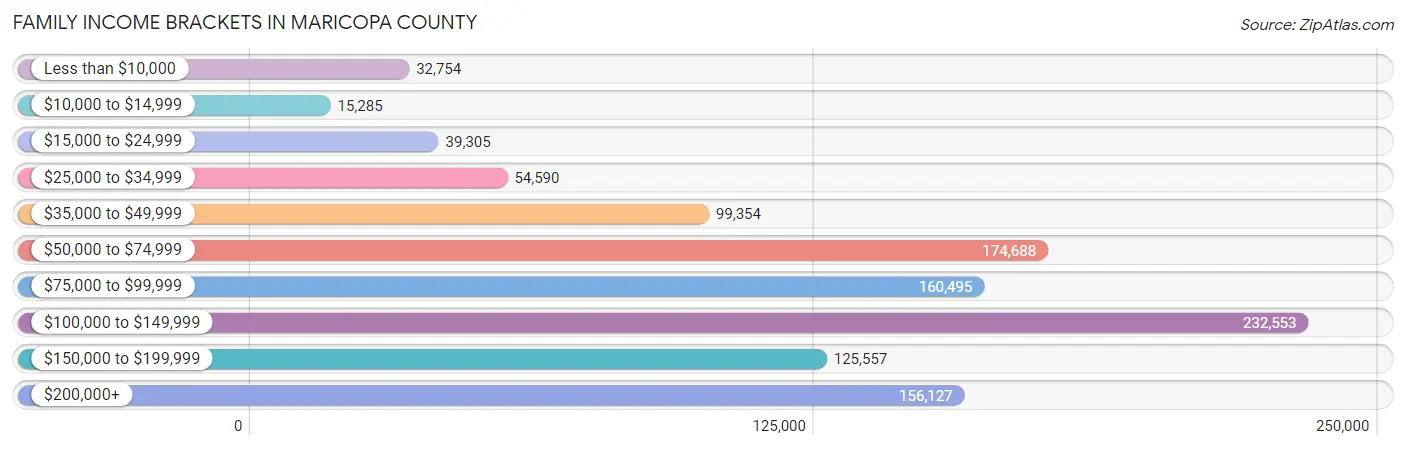
Family Income Brackets in Maricopa County
According to the Maricopa County family income data, there are 232,553 families falling into the $100,000 to $149,999 income range, which is the most common income bracket and makes up 21.3% of all families. Conversely, the $10,000 to $14,999 income bracket is the least frequent group with only 15,285 families (1.4%) belonging to this category.
| Income Bracket | # Families | % Families |
| Less than $10,000 | 32,754 | 3.0% |
| $10,000 to $14,999 | 15,285 | 1.4% |
| $15,000 to $24,999 | 39,305 | 3.6% |
| $25,000 to $34,999 | 54,590 | 5.0% |
| $35,000 to $49,999 | 99,354 | 9.1% |
| $50,000 to $74,999 | 174,688 | 16.0% |
| $75,000 to $99,999 | 160,495 | 14.7% |
| $100,000 to $149,999 | 232,553 | 21.3% |
| $150,000 to $199,999 | 125,557 | 11.5% |
| $200,000+ | 156,127 | 14.3% |
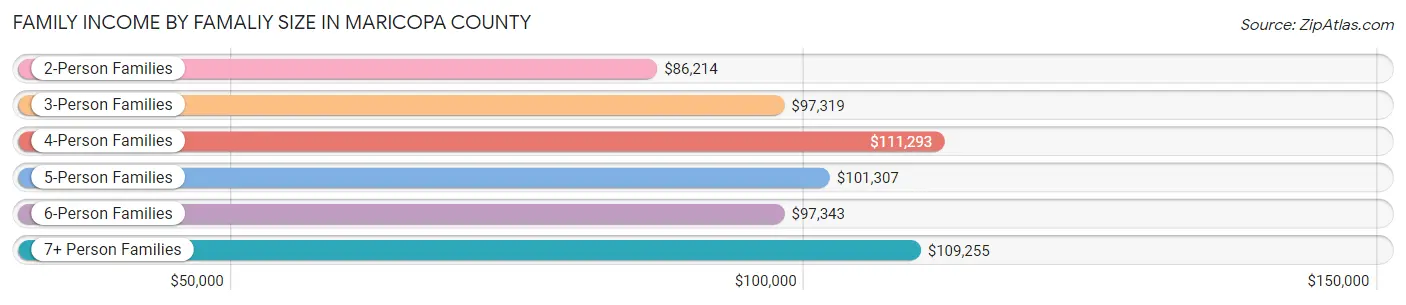
Family Income by Famaliy Size in Maricopa County
4-person families (192,331 | 17.6%) account for the highest median family income in Maricopa County with $111,293 per family, while 2-person families (497,640 | 45.6%) have the highest median income of $43,107 per family member.
| Income Bracket | # Families | Median Income |
| 2-Person Families | 497,640 (45.6%) | $86,214 |
| 3-Person Families | 228,517 (20.9%) | $97,319 |
| 4-Person Families | 192,331 (17.6%) | $111,293 |
| 5-Person Families | 99,875 (9.1%) | $101,307 |
| 6-Person Families | 44,024 (4.0%) | $97,343 |
| 7+ Person Families | 29,413 (2.7%) | $109,255 |
| Total | 1,091,800 (100.0%) | $94,672 |
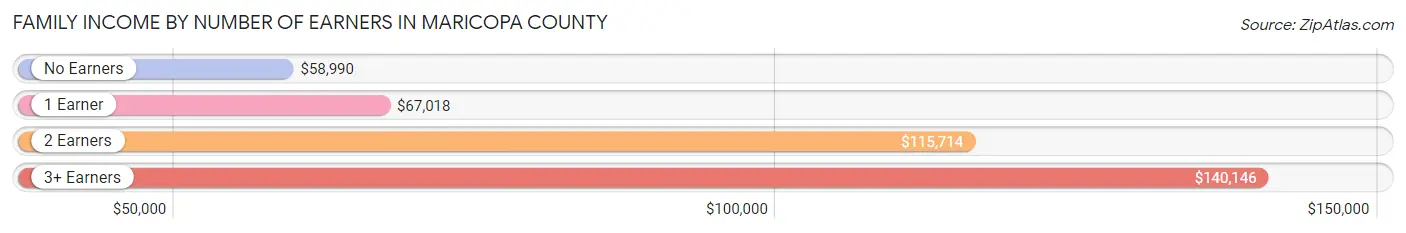
Family Income by Number of Earners in Maricopa County
The median family income in Maricopa County is $94,672, with families comprising 3+ earners (135,853) having the highest median family income of $140,146, while families with no earners (163,110) have the lowest median family income of $58,990, accounting for 12.4% and 14.9% of families, respectively.
| Number of Earners | # Families | Median Income |
| No Earners | 163,110 (14.9%) | $58,990 |
| 1 Earner | 347,125 (31.8%) | $67,018 |
| 2 Earners | 445,712 (40.8%) | $115,714 |
| 3+ Earners | 135,853 (12.4%) | $140,146 |
| Total | 1,091,800 (100.0%) | $94,672 |
Household Income in Maricopa County
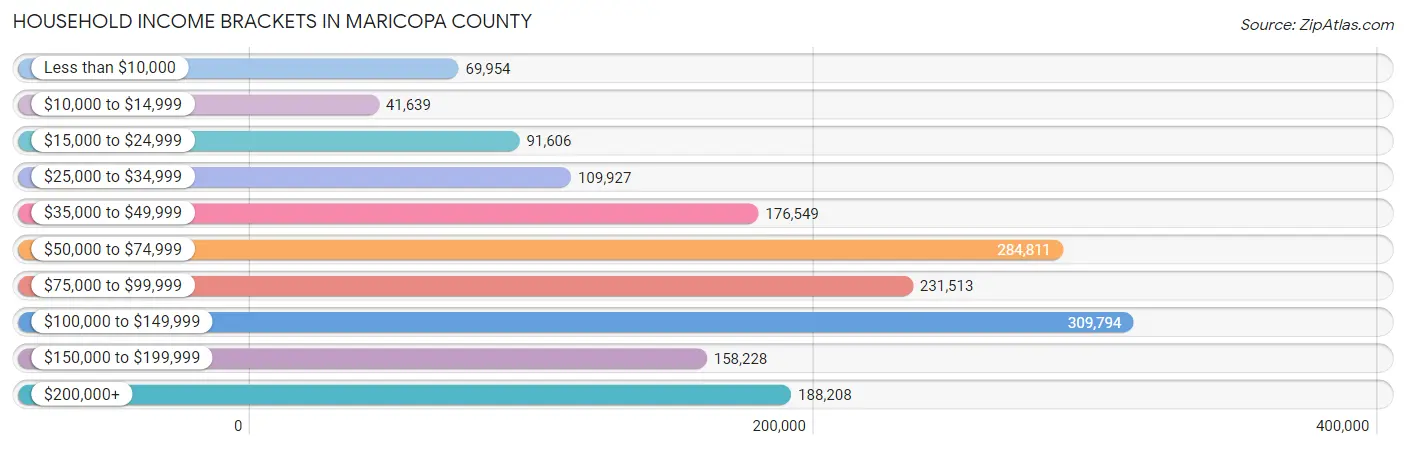
Household Income Brackets in Maricopa County
With 309,794 households falling in the category, the $100,000 to $149,999 income range is the most frequent in Maricopa County, accounting for 18.6% of all households. In contrast, only 41,639 households (2.5%) fall into the $10,000 to $14,999 income bracket, making it the least populous group.
| Income Bracket | # Households | % Households |
| Less than $10,000 | 69,954 | 4.2% |
| $10,000 to $14,999 | 41,639 | 2.5% |
| $15,000 to $24,999 | 91,606 | 5.5% |
| $25,000 to $34,999 | 109,927 | 6.6% |
| $35,000 to $49,999 | 176,549 | 10.6% |
| $50,000 to $74,999 | 284,811 | 17.1% |
| $75,000 to $99,999 | 231,513 | 13.9% |
| $100,000 to $149,999 | 309,794 | 18.6% |
| $150,000 to $199,999 | 158,228 | 9.5% |
| $200,000+ | 188,208 | 11.3% |
Household Income by Householder Age in Maricopa County
The median household income in Maricopa County is $80,675, with the highest median household income of $97,879 found in the 45 to 64 years age bracket for the primary householder. A total of 593,407 households (35.6%) fall into this category. Meanwhile, the 15 to 24 years age bracket for the primary householder has the lowest median household income of $51,209, with 73,906 households (4.4%) in this group.
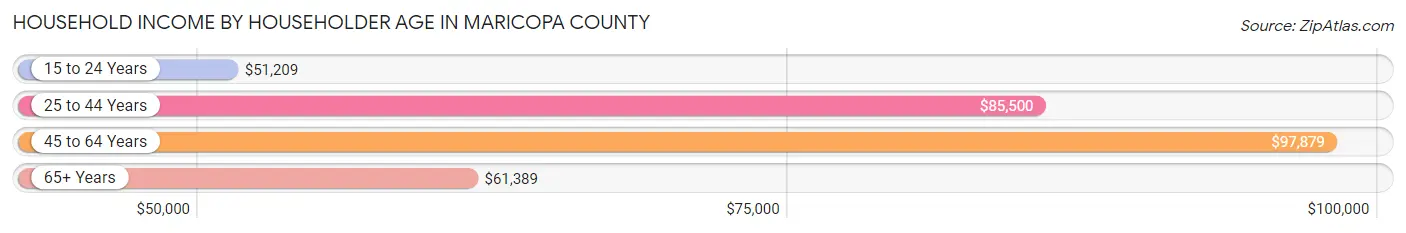
| Income Bracket | # Households | Median Income |
| 15 to 24 Years | 73,906 (4.4%) | $51,209 |
| 25 to 44 Years | 583,013 (35.0%) | $85,500 |
| 45 to 64 Years | 593,407 (35.6%) | $97,879 |
| 65+ Years | 415,234 (24.9%) | $61,389 |
| Total | 1,665,560 (100.0%) | $80,675 |
Poverty in Maricopa County
Income Below Poverty by Sex and Age in Maricopa County
With 10.6% poverty level for males and 12.4% for females among the residents of Maricopa County, 5 year old males and 18 to 24 year old females are the most vulnerable to poverty, with 4,631 males (17.5%) and 34,198 females (17.5%) in their respective age groups living below the poverty level.
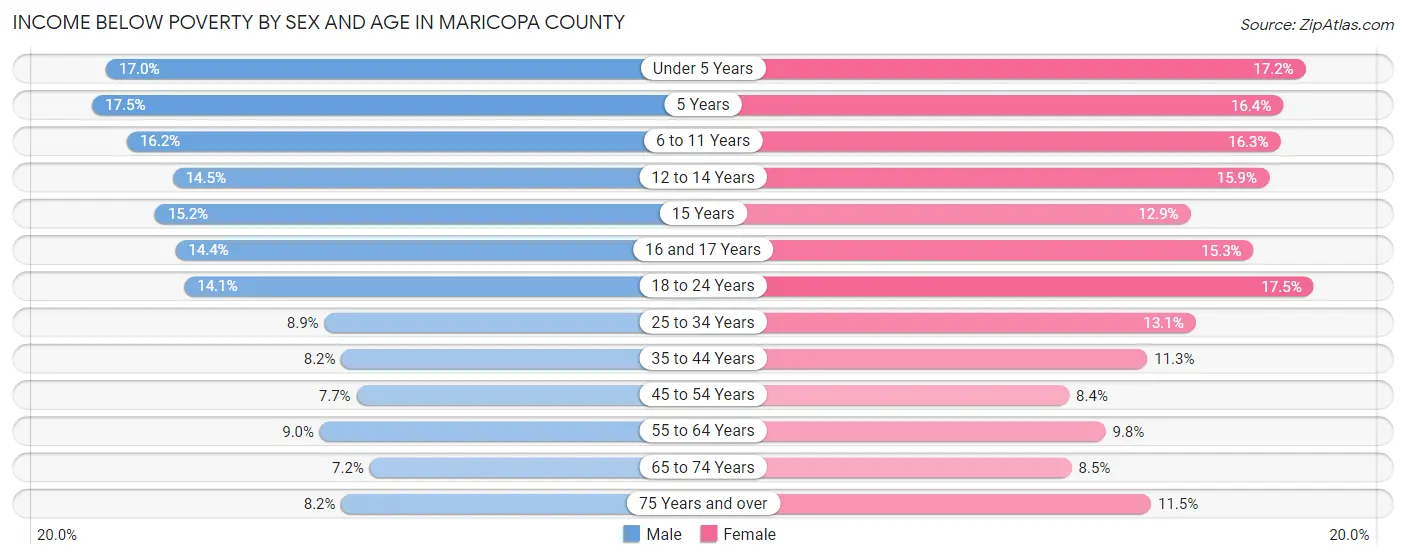
| Age Bracket | Male | Female |
| Under 5 Years | 22,101 (17.0%) | 21,507 (17.2%) |
| 5 Years | 4,631 (17.5%) | 4,320 (16.4%) |
| 6 to 11 Years | 28,157 (16.2%) | 26,663 (16.3%) |
| 12 to 14 Years | 13,340 (14.5%) | 14,082 (15.9%) |
| 15 Years | 4,911 (15.2%) | 3,827 (12.9%) |
| 16 and 17 Years | 8,684 (14.4%) | 9,019 (15.3%) |
| 18 to 24 Years | 29,210 (14.1%) | 34,198 (17.5%) |
| 25 to 34 Years | 28,752 (8.9%) | 41,068 (13.1%) |
| 35 to 44 Years | 24,163 (8.2%) | 32,428 (11.3%) |
| 45 to 54 Years | 21,010 (7.7%) | 23,042 (8.4%) |
| 55 to 64 Years | 22,617 (9.0%) | 25,673 (9.8%) |
| 65 to 74 Years | 13,225 (7.2%) | 18,089 (8.5%) |
| 75 Years and over | 10,295 (8.2%) | 18,553 (11.5%) |
| Total | 231,096 (10.6%) | 272,469 (12.4%) |
Income Above Poverty by Sex and Age in Maricopa County
According to the poverty statistics in Maricopa County, males aged 65 to 74 years and females aged 45 to 54 years are the age groups that are most secure financially, with 92.8% of males and 91.6% of females in these age groups living above the poverty line.
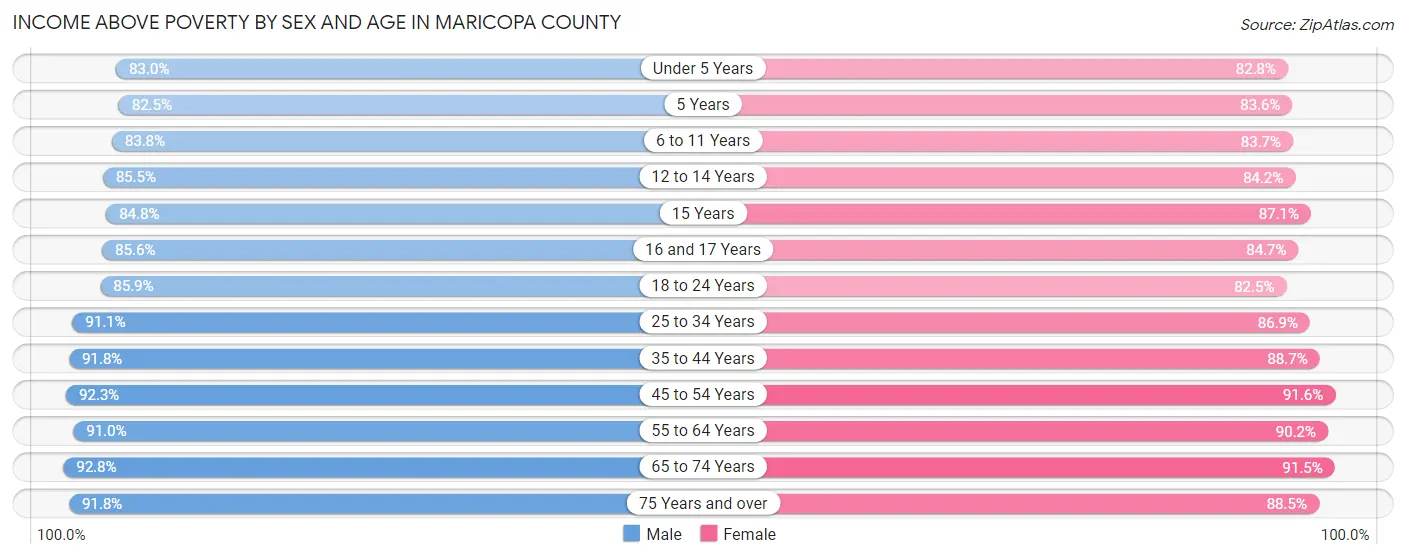
| Age Bracket | Male | Female |
| Under 5 Years | 108,159 (83.0%) | 103,457 (82.8%) |
| 5 Years | 21,851 (82.5%) | 22,049 (83.6%) |
| 6 to 11 Years | 145,679 (83.8%) | 137,139 (83.7%) |
| 12 to 14 Years | 78,648 (85.5%) | 74,790 (84.2%) |
| 15 Years | 27,493 (84.8%) | 25,749 (87.1%) |
| 16 and 17 Years | 51,611 (85.6%) | 49,999 (84.7%) |
| 18 to 24 Years | 178,455 (85.9%) | 161,107 (82.5%) |
| 25 to 34 Years | 295,464 (91.1%) | 271,643 (86.9%) |
| 35 to 44 Years | 269,022 (91.8%) | 253,482 (88.7%) |
| 45 to 54 Years | 252,509 (92.3%) | 249,834 (91.6%) |
| 55 to 64 Years | 227,700 (91.0%) | 236,467 (90.2%) |
| 65 to 74 Years | 170,599 (92.8%) | 193,946 (91.5%) |
| 75 Years and over | 114,639 (91.8%) | 142,992 (88.5%) |
| Total | 1,941,829 (89.4%) | 1,922,654 (87.6%) |
Income Below Poverty Among Married-Couple Families in Maricopa County
The poverty statistics for married-couple families in Maricopa County show that 4.8% or 37,654 of the total 790,888 families live below the poverty line. Families with 5 or more children have the highest poverty rate of 17.5%, comprising of 1,612 families. On the other hand, families with no children have the lowest poverty rate of 3.4%, which includes 15,402 families.
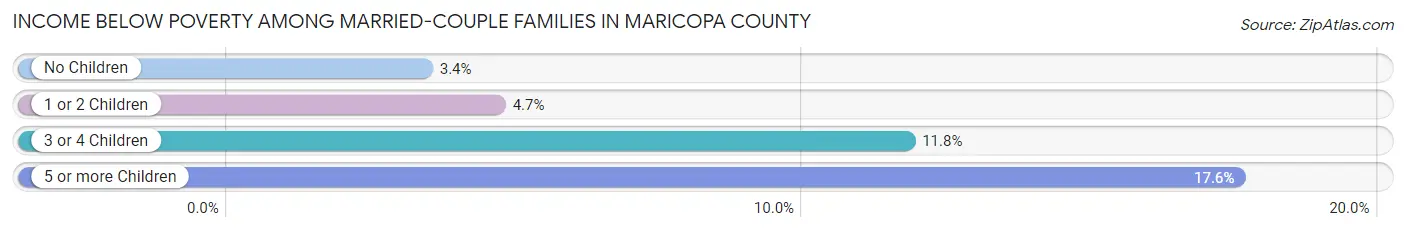
| Children | Above Poverty | Below Poverty |
| No Children | 438,695 (96.6%) | 15,402 (3.4%) |
| 1 or 2 Children | 240,349 (95.3%) | 11,739 (4.7%) |
| 3 or 4 Children | 66,616 (88.2%) | 8,901 (11.8%) |
| 5 or more Children | 7,574 (82.5%) | 1,612 (17.5%) |
| Total | 753,234 (95.2%) | 37,654 (4.8%) |
Income Below Poverty Among Single-Parent Households in Maricopa County
According to the poverty data in Maricopa County, 10.6% or 10,405 single-father households and 20.2% or 40,847 single-mother households are living below the poverty line. Among single-father households, those with 5 or more children have the highest poverty rate, with 318 households (25.2%) experiencing poverty. Likewise, among single-mother households, those with 5 or more children have the highest poverty rate, with 2,199 households (64.2%) falling below the poverty line.
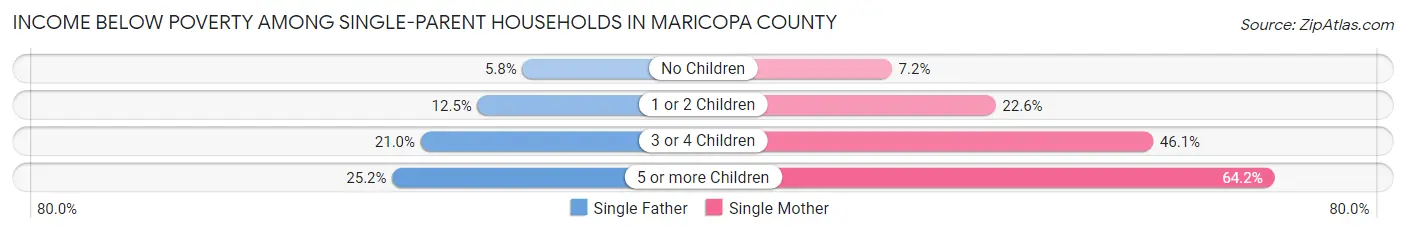
| Children | Single Father | Single Mother |
| No Children | 2,397 (5.8%) | 5,367 (7.1%) |
| 1 or 2 Children | 5,840 (12.5%) | 23,094 (22.6%) |
| 3 or 4 Children | 1,850 (20.9%) | 10,187 (46.1%) |
| 5 or more Children | 318 (25.2%) | 2,199 (64.2%) |
| Total | 10,405 (10.6%) | 40,847 (20.2%) |
Income Below Poverty Among Married-Couple vs Single-Parent Households in Maricopa County
The poverty data for Maricopa County shows that 37,654 of the married-couple family households (4.8%) and 51,252 of the single-parent households (17.0%) are living below the poverty level. Within the married-couple family households, those with 5 or more children have the highest poverty rate, with 1,612 households (17.5%) falling below the poverty line. Among the single-parent households, those with 5 or more children have the highest poverty rate, with 2,517 household (53.7%) living below poverty.
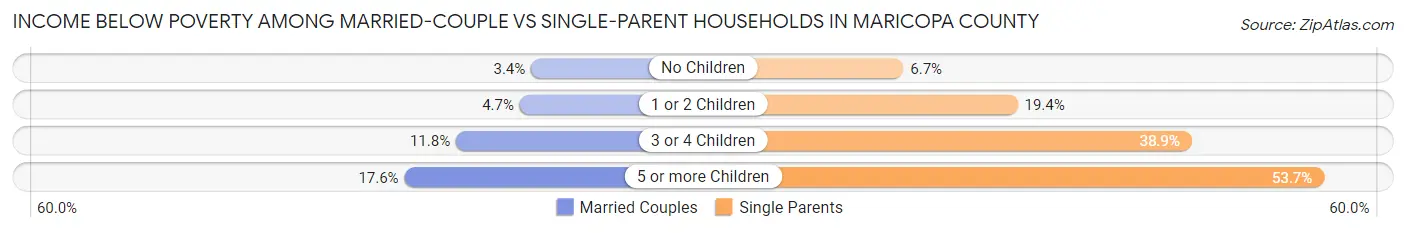
| Children | Married-Couple Families | Single-Parent Households |
| No Children | 15,402 (3.4%) | 7,764 (6.7%) |
| 1 or 2 Children | 11,739 (4.7%) | 28,934 (19.4%) |
| 3 or 4 Children | 8,901 (11.8%) | 12,037 (38.9%) |
| 5 or more Children | 1,612 (17.5%) | 2,517 (53.7%) |
| Total | 37,654 (4.8%) | 51,252 (17.0%) |
Race in Maricopa County
The most populous races in Maricopa County are White / Caucasian (2,954,182 | 66.7%), Hispanic or Latino (1,402,753 | 31.7%), and Two or more Races (602,000 | 13.6%).
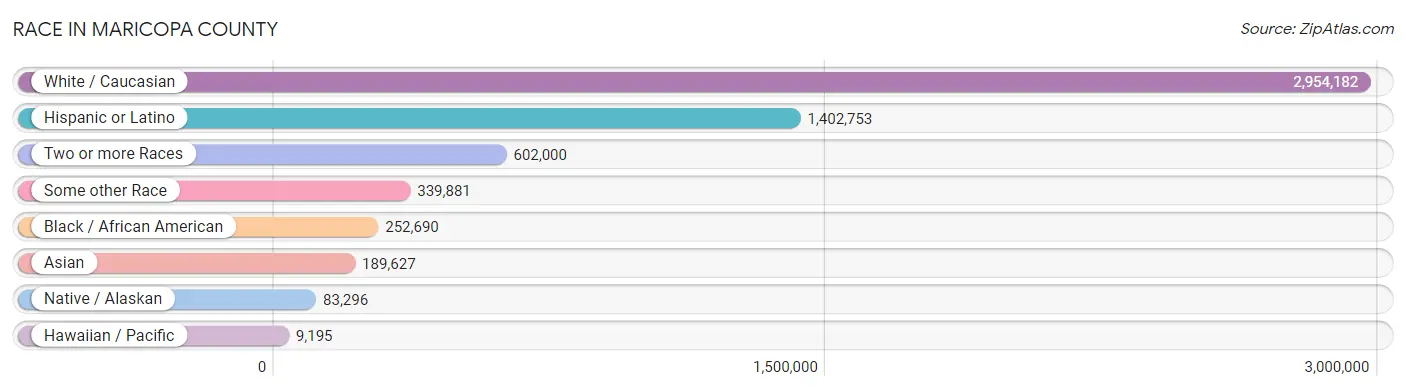
| Race | # Population | % Population |
| Asian | 189,627 | 4.3% |
| Black / African American | 252,690 | 5.7% |
| Hawaiian / Pacific | 9,195 | 0.2% |
| Hispanic or Latino | 1,402,753 | 31.7% |
| Native / Alaskan | 83,296 | 1.9% |
| White / Caucasian | 2,954,182 | 66.7% |
| Two or more Races | 602,000 | 13.6% |
| Some other Race | 339,881 | 7.7% |
| Total | 4,430,871 | 100.0% |
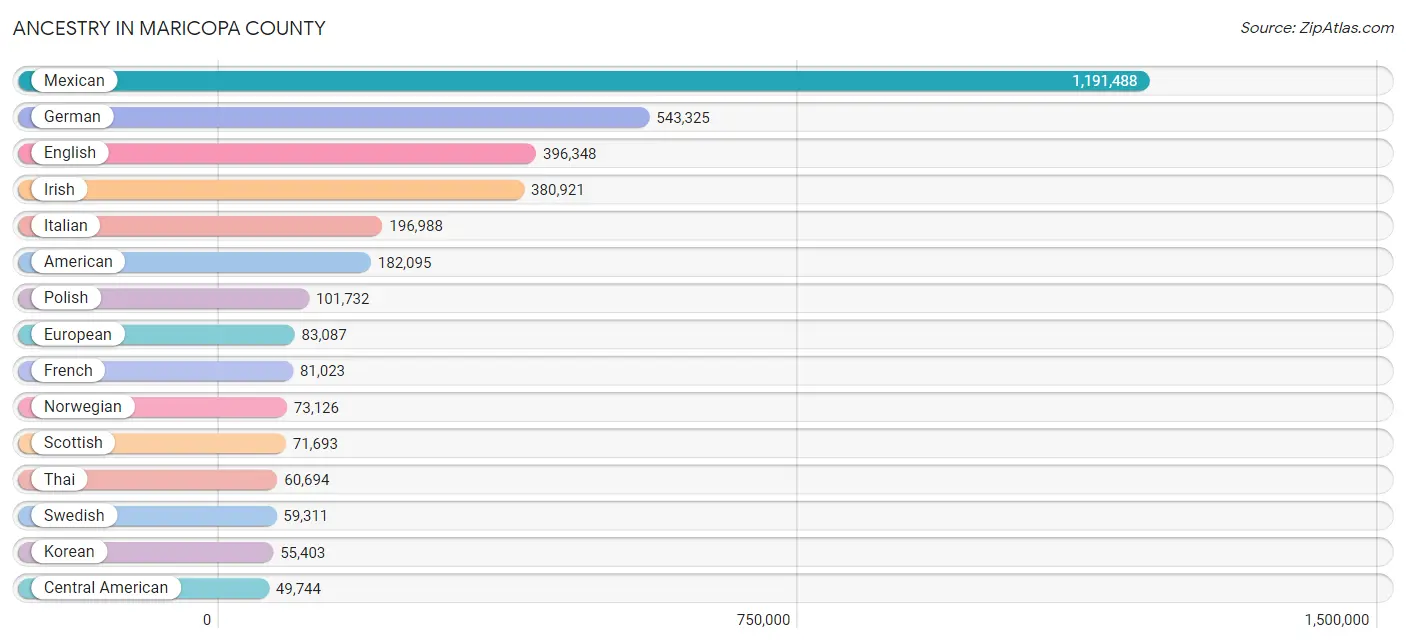
Ancestry in Maricopa County
The most populous ancestries reported in Maricopa County are Mexican (1,191,488 | 26.9%), German (543,325 | 12.3%), English (396,348 | 8.9%), Irish (380,921 | 8.6%), and Italian (196,988 | 4.4%), together accounting for 61.1% of all Maricopa County residents.
| Ancestry | # Population | % Population |
| Afghan | 2,377 | 0.1% |
| African | 20,028 | 0.4% |
| Alaska Native | 217 | 0.0% |
| Alaskan Athabascan | 191 | 0.0% |
| Albanian | 2,129 | 0.1% |
| Aleut | 316 | 0.0% |
| Alsatian | 63 | 0.0% |
| American | 182,095 | 4.1% |
| Apache | 6,670 | 0.2% |
| Arab | 28,587 | 0.6% |
| Arapaho | 69 | 0.0% |
| Argentinean | 3,041 | 0.1% |
| Armenian | 3,923 | 0.1% |
| Assyrian / Chaldean / Syriac | 4,569 | 0.1% |
| Australian | 1,979 | 0.0% |
| Austrian | 7,890 | 0.2% |
| Bahamian | 325 | 0.0% |
| Bangladeshi | 235 | 0.0% |
| Barbadian | 528 | 0.0% |
| Basque | 850 | 0.0% |
| Belgian | 3,793 | 0.1% |
| Belizean | 609 | 0.0% |
| Bermudan | 23 | 0.0% |
| Bhutanese | 20,206 | 0.5% |
| Blackfeet | 3,000 | 0.1% |
| Bolivian | 597 | 0.0% |
| Brazilian | 3,561 | 0.1% |
| British | 27,347 | 0.6% |
| British West Indian | 155 | 0.0% |
| Bulgarian | 1,973 | 0.0% |
| Burmese | 17,905 | 0.4% |
| Cajun | 347 | 0.0% |
| Cambodian | 218 | 0.0% |
| Canadian | 13,357 | 0.3% |
| Cape Verdean | 344 | 0.0% |
| Carpatho Rusyn | 96 | 0.0% |
| Celtic | 610 | 0.0% |
| Central American | 49,744 | 1.1% |
| Central American Indian | 4,444 | 0.1% |
| Cherokee | 10,679 | 0.2% |
| Cheyenne | 167 | 0.0% |
| Chickasaw | 1,124 | 0.0% |
| Chilean | 2,128 | 0.1% |
| Chinese | 61 | 0.0% |
| Chippewa | 1,663 | 0.0% |
| Choctaw | 3,424 | 0.1% |
| Colombian | 8,385 | 0.2% |
| Colville | 205 | 0.0% |
| Comanche | 460 | 0.0% |
| Costa Rican | 2,424 | 0.1% |
| Cree | 213 | 0.0% |
| Creek | 686 | 0.0% |
| Croatian | 6,375 | 0.1% |
| Crow | 16 | 0.0% |
| Cuban | 14,690 | 0.3% |
| Cypriot | 195 | 0.0% |
| Czech | 16,529 | 0.4% |
| Czechoslovakian | 4,868 | 0.1% |
| Danish | 24,151 | 0.5% |
| Delaware | 313 | 0.0% |
| Dominican | 5,127 | 0.1% |
| Dutch | 43,566 | 1.0% |
| Dutch West Indian | 60 | 0.0% |
| Eastern European | 12,329 | 0.3% |
| Ecuadorian | 3,045 | 0.1% |
| Egyptian | 2,539 | 0.1% |
| English | 396,348 | 8.9% |
| Estonian | 489 | 0.0% |
| Ethiopian | 4,178 | 0.1% |
| European | 83,087 | 1.9% |
| Fijian | 953 | 0.0% |
| Filipino | 3,181 | 0.1% |
| Finnish | 9,610 | 0.2% |
| French | 81,023 | 1.8% |
| French American Indian | 435 | 0.0% |
| French Canadian | 16,648 | 0.4% |
| German | 543,325 | 12.3% |
| German Russian | 147 | 0.0% |
| Ghanaian | 659 | 0.0% |
| Greek | 16,402 | 0.4% |
| Guamanian / Chamorro | 3,555 | 0.1% |
| Guatemalan | 20,453 | 0.5% |
| Guyanese | 468 | 0.0% |
| Haitian | 1,903 | 0.0% |
| Hmong | 11 | 0.0% |
| Honduran | 4,250 | 0.1% |
| Hopi | 3,010 | 0.1% |
| Houma | 195 | 0.0% |
| Hungarian | 15,500 | 0.4% |
| Icelander | 714 | 0.0% |
| Indian (Asian) | 46,864 | 1.1% |
| Indonesian | 3,556 | 0.1% |
| Inupiat | 667 | 0.0% |
| Iranian | 6,260 | 0.1% |
| Iraqi | 6,335 | 0.1% |
| Irish | 380,921 | 8.6% |
| Iroquois | 770 | 0.0% |
| Israeli | 1,367 | 0.0% |
| Italian | 196,988 | 4.4% |
| Jamaican | 5,785 | 0.1% |
| Japanese | 3,952 | 0.1% |
| Jordanian | 1,641 | 0.0% |
| Kenyan | 1,059 | 0.0% |
| Kiowa | 416 | 0.0% |
| Korean | 55,403 | 1.3% |
| Laotian | 2,203 | 0.1% |
| Latvian | 1,003 | 0.0% |
| Lebanese | 7,421 | 0.2% |
| Liberian | 1,196 | 0.0% |
| Lithuanian | 7,943 | 0.2% |
| Lumbee | 120 | 0.0% |
| Luxembourger | 820 | 0.0% |
| Macedonian | 721 | 0.0% |
| Malaysian | 2,386 | 0.1% |
| Maltese | 288 | 0.0% |
| Marshallese | 134 | 0.0% |
| Menominee | 119 | 0.0% |
| Mexican | 1,191,488 | 26.9% |
| Mexican American Indian | 9,042 | 0.2% |
| Mongolian | 342 | 0.0% |
| Moroccan | 937 | 0.0% |
| Native Hawaiian | 7,574 | 0.2% |
| Navajo | 35,331 | 0.8% |
| New Zealander | 237 | 0.0% |
| Nicaraguan | 3,162 | 0.1% |
| Nigerian | 4,836 | 0.1% |
| Northern European | 7,431 | 0.2% |
| Norwegian | 73,126 | 1.7% |
| Okinawan | 120 | 0.0% |
| Osage | 286 | 0.0% |
| Ottawa | 58 | 0.0% |
| Paiute | 211 | 0.0% |
| Pakistani | 5,364 | 0.1% |
| Palestinian | 1,207 | 0.0% |
| Panamanian | 2,368 | 0.1% |
| Paraguayan | 169 | 0.0% |
| Pennsylvania German | 978 | 0.0% |
| Peruvian | 4,923 | 0.1% |
| Pima | 13,469 | 0.3% |
| Polish | 101,732 | 2.3% |
| Portuguese | 11,118 | 0.3% |
| Potawatomi | 498 | 0.0% |
| Pueblo | 1,602 | 0.0% |
| Puerto Rican | 33,056 | 0.7% |
| Puget Sound Salish | 167 | 0.0% |
| Romanian | 10,190 | 0.2% |
| Russian | 29,520 | 0.7% |
| Salvadoran | 16,673 | 0.4% |
| Samoan | 3,341 | 0.1% |
| Scandinavian | 17,607 | 0.4% |
| Scotch-Irish | 27,426 | 0.6% |
| Scottish | 71,693 | 1.6% |
| Seminole | 119 | 0.0% |
| Senegalese | 324 | 0.0% |
| Serbian | 5,995 | 0.1% |
| Shoshone | 629 | 0.0% |
| Sierra Leonean | 240 | 0.0% |
| Sioux | 2,459 | 0.1% |
| Slavic | 1,793 | 0.0% |
| Slovak | 6,446 | 0.2% |
| Slovene | 1,899 | 0.0% |
| Somali | 2,403 | 0.1% |
| South African | 1,243 | 0.0% |
| South American | 25,401 | 0.6% |
| South American Indian | 608 | 0.0% |
| Soviet Union | 68 | 0.0% |
| Spaniard | 21,308 | 0.5% |
| Spanish | 16,875 | 0.4% |
| Spanish American | 539 | 0.0% |
| Spanish American Indian | 99 | 0.0% |
| Sri Lankan | 29,189 | 0.7% |
| Subsaharan African | 42,206 | 0.9% |
| Sudanese | 2,168 | 0.1% |
| Swedish | 59,311 | 1.3% |
| Swiss | 11,352 | 0.3% |
| Syrian | 1,904 | 0.0% |
| Thai | 60,694 | 1.4% |
| Tlingit-Haida | 454 | 0.0% |
| Tohono O'Odham | 5,035 | 0.1% |
| Tongan | 1,107 | 0.0% |
| Trinidadian and Tobagonian | 713 | 0.0% |
| Tsimshian | 36 | 0.0% |
| Turkish | 2,474 | 0.1% |
| U.S. Virgin Islander | 116 | 0.0% |
| Ugandan | 196 | 0.0% |
| Ukrainian | 9,456 | 0.2% |
| Uruguayan | 181 | 0.0% |
| Ute | 249 | 0.0% |
| Venezuelan | 2,653 | 0.1% |
| Vietnamese | 2,471 | 0.1% |
| Welsh | 24,416 | 0.5% |
| West Indian | 1,590 | 0.0% |
| Yakama | 30 | 0.0% |
| Yaqui | 8,043 | 0.2% |
| Yugoslavian | 4,495 | 0.1% |
| Yuman | 2,016 | 0.1% |
| Yup'ik | 109 | 0.0% |
| Zimbabwean | 186 | 0.0% | View All 198 Rows |
Immigrants in Maricopa County
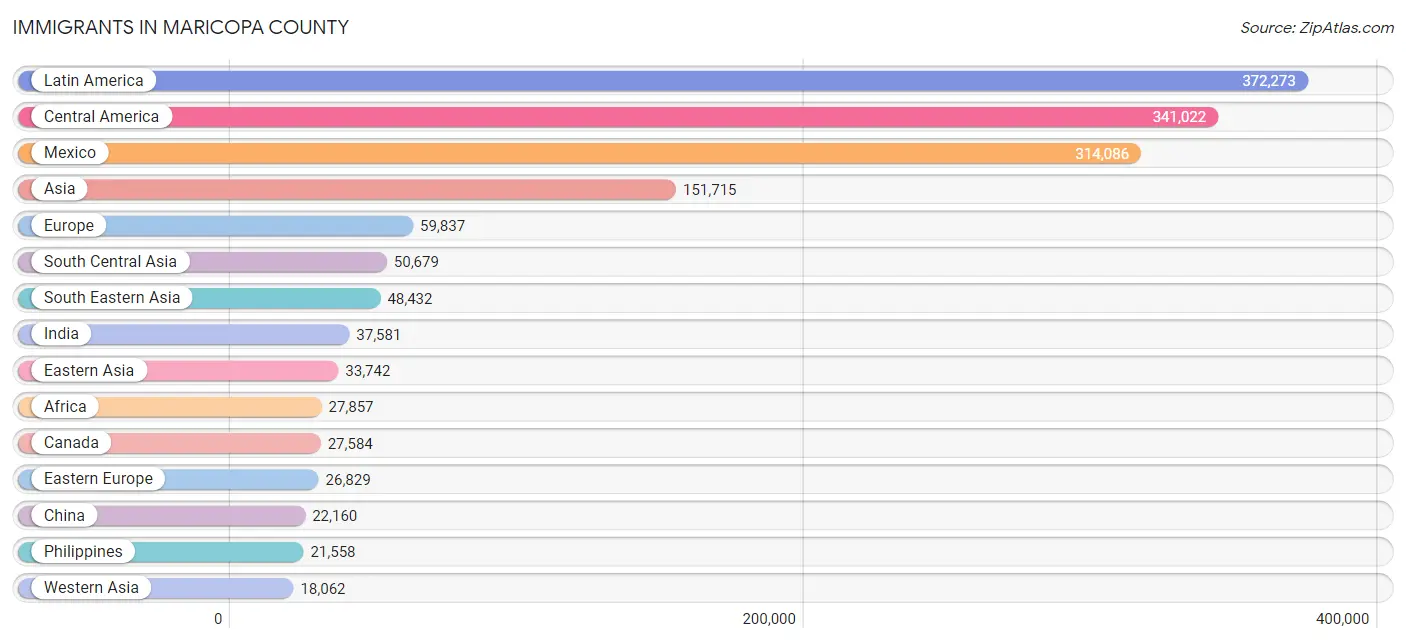
The most numerous immigrant groups reported in Maricopa County came from Latin America (372,273 | 8.4%), Central America (341,022 | 7.7%), Mexico (314,086 | 7.1%), Asia (151,715 | 3.4%), and Europe (59,837 | 1.3%), together accounting for 28.0% of all Maricopa County residents.
| Immigration Origin | # Population | % Population |
| Afghanistan | 2,138 | 0.1% |
| Africa | 27,857 | 0.6% |
| Albania | 1,522 | 0.0% |
| Argentina | 1,568 | 0.0% |
| Armenia | 400 | 0.0% |
| Asia | 151,715 | 3.4% |
| Australia | 1,275 | 0.0% |
| Austria | 512 | 0.0% |
| Azores | 32 | 0.0% |
| Bahamas | 254 | 0.0% |
| Bangladesh | 2,046 | 0.1% |
| Barbados | 768 | 0.0% |
| Belarus | 458 | 0.0% |
| Belgium | 316 | 0.0% |
| Belize | 290 | 0.0% |
| Bolivia | 183 | 0.0% |
| Bosnia and Herzegovina | 3,405 | 0.1% |
| Brazil | 2,444 | 0.1% |
| Bulgaria | 1,416 | 0.0% |
| Cabo Verde | 15 | 0.0% |
| Cambodia | 1,437 | 0.0% |
| Cameroon | 437 | 0.0% |
| Canada | 27,584 | 0.6% |
| Caribbean | 14,149 | 0.3% |
| Central America | 341,022 | 7.7% |
| Chile | 1,172 | 0.0% |
| China | 22,160 | 0.5% |
| Colombia | 4,278 | 0.1% |
| Congo | 739 | 0.0% |
| Costa Rica | 1,070 | 0.0% |
| Croatia | 1,146 | 0.0% |
| Cuba | 7,374 | 0.2% |
| Czechoslovakia | 899 | 0.0% |
| Denmark | 287 | 0.0% |
| Dominica | 20 | 0.0% |
| Dominican Republic | 1,555 | 0.0% |
| Eastern Africa | 11,896 | 0.3% |
| Eastern Asia | 33,742 | 0.8% |
| Eastern Europe | 26,829 | 0.6% |
| Ecuador | 1,403 | 0.0% |
| Egypt | 1,422 | 0.0% |
| El Salvador | 8,141 | 0.2% |
| England | 6,360 | 0.1% |
| Eritrea | 1,168 | 0.0% |
| Ethiopia | 3,482 | 0.1% |
| Europe | 59,837 | 1.3% |
| Fiji | 342 | 0.0% |
| France | 2,524 | 0.1% |
| Germany | 8,207 | 0.2% |
| Ghana | 463 | 0.0% |
| Greece | 827 | 0.0% |
| Grenada | 13 | 0.0% |
| Guatemala | 12,171 | 0.3% |
| Guyana | 556 | 0.0% |
| Haiti | 1,261 | 0.0% |
| Honduras | 2,472 | 0.1% |
| Hong Kong | 1,977 | 0.0% |
| Hungary | 1,019 | 0.0% |
| India | 37,581 | 0.9% |
| Indonesia | 1,484 | 0.0% |
| Iran | 4,100 | 0.1% |
| Iraq | 8,732 | 0.2% |
| Ireland | 885 | 0.0% |
| Israel | 1,176 | 0.0% |
| Italy | 3,235 | 0.1% |
| Jamaica | 1,918 | 0.0% |
| Japan | 4,006 | 0.1% |
| Jordan | 974 | 0.0% |
| Kazakhstan | 338 | 0.0% |
| Kenya | 2,134 | 0.1% |
| Korea | 7,505 | 0.2% |
| Kuwait | 534 | 0.0% |
| Laos | 875 | 0.0% |
| Latin America | 372,273 | 8.4% |
| Latvia | 141 | 0.0% |
| Lebanon | 1,354 | 0.0% |
| Liberia | 889 | 0.0% |
| Lithuania | 260 | 0.0% |
| Malaysia | 1,246 | 0.0% |
| Mexico | 314,086 | 7.1% |
| Micronesia | 277 | 0.0% |
| Middle Africa | 2,566 | 0.1% |
| Moldova | 254 | 0.0% |
| Morocco | 671 | 0.0% |
| Nepal | 884 | 0.0% |
| Netherlands | 1,396 | 0.0% |
| Nicaragua | 1,762 | 0.0% |
| Nigeria | 2,752 | 0.1% |
| North Macedonia | 107 | 0.0% |
| Northern Africa | 3,690 | 0.1% |
| Northern Europe | 13,750 | 0.3% |
| Norway | 298 | 0.0% |
| Oceania | 3,654 | 0.1% |
| Pakistan | 1,933 | 0.0% |
| Panama | 986 | 0.0% |
| Peru | 2,930 | 0.1% |
| Philippines | 21,558 | 0.5% |
| Poland | 3,650 | 0.1% |
| Portugal | 289 | 0.0% |
| Romania | 5,291 | 0.1% |
| Russia | 2,629 | 0.1% |
| Saudi Arabia | 1,180 | 0.0% |
| Scotland | 775 | 0.0% |
| Senegal | 232 | 0.0% |
| Serbia | 1,093 | 0.0% |
| Sierra Leone | 419 | 0.0% |
| Singapore | 602 | 0.0% |
| Somalia | 1,126 | 0.0% |
| South Africa | 1,910 | 0.0% |
| South America | 17,102 | 0.4% |
| South Central Asia | 50,679 | 1.1% |
| South Eastern Asia | 48,432 | 1.1% |
| Southern Europe | 5,597 | 0.1% |
| Spain | 1,199 | 0.0% |
| Sri Lanka | 556 | 0.0% |
| Sudan | 1,258 | 0.0% |
| Sweden | 690 | 0.0% |
| Switzerland | 499 | 0.0% |
| Syria | 1,241 | 0.0% |
| Taiwan | 3,868 | 0.1% |
| Thailand | 2,797 | 0.1% |
| Trinidad and Tobago | 715 | 0.0% |
| Turkey | 1,294 | 0.0% |
| Uganda | 382 | 0.0% |
| Ukraine | 1,496 | 0.0% |
| Uruguay | 146 | 0.0% |
| Uzbekistan | 551 | 0.0% |
| Venezuela | 2,256 | 0.1% |
| Vietnam | 15,928 | 0.4% |
| West Indies | 98 | 0.0% |
| Western Africa | 5,511 | 0.1% |
| Western Asia | 18,062 | 0.4% |
| Western Europe | 13,520 | 0.3% |
| Yemen | 154 | 0.0% |
| Zaire | 1,301 | 0.0% |
| Zimbabwe | 265 | 0.0% | View All 136 Rows |
Sex and Age in Maricopa County
Sex and Age in Maricopa County
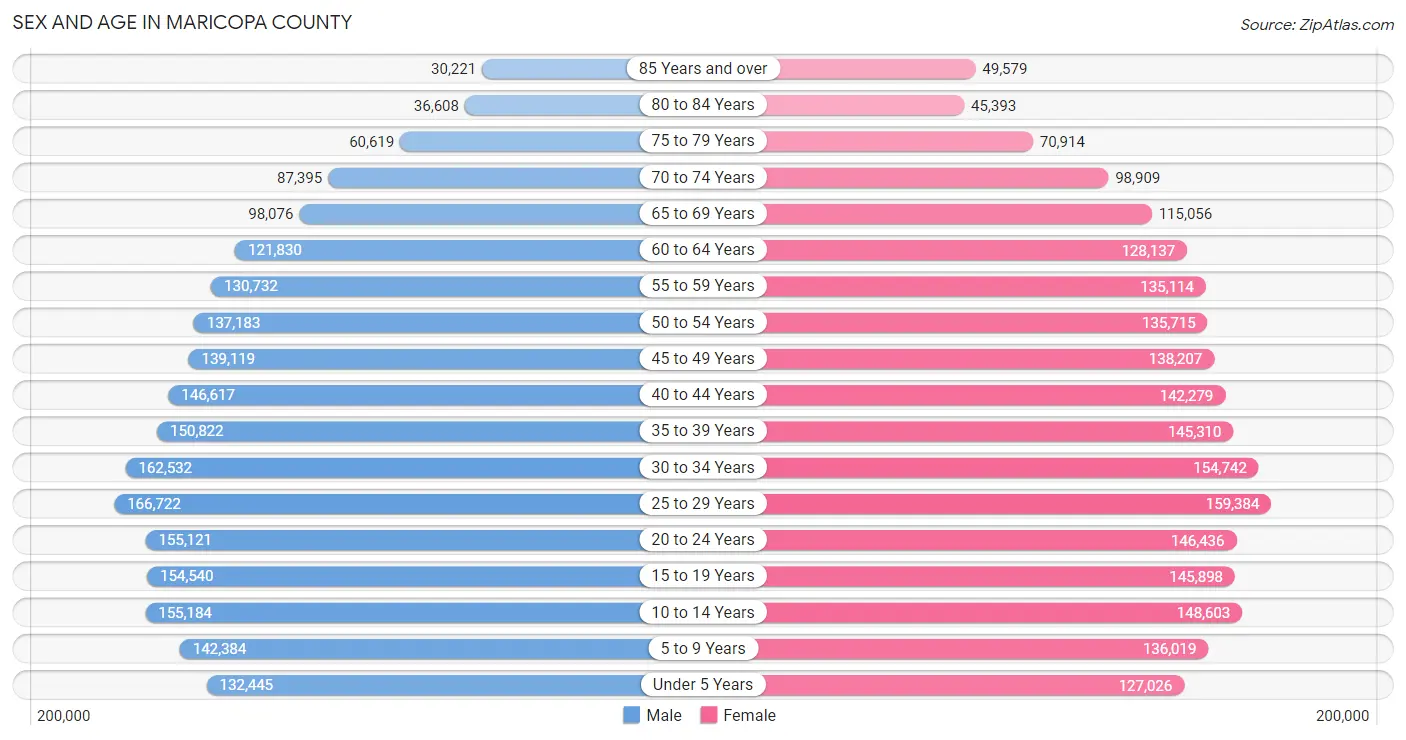
The most populous age groups in Maricopa County are 25 to 29 Years (166,722 | 7.5%) for men and 25 to 29 Years (159,384 | 7.2%) for women.
| Age Bracket | Male | Female |
| Under 5 Years | 132,445 (6.0%) | 127,026 (5.7%) |
| 5 to 9 Years | 142,384 (6.5%) | 136,019 (6.1%) |
| 10 to 14 Years | 155,184 (7.0%) | 148,603 (6.7%) |
| 15 to 19 Years | 154,540 (7.0%) | 145,898 (6.6%) |
| 20 to 24 Years | 155,121 (7.0%) | 146,436 (6.6%) |
| 25 to 29 Years | 166,722 (7.5%) | 159,384 (7.2%) |
| 30 to 34 Years | 162,532 (7.4%) | 154,742 (7.0%) |
| 35 to 39 Years | 150,822 (6.8%) | 145,310 (6.5%) |
| 40 to 44 Years | 146,617 (6.6%) | 142,279 (6.4%) |
| 45 to 49 Years | 139,119 (6.3%) | 138,207 (6.2%) |
| 50 to 54 Years | 137,183 (6.2%) | 135,715 (6.1%) |
| 55 to 59 Years | 130,732 (5.9%) | 135,114 (6.1%) |
| 60 to 64 Years | 121,830 (5.5%) | 128,137 (5.8%) |
| 65 to 69 Years | 98,076 (4.4%) | 115,056 (5.2%) |
| 70 to 74 Years | 87,395 (4.0%) | 98,909 (4.4%) |
| 75 to 79 Years | 60,619 (2.8%) | 70,914 (3.2%) |
| 80 to 84 Years | 36,608 (1.7%) | 45,393 (2.0%) |
| 85 Years and over | 30,221 (1.4%) | 49,579 (2.2%) |
| Total | 2,208,150 (100.0%) | 2,222,721 (100.0%) |
Families and Households in Maricopa County
Median Family Size in Maricopa County
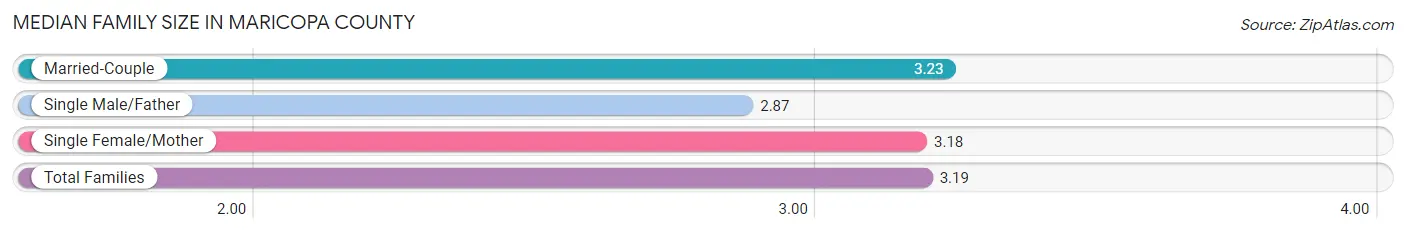
The median family size in Maricopa County is 3.19 persons per family, with married-couple families (790,888 | 72.4%) accounting for the largest median family size of 3.23 persons per family. On the other hand, single male/father families (98,213 | 9.0%) represent the smallest median family size with 2.87 persons per family.
| Family Type | # Families | Family Size |
| Married-Couple | 790,888 (72.4%) | 3.23 |
| Single Male/Father | 98,213 (9.0%) | 2.87 |
| Single Female/Mother | 202,699 (18.6%) | 3.18 |
| Total Families | 1,091,800 (100.0%) | 3.19 |
Median Household Size in Maricopa County
The median household size in Maricopa County is 2.62 persons per household, with single female/mother households (202,699 | 12.2%) accounting for the largest median household size of 3.46 persons per household. non-family households (573,760 | 34.4%) represent the smallest median household size with 1.33 persons per household.

| Household Type | # Households | Household Size |
| Married-Couple | 790,888 (47.5%) | 3.26 |
| Single Male/Father | 98,213 (5.9%) | 3.31 |
| Single Female/Mother | 202,699 (12.2%) | 3.46 |
| Non-family | 573,760 (34.4%) | 1.33 |
| Total Households | 1,665,560 (100.0%) | 2.62 |
Household Size by Marriage Status in Maricopa County
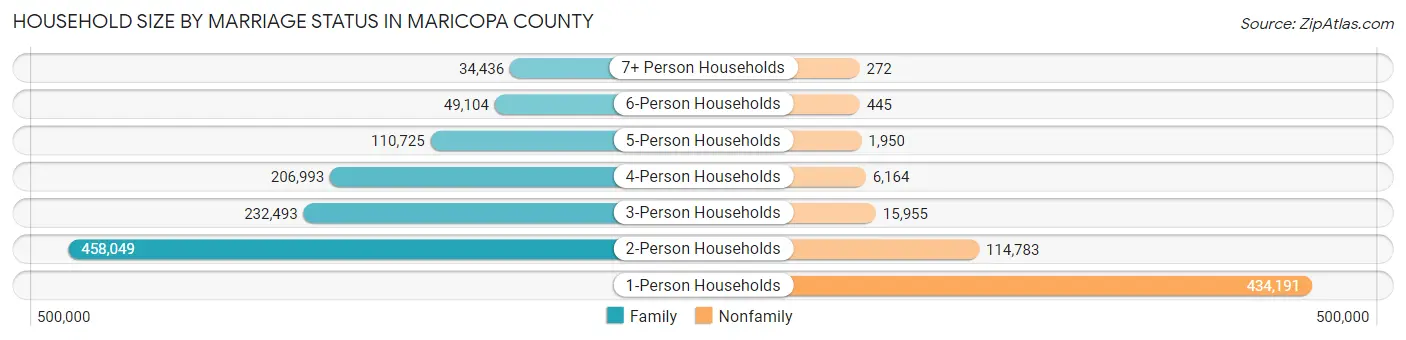
Out of a total of 1,665,560 households in Maricopa County, 1,091,800 (65.5%) are family households, while 573,760 (34.4%) are nonfamily households. The most numerous type of family households are 2-person households, comprising 458,049, and the most common type of nonfamily households are 1-person households, comprising 434,191.
| Household Size | Family Households | Nonfamily Households |
| 1-Person Households | - | 434,191 (26.1%) |
| 2-Person Households | 458,049 (27.5%) | 114,783 (6.9%) |
| 3-Person Households | 232,493 (14.0%) | 15,955 (1.0%) |
| 4-Person Households | 206,993 (12.4%) | 6,164 (0.4%) |
| 5-Person Households | 110,725 (6.7%) | 1,950 (0.1%) |
| 6-Person Households | 49,104 (2.9%) | 445 (0.0%) |
| 7+ Person Households | 34,436 (2.1%) | 272 (0.0%) |
| Total | 1,091,800 (65.5%) | 573,760 (34.4%) |
Female Fertility in Maricopa County
Fertility by Age in Maricopa County
Average fertility rate in Maricopa County is 54.0 births per 1,000 women. Women in the age bracket of 20 to 34 years have the highest fertility rate with 85.0 births per 1,000 women. Women in the age bracket of 20 to 34 years acount for 68.4% of all women with births.
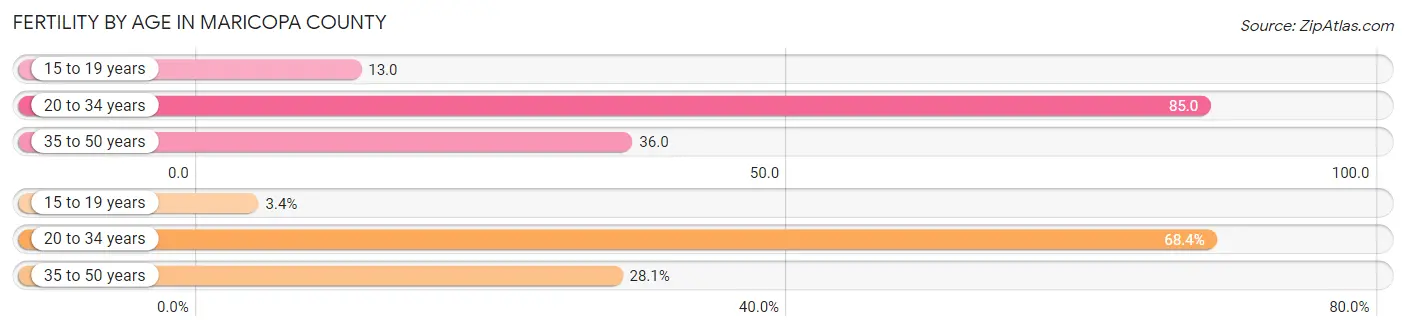
| Age Bracket | Women with Births | Births / 1,000 Women |
| 15 to 19 years | 1,969 (3.4%) | 13.0 |
| 20 to 34 years | 39,266 (68.4%) | 85.0 |
| 35 to 50 years | 16,137 (28.1%) | 36.0 |
| Total | 57,372 (100.0%) | 54.0 |
Fertility by Age by Marriage Status in Maricopa County
66.1% of women with births (57,372) in Maricopa County are married. The highest percentage of unmarried women with births falls into 15 to 19 years age bracket with 95.2% of them unmarried at the time of birth, while the lowest percentage of unmarried women with births belong to 35 to 50 years age bracket with 23.2% of them unmarried.
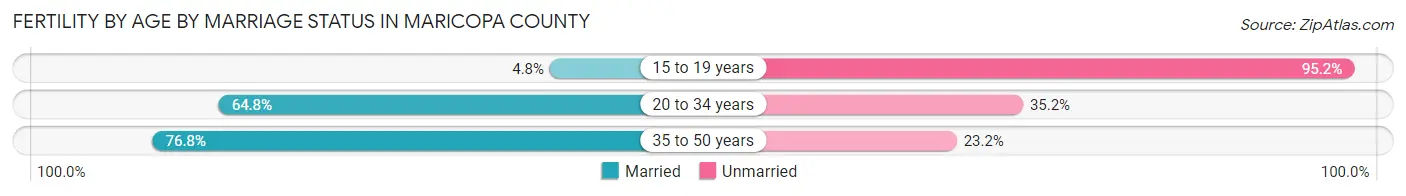
| Age Bracket | Married | Unmarried |
| 15 to 19 years | 95 (4.8%) | 1,874 (95.2%) |
| 20 to 34 years | 25,444 (64.8%) | 13,822 (35.2%) |
| 35 to 50 years | 12,393 (76.8%) | 3,744 (23.2%) |
| Total | 37,923 (66.1%) | 19,449 (33.9%) |
Fertility by Education in Maricopa County
Average fertility rate in Maricopa County is 54.0 births per 1,000 women. Women with the education attainment of high school diploma have the highest fertility rate of 64.0 births per 1,000 women, while women with the education attainment of less than high school have the lowest fertility at 36.0 births per 1,000 women. Women with the education attainment of college or associate's degree represent 31.6% of all women with births.
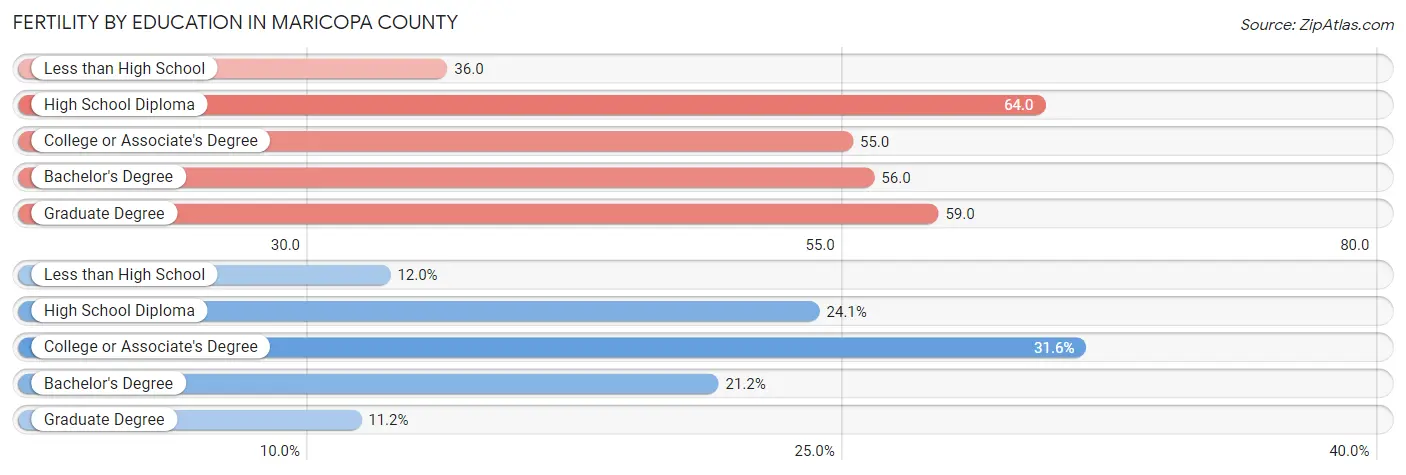
| Educational Attainment | Women with Births | Births / 1,000 Women |
| Less than High School | 6,884 (12.0%) | 36.0 |
| High School Diploma | 13,802 (24.1%) | 64.0 |
| College or Associate's Degree | 18,099 (31.6%) | 55.0 |
| Bachelor's Degree | 12,173 (21.2%) | 56.0 |
| Graduate Degree | 6,414 (11.2%) | 59.0 |
| Total | 57,372 (100.0%) | 54.0 |
Fertility by Education by Marriage Status in Maricopa County
33.9% of women with births in Maricopa County are unmarried. Women with the educational attainment of graduate degree are most likely to be married with 93.1% of them married at childbirth, while women with the educational attainment of high school diploma are least likely to be married with 51.5% of them unmarried at childbirth.
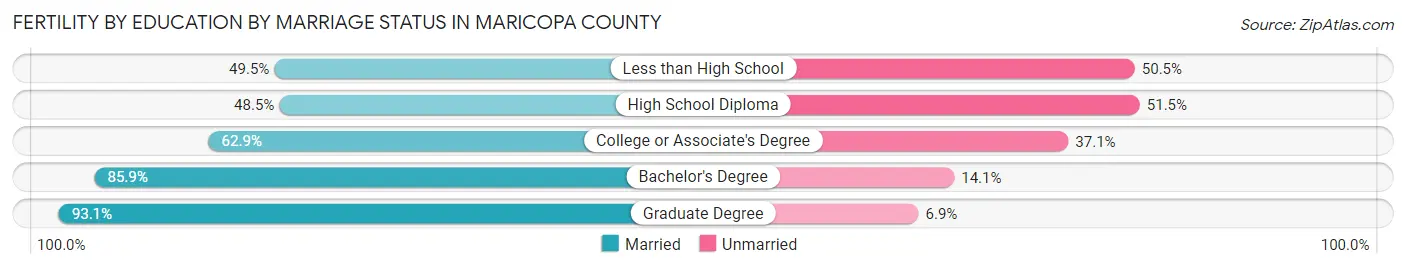
| Educational Attainment | Married | Unmarried |
| Less than High School | 3,408 (49.5%) | 3,476 (50.5%) |
| High School Diploma | 6,694 (48.5%) | 7,108 (51.5%) |
| College or Associate's Degree | 11,384 (62.9%) | 6,715 (37.1%) |
| Bachelor's Degree | 10,457 (85.9%) | 1,716 (14.1%) |
| Graduate Degree | 5,971 (93.1%) | 443 (6.9%) |
| Total | 37,923 (66.1%) | 19,449 (33.9%) |
Employment Characteristics in Maricopa County
Employment by Class of Employer in Maricopa County
Among the 2,146,216 employed individuals in Maricopa County, private company employees (1,534,580 | 71.5%), not-for-profit organizations (146,154 | 6.8%), and local government employees (127,058 | 5.9%) make up the most common classes of employment.
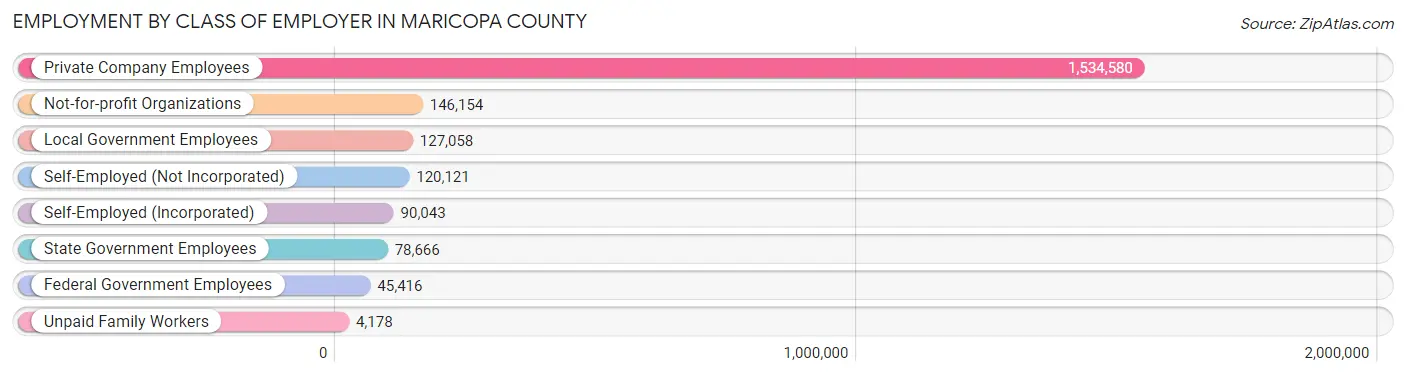
| Employer Class | # Employees | % Employees |
| Private Company Employees | 1,534,580 | 71.5% |
| Self-Employed (Incorporated) | 90,043 | 4.2% |
| Self-Employed (Not Incorporated) | 120,121 | 5.6% |
| Not-for-profit Organizations | 146,154 | 6.8% |
| Local Government Employees | 127,058 | 5.9% |
| State Government Employees | 78,666 | 3.7% |
| Federal Government Employees | 45,416 | 2.1% |
| Unpaid Family Workers | 4,178 | 0.2% |
| Total | 2,146,216 | 100.0% |
Employment Status by Age in Maricopa County
According to the labor force statistics for Maricopa County, out of the total population over 16 years of age (3,526,945), 65.0% or 2,292,514 individuals are in the labor force, with 4.8% or 110,041 of them unemployed. The age group with the highest labor force participation rate is 25 to 29 years, with 85.0% or 277,190 individuals in the labor force. Within the labor force, the 16 to 19 years age range has the highest percentage of unemployed individuals, with 15.0% or 14,719 of them being unemployed.
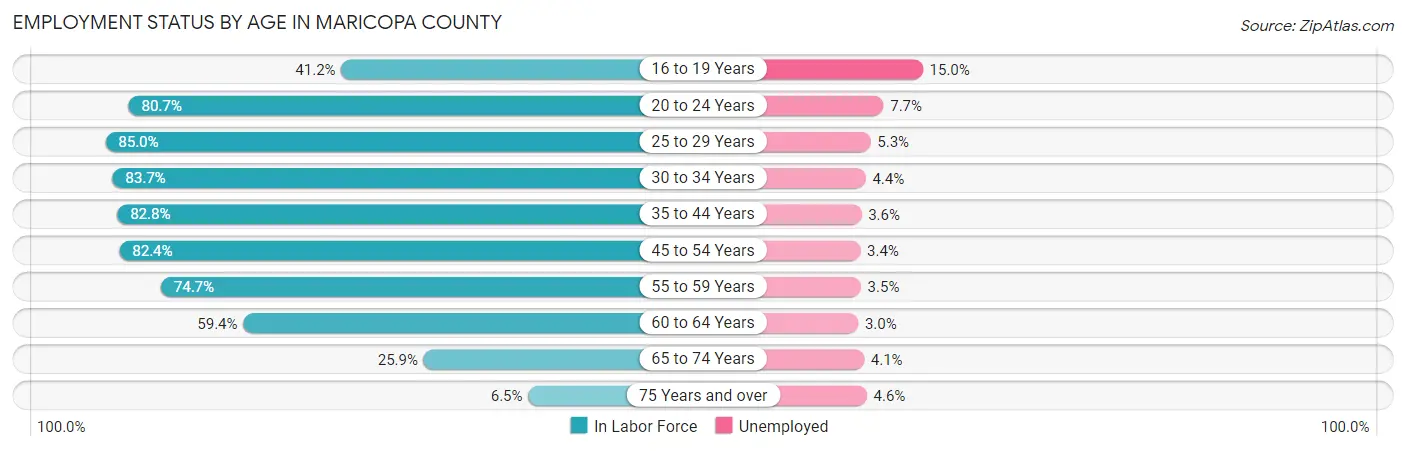
| Age Bracket | In Labor Force | Unemployed |
| 16 to 19 Years | 98,127 (41.2%) | 14,719 (15.0%) |
| 20 to 24 Years | 243,356 (80.7%) | 18,738 (7.7%) |
| 25 to 29 Years | 277,190 (85.0%) | 14,691 (5.3%) |
| 30 to 34 Years | 265,558 (83.7%) | 11,685 (4.4%) |
| 35 to 44 Years | 484,403 (82.8%) | 17,439 (3.6%) |
| 45 to 54 Years | 453,385 (82.4%) | 15,415 (3.4%) |
| 55 to 59 Years | 198,587 (74.7%) | 6,951 (3.5%) |
| 60 to 64 Years | 148,480 (59.4%) | 4,454 (3.0%) |
| 65 to 74 Years | 103,454 (25.9%) | 4,242 (4.1%) |
| 75 Years and over | 19,067 (6.5%) | 877 (4.6%) |
| Total | 2,292,514 (65.0%) | 110,041 (4.8%) |
Employment Status by Educational Attainment in Maricopa County
According to labor force statistics for Maricopa County, 79.6% of individuals (1,826,378) out of the total population between 25 and 64 years of age (2,294,445) are in the labor force, with 3.9% or 71,229 of them being unemployed. The group with the highest labor force participation rate are those with the educational attainment of bachelor's degree or higher, with 86.2% or 698,032 individuals in the labor force. Within the labor force, individuals with less than high school education have the highest percentage of unemployment, with 5.3% or 8,816 of them being unemployed.

| Educational Attainment | In Labor Force | Unemployed |
| Less than High School | 166,347 (65.3%) | 13,501 (5.3%) |
| High School Diploma | 371,414 (74.9%) | 26,282 (5.3%) |
| College / Associate Degree | 591,637 (80.6%) | 30,830 (4.2%) |
| Bachelor's Degree or higher | 698,032 (86.2%) | 20,245 (2.5%) |
| Total | 1,826,378 (79.6%) | 89,483 (3.9%) |
Employment Occupations by Sex in Maricopa County
Management, Business, Science and Arts Occupations
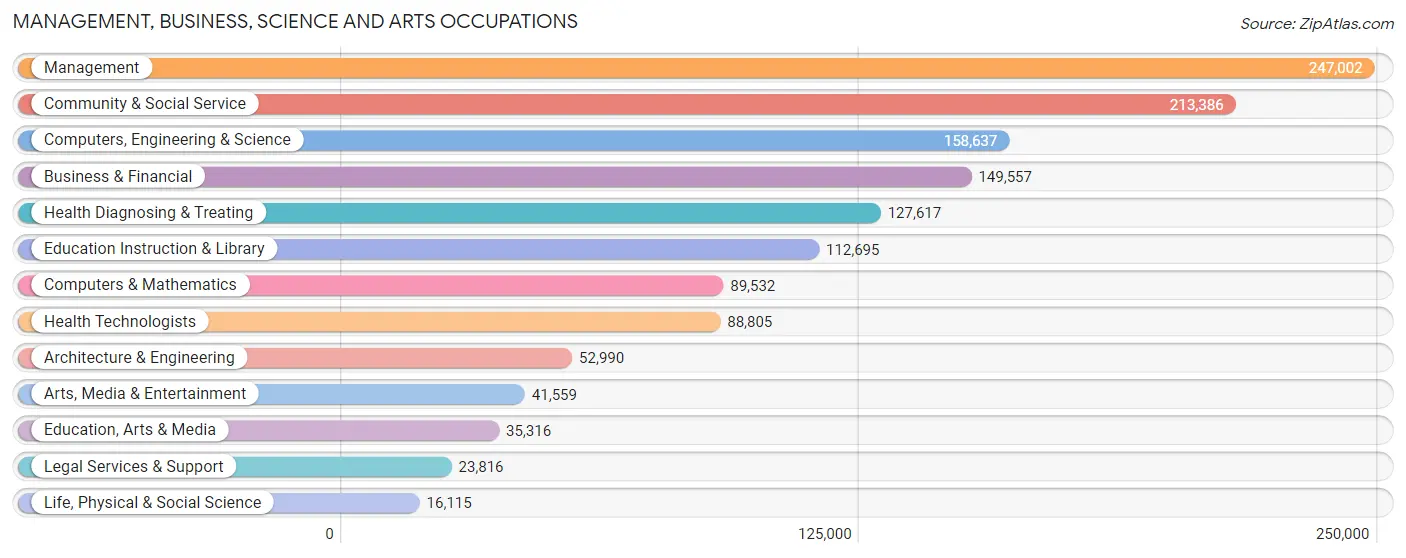
The most common Management, Business, Science and Arts occupations in Maricopa County are Management (247,002 | 11.4%), Community & Social Service (213,386 | 9.8%), Computers, Engineering & Science (158,637 | 7.3%), Business & Financial (149,557 | 6.9%), and Health Diagnosing & Treating (127,617 | 5.9%).
Management, Business, Science and Arts Occupations by Sex
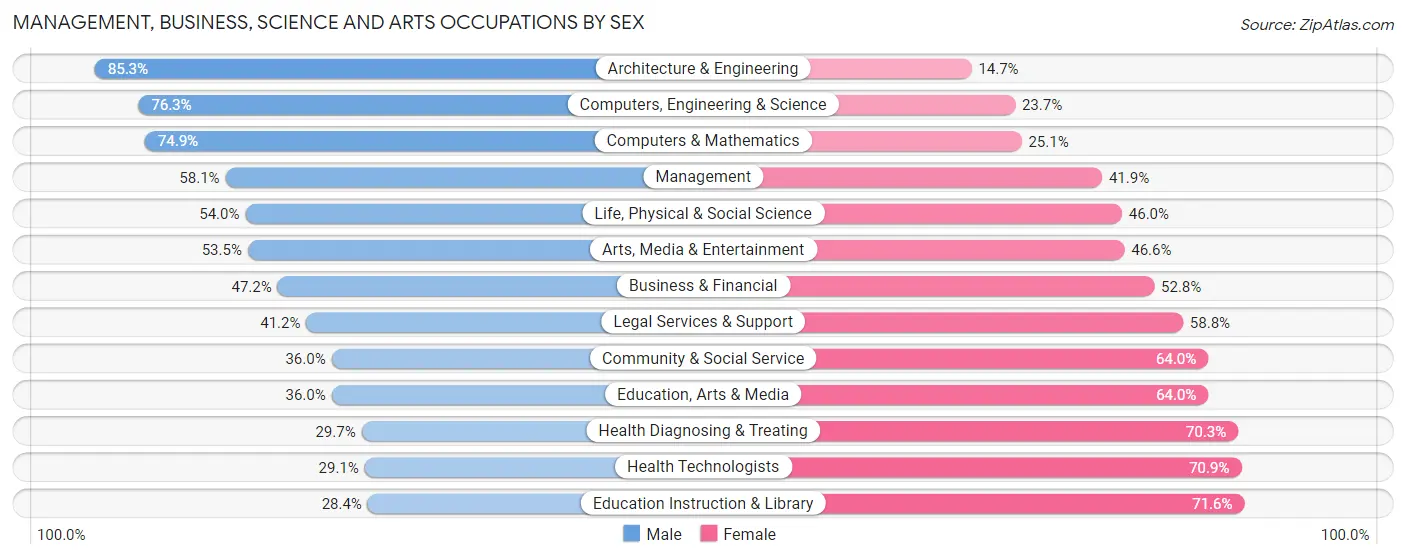
Within the Management, Business, Science and Arts occupations in Maricopa County, the most male-oriented occupations are Architecture & Engineering (85.3%), Computers, Engineering & Science (76.3%), and Computers & Mathematics (74.9%), while the most female-oriented occupations are Education Instruction & Library (71.6%), Health Technologists (70.9%), and Health Diagnosing & Treating (70.3%).
| Occupation | Male | Female |
| Management | 143,535 (58.1%) | 103,467 (41.9%) |
| Business & Financial | 70,639 (47.2%) | 78,918 (52.8%) |
| Computers, Engineering & Science | 120,972 (76.3%) | 37,665 (23.7%) |
| Computers & Mathematics | 67,055 (74.9%) | 22,477 (25.1%) |
| Architecture & Engineering | 45,221 (85.3%) | 7,769 (14.7%) |
| Life, Physical & Social Science | 8,696 (54.0%) | 7,419 (46.0%) |
| Community & Social Service | 76,774 (36.0%) | 136,612 (64.0%) |
| Education, Arts & Media | 12,698 (36.0%) | 22,618 (64.0%) |
| Legal Services & Support | 9,820 (41.2%) | 13,996 (58.8%) |
| Education Instruction & Library | 32,043 (28.4%) | 80,652 (71.6%) |
| Arts, Media & Entertainment | 22,213 (53.4%) | 19,346 (46.6%) |
| Health Diagnosing & Treating | 37,945 (29.7%) | 89,672 (70.3%) |
| Health Technologists | 25,818 (29.1%) | 62,987 (70.9%) |
| Total (Category) | 449,865 (50.2%) | 446,334 (49.8%) |
| Total (Overall) | 1,178,655 (54.2%) | 997,391 (45.8%) |
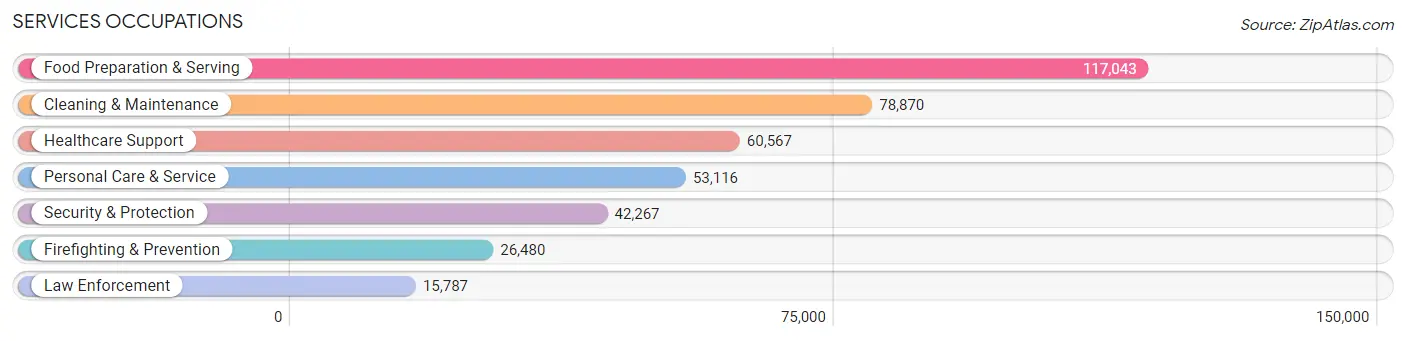
Services Occupations
The most common Services occupations in Maricopa County are Food Preparation & Serving (117,043 | 5.4%), Cleaning & Maintenance (78,870 | 3.6%), Healthcare Support (60,567 | 2.8%), Personal Care & Service (53,116 | 2.4%), and Security & Protection (42,267 | 1.9%).
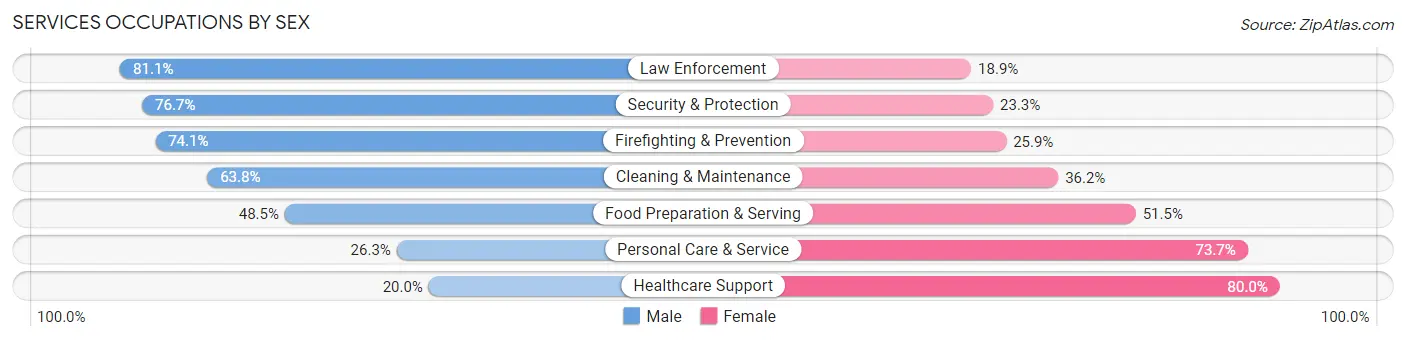
Services Occupations by Sex
Within the Services occupations in Maricopa County, the most male-oriented occupations are Law Enforcement (81.1%), Security & Protection (76.7%), and Firefighting & Prevention (74.1%), while the most female-oriented occupations are Healthcare Support (80.0%), Personal Care & Service (73.7%), and Food Preparation & Serving (51.5%).
| Occupation | Male | Female |
| Healthcare Support | 12,102 (20.0%) | 48,465 (80.0%) |
| Security & Protection | 32,427 (76.7%) | 9,840 (23.3%) |
| Firefighting & Prevention | 19,629 (74.1%) | 6,851 (25.9%) |
| Law Enforcement | 12,798 (81.1%) | 2,989 (18.9%) |
| Food Preparation & Serving | 56,745 (48.5%) | 60,298 (51.5%) |
| Cleaning & Maintenance | 50,339 (63.8%) | 28,531 (36.2%) |
| Personal Care & Service | 13,986 (26.3%) | 39,130 (73.7%) |
| Total (Category) | 165,599 (47.1%) | 186,264 (52.9%) |
| Total (Overall) | 1,178,655 (54.2%) | 997,391 (45.8%) |
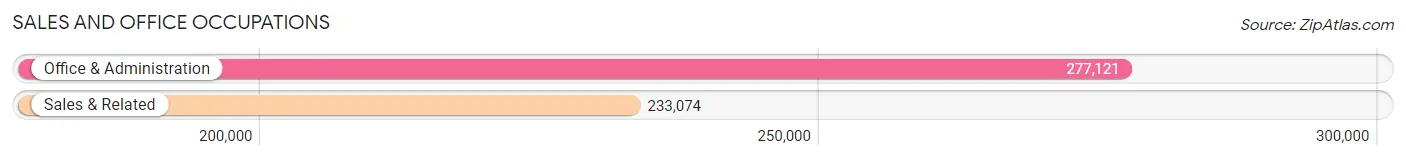
Sales and Office Occupations
The most common Sales and Office occupations in Maricopa County are Office & Administration (277,121 | 12.7%), and Sales & Related (233,074 | 10.7%).
Sales and Office Occupations by Sex
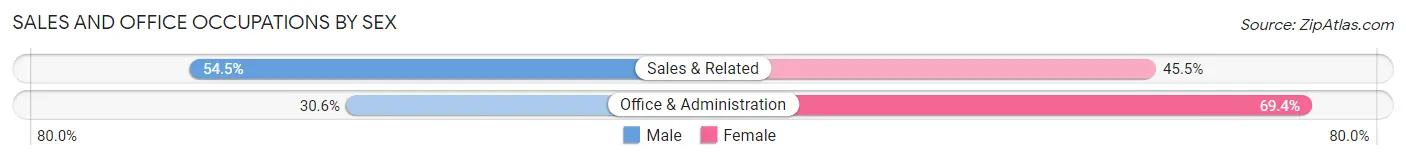
| Occupation | Male | Female |
| Sales & Related | 127,085 (54.5%) | 105,989 (45.5%) |
| Office & Administration | 84,783 (30.6%) | 192,338 (69.4%) |
| Total (Category) | 211,868 (41.5%) | 298,327 (58.5%) |
| Total (Overall) | 1,178,655 (54.2%) | 997,391 (45.8%) |
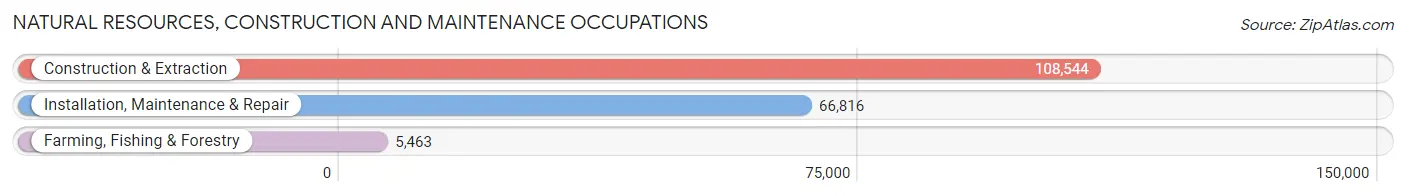
Natural Resources, Construction and Maintenance Occupations
The most common Natural Resources, Construction and Maintenance occupations in Maricopa County are Construction & Extraction (108,544 | 5.0%), Installation, Maintenance & Repair (66,816 | 3.1%), and Farming, Fishing & Forestry (5,463 | 0.3%).
Natural Resources, Construction and Maintenance Occupations by Sex
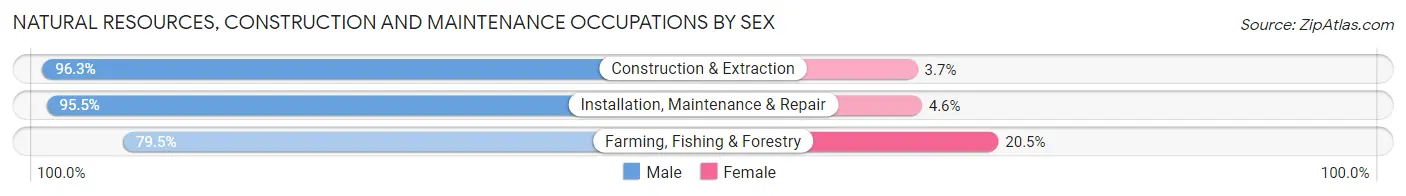
| Occupation | Male | Female |
| Farming, Fishing & Forestry | 4,344 (79.5%) | 1,119 (20.5%) |
| Construction & Extraction | 104,534 (96.3%) | 4,010 (3.7%) |
| Installation, Maintenance & Repair | 63,777 (95.5%) | 3,039 (4.5%) |
| Total (Category) | 172,655 (95.5%) | 8,168 (4.5%) |
| Total (Overall) | 1,178,655 (54.2%) | 997,391 (45.8%) |
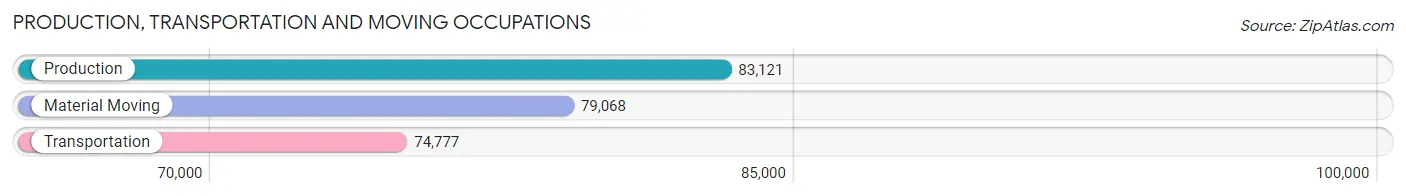
Production, Transportation and Moving Occupations
The most common Production, Transportation and Moving occupations in Maricopa County are Production (83,121 | 3.8%), Material Moving (79,068 | 3.6%), and Transportation (74,777 | 3.4%).
Production, Transportation and Moving Occupations by Sex
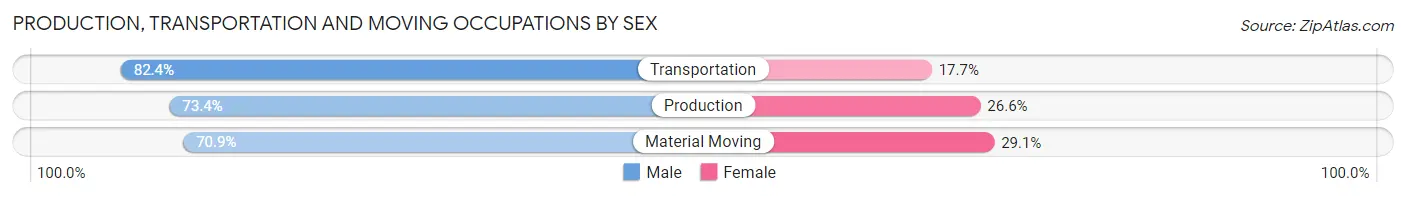
| Occupation | Male | Female |
| Production | 61,031 (73.4%) | 22,090 (26.6%) |
| Transportation | 61,582 (82.4%) | 13,195 (17.6%) |
| Material Moving | 56,055 (70.9%) | 23,013 (29.1%) |
| Total (Category) | 178,668 (75.4%) | 58,298 (24.6%) |
| Total (Overall) | 1,178,655 (54.2%) | 997,391 (45.8%) |
Employment Industries by Sex in Maricopa County
Employment Industries in Maricopa County
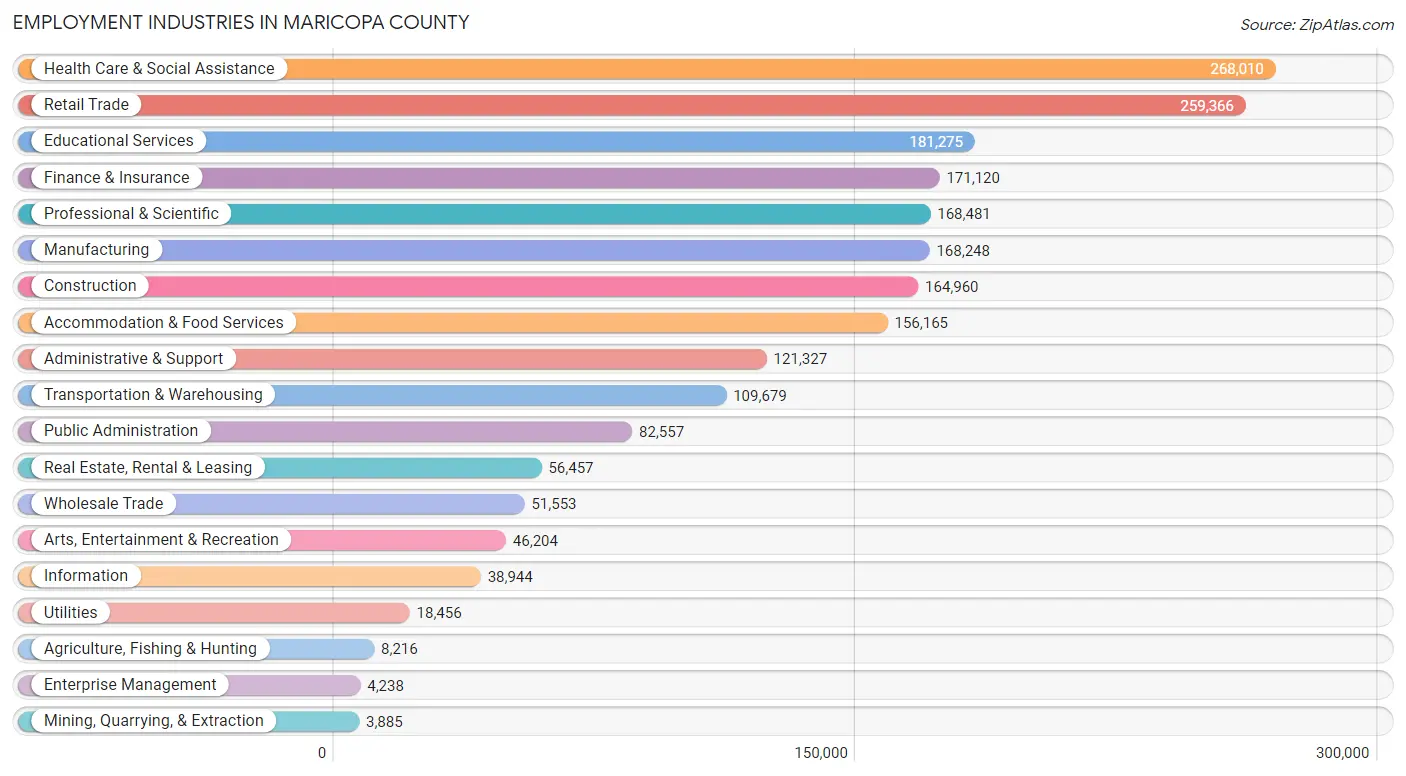
The major employment industries in Maricopa County include Health Care & Social Assistance (268,010 | 12.3%), Retail Trade (259,366 | 11.9%), Educational Services (181,275 | 8.3%), Finance & Insurance (171,120 | 7.9%), and Professional & Scientific (168,481 | 7.7%).
Employment Industries by Sex in Maricopa County
The Maricopa County industries that see more men than women are Construction (88.0%), Mining, Quarrying, & Extraction (79.6%), and Agriculture, Fishing & Hunting (74.4%), whereas the industries that tend to have a higher number of women are Health Care & Social Assistance (73.5%), Educational Services (67.5%), and Enterprise Management (55.3%).
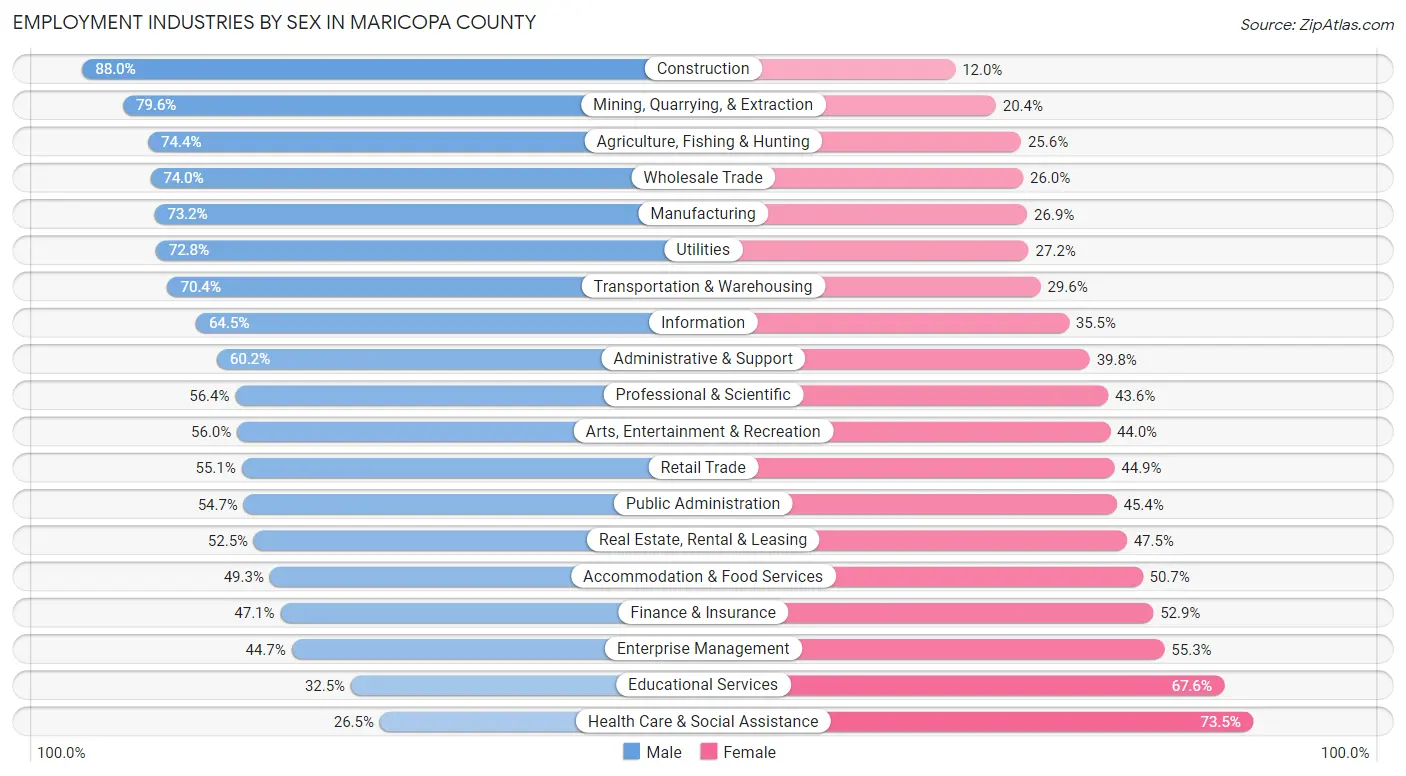
| Industry | Male | Female |
| Agriculture, Fishing & Hunting | 6,114 (74.4%) | 2,102 (25.6%) |
| Mining, Quarrying, & Extraction | 3,094 (79.6%) | 791 (20.4%) |
| Construction | 145,231 (88.0%) | 19,729 (12.0%) |
| Manufacturing | 123,077 (73.2%) | 45,171 (26.9%) |
| Wholesale Trade | 38,138 (74.0%) | 13,415 (26.0%) |
| Retail Trade | 142,875 (55.1%) | 116,491 (44.9%) |
| Transportation & Warehousing | 77,201 (70.4%) | 32,478 (29.6%) |
| Utilities | 13,443 (72.8%) | 5,013 (27.2%) |
| Information | 25,126 (64.5%) | 13,818 (35.5%) |
| Finance & Insurance | 80,521 (47.1%) | 90,599 (52.9%) |
| Real Estate, Rental & Leasing | 29,664 (52.5%) | 26,793 (47.5%) |
| Professional & Scientific | 95,006 (56.4%) | 73,475 (43.6%) |
| Enterprise Management | 1,896 (44.7%) | 2,342 (55.3%) |
| Administrative & Support | 73,040 (60.2%) | 48,287 (39.8%) |
| Educational Services | 58,829 (32.5%) | 122,446 (67.5%) |
| Health Care & Social Assistance | 70,970 (26.5%) | 197,040 (73.5%) |
| Arts, Entertainment & Recreation | 25,879 (56.0%) | 20,325 (44.0%) |
| Accommodation & Food Services | 76,930 (49.3%) | 79,235 (50.7%) |
| Public Administration | 45,116 (54.6%) | 37,441 (45.4%) |
| Total | 1,178,655 (54.2%) | 997,391 (45.8%) |
Education in Maricopa County
School Enrollment in Maricopa County
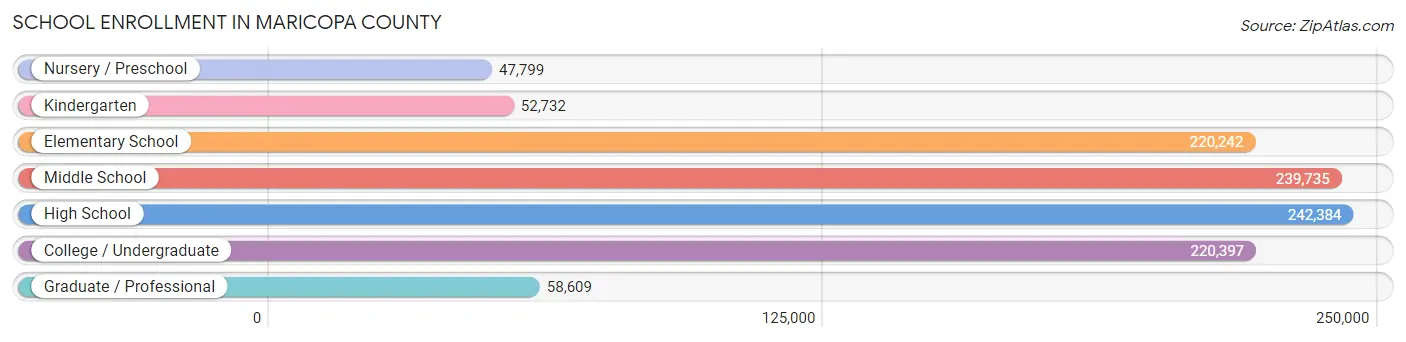
The most common levels of schooling among the 1,081,898 students in Maricopa County are high school (242,384 | 22.4%), middle school (239,735 | 22.2%), and college / undergraduate (220,397 | 20.4%).
| School Level | # Students | % Students |
| Nursery / Preschool | 47,799 | 4.4% |
| Kindergarten | 52,732 | 4.9% |
| Elementary School | 220,242 | 20.4% |
| Middle School | 239,735 | 22.2% |
| High School | 242,384 | 22.4% |
| College / Undergraduate | 220,397 | 20.4% |
| Graduate / Professional | 58,609 | 5.4% |
| Total | 1,081,898 | 100.0% |
School Enrollment by Age by Funding Source in Maricopa County
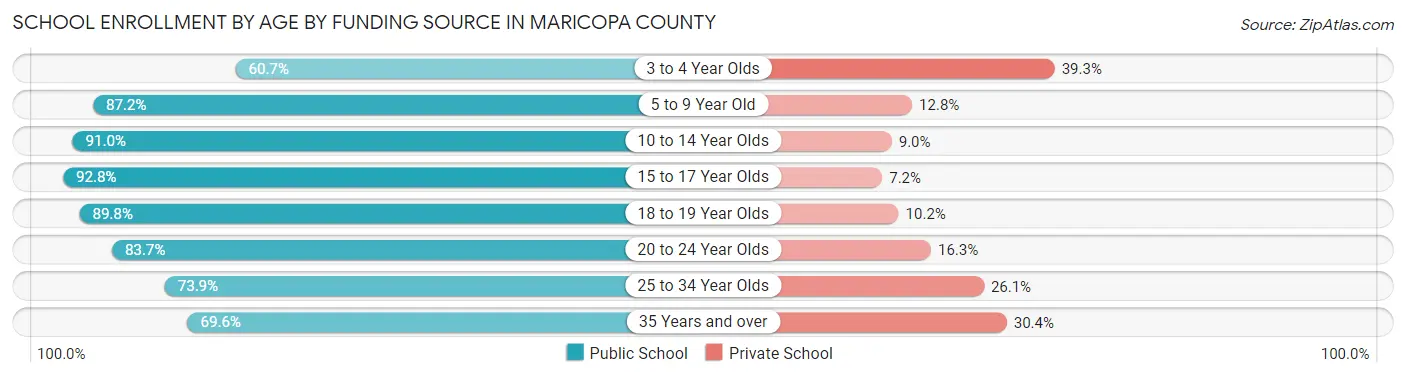
Out of a total of 1,081,898 students who are enrolled in schools in Maricopa County, 148,220 (13.7%) attend a private institution, while the remaining 933,678 (86.3%) are enrolled in public schools. The age group of 3 to 4 year olds has the highest likelihood of being enrolled in private schools, with 14,969 (39.3% in the age bracket) enrolled. Conversely, the age group of 15 to 17 year olds has the lowest likelihood of being enrolled in a private school, with 162,478 (92.8% in the age bracket) attending a public institution.
| Age Bracket | Public School | Private School |
| 3 to 4 Year Olds | 23,109 (60.7%) | 14,969 (39.3%) |
| 5 to 9 Year Old | 224,600 (87.2%) | 32,845 (12.8%) |
| 10 to 14 Year Olds | 269,979 (91.0%) | 26,575 (9.0%) |
| 15 to 17 Year Olds | 162,478 (92.8%) | 12,585 (7.2%) |
| 18 to 19 Year Olds | 70,954 (89.8%) | 8,096 (10.2%) |
| 20 to 24 Year Olds | 89,176 (83.7%) | 17,343 (16.3%) |
| 25 to 34 Year Olds | 51,869 (73.9%) | 18,352 (26.1%) |
| 35 Years and over | 41,056 (69.6%) | 17,912 (30.4%) |
| Total | 933,678 (86.3%) | 148,220 (13.7%) |
Educational Attainment by Field of Study in Maricopa County
Business (251,665 | 22.5%), education (131,239 | 11.7%), science & technology (113,494 | 10.1%), engineering (91,752 | 8.2%), and social sciences (77,434 | 6.9%) are the most common fields of study among 1,121,062 individuals in Maricopa County who have obtained a bachelor's degree or higher.
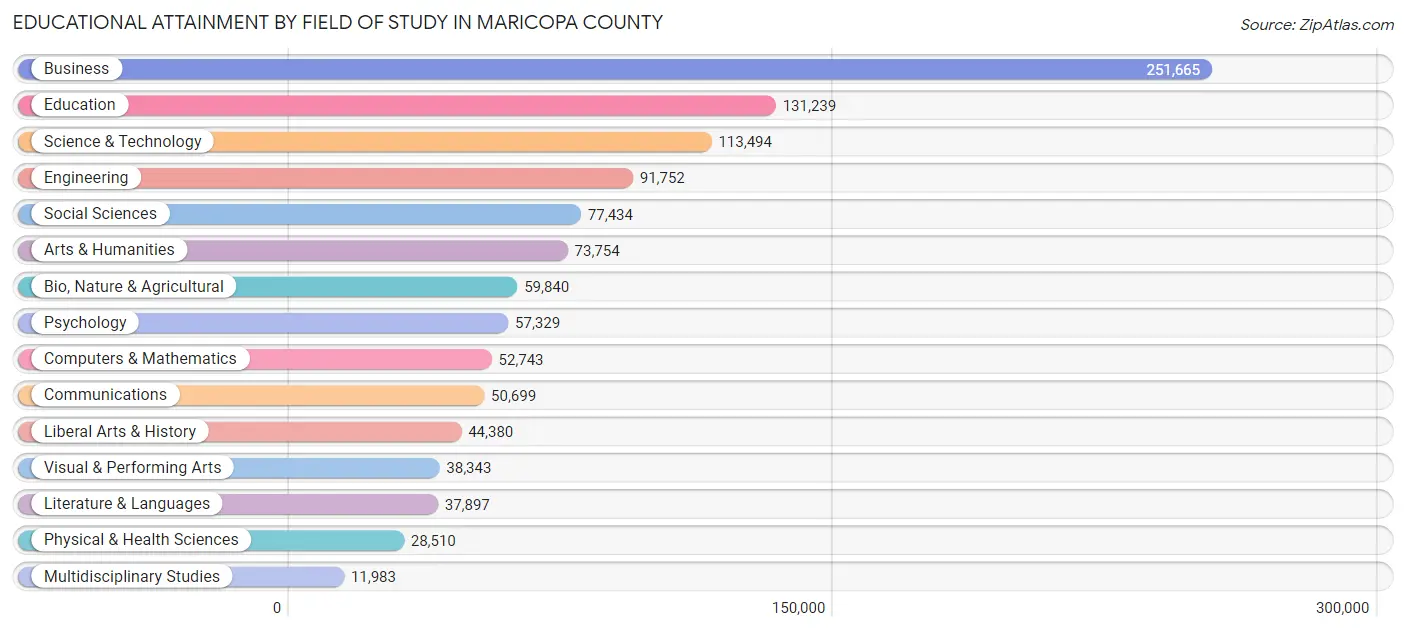
| Field of Study | # Graduates | % Graduates |
| Computers & Mathematics | 52,743 | 4.7% |
| Bio, Nature & Agricultural | 59,840 | 5.3% |
| Physical & Health Sciences | 28,510 | 2.5% |
| Psychology | 57,329 | 5.1% |
| Social Sciences | 77,434 | 6.9% |
| Engineering | 91,752 | 8.2% |
| Multidisciplinary Studies | 11,983 | 1.1% |
| Science & Technology | 113,494 | 10.1% |
| Business | 251,665 | 22.5% |
| Education | 131,239 | 11.7% |
| Literature & Languages | 37,897 | 3.4% |
| Liberal Arts & History | 44,380 | 4.0% |
| Visual & Performing Arts | 38,343 | 3.4% |
| Communications | 50,699 | 4.5% |
| Arts & Humanities | 73,754 | 6.6% |
| Total | 1,121,062 | 100.0% |
Transportation & Commute in Maricopa County
Vehicle Availability by Sex in Maricopa County
The most prevalent vehicle ownership categories in Maricopa County are males with 2 vehicles (494,387, accounting for 42.5%) and females with 2 vehicles (403,862, making up 50.7%).
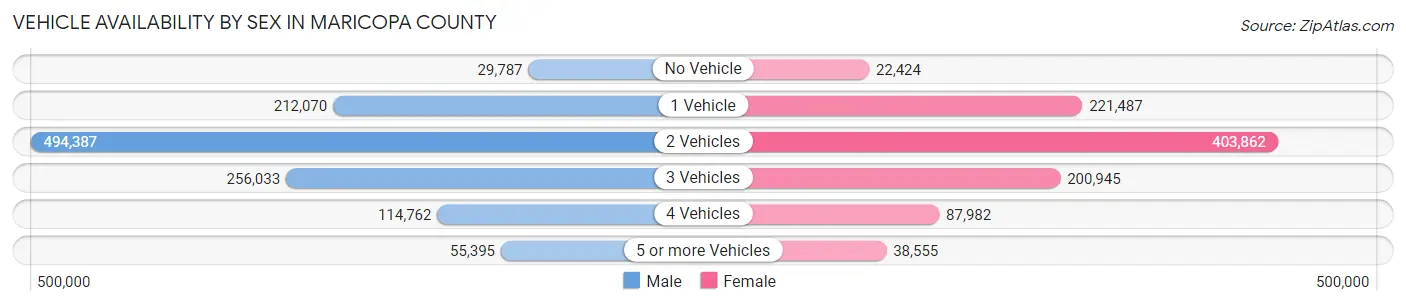
| Vehicles Available | Male | Female |
| No Vehicle | 29,787 (2.6%) | 22,424 (2.3%) |
| 1 Vehicle | 212,070 (18.2%) | 221,487 (22.7%) |
| 2 Vehicles | 494,387 (42.5%) | 403,862 (41.4%) |
| 3 Vehicles | 256,033 (22.0%) | 200,945 (20.6%) |
| 4 Vehicles | 114,762 (9.9%) | 87,982 (9.0%) |
| 5 or more Vehicles | 55,395 (4.8%) | 38,555 (4.0%) |
| Total | 1,162,434 (100.0%) | 975,255 (100.0%) |
Commute Time in Maricopa County
The most frequently occuring commute durations in Maricopa County are 20 to 24 minutes (298,632 commuters, 16.6%), 30 to 34 minutes (279,170 commuters, 15.5%), and 15 to 19 minutes (269,865 commuters, 15.0%).
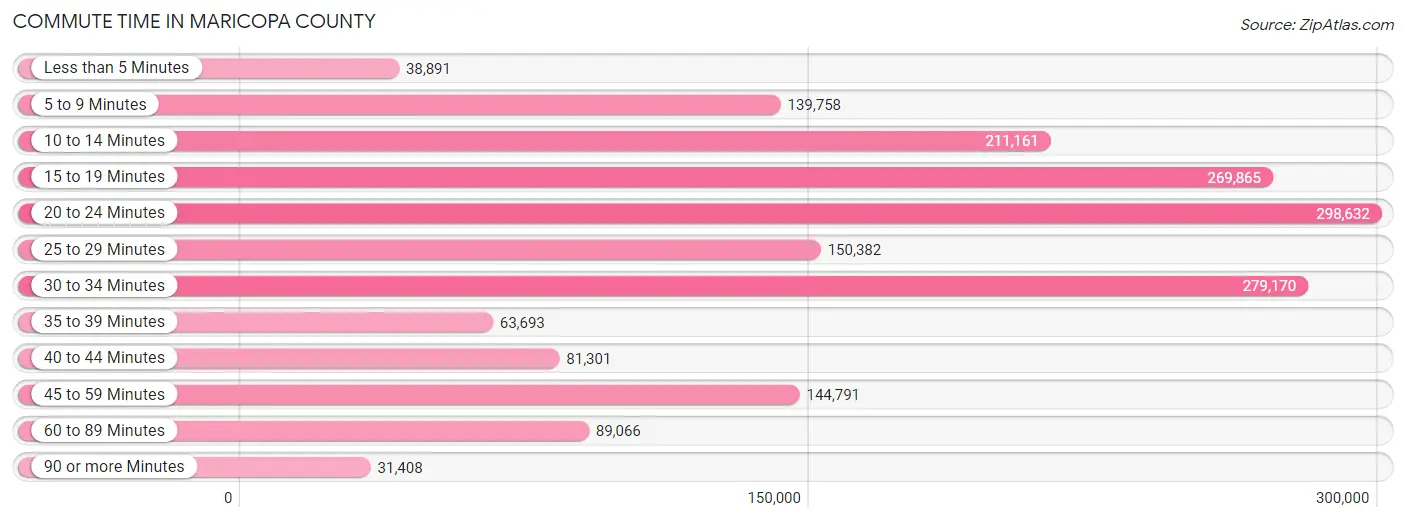
| Commute Time | # Commuters | % Commuters |
| Less than 5 Minutes | 38,891 | 2.2% |
| 5 to 9 Minutes | 139,758 | 7.8% |
| 10 to 14 Minutes | 211,161 | 11.7% |
| 15 to 19 Minutes | 269,865 | 15.0% |
| 20 to 24 Minutes | 298,632 | 16.6% |
| 25 to 29 Minutes | 150,382 | 8.4% |
| 30 to 34 Minutes | 279,170 | 15.5% |
| 35 to 39 Minutes | 63,693 | 3.5% |
| 40 to 44 Minutes | 81,301 | 4.5% |
| 45 to 59 Minutes | 144,791 | 8.1% |
| 60 to 89 Minutes | 89,066 | 5.0% |
| 90 or more Minutes | 31,408 | 1.8% |
Commute Time by Sex in Maricopa County
The most common commute times in Maricopa County are 20 to 24 minutes (163,569 commuters, 16.4%) for males and 20 to 24 minutes (135,063 commuters, 16.8%) for females.
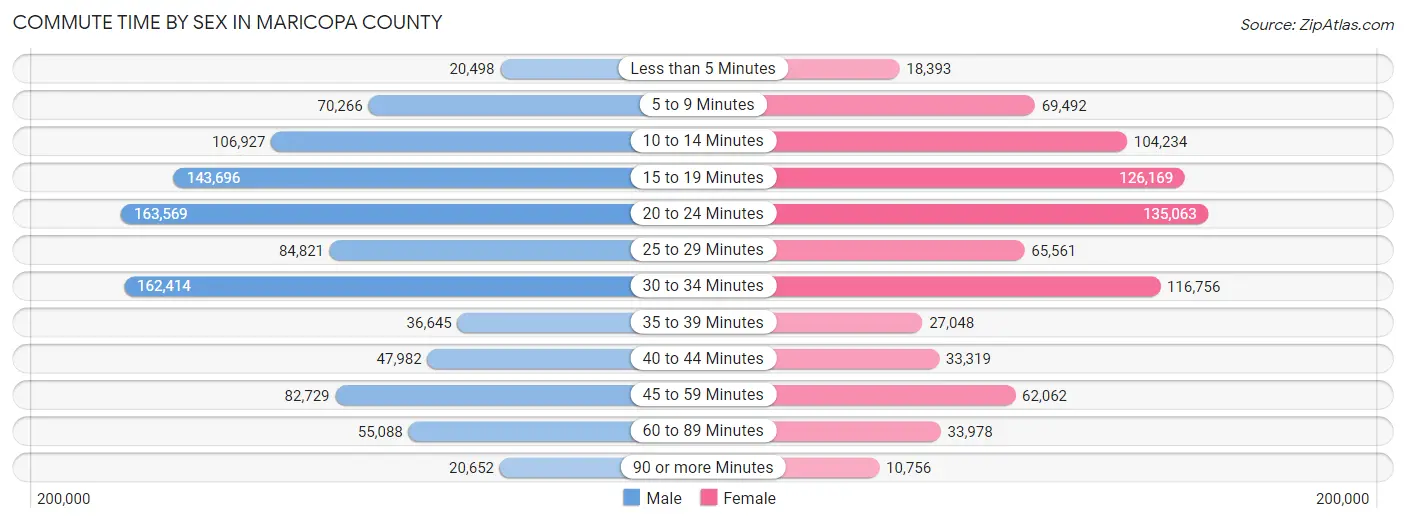
| Commute Time | Male | Female |
| Less than 5 Minutes | 20,498 (2.1%) | 18,393 (2.3%) |
| 5 to 9 Minutes | 70,266 (7.1%) | 69,492 (8.7%) |
| 10 to 14 Minutes | 106,927 (10.7%) | 104,234 (13.0%) |
| 15 to 19 Minutes | 143,696 (14.4%) | 126,169 (15.7%) |
| 20 to 24 Minutes | 163,569 (16.4%) | 135,063 (16.8%) |
| 25 to 29 Minutes | 84,821 (8.5%) | 65,561 (8.2%) |
| 30 to 34 Minutes | 162,414 (16.3%) | 116,756 (14.5%) |
| 35 to 39 Minutes | 36,645 (3.7%) | 27,048 (3.4%) |
| 40 to 44 Minutes | 47,982 (4.8%) | 33,319 (4.2%) |
| 45 to 59 Minutes | 82,729 (8.3%) | 62,062 (7.7%) |
| 60 to 89 Minutes | 55,088 (5.5%) | 33,978 (4.2%) |
| 90 or more Minutes | 20,652 (2.1%) | 10,756 (1.3%) |
Time of Departure to Work by Sex in Maricopa County
The most frequent times of departure to work in Maricopa County are 7:00 AM to 7:29 AM (117,587, 11.8%) for males and 7:00 AM to 7:29 AM (118,869, 14.8%) for females.
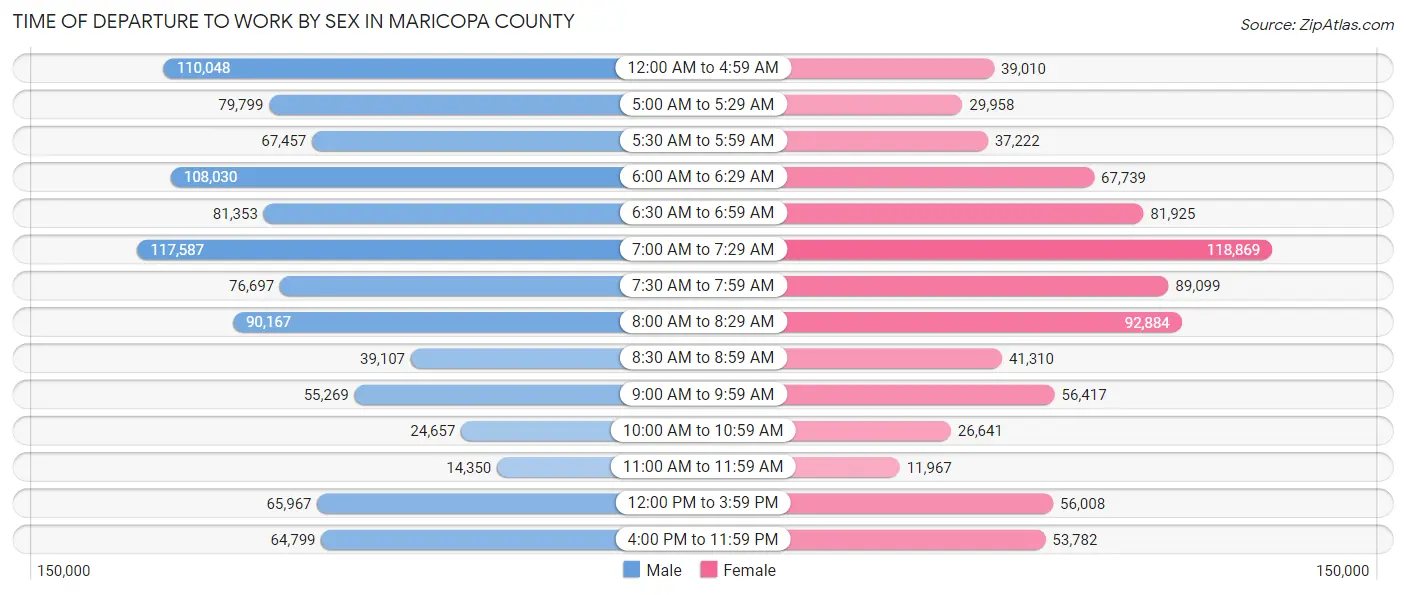
| Time of Departure | Male | Female |
| 12:00 AM to 4:59 AM | 110,048 (11.1%) | 39,010 (4.9%) |
| 5:00 AM to 5:29 AM | 79,799 (8.0%) | 29,958 (3.7%) |
| 5:30 AM to 5:59 AM | 67,457 (6.8%) | 37,222 (4.6%) |
| 6:00 AM to 6:29 AM | 108,030 (10.8%) | 67,739 (8.4%) |
| 6:30 AM to 6:59 AM | 81,353 (8.2%) | 81,925 (10.2%) |
| 7:00 AM to 7:29 AM | 117,587 (11.8%) | 118,869 (14.8%) |
| 7:30 AM to 7:59 AM | 76,697 (7.7%) | 89,099 (11.1%) |
| 8:00 AM to 8:29 AM | 90,167 (9.1%) | 92,884 (11.6%) |
| 8:30 AM to 8:59 AM | 39,107 (3.9%) | 41,310 (5.1%) |
| 9:00 AM to 9:59 AM | 55,269 (5.6%) | 56,417 (7.0%) |
| 10:00 AM to 10:59 AM | 24,657 (2.5%) | 26,641 (3.3%) |
| 11:00 AM to 11:59 AM | 14,350 (1.4%) | 11,967 (1.5%) |
| 12:00 PM to 3:59 PM | 65,967 (6.6%) | 56,008 (7.0%) |
| 4:00 PM to 11:59 PM | 64,799 (6.5%) | 53,782 (6.7%) |
| Total | 995,287 (100.0%) | 802,831 (100.0%) |
Housing Occupancy in Maricopa County
Occupancy by Ownership in Maricopa County
Of the total 1,665,560 dwellings in Maricopa County, owner-occupied units account for 1,071,054 (64.3%), while renter-occupied units make up 594,506 (35.7%).
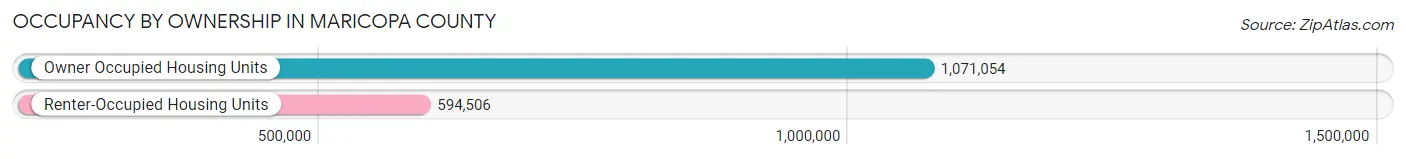
| Occupancy | # Housing Units | % Housing Units |
| Owner Occupied Housing Units | 1,071,054 | 64.3% |
| Renter-Occupied Housing Units | 594,506 | 35.7% |
| Total Occupied Housing Units | 1,665,560 | 100.0% |
Occupancy by Household Size in Maricopa County
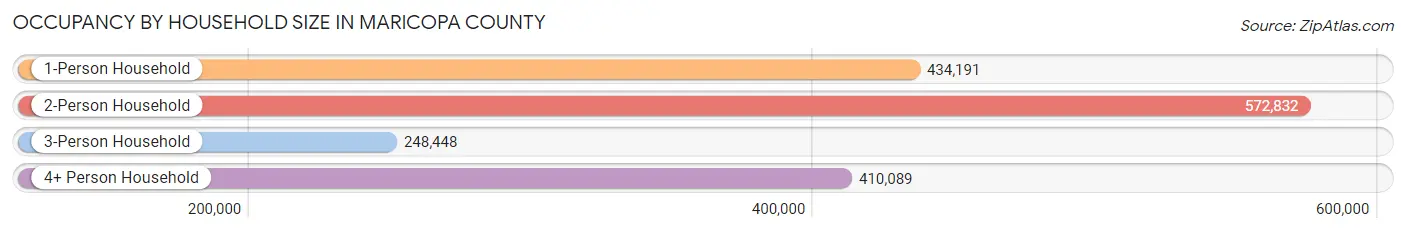
| Household Size | # Housing Units | % Housing Units |
| 1-Person Household | 434,191 | 26.1% |
| 2-Person Household | 572,832 | 34.4% |
| 3-Person Household | 248,448 | 14.9% |
| 4+ Person Household | 410,089 | 24.6% |
| Total Housing Units | 1,665,560 | 100.0% |
Occupancy by Ownership by Household Size in Maricopa County
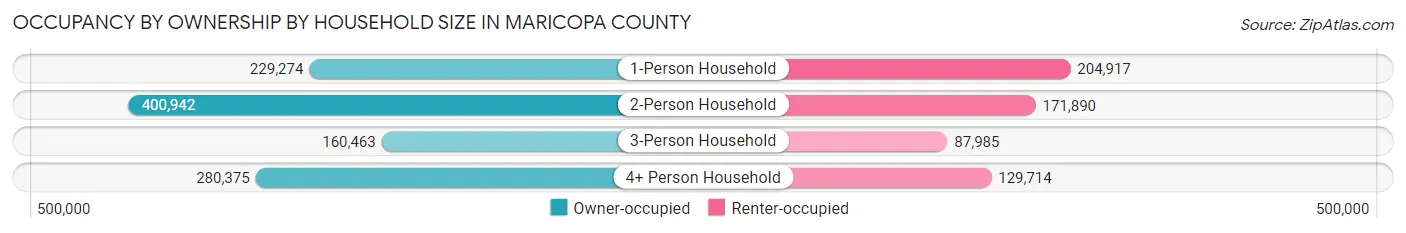
| Household Size | Owner-occupied | Renter-occupied |
| 1-Person Household | 229,274 (52.8%) | 204,917 (47.2%) |
| 2-Person Household | 400,942 (70.0%) | 171,890 (30.0%) |
| 3-Person Household | 160,463 (64.6%) | 87,985 (35.4%) |
| 4+ Person Household | 280,375 (68.4%) | 129,714 (31.6%) |
| Total Housing Units | 1,071,054 (64.3%) | 594,506 (35.7%) |
Occupancy by Educational Attainment in Maricopa County
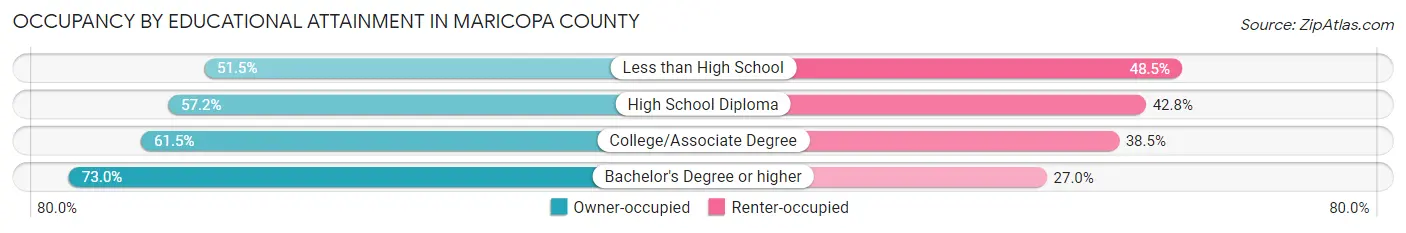
| Household Size | Owner-occupied | Renter-occupied |
| Less than High School | 73,625 (51.5%) | 69,258 (48.5%) |
| High School Diploma | 176,361 (57.2%) | 131,768 (42.8%) |
| College/Associate Degree | 350,603 (61.5%) | 219,235 (38.5%) |
| Bachelor's Degree or higher | 470,465 (73.0%) | 174,245 (27.0%) |
Occupancy by Age of Householder in Maricopa County
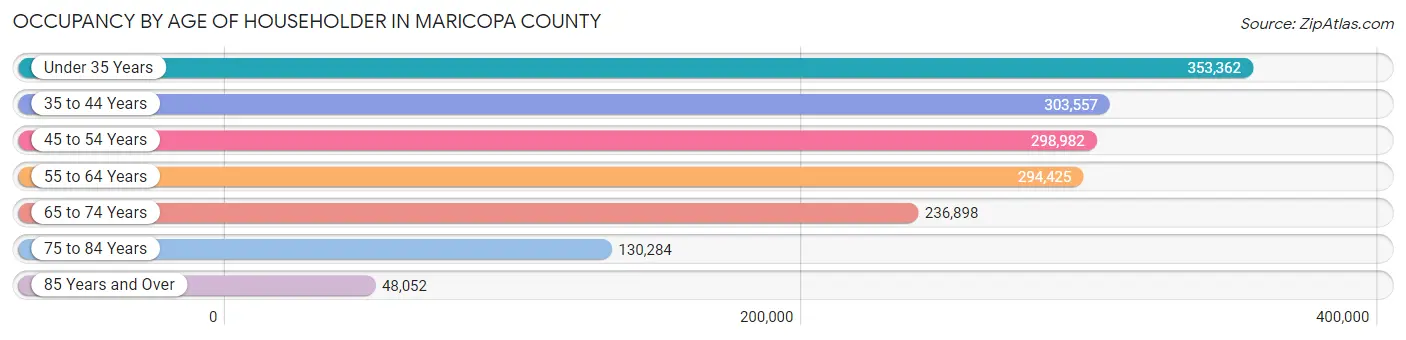
| Age Bracket | # Households | % Households |
| Under 35 Years | 353,362 | 21.2% |
| 35 to 44 Years | 303,557 | 18.2% |
| 45 to 54 Years | 298,982 | 17.9% |
| 55 to 64 Years | 294,425 | 17.7% |
| 65 to 74 Years | 236,898 | 14.2% |
| 75 to 84 Years | 130,284 | 7.8% |
| 85 Years and Over | 48,052 | 2.9% |
| Total | 1,665,560 | 100.0% |
Housing Finances in Maricopa County
Median Income by Occupancy in Maricopa County
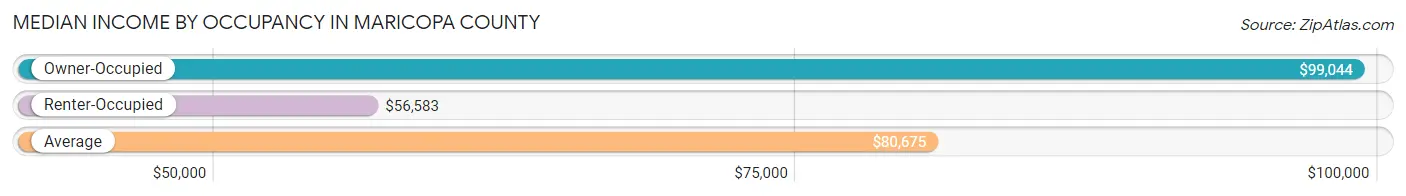
| Occupancy Type | # Households | Median Income |
| Owner-Occupied | 1,071,054 (64.3%) | $99,044 |
| Renter-Occupied | 594,506 (35.7%) | $56,583 |
| Average | 1,665,560 (100.0%) | $80,675 |
Occupancy by Householder Income Bracket in Maricopa County
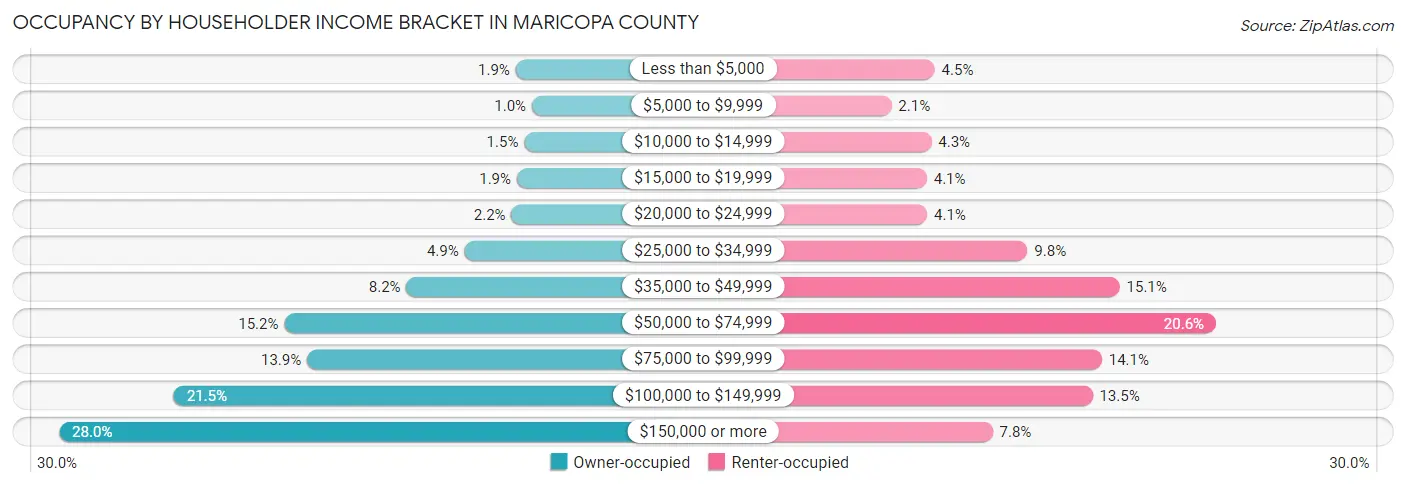
| Income Bracket | Owner-occupied | Renter-occupied |
| Less than $5,000 | 20,752 (1.9%) | 26,878 (4.5%) |
| $5,000 to $9,999 | 10,834 (1.0%) | 12,175 (2.1%) |
| $10,000 to $14,999 | 15,533 (1.5%) | 25,742 (4.3%) |
| $15,000 to $19,999 | 20,007 (1.9%) | 24,183 (4.1%) |
| $20,000 to $24,999 | 23,342 (2.2%) | 24,307 (4.1%) |
| $25,000 to $34,999 | 52,068 (4.9%) | 58,352 (9.8%) |
| $35,000 to $49,999 | 87,629 (8.2%) | 89,727 (15.1%) |
| $50,000 to $74,999 | 162,330 (15.2%) | 122,414 (20.6%) |
| $75,000 to $99,999 | 148,399 (13.9%) | 83,634 (14.1%) |
| $100,000 to $149,999 | 229,993 (21.5%) | 80,517 (13.5%) |
| $150,000 or more | 300,167 (28.0%) | 46,577 (7.8%) |
| Total | 1,071,054 (100.0%) | 594,506 (100.0%) |
Monthly Housing Cost Tiers in Maricopa County
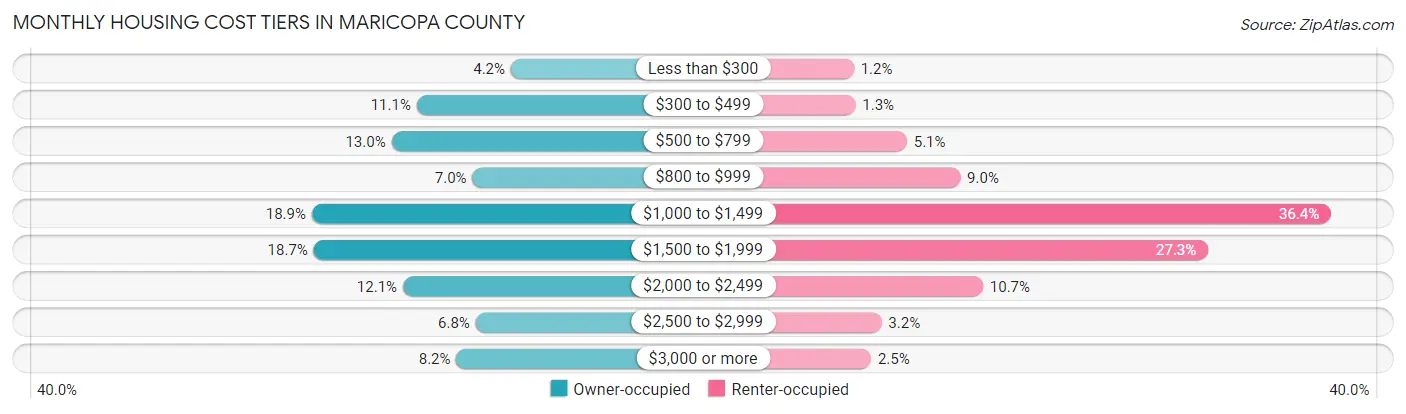
| Monthly Cost | Owner-occupied | Renter-occupied |
| Less than $300 | 44,898 (4.2%) | 7,132 (1.2%) |
| $300 to $499 | 119,100 (11.1%) | 7,825 (1.3%) |
| $500 to $799 | 139,073 (13.0%) | 30,376 (5.1%) |
| $800 to $999 | 75,156 (7.0%) | 53,772 (9.0%) |
| $1,000 to $1,499 | 201,920 (18.9%) | 216,079 (36.3%) |
| $1,500 to $1,999 | 200,400 (18.7%) | 162,323 (27.3%) |
| $2,000 to $2,499 | 130,044 (12.1%) | 63,701 (10.7%) |
| $2,500 to $2,999 | 72,629 (6.8%) | 19,267 (3.2%) |
| $3,000 or more | 87,834 (8.2%) | 14,683 (2.5%) |
| Total | 1,071,054 (100.0%) | 594,506 (100.0%) |
Physical Housing Characteristics in Maricopa County
Housing Structures in Maricopa County
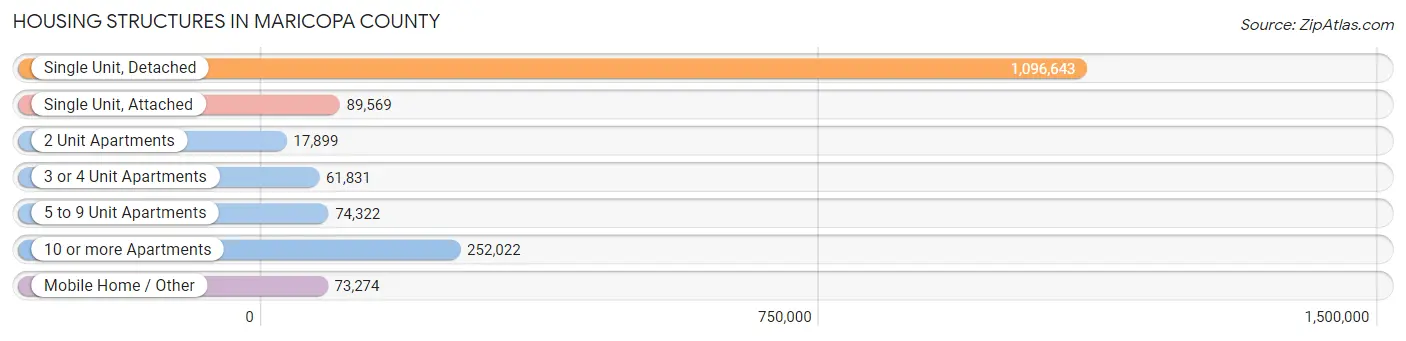
| Structure Type | # Housing Units | % Housing Units |
| Single Unit, Detached | 1,096,643 | 65.8% |
| Single Unit, Attached | 89,569 | 5.4% |
| 2 Unit Apartments | 17,899 | 1.1% |
| 3 or 4 Unit Apartments | 61,831 | 3.7% |
| 5 to 9 Unit Apartments | 74,322 | 4.5% |
| 10 or more Apartments | 252,022 | 15.1% |
| Mobile Home / Other | 73,274 | 4.4% |
| Total | 1,665,560 | 100.0% |
Housing Structures by Occupancy in Maricopa County
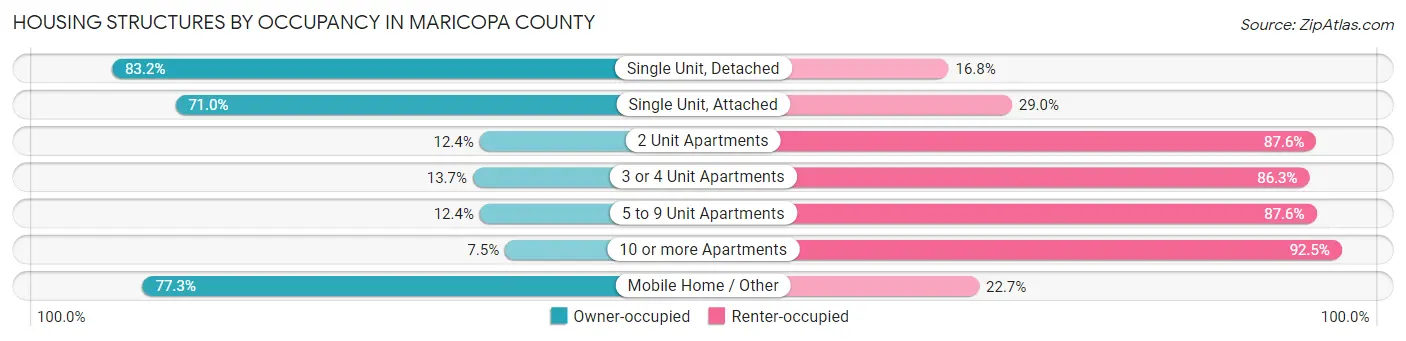
| Structure Type | Owner-occupied | Renter-occupied |
| Single Unit, Detached | 912,077 (83.2%) | 184,566 (16.8%) |
| Single Unit, Attached | 63,594 (71.0%) | 25,975 (29.0%) |
| 2 Unit Apartments | 2,219 (12.4%) | 15,680 (87.6%) |
| 3 or 4 Unit Apartments | 8,475 (13.7%) | 53,356 (86.3%) |
| 5 to 9 Unit Apartments | 9,193 (12.4%) | 65,129 (87.6%) |
| 10 or more Apartments | 18,864 (7.5%) | 233,158 (92.5%) |
| Mobile Home / Other | 56,632 (77.3%) | 16,642 (22.7%) |
| Total | 1,071,054 (64.3%) | 594,506 (35.7%) |
Housing Structures by Number of Rooms in Maricopa County
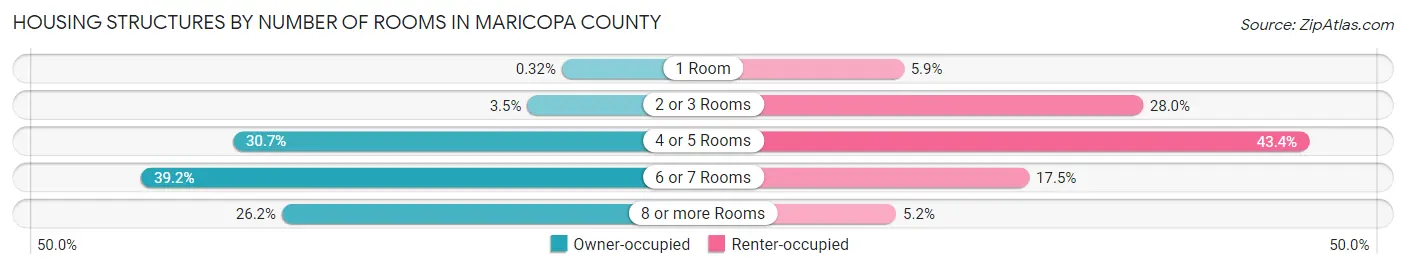
| Number of Rooms | Owner-occupied | Renter-occupied |
| 1 Room | 3,438 (0.3%) | 35,103 (5.9%) |
| 2 or 3 Rooms | 37,616 (3.5%) | 166,587 (28.0%) |
| 4 or 5 Rooms | 329,111 (30.7%) | 257,856 (43.4%) |
| 6 or 7 Rooms | 420,218 (39.2%) | 104,060 (17.5%) |
| 8 or more Rooms | 280,671 (26.2%) | 30,900 (5.2%) |
| Total | 1,071,054 (100.0%) | 594,506 (100.0%) |
Housing Structure by Heating Type in Maricopa County
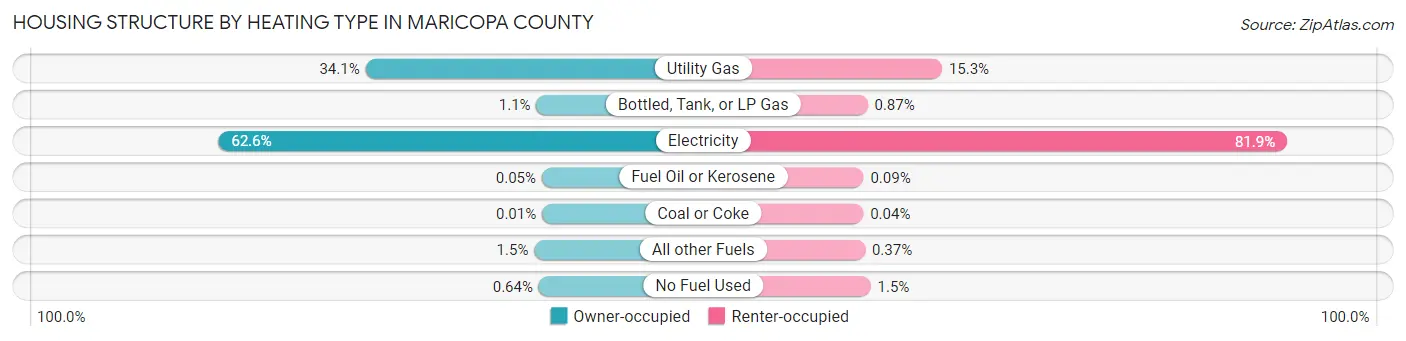
| Heating Type | Owner-occupied | Renter-occupied |
| Utility Gas | 365,531 (34.1%) | 90,653 (15.2%) |
| Bottled, Tank, or LP Gas | 11,757 (1.1%) | 5,187 (0.9%) |
| Electricity | 669,999 (62.6%) | 487,041 (81.9%) |
| Fuel Oil or Kerosene | 548 (0.1%) | 536 (0.1%) |
| Coal or Coke | 76 (0.0%) | 241 (0.0%) |
| All other Fuels | 16,304 (1.5%) | 2,175 (0.4%) |
| No Fuel Used | 6,839 (0.6%) | 8,673 (1.5%) |
| Total | 1,071,054 (100.0%) | 594,506 (100.0%) |
Household Vehicle Usage in Maricopa County
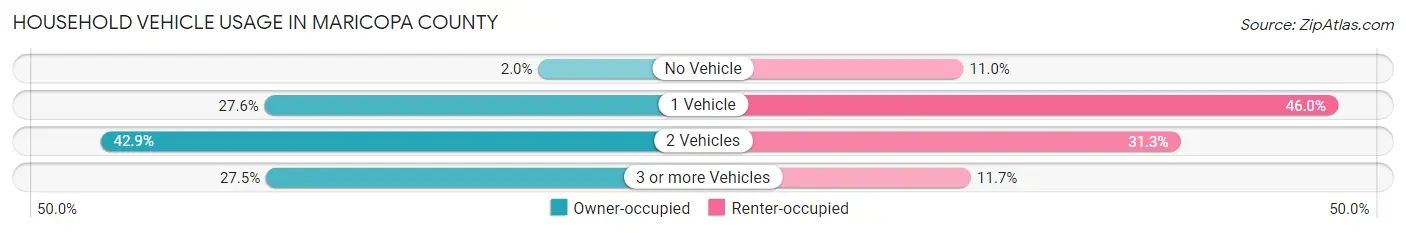
| Vehicles per Household | Owner-occupied | Renter-occupied |
| No Vehicle | 21,817 (2.0%) | 65,357 (11.0%) |
| 1 Vehicle | 295,502 (27.6%) | 273,520 (46.0%) |
| 2 Vehicles | 459,614 (42.9%) | 186,102 (31.3%) |
| 3 or more Vehicles | 294,121 (27.5%) | 69,527 (11.7%) |
| Total | 1,071,054 (100.0%) | 594,506 (100.0%) |
Real Estate & Mortgages in Maricopa County
Real Estate and Mortgage Overview in Maricopa County
| Characteristic | Without Mortgage | With Mortgage |
| Housing Units | 343,878 | 727,176 |
| Median Property Value | $336,000 | $384,700 |
| Median Household Income | $72,309 | $235,245 |
| Monthly Housing Costs | $527 | $86,186 |
| Real Estate Taxes | $1,768 | $19,588 |
Property Value by Mortgage Status in Maricopa County
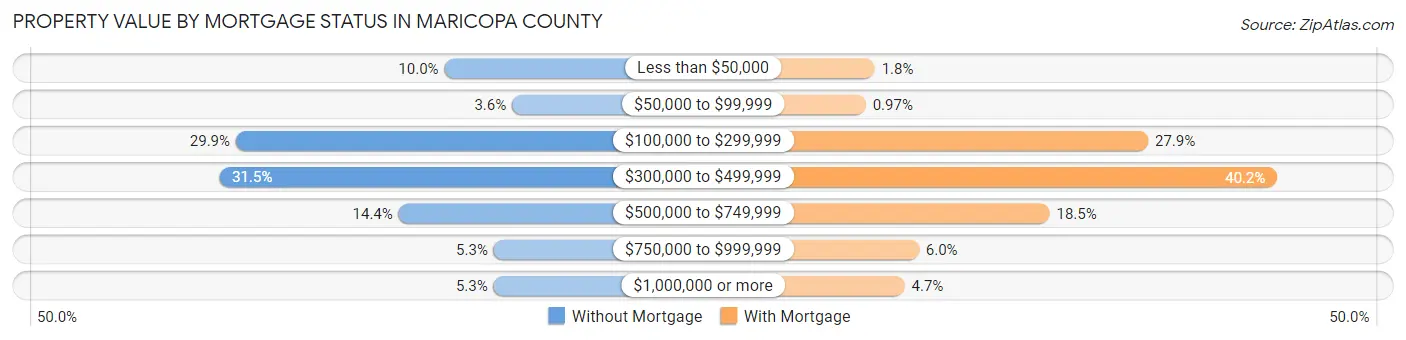
| Property Value | Without Mortgage | With Mortgage |
| Less than $50,000 | 34,448 (10.0%) | 13,284 (1.8%) |
| $50,000 to $99,999 | 12,314 (3.6%) | 7,054 (1.0%) |
| $100,000 to $299,999 | 102,746 (29.9%) | 202,613 (27.9%) |
| $300,000 to $499,999 | 108,254 (31.5%) | 292,061 (40.2%) |
| $500,000 to $749,999 | 49,462 (14.4%) | 134,375 (18.5%) |
| $750,000 to $999,999 | 18,301 (5.3%) | 43,827 (6.0%) |
| $1,000,000 or more | 18,353 (5.3%) | 33,962 (4.7%) |
| Total | 343,878 (100.0%) | 727,176 (100.0%) |
Household Income by Mortgage Status in Maricopa County
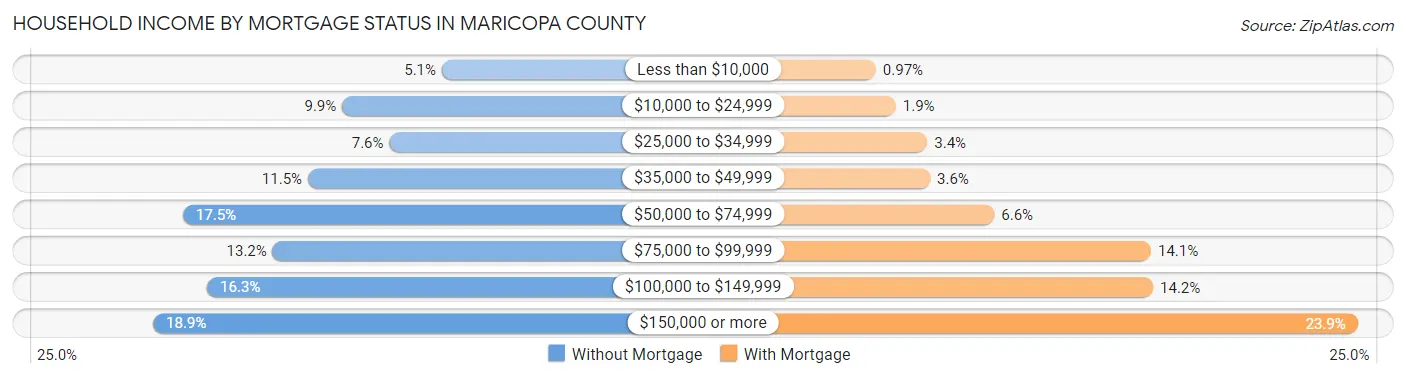
| Household Income | Without Mortgage | With Mortgage |
| Less than $10,000 | 17,633 (5.1%) | 7,075 (1.0%) |
| $10,000 to $24,999 | 33,983 (9.9%) | 13,953 (1.9%) |
| $25,000 to $34,999 | 26,247 (7.6%) | 24,899 (3.4%) |
| $35,000 to $49,999 | 39,596 (11.5%) | 25,821 (3.5%) |
| $50,000 to $74,999 | 60,037 (17.5%) | 48,033 (6.6%) |
| $75,000 to $99,999 | 45,357 (13.2%) | 102,293 (14.1%) |
| $100,000 to $149,999 | 56,103 (16.3%) | 103,042 (14.2%) |
| $150,000 or more | 64,922 (18.9%) | 173,890 (23.9%) |
| Total | 343,878 (100.0%) | 727,176 (100.0%) |
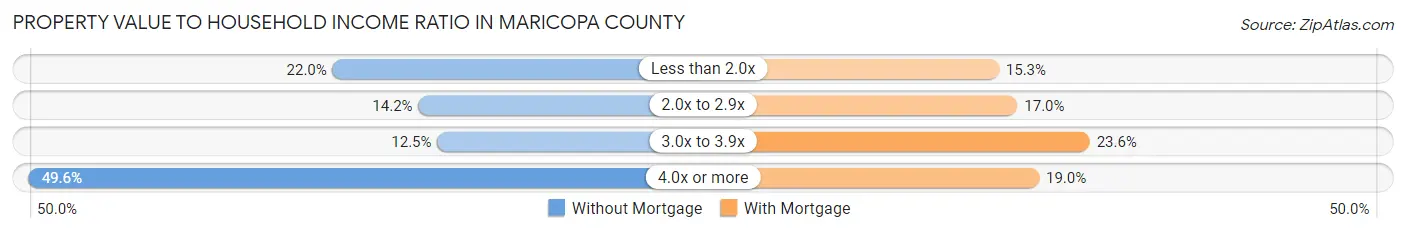
Property Value to Household Income Ratio in Maricopa County
| Value-to-Income Ratio | Without Mortgage | With Mortgage |
| Less than 2.0x | 75,747 (22.0%) | 111,558 (15.3%) |
| 2.0x to 2.9x | 48,981 (14.2%) | 123,758 (17.0%) |
| 3.0x to 3.9x | 43,062 (12.5%) | 171,527 (23.6%) |
| 4.0x or more | 170,632 (49.6%) | 138,074 (19.0%) |
| Total | 343,878 (100.0%) | 727,176 (100.0%) |
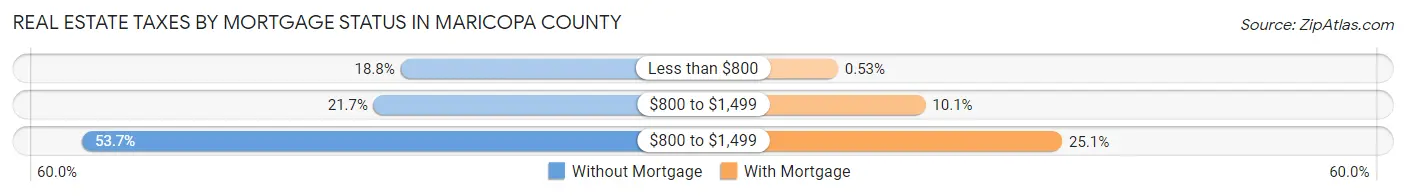
Real Estate Taxes by Mortgage Status in Maricopa County
| Property Taxes | Without Mortgage | With Mortgage |
| Less than $800 | 64,637 (18.8%) | 3,872 (0.5%) |
| $800 to $1,499 | 74,738 (21.7%) | 73,570 (10.1%) |
| $800 to $1,499 | 184,686 (53.7%) | 182,541 (25.1%) |
| Total | 343,878 (100.0%) | 727,176 (100.0%) |
Health & Disability in Maricopa County
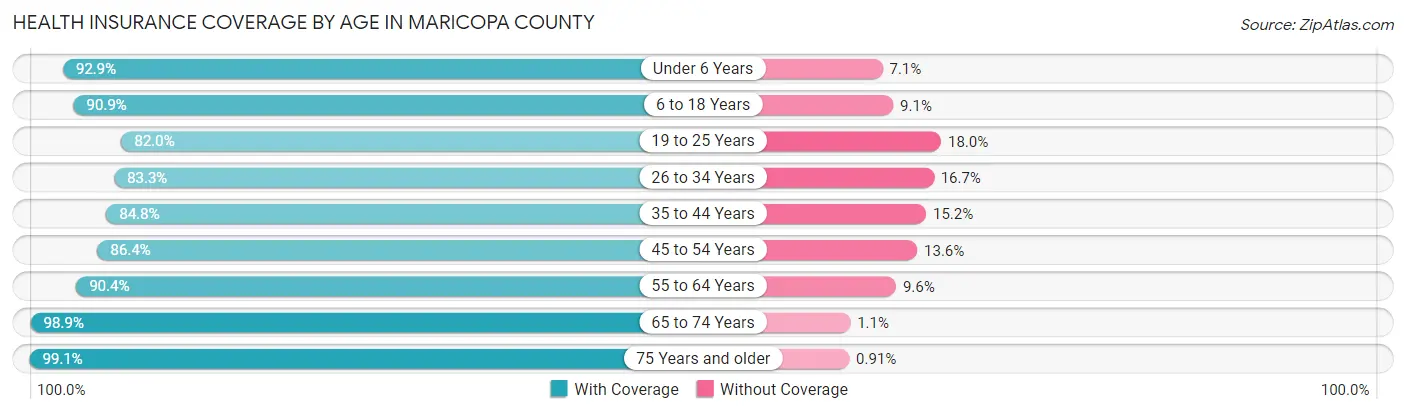
Health Insurance Coverage by Age in Maricopa County
| Age Bracket | With Coverage | Without Coverage |
| Under 6 Years | 290,849 (92.9%) | 22,330 (7.1%) |
| 6 to 18 Years | 700,118 (90.9%) | 70,212 (9.1%) |
| 19 to 25 Years | 345,714 (82.0%) | 76,094 (18.0%) |
| 26 to 34 Years | 473,252 (83.3%) | 94,687 (16.7%) |
| 35 to 44 Years | 489,732 (84.8%) | 88,086 (15.2%) |
| 45 to 54 Years | 471,805 (86.4%) | 74,132 (13.6%) |
| 55 to 64 Years | 463,093 (90.4%) | 49,352 (9.6%) |
| 65 to 74 Years | 391,488 (98.9%) | 4,371 (1.1%) |
| 75 Years and older | 283,872 (99.1%) | 2,607 (0.9%) |
| Total | 3,909,923 (89.0%) | 481,871 (11.0%) |
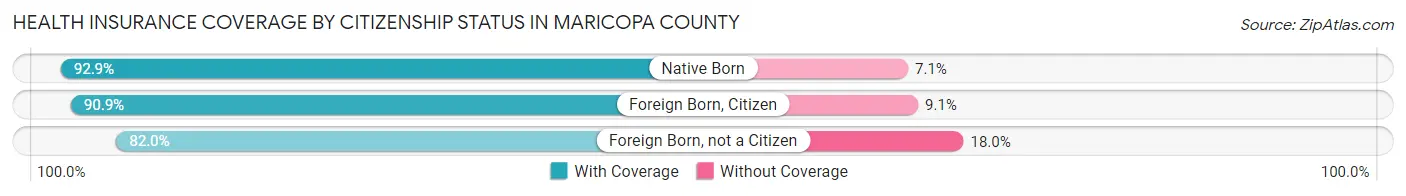
Health Insurance Coverage by Citizenship Status in Maricopa County
| Citizenship Status | With Coverage | Without Coverage |
| Native Born | 290,849 (92.9%) | 22,330 (7.1%) |
| Foreign Born, Citizen | 700,118 (90.9%) | 70,212 (9.1%) |
| Foreign Born, not a Citizen | 345,714 (82.0%) | 76,094 (18.0%) |
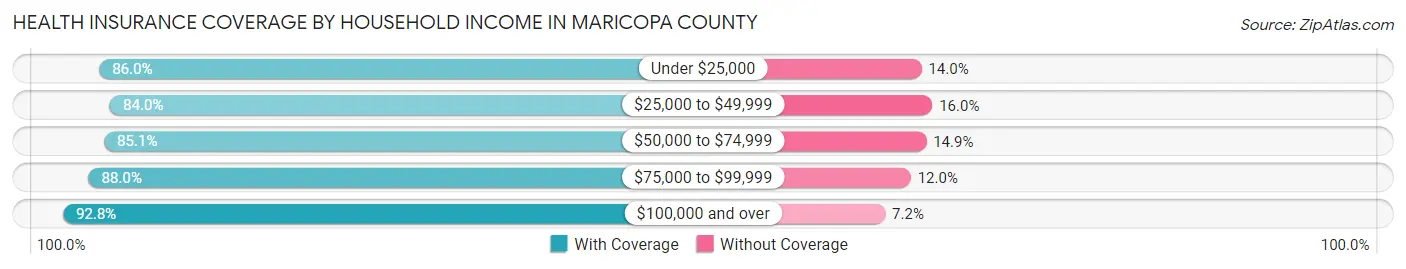
Health Insurance Coverage by Household Income in Maricopa County
| Household Income | With Coverage | Without Coverage |
| Under $25,000 | 324,299 (86.0%) | 52,751 (14.0%) |
| $25,000 to $49,999 | 527,524 (84.0%) | 100,537 (16.0%) |
| $50,000 to $74,999 | 592,826 (85.1%) | 103,615 (14.9%) |
| $75,000 to $99,999 | 551,629 (88.0%) | 75,046 (12.0%) |
| $100,000 and over | 1,886,834 (92.8%) | 146,216 (7.2%) |
Public vs Private Health Insurance Coverage by Age in Maricopa County
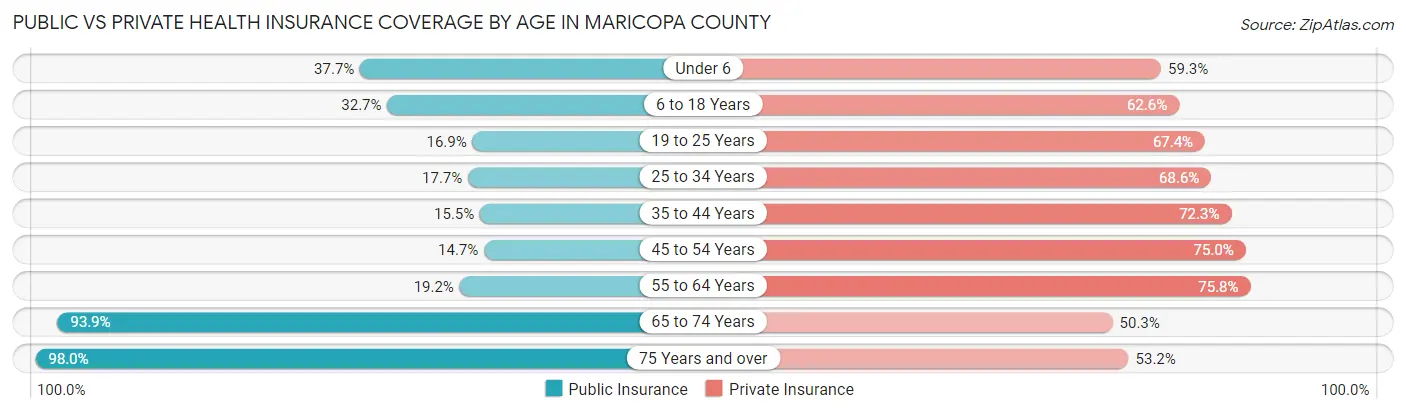
| Age Bracket | Public Insurance | Private Insurance |
| Under 6 | 118,123 (37.7%) | 185,611 (59.3%) |
| 6 to 18 Years | 251,633 (32.7%) | 482,103 (62.6%) |
| 19 to 25 Years | 71,061 (16.9%) | 284,300 (67.4%) |
| 25 to 34 Years | 100,413 (17.7%) | 389,335 (68.5%) |
| 35 to 44 Years | 89,273 (15.4%) | 417,671 (72.3%) |
| 45 to 54 Years | 80,290 (14.7%) | 409,242 (75.0%) |
| 55 to 64 Years | 98,608 (19.2%) | 388,604 (75.8%) |
| 65 to 74 Years | 371,759 (93.9%) | 198,979 (50.3%) |
| 75 Years and over | 280,757 (98.0%) | 152,534 (53.2%) |
| Total | 1,461,917 (33.3%) | 2,908,379 (66.2%) |
Disability Status by Sex by Age in Maricopa County
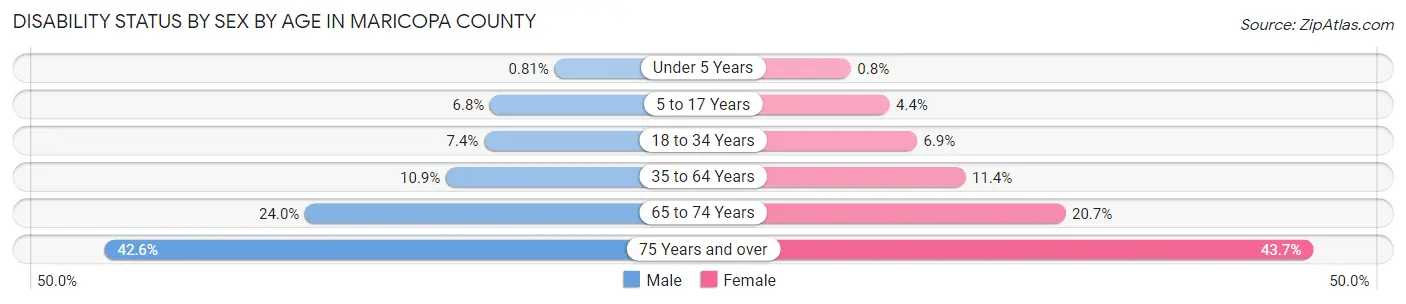
| Age Bracket | Male | Female |
| Under 5 Years | 1,071 (0.8%) | 1,021 (0.8%) |
| 5 to 17 Years | 26,486 (6.8%) | 16,395 (4.4%) |
| 18 to 34 Years | 39,366 (7.3%) | 35,672 (6.9%) |
| 35 to 64 Years | 88,772 (10.9%) | 93,854 (11.4%) |
| 65 to 74 Years | 44,050 (24.0%) | 43,927 (20.7%) |
| 75 Years and over | 53,187 (42.6%) | 70,646 (43.7%) |
Disability Class by Sex by Age in Maricopa County
Disability Class: Hearing Difficulty
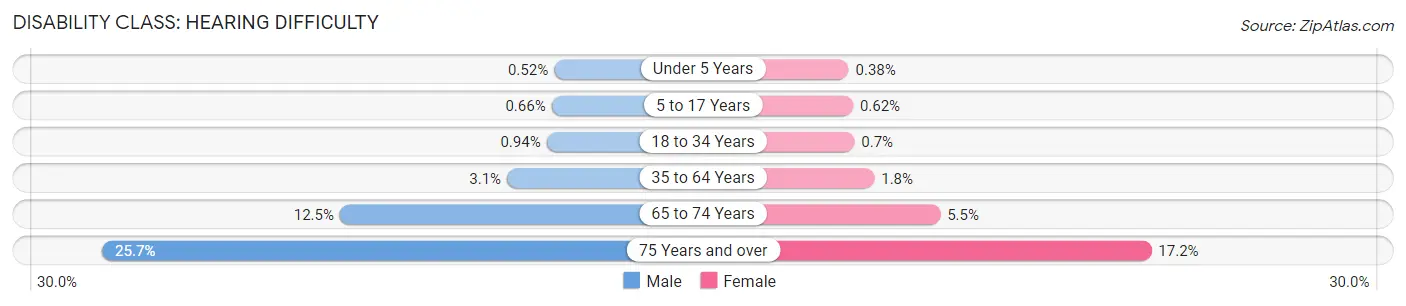
| Age Bracket | Male | Female |
| Under 5 Years | 682 (0.5%) | 484 (0.4%) |
| 5 to 17 Years | 2,580 (0.7%) | 2,309 (0.6%) |
| 18 to 34 Years | 5,040 (0.9%) | 3,587 (0.7%) |
| 35 to 64 Years | 25,576 (3.1%) | 14,893 (1.8%) |
| 65 to 74 Years | 22,894 (12.4%) | 11,622 (5.5%) |
| 75 Years and over | 32,080 (25.7%) | 27,856 (17.2%) |
Disability Class: Vision Difficulty
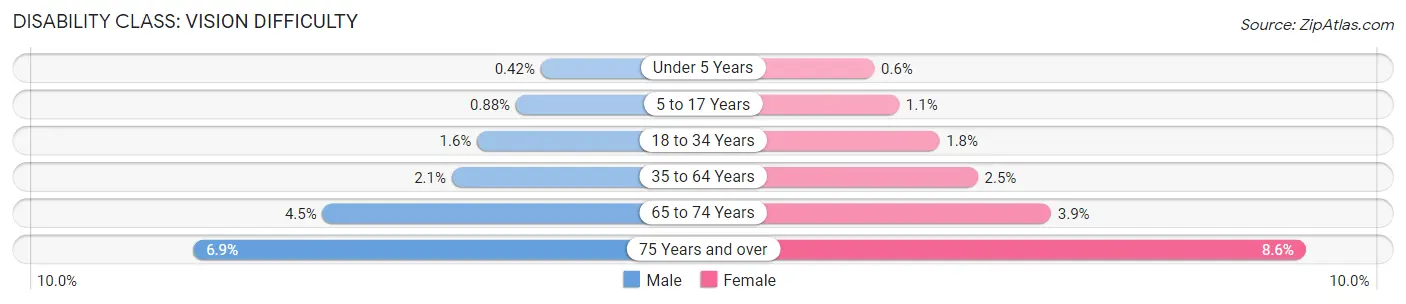
| Age Bracket | Male | Female |
| Under 5 Years | 558 (0.4%) | 760 (0.6%) |
| 5 to 17 Years | 3,416 (0.9%) | 3,947 (1.1%) |
| 18 to 34 Years | 8,553 (1.6%) | 9,302 (1.8%) |
| 35 to 64 Years | 16,918 (2.1%) | 20,680 (2.5%) |
| 65 to 74 Years | 8,215 (4.5%) | 8,237 (3.9%) |
| 75 Years and over | 8,583 (6.9%) | 13,916 (8.6%) |
Disability Class: Cognitive Difficulty
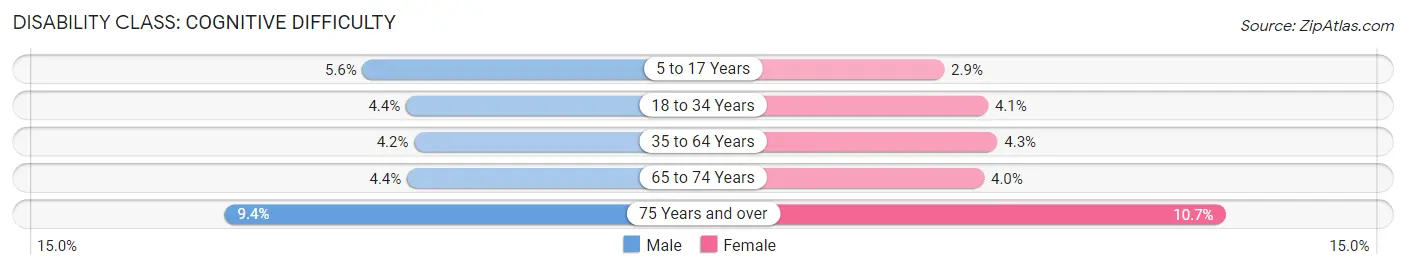
| Age Bracket | Male | Female |
| 5 to 17 Years | 21,792 (5.6%) | 10,636 (2.9%) |
| 18 to 34 Years | 23,457 (4.4%) | 20,951 (4.1%) |
| 35 to 64 Years | 33,818 (4.2%) | 35,527 (4.3%) |
| 65 to 74 Years | 7,991 (4.3%) | 8,398 (4.0%) |
| 75 Years and over | 11,787 (9.4%) | 17,255 (10.7%) |
Disability Class: Ambulatory Difficulty
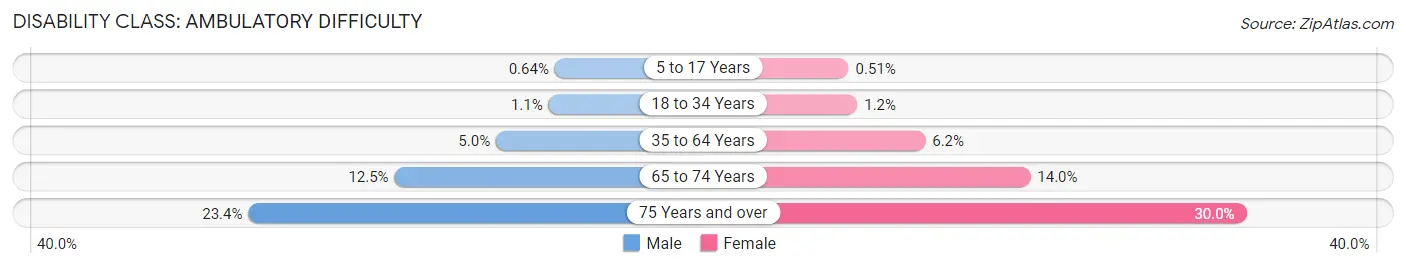
| Age Bracket | Male | Female |
| 5 to 17 Years | 2,480 (0.6%) | 1,920 (0.5%) |
| 18 to 34 Years | 5,884 (1.1%) | 5,926 (1.1%) |
| 35 to 64 Years | 40,811 (5.0%) | 50,875 (6.2%) |
| 65 to 74 Years | 23,052 (12.5%) | 29,693 (14.0%) |
| 75 Years and over | 29,222 (23.4%) | 48,532 (30.0%) |
Disability Class: Self-Care Difficulty
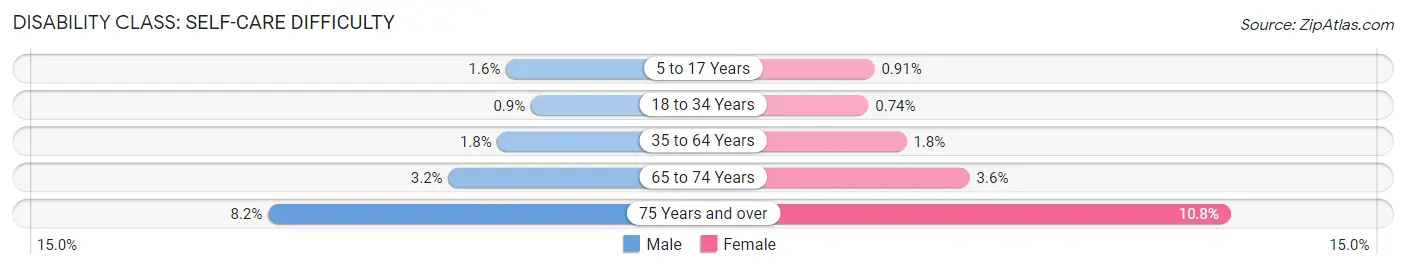
| Age Bracket | Male | Female |
| 5 to 17 Years | 6,196 (1.6%) | 3,411 (0.9%) |
| 18 to 34 Years | 4,829 (0.9%) | 3,788 (0.7%) |
| 35 to 64 Years | 14,945 (1.8%) | 14,786 (1.8%) |
| 65 to 74 Years | 5,878 (3.2%) | 7,546 (3.6%) |
| 75 Years and over | 10,275 (8.2%) | 17,488 (10.8%) |
Technology Access in Maricopa County
Computing Device Access in Maricopa County
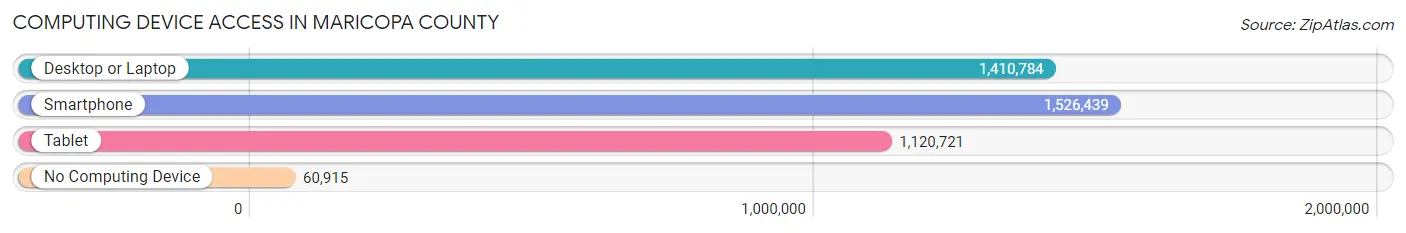
| Device Type | # Households | % Households |
| Desktop or Laptop | 1,410,784 | 84.7% |
| Smartphone | 1,526,439 | 91.6% |
| Tablet | 1,120,721 | 67.3% |
| No Computing Device | 60,915 | 3.7% |
| Total | 1,665,560 | 100.0% |
Internet Access in Maricopa County
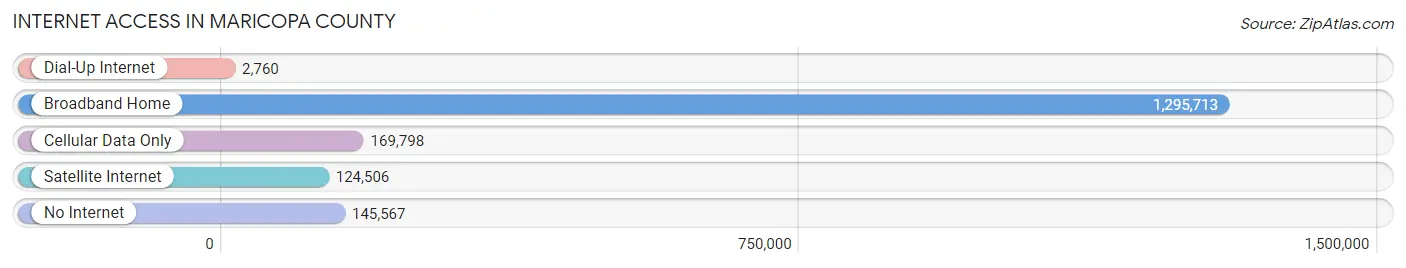
| Internet Type | # Households | % Households |
| Dial-Up Internet | 2,760 | 0.2% |
| Broadband Home | 1,295,713 | 77.8% |
| Cellular Data Only | 169,798 | 10.2% |
| Satellite Internet | 124,506 | 7.5% |
| No Internet | 145,567 | 8.7% |
| Total | 1,665,560 | 100.0% |
Maricopa County Summary
Maricopa County, Arizona is the fourth most populous county in the United States, with an estimated population of 4,410,824 as of 2019. It is located in the south-central part of the state and is home to the state capital, Phoenix. The county is bordered by Pinal County to the south, Yavapai County to the west, Gila County to the east, and Yuma County to the northwest.
Geography
Maricopa County covers an area of 9,224 square miles, making it the largest county in Arizona and the sixth largest county in the United States. The county is located in the Sonoran Desert and is characterized by its arid climate. The county is divided into two distinct regions: the Valley of the Sun, which is located in the center of the county, and the surrounding desert. The Valley of the Sun is home to the majority of the county’s population and is characterized by its flat terrain and hot, dry climate. The desert region is characterized by its rugged terrain and sparse vegetation.
The county is home to several mountain ranges, including the White Tank Mountains, the Superstition Mountains, and the Sierra Estrella Mountains. The county is also home to several rivers, including the Gila River, the Salt River, and the Verde River.
Economy
Maricopa County is home to a diverse economy, with a variety of industries contributing to its economic growth. The county is home to several major corporations, including Intel, Honeywell, and US Airways. The county is also home to a number of smaller businesses, including technology companies, manufacturing companies, and retail stores.
The county is home to several major airports, including Phoenix Sky Harbor International Airport, Phoenix-Mesa Gateway Airport, and Phoenix Deer Valley Airport. The county is also home to several major highways, including Interstate 10, Interstate 17, and State Route 51.
Demographics
As of 2019, Maricopa County had an estimated population of 4,410,824, making it the fourth most populous county in the United States. The county is home to a diverse population, with a variety of ethnic and racial backgrounds. The largest racial group in the county is White, making up 57.3% of the population. The second largest racial group is Hispanic or Latino, making up 30.2% of the population. Other racial groups include African American (4.7%), Asian (3.7%), and Native American (1.7%).
Maricopa County is home to a variety of religious affiliations, with the largest being Catholic (25.3%), followed by Protestant (19.2%), and Mormon (7.2%). The county is also home to a variety of languages, with the most common being English (83.2%), followed by Spanish (9.7%), and Navajo (2.2%).
Maricopa County is home to a variety of educational institutions, including Arizona State University, the University of Phoenix, and Grand Canyon University. The county is also home to several community colleges, including Phoenix College, Glendale Community College, and Mesa Community College.
Maricopa County is home to a variety of cultural attractions, including the Phoenix Art Museum, the Heard Museum, and the Arizona Science Center. The county is also home to several professional sports teams, including the Arizona Diamondbacks, the Phoenix Suns, and the Arizona Cardinals.
Maricopa County is a vibrant and diverse county, with a variety of attractions, industries, and educational institutions. The county is home to a variety of cultures, religions, and languages, making it a great place to live and work.
Common Questions
What is Per Capita Income in Maricopa County?
Per Capita income in Maricopa County is $41,533.
What is the Median Family Income in Maricopa County?
Median Family Income in Maricopa County is $94,672.
What is the Median Household income in Maricopa County?
Median Household Income in Maricopa County is $80,675.
What is Income or Wage Gap in Maricopa County?
Income or Wage Gap in Maricopa County is 21.1%.
Women in Maricopa County earn 78.9 cents for every dollar earned by a man.
What is Family Income Deficit in Maricopa County?
Family Income Deficit in Maricopa County is $11,849.
Families that are below poverty line in Maricopa County earn $11,849 less on average than the poverty threshold level.
What is Inequality or Gini Index in Maricopa County?
Inequality or Gini Index in Maricopa County is 0.46.
What is the Total Population of Maricopa County?
Total Population of Maricopa County is 4,430,871.
What is the Total Male Population of Maricopa County?
Total Male Population of Maricopa County is 2,208,150.
What is the Total Female Population of Maricopa County?
Total Female Population of Maricopa County is 2,222,721.
What is the Ratio of Males per 100 Females in Maricopa County?
There are 99.34 Males per 100 Females in Maricopa County.
What is the Ratio of Females per 100 Males in Maricopa County?
There are 100.66 Females per 100 Males in Maricopa County.
What is the Median Population Age in Maricopa County?
Median Population Age in Maricopa County is 37.1 Years.
What is the Average Family Size in Maricopa County
Average Family Size in Maricopa County is 3.2 People.
What is the Average Household Size in Maricopa County
Average Household Size in Maricopa County is 2.6 People.
How Large is the Labor Force in Maricopa County?
There are 2,292,514 People in the Labor Forcein in Maricopa County.
What is the Percentage of People in the Labor Force in Maricopa County?
65.0% of People are in the Labor Force in Maricopa County.
What is the Unemployment Rate in Maricopa County?
Unemployment Rate in Maricopa County is 4.8%.