Yuma, AZ Map & Demographics
Yuma Map
Yuma Overview
$30,841
PER CAPITA INCOME
$66,788
AVG FAMILY INCOME
$59,312
AVG HOUSEHOLD INCOME
29.4%
WAGE / INCOME GAP [ % ]
70.6¢/ $1
WAGE / INCOME GAP [ $ ]
$11,513
FAMILY INCOME DEFICIT
0.46
INEQUALITY / GINI INDEX
96,314
TOTAL POPULATION
49,897
MALE POPULATION
46,417
FEMALE POPULATION
107.50
MALES / 100 FEMALES
93.03
FEMALES / 100 MALES
32.0
MEDIAN AGE
3.0
AVG FAMILY SIZE
2.6
AVG HOUSEHOLD SIZE
45,327
LABOR FORCE [ PEOPLE ]
61.0%
PERCENT IN LABOR FORCE
7.7%
UNEMPLOYMENT RATE
Income in Yuma
Income Overview in Yuma
Per Capita Income in Yuma is $30,841, while median incomes of families and households are $66,788 and $59,312 respectively.
| Characteristic | Number | Measure |
| Per Capita Income | 96,314 | $30,841 |
| Median Family Income | 25,723 | $66,788 |
| Mean Family Income | 25,723 | $87,208 |
| Median Household Income | 36,290 | $59,312 |
| Mean Household Income | 36,290 | $80,348 |
| Income Deficit | 25,723 | $11,513 |
| Wage / Income Gap (%) | 96,314 | 29.38% |
| Wage / Income Gap ($) | 96,314 | 70.62¢ per $1 |
| Gini / Inequality Index | 96,314 | 0.46 |
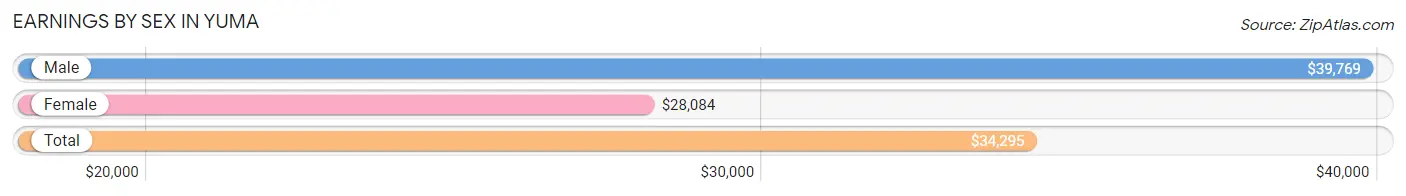
Earnings by Sex in Yuma
Average Earnings in Yuma are $34,295, $39,769 for men and $28,084 for women, a difference of 29.4%.
| Sex | Number | Average Earnings |
| Male | 26,801 (57.2%) | $39,769 |
| Female | 20,048 (42.8%) | $28,084 |
| Total | 46,849 (100.0%) | $34,295 |
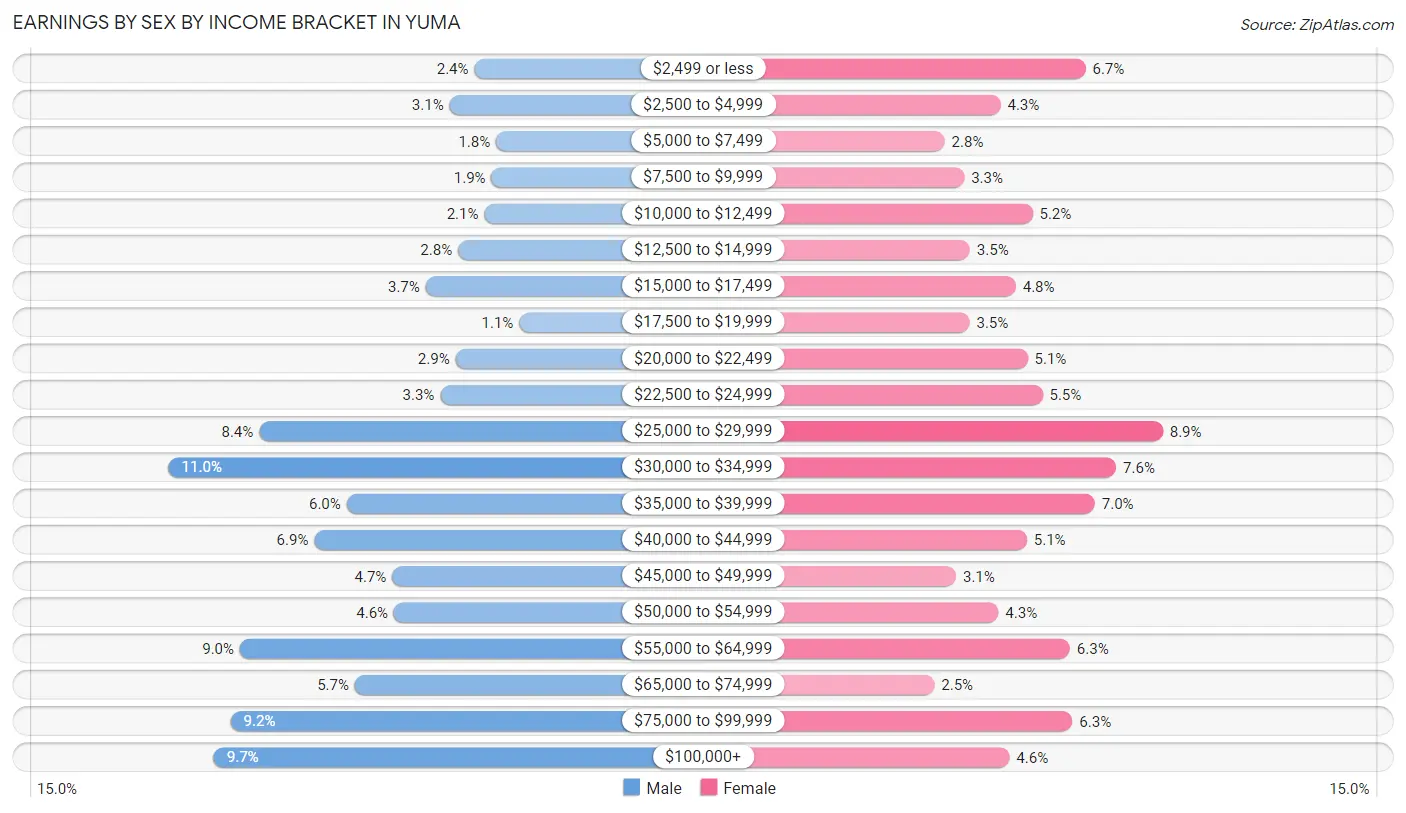
Earnings by Sex by Income Bracket in Yuma
The most common earnings brackets in Yuma are $30,000 to $34,999 for men (2,934 | 11.0%) and $25,000 to $29,999 for women (1,780 | 8.9%).
| Income | Male | Female |
| $2,499 or less | 632 (2.4%) | 1,345 (6.7%) |
| $2,500 to $4,999 | 821 (3.1%) | 867 (4.3%) |
| $5,000 to $7,499 | 470 (1.8%) | 551 (2.8%) |
| $7,500 to $9,999 | 504 (1.9%) | 661 (3.3%) |
| $10,000 to $12,499 | 557 (2.1%) | 1,047 (5.2%) |
| $12,500 to $14,999 | 756 (2.8%) | 694 (3.5%) |
| $15,000 to $17,499 | 999 (3.7%) | 952 (4.8%) |
| $17,500 to $19,999 | 294 (1.1%) | 691 (3.5%) |
| $20,000 to $22,499 | 774 (2.9%) | 1,019 (5.1%) |
| $22,500 to $24,999 | 889 (3.3%) | 1,102 (5.5%) |
| $25,000 to $29,999 | 2,253 (8.4%) | 1,780 (8.9%) |
| $30,000 to $34,999 | 2,934 (11.0%) | 1,518 (7.6%) |
| $35,000 to $39,999 | 1,595 (5.9%) | 1,397 (7.0%) |
| $40,000 to $44,999 | 1,838 (6.9%) | 1,015 (5.1%) |
| $45,000 to $49,999 | 1,251 (4.7%) | 615 (3.1%) |
| $50,000 to $54,999 | 1,239 (4.6%) | 854 (4.3%) |
| $55,000 to $64,999 | 2,399 (8.9%) | 1,258 (6.3%) |
| $65,000 to $74,999 | 1,533 (5.7%) | 493 (2.5%) |
| $75,000 to $99,999 | 2,469 (9.2%) | 1,272 (6.3%) |
| $100,000+ | 2,594 (9.7%) | 917 (4.6%) |
| Total | 26,801 (100.0%) | 20,048 (100.0%) |
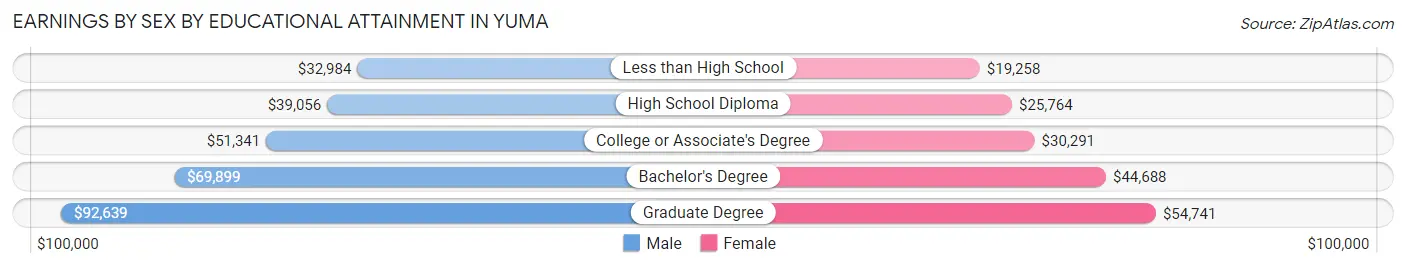
Earnings by Sex by Educational Attainment in Yuma
Average earnings in Yuma are $46,659 for men and $32,291 for women, a difference of 30.8%. Men with an educational attainment of graduate degree enjoy the highest average annual earnings of $92,639, while those with less than high school education earn the least with $32,984. Women with an educational attainment of graduate degree earn the most with the average annual earnings of $54,741, while those with less than high school education have the smallest earnings of $19,258.
| Educational Attainment | Male Income | Female Income |
| Less than High School | $32,984 | $19,258 |
| High School Diploma | $39,056 | $25,764 |
| College or Associate's Degree | $51,341 | $30,291 |
| Bachelor's Degree | $69,899 | $44,688 |
| Graduate Degree | $92,639 | $54,741 |
| Total | $46,659 | $32,291 |
Family Income in Yuma
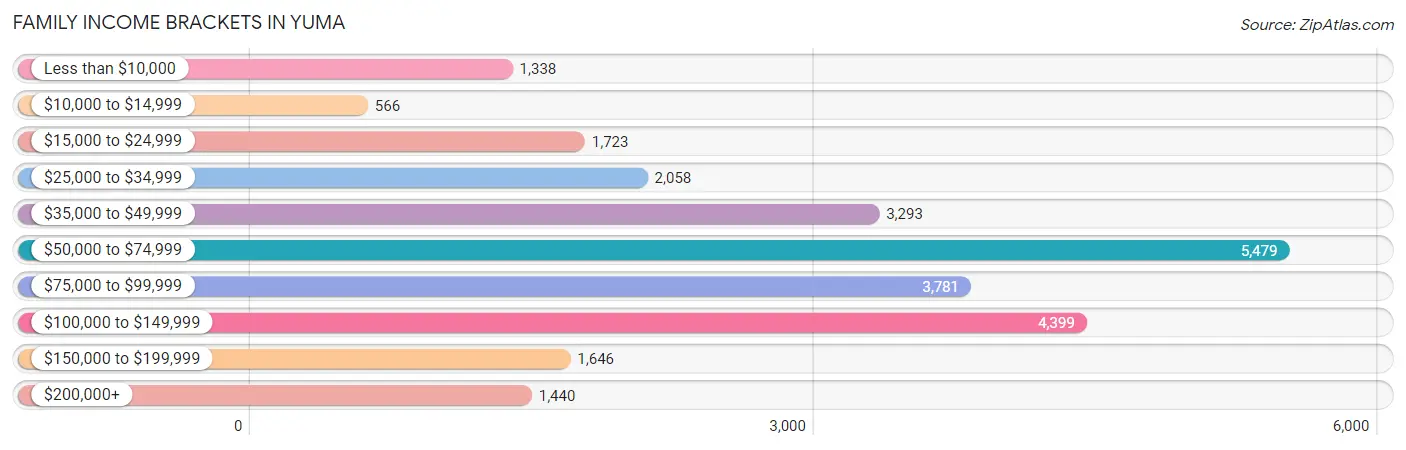
Family Income Brackets in Yuma
According to the Yuma family income data, there are 5,479 families falling into the $50,000 to $74,999 income range, which is the most common income bracket and makes up 21.3% of all families. Conversely, the $10,000 to $14,999 income bracket is the least frequent group with only 566 families (2.2%) belonging to this category.
| Income Bracket | # Families | % Families |
| Less than $10,000 | 1,338 | 5.2% |
| $10,000 to $14,999 | 566 | 2.2% |
| $15,000 to $24,999 | 1,723 | 6.7% |
| $25,000 to $34,999 | 2,058 | 8.0% |
| $35,000 to $49,999 | 3,293 | 12.8% |
| $50,000 to $74,999 | 5,479 | 21.3% |
| $75,000 to $99,999 | 3,781 | 14.7% |
| $100,000 to $149,999 | 4,399 | 17.1% |
| $150,000 to $199,999 | 1,646 | 6.4% |
| $200,000+ | 1,440 | 5.6% |
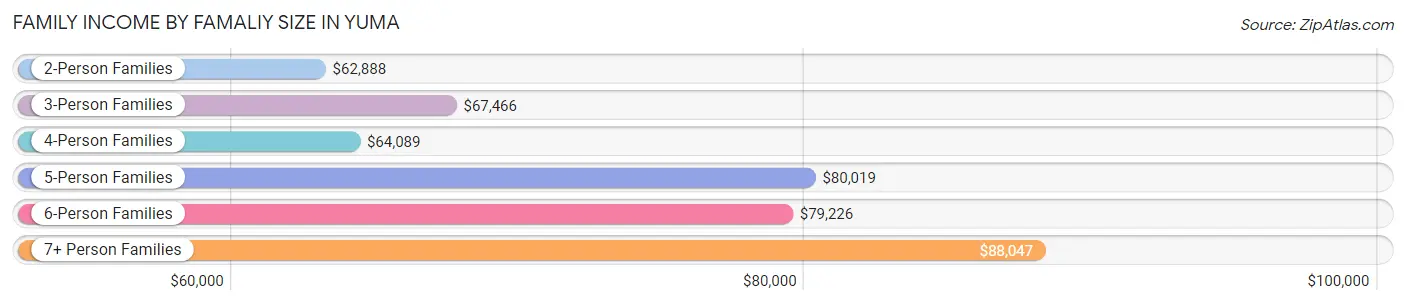
Family Income by Famaliy Size in Yuma
7+ person families (498 | 1.9%) account for the highest median family income in Yuma with $88,047 per family, while 2-person families (11,123 | 43.2%) have the highest median income of $31,444 per family member.
| Income Bracket | # Families | Median Income |
| 2-Person Families | 11,123 (43.2%) | $62,888 |
| 3-Person Families | 5,707 (22.2%) | $67,466 |
| 4-Person Families | 4,662 (18.1%) | $64,089 |
| 5-Person Families | 2,963 (11.5%) | $80,019 |
| 6-Person Families | 770 (3.0%) | $79,226 |
| 7+ Person Families | 498 (1.9%) | $88,047 |
| Total | 25,723 (100.0%) | $66,788 |
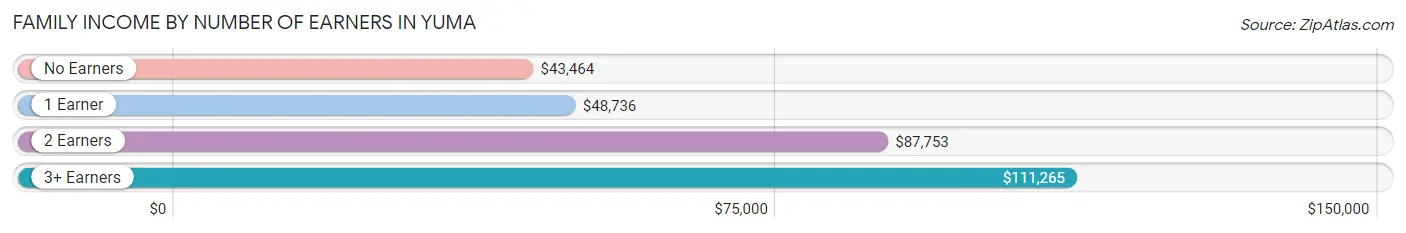
Family Income by Number of Earners in Yuma
The median family income in Yuma is $66,788, with families comprising 3+ earners (2,469) having the highest median family income of $111,265, while families with no earners (4,597) have the lowest median family income of $43,464, accounting for 9.6% and 17.9% of families, respectively.
| Number of Earners | # Families | Median Income |
| No Earners | 4,597 (17.9%) | $43,464 |
| 1 Earner | 9,184 (35.7%) | $48,736 |
| 2 Earners | 9,473 (36.8%) | $87,753 |
| 3+ Earners | 2,469 (9.6%) | $111,265 |
| Total | 25,723 (100.0%) | $66,788 |
Household Income in Yuma
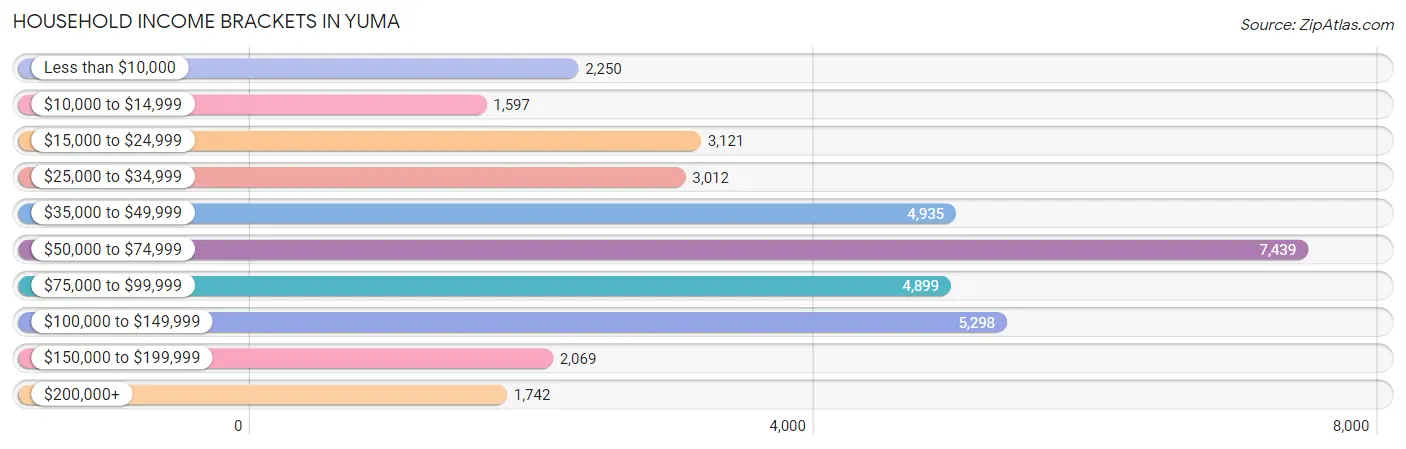
Household Income Brackets in Yuma
With 7,439 households falling in the category, the $50,000 to $74,999 income range is the most frequent in Yuma, accounting for 20.5% of all households. In contrast, only 1,597 households (4.4%) fall into the $10,000 to $14,999 income bracket, making it the least populous group.
| Income Bracket | # Households | % Households |
| Less than $10,000 | 2,250 | 6.2% |
| $10,000 to $14,999 | 1,597 | 4.4% |
| $15,000 to $24,999 | 3,121 | 8.6% |
| $25,000 to $34,999 | 3,012 | 8.3% |
| $35,000 to $49,999 | 4,935 | 13.6% |
| $50,000 to $74,999 | 7,439 | 20.5% |
| $75,000 to $99,999 | 4,899 | 13.5% |
| $100,000 to $149,999 | 5,298 | 14.6% |
| $150,000 to $199,999 | 2,069 | 5.7% |
| $200,000+ | 1,742 | 4.8% |
Household Income by Householder Age in Yuma
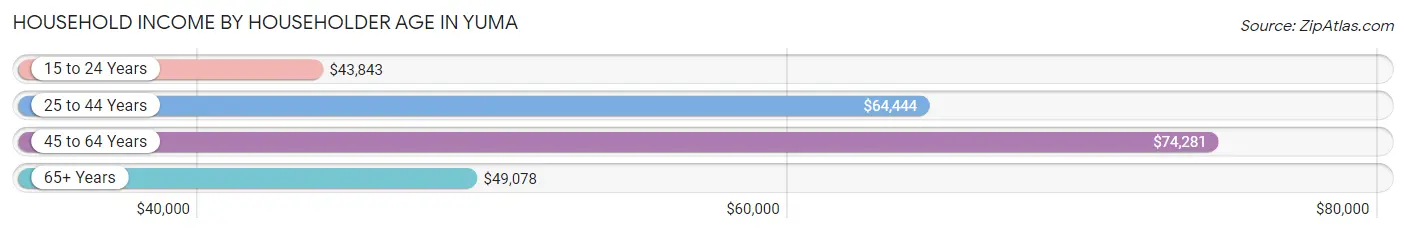
The median household income in Yuma is $59,312, with the highest median household income of $74,281 found in the 45 to 64 years age bracket for the primary householder. A total of 9,757 households (26.9%) fall into this category. Meanwhile, the 15 to 24 years age bracket for the primary householder has the lowest median household income of $43,843, with 2,931 households (8.1%) in this group.
| Income Bracket | # Households | Median Income |
| 15 to 24 Years | 2,931 (8.1%) | $43,843 |
| 25 to 44 Years | 13,801 (38.0%) | $64,444 |
| 45 to 64 Years | 9,757 (26.9%) | $74,281 |
| 65+ Years | 9,801 (27.0%) | $49,078 |
| Total | 36,290 (100.0%) | $59,312 |
Poverty in Yuma
Income Below Poverty by Sex and Age in Yuma
With 14.2% poverty level for males and 18.0% for females among the residents of Yuma, 15 year old males and under 5 year old females are the most vulnerable to poverty, with 252 males (35.2%) and 1,088 females (30.3%) in their respective age groups living below the poverty level.
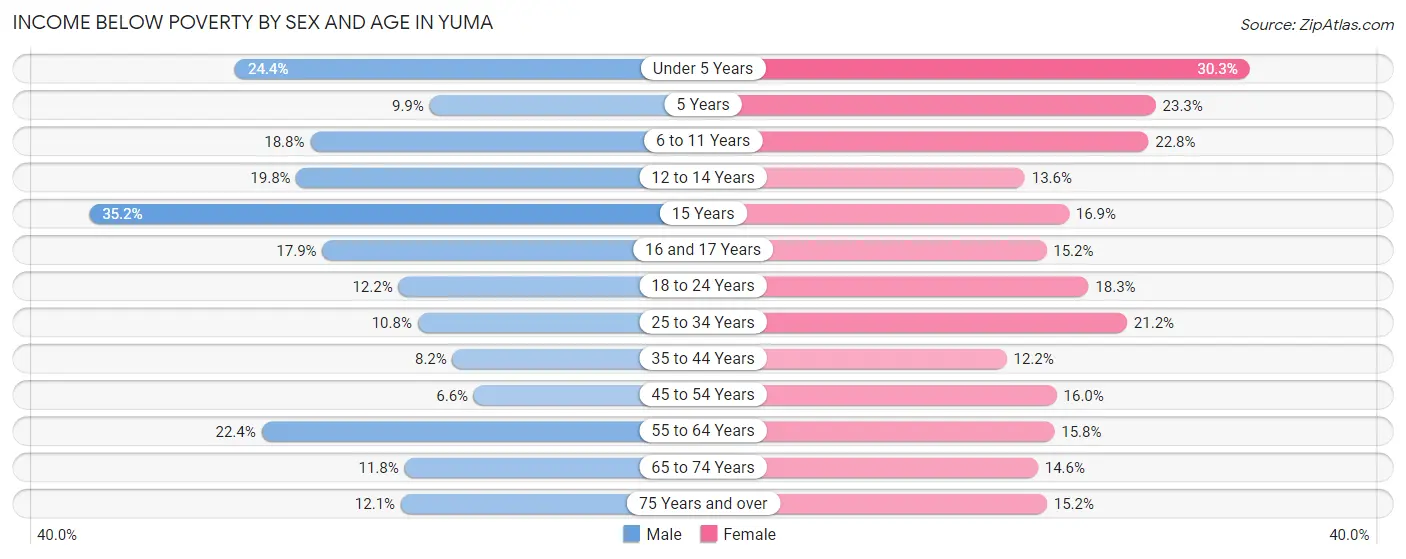
| Age Bracket | Male | Female |
| Under 5 Years | 829 (24.4%) | 1,088 (30.3%) |
| 5 Years | 67 (9.9%) | 161 (23.3%) |
| 6 to 11 Years | 804 (18.8%) | 874 (22.8%) |
| 12 to 14 Years | 445 (19.8%) | 230 (13.6%) |
| 15 Years | 252 (35.2%) | 73 (16.9%) |
| 16 and 17 Years | 277 (17.9%) | 192 (15.2%) |
| 18 to 24 Years | 704 (12.2%) | 836 (18.3%) |
| 25 to 34 Years | 841 (10.8%) | 1,508 (21.2%) |
| 35 to 44 Years | 483 (8.2%) | 697 (12.2%) |
| 45 to 54 Years | 262 (6.6%) | 702 (16.0%) |
| 55 to 64 Years | 928 (22.4%) | 701 (15.8%) |
| 65 to 74 Years | 432 (11.8%) | 582 (14.5%) |
| 75 Years and over | 448 (12.1%) | 585 (15.2%) |
| Total | 6,772 (14.2%) | 8,229 (18.0%) |
Income Above Poverty by Sex and Age in Yuma
According to the poverty statistics in Yuma, males aged 45 to 54 years and females aged 35 to 44 years are the age groups that are most secure financially, with 93.4% of males and 87.8% of females in these age groups living above the poverty line.
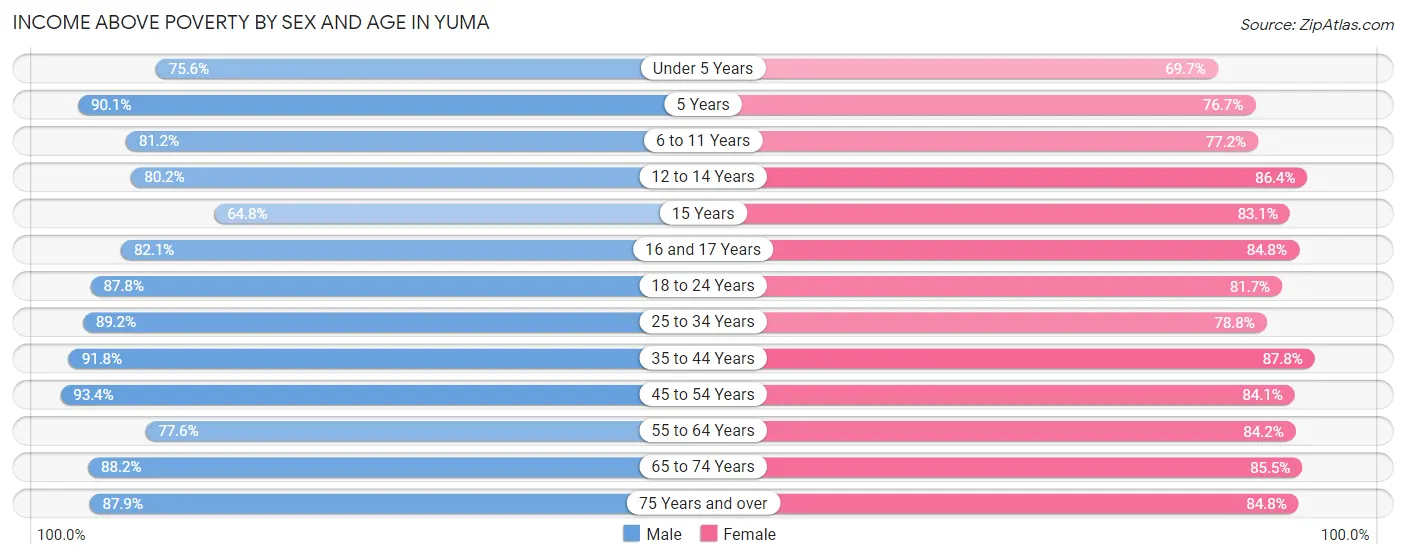
| Age Bracket | Male | Female |
| Under 5 Years | 2,573 (75.6%) | 2,506 (69.7%) |
| 5 Years | 608 (90.1%) | 530 (76.7%) |
| 6 to 11 Years | 3,474 (81.2%) | 2,966 (77.2%) |
| 12 to 14 Years | 1,800 (80.2%) | 1,463 (86.4%) |
| 15 Years | 464 (64.8%) | 360 (83.1%) |
| 16 and 17 Years | 1,271 (82.1%) | 1,073 (84.8%) |
| 18 to 24 Years | 5,048 (87.8%) | 3,729 (81.7%) |
| 25 to 34 Years | 6,938 (89.2%) | 5,616 (78.8%) |
| 35 to 44 Years | 5,394 (91.8%) | 5,003 (87.8%) |
| 45 to 54 Years | 3,685 (93.4%) | 3,698 (84.1%) |
| 55 to 64 Years | 3,213 (77.6%) | 3,742 (84.2%) |
| 65 to 74 Years | 3,233 (88.2%) | 3,418 (85.5%) |
| 75 Years and over | 3,266 (87.9%) | 3,259 (84.8%) |
| Total | 40,967 (85.8%) | 37,363 (82.0%) |
Income Below Poverty Among Married-Couple Families in Yuma
The poverty statistics for married-couple families in Yuma show that 7.5% or 1,328 of the total 17,709 families live below the poverty line. Families with 3 or 4 children have the highest poverty rate of 16.6%, comprising of 323 families. On the other hand, families with 1 or 2 children have the lowest poverty rate of 3.3%, which includes 207 families.
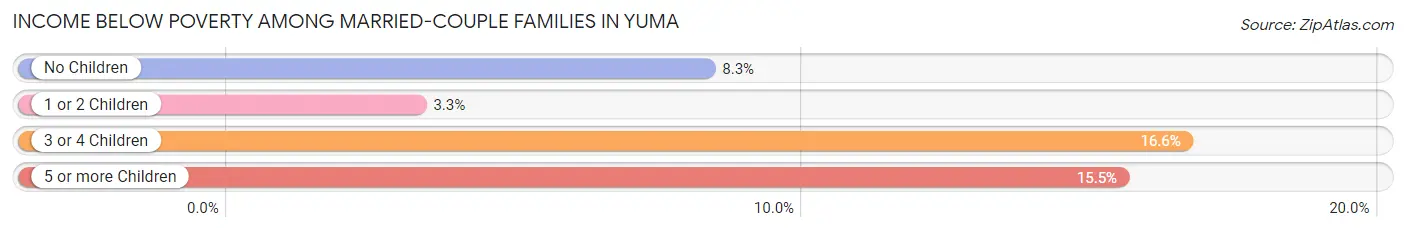
| Children | Above Poverty | Below Poverty |
| No Children | 8,490 (91.7%) | 769 (8.3%) |
| 1 or 2 Children | 6,112 (96.7%) | 207 (3.3%) |
| 3 or 4 Children | 1,621 (83.4%) | 323 (16.6%) |
| 5 or more Children | 158 (84.5%) | 29 (15.5%) |
| Total | 16,381 (92.5%) | 1,328 (7.5%) |
Income Below Poverty Among Single-Parent Households in Yuma
According to the poverty data in Yuma, 19.4% or 490 single-father households and 29.7% or 1,630 single-mother households are living below the poverty line. Among single-father households, those with 1 or 2 children have the highest poverty rate, with 328 households (23.8%) experiencing poverty. Likewise, among single-mother households, those with 5 or more children have the highest poverty rate, with 11 households (100.0%) falling below the poverty line.
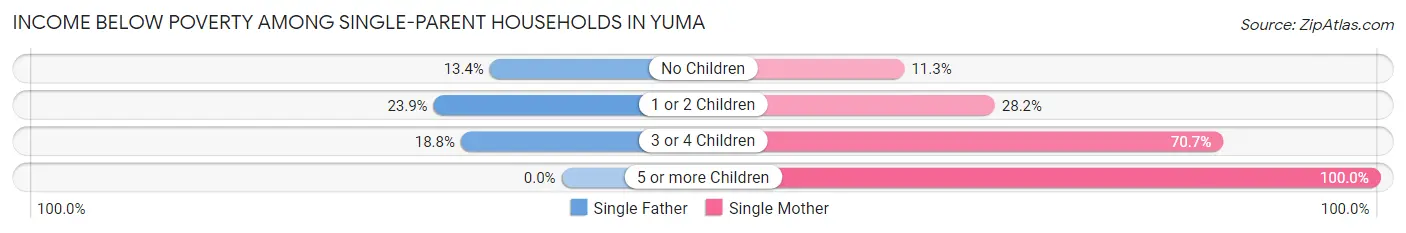
| Children | Single Father | Single Mother |
| No Children | 132 (13.4%) | 181 (11.3%) |
| 1 or 2 Children | 328 (23.8%) | 865 (28.2%) |
| 3 or 4 Children | 30 (18.8%) | 573 (70.7%) |
| 5 or more Children | 0 (0.0%) | 11 (100.0%) |
| Total | 490 (19.4%) | 1,630 (29.7%) |
Income Below Poverty Among Married-Couple vs Single-Parent Households in Yuma
The poverty data for Yuma shows that 1,328 of the married-couple family households (7.5%) and 2,120 of the single-parent households (26.5%) are living below the poverty level. Within the married-couple family households, those with 3 or 4 children have the highest poverty rate, with 323 households (16.6%) falling below the poverty line. Among the single-parent households, those with 5 or more children have the highest poverty rate, with 11 household (100.0%) living below poverty.
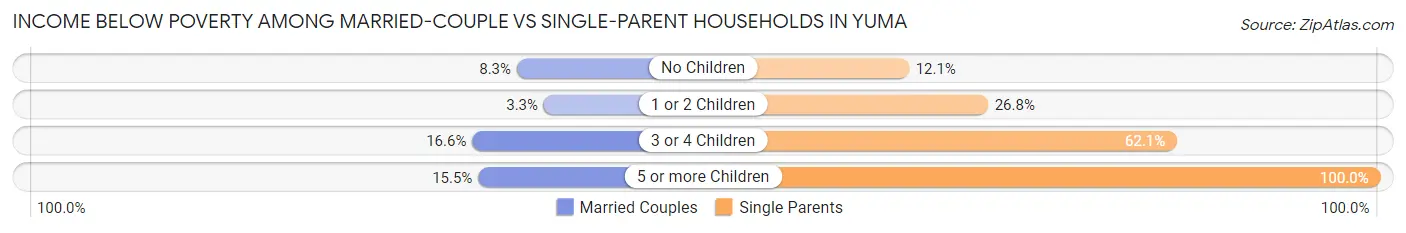
| Children | Married-Couple Families | Single-Parent Households |
| No Children | 769 (8.3%) | 313 (12.1%) |
| 1 or 2 Children | 207 (3.3%) | 1,193 (26.8%) |
| 3 or 4 Children | 323 (16.6%) | 603 (62.1%) |
| 5 or more Children | 29 (15.5%) | 11 (100.0%) |
| Total | 1,328 (7.5%) | 2,120 (26.5%) |
Race in Yuma
The most populous races in Yuma are Hispanic or Latino (59,825 | 62.1%), White / Caucasian (55,770 | 57.9%), and Two or more Races (21,137 | 22.0%).
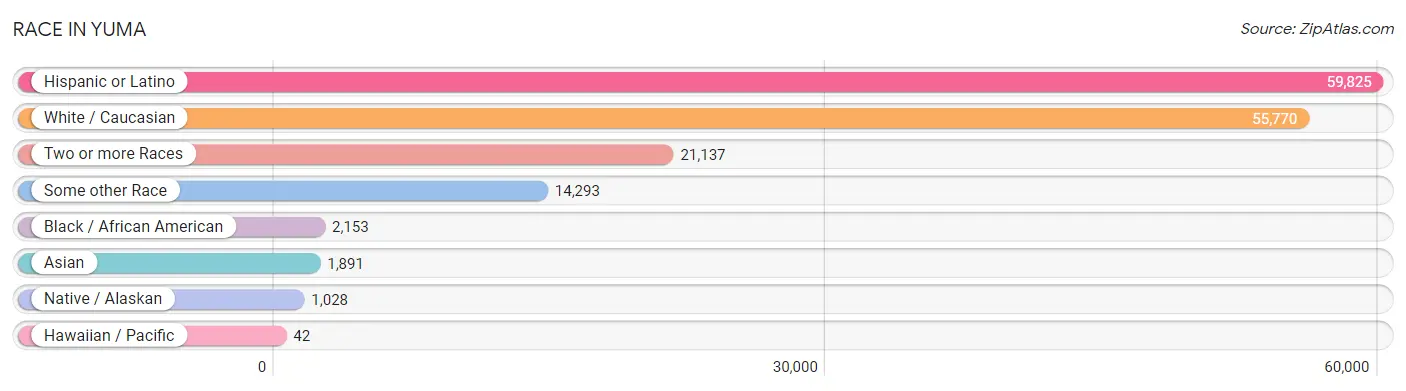
| Race | # Population | % Population |
| Asian | 1,891 | 2.0% |
| Black / African American | 2,153 | 2.2% |
| Hawaiian / Pacific | 42 | 0.0% |
| Hispanic or Latino | 59,825 | 62.1% |
| Native / Alaskan | 1,028 | 1.1% |
| White / Caucasian | 55,770 | 57.9% |
| Two or more Races | 21,137 | 22.0% |
| Some other Race | 14,293 | 14.8% |
| Total | 96,314 | 100.0% |
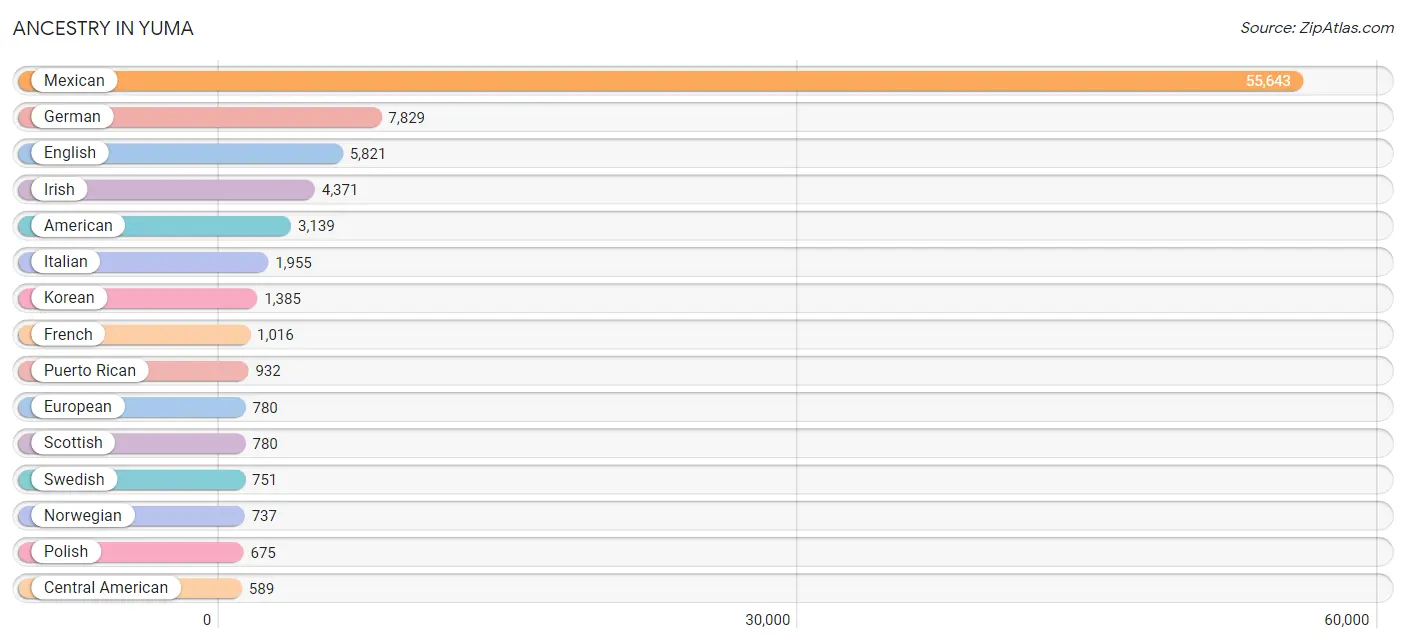
Ancestry in Yuma
The most populous ancestries reported in Yuma are Mexican (55,643 | 57.8%), German (7,829 | 8.1%), English (5,821 | 6.0%), Irish (4,371 | 4.5%), and American (3,139 | 3.3%), together accounting for 79.7% of all Yuma residents.
| Ancestry | # Population | % Population |
| African | 395 | 0.4% |
| Alaskan Athabascan | 33 | 0.0% |
| American | 3,139 | 3.3% |
| Apache | 71 | 0.1% |
| Arab | 157 | 0.2% |
| Australian | 14 | 0.0% |
| Austrian | 24 | 0.0% |
| Bangladeshi | 22 | 0.0% |
| Basque | 24 | 0.0% |
| Belgian | 53 | 0.1% |
| Belizean | 34 | 0.0% |
| Bhutanese | 385 | 0.4% |
| Blackfeet | 165 | 0.2% |
| Brazilian | 43 | 0.0% |
| British | 231 | 0.2% |
| British West Indian | 26 | 0.0% |
| Bulgarian | 16 | 0.0% |
| Burmese | 234 | 0.2% |
| Canadian | 289 | 0.3% |
| Celtic | 12 | 0.0% |
| Central American | 589 | 0.6% |
| Cherokee | 178 | 0.2% |
| Chinese | 20 | 0.0% |
| Chippewa | 24 | 0.0% |
| Choctaw | 68 | 0.1% |
| Colombian | 121 | 0.1% |
| Comanche | 51 | 0.1% |
| Costa Rican | 109 | 0.1% |
| Creek | 19 | 0.0% |
| Croatian | 80 | 0.1% |
| Cuban | 144 | 0.2% |
| Czech | 156 | 0.2% |
| Czechoslovakian | 8 | 0.0% |
| Danish | 276 | 0.3% |
| Dominican | 227 | 0.2% |
| Dutch | 516 | 0.5% |
| Eastern European | 24 | 0.0% |
| Ecuadorian | 87 | 0.1% |
| English | 5,821 | 6.0% |
| European | 780 | 0.8% |
| Finnish | 49 | 0.1% |
| French | 1,016 | 1.1% |
| French Canadian | 171 | 0.2% |
| German | 7,829 | 8.1% |
| Ghanaian | 10 | 0.0% |
| Greek | 69 | 0.1% |
| Guamanian / Chamorro | 28 | 0.0% |
| Guatemalan | 122 | 0.1% |
| Honduran | 16 | 0.0% |
| Hungarian | 187 | 0.2% |
| Icelander | 6 | 0.0% |
| Indian (Asian) | 381 | 0.4% |
| Iranian | 26 | 0.0% |
| Iraqi | 16 | 0.0% |
| Irish | 4,371 | 4.5% |
| Iroquois | 6 | 0.0% |
| Italian | 1,955 | 2.0% |
| Jamaican | 93 | 0.1% |
| Japanese | 66 | 0.1% |
| Jordanian | 33 | 0.0% |
| Korean | 1,385 | 1.4% |
| Laotian | 8 | 0.0% |
| Latvian | 31 | 0.0% |
| Lebanese | 83 | 0.1% |
| Lithuanian | 22 | 0.0% |
| Luxembourger | 8 | 0.0% |
| Mexican | 55,643 | 57.8% |
| Mexican American Indian | 304 | 0.3% |
| Mongolian | 12 | 0.0% |
| Native Hawaiian | 144 | 0.2% |
| Navajo | 274 | 0.3% |
| Nicaraguan | 7 | 0.0% |
| Nigerian | 47 | 0.1% |
| Northern European | 26 | 0.0% |
| Norwegian | 737 | 0.8% |
| Pakistani | 30 | 0.0% |
| Panamanian | 46 | 0.1% |
| Peruvian | 85 | 0.1% |
| Pima | 36 | 0.0% |
| Polish | 675 | 0.7% |
| Portuguese | 216 | 0.2% |
| Potawatomi | 10 | 0.0% |
| Puerto Rican | 932 | 1.0% |
| Romanian | 80 | 0.1% |
| Russian | 127 | 0.1% |
| Salvadoran | 289 | 0.3% |
| Samoan | 21 | 0.0% |
| Scandinavian | 217 | 0.2% |
| Scotch-Irish | 539 | 0.6% |
| Scottish | 780 | 0.8% |
| Sioux | 9 | 0.0% |
| Slavic | 25 | 0.0% |
| Slovene | 12 | 0.0% |
| South African | 10 | 0.0% |
| South American | 394 | 0.4% |
| South American Indian | 17 | 0.0% |
| Spaniard | 303 | 0.3% |
| Spanish | 363 | 0.4% |
| Spanish American | 11 | 0.0% |
| Spanish American Indian | 21 | 0.0% |
| Sri Lankan | 297 | 0.3% |
| Subsaharan African | 514 | 0.5% |
| Swedish | 751 | 0.8% |
| Swiss | 142 | 0.2% |
| Thai | 235 | 0.2% |
| Tohono O'Odham | 71 | 0.1% |
| Trinidadian and Tobagonian | 21 | 0.0% |
| U.S. Virgin Islander | 9 | 0.0% |
| Ukrainian | 130 | 0.1% |
| Uruguayan | 33 | 0.0% |
| Venezuelan | 50 | 0.1% |
| Welsh | 174 | 0.2% |
| West Indian | 50 | 0.1% |
| Yaqui | 280 | 0.3% |
| Yugoslavian | 20 | 0.0% |
| Yuman | 425 | 0.4% | View All 116 Rows |
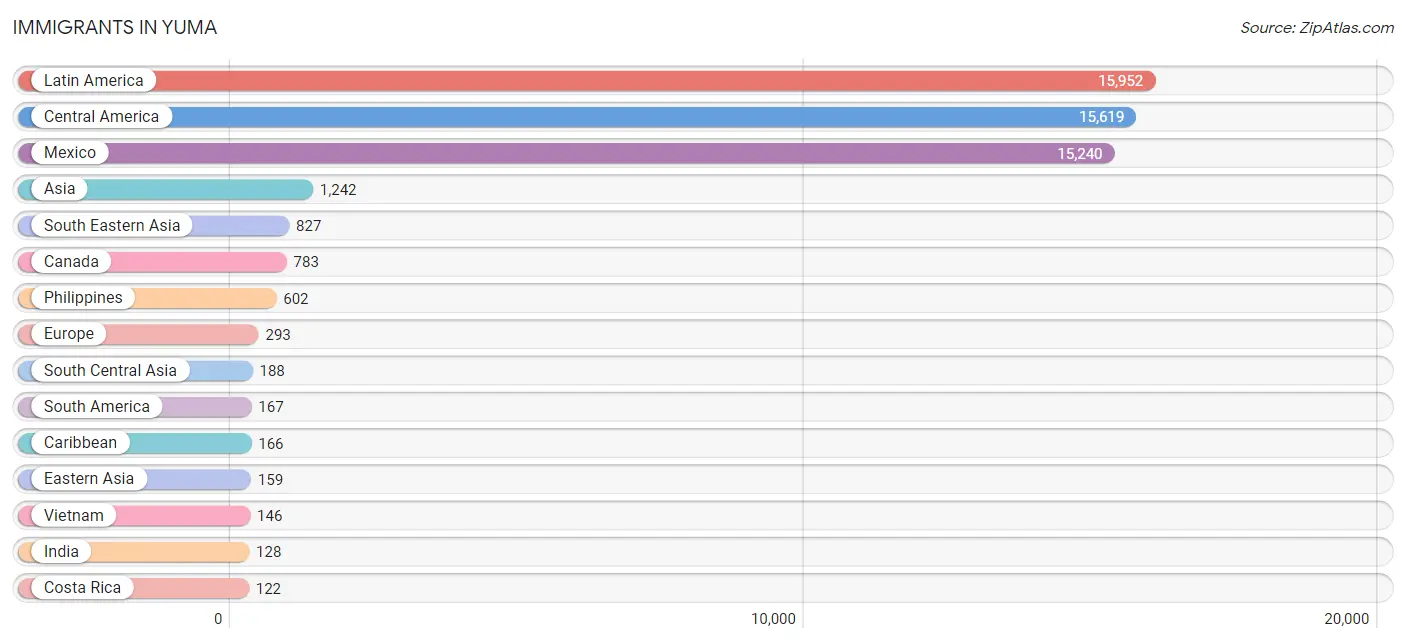
Immigrants in Yuma
The most numerous immigrant groups reported in Yuma came from Latin America (15,952 | 16.6%), Central America (15,619 | 16.2%), Mexico (15,240 | 15.8%), Asia (1,242 | 1.3%), and South Eastern Asia (827 | 0.9%), together accounting for 50.8% of all Yuma residents.
| Immigration Origin | # Population | % Population |
| Africa | 111 | 0.1% |
| Asia | 1,242 | 1.3% |
| Australia | 8 | 0.0% |
| Bahamas | 35 | 0.0% |
| Bangladesh | 30 | 0.0% |
| Belize | 9 | 0.0% |
| Bosnia and Herzegovina | 5 | 0.0% |
| Brazil | 7 | 0.0% |
| Bulgaria | 16 | 0.0% |
| Cambodia | 38 | 0.0% |
| Canada | 783 | 0.8% |
| Caribbean | 166 | 0.2% |
| Central America | 15,619 | 16.2% |
| China | 3 | 0.0% |
| Colombia | 52 | 0.1% |
| Costa Rica | 122 | 0.1% |
| Cuba | 54 | 0.1% |
| Czechoslovakia | 9 | 0.0% |
| Eastern Asia | 159 | 0.2% |
| Eastern Europe | 50 | 0.1% |
| Ecuador | 62 | 0.1% |
| El Salvador | 111 | 0.1% |
| England | 56 | 0.1% |
| Europe | 293 | 0.3% |
| Germany | 90 | 0.1% |
| Ghana | 10 | 0.0% |
| Guatemala | 68 | 0.1% |
| Haiti | 6 | 0.0% |
| Honduras | 38 | 0.0% |
| India | 128 | 0.1% |
| Italy | 23 | 0.0% |
| Jamaica | 71 | 0.1% |
| Japan | 53 | 0.1% |
| Jordan | 33 | 0.0% |
| Korea | 103 | 0.1% |
| Latin America | 15,952 | 16.6% |
| Lebanon | 10 | 0.0% |
| Malaysia | 12 | 0.0% |
| Mexico | 15,240 | 15.8% |
| Middle Africa | 11 | 0.0% |
| Netherlands | 4 | 0.0% |
| Nigeria | 40 | 0.0% |
| Northern Europe | 107 | 0.1% |
| Oceania | 16 | 0.0% |
| Pakistan | 4 | 0.0% |
| Panama | 31 | 0.0% |
| Philippines | 602 | 0.6% |
| Portugal | 6 | 0.0% |
| South Africa | 48 | 0.1% |
| South America | 167 | 0.2% |
| South Central Asia | 188 | 0.2% |
| South Eastern Asia | 827 | 0.9% |
| Southern Europe | 42 | 0.0% |
| Spain | 13 | 0.0% |
| Sri Lanka | 26 | 0.0% |
| Sweden | 22 | 0.0% |
| Thailand | 19 | 0.0% |
| Ukraine | 20 | 0.0% |
| Uruguay | 33 | 0.0% |
| Venezuela | 13 | 0.0% |
| Vietnam | 146 | 0.2% |
| Western Africa | 50 | 0.1% |
| Western Asia | 68 | 0.1% |
| Western Europe | 94 | 0.1% |
| Zaire | 11 | 0.0% | View All 65 Rows |
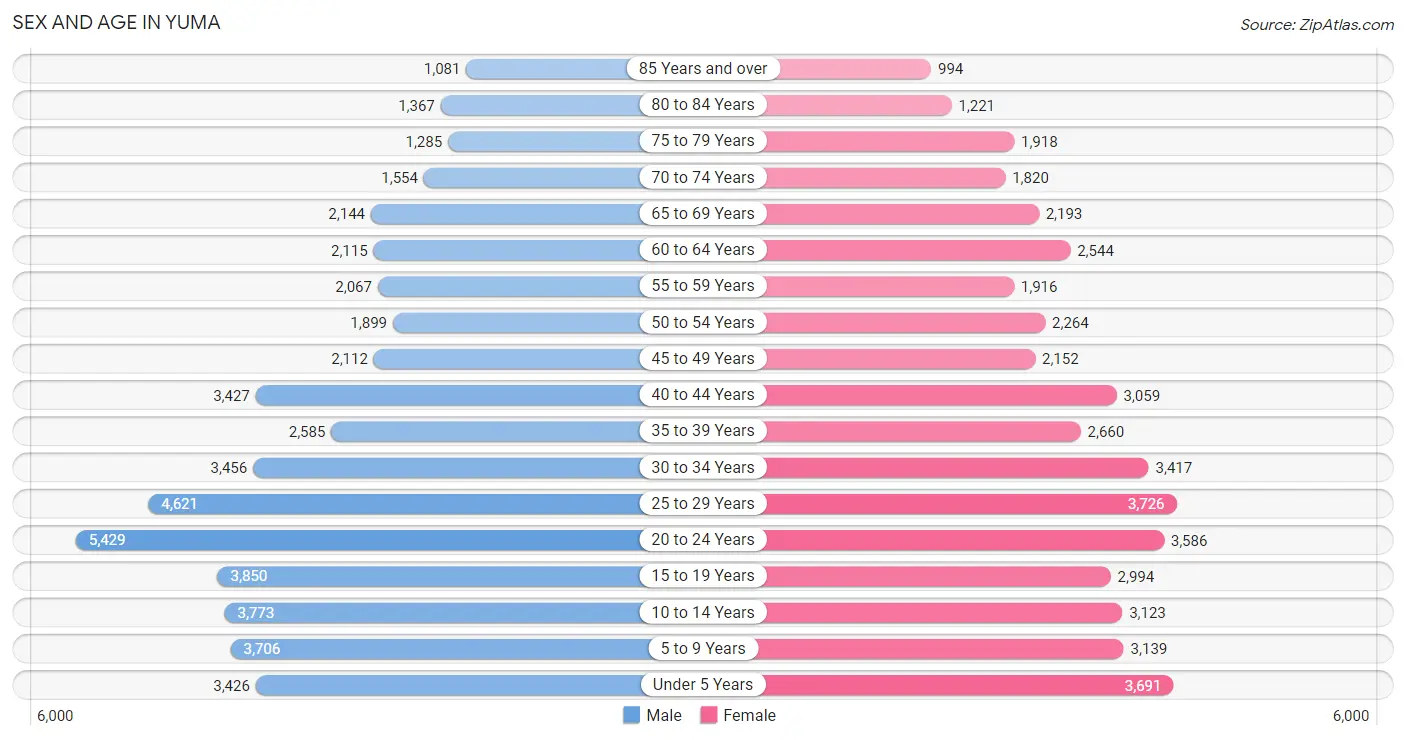
Sex and Age in Yuma
Sex and Age in Yuma
The most populous age groups in Yuma are 20 to 24 Years (5,429 | 10.9%) for men and 25 to 29 Years (3,726 | 8.0%) for women.
| Age Bracket | Male | Female |
| Under 5 Years | 3,426 (6.9%) | 3,691 (8.0%) |
| 5 to 9 Years | 3,706 (7.4%) | 3,139 (6.8%) |
| 10 to 14 Years | 3,773 (7.6%) | 3,123 (6.7%) |
| 15 to 19 Years | 3,850 (7.7%) | 2,994 (6.5%) |
| 20 to 24 Years | 5,429 (10.9%) | 3,586 (7.7%) |
| 25 to 29 Years | 4,621 (9.3%) | 3,726 (8.0%) |
| 30 to 34 Years | 3,456 (6.9%) | 3,417 (7.4%) |
| 35 to 39 Years | 2,585 (5.2%) | 2,660 (5.7%) |
| 40 to 44 Years | 3,427 (6.9%) | 3,059 (6.6%) |
| 45 to 49 Years | 2,112 (4.2%) | 2,152 (4.6%) |
| 50 to 54 Years | 1,899 (3.8%) | 2,264 (4.9%) |
| 55 to 59 Years | 2,067 (4.1%) | 1,916 (4.1%) |
| 60 to 64 Years | 2,115 (4.2%) | 2,544 (5.5%) |
| 65 to 69 Years | 2,144 (4.3%) | 2,193 (4.7%) |
| 70 to 74 Years | 1,554 (3.1%) | 1,820 (3.9%) |
| 75 to 79 Years | 1,285 (2.6%) | 1,918 (4.1%) |
| 80 to 84 Years | 1,367 (2.7%) | 1,221 (2.6%) |
| 85 Years and over | 1,081 (2.2%) | 994 (2.1%) |
| Total | 49,897 (100.0%) | 46,417 (100.0%) |
Families and Households in Yuma
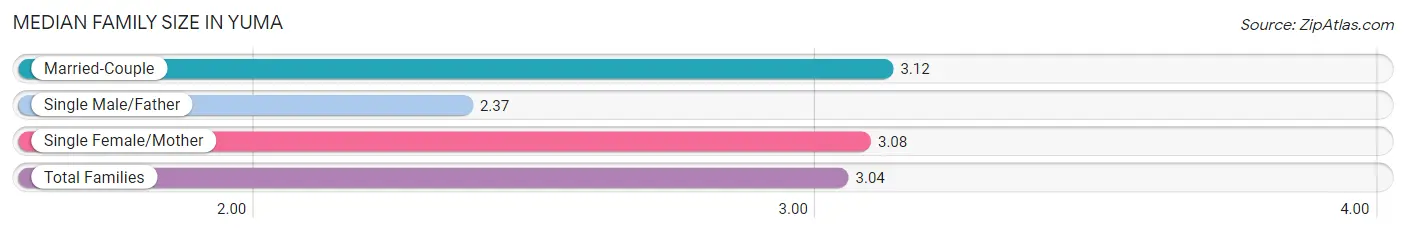
Median Family Size in Yuma
The median family size in Yuma is 3.04 persons per family, with married-couple families (17,709 | 68.9%) accounting for the largest median family size of 3.12 persons per family. On the other hand, single male/father families (2,522 | 9.8%) represent the smallest median family size with 2.37 persons per family.
| Family Type | # Families | Family Size |
| Married-Couple | 17,709 (68.9%) | 3.12 |
| Single Male/Father | 2,522 (9.8%) | 2.37 |
| Single Female/Mother | 5,492 (21.3%) | 3.08 |
| Total Families | 25,723 (100.0%) | 3.04 |
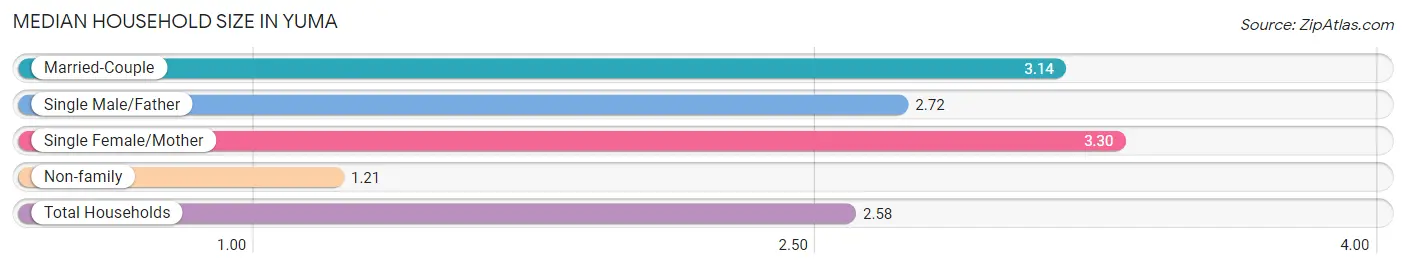
Median Household Size in Yuma
The median household size in Yuma is 2.58 persons per household, with single female/mother households (5,492 | 15.1%) accounting for the largest median household size of 3.3 persons per household. non-family households (10,567 | 29.1%) represent the smallest median household size with 1.21 persons per household.
| Household Type | # Households | Household Size |
| Married-Couple | 17,709 (48.8%) | 3.14 |
| Single Male/Father | 2,522 (7.0%) | 2.72 |
| Single Female/Mother | 5,492 (15.1%) | 3.30 |
| Non-family | 10,567 (29.1%) | 1.21 |
| Total Households | 36,290 (100.0%) | 2.58 |
Household Size by Marriage Status in Yuma
Out of a total of 36,290 households in Yuma, 25,723 (70.9%) are family households, while 10,567 (29.1%) are nonfamily households. The most numerous type of family households are 2-person households, comprising 10,297, and the most common type of nonfamily households are 1-person households, comprising 8,166.
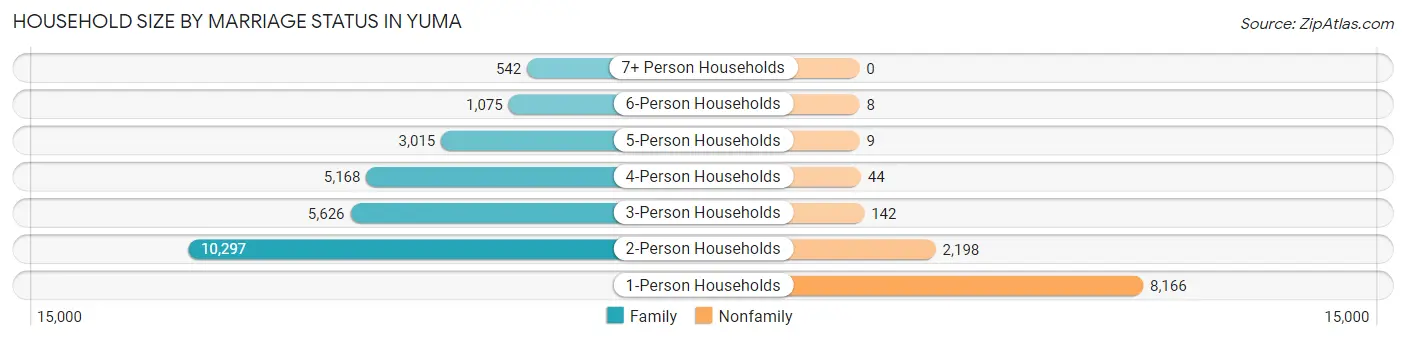
| Household Size | Family Households | Nonfamily Households |
| 1-Person Households | - | 8,166 (22.5%) |
| 2-Person Households | 10,297 (28.4%) | 2,198 (6.1%) |
| 3-Person Households | 5,626 (15.5%) | 142 (0.4%) |
| 4-Person Households | 5,168 (14.2%) | 44 (0.1%) |
| 5-Person Households | 3,015 (8.3%) | 9 (0.0%) |
| 6-Person Households | 1,075 (3.0%) | 8 (0.0%) |
| 7+ Person Households | 542 (1.5%) | 0 (0.0%) |
| Total | 25,723 (70.9%) | 10,567 (29.1%) |
Female Fertility in Yuma
Fertility by Age in Yuma
Average fertility rate in Yuma is 81.0 births per 1,000 women. Women in the age bracket of 20 to 34 years have the highest fertility rate with 138.0 births per 1,000 women. Women in the age bracket of 20 to 34 years acount for 83.2% of all women with births.
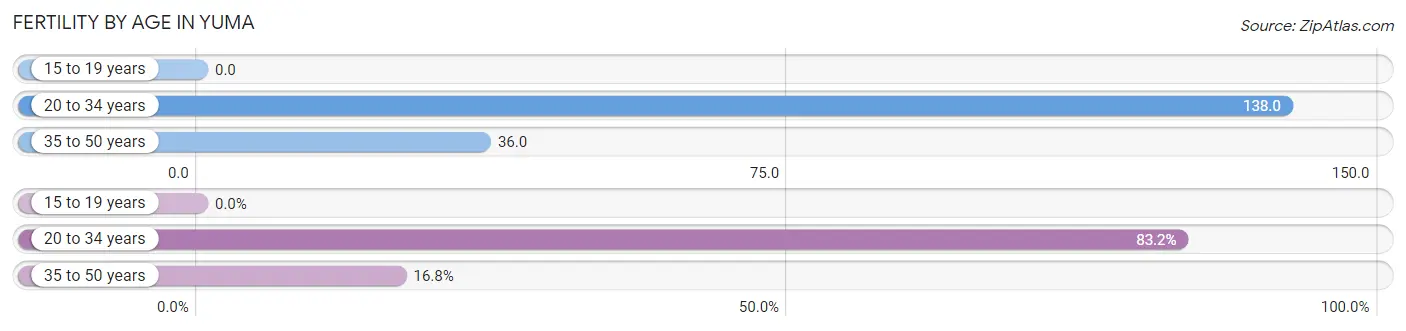
| Age Bracket | Women with Births | Births / 1,000 Women |
| 15 to 19 years | 0 (0.0%) | 0.0 |
| 20 to 34 years | 1,477 (83.2%) | 138.0 |
| 35 to 50 years | 299 (16.8%) | 36.0 |
| Total | 1,776 (100.0%) | 81.0 |
Fertility by Age by Marriage Status in Yuma
66.6% of women with births (1,776) in Yuma are married. The highest percentage of unmarried women with births falls into 20 to 34 years age bracket with 34.6% of them unmarried at the time of birth, while the lowest percentage of unmarried women with births belong to 35 to 50 years age bracket with 27.4% of them unmarried.
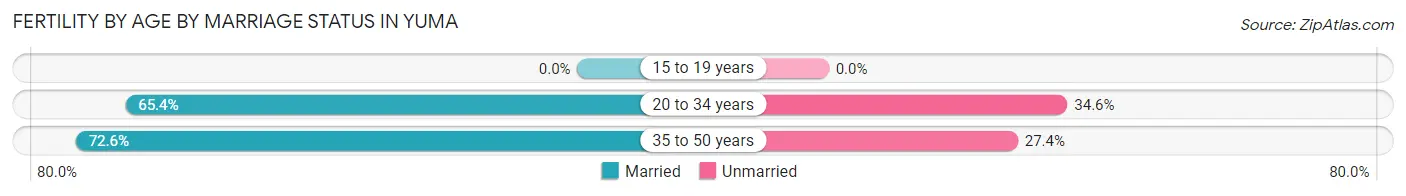
| Age Bracket | Married | Unmarried |
| 15 to 19 years | 0 (0.0%) | 0 (0.0%) |
| 20 to 34 years | 966 (65.4%) | 511 (34.6%) |
| 35 to 50 years | 217 (72.6%) | 82 (27.4%) |
| Total | 1,183 (66.6%) | 593 (33.4%) |
Fertility by Education in Yuma
Average fertility rate in Yuma is 81.0 births per 1,000 women. Women with the education attainment of high school diploma have the highest fertility rate of 135.0 births per 1,000 women, while women with the education attainment of less than high school have the lowest fertility at 30.0 births per 1,000 women. Women with the education attainment of high school diploma represent 44.4% of all women with births.
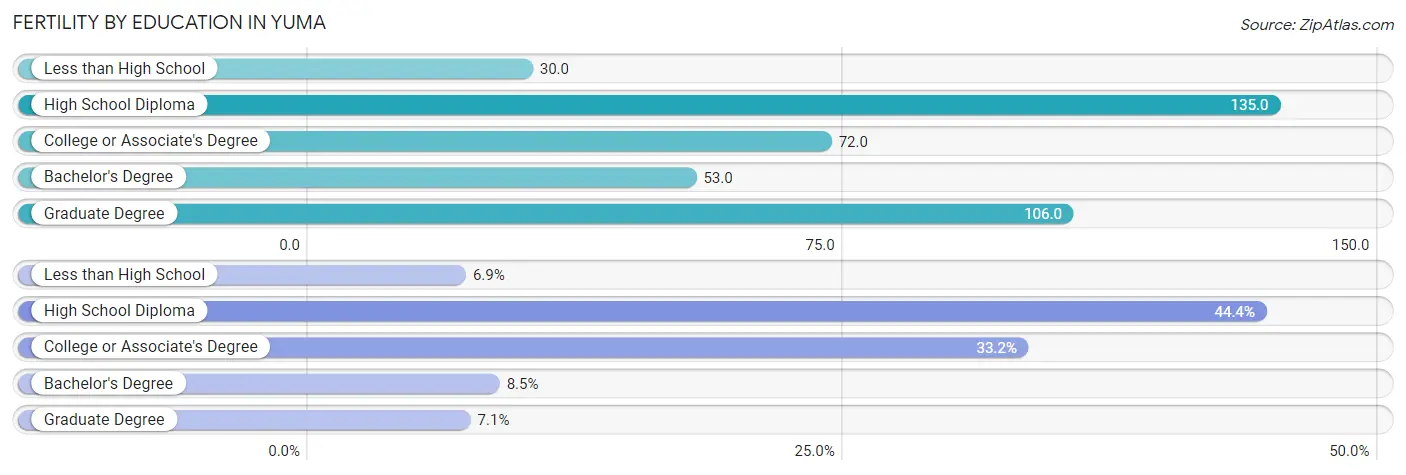
| Educational Attainment | Women with Births | Births / 1,000 Women |
| Less than High School | 122 (6.9%) | 30.0 |
| High School Diploma | 788 (44.4%) | 135.0 |
| College or Associate's Degree | 590 (33.2%) | 72.0 |
| Bachelor's Degree | 150 (8.5%) | 53.0 |
| Graduate Degree | 126 (7.1%) | 106.0 |
| Total | 1,776 (100.0%) | 81.0 |
Fertility by Education by Marriage Status in Yuma
33.4% of women with births in Yuma are unmarried. Women with the educational attainment of college or associate's degree are most likely to be married with 76.9% of them married at childbirth, while women with the educational attainment of high school diploma are least likely to be married with 40.7% of them unmarried at childbirth.
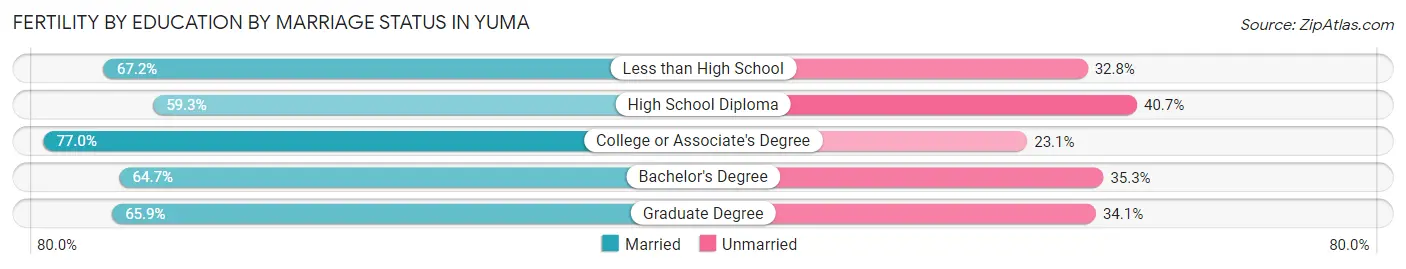
| Educational Attainment | Married | Unmarried |
| Less than High School | 82 (67.2%) | 40 (32.8%) |
| High School Diploma | 467 (59.3%) | 321 (40.7%) |
| College or Associate's Degree | 454 (76.9%) | 136 (23.1%) |
| Bachelor's Degree | 97 (64.7%) | 53 (35.3%) |
| Graduate Degree | 83 (65.9%) | 43 (34.1%) |
| Total | 1,183 (66.6%) | 593 (33.4%) |
Employment Characteristics in Yuma
Employment by Class of Employer in Yuma
Among the 41,355 employed individuals in Yuma, private company employees (23,085 | 55.8%), federal government employees (6,387 | 15.4%), and not-for-profit organizations (3,475 | 8.4%) make up the most common classes of employment.
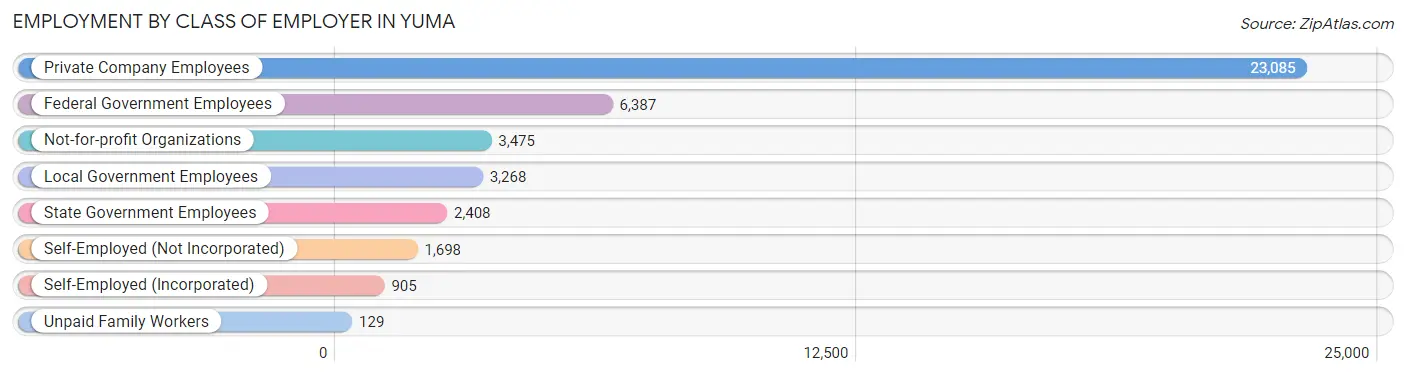
| Employer Class | # Employees | % Employees |
| Private Company Employees | 23,085 | 55.8% |
| Self-Employed (Incorporated) | 905 | 2.2% |
| Self-Employed (Not Incorporated) | 1,698 | 4.1% |
| Not-for-profit Organizations | 3,475 | 8.4% |
| Local Government Employees | 3,268 | 7.9% |
| State Government Employees | 2,408 | 5.8% |
| Federal Government Employees | 6,387 | 15.4% |
| Unpaid Family Workers | 129 | 0.3% |
| Total | 41,355 | 100.0% |
Employment Status by Age in Yuma
According to the labor force statistics for Yuma, out of the total population over 16 years of age (74,306), 61.0% or 45,327 individuals are in the labor force, with 7.7% or 3,490 of them unemployed. The age group with the highest labor force participation rate is 25 to 29 years, with 87.1% or 7,270 individuals in the labor force. Within the labor force, the 16 to 19 years age range has the highest percentage of unemployed individuals, with 25.4% or 496 of them being unemployed.
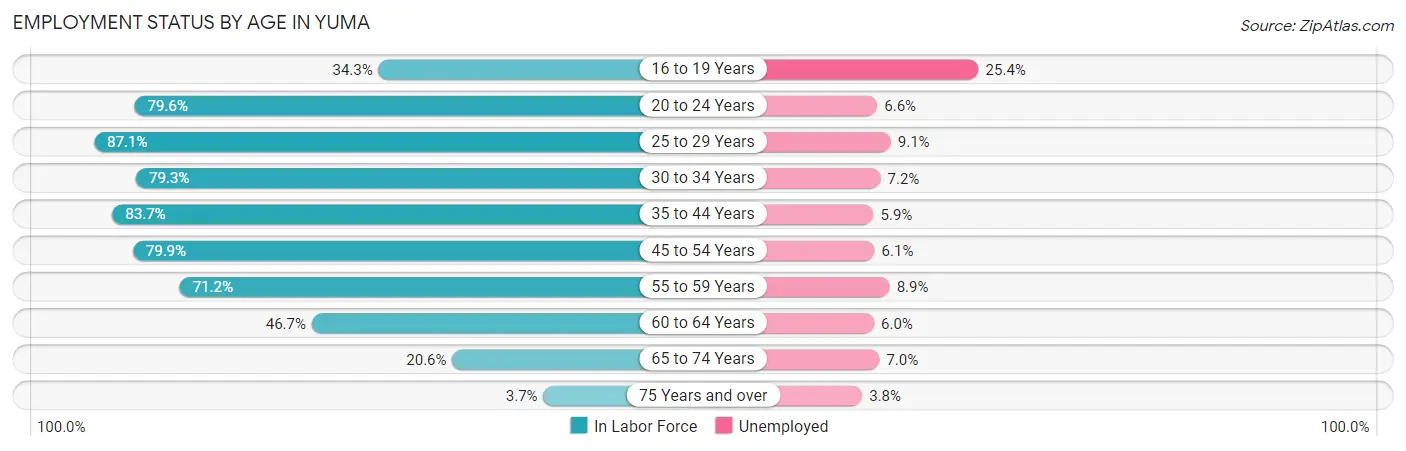
| Age Bracket | In Labor Force | Unemployed |
| 16 to 19 Years | 1,953 (34.3%) | 496 (25.4%) |
| 20 to 24 Years | 7,176 (79.6%) | 474 (6.6%) |
| 25 to 29 Years | 7,270 (87.1%) | 662 (9.1%) |
| 30 to 34 Years | 5,450 (79.3%) | 392 (7.2%) |
| 35 to 44 Years | 9,819 (83.7%) | 579 (5.9%) |
| 45 to 54 Years | 6,733 (79.9%) | 411 (6.1%) |
| 55 to 59 Years | 2,836 (71.2%) | 252 (8.9%) |
| 60 to 64 Years | 2,176 (46.7%) | 131 (6.0%) |
| 65 to 74 Years | 1,588 (20.6%) | 111 (7.0%) |
| 75 Years and over | 291 (3.7%) | 11 (3.8%) |
| Total | 45,327 (61.0%) | 3,490 (7.7%) |
Employment Status by Educational Attainment in Yuma
According to labor force statistics for Yuma, 77.9% of individuals (34,292) out of the total population between 25 and 64 years of age (44,020) are in the labor force, with 7.0% or 2,400 of them being unemployed. The group with the highest labor force participation rate are those with the educational attainment of bachelor's degree or higher, with 86.5% or 7,987 individuals in the labor force. Within the labor force, individuals with less than high school education have the highest percentage of unemployment, with 16.1% or 609 of them being unemployed.
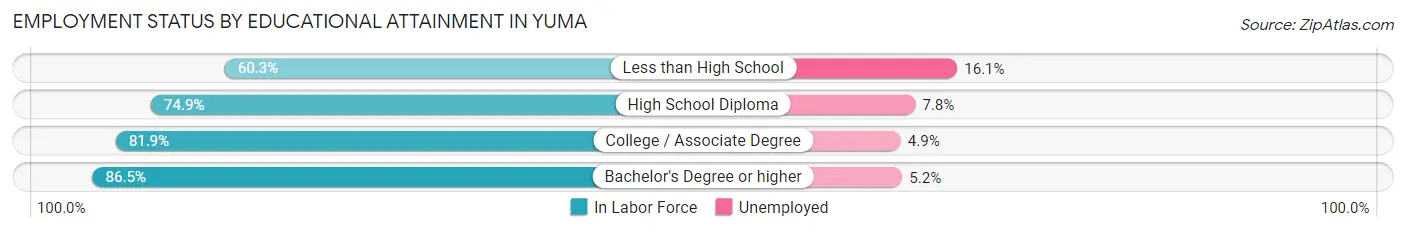
| Educational Attainment | In Labor Force | Unemployed |
| Less than High School | 3,784 (60.3%) | 1,010 (16.1%) |
| High School Diploma | 8,989 (74.9%) | 936 (7.8%) |
| College / Associate Degree | 13,522 (81.9%) | 809 (4.9%) |
| Bachelor's Degree or higher | 7,987 (86.5%) | 480 (5.2%) |
| Total | 34,292 (77.9%) | 3,081 (7.0%) |
Employment Occupations by Sex in Yuma
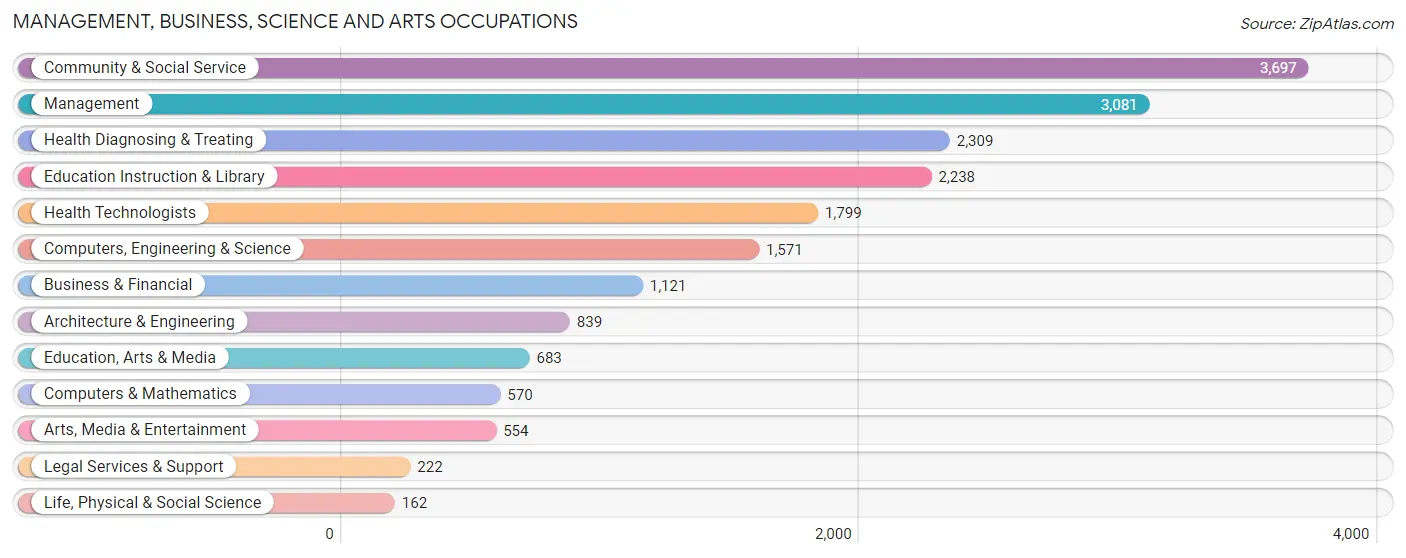
Management, Business, Science and Arts Occupations
The most common Management, Business, Science and Arts occupations in Yuma are Community & Social Service (3,697 | 9.6%), Management (3,081 | 8.0%), Health Diagnosing & Treating (2,309 | 6.0%), Education Instruction & Library (2,238 | 5.8%), and Health Technologists (1,799 | 4.7%).
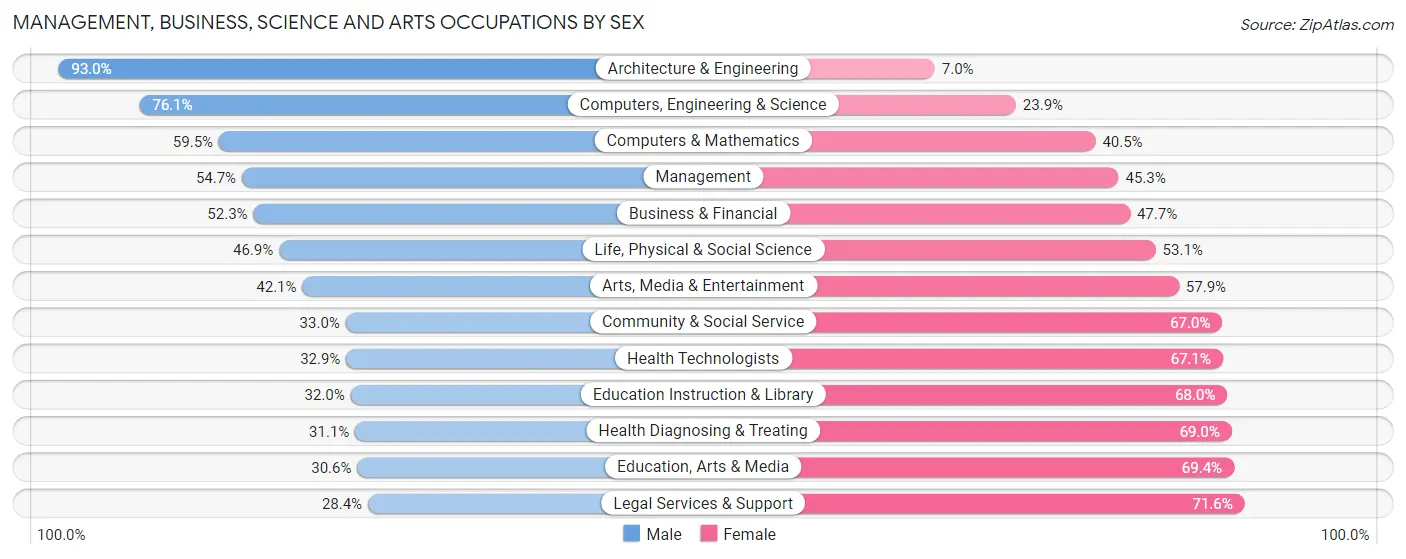
Management, Business, Science and Arts Occupations by Sex
Within the Management, Business, Science and Arts occupations in Yuma, the most male-oriented occupations are Architecture & Engineering (93.0%), Computers, Engineering & Science (76.1%), and Computers & Mathematics (59.5%), while the most female-oriented occupations are Legal Services & Support (71.6%), Education, Arts & Media (69.4%), and Health Diagnosing & Treating (69.0%).
| Occupation | Male | Female |
| Management | 1,684 (54.7%) | 1,397 (45.3%) |
| Business & Financial | 586 (52.3%) | 535 (47.7%) |
| Computers, Engineering & Science | 1,195 (76.1%) | 376 (23.9%) |
| Computers & Mathematics | 339 (59.5%) | 231 (40.5%) |
| Architecture & Engineering | 780 (93.0%) | 59 (7.0%) |
| Life, Physical & Social Science | 76 (46.9%) | 86 (53.1%) |
| Community & Social Service | 1,221 (33.0%) | 2,476 (67.0%) |
| Education, Arts & Media | 209 (30.6%) | 474 (69.4%) |
| Legal Services & Support | 63 (28.4%) | 159 (71.6%) |
| Education Instruction & Library | 716 (32.0%) | 1,522 (68.0%) |
| Arts, Media & Entertainment | 233 (42.1%) | 321 (57.9%) |
| Health Diagnosing & Treating | 717 (31.0%) | 1,592 (69.0%) |
| Health Technologists | 592 (32.9%) | 1,207 (67.1%) |
| Total (Category) | 5,403 (45.9%) | 6,376 (54.1%) |
| Total (Overall) | 21,183 (54.9%) | 17,374 (45.1%) |
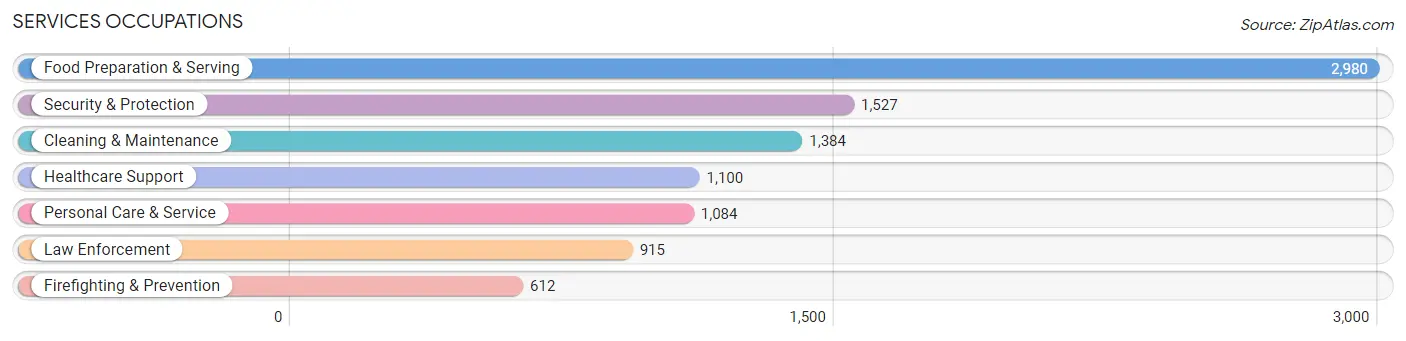
Services Occupations
The most common Services occupations in Yuma are Food Preparation & Serving (2,980 | 7.7%), Security & Protection (1,527 | 4.0%), Cleaning & Maintenance (1,384 | 3.6%), Healthcare Support (1,100 | 2.9%), and Personal Care & Service (1,084 | 2.8%).
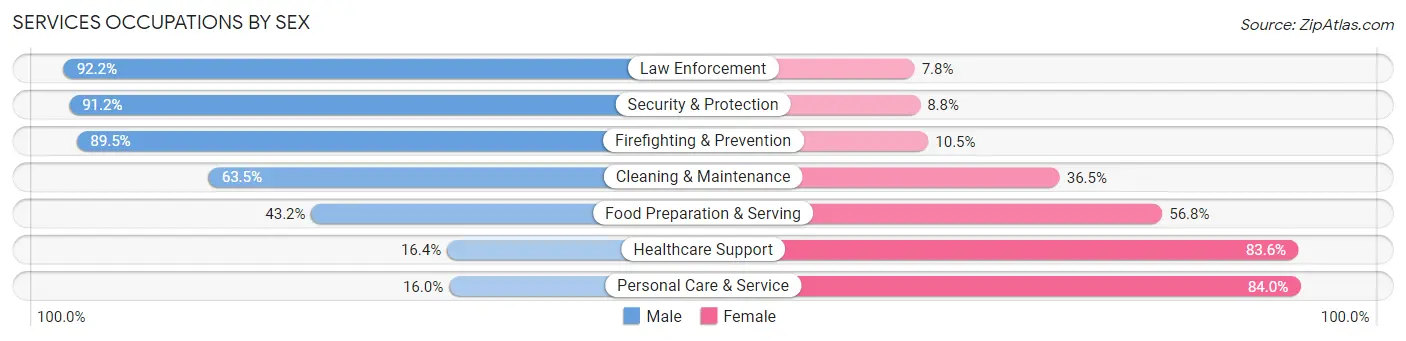
Services Occupations by Sex
Within the Services occupations in Yuma, the most male-oriented occupations are Law Enforcement (92.2%), Security & Protection (91.2%), and Firefighting & Prevention (89.5%), while the most female-oriented occupations are Personal Care & Service (84.0%), Healthcare Support (83.6%), and Food Preparation & Serving (56.8%).
| Occupation | Male | Female |
| Healthcare Support | 180 (16.4%) | 920 (83.6%) |
| Security & Protection | 1,392 (91.2%) | 135 (8.8%) |
| Firefighting & Prevention | 548 (89.5%) | 64 (10.5%) |
| Law Enforcement | 844 (92.2%) | 71 (7.8%) |
| Food Preparation & Serving | 1,288 (43.2%) | 1,692 (56.8%) |
| Cleaning & Maintenance | 879 (63.5%) | 505 (36.5%) |
| Personal Care & Service | 173 (16.0%) | 911 (84.0%) |
| Total (Category) | 3,912 (48.4%) | 4,163 (51.5%) |
| Total (Overall) | 21,183 (54.9%) | 17,374 (45.1%) |
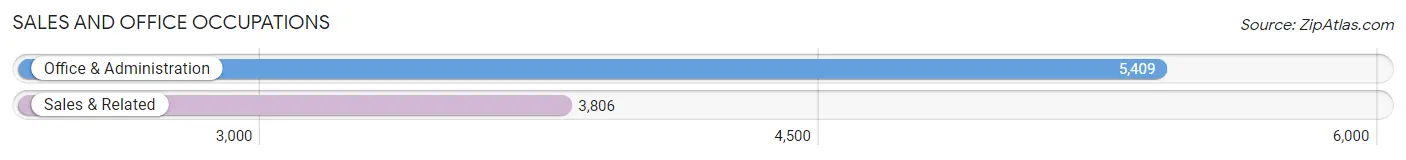
Sales and Office Occupations
The most common Sales and Office occupations in Yuma are Office & Administration (5,409 | 14.0%), and Sales & Related (3,806 | 9.9%).
Sales and Office Occupations by Sex
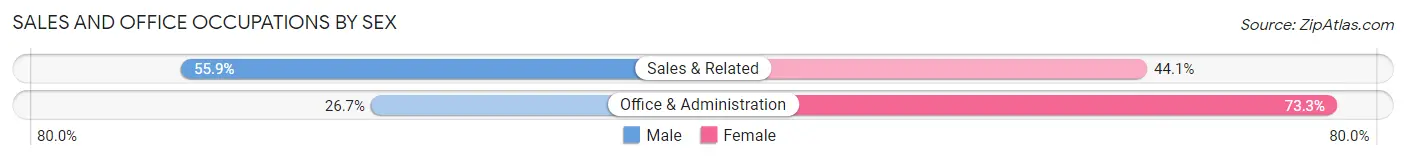
| Occupation | Male | Female |
| Sales & Related | 2,128 (55.9%) | 1,678 (44.1%) |
| Office & Administration | 1,446 (26.7%) | 3,963 (73.3%) |
| Total (Category) | 3,574 (38.8%) | 5,641 (61.2%) |
| Total (Overall) | 21,183 (54.9%) | 17,374 (45.1%) |
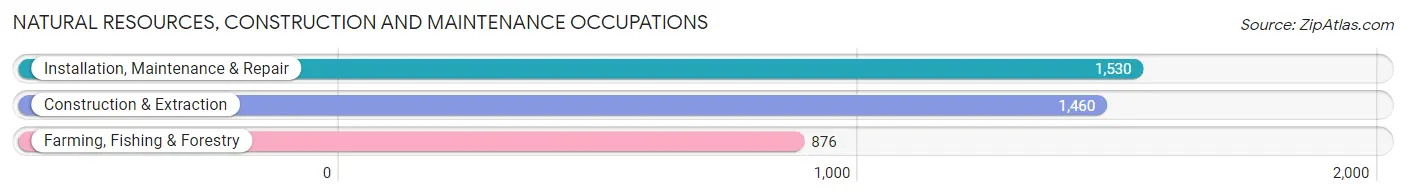
Natural Resources, Construction and Maintenance Occupations
The most common Natural Resources, Construction and Maintenance occupations in Yuma are Installation, Maintenance & Repair (1,530 | 4.0%), Construction & Extraction (1,460 | 3.8%), and Farming, Fishing & Forestry (876 | 2.3%).
Natural Resources, Construction and Maintenance Occupations by Sex
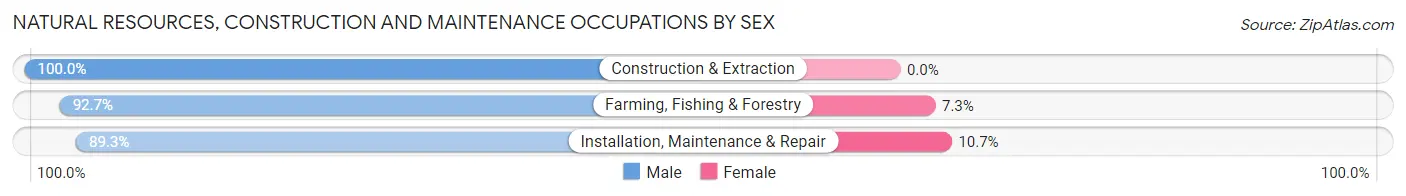
| Occupation | Male | Female |
| Farming, Fishing & Forestry | 812 (92.7%) | 64 (7.3%) |
| Construction & Extraction | 1,460 (100.0%) | 0 (0.0%) |
| Installation, Maintenance & Repair | 1,366 (89.3%) | 164 (10.7%) |
| Total (Category) | 3,638 (94.1%) | 228 (5.9%) |
| Total (Overall) | 21,183 (54.9%) | 17,374 (45.1%) |
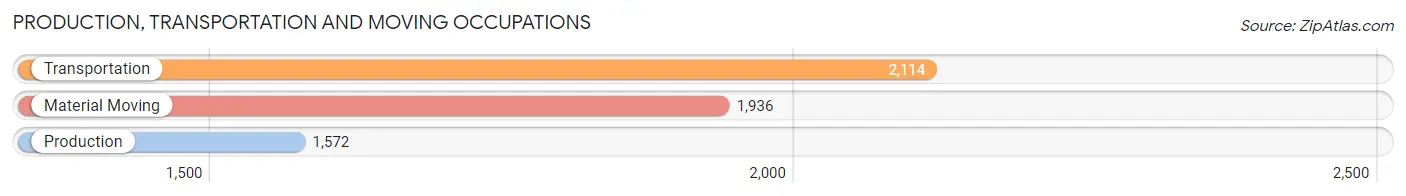
Production, Transportation and Moving Occupations
The most common Production, Transportation and Moving occupations in Yuma are Transportation (2,114 | 5.5%), Material Moving (1,936 | 5.0%), and Production (1,572 | 4.1%).
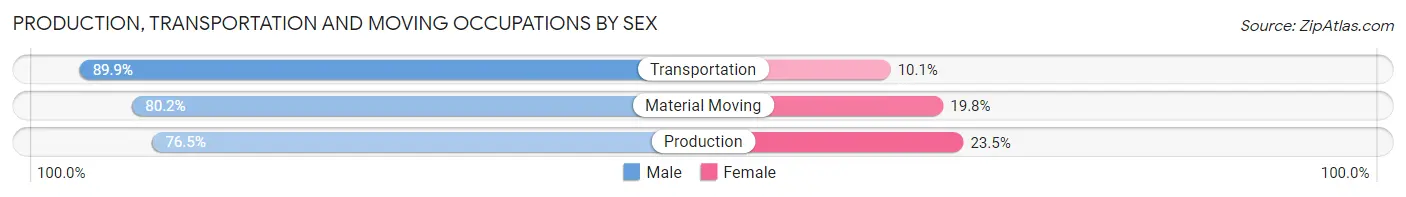
Production, Transportation and Moving Occupations by Sex
| Occupation | Male | Female |
| Production | 1,203 (76.5%) | 369 (23.5%) |
| Transportation | 1,900 (89.9%) | 214 (10.1%) |
| Material Moving | 1,553 (80.2%) | 383 (19.8%) |
| Total (Category) | 4,656 (82.8%) | 966 (17.2%) |
| Total (Overall) | 21,183 (54.9%) | 17,374 (45.1%) |
Employment Industries by Sex in Yuma
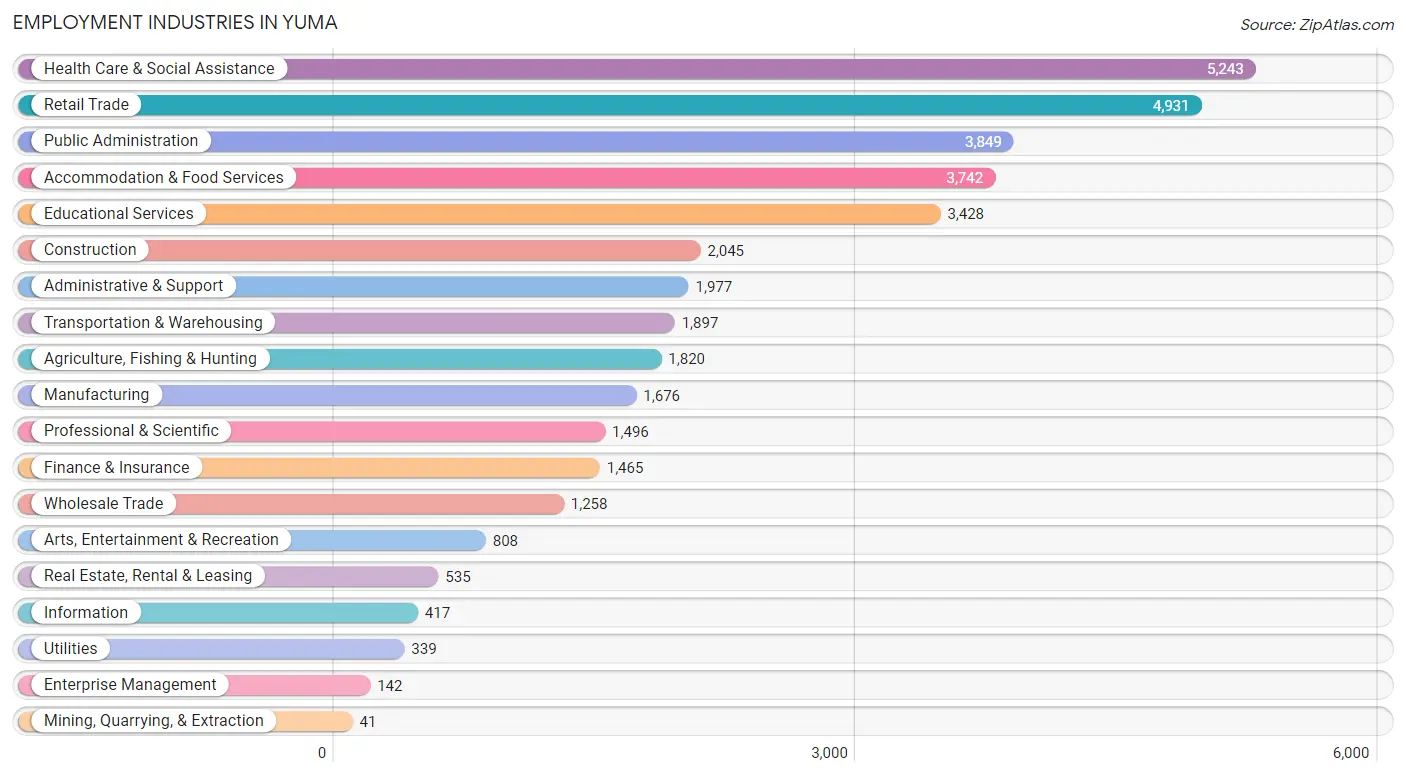
Employment Industries in Yuma
The major employment industries in Yuma include Health Care & Social Assistance (5,243 | 13.6%), Retail Trade (4,931 | 12.8%), Public Administration (3,849 | 10.0%), Accommodation & Food Services (3,742 | 9.7%), and Educational Services (3,428 | 8.9%).
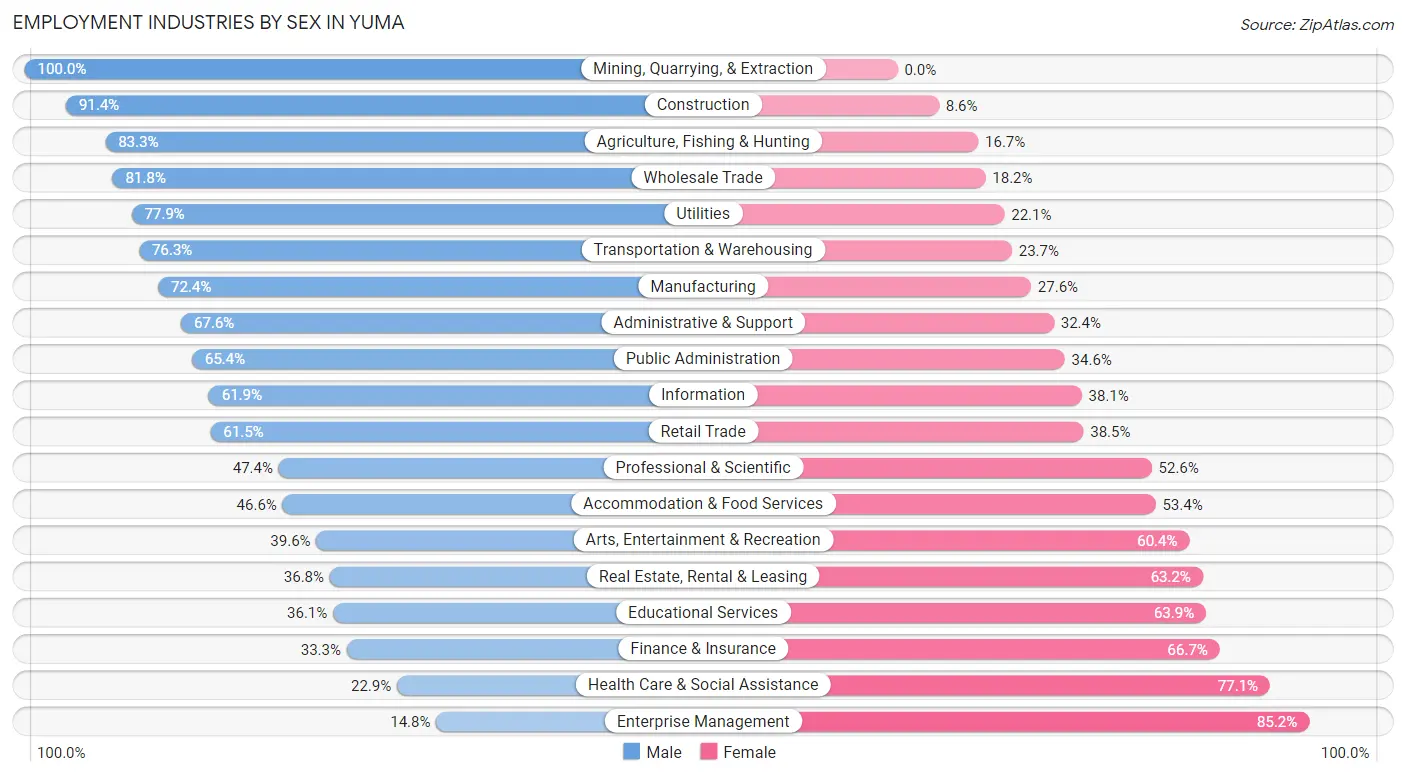
Employment Industries by Sex in Yuma
The Yuma industries that see more men than women are Mining, Quarrying, & Extraction (100.0%), Construction (91.4%), and Agriculture, Fishing & Hunting (83.3%), whereas the industries that tend to have a higher number of women are Enterprise Management (85.2%), Health Care & Social Assistance (77.1%), and Finance & Insurance (66.7%).
| Industry | Male | Female |
| Agriculture, Fishing & Hunting | 1,516 (83.3%) | 304 (16.7%) |
| Mining, Quarrying, & Extraction | 41 (100.0%) | 0 (0.0%) |
| Construction | 1,870 (91.4%) | 175 (8.6%) |
| Manufacturing | 1,213 (72.4%) | 463 (27.6%) |
| Wholesale Trade | 1,029 (81.8%) | 229 (18.2%) |
| Retail Trade | 3,034 (61.5%) | 1,897 (38.5%) |
| Transportation & Warehousing | 1,448 (76.3%) | 449 (23.7%) |
| Utilities | 264 (77.9%) | 75 (22.1%) |
| Information | 258 (61.9%) | 159 (38.1%) |
| Finance & Insurance | 488 (33.3%) | 977 (66.7%) |
| Real Estate, Rental & Leasing | 197 (36.8%) | 338 (63.2%) |
| Professional & Scientific | 709 (47.4%) | 787 (52.6%) |
| Enterprise Management | 21 (14.8%) | 121 (85.2%) |
| Administrative & Support | 1,337 (67.6%) | 640 (32.4%) |
| Educational Services | 1,239 (36.1%) | 2,189 (63.9%) |
| Health Care & Social Assistance | 1,201 (22.9%) | 4,042 (77.1%) |
| Arts, Entertainment & Recreation | 320 (39.6%) | 488 (60.4%) |
| Accommodation & Food Services | 1,743 (46.6%) | 1,999 (53.4%) |
| Public Administration | 2,517 (65.4%) | 1,332 (34.6%) |
| Total | 21,183 (54.9%) | 17,374 (45.1%) |
Education in Yuma
School Enrollment in Yuma
The most common levels of schooling among the 24,245 students in Yuma are high school (5,622 | 23.2%), elementary school (5,469 | 22.6%), and middle school (5,312 | 21.9%).
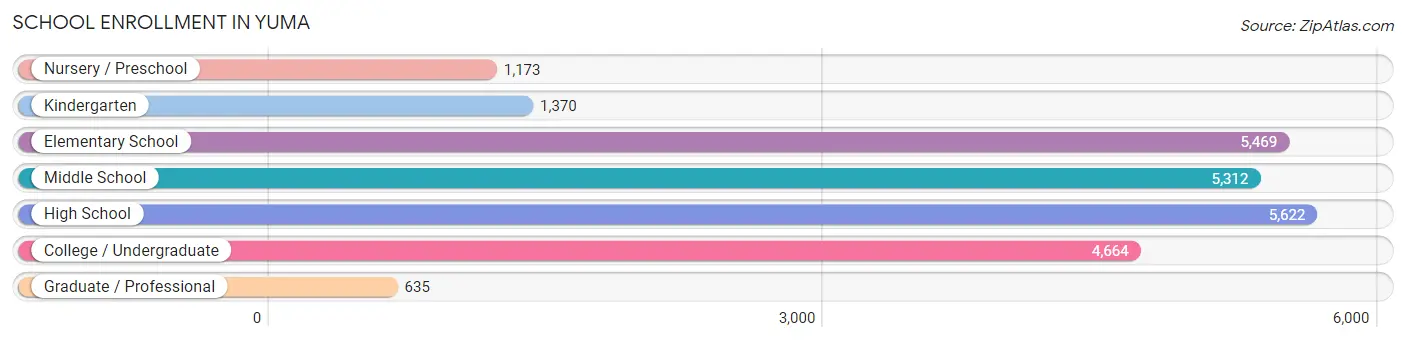
| School Level | # Students | % Students |
| Nursery / Preschool | 1,173 | 4.8% |
| Kindergarten | 1,370 | 5.7% |
| Elementary School | 5,469 | 22.6% |
| Middle School | 5,312 | 21.9% |
| High School | 5,622 | 23.2% |
| College / Undergraduate | 4,664 | 19.2% |
| Graduate / Professional | 635 | 2.6% |
| Total | 24,245 | 100.0% |
School Enrollment by Age by Funding Source in Yuma
Out of a total of 24,245 students who are enrolled in schools in Yuma, 2,376 (9.8%) attend a private institution, while the remaining 21,869 (90.2%) are enrolled in public schools. The age group of 35 years and over has the highest likelihood of being enrolled in private schools, with 339 (30.2% in the age bracket) enrolled. Conversely, the age group of 18 to 19 year olds has the lowest likelihood of being enrolled in a private school, with 1,738 (97.6% in the age bracket) attending a public institution.
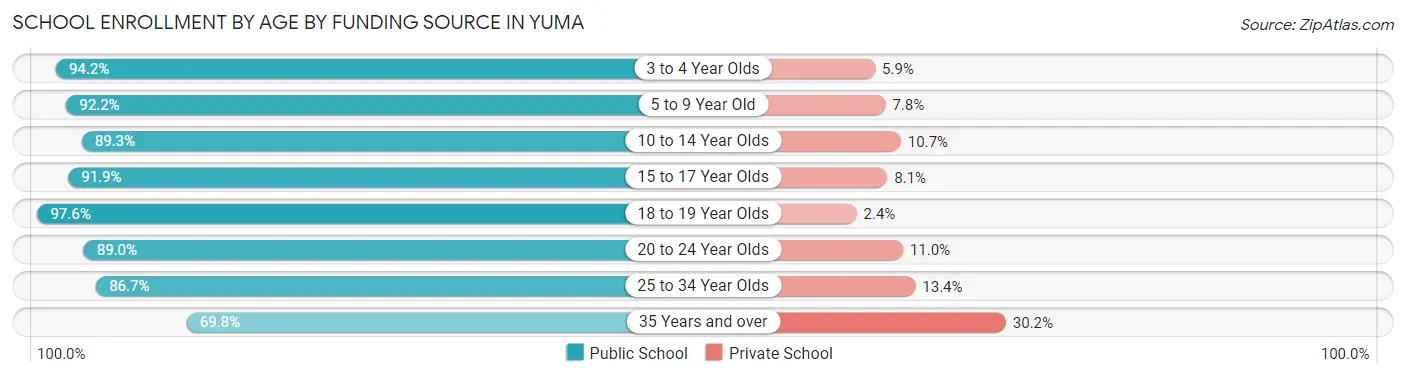
| Age Bracket | Public School | Private School |
| 3 to 4 Year Olds | 918 (94.2%) | 57 (5.9%) |
| 5 to 9 Year Old | 5,958 (92.2%) | 503 (7.8%) |
| 10 to 14 Year Olds | 6,037 (89.3%) | 720 (10.7%) |
| 15 to 17 Year Olds | 3,398 (91.9%) | 301 (8.1%) |
| 18 to 19 Year Olds | 1,738 (97.6%) | 43 (2.4%) |
| 20 to 24 Year Olds | 1,830 (89.0%) | 227 (11.0%) |
| 25 to 34 Year Olds | 1,207 (86.7%) | 186 (13.4%) |
| 35 Years and over | 783 (69.8%) | 339 (30.2%) |
| Total | 21,869 (90.2%) | 2,376 (9.8%) |
Educational Attainment by Field of Study in Yuma
Business (2,387 | 18.5%), education (2,128 | 16.5%), arts & humanities (1,486 | 11.5%), science & technology (1,367 | 10.6%), and social sciences (794 | 6.1%) are the most common fields of study among 12,922 individuals in Yuma who have obtained a bachelor's degree or higher.
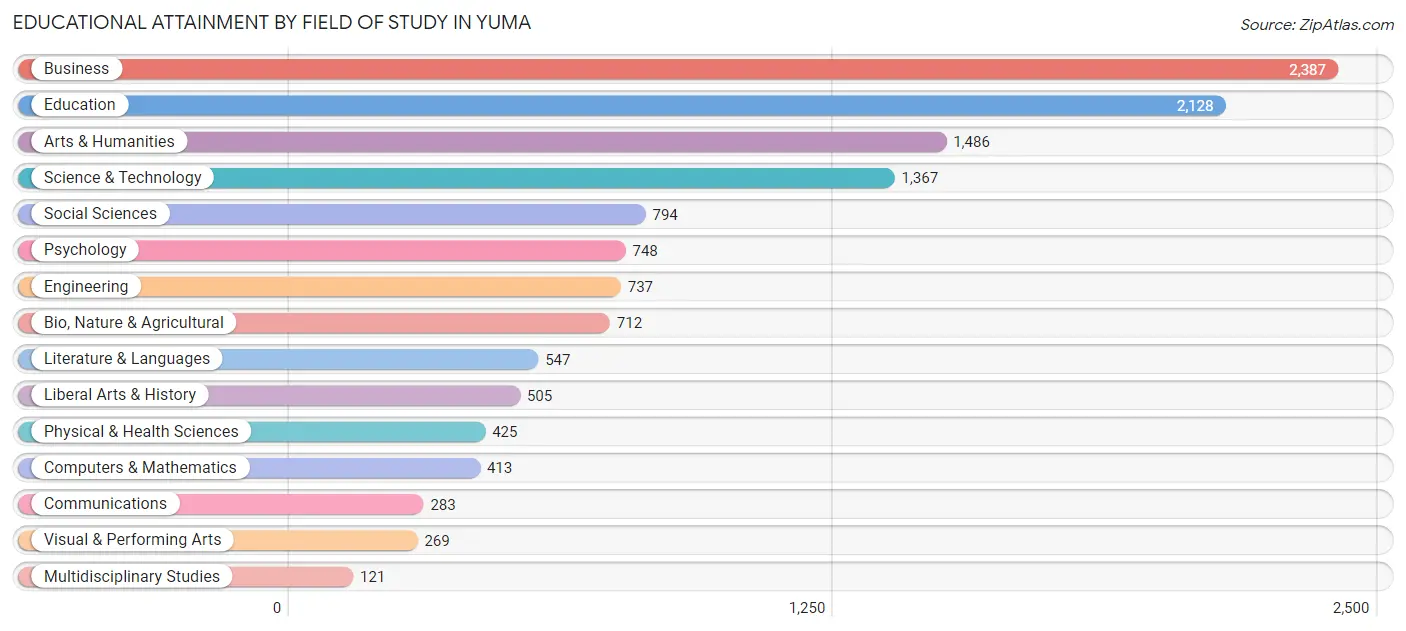
| Field of Study | # Graduates | % Graduates |
| Computers & Mathematics | 413 | 3.2% |
| Bio, Nature & Agricultural | 712 | 5.5% |
| Physical & Health Sciences | 425 | 3.3% |
| Psychology | 748 | 5.8% |
| Social Sciences | 794 | 6.1% |
| Engineering | 737 | 5.7% |
| Multidisciplinary Studies | 121 | 0.9% |
| Science & Technology | 1,367 | 10.6% |
| Business | 2,387 | 18.5% |
| Education | 2,128 | 16.5% |
| Literature & Languages | 547 | 4.2% |
| Liberal Arts & History | 505 | 3.9% |
| Visual & Performing Arts | 269 | 2.1% |
| Communications | 283 | 2.2% |
| Arts & Humanities | 1,486 | 11.5% |
| Total | 12,922 | 100.0% |
Transportation & Commute in Yuma
Vehicle Availability by Sex in Yuma
The most prevalent vehicle ownership categories in Yuma are males with 2 vehicles (10,239, accounting for 45.0%) and females with 2 vehicles (7,222, making up 60.0%).
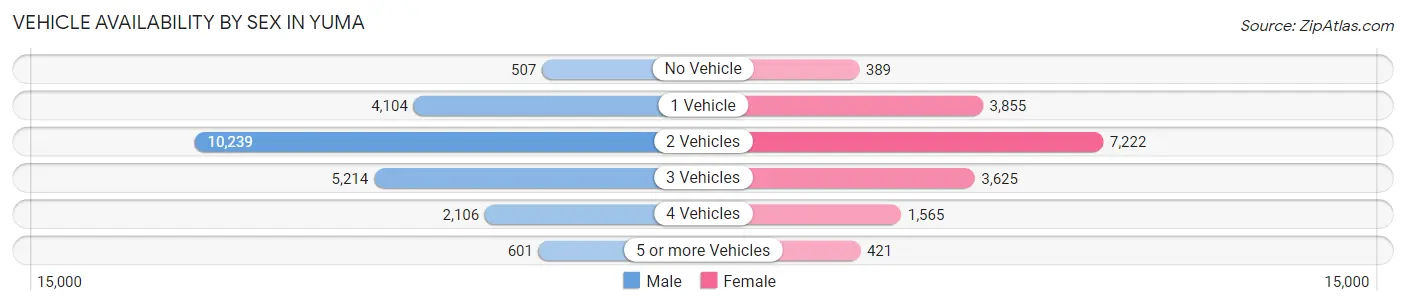
| Vehicles Available | Male | Female |
| No Vehicle | 507 (2.2%) | 389 (2.3%) |
| 1 Vehicle | 4,104 (18.0%) | 3,855 (22.6%) |
| 2 Vehicles | 10,239 (45.0%) | 7,222 (42.3%) |
| 3 Vehicles | 5,214 (22.9%) | 3,625 (21.2%) |
| 4 Vehicles | 2,106 (9.2%) | 1,565 (9.2%) |
| 5 or more Vehicles | 601 (2.6%) | 421 (2.5%) |
| Total | 22,771 (100.0%) | 17,077 (100.0%) |
Commute Time in Yuma
The most frequently occuring commute durations in Yuma are 15 to 19 minutes (9,241 commuters, 23.9%), 10 to 14 minutes (8,255 commuters, 21.4%), and 5 to 9 minutes (6,940 commuters, 18.0%).
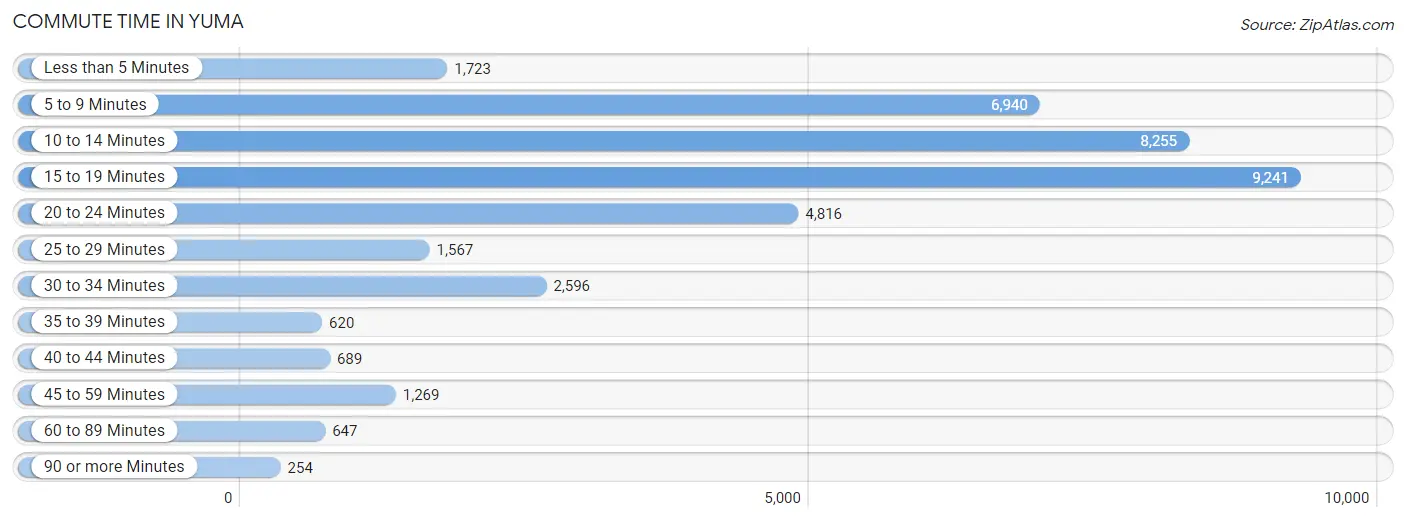
| Commute Time | # Commuters | % Commuters |
| Less than 5 Minutes | 1,723 | 4.5% |
| 5 to 9 Minutes | 6,940 | 18.0% |
| 10 to 14 Minutes | 8,255 | 21.4% |
| 15 to 19 Minutes | 9,241 | 23.9% |
| 20 to 24 Minutes | 4,816 | 12.5% |
| 25 to 29 Minutes | 1,567 | 4.1% |
| 30 to 34 Minutes | 2,596 | 6.7% |
| 35 to 39 Minutes | 620 | 1.6% |
| 40 to 44 Minutes | 689 | 1.8% |
| 45 to 59 Minutes | 1,269 | 3.3% |
| 60 to 89 Minutes | 647 | 1.7% |
| 90 or more Minutes | 254 | 0.7% |
Commute Time by Sex in Yuma
The most common commute times in Yuma are 15 to 19 minutes (5,480 commuters, 23.7%) for males and 15 to 19 minutes (3,761 commuters, 24.3%) for females.
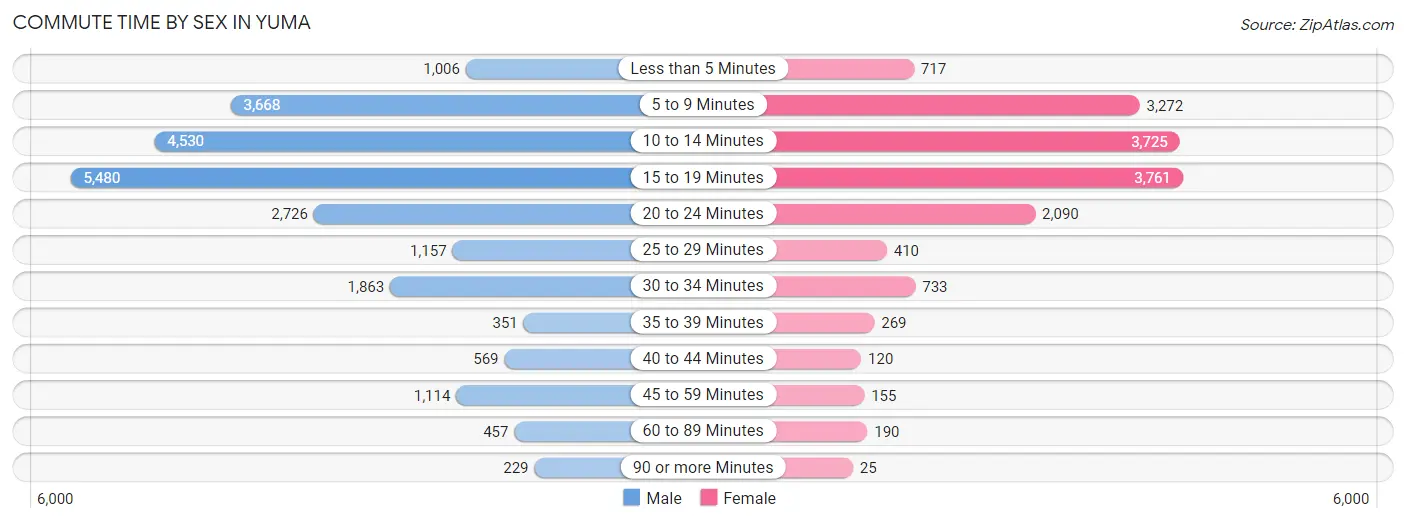
| Commute Time | Male | Female |
| Less than 5 Minutes | 1,006 (4.3%) | 717 (4.6%) |
| 5 to 9 Minutes | 3,668 (15.8%) | 3,272 (21.1%) |
| 10 to 14 Minutes | 4,530 (19.6%) | 3,725 (24.1%) |
| 15 to 19 Minutes | 5,480 (23.7%) | 3,761 (24.3%) |
| 20 to 24 Minutes | 2,726 (11.8%) | 2,090 (13.5%) |
| 25 to 29 Minutes | 1,157 (5.0%) | 410 (2.6%) |
| 30 to 34 Minutes | 1,863 (8.1%) | 733 (4.7%) |
| 35 to 39 Minutes | 351 (1.5%) | 269 (1.7%) |
| 40 to 44 Minutes | 569 (2.5%) | 120 (0.8%) |
| 45 to 59 Minutes | 1,114 (4.8%) | 155 (1.0%) |
| 60 to 89 Minutes | 457 (2.0%) | 190 (1.2%) |
| 90 or more Minutes | 229 (1.0%) | 25 (0.2%) |
Time of Departure to Work by Sex in Yuma
The most frequent times of departure to work in Yuma are 7:00 AM to 7:29 AM (2,685, 11.6%) for males and 7:30 AM to 7:59 AM (2,869, 18.5%) for females.
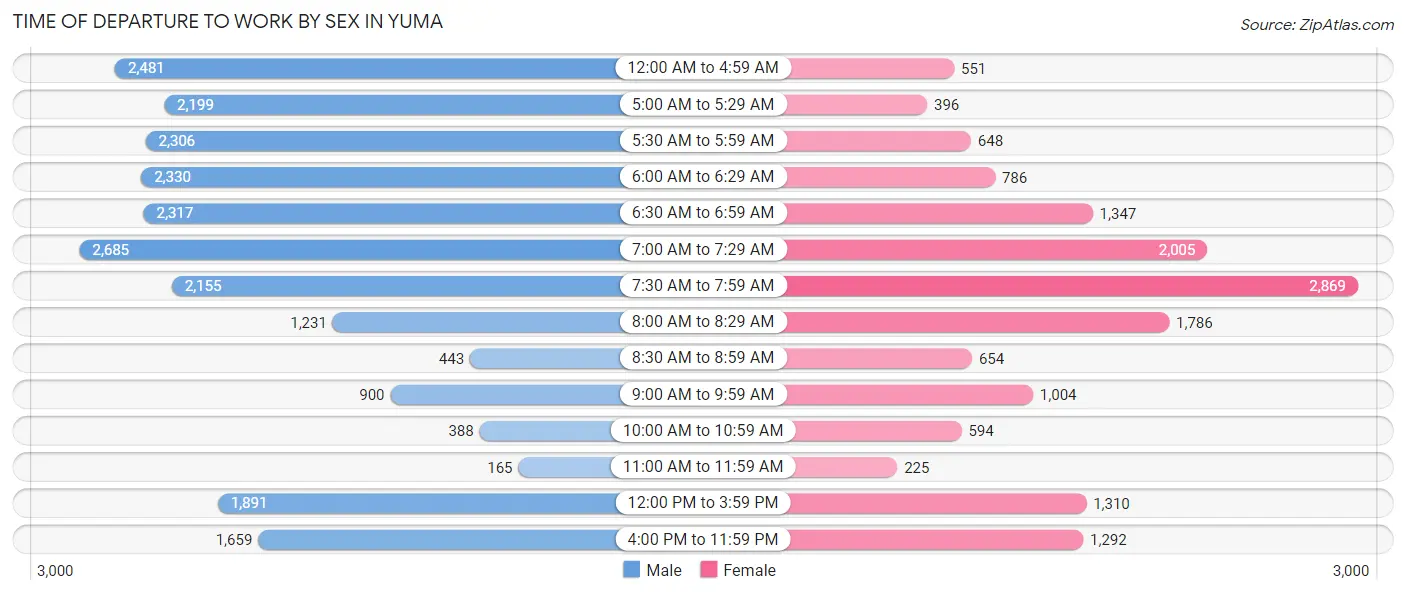
| Time of Departure | Male | Female |
| 12:00 AM to 4:59 AM | 2,481 (10.7%) | 551 (3.6%) |
| 5:00 AM to 5:29 AM | 2,199 (9.5%) | 396 (2.6%) |
| 5:30 AM to 5:59 AM | 2,306 (10.0%) | 648 (4.2%) |
| 6:00 AM to 6:29 AM | 2,330 (10.1%) | 786 (5.1%) |
| 6:30 AM to 6:59 AM | 2,317 (10.0%) | 1,347 (8.7%) |
| 7:00 AM to 7:29 AM | 2,685 (11.6%) | 2,005 (13.0%) |
| 7:30 AM to 7:59 AM | 2,155 (9.3%) | 2,869 (18.5%) |
| 8:00 AM to 8:29 AM | 1,231 (5.3%) | 1,786 (11.6%) |
| 8:30 AM to 8:59 AM | 443 (1.9%) | 654 (4.2%) |
| 9:00 AM to 9:59 AM | 900 (3.9%) | 1,004 (6.5%) |
| 10:00 AM to 10:59 AM | 388 (1.7%) | 594 (3.8%) |
| 11:00 AM to 11:59 AM | 165 (0.7%) | 225 (1.5%) |
| 12:00 PM to 3:59 PM | 1,891 (8.2%) | 1,310 (8.5%) |
| 4:00 PM to 11:59 PM | 1,659 (7.2%) | 1,292 (8.4%) |
| Total | 23,150 (100.0%) | 15,467 (100.0%) |
Housing Occupancy in Yuma
Occupancy by Ownership in Yuma
Of the total 36,290 dwellings in Yuma, owner-occupied units account for 23,339 (64.3%), while renter-occupied units make up 12,951 (35.7%).
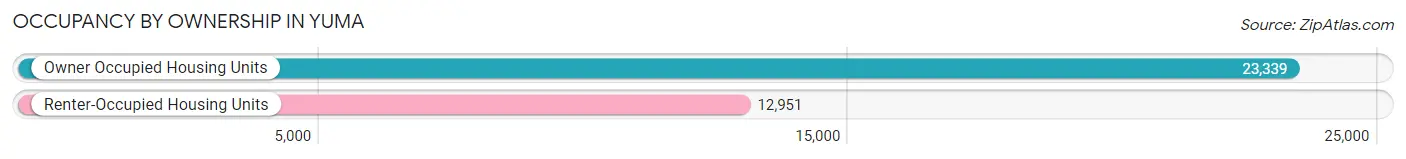
| Occupancy | # Housing Units | % Housing Units |
| Owner Occupied Housing Units | 23,339 | 64.3% |
| Renter-Occupied Housing Units | 12,951 | 35.7% |
| Total Occupied Housing Units | 36,290 | 100.0% |
Occupancy by Household Size in Yuma
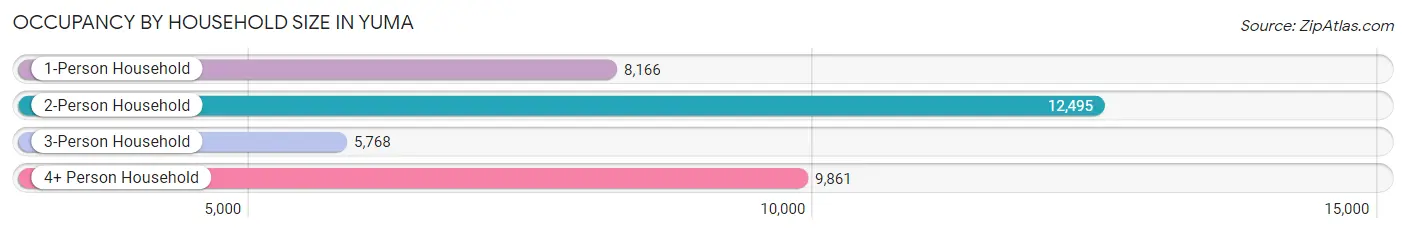
| Household Size | # Housing Units | % Housing Units |
| 1-Person Household | 8,166 | 22.5% |
| 2-Person Household | 12,495 | 34.4% |
| 3-Person Household | 5,768 | 15.9% |
| 4+ Person Household | 9,861 | 27.2% |
| Total Housing Units | 36,290 | 100.0% |
Occupancy by Ownership by Household Size in Yuma
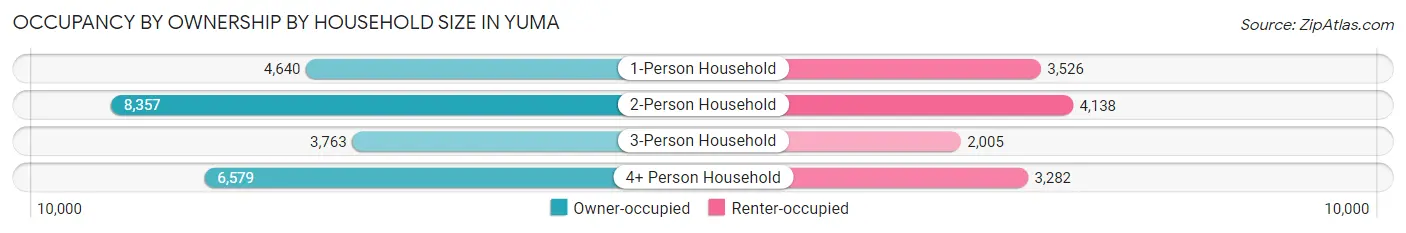
| Household Size | Owner-occupied | Renter-occupied |
| 1-Person Household | 4,640 (56.8%) | 3,526 (43.2%) |
| 2-Person Household | 8,357 (66.9%) | 4,138 (33.1%) |
| 3-Person Household | 3,763 (65.2%) | 2,005 (34.8%) |
| 4+ Person Household | 6,579 (66.7%) | 3,282 (33.3%) |
| Total Housing Units | 23,339 (64.3%) | 12,951 (35.7%) |
Occupancy by Educational Attainment in Yuma
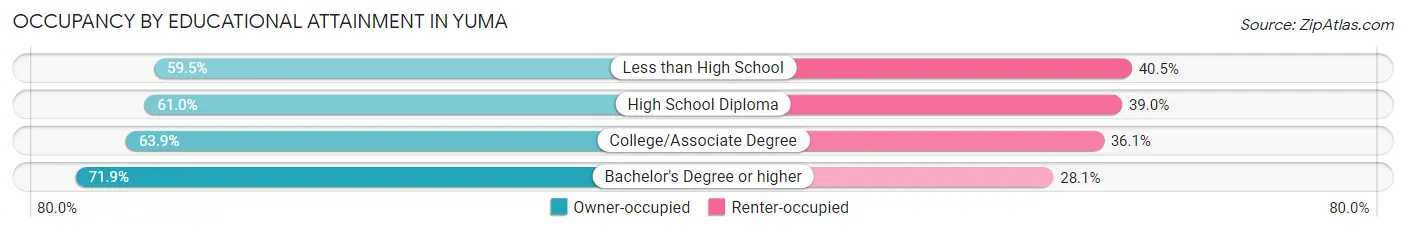
| Household Size | Owner-occupied | Renter-occupied |
| Less than High School | 3,080 (59.5%) | 2,099 (40.5%) |
| High School Diploma | 5,280 (61.0%) | 3,375 (39.0%) |
| College/Associate Degree | 9,338 (63.9%) | 5,274 (36.1%) |
| Bachelor's Degree or higher | 5,641 (71.9%) | 2,203 (28.1%) |
Occupancy by Age of Householder in Yuma
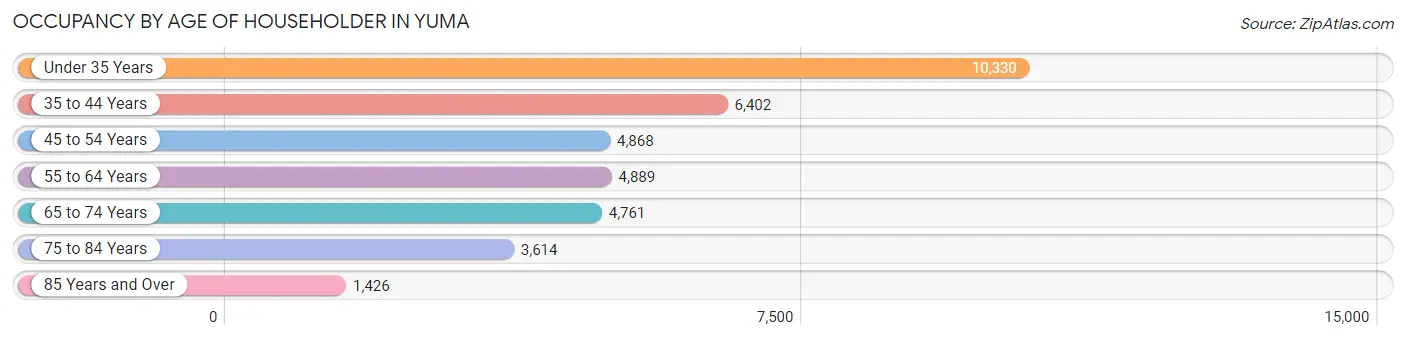
| Age Bracket | # Households | % Households |
| Under 35 Years | 10,330 | 28.5% |
| 35 to 44 Years | 6,402 | 17.6% |
| 45 to 54 Years | 4,868 | 13.4% |
| 55 to 64 Years | 4,889 | 13.5% |
| 65 to 74 Years | 4,761 | 13.1% |
| 75 to 84 Years | 3,614 | 10.0% |
| 85 Years and Over | 1,426 | 3.9% |
| Total | 36,290 | 100.0% |
Housing Finances in Yuma
Median Income by Occupancy in Yuma
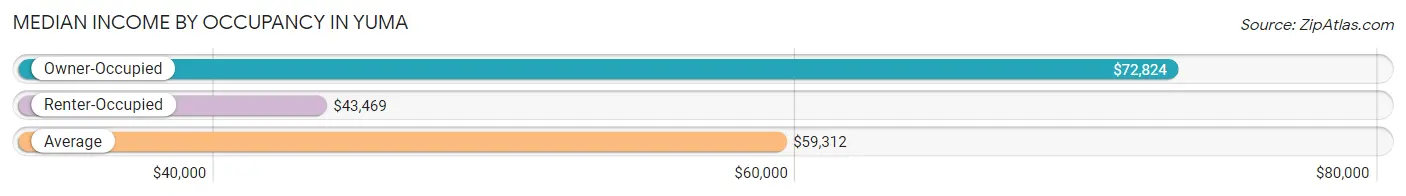
| Occupancy Type | # Households | Median Income |
| Owner-Occupied | 23,339 (64.3%) | $72,824 |
| Renter-Occupied | 12,951 (35.7%) | $43,469 |
| Average | 36,290 (100.0%) | $59,312 |
Occupancy by Householder Income Bracket in Yuma
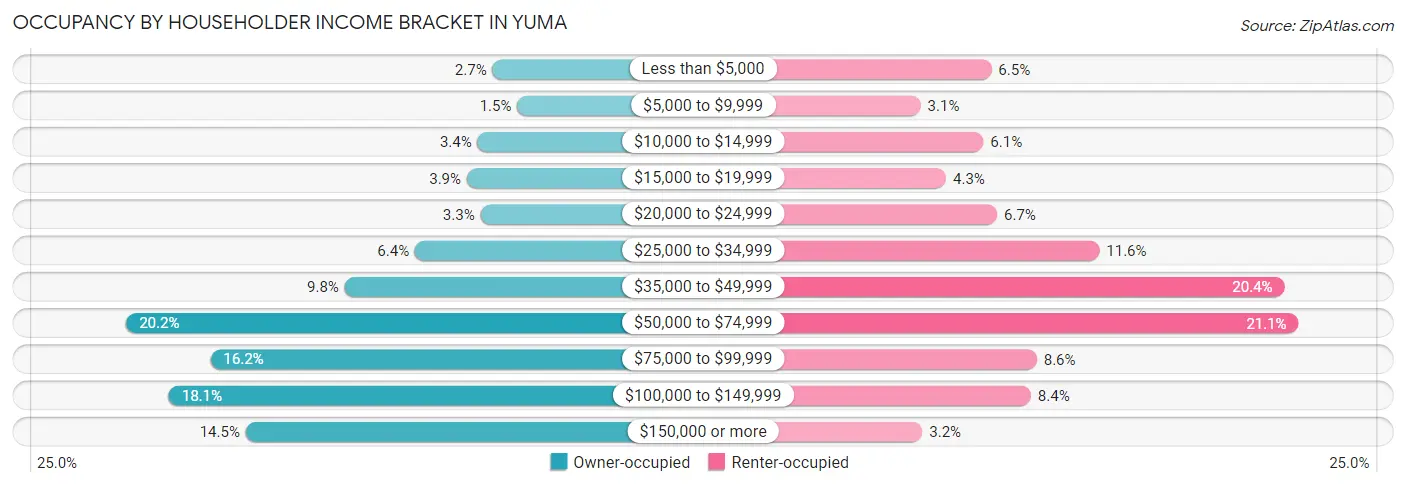
| Income Bracket | Owner-occupied | Renter-occupied |
| Less than $5,000 | 634 (2.7%) | 838 (6.5%) |
| $5,000 to $9,999 | 359 (1.5%) | 402 (3.1%) |
| $10,000 to $14,999 | 800 (3.4%) | 789 (6.1%) |
| $15,000 to $19,999 | 920 (3.9%) | 558 (4.3%) |
| $20,000 to $24,999 | 769 (3.3%) | 873 (6.7%) |
| $25,000 to $34,999 | 1,495 (6.4%) | 1,504 (11.6%) |
| $35,000 to $49,999 | 2,279 (9.8%) | 2,644 (20.4%) |
| $50,000 to $74,999 | 4,706 (20.2%) | 2,731 (21.1%) |
| $75,000 to $99,999 | 3,769 (16.2%) | 1,118 (8.6%) |
| $100,000 to $149,999 | 4,231 (18.1%) | 1,082 (8.4%) |
| $150,000 or more | 3,377 (14.5%) | 412 (3.2%) |
| Total | 23,339 (100.0%) | 12,951 (100.0%) |
Monthly Housing Cost Tiers in Yuma
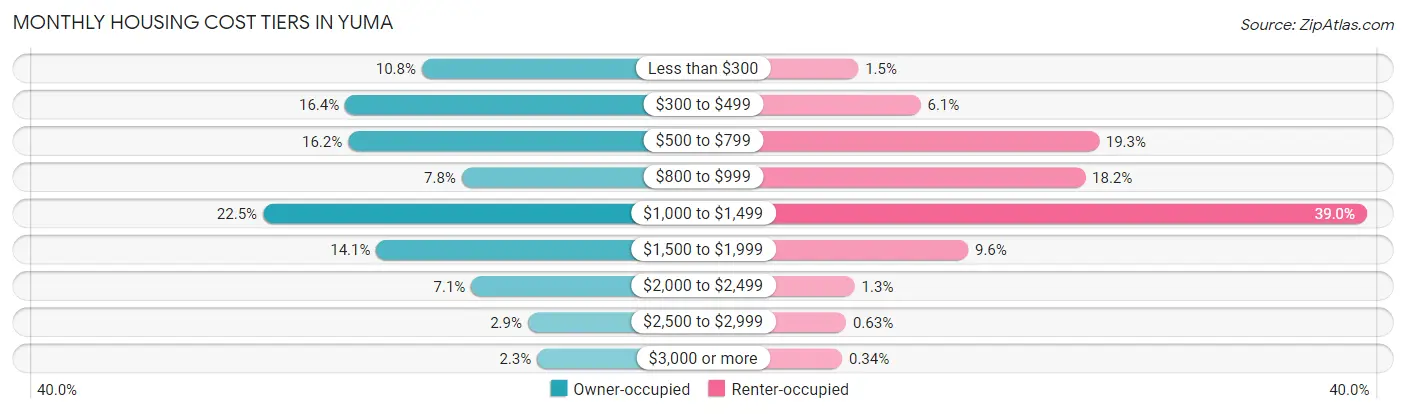
| Monthly Cost | Owner-occupied | Renter-occupied |
| Less than $300 | 2,508 (10.7%) | 198 (1.5%) |
| $300 to $499 | 3,827 (16.4%) | 792 (6.1%) |
| $500 to $799 | 3,777 (16.2%) | 2,493 (19.3%) |
| $800 to $999 | 1,822 (7.8%) | 2,362 (18.2%) |
| $1,000 to $1,499 | 5,240 (22.5%) | 5,050 (39.0%) |
| $1,500 to $1,999 | 3,291 (14.1%) | 1,246 (9.6%) |
| $2,000 to $2,499 | 1,659 (7.1%) | 165 (1.3%) |
| $2,500 to $2,999 | 687 (2.9%) | 82 (0.6%) |
| $3,000 or more | 528 (2.3%) | 44 (0.3%) |
| Total | 23,339 (100.0%) | 12,951 (100.0%) |
Physical Housing Characteristics in Yuma
Housing Structures in Yuma
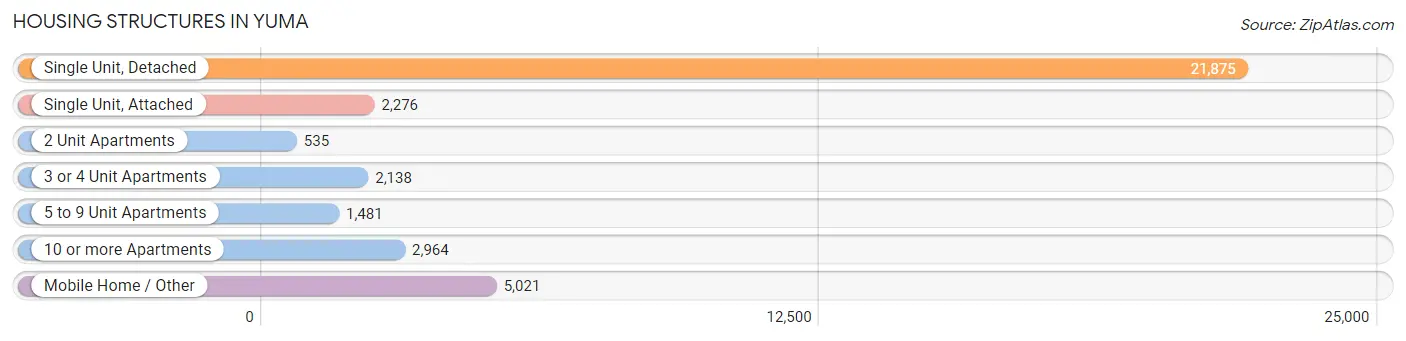
| Structure Type | # Housing Units | % Housing Units |
| Single Unit, Detached | 21,875 | 60.3% |
| Single Unit, Attached | 2,276 | 6.3% |
| 2 Unit Apartments | 535 | 1.5% |
| 3 or 4 Unit Apartments | 2,138 | 5.9% |
| 5 to 9 Unit Apartments | 1,481 | 4.1% |
| 10 or more Apartments | 2,964 | 8.2% |
| Mobile Home / Other | 5,021 | 13.8% |
| Total | 36,290 | 100.0% |
Housing Structures by Occupancy in Yuma
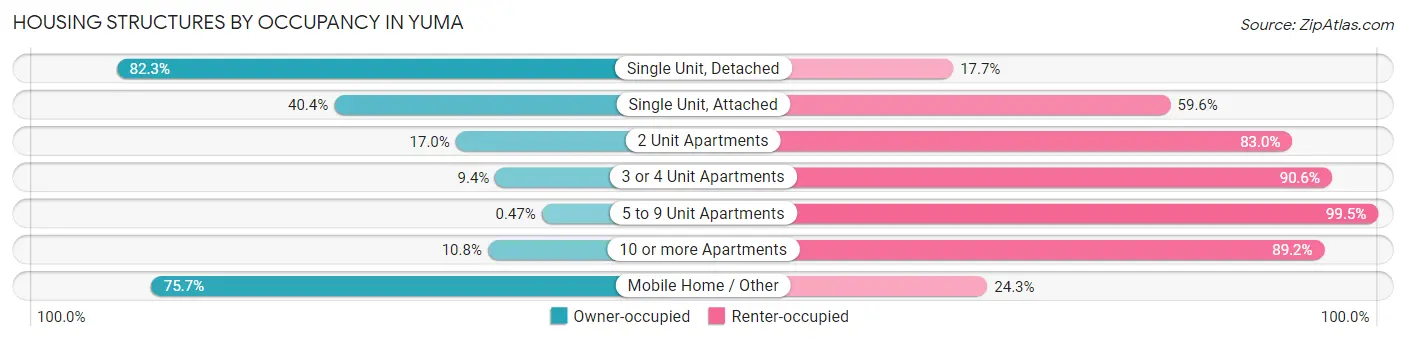
| Structure Type | Owner-occupied | Renter-occupied |
| Single Unit, Detached | 17,998 (82.3%) | 3,877 (17.7%) |
| Single Unit, Attached | 920 (40.4%) | 1,356 (59.6%) |
| 2 Unit Apartments | 91 (17.0%) | 444 (83.0%) |
| 3 or 4 Unit Apartments | 201 (9.4%) | 1,937 (90.6%) |
| 5 to 9 Unit Apartments | 7 (0.5%) | 1,474 (99.5%) |
| 10 or more Apartments | 321 (10.8%) | 2,643 (89.2%) |
| Mobile Home / Other | 3,801 (75.7%) | 1,220 (24.3%) |
| Total | 23,339 (64.3%) | 12,951 (35.7%) |
Housing Structures by Number of Rooms in Yuma
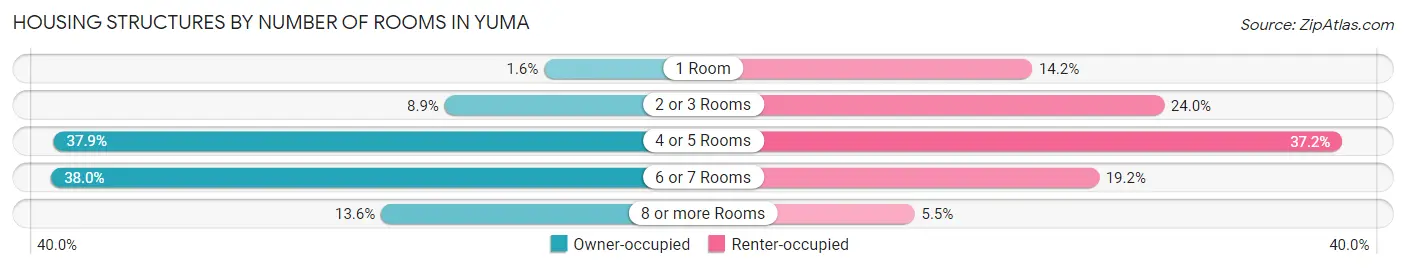
| Number of Rooms | Owner-occupied | Renter-occupied |
| 1 Room | 365 (1.6%) | 1,840 (14.2%) |
| 2 or 3 Rooms | 2,083 (8.9%) | 3,104 (24.0%) |
| 4 or 5 Rooms | 8,834 (37.9%) | 4,812 (37.2%) |
| 6 or 7 Rooms | 8,875 (38.0%) | 2,480 (19.2%) |
| 8 or more Rooms | 3,182 (13.6%) | 715 (5.5%) |
| Total | 23,339 (100.0%) | 12,951 (100.0%) |
Housing Structure by Heating Type in Yuma
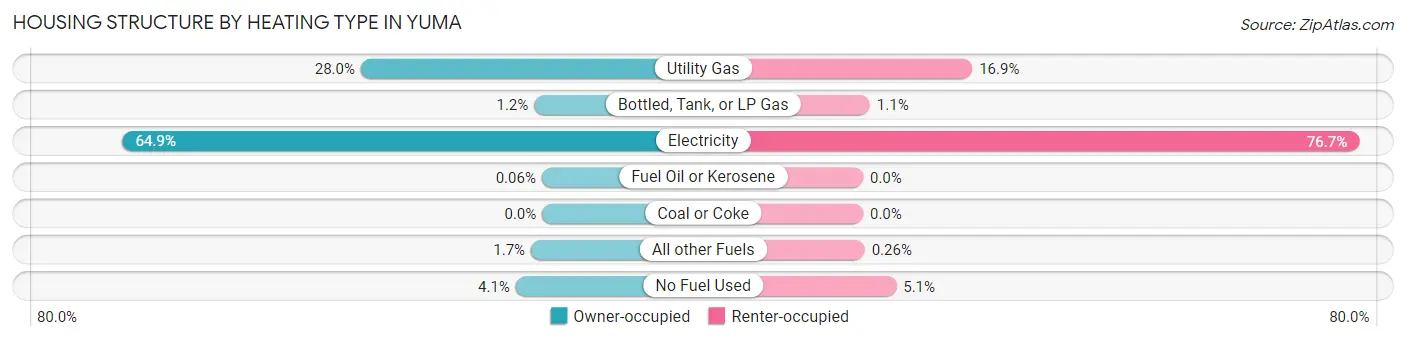
| Heating Type | Owner-occupied | Renter-occupied |
| Utility Gas | 6,541 (28.0%) | 2,186 (16.9%) |
| Bottled, Tank, or LP Gas | 288 (1.2%) | 137 (1.1%) |
| Electricity | 15,138 (64.9%) | 9,928 (76.7%) |
| Fuel Oil or Kerosene | 15 (0.1%) | 0 (0.0%) |
| Coal or Coke | 0 (0.0%) | 0 (0.0%) |
| All other Fuels | 404 (1.7%) | 34 (0.3%) |
| No Fuel Used | 953 (4.1%) | 666 (5.1%) |
| Total | 23,339 (100.0%) | 12,951 (100.0%) |
Household Vehicle Usage in Yuma
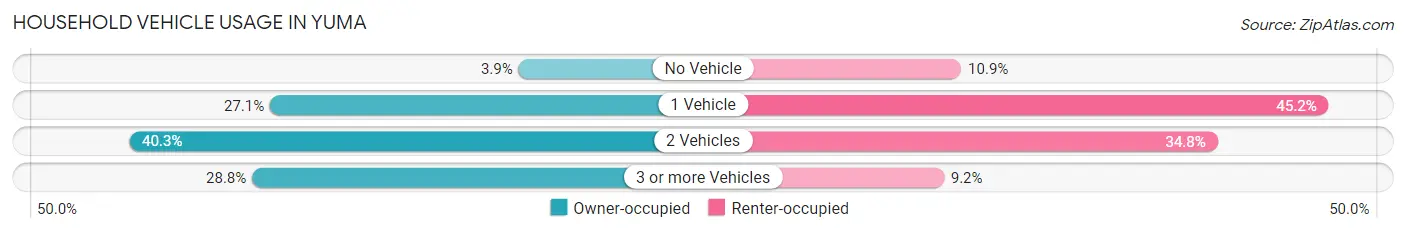
| Vehicles per Household | Owner-occupied | Renter-occupied |
| No Vehicle | 909 (3.9%) | 1,405 (10.8%) |
| 1 Vehicle | 6,322 (27.1%) | 5,847 (45.2%) |
| 2 Vehicles | 9,395 (40.3%) | 4,504 (34.8%) |
| 3 or more Vehicles | 6,713 (28.8%) | 1,195 (9.2%) |
| Total | 23,339 (100.0%) | 12,951 (100.0%) |
Real Estate & Mortgages in Yuma
Real Estate and Mortgage Overview in Yuma
| Characteristic | Without Mortgage | With Mortgage |
| Housing Units | 9,888 | 13,451 |
| Median Property Value | $134,600 | $220,700 |
| Median Household Income | $57,555 | $2,547 |
| Monthly Housing Costs | $423 | $497 |
| Real Estate Taxes | $1,056 | $398 |
Property Value by Mortgage Status in Yuma
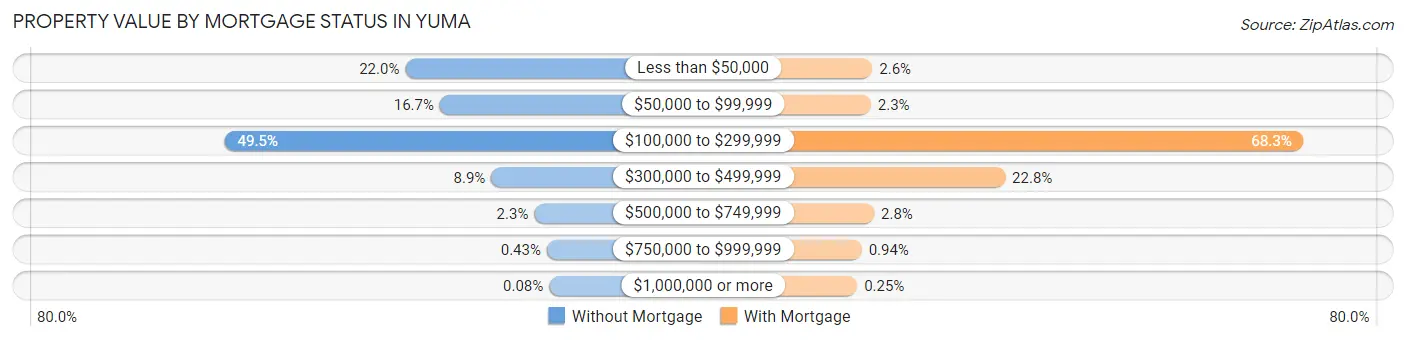
| Property Value | Without Mortgage | With Mortgage |
| Less than $50,000 | 2,175 (22.0%) | 345 (2.6%) |
| $50,000 to $99,999 | 1,654 (16.7%) | 314 (2.3%) |
| $100,000 to $299,999 | 4,897 (49.5%) | 9,185 (68.3%) |
| $300,000 to $499,999 | 880 (8.9%) | 3,067 (22.8%) |
| $500,000 to $749,999 | 231 (2.3%) | 380 (2.8%) |
| $750,000 to $999,999 | 43 (0.4%) | 126 (0.9%) |
| $1,000,000 or more | 8 (0.1%) | 34 (0.3%) |
| Total | 9,888 (100.0%) | 13,451 (100.0%) |
Household Income by Mortgage Status in Yuma
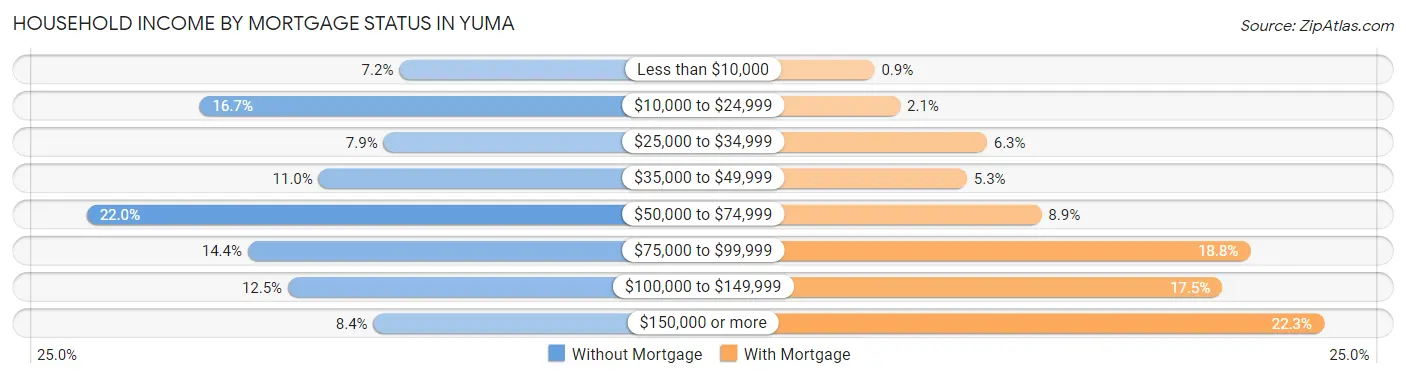
| Household Income | Without Mortgage | With Mortgage |
| Less than $10,000 | 708 (7.2%) | 121 (0.9%) |
| $10,000 to $24,999 | 1,648 (16.7%) | 285 (2.1%) |
| $25,000 to $34,999 | 782 (7.9%) | 841 (6.2%) |
| $35,000 to $49,999 | 1,088 (11.0%) | 713 (5.3%) |
| $50,000 to $74,999 | 2,179 (22.0%) | 1,191 (8.8%) |
| $75,000 to $99,999 | 1,421 (14.4%) | 2,527 (18.8%) |
| $100,000 to $149,999 | 1,232 (12.5%) | 2,348 (17.5%) |
| $150,000 or more | 830 (8.4%) | 2,999 (22.3%) |
| Total | 9,888 (100.0%) | 13,451 (100.0%) |
Property Value to Household Income Ratio in Yuma
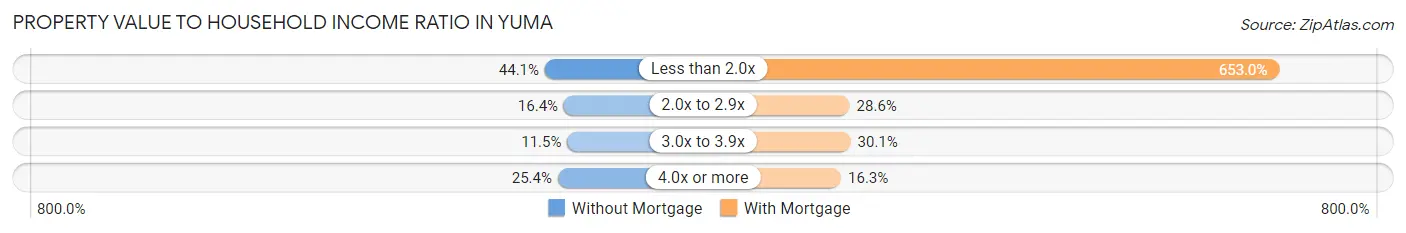
| Value-to-Income Ratio | Without Mortgage | With Mortgage |
| Less than 2.0x | 4,360 (44.1%) | 87,830 (653.0%) |
| 2.0x to 2.9x | 1,625 (16.4%) | 3,852 (28.6%) |
| 3.0x to 3.9x | 1,136 (11.5%) | 4,045 (30.1%) |
| 4.0x or more | 2,507 (25.4%) | 2,189 (16.3%) |
| Total | 9,888 (100.0%) | 13,451 (100.0%) |
Real Estate Taxes by Mortgage Status in Yuma
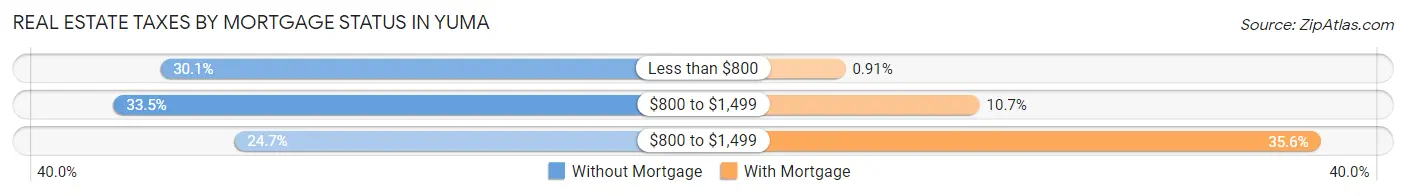
| Property Taxes | Without Mortgage | With Mortgage |
| Less than $800 | 2,975 (30.1%) | 122 (0.9%) |
| $800 to $1,499 | 3,313 (33.5%) | 1,441 (10.7%) |
| $800 to $1,499 | 2,439 (24.7%) | 4,790 (35.6%) |
| Total | 9,888 (100.0%) | 13,451 (100.0%) |
Health & Disability in Yuma
Health Insurance Coverage by Age in Yuma
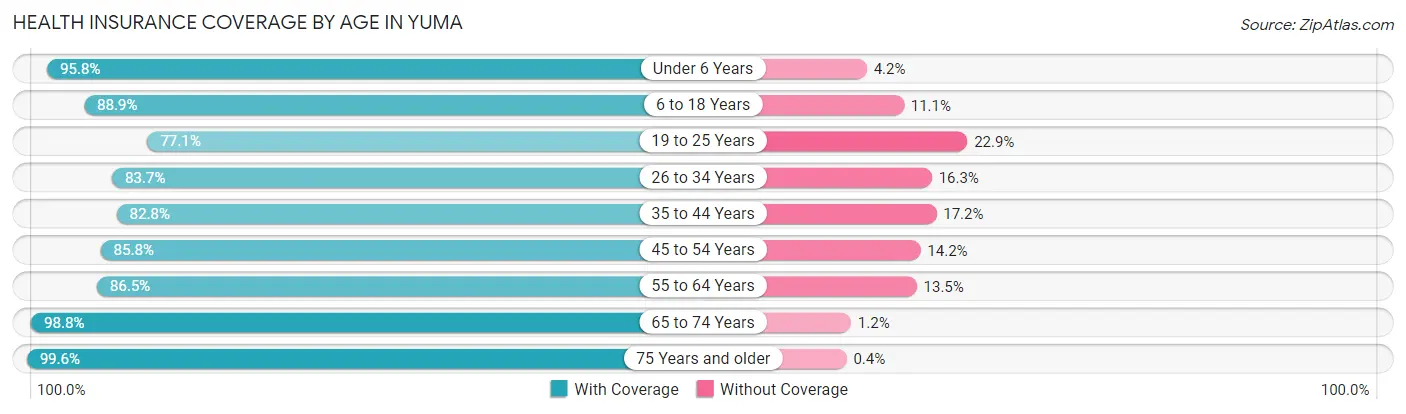
| Age Bracket | With Coverage | Without Coverage |
| Under 6 Years | 8,136 (95.8%) | 355 (4.2%) |
| 6 to 18 Years | 15,737 (88.9%) | 1,964 (11.1%) |
| 19 to 25 Years | 7,743 (77.1%) | 2,302 (22.9%) |
| 26 to 34 Years | 10,309 (83.7%) | 2,007 (16.3%) |
| 35 to 44 Years | 9,259 (82.8%) | 1,918 (17.2%) |
| 45 to 54 Years | 7,122 (85.8%) | 1,178 (14.2%) |
| 55 to 64 Years | 7,426 (86.5%) | 1,158 (13.5%) |
| 65 to 74 Years | 7,571 (98.8%) | 94 (1.2%) |
| 75 Years and older | 7,528 (99.6%) | 30 (0.4%) |
| Total | 80,831 (88.0%) | 11,006 (12.0%) |
Health Insurance Coverage by Citizenship Status in Yuma
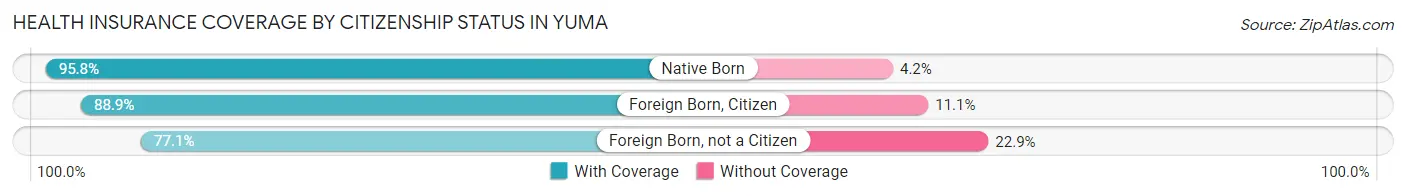
| Citizenship Status | With Coverage | Without Coverage |
| Native Born | 8,136 (95.8%) | 355 (4.2%) |
| Foreign Born, Citizen | 15,737 (88.9%) | 1,964 (11.1%) |
| Foreign Born, not a Citizen | 7,743 (77.1%) | 2,302 (22.9%) |
Health Insurance Coverage by Household Income in Yuma
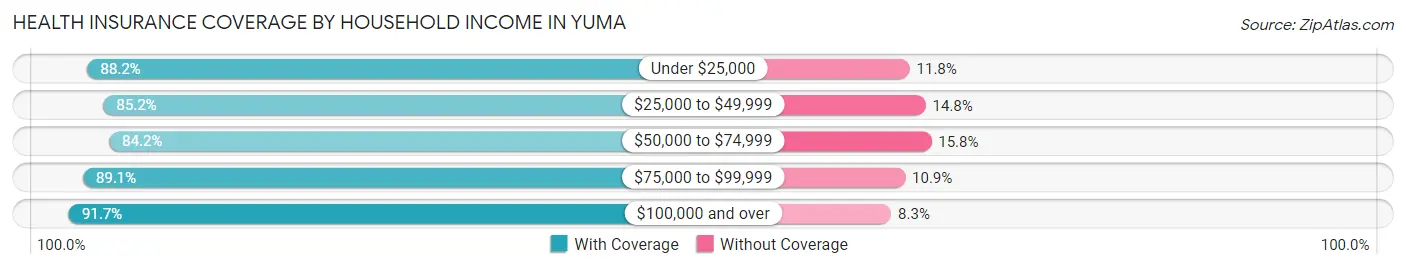
| Household Income | With Coverage | Without Coverage |
| Under $25,000 | 11,617 (88.2%) | 1,549 (11.8%) |
| $25,000 to $49,999 | 15,519 (85.2%) | 2,690 (14.8%) |
| $50,000 to $74,999 | 15,909 (84.2%) | 2,992 (15.8%) |
| $75,000 to $99,999 | 11,638 (89.1%) | 1,426 (10.9%) |
| $100,000 and over | 25,580 (91.7%) | 2,317 (8.3%) |
Public vs Private Health Insurance Coverage by Age in Yuma
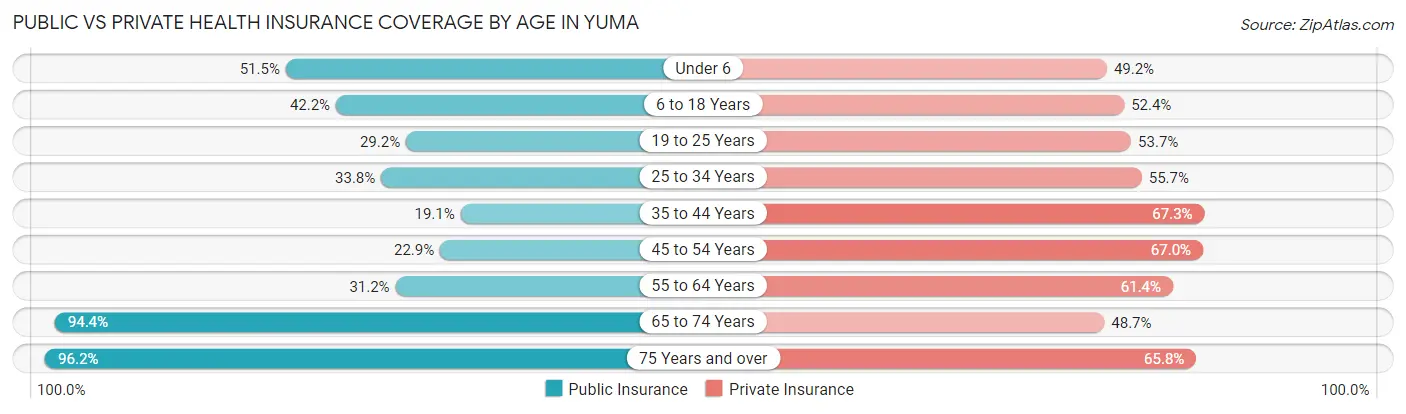
| Age Bracket | Public Insurance | Private Insurance |
| Under 6 | 4,375 (51.5%) | 4,179 (49.2%) |
| 6 to 18 Years | 7,471 (42.2%) | 9,278 (52.4%) |
| 19 to 25 Years | 2,934 (29.2%) | 5,395 (53.7%) |
| 25 to 34 Years | 4,166 (33.8%) | 6,859 (55.7%) |
| 35 to 44 Years | 2,133 (19.1%) | 7,522 (67.3%) |
| 45 to 54 Years | 1,900 (22.9%) | 5,563 (67.0%) |
| 55 to 64 Years | 2,676 (31.2%) | 5,274 (61.4%) |
| 65 to 74 Years | 7,234 (94.4%) | 3,736 (48.7%) |
| 75 Years and over | 7,269 (96.2%) | 4,971 (65.8%) |
| Total | 40,158 (43.7%) | 52,777 (57.5%) |
Disability Status by Sex by Age in Yuma
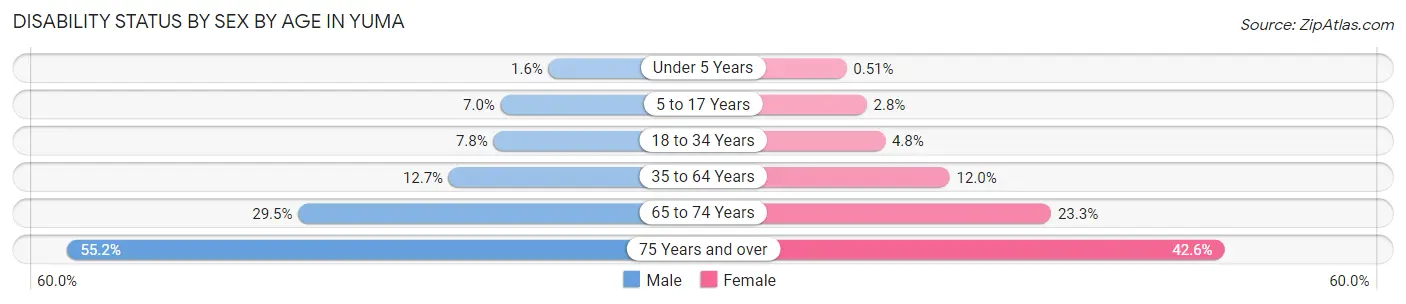
| Age Bracket | Male | Female |
| Under 5 Years | 56 (1.6%) | 19 (0.5%) |
| 5 to 17 Years | 680 (7.0%) | 220 (2.8%) |
| 18 to 34 Years | 923 (7.8%) | 570 (4.8%) |
| 35 to 64 Years | 1,725 (12.7%) | 1,742 (12.0%) |
| 65 to 74 Years | 1,082 (29.5%) | 932 (23.3%) |
| 75 Years and over | 2,051 (55.2%) | 1,638 (42.6%) |
Disability Class by Sex by Age in Yuma
Disability Class: Hearing Difficulty
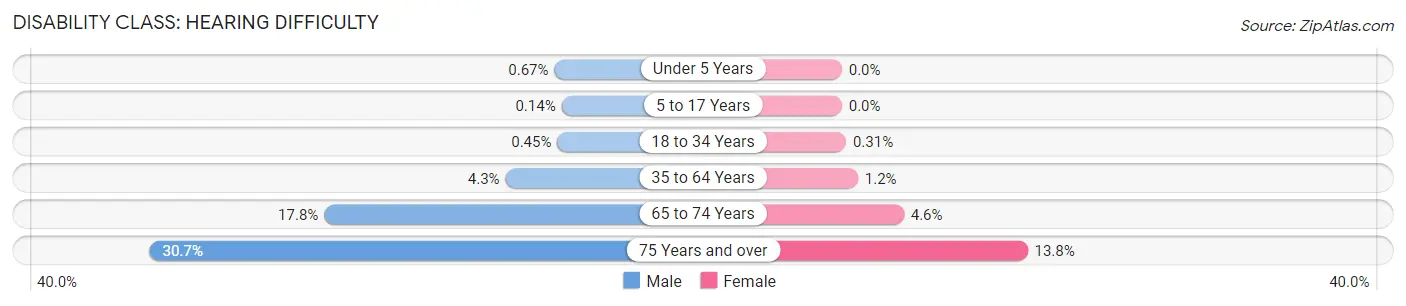
| Age Bracket | Male | Female |
| Under 5 Years | 23 (0.7%) | 0 (0.0%) |
| 5 to 17 Years | 14 (0.1%) | 0 (0.0%) |
| 18 to 34 Years | 53 (0.4%) | 37 (0.3%) |
| 35 to 64 Years | 582 (4.3%) | 173 (1.2%) |
| 65 to 74 Years | 651 (17.8%) | 184 (4.6%) |
| 75 Years and over | 1,141 (30.7%) | 530 (13.8%) |
Disability Class: Vision Difficulty
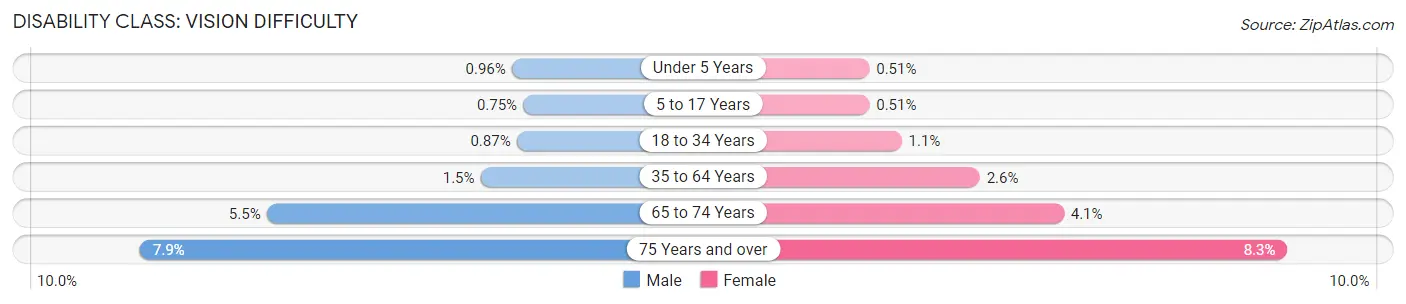
| Age Bracket | Male | Female |
| Under 5 Years | 33 (1.0%) | 19 (0.5%) |
| 5 to 17 Years | 73 (0.7%) | 41 (0.5%) |
| 18 to 34 Years | 103 (0.9%) | 131 (1.1%) |
| 35 to 64 Years | 208 (1.5%) | 371 (2.6%) |
| 65 to 74 Years | 202 (5.5%) | 165 (4.1%) |
| 75 Years and over | 292 (7.9%) | 318 (8.3%) |
Disability Class: Cognitive Difficulty
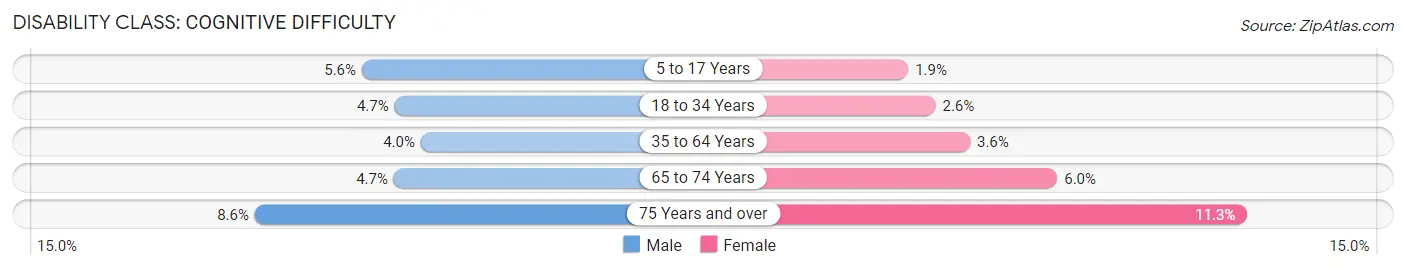
| Age Bracket | Male | Female |
| 5 to 17 Years | 547 (5.6%) | 147 (1.8%) |
| 18 to 34 Years | 559 (4.7%) | 309 (2.6%) |
| 35 to 64 Years | 538 (4.0%) | 519 (3.6%) |
| 65 to 74 Years | 173 (4.7%) | 240 (6.0%) |
| 75 Years and over | 319 (8.6%) | 434 (11.3%) |
Disability Class: Ambulatory Difficulty
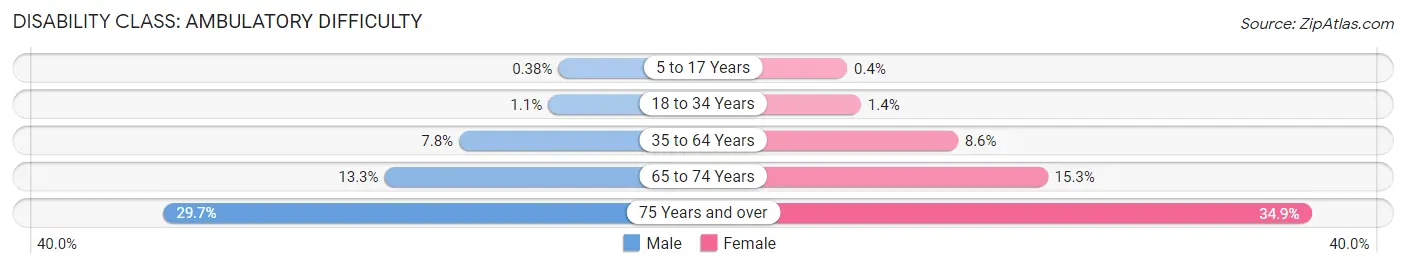
| Age Bracket | Male | Female |
| 5 to 17 Years | 37 (0.4%) | 32 (0.4%) |
| 18 to 34 Years | 135 (1.1%) | 168 (1.4%) |
| 35 to 64 Years | 1,049 (7.7%) | 1,250 (8.6%) |
| 65 to 74 Years | 487 (13.3%) | 611 (15.3%) |
| 75 Years and over | 1,103 (29.7%) | 1,340 (34.9%) |
Disability Class: Self-Care Difficulty
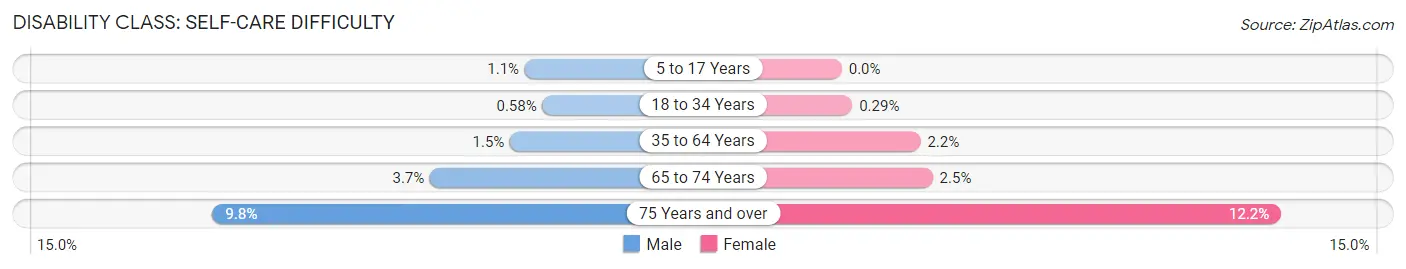
| Age Bracket | Male | Female |
| 5 to 17 Years | 104 (1.1%) | 0 (0.0%) |
| 18 to 34 Years | 69 (0.6%) | 34 (0.3%) |
| 35 to 64 Years | 201 (1.5%) | 318 (2.2%) |
| 65 to 74 Years | 136 (3.7%) | 101 (2.5%) |
| 75 Years and over | 363 (9.8%) | 470 (12.2%) |
Technology Access in Yuma
Computing Device Access in Yuma
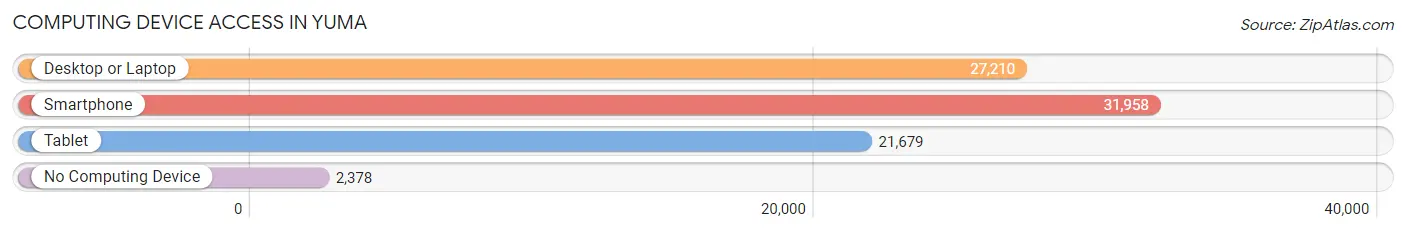
| Device Type | # Households | % Households |
| Desktop or Laptop | 27,210 | 75.0% |
| Smartphone | 31,958 | 88.1% |
| Tablet | 21,679 | 59.7% |
| No Computing Device | 2,378 | 6.6% |
| Total | 36,290 | 100.0% |
Internet Access in Yuma
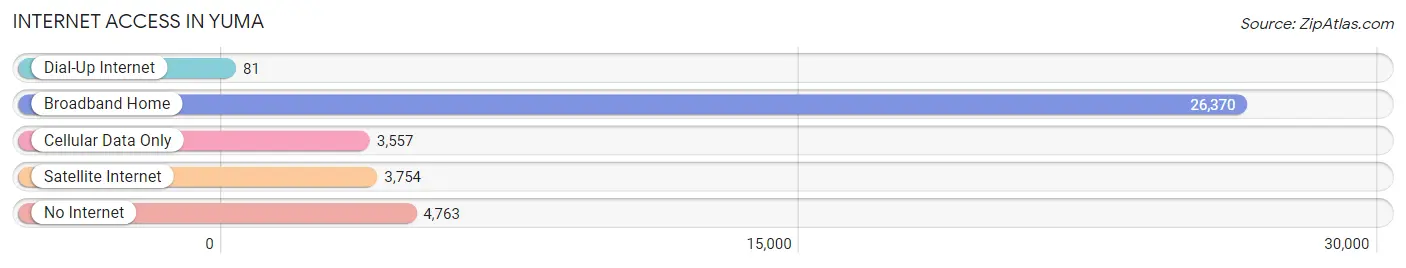
| Internet Type | # Households | % Households |
| Dial-Up Internet | 81 | 0.2% |
| Broadband Home | 26,370 | 72.7% |
| Cellular Data Only | 3,557 | 9.8% |
| Satellite Internet | 3,754 | 10.3% |
| No Internet | 4,763 | 13.1% |
| Total | 36,290 | 100.0% |
Yuma Summary
Yuma, Arizona is a city located in the southwestern corner of the state, near the borders of California and Mexico. It is the county seat of Yuma County and the 11th largest city in Arizona. Yuma is known for its hot and dry climate, making it a popular destination for winter visitors.
History
The area that is now Yuma was first inhabited by the Hohokam people, who lived in the area from around 300 BC to 1450 AD. The Hohokam were a semi-nomadic people who built irrigation canals and constructed dwellings from adobe and stone.
The first Europeans to visit the area were Spanish explorers in the late 1700s. The area was part of Mexico until 1853, when it became part of the United States as part of the Gadsden Purchase.
In 1854, the U.S. Army established Fort Yuma to protect travelers on the Gila River. The fort was abandoned in 1883, but the town of Yuma was established in 1864. The town was named after the Yuma Indians, who lived in the area.
In the late 1800s, Yuma became a popular destination for travelers on the Southern Pacific Railroad. The city was also a major stop on the Butterfield Overland Mail route.
Geography
Yuma is located in the southwestern corner of Arizona, near the borders of California and Mexico. It is situated on the Colorado River, which forms the border between Arizona and California.
The city has a hot desert climate, with hot summers and mild winters. The average high temperature in July is 106°F (41°C), and the average low temperature in January is 43°F (6°C).
Yuma is located in the Sonoran Desert, and the surrounding area is mostly flat and barren. The city is surrounded by mountains, including the Gila Mountains to the east and the Chocolate Mountains to the west.
Economy
Yuma’s economy is largely based on agriculture and tourism. The city is a major producer of winter vegetables, including lettuce, broccoli, and cauliflower. It is also a major producer of cotton, melons, and hay.
Tourism is also an important part of the local economy. Yuma is a popular destination for winter visitors, who come to enjoy the warm weather and outdoor activities. The city is also home to several military bases, which provide jobs and economic activity.
Demographics
As of the 2010 census, Yuma had a population of 93,064. The racial makeup of the city was 68.3% White, 2.2% African American, 0.9% Native American, 1.7% Asian, 0.1% Pacific Islander, 24.3% from other races, and 2.5% from two or more races. Hispanic or Latino of any race were 53.2% of the population.
Yuma is a culturally diverse city, with a large Hispanic population. The city is also home to a large Native American population, including the Cocopah, Quechan, and Yuma tribes.
Conclusion
Yuma, Arizona is a city located in the southwestern corner of the state, near the borders of California and Mexico. It is the county seat of Yuma County and the 11th largest city in Arizona. Yuma is known for its hot and dry climate, making it a popular destination for winter visitors. The area was first inhabited by the Hohokam people, and was part of Mexico until 1853. The city has a hot desert climate, and its economy is largely based on agriculture and tourism. Yuma is a culturally diverse city, with a large Hispanic population and a large Native American population.
Common Questions
What is Per Capita Income in Yuma?
Per Capita income in Yuma is $30,841.
What is the Median Family Income in Yuma?
Median Family Income in Yuma is $66,788.
What is the Median Household income in Yuma?
Median Household Income in Yuma is $59,312.
What is Income or Wage Gap in Yuma?
Income or Wage Gap in Yuma is 29.4%.
Women in Yuma earn 70.6 cents for every dollar earned by a man.
What is Family Income Deficit in Yuma?
Family Income Deficit in Yuma is $11,513.
Families that are below poverty line in Yuma earn $11,513 less on average than the poverty threshold level.
What is Inequality or Gini Index in Yuma?
Inequality or Gini Index in Yuma is 0.46.
What is the Total Population of Yuma?
Total Population of Yuma is 96,314.
What is the Total Male Population of Yuma?
Total Male Population of Yuma is 49,897.
What is the Total Female Population of Yuma?
Total Female Population of Yuma is 46,417.
What is the Ratio of Males per 100 Females in Yuma?
There are 107.50 Males per 100 Females in Yuma.
What is the Ratio of Females per 100 Males in Yuma?
There are 93.03 Females per 100 Males in Yuma.
What is the Median Population Age in Yuma?
Median Population Age in Yuma is 32.0 Years.
What is the Average Family Size in Yuma
Average Family Size in Yuma is 3.0 People.
What is the Average Household Size in Yuma
Average Household Size in Yuma is 2.6 People.
How Large is the Labor Force in Yuma?
There are 45,327 People in the Labor Forcein in Yuma.
What is the Percentage of People in the Labor Force in Yuma?
61.0% of People are in the Labor Force in Yuma.
What is the Unemployment Rate in Yuma?
Unemployment Rate in Yuma is 7.7%.