Chinle, AZ Map & Demographics
Chinle Map
Chinle Overview
$21,035
PER CAPITA INCOME
$42,589
AVG FAMILY INCOME
$44,821
AVG HOUSEHOLD INCOME
48.6%
WAGE / INCOME GAP [ % ]
51.4¢/ $1
WAGE / INCOME GAP [ $ ]
$16,663
FAMILY INCOME DEFICIT
0.51
INEQUALITY / GINI INDEX
3,888
TOTAL POPULATION
1,868
MALE POPULATION
2,020
FEMALE POPULATION
92.48
MALES / 100 FEMALES
108.14
FEMALES / 100 MALES
32.3
MEDIAN AGE
4.6
AVG FAMILY SIZE
3.3
AVG HOUSEHOLD SIZE
1,261
LABOR FORCE [ PEOPLE ]
44.4%
PERCENT IN LABOR FORCE
11.4%
UNEMPLOYMENT RATE
Chinle Zip Codes
Chinle Area Codes
Income in Chinle
Income Overview in Chinle
Per Capita Income in Chinle is $21,035, while median incomes of families and households are $42,589 and $44,821 respectively.
| Characteristic | Number | Measure |
| Per Capita Income | 3,888 | $21,035 |
| Median Family Income | 710 | $42,589 |
| Mean Family Income | 710 | $53,685 |
| Median Household Income | 1,118 | $44,821 |
| Mean Household Income | 1,118 | $59,940 |
| Income Deficit | 710 | $16,663 |
| Wage / Income Gap (%) | 3,888 | 48.65% |
| Wage / Income Gap ($) | 3,888 | 51.35¢ per $1 |
| Gini / Inequality Index | 3,888 | 0.51 |
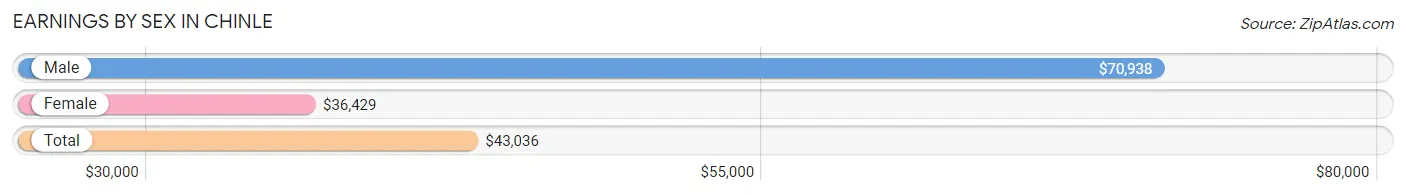
Earnings by Sex in Chinle
Average Earnings in Chinle are $43,036, $70,938 for men and $36,429 for women, a difference of 48.6%.
| Sex | Number | Average Earnings |
| Male | 536 (47.3%) | $70,938 |
| Female | 596 (52.6%) | $36,429 |
| Total | 1,132 (100.0%) | $43,036 |
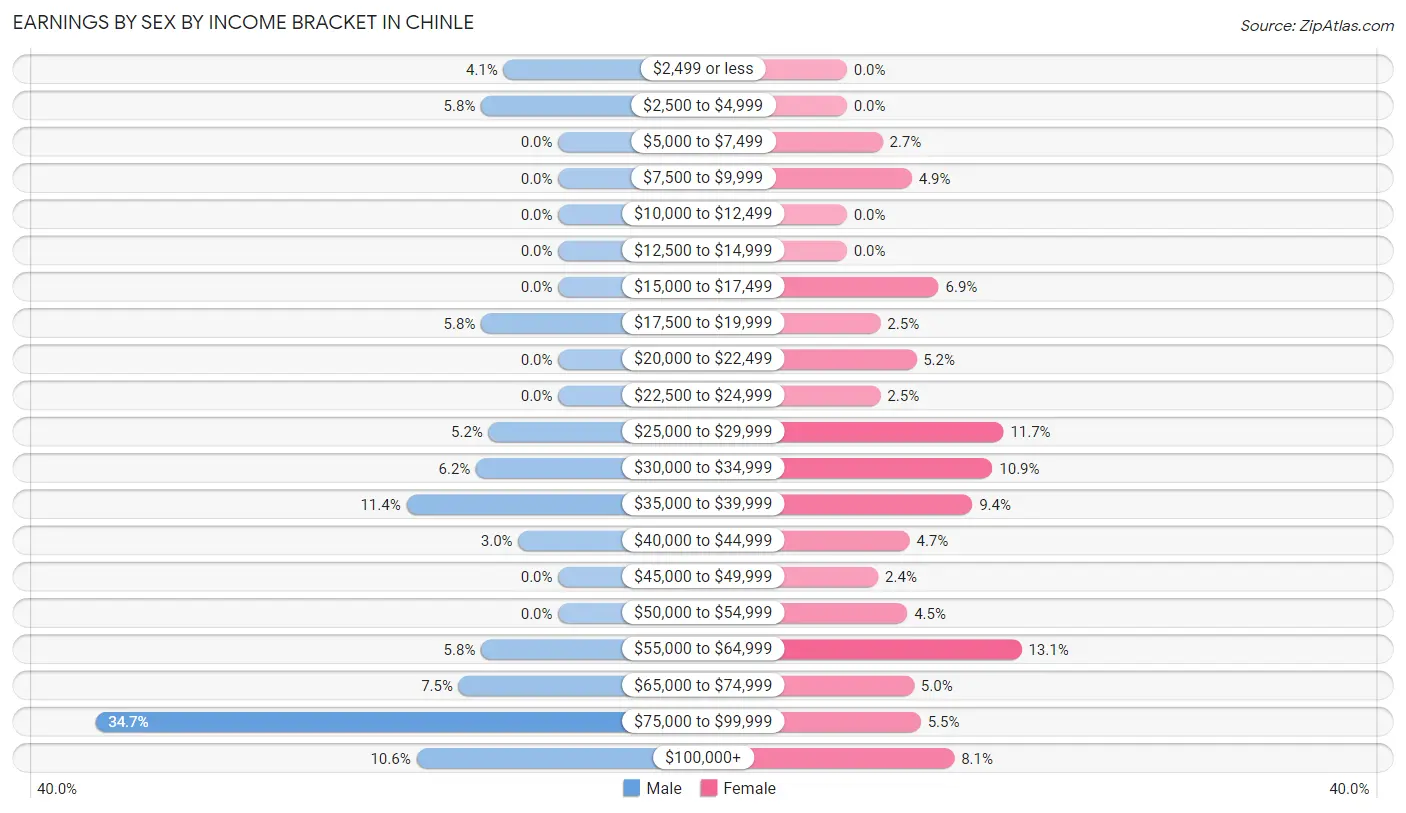
Earnings by Sex by Income Bracket in Chinle
The most common earnings brackets in Chinle are $75,000 to $99,999 for men (186 | 34.7%) and $55,000 to $64,999 for women (78 | 13.1%).
| Income | Male | Female |
| $2,499 or less | 22 (4.1%) | 0 (0.0%) |
| $2,500 to $4,999 | 31 (5.8%) | 0 (0.0%) |
| $5,000 to $7,499 | 0 (0.0%) | 16 (2.7%) |
| $7,500 to $9,999 | 0 (0.0%) | 29 (4.9%) |
| $10,000 to $12,499 | 0 (0.0%) | 0 (0.0%) |
| $12,500 to $14,999 | 0 (0.0%) | 0 (0.0%) |
| $15,000 to $17,499 | 0 (0.0%) | 41 (6.9%) |
| $17,500 to $19,999 | 31 (5.8%) | 15 (2.5%) |
| $20,000 to $22,499 | 0 (0.0%) | 31 (5.2%) |
| $22,500 to $24,999 | 0 (0.0%) | 15 (2.5%) |
| $25,000 to $29,999 | 28 (5.2%) | 70 (11.7%) |
| $30,000 to $34,999 | 33 (6.2%) | 65 (10.9%) |
| $35,000 to $39,999 | 61 (11.4%) | 56 (9.4%) |
| $40,000 to $44,999 | 16 (3.0%) | 28 (4.7%) |
| $45,000 to $49,999 | 0 (0.0%) | 14 (2.4%) |
| $50,000 to $54,999 | 0 (0.0%) | 27 (4.5%) |
| $55,000 to $64,999 | 31 (5.8%) | 78 (13.1%) |
| $65,000 to $74,999 | 40 (7.5%) | 30 (5.0%) |
| $75,000 to $99,999 | 186 (34.7%) | 33 (5.5%) |
| $100,000+ | 57 (10.6%) | 48 (8.1%) |
| Total | 536 (100.0%) | 596 (100.0%) |
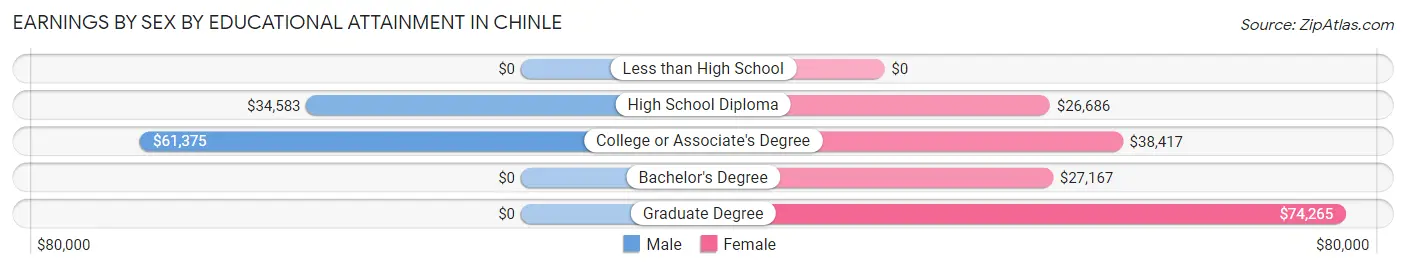
Earnings by Sex by Educational Attainment in Chinle
Average earnings in Chinle are $70,031 for men and $38,973 for women, a difference of 44.4%. Men with an educational attainment of college or associate's degree enjoy the highest average annual earnings of $61,375, while those with high school diploma education earn the least with $34,583. Women with an educational attainment of graduate degree earn the most with the average annual earnings of $74,265, while those with high school diploma education have the smallest earnings of $26,686.
| Educational Attainment | Male Income | Female Income |
| Less than High School | - | - |
| High School Diploma | $34,583 | $26,686 |
| College or Associate's Degree | $61,375 | $38,417 |
| Bachelor's Degree | - | - |
| Graduate Degree | - | - |
| Total | $70,031 | $38,973 |
Family Income in Chinle
Family Income Brackets in Chinle
According to the Chinle family income data, there are 160 families falling into the less than $10,000 income range, which is the most common income bracket and makes up 22.5% of all families. Conversely, the $200,000+ income bracket is the least frequent group with only 19 families (2.7%) belonging to this category.
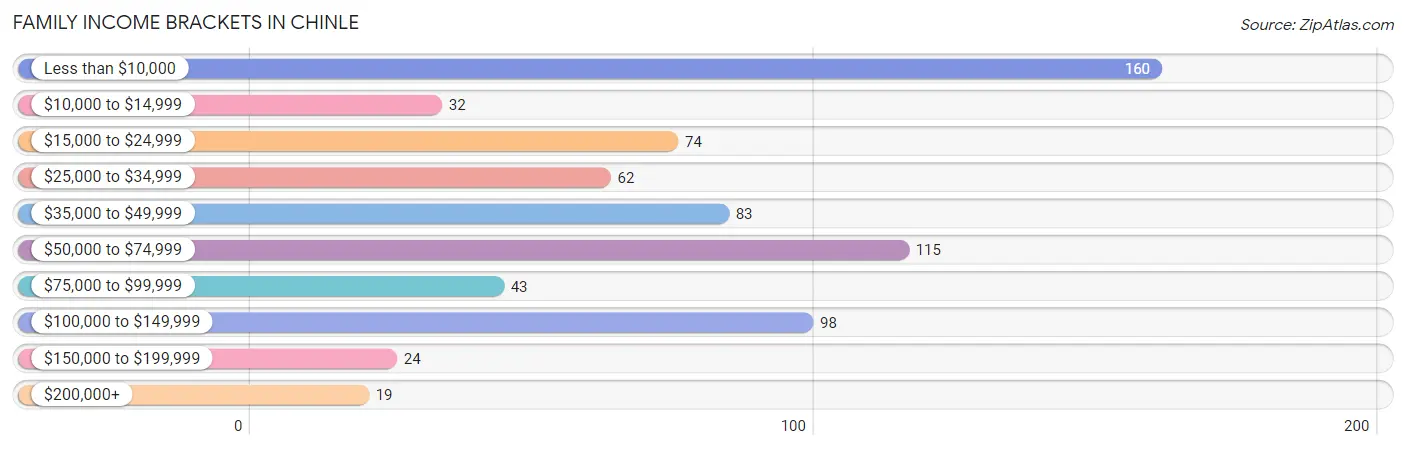
| Income Bracket | # Families | % Families |
| Less than $10,000 | 160 | 22.5% |
| $10,000 to $14,999 | 32 | 4.5% |
| $15,000 to $24,999 | 74 | 10.4% |
| $25,000 to $34,999 | 62 | 8.7% |
| $35,000 to $49,999 | 83 | 11.7% |
| $50,000 to $74,999 | 115 | 16.2% |
| $75,000 to $99,999 | 43 | 6.1% |
| $100,000 to $149,999 | 98 | 13.8% |
| $150,000 to $199,999 | 24 | 3.4% |
| $200,000+ | 19 | 2.7% |
Family Income by Famaliy Size in Chinle
6-person families (43 | 6.1%) account for the highest median family income in Chinle with $111,328 per family, while 2-person families (252 | 35.5%) have the highest median income of $23,104 per family member.
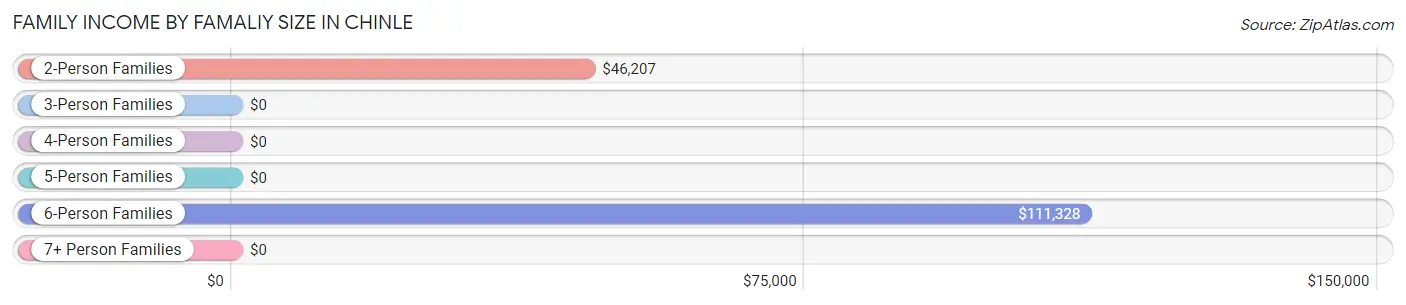
| Income Bracket | # Families | Median Income |
| 2-Person Families | 252 (35.5%) | $46,207 |
| 3-Person Families | 131 (18.4%) | $0 |
| 4-Person Families | 219 (30.8%) | $0 |
| 5-Person Families | 34 (4.8%) | $0 |
| 6-Person Families | 43 (6.1%) | $111,328 |
| 7+ Person Families | 31 (4.4%) | $0 |
| Total | 710 (100.0%) | $42,589 |
Family Income by Number of Earners in Chinle
The median family income in Chinle is $42,589, with families comprising 3+ earners (44) having the highest median family income of $128,571, while families with no earners (260) have the lowest median family income of $6,161, accounting for 6.2% and 36.6% of families, respectively.
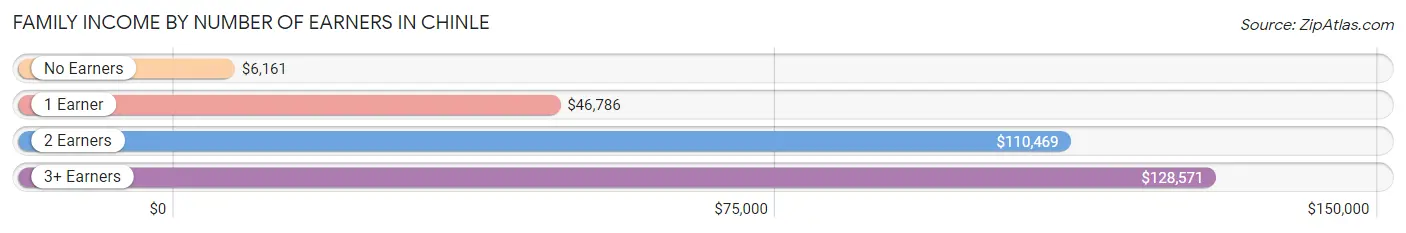
| Number of Earners | # Families | Median Income |
| No Earners | 260 (36.6%) | $6,161 |
| 1 Earner | 318 (44.8%) | $46,786 |
| 2 Earners | 88 (12.4%) | $110,469 |
| 3+ Earners | 44 (6.2%) | $128,571 |
| Total | 710 (100.0%) | $42,589 |
Household Income in Chinle
Household Income Brackets in Chinle
With 233 households falling in the category, the less than $10,000 income range is the most frequent in Chinle, accounting for 20.8% of all households. In contrast, only 32 households (2.9%) fall into the $10,000 to $14,999 income bracket, making it the least populous group.
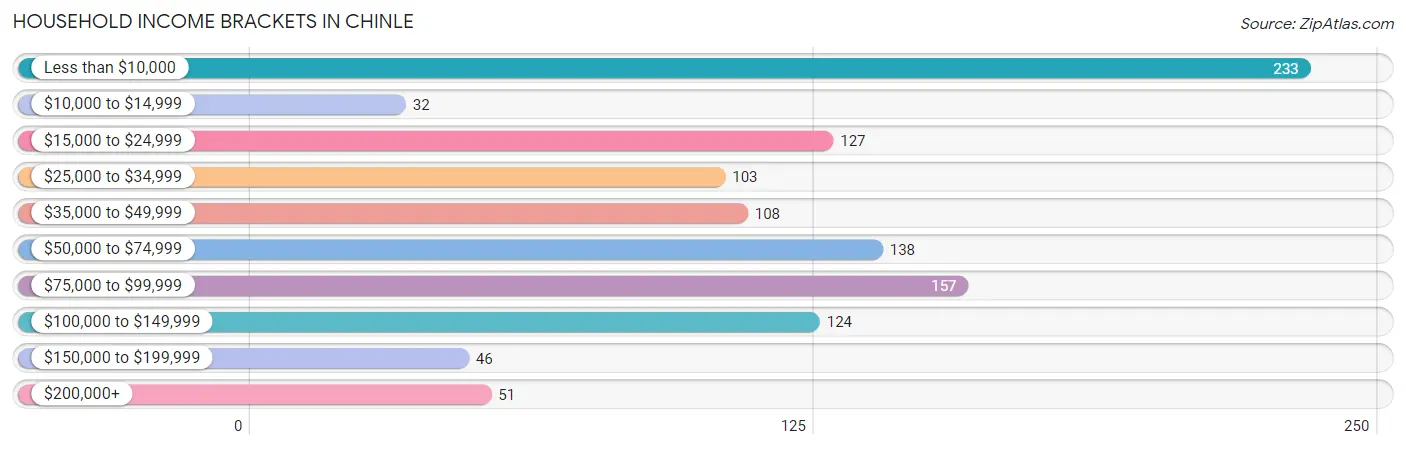
| Income Bracket | # Households | % Households |
| Less than $10,000 | 233 | 20.8% |
| $10,000 to $14,999 | 32 | 2.9% |
| $15,000 to $24,999 | 127 | 11.4% |
| $25,000 to $34,999 | 103 | 9.2% |
| $35,000 to $49,999 | 108 | 9.7% |
| $50,000 to $74,999 | 138 | 12.3% |
| $75,000 to $99,999 | 157 | 14.0% |
| $100,000 to $149,999 | 124 | 11.1% |
| $150,000 to $199,999 | 46 | 4.1% |
| $200,000+ | 51 | 4.6% |
Household Income by Householder Age in Chinle
The median household income in Chinle is $44,821, with the highest median household income of $53,250 found in the 45 to 64 years age bracket for the primary householder. A total of 485 households (43.4%) fall into this category.
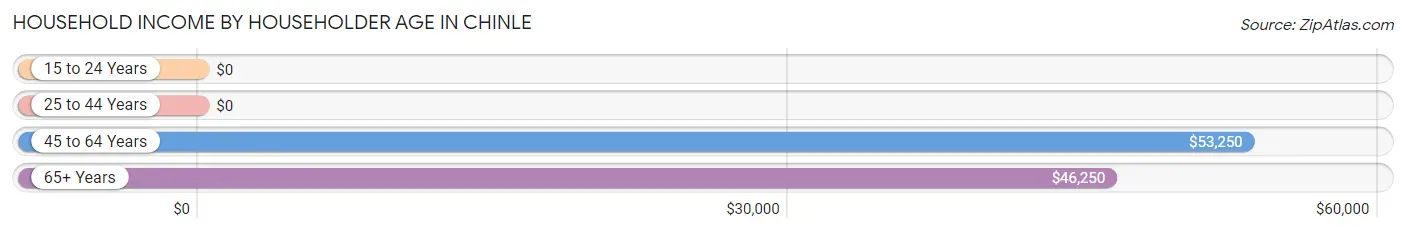
| Income Bracket | # Households | Median Income |
| 15 to 24 Years | 0 (0.0%) | $0 |
| 25 to 44 Years | 413 (36.9%) | $0 |
| 45 to 64 Years | 485 (43.4%) | $53,250 |
| 65+ Years | 220 (19.7%) | $46,250 |
| Total | 1,118 (100.0%) | $44,821 |
Poverty in Chinle
Income Below Poverty by Sex and Age in Chinle
With 38.5% poverty level for males and 44.7% for females among the residents of Chinle, under 5 year old males and 5 year old females are the most vulnerable to poverty, with 109 males (85.8%) and 25 females (100.0%) in their respective age groups living below the poverty level.
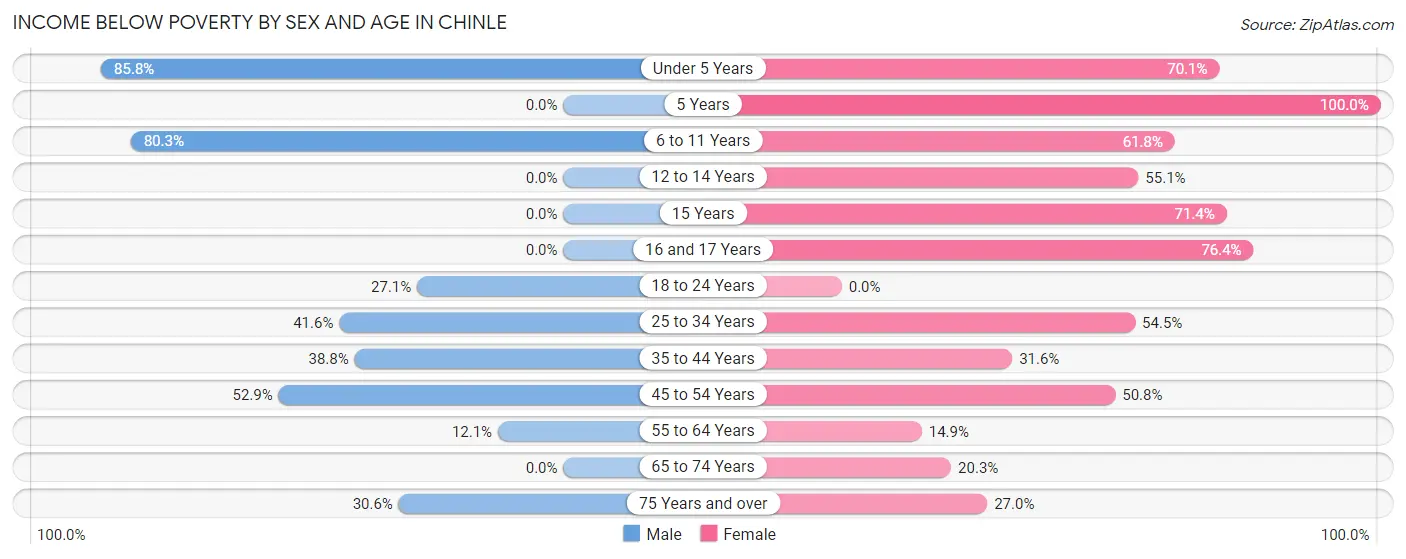
| Age Bracket | Male | Female |
| Under 5 Years | 109 (85.8%) | 89 (70.1%) |
| 5 Years | 0 (0.0%) | 25 (100.0%) |
| 6 to 11 Years | 167 (80.3%) | 191 (61.8%) |
| 12 to 14 Years | 0 (0.0%) | 49 (55.1%) |
| 15 Years | 0 (0.0%) | 50 (71.4%) |
| 16 and 17 Years | 0 (0.0%) | 68 (76.4%) |
| 18 to 24 Years | 57 (27.1%) | 0 (0.0%) |
| 25 to 34 Years | 99 (41.6%) | 104 (54.4%) |
| 35 to 44 Years | 131 (38.8%) | 62 (31.6%) |
| 45 to 54 Years | 92 (52.9%) | 164 (50.8%) |
| 55 to 64 Years | 17 (12.1%) | 30 (14.8%) |
| 65 to 74 Years | 0 (0.0%) | 27 (20.3%) |
| 75 Years and over | 11 (30.6%) | 27 (27.0%) |
| Total | 683 (38.5%) | 886 (44.7%) |
Income Above Poverty by Sex and Age in Chinle
According to the poverty statistics in Chinle, males aged 12 to 14 years and females aged 18 to 24 years are the age groups that are most secure financially, with 100.0% of males and 100.0% of females in these age groups living above the poverty line.
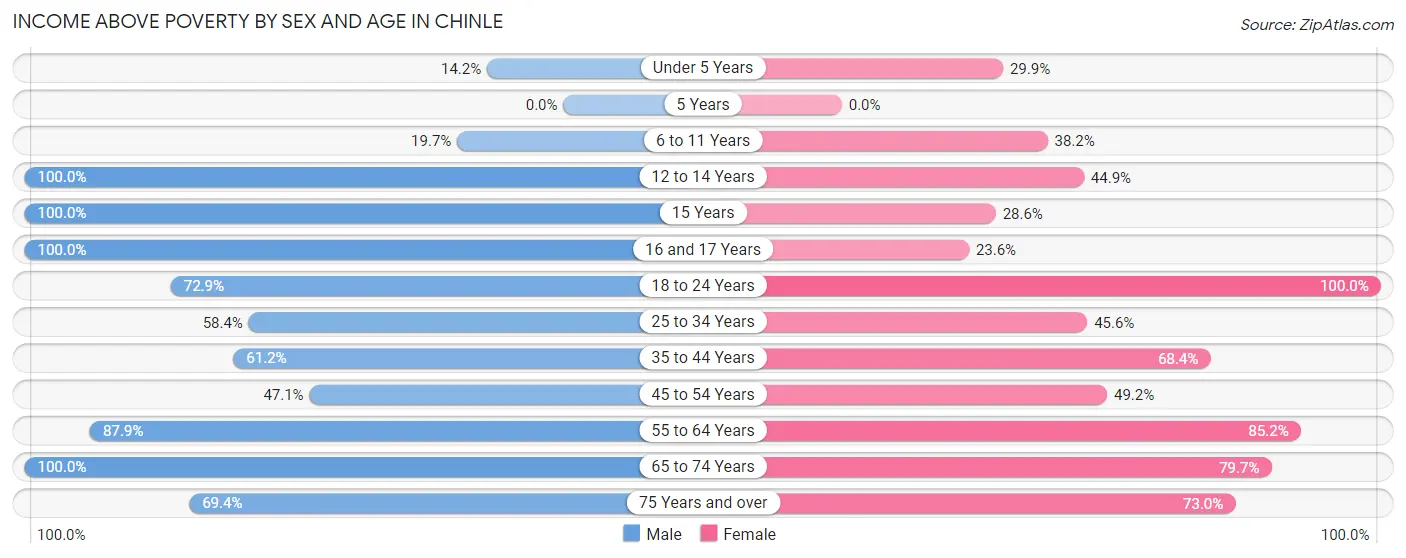
| Age Bracket | Male | Female |
| Under 5 Years | 18 (14.2%) | 38 (29.9%) |
| 5 Years | 0 (0.0%) | 0 (0.0%) |
| 6 to 11 Years | 41 (19.7%) | 118 (38.2%) |
| 12 to 14 Years | 62 (100.0%) | 40 (44.9%) |
| 15 Years | 18 (100.0%) | 20 (28.6%) |
| 16 and 17 Years | 148 (100.0%) | 21 (23.6%) |
| 18 to 24 Years | 153 (72.9%) | 128 (100.0%) |
| 25 to 34 Years | 139 (58.4%) | 87 (45.6%) |
| 35 to 44 Years | 207 (61.2%) | 134 (68.4%) |
| 45 to 54 Years | 82 (47.1%) | 159 (49.2%) |
| 55 to 64 Years | 123 (87.9%) | 172 (85.2%) |
| 65 to 74 Years | 76 (100.0%) | 106 (79.7%) |
| 75 Years and over | 25 (69.4%) | 73 (73.0%) |
| Total | 1,092 (61.5%) | 1,096 (55.3%) |
Income Below Poverty Among Married-Couple Families in Chinle
The poverty statistics for married-couple families in Chinle show that 32.0% or 120 of the total 375 families live below the poverty line. Families with 1 or 2 children have the highest poverty rate of 65.7%, comprising of 90 families. On the other hand, families with no children have the lowest poverty rate of 7.8%, which includes 15 families.
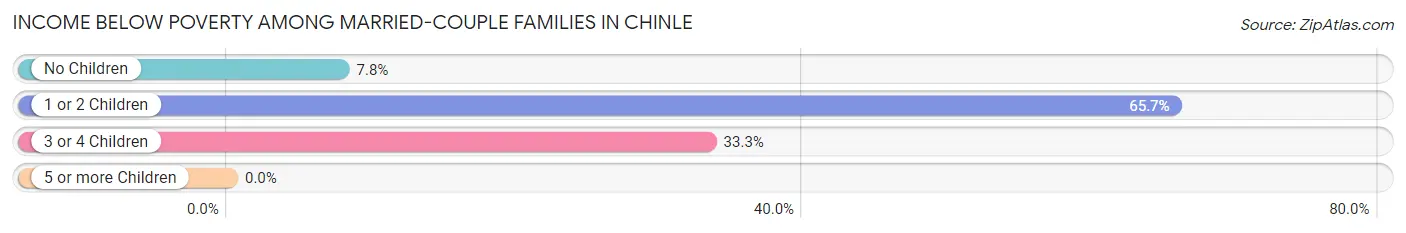
| Children | Above Poverty | Below Poverty |
| No Children | 178 (92.2%) | 15 (7.8%) |
| 1 or 2 Children | 47 (34.3%) | 90 (65.7%) |
| 3 or 4 Children | 30 (66.7%) | 15 (33.3%) |
| 5 or more Children | 0 (0.0%) | 0 (0.0%) |
| Total | 255 (68.0%) | 120 (32.0%) |
Income Below Poverty Among Single-Parent Households in Chinle
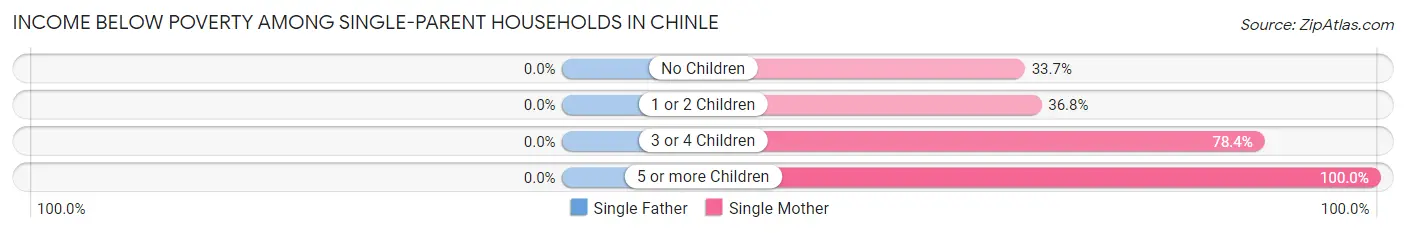
| Children | Single Father | Single Mother |
| No Children | 0 (0.0%) | 28 (33.7%) |
| 1 or 2 Children | 0 (0.0%) | 60 (36.8%) |
| 3 or 4 Children | 0 (0.0%) | 58 (78.4%) |
| 5 or more Children | 0 (0.0%) | 15 (100.0%) |
| Total | 0 (0.0%) | 161 (48.1%) |
Income Below Poverty Among Married-Couple vs Single-Parent Households in Chinle
The poverty data for Chinle shows that 120 of the married-couple family households (32.0%) and 161 of the single-parent households (48.1%) are living below the poverty level. Within the married-couple family households, those with 1 or 2 children have the highest poverty rate, with 90 households (65.7%) falling below the poverty line. Among the single-parent households, those with 5 or more children have the highest poverty rate, with 15 household (100.0%) living below poverty.
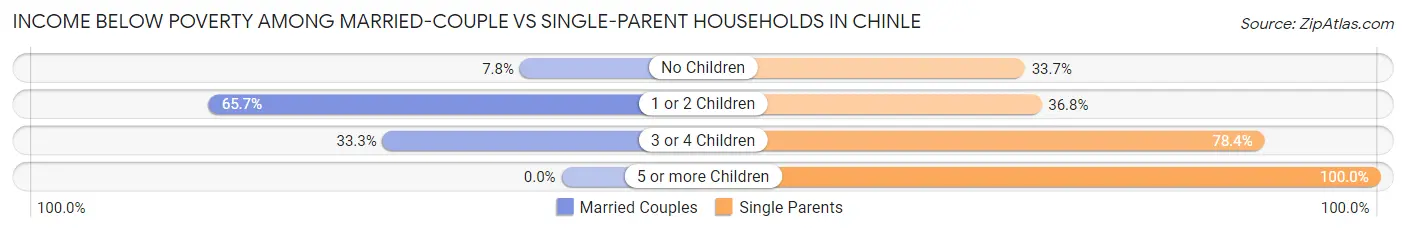
| Children | Married-Couple Families | Single-Parent Households |
| No Children | 15 (7.8%) | 28 (33.7%) |
| 1 or 2 Children | 90 (65.7%) | 60 (36.8%) |
| 3 or 4 Children | 15 (33.3%) | 58 (78.4%) |
| 5 or more Children | 0 (0.0%) | 15 (100.0%) |
| Total | 120 (32.0%) | 161 (48.1%) |
Race in Chinle
The most populous races in Chinle are Native / Alaskan (3,521 | 90.6%), White / Caucasian (138 | 3.5%), and Asian (105 | 2.7%).
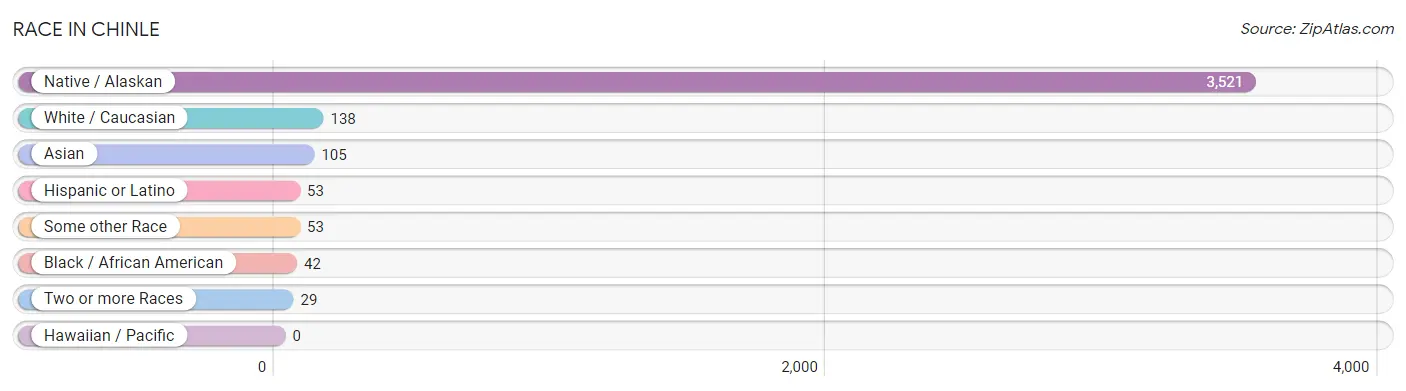
| Race | # Population | % Population |
| Asian | 105 | 2.7% |
| Black / African American | 42 | 1.1% |
| Hawaiian / Pacific | 0 | 0.0% |
| Hispanic or Latino | 53 | 1.4% |
| Native / Alaskan | 3,521 | 90.6% |
| White / Caucasian | 138 | 3.5% |
| Two or more Races | 29 | 0.7% |
| Some other Race | 53 | 1.4% |
| Total | 3,888 | 100.0% |
Ancestry in Chinle
The most populous ancestries reported in Chinle are Navajo (3,443 | 88.5%), Korean (105 | 2.7%), Pueblo (100 | 2.6%), Tohono O'Odham (51 | 1.3%), and Mexican (39 | 1.0%), together accounting for 96.1% of all Chinle residents.
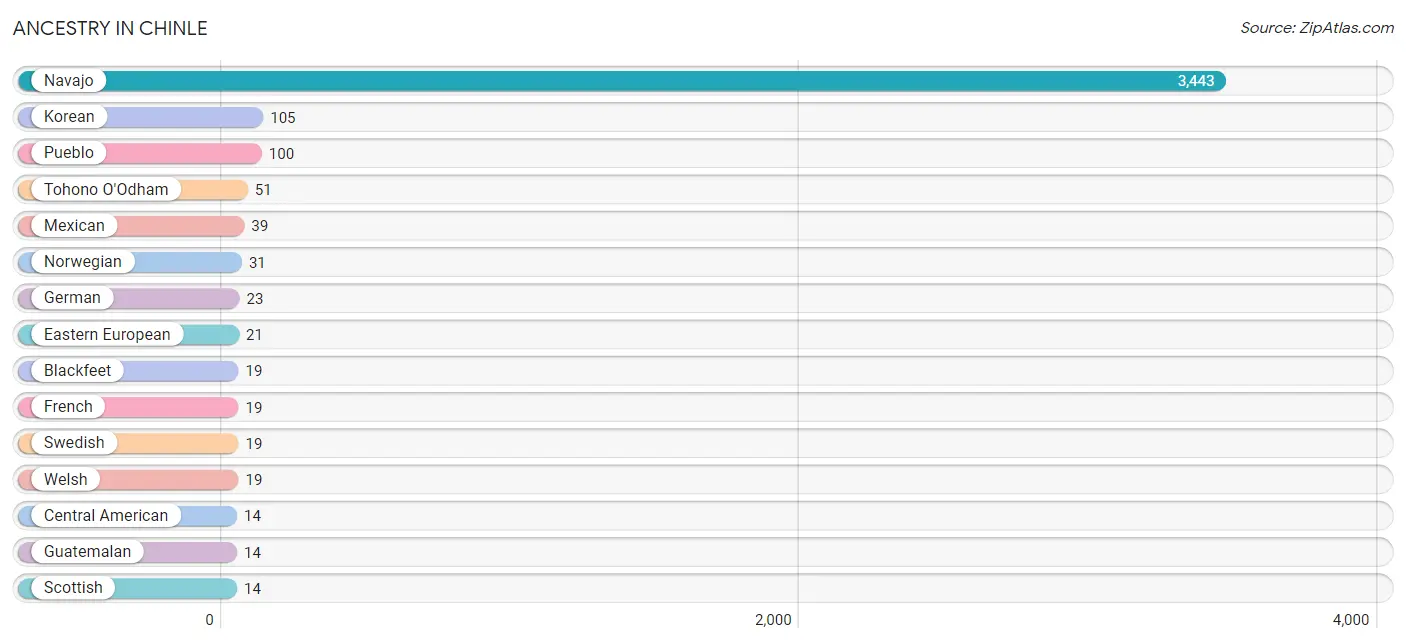
| Ancestry | # Population | % Population |
| Blackfeet | 19 | 0.5% |
| Central American | 14 | 0.4% |
| Cherokee | 2 | 0.1% |
| Eastern European | 21 | 0.5% |
| French | 19 | 0.5% |
| German | 23 | 0.6% |
| Guatemalan | 14 | 0.4% |
| Indian (Asian) | 8 | 0.2% |
| Irish | 3 | 0.1% |
| Italian | 1 | 0.0% |
| Korean | 105 | 2.7% |
| Mexican | 39 | 1.0% |
| Navajo | 3,443 | 88.5% |
| Norwegian | 31 | 0.8% |
| Pueblo | 100 | 2.6% |
| Scottish | 14 | 0.4% |
| Swedish | 19 | 0.5% |
| Tohono O'Odham | 51 | 1.3% |
| Welsh | 19 | 0.5% |
| Yuman | 14 | 0.4% | View All 20 Rows |
Immigrants in Chinle
The most numerous immigrant groups reported in Chinle came from Asia (105 | 2.7%), Philippines (105 | 2.7%), South Eastern Asia (105 | 2.7%), Central America (39 | 1.0%), and Latin America (39 | 1.0%), together accounting for 10.1% of all Chinle residents.
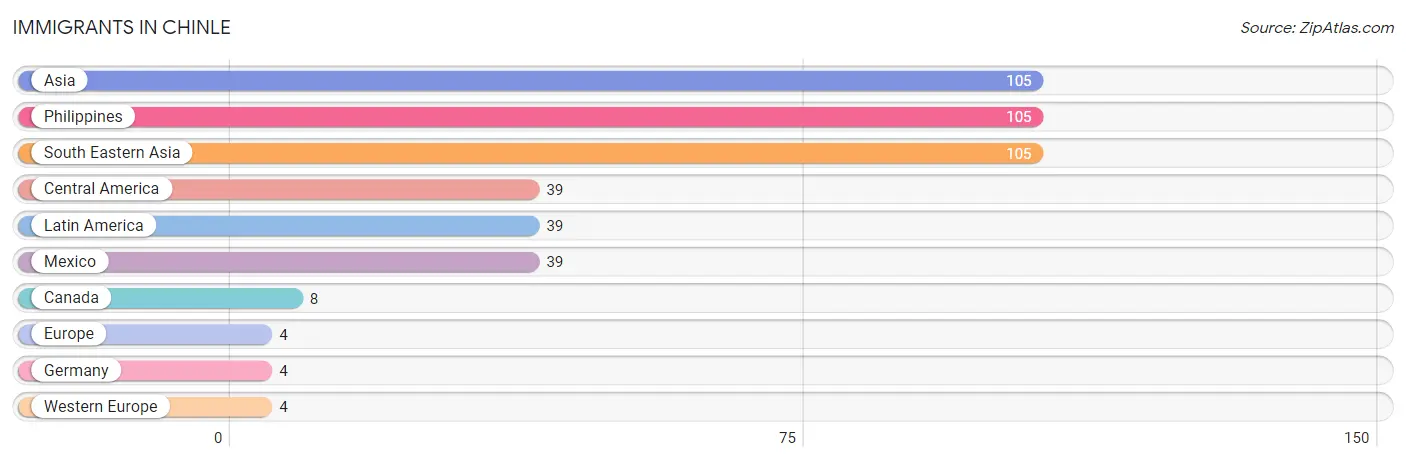
| Immigration Origin | # Population | % Population |
| Asia | 105 | 2.7% |
| Canada | 8 | 0.2% |
| Central America | 39 | 1.0% |
| Europe | 4 | 0.1% |
| Germany | 4 | 0.1% |
| Latin America | 39 | 1.0% |
| Mexico | 39 | 1.0% |
| Philippines | 105 | 2.7% |
| South Eastern Asia | 105 | 2.7% |
| Western Europe | 4 | 0.1% | View All 10 Rows |
Sex and Age in Chinle
Sex and Age in Chinle
The most populous age groups in Chinle are 35 to 39 Years (299 | 16.0%) for men and 5 to 9 Years (262 | 13.0%) for women.
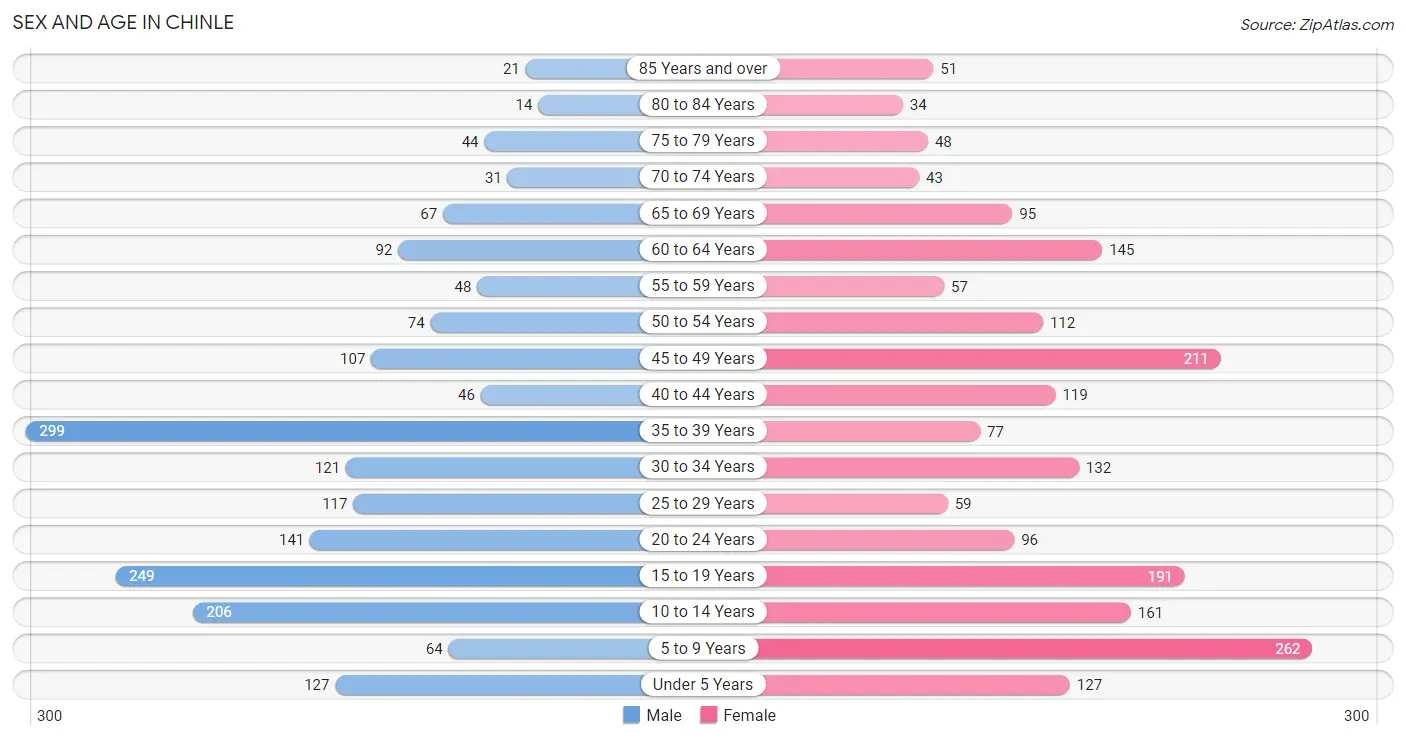
| Age Bracket | Male | Female |
| Under 5 Years | 127 (6.8%) | 127 (6.3%) |
| 5 to 9 Years | 64 (3.4%) | 262 (13.0%) |
| 10 to 14 Years | 206 (11.0%) | 161 (8.0%) |
| 15 to 19 Years | 249 (13.3%) | 191 (9.5%) |
| 20 to 24 Years | 141 (7.5%) | 96 (4.8%) |
| 25 to 29 Years | 117 (6.3%) | 59 (2.9%) |
| 30 to 34 Years | 121 (6.5%) | 132 (6.5%) |
| 35 to 39 Years | 299 (16.0%) | 77 (3.8%) |
| 40 to 44 Years | 46 (2.5%) | 119 (5.9%) |
| 45 to 49 Years | 107 (5.7%) | 211 (10.4%) |
| 50 to 54 Years | 74 (4.0%) | 112 (5.5%) |
| 55 to 59 Years | 48 (2.6%) | 57 (2.8%) |
| 60 to 64 Years | 92 (4.9%) | 145 (7.2%) |
| 65 to 69 Years | 67 (3.6%) | 95 (4.7%) |
| 70 to 74 Years | 31 (1.7%) | 43 (2.1%) |
| 75 to 79 Years | 44 (2.4%) | 48 (2.4%) |
| 80 to 84 Years | 14 (0.7%) | 34 (1.7%) |
| 85 Years and over | 21 (1.1%) | 51 (2.5%) |
| Total | 1,868 (100.0%) | 2,020 (100.0%) |
Families and Households in Chinle
Median Family Size in Chinle
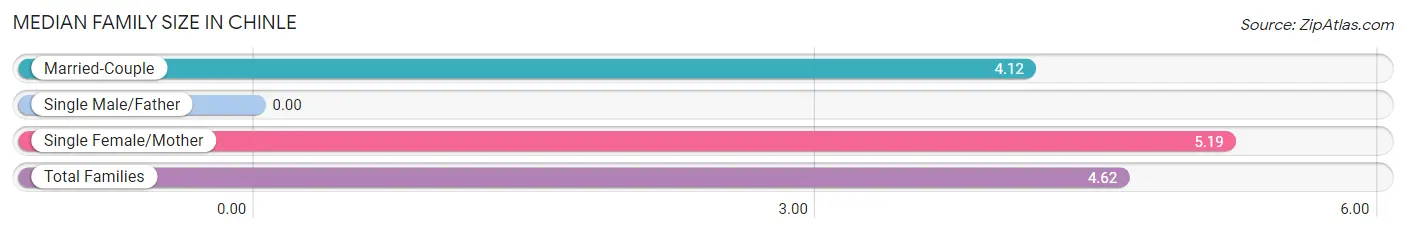
| Family Type | # Families | Family Size |
| Married-Couple | 375 (52.8%) | 4.12 |
| Single Male/Father | 0 (0.0%) | - |
| Single Female/Mother | 335 (47.2%) | 5.19 |
| Total Families | 710 (100.0%) | 4.62 |
Median Household Size in Chinle
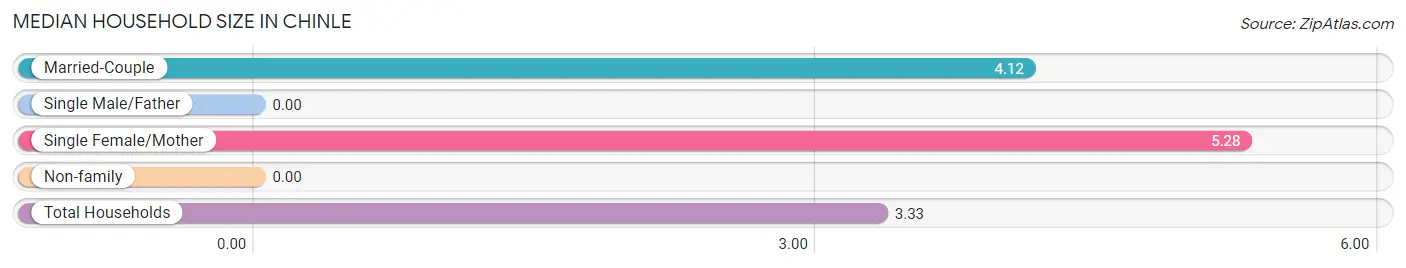
| Household Type | # Households | Household Size |
| Married-Couple | 375 (33.5%) | 4.12 |
| Single Male/Father | 0 (0.0%) | - |
| Single Female/Mother | 335 (30.0%) | 5.28 |
| Non-family | 408 (36.5%) | - |
| Total Households | 1,118 (100.0%) | 3.33 |
Household Size by Marriage Status in Chinle
Out of a total of 1,118 households in Chinle, 710 (63.5%) are family households, while 408 (36.5%) are nonfamily households. The most numerous type of family households are 2-person households, comprising 238, and the most common type of nonfamily households are 1-person households, comprising 408.
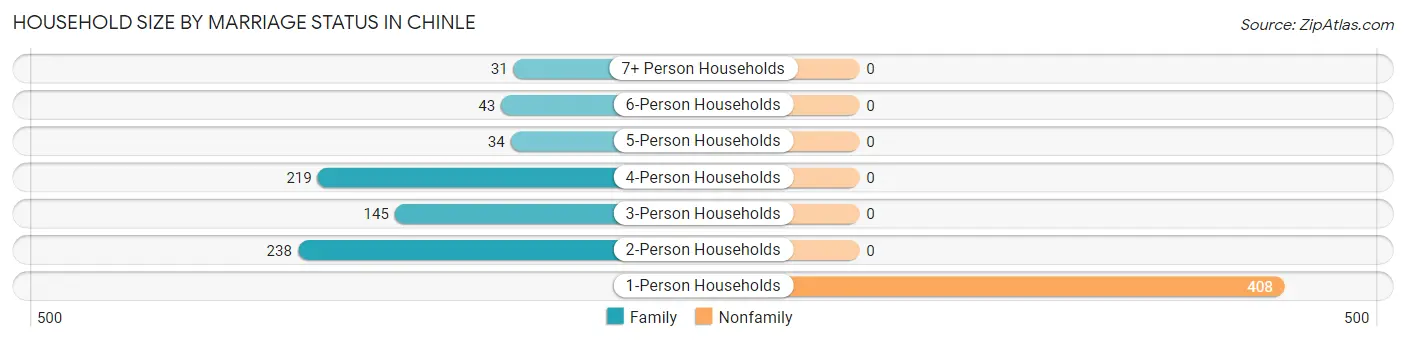
| Household Size | Family Households | Nonfamily Households |
| 1-Person Households | - | 408 (36.5%) |
| 2-Person Households | 238 (21.3%) | 0 (0.0%) |
| 3-Person Households | 145 (13.0%) | 0 (0.0%) |
| 4-Person Households | 219 (19.6%) | 0 (0.0%) |
| 5-Person Households | 34 (3.0%) | 0 (0.0%) |
| 6-Person Households | 43 (3.8%) | 0 (0.0%) |
| 7+ Person Households | 31 (2.8%) | 0 (0.0%) |
| Total | 710 (63.5%) | 408 (36.5%) |
Female Fertility in Chinle
Fertility by Age in Chinle
Average fertility rate in Chinle is 50.0 births per 1,000 women. Women in the age bracket of 35 to 50 years have the highest fertility rate with 105.0 births per 1,000 women. Women in the age bracket of 35 to 50 years acount for 100.0% of all women with births.
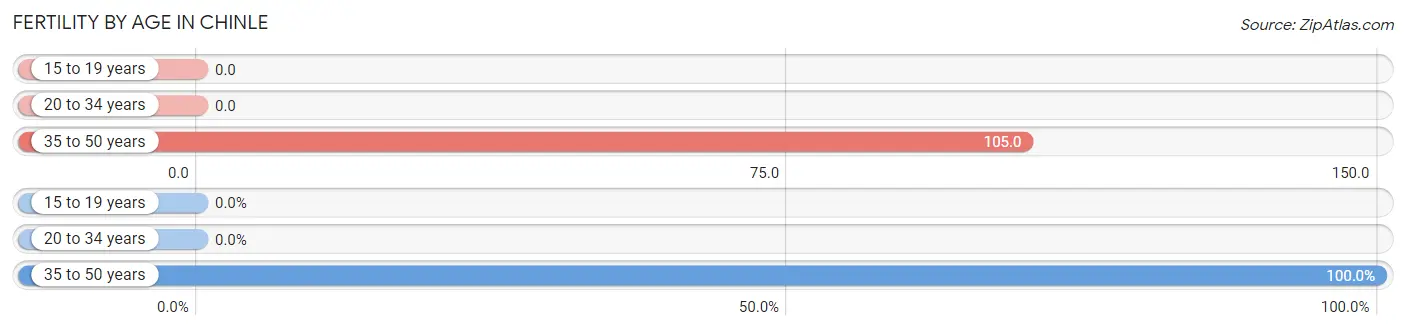
| Age Bracket | Women with Births | Births / 1,000 Women |
| 15 to 19 years | 0 (0.0%) | 0.0 |
| 20 to 34 years | 0 (0.0%) | 0.0 |
| 35 to 50 years | 45 (100.0%) | 105.0 |
| Total | 45 (100.0%) | 50.0 |
Fertility by Age by Marriage Status in Chinle
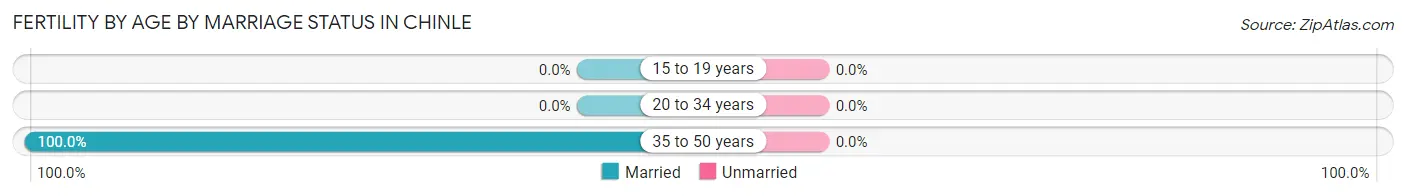
| Age Bracket | Married | Unmarried |
| 15 to 19 years | 0 (0.0%) | 0 (0.0%) |
| 20 to 34 years | 0 (0.0%) | 0 (0.0%) |
| 35 to 50 years | 45 (100.0%) | 0 (0.0%) |
| Total | 45 (100.0%) | 0 (0.0%) |
Fertility by Education in Chinle
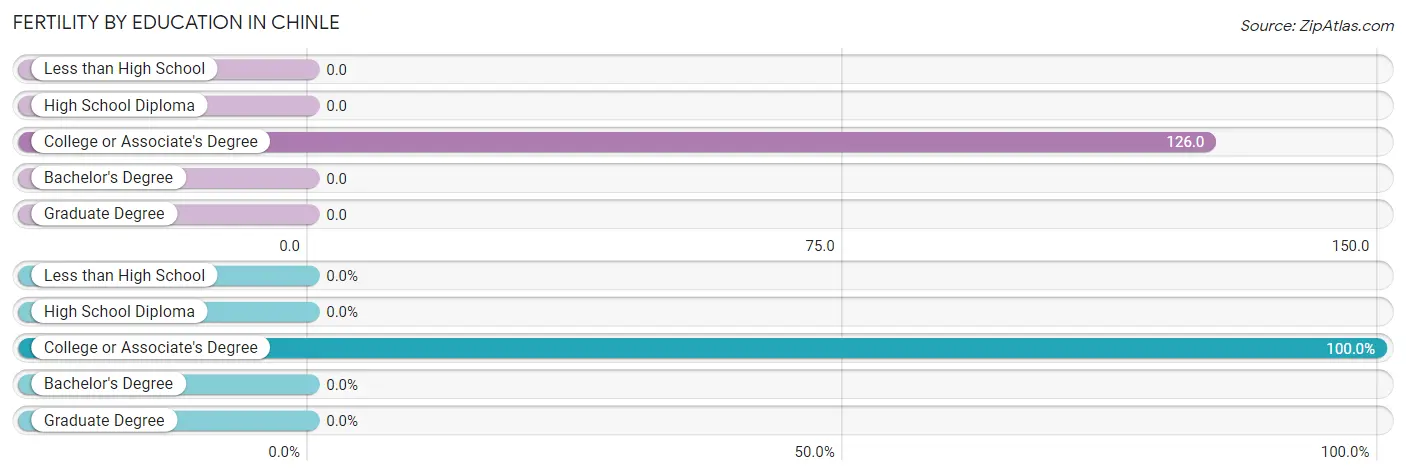
| Educational Attainment | Women with Births | Births / 1,000 Women |
| Less than High School | 0 (0.0%) | 0.0 |
| High School Diploma | 0 (0.0%) | 0.0 |
| College or Associate's Degree | 45 (100.0%) | 126.0 |
| Bachelor's Degree | 0 (0.0%) | 0.0 |
| Graduate Degree | 0 (0.0%) | 0.0 |
| Total | 45 (100.0%) | 50.0 |
Fertility by Education by Marriage Status in Chinle
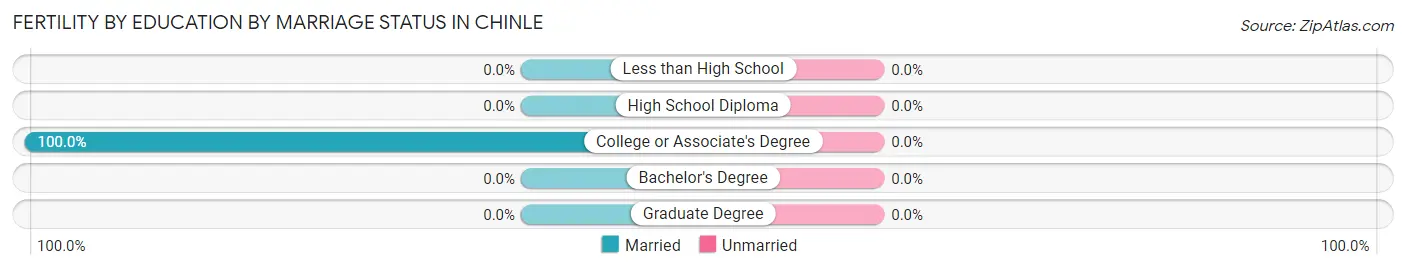
| Educational Attainment | Married | Unmarried |
| Less than High School | 0 (0.0%) | 0 (0.0%) |
| High School Diploma | 0 (0.0%) | 0 (0.0%) |
| College or Associate's Degree | 45 (100.0%) | 0 (0.0%) |
| Bachelor's Degree | 0 (0.0%) | 0 (0.0%) |
| Graduate Degree | 0 (0.0%) | 0 (0.0%) |
| Total | 45 (100.0%) | 0 (0.0%) |
Employment Characteristics in Chinle
Employment by Class of Employer in Chinle
Among the 1,117 employed individuals in Chinle, private company employees (373 | 33.4%), federal government employees (322 | 28.8%), and state government employees (240 | 21.5%) make up the most common classes of employment.
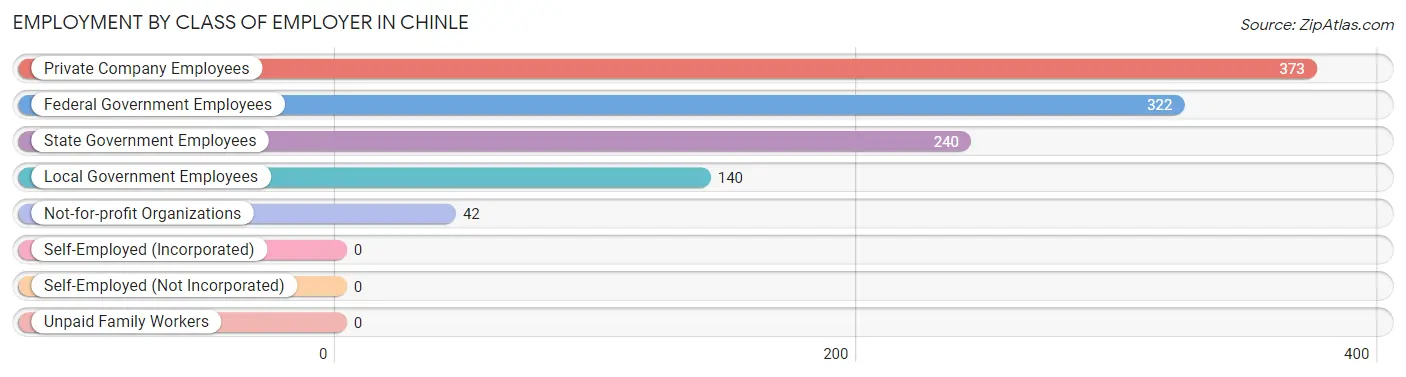
| Employer Class | # Employees | % Employees |
| Private Company Employees | 373 | 33.4% |
| Self-Employed (Incorporated) | 0 | 0.0% |
| Self-Employed (Not Incorporated) | 0 | 0.0% |
| Not-for-profit Organizations | 42 | 3.8% |
| Local Government Employees | 140 | 12.5% |
| State Government Employees | 240 | 21.5% |
| Federal Government Employees | 322 | 28.8% |
| Unpaid Family Workers | 0 | 0.0% |
| Total | 1,117 | 100.0% |
Employment Status by Age in Chinle
According to the labor force statistics for Chinle, out of the total population over 16 years of age (2,839), 44.4% or 1,261 individuals are in the labor force, with 11.4% or 144 of them unemployed. The age group with the highest labor force participation rate is 30 to 34 years, with 71.1% or 180 individuals in the labor force. Within the labor force, the 16 to 19 years age range has the highest percentage of unemployed individuals, with 100.0% or 22 of them being unemployed.
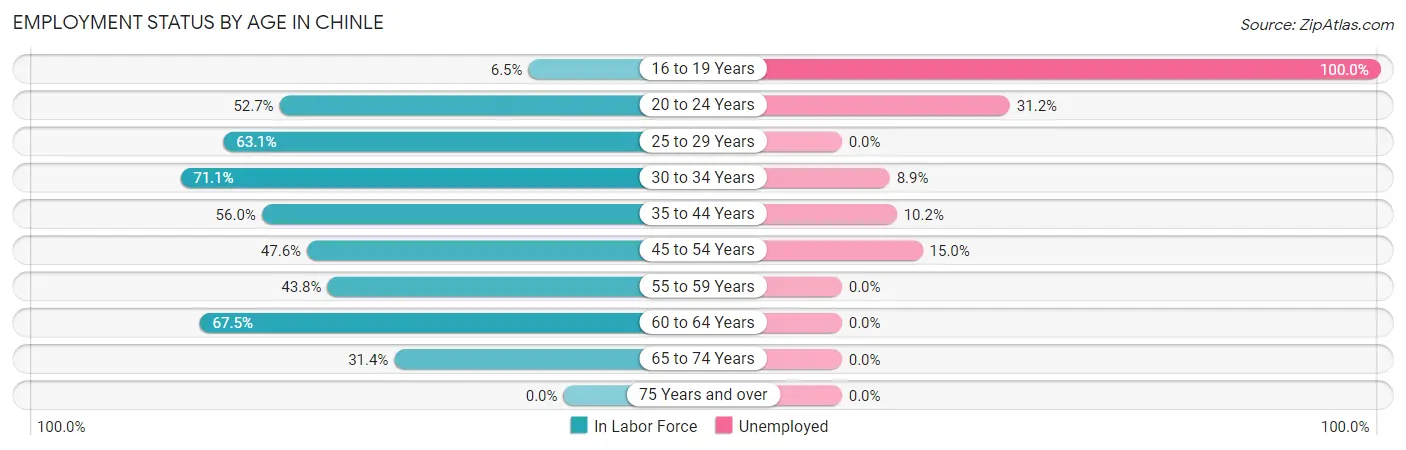
| Age Bracket | In Labor Force | Unemployed |
| 16 to 19 Years | 22 (6.5%) | 22 (100.0%) |
| 20 to 24 Years | 125 (52.7%) | 39 (31.2%) |
| 25 to 29 Years | 111 (63.1%) | 0 (0.0%) |
| 30 to 34 Years | 180 (71.1%) | 16 (8.9%) |
| 35 to 44 Years | 303 (56.0%) | 31 (10.2%) |
| 45 to 54 Years | 240 (47.6%) | 36 (15.0%) |
| 55 to 59 Years | 46 (43.8%) | 0 (0.0%) |
| 60 to 64 Years | 160 (67.5%) | 0 (0.0%) |
| 65 to 74 Years | 74 (31.4%) | 0 (0.0%) |
| 75 Years and over | 0 (0.0%) | 0 (0.0%) |
| Total | 1,261 (44.4%) | 144 (11.4%) |
Employment Status by Educational Attainment in Chinle
According to labor force statistics for Chinle, 57.3% of individuals (1,041) out of the total population between 25 and 64 years of age (1,816) are in the labor force, with 8.0% or 83 of them being unemployed. The group with the highest labor force participation rate are those with the educational attainment of bachelor's degree or higher, with 100.0% or 332 individuals in the labor force. Within the labor force, individuals with less than high school education have the highest percentage of unemployment, with 41.3% or 31 of them being unemployed.
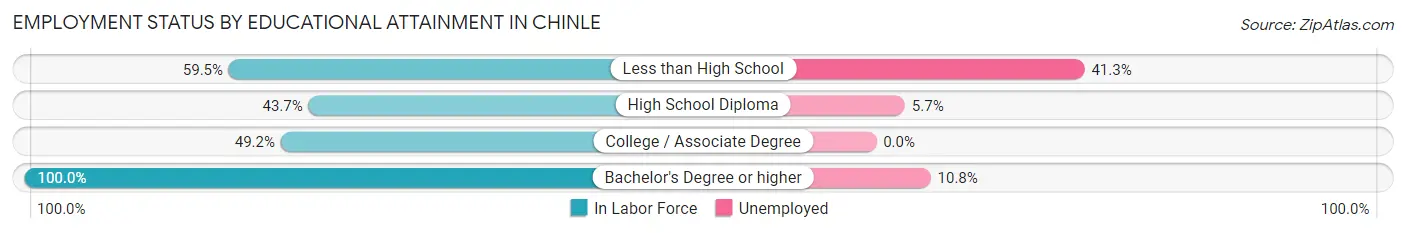
| Educational Attainment | In Labor Force | Unemployed |
| Less than High School | 75 (59.5%) | 52 (41.3%) |
| High School Diploma | 283 (43.7%) | 37 (5.7%) |
| College / Associate Degree | 350 (49.2%) | 0 (0.0%) |
| Bachelor's Degree or higher | 332 (100.0%) | 36 (10.8%) |
| Total | 1,041 (57.3%) | 145 (8.0%) |
Employment Occupations by Sex in Chinle
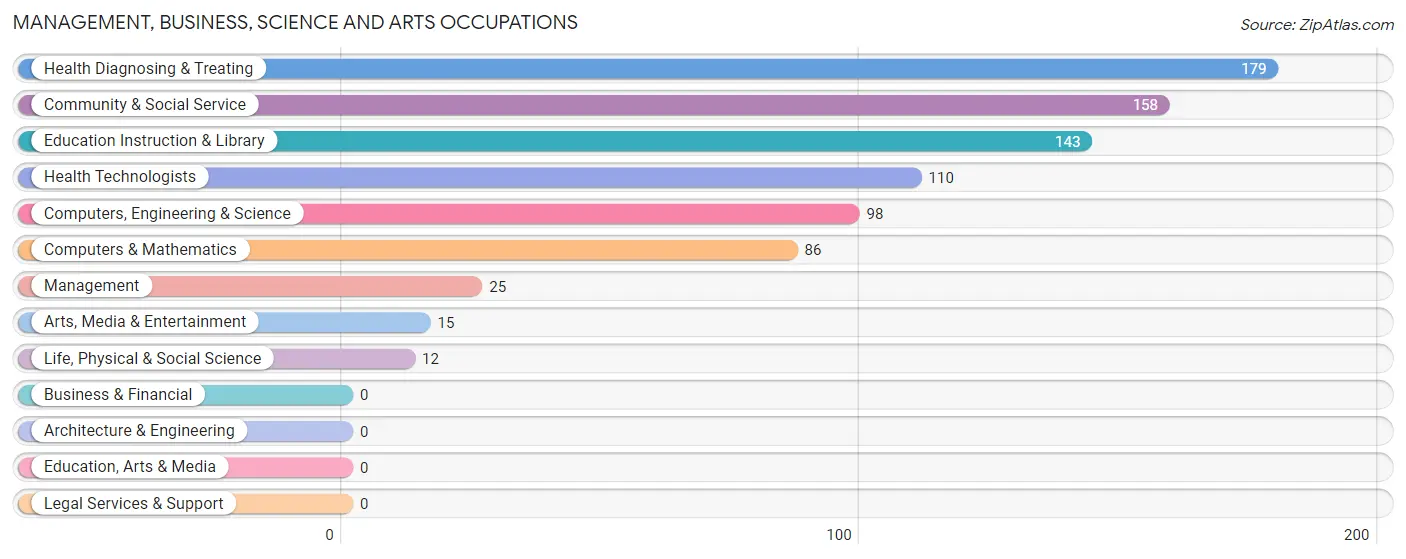
Management, Business, Science and Arts Occupations
The most common Management, Business, Science and Arts occupations in Chinle are Health Diagnosing & Treating (179 | 16.0%), Community & Social Service (158 | 14.1%), Education Instruction & Library (143 | 12.8%), Health Technologists (110 | 9.9%), and Computers, Engineering & Science (98 | 8.8%).
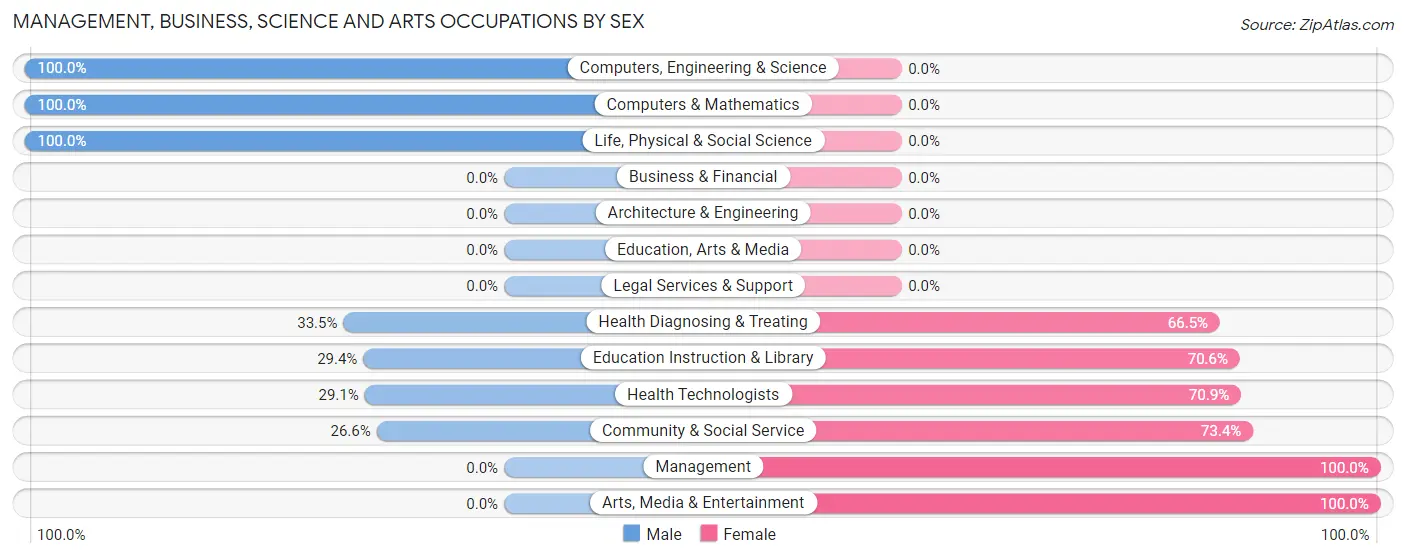
Management, Business, Science and Arts Occupations by Sex
Within the Management, Business, Science and Arts occupations in Chinle, the most male-oriented occupations are Computers, Engineering & Science (100.0%), Computers & Mathematics (100.0%), and Life, Physical & Social Science (100.0%), while the most female-oriented occupations are Management (100.0%), Arts, Media & Entertainment (100.0%), and Community & Social Service (73.4%).
| Occupation | Male | Female |
| Management | 0 (0.0%) | 25 (100.0%) |
| Business & Financial | 0 (0.0%) | 0 (0.0%) |
| Computers, Engineering & Science | 98 (100.0%) | 0 (0.0%) |
| Computers & Mathematics | 86 (100.0%) | 0 (0.0%) |
| Architecture & Engineering | 0 (0.0%) | 0 (0.0%) |
| Life, Physical & Social Science | 12 (100.0%) | 0 (0.0%) |
| Community & Social Service | 42 (26.6%) | 116 (73.4%) |
| Education, Arts & Media | 0 (0.0%) | 0 (0.0%) |
| Legal Services & Support | 0 (0.0%) | 0 (0.0%) |
| Education Instruction & Library | 42 (29.4%) | 101 (70.6%) |
| Arts, Media & Entertainment | 0 (0.0%) | 15 (100.0%) |
| Health Diagnosing & Treating | 60 (33.5%) | 119 (66.5%) |
| Health Technologists | 32 (29.1%) | 78 (70.9%) |
| Total (Category) | 200 (43.5%) | 260 (56.5%) |
| Total (Overall) | 536 (48.0%) | 581 (52.0%) |
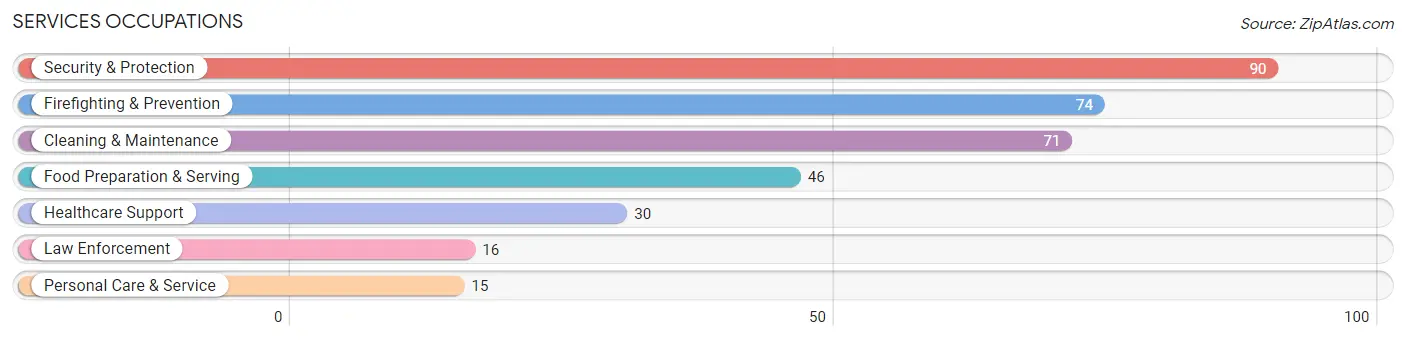
Services Occupations
The most common Services occupations in Chinle are Security & Protection (90 | 8.1%), Firefighting & Prevention (74 | 6.6%), Cleaning & Maintenance (71 | 6.4%), Food Preparation & Serving (46 | 4.1%), and Healthcare Support (30 | 2.7%).
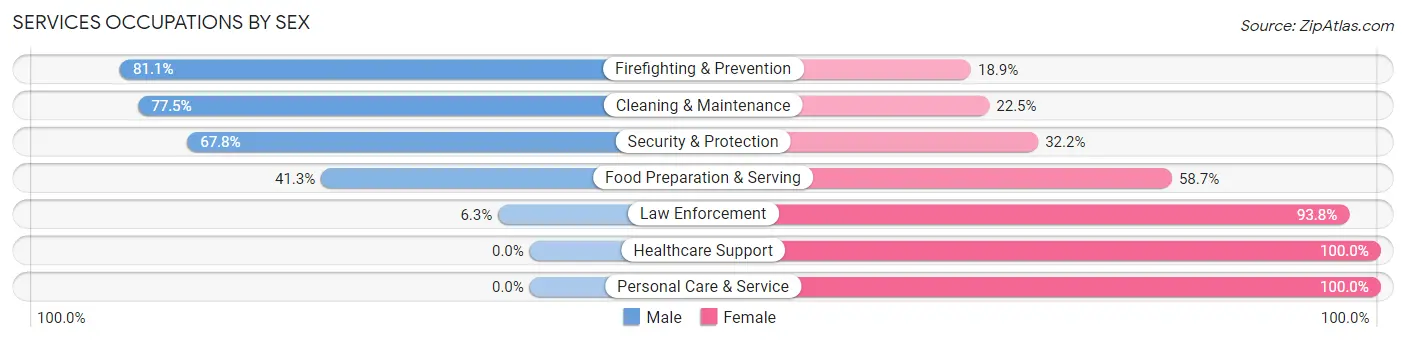
Services Occupations by Sex
Within the Services occupations in Chinle, the most male-oriented occupations are Firefighting & Prevention (81.1%), Cleaning & Maintenance (77.5%), and Security & Protection (67.8%), while the most female-oriented occupations are Healthcare Support (100.0%), Personal Care & Service (100.0%), and Law Enforcement (93.8%).
| Occupation | Male | Female |
| Healthcare Support | 0 (0.0%) | 30 (100.0%) |
| Security & Protection | 61 (67.8%) | 29 (32.2%) |
| Firefighting & Prevention | 60 (81.1%) | 14 (18.9%) |
| Law Enforcement | 1 (6.2%) | 15 (93.8%) |
| Food Preparation & Serving | 19 (41.3%) | 27 (58.7%) |
| Cleaning & Maintenance | 55 (77.5%) | 16 (22.5%) |
| Personal Care & Service | 0 (0.0%) | 15 (100.0%) |
| Total (Category) | 135 (53.6%) | 117 (46.4%) |
| Total (Overall) | 536 (48.0%) | 581 (52.0%) |
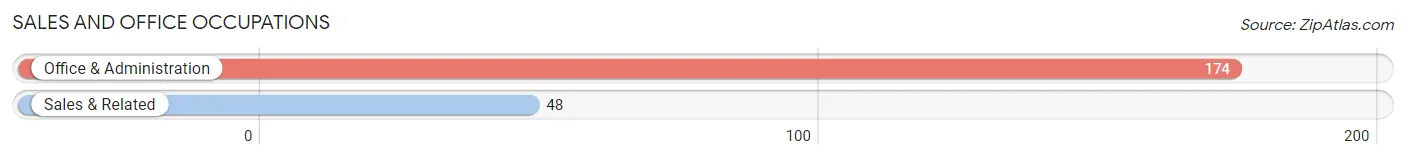
Sales and Office Occupations
The most common Sales and Office occupations in Chinle are Office & Administration (174 | 15.6%), and Sales & Related (48 | 4.3%).
Sales and Office Occupations by Sex
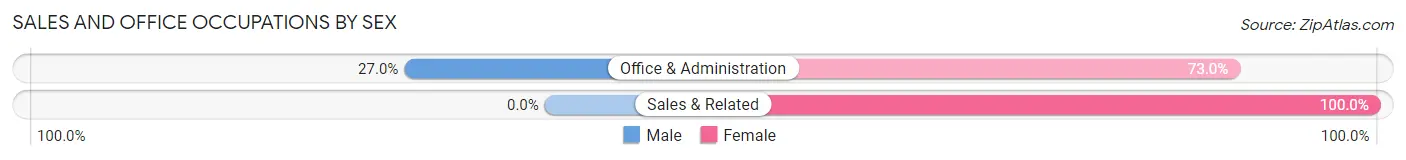
| Occupation | Male | Female |
| Sales & Related | 0 (0.0%) | 48 (100.0%) |
| Office & Administration | 47 (27.0%) | 127 (73.0%) |
| Total (Category) | 47 (21.2%) | 175 (78.8%) |
| Total (Overall) | 536 (48.0%) | 581 (52.0%) |
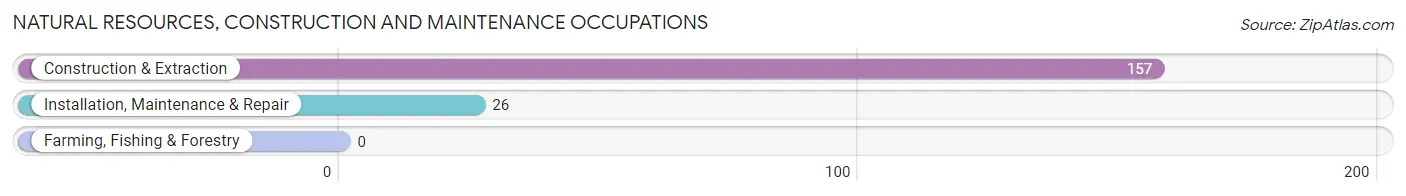
Natural Resources, Construction and Maintenance Occupations
The most common Natural Resources, Construction and Maintenance occupations in Chinle are Construction & Extraction (157 | 14.1%), and Installation, Maintenance & Repair (26 | 2.3%).
Natural Resources, Construction and Maintenance Occupations by Sex
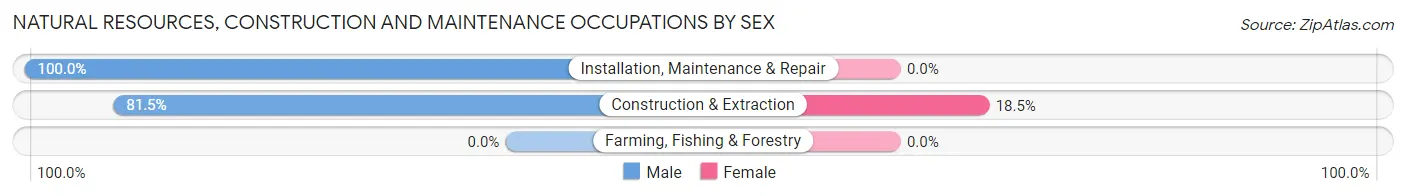
| Occupation | Male | Female |
| Farming, Fishing & Forestry | 0 (0.0%) | 0 (0.0%) |
| Construction & Extraction | 128 (81.5%) | 29 (18.5%) |
| Installation, Maintenance & Repair | 26 (100.0%) | 0 (0.0%) |
| Total (Category) | 154 (84.2%) | 29 (15.9%) |
| Total (Overall) | 536 (48.0%) | 581 (52.0%) |
Production, Transportation and Moving Occupations
Production, Transportation and Moving Occupations by Sex
| Occupation | Male | Female |
| Production | 0 (0.0%) | 0 (0.0%) |
| Transportation | 0 (0.0%) | 0 (0.0%) |
| Material Moving | 0 (0.0%) | 0 (0.0%) |
| Total (Category) | 0 (0.0%) | 0 (0.0%) |
| Total (Overall) | 536 (48.0%) | 581 (52.0%) |
Employment Industries by Sex in Chinle
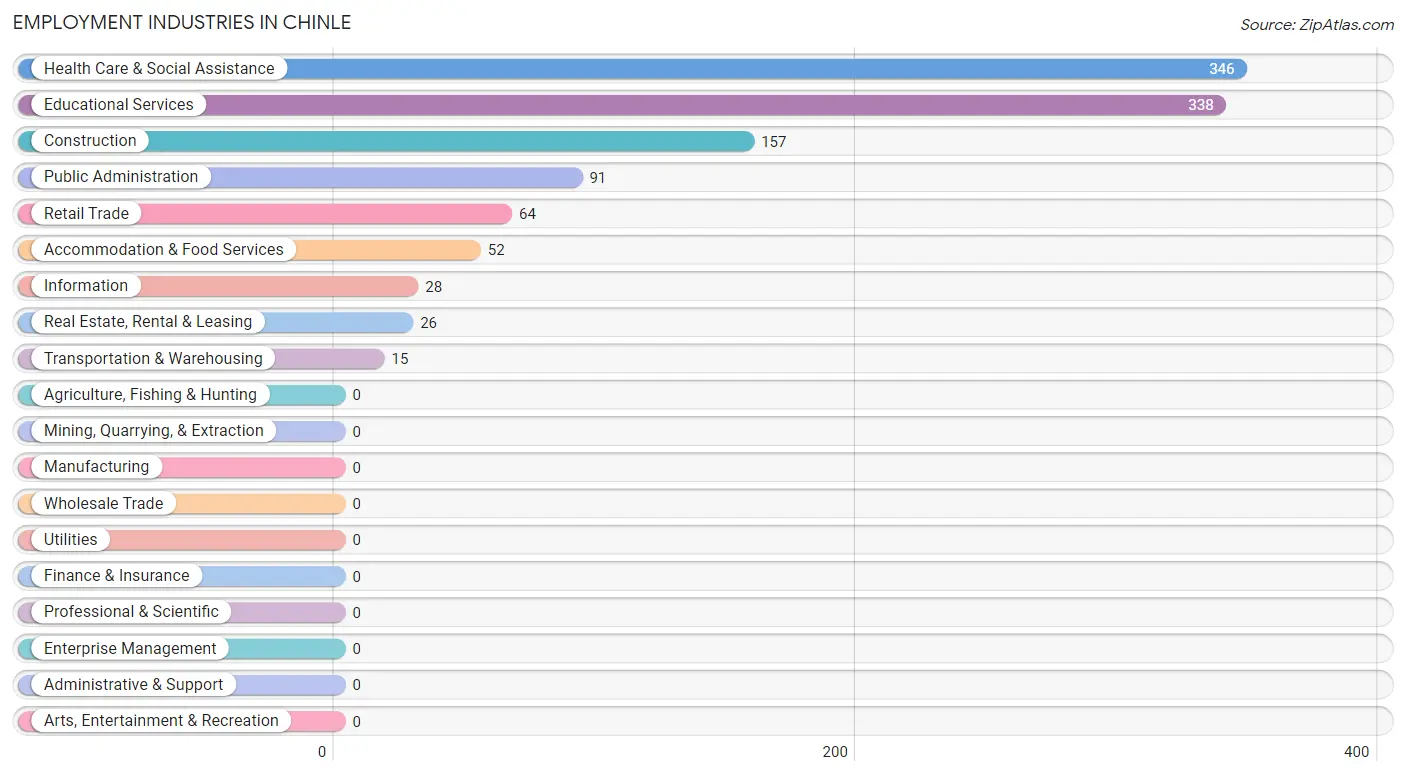
Employment Industries in Chinle
The major employment industries in Chinle include Health Care & Social Assistance (346 | 31.0%), Educational Services (338 | 30.3%), Construction (157 | 14.1%), Public Administration (91 | 8.2%), and Retail Trade (64 | 5.7%).
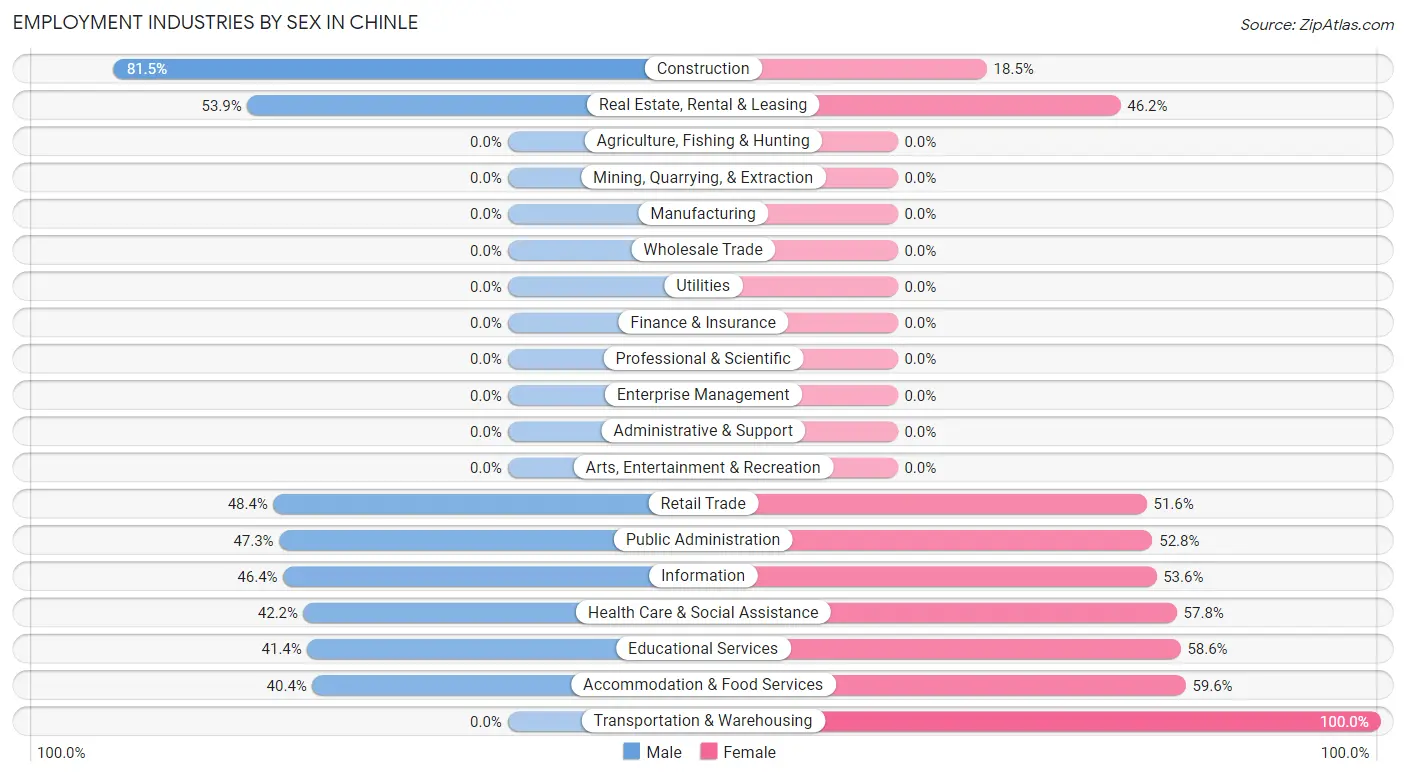
Employment Industries by Sex in Chinle
The Chinle industries that see more men than women are Construction (81.5%), Real Estate, Rental & Leasing (53.8%), and Retail Trade (48.4%), whereas the industries that tend to have a higher number of women are Transportation & Warehousing (100.0%), Accommodation & Food Services (59.6%), and Educational Services (58.6%).
| Industry | Male | Female |
| Agriculture, Fishing & Hunting | 0 (0.0%) | 0 (0.0%) |
| Mining, Quarrying, & Extraction | 0 (0.0%) | 0 (0.0%) |
| Construction | 128 (81.5%) | 29 (18.5%) |
| Manufacturing | 0 (0.0%) | 0 (0.0%) |
| Wholesale Trade | 0 (0.0%) | 0 (0.0%) |
| Retail Trade | 31 (48.4%) | 33 (51.6%) |
| Transportation & Warehousing | 0 (0.0%) | 15 (100.0%) |
| Utilities | 0 (0.0%) | 0 (0.0%) |
| Information | 13 (46.4%) | 15 (53.6%) |
| Finance & Insurance | 0 (0.0%) | 0 (0.0%) |
| Real Estate, Rental & Leasing | 14 (53.8%) | 12 (46.2%) |
| Professional & Scientific | 0 (0.0%) | 0 (0.0%) |
| Enterprise Management | 0 (0.0%) | 0 (0.0%) |
| Administrative & Support | 0 (0.0%) | 0 (0.0%) |
| Educational Services | 140 (41.4%) | 198 (58.6%) |
| Health Care & Social Assistance | 146 (42.2%) | 200 (57.8%) |
| Arts, Entertainment & Recreation | 0 (0.0%) | 0 (0.0%) |
| Accommodation & Food Services | 21 (40.4%) | 31 (59.6%) |
| Public Administration | 43 (47.2%) | 48 (52.7%) |
| Total | 536 (48.0%) | 581 (52.0%) |
Education in Chinle
School Enrollment in Chinle
The most common levels of schooling among the 1,229 students in Chinle are high school (307 | 25.0%), middle school (300 | 24.4%), and elementary school (271 | 22.1%).
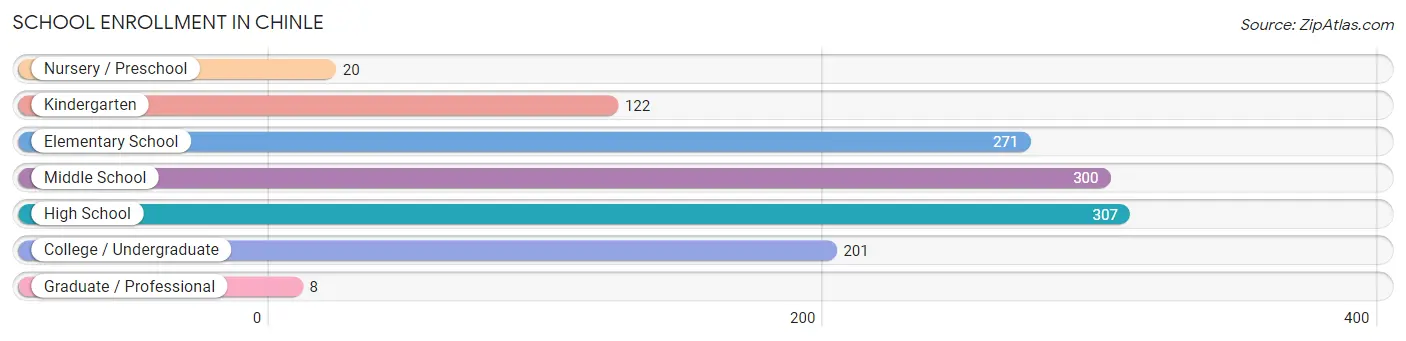
| School Level | # Students | % Students |
| Nursery / Preschool | 20 | 1.6% |
| Kindergarten | 122 | 9.9% |
| Elementary School | 271 | 22.1% |
| Middle School | 300 | 24.4% |
| High School | 307 | 25.0% |
| College / Undergraduate | 201 | 16.4% |
| Graduate / Professional | 8 | 0.6% |
| Total | 1,229 | 100.0% |
School Enrollment by Age by Funding Source in Chinle
Out of a total of 1,229 students who are enrolled in schools in Chinle, 104 (8.5%) attend a private institution, while the remaining 1,125 (91.5%) are enrolled in public schools. The age group of 20 to 24 year olds has the highest likelihood of being enrolled in private schools, with 26 (50.0% in the age bracket) enrolled. Conversely, the age group of 3 to 4 year olds has the lowest likelihood of being enrolled in a private school, with 20 (100.0% in the age bracket) attending a public institution.
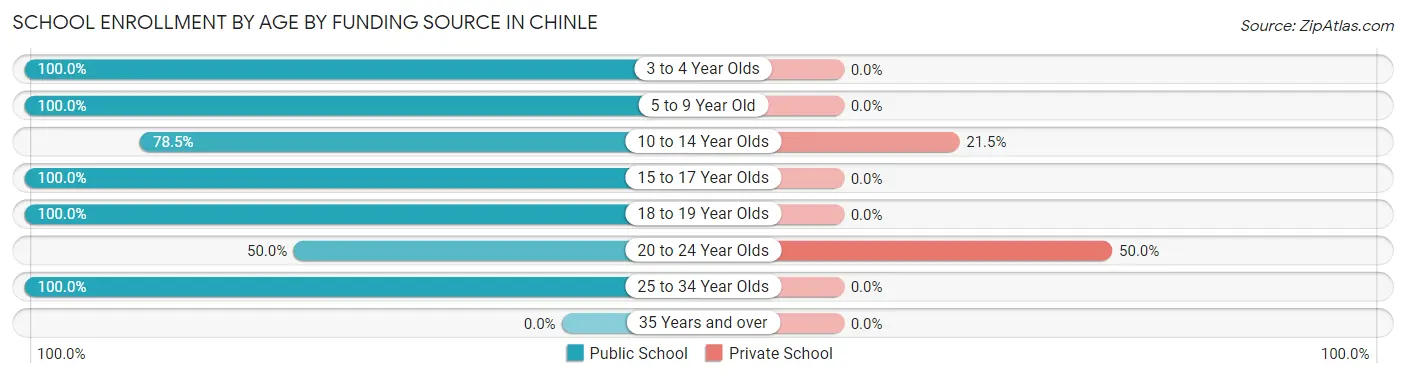
| Age Bracket | Public School | Private School |
| 3 to 4 Year Olds | 20 (100.0%) | 0 (0.0%) |
| 5 to 9 Year Old | 326 (100.0%) | 0 (0.0%) |
| 10 to 14 Year Olds | 288 (78.5%) | 79 (21.5%) |
| 15 to 17 Year Olds | 307 (100.0%) | 0 (0.0%) |
| 18 to 19 Year Olds | 32 (100.0%) | 0 (0.0%) |
| 20 to 24 Year Olds | 26 (50.0%) | 26 (50.0%) |
| 25 to 34 Year Olds | 125 (100.0%) | 0 (0.0%) |
| 35 Years and over | 0 (0.0%) | 0 (0.0%) |
| Total | 1,125 (91.5%) | 104 (8.5%) |
Educational Attainment by Field of Study in Chinle
Education (149 | 38.5%), computers & mathematics (86 | 22.2%), arts & humanities (39 | 10.1%), science & technology (37 | 9.6%), and bio, nature & agricultural (33 | 8.5%) are the most common fields of study among 387 individuals in Chinle who have obtained a bachelor's degree or higher.
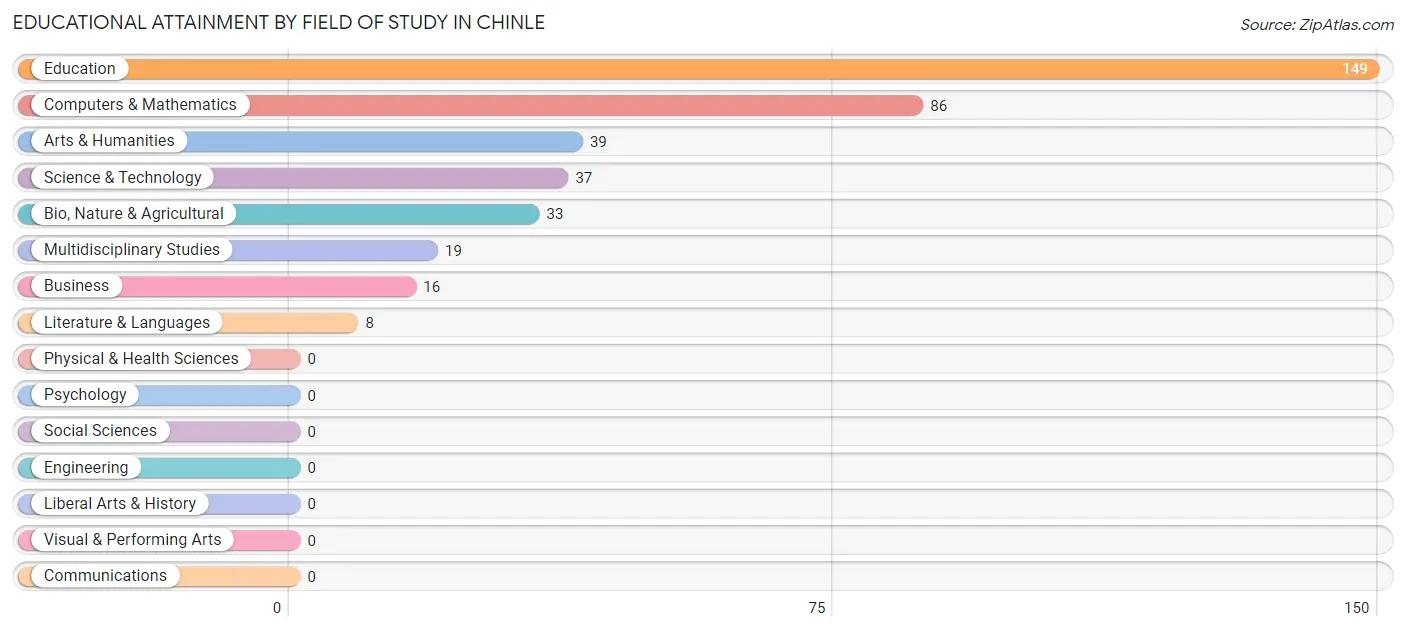
| Field of Study | # Graduates | % Graduates |
| Computers & Mathematics | 86 | 22.2% |
| Bio, Nature & Agricultural | 33 | 8.5% |
| Physical & Health Sciences | 0 | 0.0% |
| Psychology | 0 | 0.0% |
| Social Sciences | 0 | 0.0% |
| Engineering | 0 | 0.0% |
| Multidisciplinary Studies | 19 | 4.9% |
| Science & Technology | 37 | 9.6% |
| Business | 16 | 4.1% |
| Education | 149 | 38.5% |
| Literature & Languages | 8 | 2.1% |
| Liberal Arts & History | 0 | 0.0% |
| Visual & Performing Arts | 0 | 0.0% |
| Communications | 0 | 0.0% |
| Arts & Humanities | 39 | 10.1% |
| Total | 387 | 100.0% |
Transportation & Commute in Chinle
Vehicle Availability by Sex in Chinle
The most prevalent vehicle ownership categories in Chinle are males with 1 vehicle (340, accounting for 66.5%) and females with 1 vehicle (288, making up 58.5%).
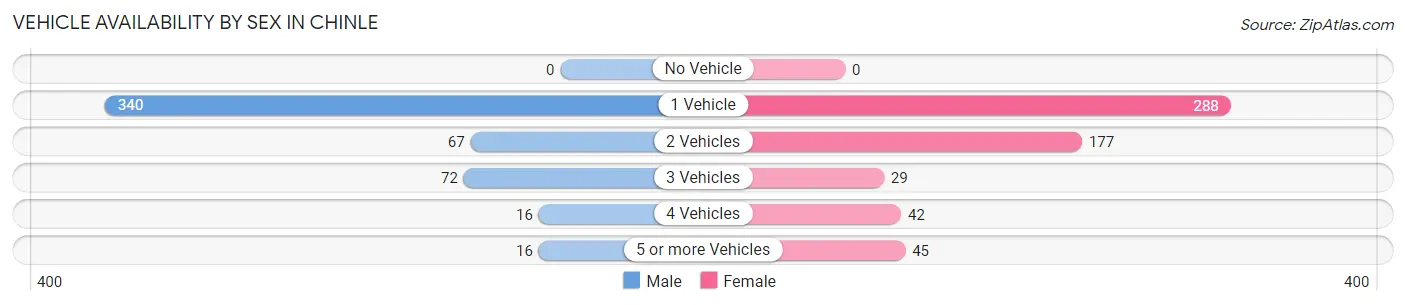
| Vehicles Available | Male | Female |
| No Vehicle | 0 (0.0%) | 0 (0.0%) |
| 1 Vehicle | 340 (66.5%) | 288 (49.6%) |
| 2 Vehicles | 67 (13.1%) | 177 (30.5%) |
| 3 Vehicles | 72 (14.1%) | 29 (5.0%) |
| 4 Vehicles | 16 (3.1%) | 42 (7.2%) |
| 5 or more Vehicles | 16 (3.1%) | 45 (7.7%) |
| Total | 511 (100.0%) | 581 (100.0%) |
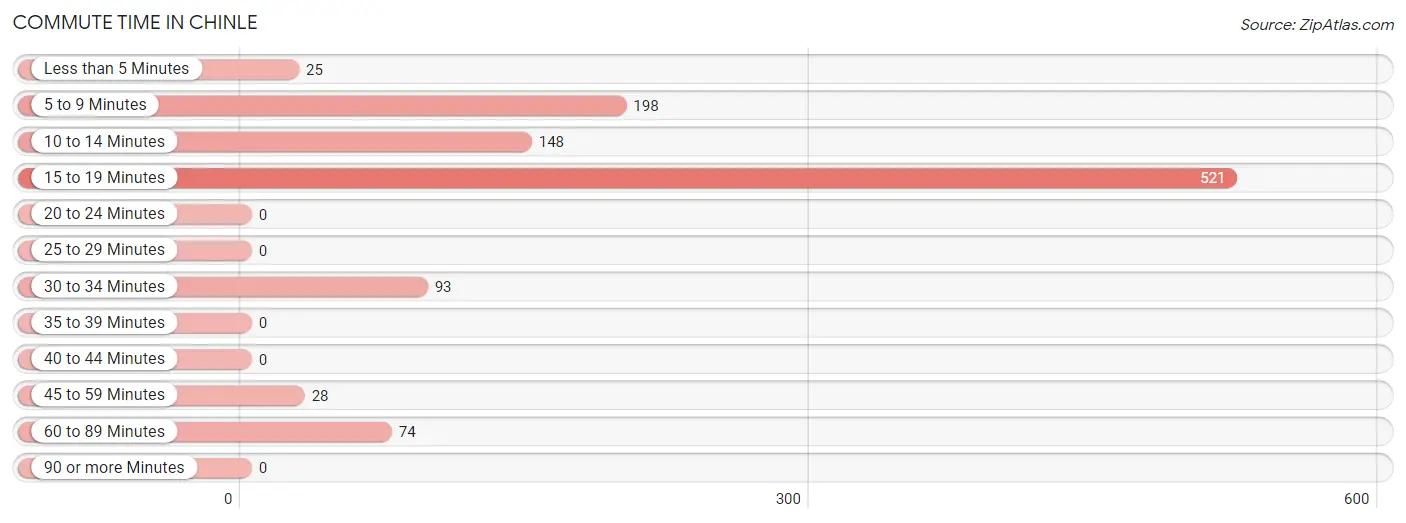
Commute Time in Chinle
The most frequently occuring commute durations in Chinle are 15 to 19 minutes (521 commuters, 47.9%), 5 to 9 minutes (198 commuters, 18.2%), and 10 to 14 minutes (148 commuters, 13.6%).
| Commute Time | # Commuters | % Commuters |
| Less than 5 Minutes | 25 | 2.3% |
| 5 to 9 Minutes | 198 | 18.2% |
| 10 to 14 Minutes | 148 | 13.6% |
| 15 to 19 Minutes | 521 | 47.9% |
| 20 to 24 Minutes | 0 | 0.0% |
| 25 to 29 Minutes | 0 | 0.0% |
| 30 to 34 Minutes | 93 | 8.6% |
| 35 to 39 Minutes | 0 | 0.0% |
| 40 to 44 Minutes | 0 | 0.0% |
| 45 to 59 Minutes | 28 | 2.6% |
| 60 to 89 Minutes | 74 | 6.8% |
| 90 or more Minutes | 0 | 0.0% |
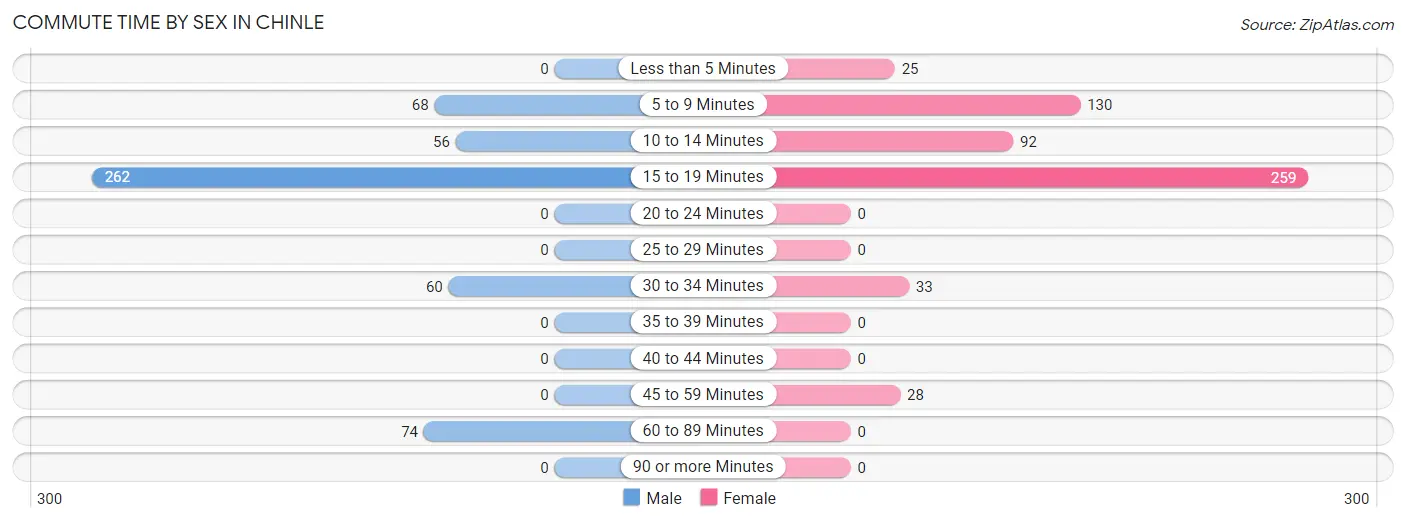
Commute Time by Sex in Chinle
The most common commute times in Chinle are 15 to 19 minutes (262 commuters, 50.4%) for males and 15 to 19 minutes (259 commuters, 45.7%) for females.
| Commute Time | Male | Female |
| Less than 5 Minutes | 0 (0.0%) | 25 (4.4%) |
| 5 to 9 Minutes | 68 (13.1%) | 130 (22.9%) |
| 10 to 14 Minutes | 56 (10.8%) | 92 (16.2%) |
| 15 to 19 Minutes | 262 (50.4%) | 259 (45.7%) |
| 20 to 24 Minutes | 0 (0.0%) | 0 (0.0%) |
| 25 to 29 Minutes | 0 (0.0%) | 0 (0.0%) |
| 30 to 34 Minutes | 60 (11.5%) | 33 (5.8%) |
| 35 to 39 Minutes | 0 (0.0%) | 0 (0.0%) |
| 40 to 44 Minutes | 0 (0.0%) | 0 (0.0%) |
| 45 to 59 Minutes | 0 (0.0%) | 28 (4.9%) |
| 60 to 89 Minutes | 74 (14.2%) | 0 (0.0%) |
| 90 or more Minutes | 0 (0.0%) | 0 (0.0%) |
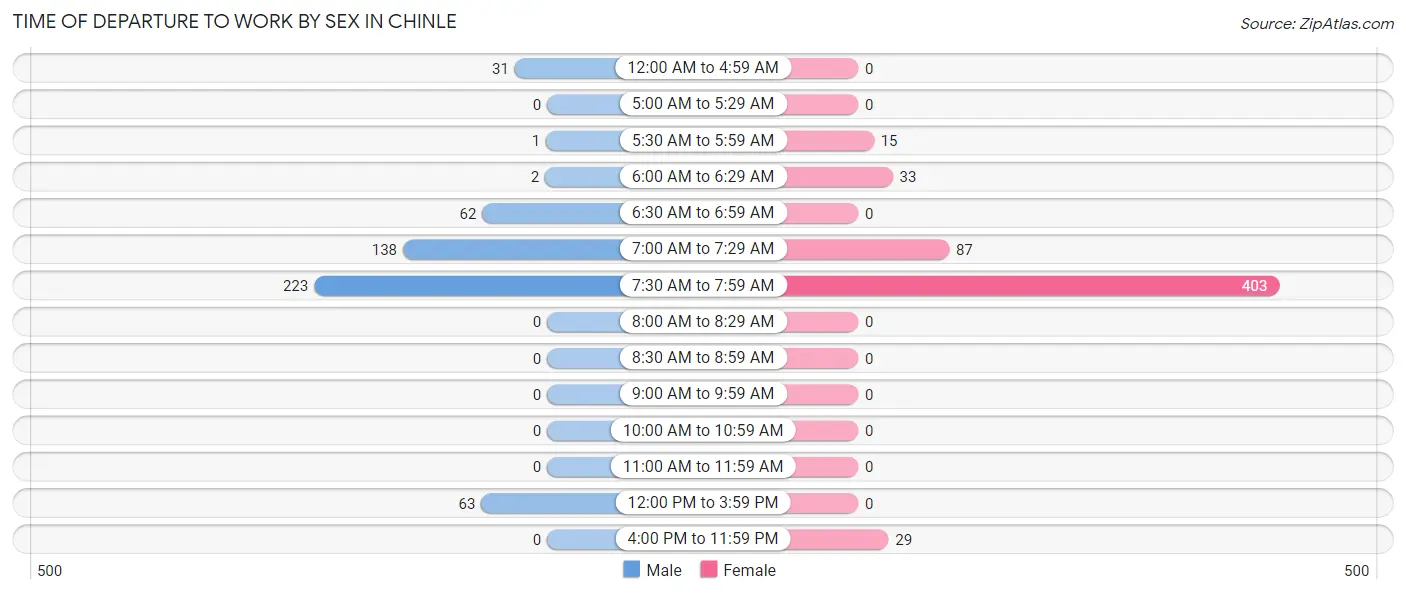
Time of Departure to Work by Sex in Chinle
The most frequent times of departure to work in Chinle are 7:30 AM to 7:59 AM (223, 42.9%) for males and 7:30 AM to 7:59 AM (403, 71.1%) for females.
| Time of Departure | Male | Female |
| 12:00 AM to 4:59 AM | 31 (6.0%) | 0 (0.0%) |
| 5:00 AM to 5:29 AM | 0 (0.0%) | 0 (0.0%) |
| 5:30 AM to 5:59 AM | 1 (0.2%) | 15 (2.6%) |
| 6:00 AM to 6:29 AM | 2 (0.4%) | 33 (5.8%) |
| 6:30 AM to 6:59 AM | 62 (11.9%) | 0 (0.0%) |
| 7:00 AM to 7:29 AM | 138 (26.5%) | 87 (15.3%) |
| 7:30 AM to 7:59 AM | 223 (42.9%) | 403 (71.1%) |
| 8:00 AM to 8:29 AM | 0 (0.0%) | 0 (0.0%) |
| 8:30 AM to 8:59 AM | 0 (0.0%) | 0 (0.0%) |
| 9:00 AM to 9:59 AM | 0 (0.0%) | 0 (0.0%) |
| 10:00 AM to 10:59 AM | 0 (0.0%) | 0 (0.0%) |
| 11:00 AM to 11:59 AM | 0 (0.0%) | 0 (0.0%) |
| 12:00 PM to 3:59 PM | 63 (12.1%) | 0 (0.0%) |
| 4:00 PM to 11:59 PM | 0 (0.0%) | 29 (5.1%) |
| Total | 520 (100.0%) | 567 (100.0%) |
Housing Occupancy in Chinle
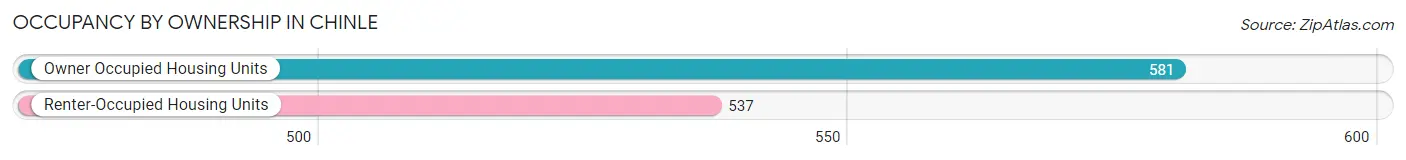
Occupancy by Ownership in Chinle
Of the total 1,118 dwellings in Chinle, owner-occupied units account for 581 (52.0%), while renter-occupied units make up 537 (48.0%).
| Occupancy | # Housing Units | % Housing Units |
| Owner Occupied Housing Units | 581 | 52.0% |
| Renter-Occupied Housing Units | 537 | 48.0% |
| Total Occupied Housing Units | 1,118 | 100.0% |
Occupancy by Household Size in Chinle
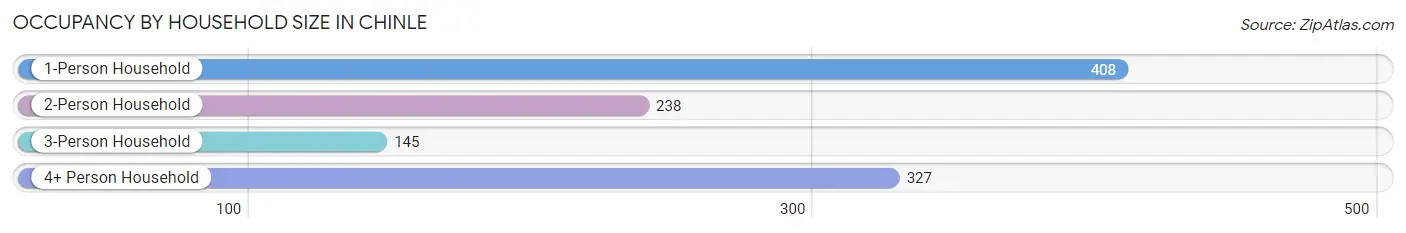
| Household Size | # Housing Units | % Housing Units |
| 1-Person Household | 408 | 36.5% |
| 2-Person Household | 238 | 21.3% |
| 3-Person Household | 145 | 13.0% |
| 4+ Person Household | 327 | 29.2% |
| Total Housing Units | 1,118 | 100.0% |
Occupancy by Ownership by Household Size in Chinle
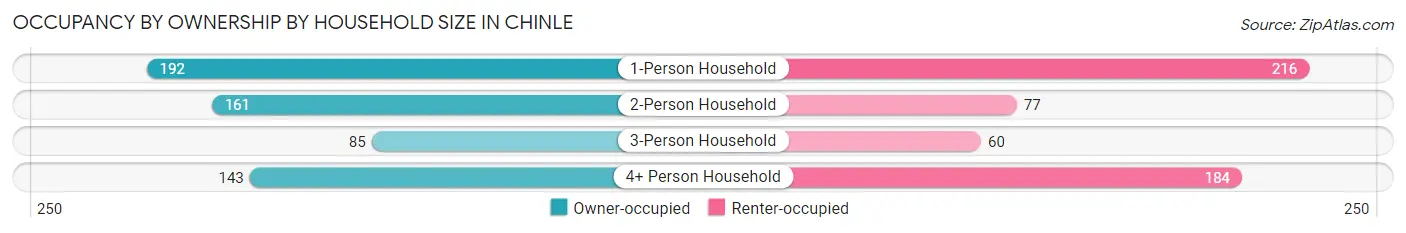
| Household Size | Owner-occupied | Renter-occupied |
| 1-Person Household | 192 (47.1%) | 216 (52.9%) |
| 2-Person Household | 161 (67.6%) | 77 (32.4%) |
| 3-Person Household | 85 (58.6%) | 60 (41.4%) |
| 4+ Person Household | 143 (43.7%) | 184 (56.3%) |
| Total Housing Units | 581 (52.0%) | 537 (48.0%) |
Occupancy by Educational Attainment in Chinle
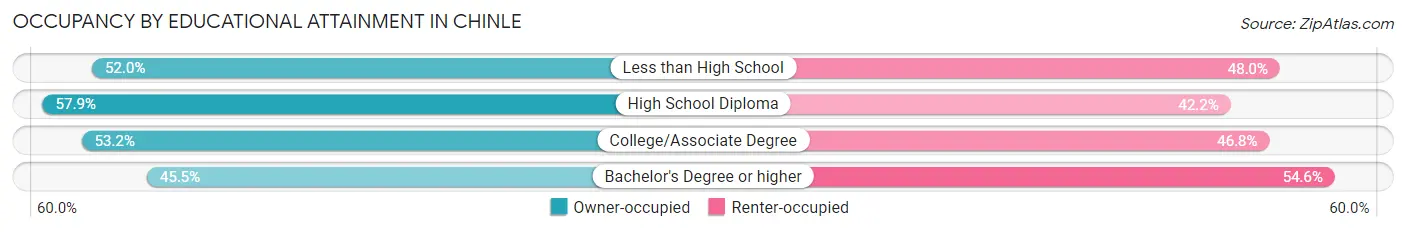
| Household Size | Owner-occupied | Renter-occupied |
| Less than High School | 92 (52.0%) | 85 (48.0%) |
| High School Diploma | 151 (57.9%) | 110 (42.1%) |
| College/Associate Degree | 198 (53.2%) | 174 (46.8%) |
| Bachelor's Degree or higher | 140 (45.5%) | 168 (54.5%) |
Occupancy by Age of Householder in Chinle
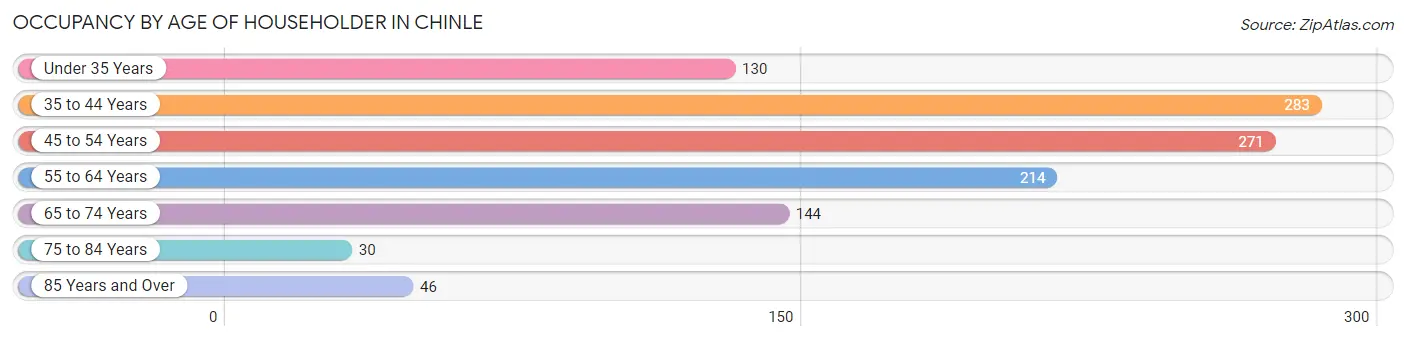
| Age Bracket | # Households | % Households |
| Under 35 Years | 130 | 11.6% |
| 35 to 44 Years | 283 | 25.3% |
| 45 to 54 Years | 271 | 24.2% |
| 55 to 64 Years | 214 | 19.1% |
| 65 to 74 Years | 144 | 12.9% |
| 75 to 84 Years | 30 | 2.7% |
| 85 Years and Over | 46 | 4.1% |
| Total | 1,118 | 100.0% |
Housing Finances in Chinle
Median Income by Occupancy in Chinle
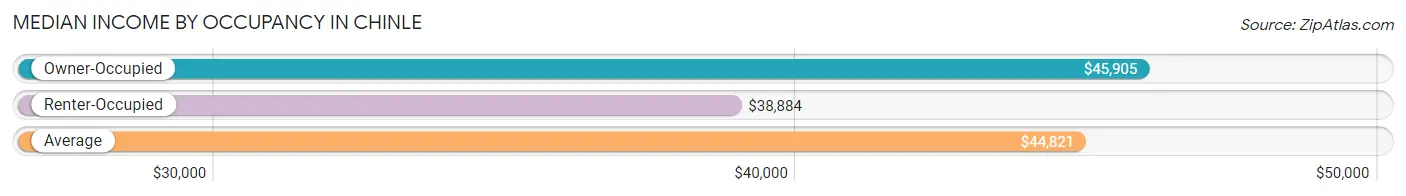
| Occupancy Type | # Households | Median Income |
| Owner-Occupied | 581 (52.0%) | $45,905 |
| Renter-Occupied | 537 (48.0%) | $38,884 |
| Average | 1,118 (100.0%) | $44,821 |
Occupancy by Householder Income Bracket in Chinle
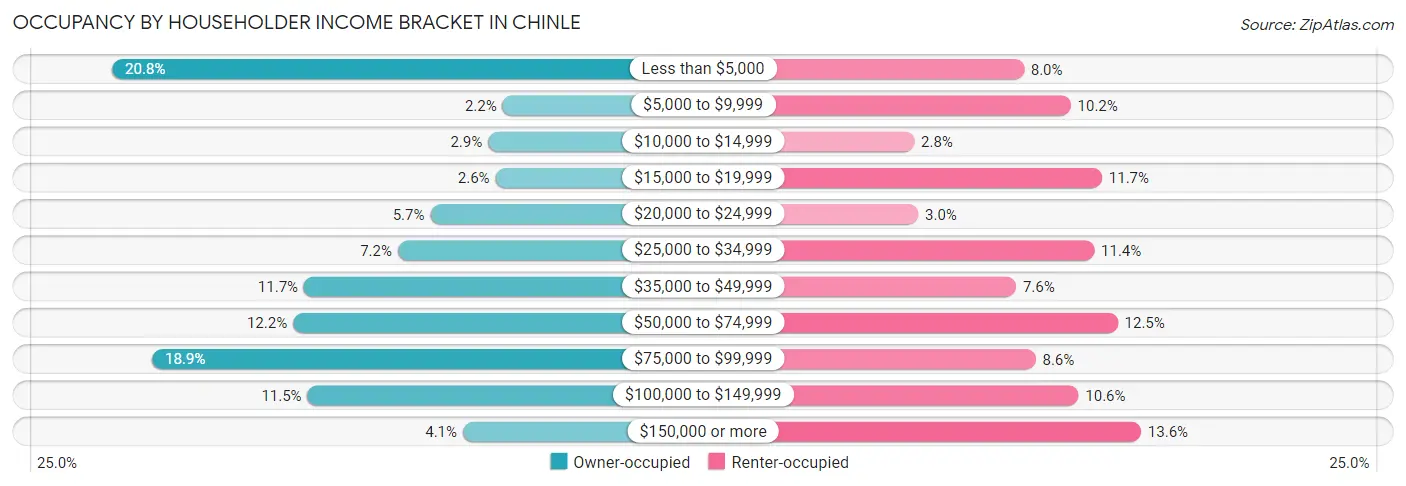
| Income Bracket | Owner-occupied | Renter-occupied |
| Less than $5,000 | 121 (20.8%) | 43 (8.0%) |
| $5,000 to $9,999 | 13 (2.2%) | 55 (10.2%) |
| $10,000 to $14,999 | 17 (2.9%) | 15 (2.8%) |
| $15,000 to $19,999 | 15 (2.6%) | 63 (11.7%) |
| $20,000 to $24,999 | 33 (5.7%) | 16 (3.0%) |
| $25,000 to $34,999 | 42 (7.2%) | 61 (11.4%) |
| $35,000 to $49,999 | 68 (11.7%) | 41 (7.6%) |
| $50,000 to $74,999 | 71 (12.2%) | 67 (12.5%) |
| $75,000 to $99,999 | 110 (18.9%) | 46 (8.6%) |
| $100,000 to $149,999 | 67 (11.5%) | 57 (10.6%) |
| $150,000 or more | 24 (4.1%) | 73 (13.6%) |
| Total | 581 (100.0%) | 537 (100.0%) |
Monthly Housing Cost Tiers in Chinle
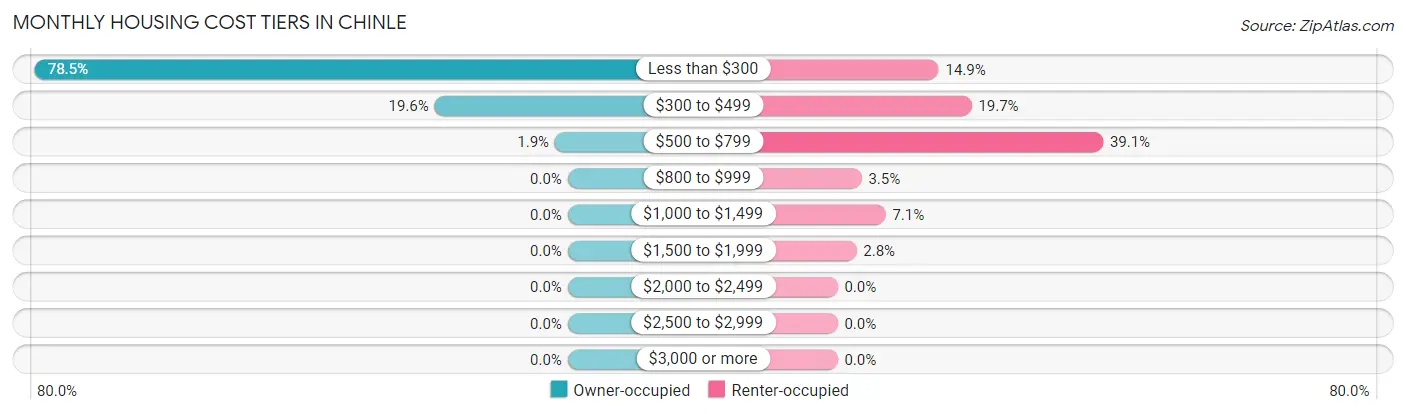
| Monthly Cost | Owner-occupied | Renter-occupied |
| Less than $300 | 456 (78.5%) | 80 (14.9%) |
| $300 to $499 | 114 (19.6%) | 106 (19.7%) |
| $500 to $799 | 11 (1.9%) | 210 (39.1%) |
| $800 to $999 | 0 (0.0%) | 19 (3.5%) |
| $1,000 to $1,499 | 0 (0.0%) | 38 (7.1%) |
| $1,500 to $1,999 | 0 (0.0%) | 15 (2.8%) |
| $2,000 to $2,499 | 0 (0.0%) | 0 (0.0%) |
| $2,500 to $2,999 | 0 (0.0%) | 0 (0.0%) |
| $3,000 or more | 0 (0.0%) | 0 (0.0%) |
| Total | 581 (100.0%) | 537 (100.0%) |
Physical Housing Characteristics in Chinle
Housing Structures in Chinle
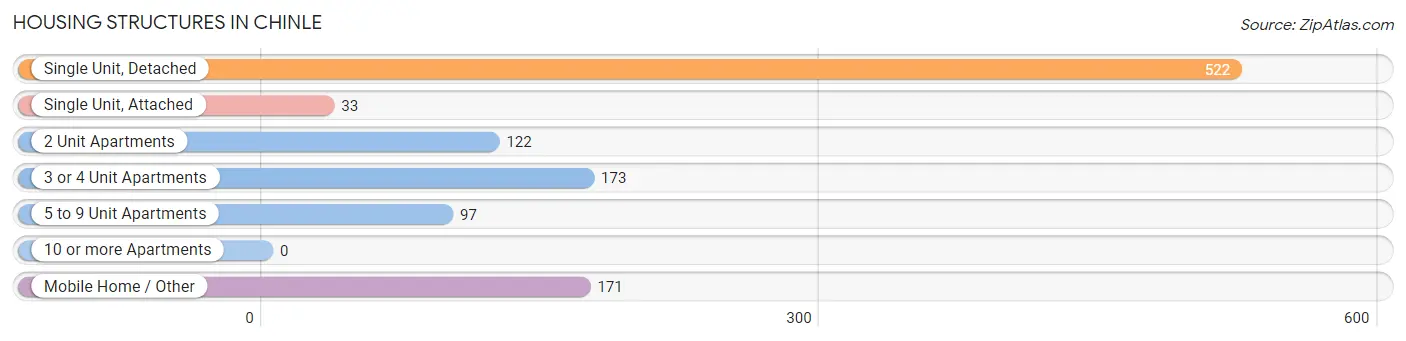
| Structure Type | # Housing Units | % Housing Units |
| Single Unit, Detached | 522 | 46.7% |
| Single Unit, Attached | 33 | 2.9% |
| 2 Unit Apartments | 122 | 10.9% |
| 3 or 4 Unit Apartments | 173 | 15.5% |
| 5 to 9 Unit Apartments | 97 | 8.7% |
| 10 or more Apartments | 0 | 0.0% |
| Mobile Home / Other | 171 | 15.3% |
| Total | 1,118 | 100.0% |
Housing Structures by Occupancy in Chinle
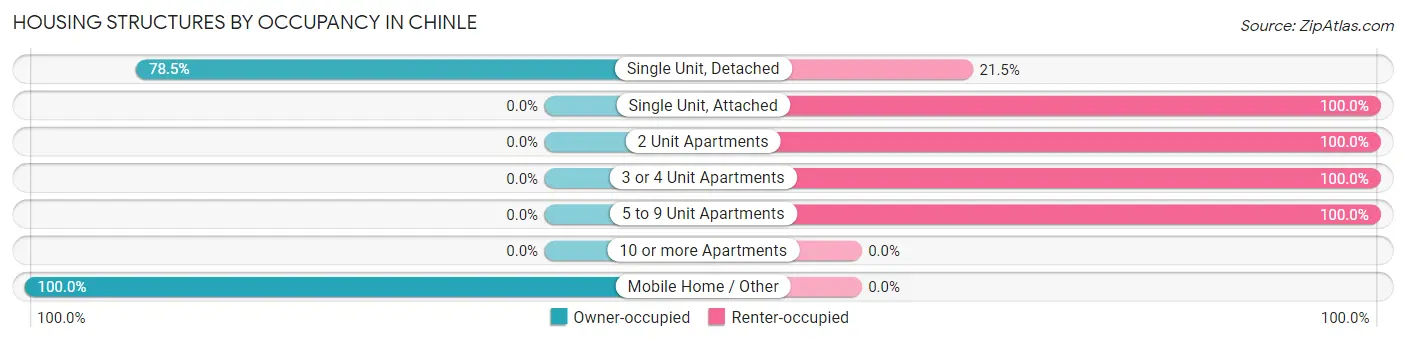
| Structure Type | Owner-occupied | Renter-occupied |
| Single Unit, Detached | 410 (78.5%) | 112 (21.5%) |
| Single Unit, Attached | 0 (0.0%) | 33 (100.0%) |
| 2 Unit Apartments | 0 (0.0%) | 122 (100.0%) |
| 3 or 4 Unit Apartments | 0 (0.0%) | 173 (100.0%) |
| 5 to 9 Unit Apartments | 0 (0.0%) | 97 (100.0%) |
| 10 or more Apartments | 0 (0.0%) | 0 (0.0%) |
| Mobile Home / Other | 171 (100.0%) | 0 (0.0%) |
| Total | 581 (52.0%) | 537 (48.0%) |
Housing Structures by Number of Rooms in Chinle
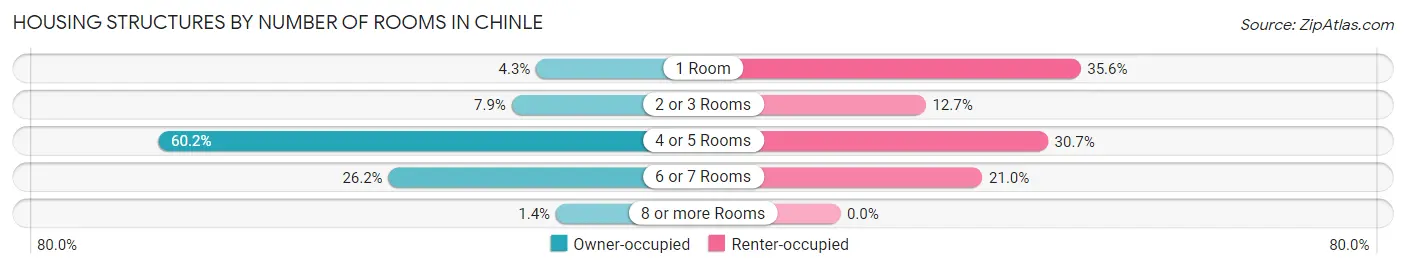
| Number of Rooms | Owner-occupied | Renter-occupied |
| 1 Room | 25 (4.3%) | 191 (35.6%) |
| 2 or 3 Rooms | 46 (7.9%) | 68 (12.7%) |
| 4 or 5 Rooms | 350 (60.2%) | 165 (30.7%) |
| 6 or 7 Rooms | 152 (26.2%) | 113 (21.0%) |
| 8 or more Rooms | 8 (1.4%) | 0 (0.0%) |
| Total | 581 (100.0%) | 537 (100.0%) |
Housing Structure by Heating Type in Chinle
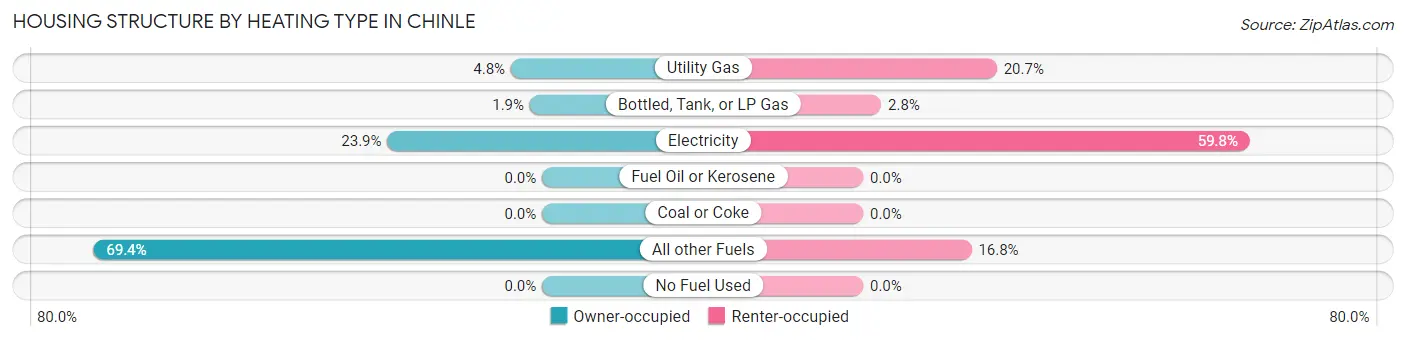
| Heating Type | Owner-occupied | Renter-occupied |
| Utility Gas | 28 (4.8%) | 111 (20.7%) |
| Bottled, Tank, or LP Gas | 11 (1.9%) | 15 (2.8%) |
| Electricity | 139 (23.9%) | 321 (59.8%) |
| Fuel Oil or Kerosene | 0 (0.0%) | 0 (0.0%) |
| Coal or Coke | 0 (0.0%) | 0 (0.0%) |
| All other Fuels | 403 (69.4%) | 90 (16.8%) |
| No Fuel Used | 0 (0.0%) | 0 (0.0%) |
| Total | 581 (100.0%) | 537 (100.0%) |
Household Vehicle Usage in Chinle
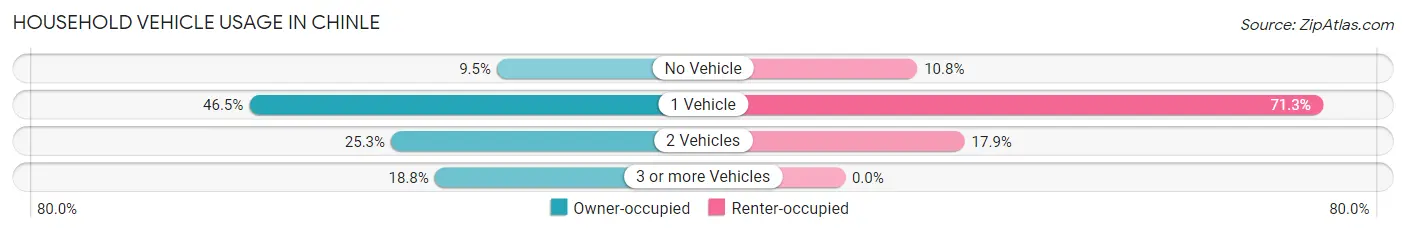
| Vehicles per Household | Owner-occupied | Renter-occupied |
| No Vehicle | 55 (9.5%) | 58 (10.8%) |
| 1 Vehicle | 270 (46.5%) | 383 (71.3%) |
| 2 Vehicles | 147 (25.3%) | 96 (17.9%) |
| 3 or more Vehicles | 109 (18.8%) | 0 (0.0%) |
| Total | 581 (100.0%) | 537 (100.0%) |
Real Estate & Mortgages in Chinle
Real Estate and Mortgage Overview in Chinle
| Characteristic | Without Mortgage | With Mortgage |
| Housing Units | 570 | 11 |
| Median Property Value | $33,900 | $0 |
| Median Household Income | $46,379 | $0 |
| Monthly Housing Costs | $203 | $0 |
| Real Estate Taxes | - | - |
Property Value by Mortgage Status in Chinle
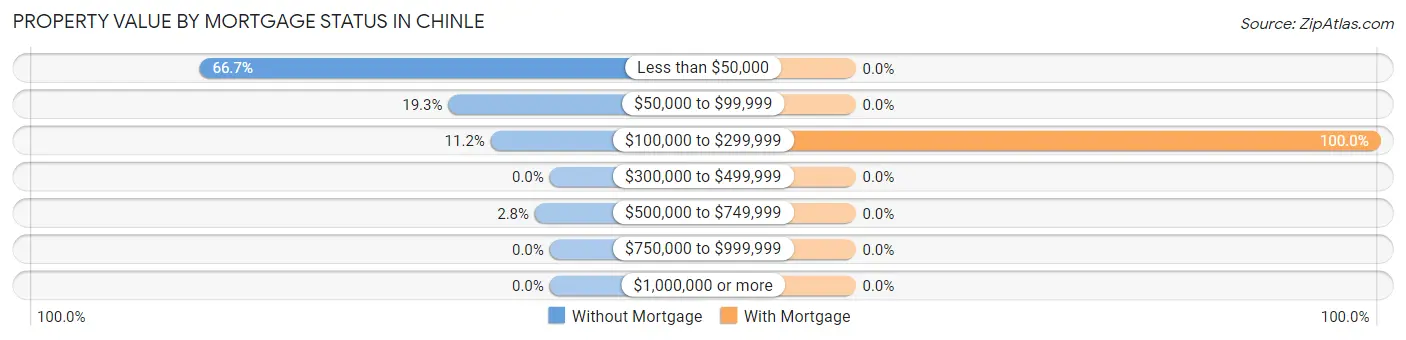
| Property Value | Without Mortgage | With Mortgage |
| Less than $50,000 | 380 (66.7%) | 0 (0.0%) |
| $50,000 to $99,999 | 110 (19.3%) | 0 (0.0%) |
| $100,000 to $299,999 | 64 (11.2%) | 11 (100.0%) |
| $300,000 to $499,999 | 0 (0.0%) | 0 (0.0%) |
| $500,000 to $749,999 | 16 (2.8%) | 0 (0.0%) |
| $750,000 to $999,999 | 0 (0.0%) | 0 (0.0%) |
| $1,000,000 or more | 0 (0.0%) | 0 (0.0%) |
| Total | 570 (100.0%) | 11 (100.0%) |
Household Income by Mortgage Status in Chinle
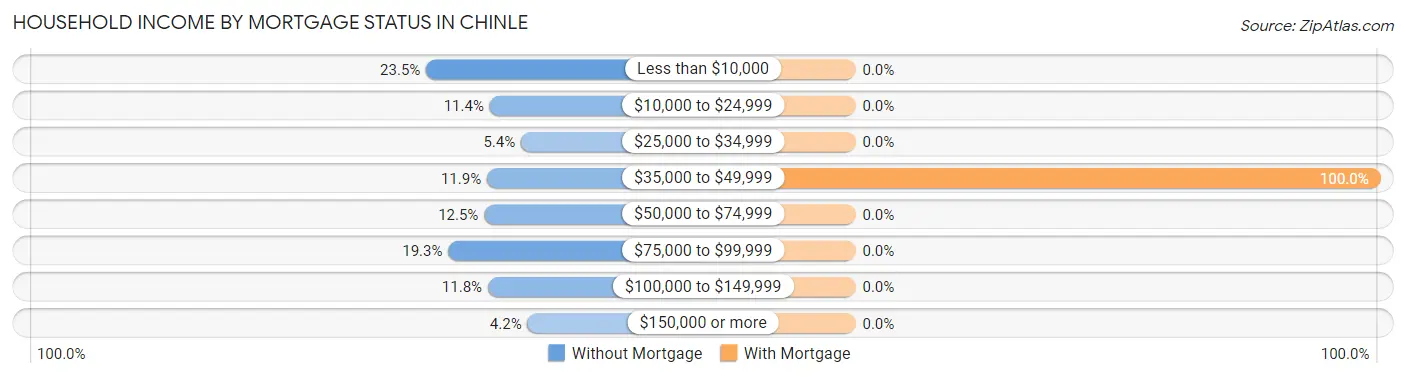
| Household Income | Without Mortgage | With Mortgage |
| Less than $10,000 | 134 (23.5%) | 0 (0.0%) |
| $10,000 to $24,999 | 65 (11.4%) | 0 (0.0%) |
| $25,000 to $34,999 | 31 (5.4%) | 0 (0.0%) |
| $35,000 to $49,999 | 68 (11.9%) | 11 (100.0%) |
| $50,000 to $74,999 | 71 (12.5%) | 0 (0.0%) |
| $75,000 to $99,999 | 110 (19.3%) | 0 (0.0%) |
| $100,000 to $149,999 | 67 (11.7%) | 0 (0.0%) |
| $150,000 or more | 24 (4.2%) | 0 (0.0%) |
| Total | 570 (100.0%) | 11 (100.0%) |
Property Value to Household Income Ratio in Chinle
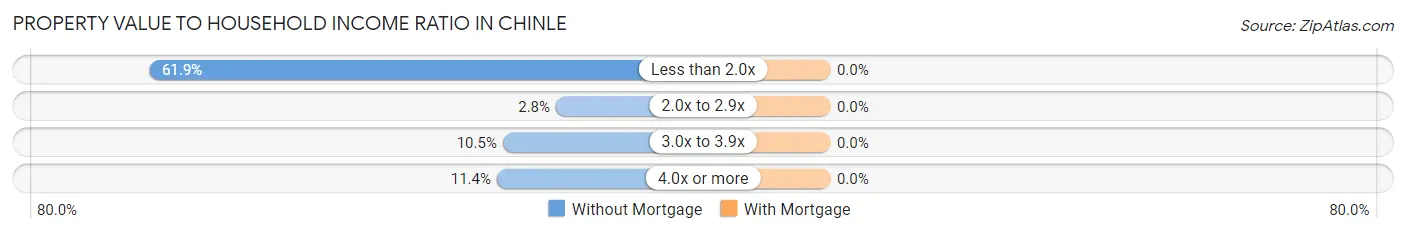
| Value-to-Income Ratio | Without Mortgage | With Mortgage |
| Less than 2.0x | 353 (61.9%) | 0 (0.0%) |
| 2.0x to 2.9x | 16 (2.8%) | 0 (0.0%) |
| 3.0x to 3.9x | 60 (10.5%) | 0 (0.0%) |
| 4.0x or more | 65 (11.4%) | 0 (0.0%) |
| Total | 570 (100.0%) | 11 (100.0%) |
Real Estate Taxes by Mortgage Status in Chinle
| Property Taxes | Without Mortgage | With Mortgage |
| Less than $800 | 0 (0.0%) | 0 (0.0%) |
| $800 to $1,499 | 0 (0.0%) | 0 (0.0%) |
| $800 to $1,499 | 0 (0.0%) | 0 (0.0%) |
| Total | 570 (100.0%) | 11 (100.0%) |
Health & Disability in Chinle
Health Insurance Coverage by Age in Chinle
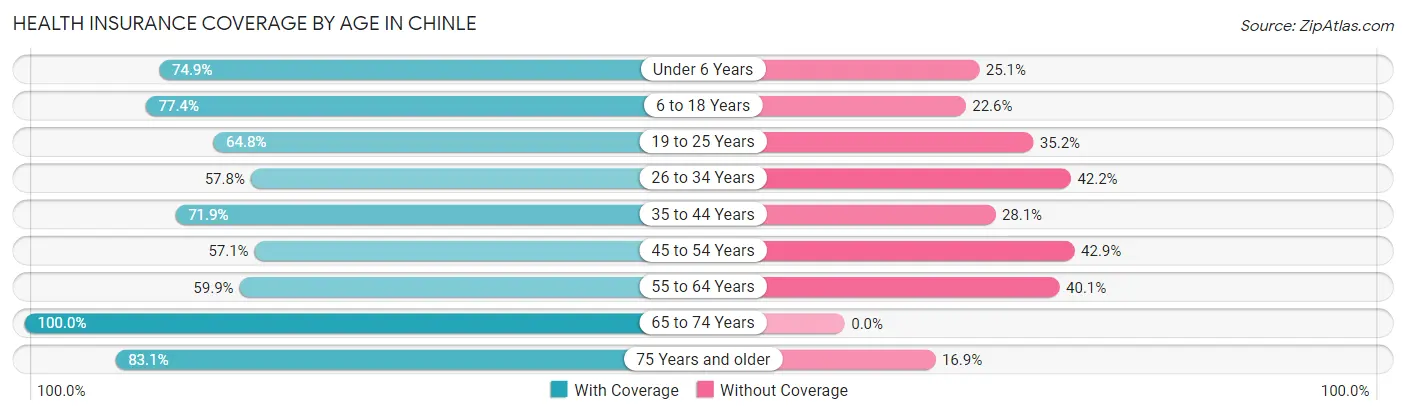
| Age Bracket | With Coverage | Without Coverage |
| Under 6 Years | 209 (74.9%) | 70 (25.1%) |
| 6 to 18 Years | 803 (77.4%) | 234 (22.6%) |
| 19 to 25 Years | 212 (64.8%) | 115 (35.2%) |
| 26 to 34 Years | 229 (57.8%) | 167 (42.2%) |
| 35 to 44 Years | 384 (71.9%) | 150 (28.1%) |
| 45 to 54 Years | 284 (57.1%) | 213 (42.9%) |
| 55 to 64 Years | 205 (59.9%) | 137 (40.1%) |
| 65 to 74 Years | 209 (100.0%) | 0 (0.0%) |
| 75 Years and older | 113 (83.1%) | 23 (16.9%) |
| Total | 2,648 (70.5%) | 1,109 (29.5%) |
Health Insurance Coverage by Citizenship Status in Chinle
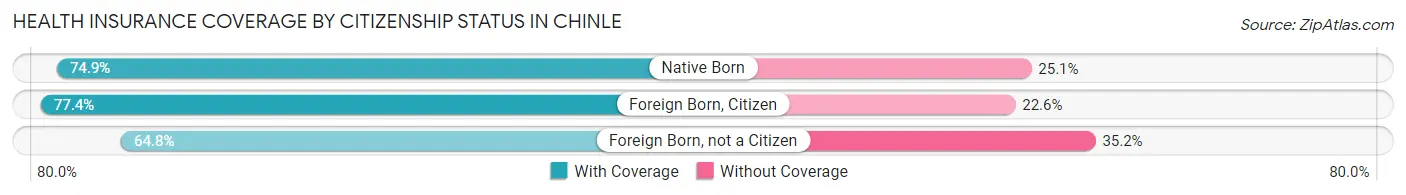
| Citizenship Status | With Coverage | Without Coverage |
| Native Born | 209 (74.9%) | 70 (25.1%) |
| Foreign Born, Citizen | 803 (77.4%) | 234 (22.6%) |
| Foreign Born, not a Citizen | 212 (64.8%) | 115 (35.2%) |
Health Insurance Coverage by Household Income in Chinle
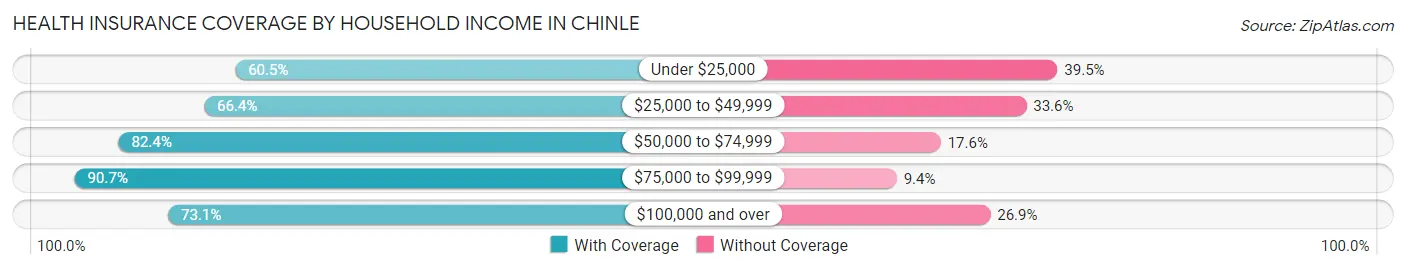
| Household Income | With Coverage | Without Coverage |
| Under $25,000 | 882 (60.5%) | 575 (39.5%) |
| $25,000 to $49,999 | 375 (66.4%) | 190 (33.6%) |
| $50,000 to $74,999 | 501 (82.4%) | 107 (17.6%) |
| $75,000 to $99,999 | 291 (90.6%) | 30 (9.3%) |
| $100,000 and over | 563 (73.1%) | 207 (26.9%) |
Public vs Private Health Insurance Coverage by Age in Chinle
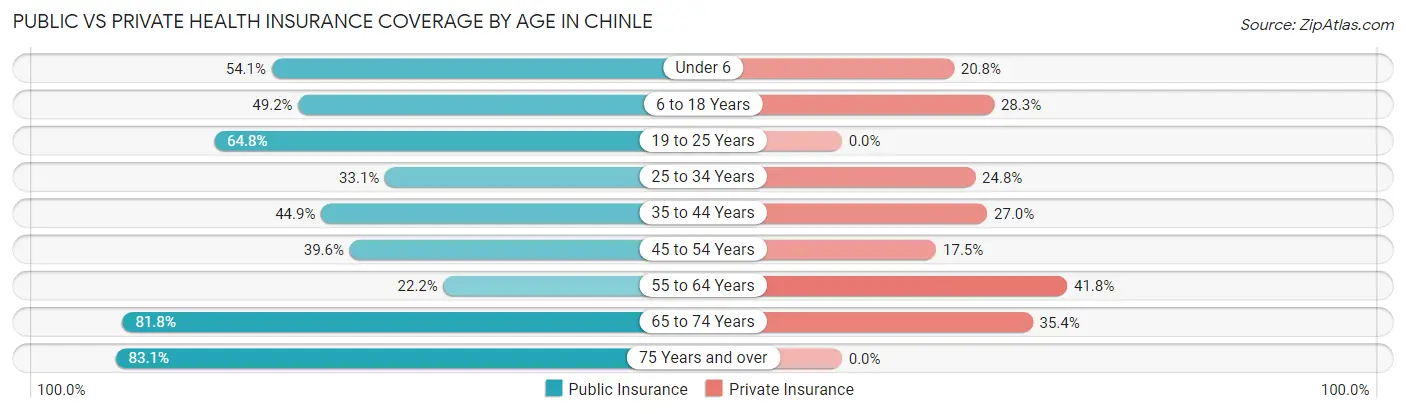
| Age Bracket | Public Insurance | Private Insurance |
| Under 6 | 151 (54.1%) | 58 (20.8%) |
| 6 to 18 Years | 510 (49.2%) | 293 (28.2%) |
| 19 to 25 Years | 212 (64.8%) | 0 (0.0%) |
| 25 to 34 Years | 131 (33.1%) | 98 (24.7%) |
| 35 to 44 Years | 240 (44.9%) | 144 (27.0%) |
| 45 to 54 Years | 197 (39.6%) | 87 (17.5%) |
| 55 to 64 Years | 76 (22.2%) | 143 (41.8%) |
| 65 to 74 Years | 171 (81.8%) | 74 (35.4%) |
| 75 Years and over | 113 (83.1%) | 0 (0.0%) |
| Total | 1,801 (47.9%) | 897 (23.9%) |
Disability Status by Sex by Age in Chinle
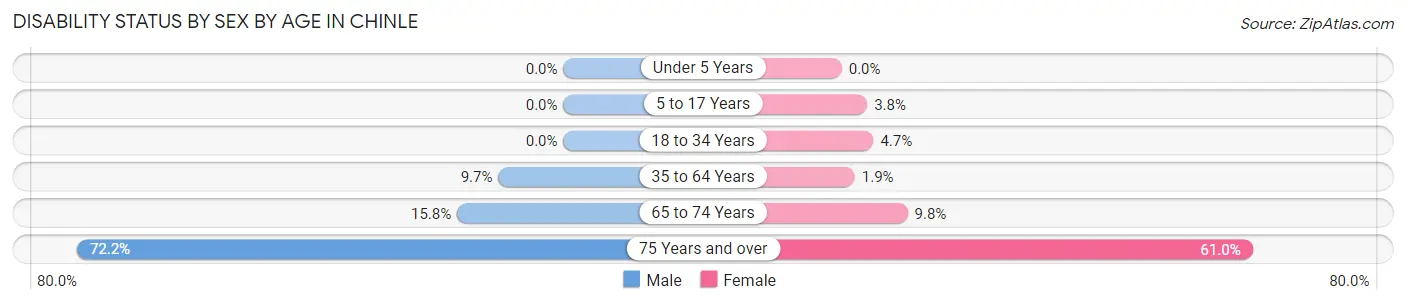
| Age Bracket | Male | Female |
| Under 5 Years | 0 (0.0%) | 0 (0.0%) |
| 5 to 17 Years | 0 (0.0%) | 22 (3.8%) |
| 18 to 34 Years | 0 (0.0%) | 15 (4.7%) |
| 35 to 64 Years | 63 (9.7%) | 14 (1.9%) |
| 65 to 74 Years | 12 (15.8%) | 13 (9.8%) |
| 75 Years and over | 26 (72.2%) | 61 (61.0%) |
Disability Class by Sex by Age in Chinle
Disability Class: Hearing Difficulty
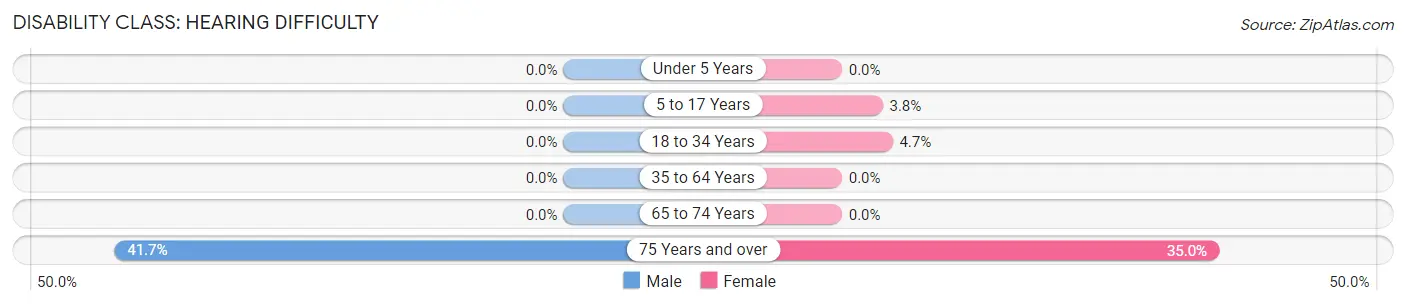
| Age Bracket | Male | Female |
| Under 5 Years | 0 (0.0%) | 0 (0.0%) |
| 5 to 17 Years | 0 (0.0%) | 22 (3.8%) |
| 18 to 34 Years | 0 (0.0%) | 15 (4.7%) |
| 35 to 64 Years | 0 (0.0%) | 0 (0.0%) |
| 65 to 74 Years | 0 (0.0%) | 0 (0.0%) |
| 75 Years and over | 15 (41.7%) | 35 (35.0%) |
Disability Class: Vision Difficulty
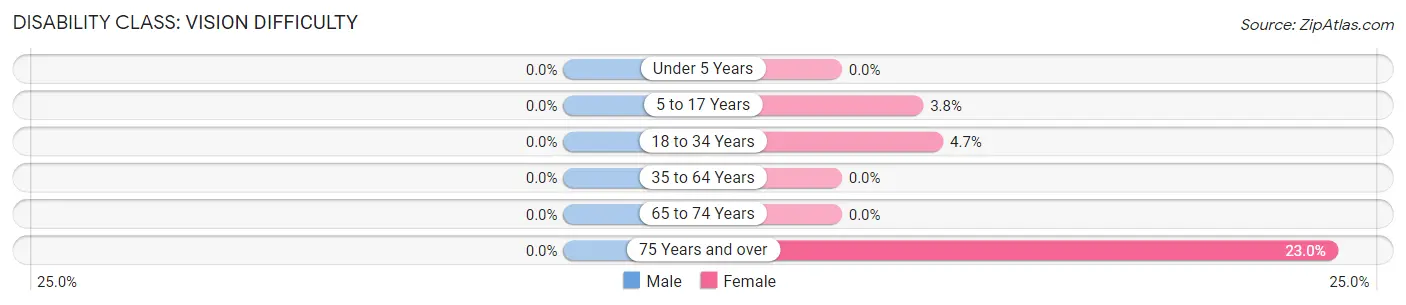
| Age Bracket | Male | Female |
| Under 5 Years | 0 (0.0%) | 0 (0.0%) |
| 5 to 17 Years | 0 (0.0%) | 22 (3.8%) |
| 18 to 34 Years | 0 (0.0%) | 15 (4.7%) |
| 35 to 64 Years | 0 (0.0%) | 0 (0.0%) |
| 65 to 74 Years | 0 (0.0%) | 0 (0.0%) |
| 75 Years and over | 0 (0.0%) | 23 (23.0%) |
Disability Class: Cognitive Difficulty
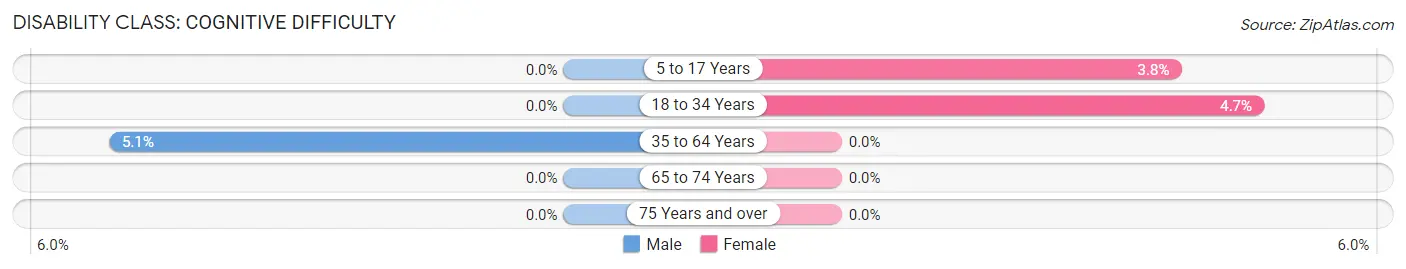
| Age Bracket | Male | Female |
| 5 to 17 Years | 0 (0.0%) | 22 (3.8%) |
| 18 to 34 Years | 0 (0.0%) | 15 (4.7%) |
| 35 to 64 Years | 33 (5.1%) | 0 (0.0%) |
| 65 to 74 Years | 0 (0.0%) | 0 (0.0%) |
| 75 Years and over | 0 (0.0%) | 0 (0.0%) |
Disability Class: Ambulatory Difficulty
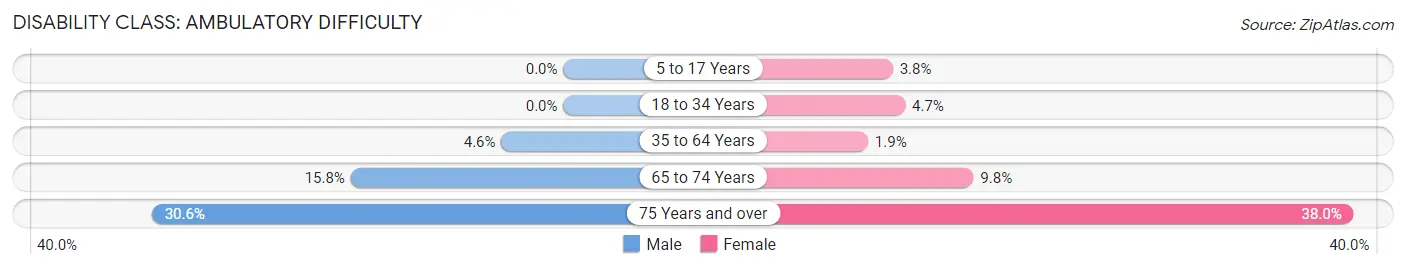
| Age Bracket | Male | Female |
| 5 to 17 Years | 0 (0.0%) | 22 (3.8%) |
| 18 to 34 Years | 0 (0.0%) | 15 (4.7%) |
| 35 to 64 Years | 30 (4.6%) | 14 (1.9%) |
| 65 to 74 Years | 12 (15.8%) | 13 (9.8%) |
| 75 Years and over | 11 (30.6%) | 38 (38.0%) |
Disability Class: Self-Care Difficulty
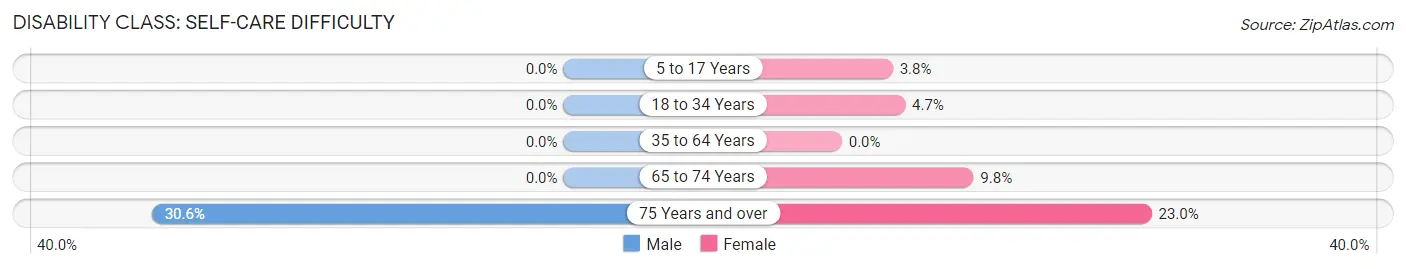
| Age Bracket | Male | Female |
| 5 to 17 Years | 0 (0.0%) | 22 (3.8%) |
| 18 to 34 Years | 0 (0.0%) | 15 (4.7%) |
| 35 to 64 Years | 0 (0.0%) | 0 (0.0%) |
| 65 to 74 Years | 0 (0.0%) | 13 (9.8%) |
| 75 Years and over | 11 (30.6%) | 23 (23.0%) |
Technology Access in Chinle
Computing Device Access in Chinle
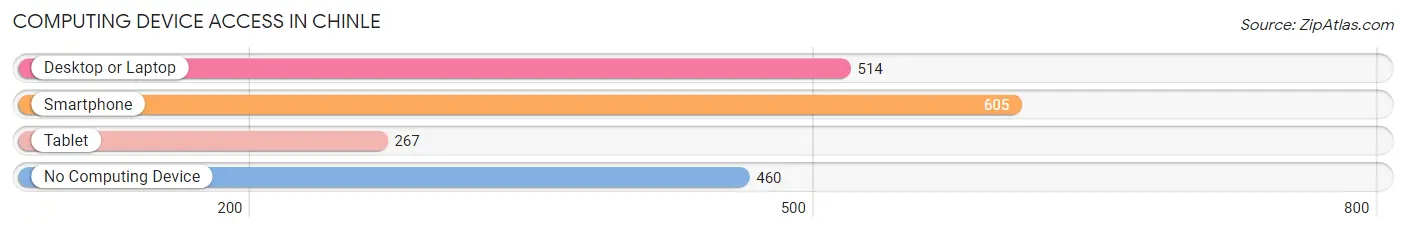
| Device Type | # Households | % Households |
| Desktop or Laptop | 514 | 46.0% |
| Smartphone | 605 | 54.1% |
| Tablet | 267 | 23.9% |
| No Computing Device | 460 | 41.1% |
| Total | 1,118 | 100.0% |
Internet Access in Chinle
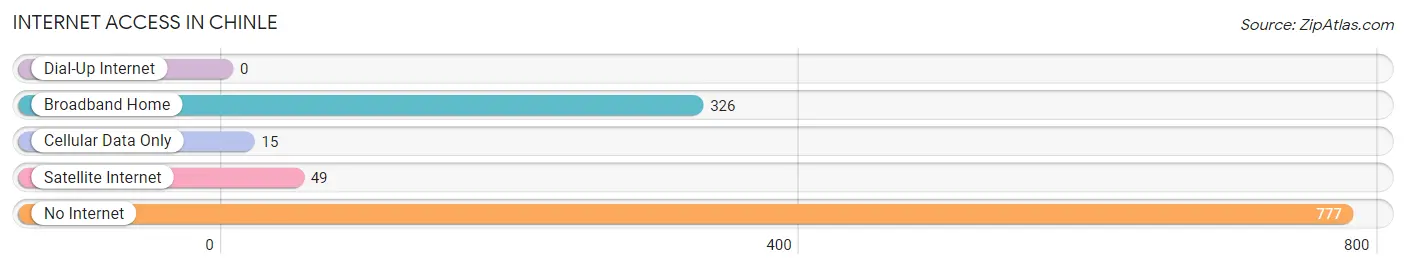
| Internet Type | # Households | % Households |
| Dial-Up Internet | 0 | 0.0% |
| Broadband Home | 326 | 29.2% |
| Cellular Data Only | 15 | 1.3% |
| Satellite Internet | 49 | 4.4% |
| No Internet | 777 | 69.5% |
| Total | 1,118 | 100.0% |
Chinle Summary
Chinle, Arizona is a small town located in the Navajo Nation in Apache County, Arizona. It is situated in the heart of the Navajo Nation, near the Four Corners region of the United States. The town is located on the banks of the Chinle Wash, a tributary of the Little Colorado River. The town is home to approximately 5,000 people, most of whom are Navajo.
Geography
Chinle is located in the heart of the Navajo Nation, in the Four Corners region of the United States. The town is situated on the banks of the Chinle Wash, a tributary of the Little Colorado River. The town is surrounded by the Chuska Mountains to the east, the Lukachukai Mountains to the west, and the Defiance Plateau to the south. The town is located at an elevation of 5,000 feet above sea level.
The climate in Chinle is semi-arid, with hot summers and cold winters. The average annual temperature is around 60°F, with temperatures ranging from the low 30s in the winter to the high 90s in the summer. The average annual precipitation is around 10 inches, with most of the precipitation occurring in the summer months.
Economy
The economy of Chinle is largely based on tourism and agriculture. The town is home to several tourist attractions, including the Navajo National Monument, Canyon de Chelly National Monument, and the Hubbell Trading Post National Historic Site. The town is also home to several agricultural operations, including cattle ranches, sheep farms, and orchards.
The town is also home to several businesses, including restaurants, hotels, and retail stores. The town is also home to a number of government offices, including the Navajo Nation government offices, the Bureau of Indian Affairs, and the Navajo Tribal Utility Authority.
Demographics
As of the 2010 census, the population of Chinle was 5,053. The racial makeup of the town was 95.3% Native American, 2.2% White, 0.3% African American, 0.2% Asian, 0.1% Pacific Islander, and 1.9% from other races. The median household income was $25,938, and the median family income was $30,938.
The town is home to a number of Navajo clans, including the Tódích'íi'nii, the Naakai Diné, the Tábaahá, the Tl'izí, the Tó'áhaní, and the Táchii'nii. The town is also home to a number of other Native American tribes, including the Hopi, the Zuni, and the Apache.
Conclusion
Chinle, Arizona is a small town located in the Navajo Nation in Apache County, Arizona. It is situated in the heart of the Navajo Nation, near the Four Corners region of the United States. The town is located on the banks of the Chinle Wash, a tributary of the Little Colorado River. The town is home to approximately 5,000 people, most of whom are Navajo. The economy of Chinle is largely based on tourism and agriculture, and the town is home to several tourist attractions, businesses, and government offices. The racial makeup of the town is 95.3% Native American, 2.2% White, 0.3% African American, 0.2% Asian, 0.1% Pacific Islander, and 1.9% from other races. The median household income was $25,938, and the median family income was $30,938. The town is home to a number of Navajo clans, as well as other Native American tribes.
Common Questions
What is Per Capita Income in Chinle?
Per Capita income in Chinle is $21,035.
What is the Median Family Income in Chinle?
Median Family Income in Chinle is $42,589.
What is the Median Household income in Chinle?
Median Household Income in Chinle is $44,821.
What is Income or Wage Gap in Chinle?
Income or Wage Gap in Chinle is 48.6%.
Women in Chinle earn 51.4 cents for every dollar earned by a man.
What is Family Income Deficit in Chinle?
Family Income Deficit in Chinle is $16,663.
Families that are below poverty line in Chinle earn $16,663 less on average than the poverty threshold level.
What is Inequality or Gini Index in Chinle?
Inequality or Gini Index in Chinle is 0.51.
What is the Total Population of Chinle?
Total Population of Chinle is 3,888.
What is the Total Male Population of Chinle?
Total Male Population of Chinle is 1,868.
What is the Total Female Population of Chinle?
Total Female Population of Chinle is 2,020.
What is the Ratio of Males per 100 Females in Chinle?
There are 92.48 Males per 100 Females in Chinle.
What is the Ratio of Females per 100 Males in Chinle?
There are 108.14 Females per 100 Males in Chinle.
What is the Median Population Age in Chinle?
Median Population Age in Chinle is 32.3 Years.
What is the Average Family Size in Chinle
Average Family Size in Chinle is 4.6 People.
What is the Average Household Size in Chinle
Average Household Size in Chinle is 3.3 People.
How Large is the Labor Force in Chinle?
There are 1,261 People in the Labor Forcein in Chinle.
What is the Percentage of People in the Labor Force in Chinle?
44.4% of People are in the Labor Force in Chinle.
What is the Unemployment Rate in Chinle?
Unemployment Rate in Chinle is 11.4%.