Stanfield, AZ Map & Demographics
Stanfield Map
Stanfield Overview
$20,225
PER CAPITA INCOME
27.9%
WAGE / INCOME GAP [ % ]
72.1¢/ $1
WAGE / INCOME GAP [ $ ]
0.44
INEQUALITY / GINI INDEX
457
TOTAL POPULATION
253
MALE POPULATION
204
FEMALE POPULATION
124.02
MALES / 100 FEMALES
80.63
FEMALES / 100 MALES
47.3
MEDIAN AGE
3.8
AVG FAMILY SIZE
3.5
AVG HOUSEHOLD SIZE
220
LABOR FORCE [ PEOPLE ]
66.1%
PERCENT IN LABOR FORCE
19.5%
UNEMPLOYMENT RATE
Stanfield Zip Codes
Stanfield Area Codes
Income in Stanfield
Income Overview in Stanfield
| Characteristic | Number | Measure |
| Per Capita Income | 457 | $20,225 |
| Median Family Income | 69 | $0 |
| Mean Family Income | 69 | $55,126 |
| Median Household Income | 132 | $0 |
| Mean Household Income | 132 | $62,008 |
| Income Deficit | 69 | $0 |
| Wage / Income Gap (%) | 457 | 27.88% |
| Wage / Income Gap ($) | 457 | 72.12¢ per $1 |
| Gini / Inequality Index | 457 | 0.44 |
Earnings by Sex in Stanfield
Average Earnings in Stanfield are $20,058, $21,192 for men and $15,284 for women, a difference of 27.9%.
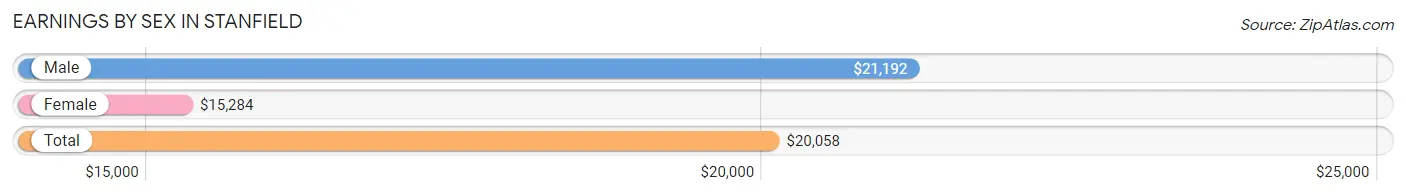
| Sex | Number | Average Earnings |
| Male | 155 (70.5%) | $21,192 |
| Female | 65 (29.5%) | $15,284 |
| Total | 220 (100.0%) | $20,058 |
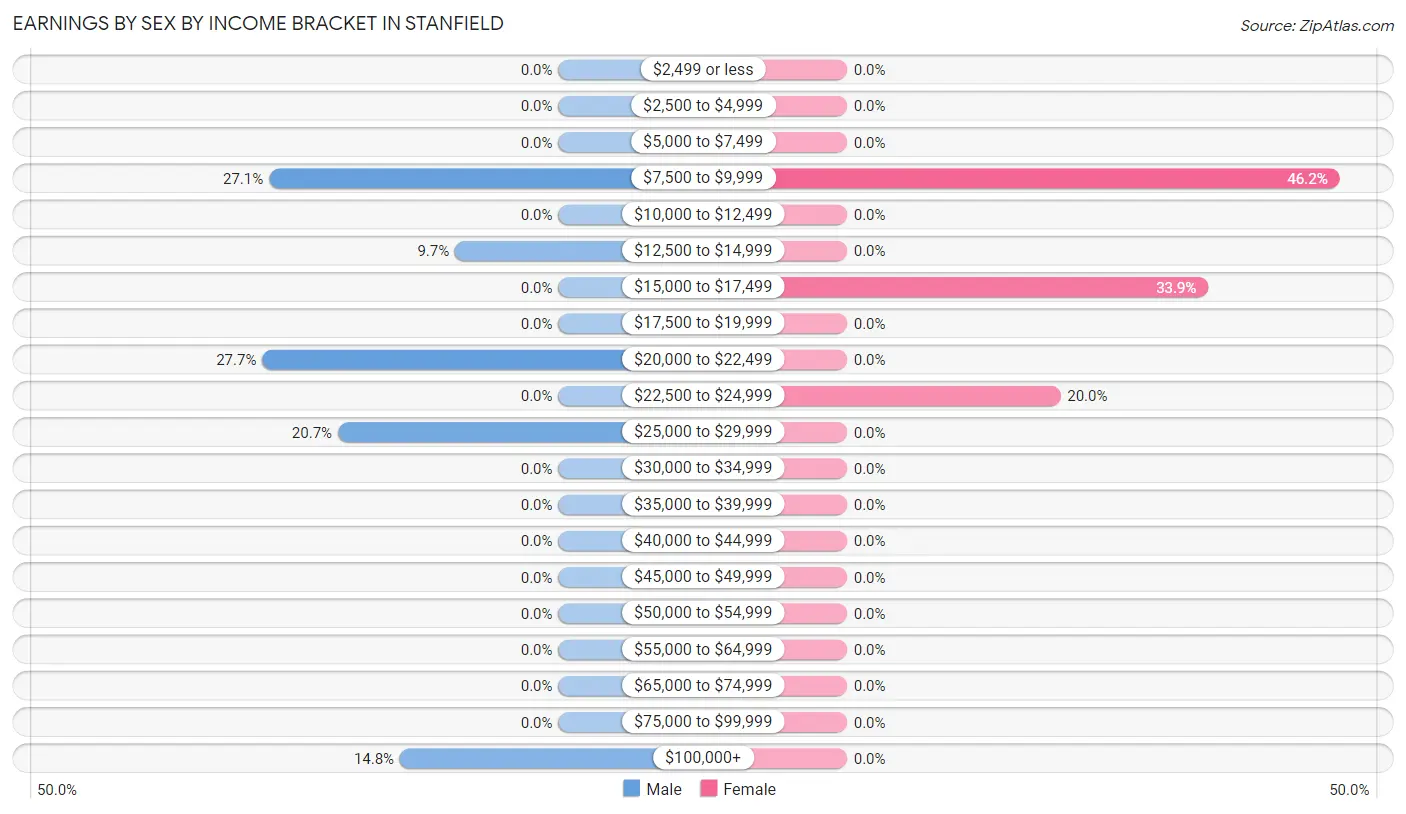
Earnings by Sex by Income Bracket in Stanfield
The most common earnings brackets in Stanfield are $20,000 to $22,499 for men (43 | 27.7%) and $7,500 to $9,999 for women (30 | 46.2%).
| Income | Male | Female |
| $2,499 or less | 0 (0.0%) | 0 (0.0%) |
| $2,500 to $4,999 | 0 (0.0%) | 0 (0.0%) |
| $5,000 to $7,499 | 0 (0.0%) | 0 (0.0%) |
| $7,500 to $9,999 | 42 (27.1%) | 30 (46.2%) |
| $10,000 to $12,499 | 0 (0.0%) | 0 (0.0%) |
| $12,500 to $14,999 | 15 (9.7%) | 0 (0.0%) |
| $15,000 to $17,499 | 0 (0.0%) | 22 (33.9%) |
| $17,500 to $19,999 | 0 (0.0%) | 0 (0.0%) |
| $20,000 to $22,499 | 43 (27.7%) | 0 (0.0%) |
| $22,500 to $24,999 | 0 (0.0%) | 13 (20.0%) |
| $25,000 to $29,999 | 32 (20.6%) | 0 (0.0%) |
| $30,000 to $34,999 | 0 (0.0%) | 0 (0.0%) |
| $35,000 to $39,999 | 0 (0.0%) | 0 (0.0%) |
| $40,000 to $44,999 | 0 (0.0%) | 0 (0.0%) |
| $45,000 to $49,999 | 0 (0.0%) | 0 (0.0%) |
| $50,000 to $54,999 | 0 (0.0%) | 0 (0.0%) |
| $55,000 to $64,999 | 0 (0.0%) | 0 (0.0%) |
| $65,000 to $74,999 | 0 (0.0%) | 0 (0.0%) |
| $75,000 to $99,999 | 0 (0.0%) | 0 (0.0%) |
| $100,000+ | 23 (14.8%) | 0 (0.0%) |
| Total | 155 (100.0%) | 65 (100.0%) |
Earnings by Sex by Educational Attainment in Stanfield
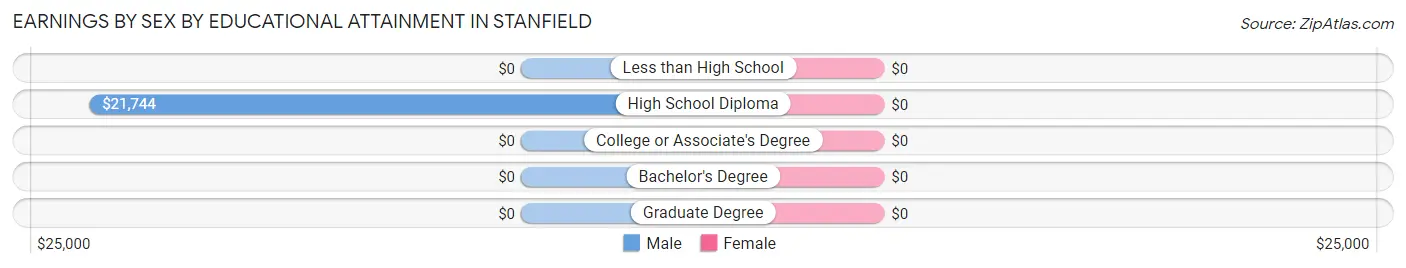
| Educational Attainment | Male Income | Female Income |
| Less than High School | - | - |
| High School Diploma | $21,744 | $0 |
| College or Associate's Degree | - | - |
| Bachelor's Degree | - | - |
| Graduate Degree | - | - |
| Total | $21,192 | $15,284 |
Family Income in Stanfield
Family Income Brackets in Stanfield
According to the Stanfield family income data, there are 32 families falling into the $25,000 to $34,999 income range, which is the most common income bracket and makes up 46.4% of all families.
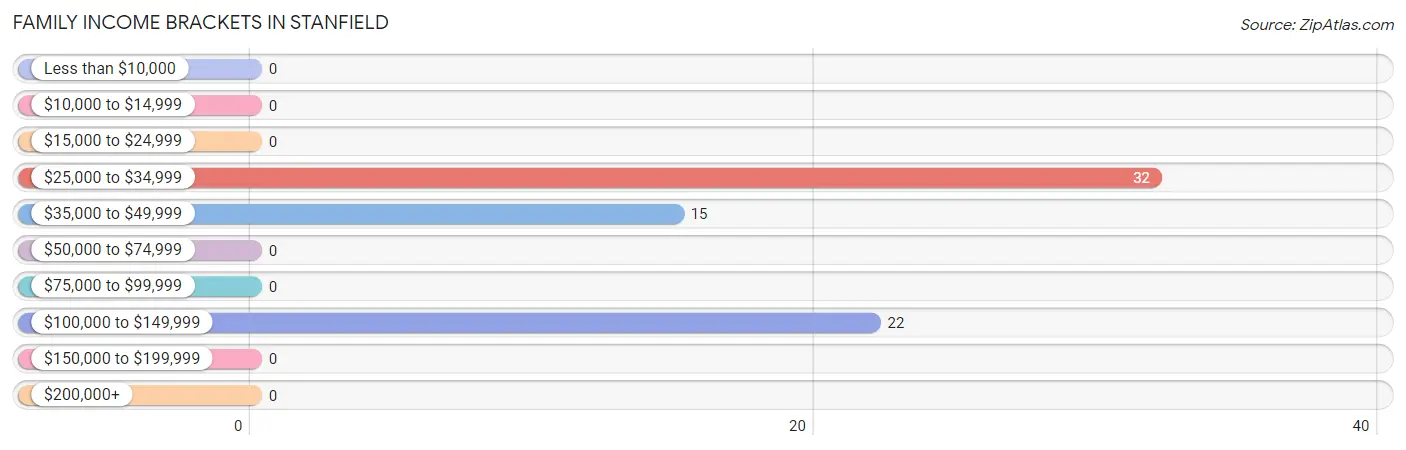
| Income Bracket | # Families | % Families |
| Less than $10,000 | 0 | 0.0% |
| $10,000 to $14,999 | 0 | 0.0% |
| $15,000 to $24,999 | 0 | 0.0% |
| $25,000 to $34,999 | 32 | 46.4% |
| $35,000 to $49,999 | 15 | 21.7% |
| $50,000 to $74,999 | 0 | 0.0% |
| $75,000 to $99,999 | 0 | 0.0% |
| $100,000 to $149,999 | 22 | 31.9% |
| $150,000 to $199,999 | 0 | 0.0% |
| $200,000+ | 0 | 0.0% |
Family Income by Famaliy Size in Stanfield
| Income Bracket | # Families | Median Income |
| 2-Person Families | 37 (53.6%) | $0 |
| 3-Person Families | 0 (0.0%) | $0 |
| 4-Person Families | 0 (0.0%) | $0 |
| 5-Person Families | 0 (0.0%) | $0 |
| 6-Person Families | 0 (0.0%) | $0 |
| 7+ Person Families | 32 (46.4%) | $0 |
| Total | 69 (100.0%) | $0 |
Family Income by Number of Earners in Stanfield
| Number of Earners | # Families | Median Income |
| No Earners | 22 (31.9%) | $0 |
| 1 Earner | 32 (46.4%) | $0 |
| 2 Earners | 15 (21.7%) | $0 |
| 3+ Earners | 0 (0.0%) | $0 |
| Total | 69 (100.0%) | $0 |
Household Income in Stanfield
Household Income Brackets in Stanfield
With 32 households falling in the category, the $25,000 to $34,999 income range is the most frequent in Stanfield, accounting for 24.2% of all households.
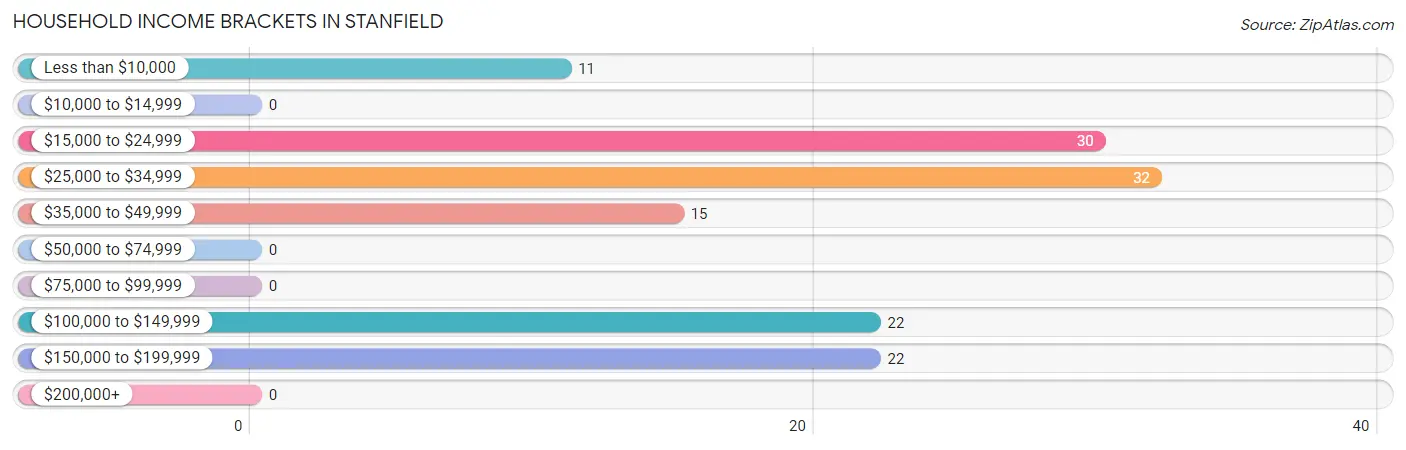
| Income Bracket | # Households | % Households |
| Less than $10,000 | 11 | 8.3% |
| $10,000 to $14,999 | 0 | 0.0% |
| $15,000 to $24,999 | 30 | 22.7% |
| $25,000 to $34,999 | 32 | 24.2% |
| $35,000 to $49,999 | 15 | 11.4% |
| $50,000 to $74,999 | 0 | 0.0% |
| $75,000 to $99,999 | 0 | 0.0% |
| $100,000 to $149,999 | 22 | 16.7% |
| $150,000 to $199,999 | 22 | 16.7% |
| $200,000+ | 0 | 0.0% |
Household Income by Householder Age in Stanfield
| Income Bracket | # Households | Median Income |
| 15 to 24 Years | 0 (0.0%) | $0 |
| 25 to 44 Years | 47 (35.6%) | $0 |
| 45 to 64 Years | 33 (25.0%) | $0 |
| 65+ Years | 52 (39.4%) | $0 |
| Total | 132 (100.0%) | $0 |
Poverty in Stanfield
Income Below Poverty by Sex and Age in Stanfield
With 59.3% poverty level for males and 56.4% for females among the residents of Stanfield, under 5 year old males and under 5 year old females are the most vulnerable to poverty, with 23 males (100.0%) and 48 females (100.0%) in their respective age groups living below the poverty level.
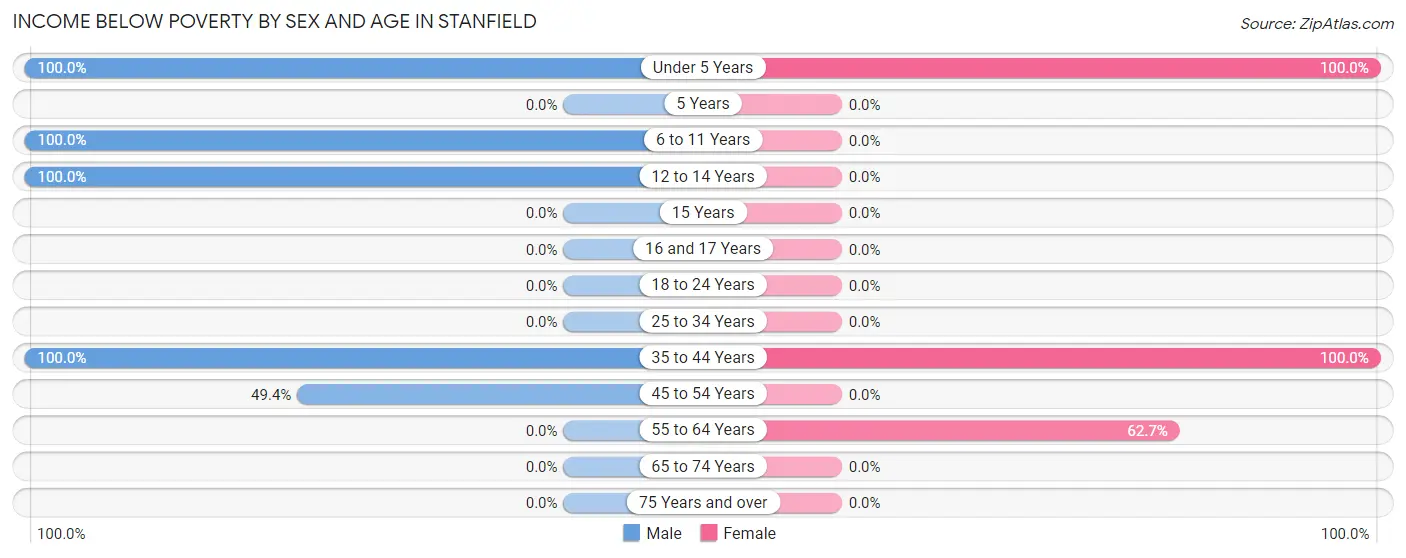
| Age Bracket | Male | Female |
| Under 5 Years | 23 (100.0%) | 48 (100.0%) |
| 5 Years | 0 (0.0%) | 0 (0.0%) |
| 6 to 11 Years | 26 (100.0%) | 0 (0.0%) |
| 12 to 14 Years | 27 (100.0%) | 0 (0.0%) |
| 15 Years | 0 (0.0%) | 0 (0.0%) |
| 16 and 17 Years | 0 (0.0%) | 0 (0.0%) |
| 18 to 24 Years | 0 (0.0%) | 0 (0.0%) |
| 25 to 34 Years | 0 (0.0%) | 0 (0.0%) |
| 35 to 44 Years | 32 (100.0%) | 30 (100.0%) |
| 45 to 54 Years | 42 (49.4%) | 0 (0.0%) |
| 55 to 64 Years | 0 (0.0%) | 37 (62.7%) |
| 65 to 74 Years | 0 (0.0%) | 0 (0.0%) |
| 75 Years and over | 0 (0.0%) | 0 (0.0%) |
| Total | 150 (59.3%) | 115 (56.4%) |
Income Above Poverty by Sex and Age in Stanfield
According to the poverty statistics in Stanfield, males aged 25 to 34 years and females aged 25 to 34 years are the age groups that are most secure financially, with 100.0% of males and 100.0% of females in these age groups living above the poverty line.
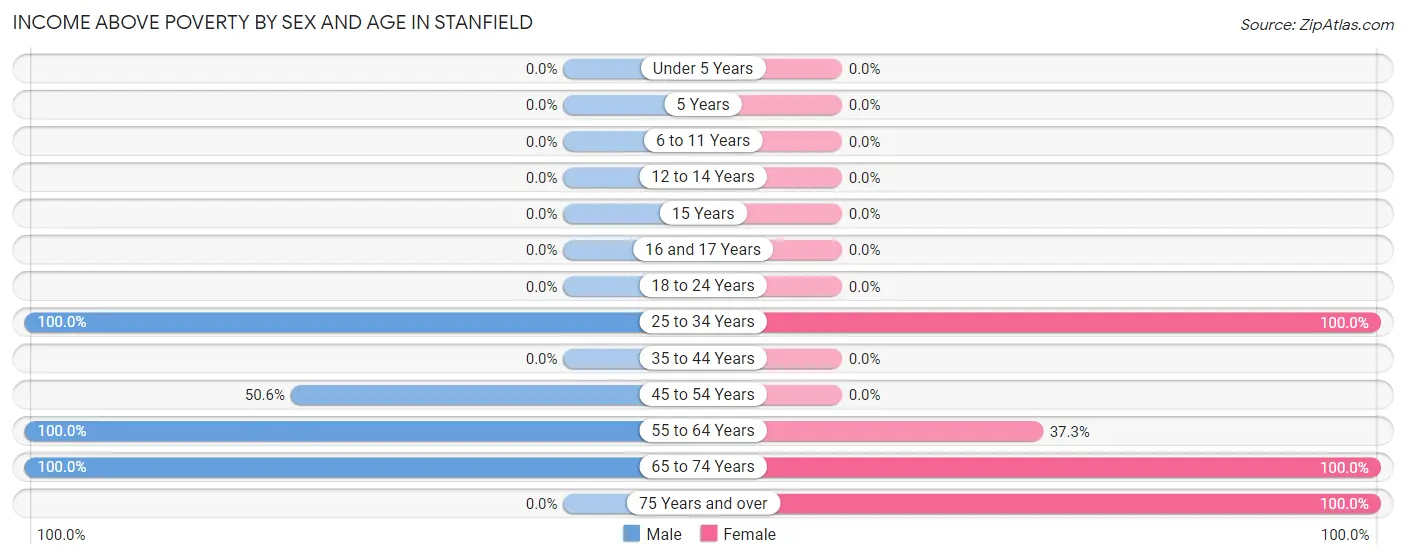
| Age Bracket | Male | Female |
| Under 5 Years | 0 (0.0%) | 0 (0.0%) |
| 5 Years | 0 (0.0%) | 0 (0.0%) |
| 6 to 11 Years | 0 (0.0%) | 0 (0.0%) |
| 12 to 14 Years | 0 (0.0%) | 0 (0.0%) |
| 15 Years | 0 (0.0%) | 0 (0.0%) |
| 16 and 17 Years | 0 (0.0%) | 0 (0.0%) |
| 18 to 24 Years | 0 (0.0%) | 0 (0.0%) |
| 25 to 34 Years | 15 (100.0%) | 13 (100.0%) |
| 35 to 44 Years | 0 (0.0%) | 0 (0.0%) |
| 45 to 54 Years | 43 (50.6%) | 0 (0.0%) |
| 55 to 64 Years | 23 (100.0%) | 22 (37.3%) |
| 65 to 74 Years | 22 (100.0%) | 24 (100.0%) |
| 75 Years and over | 0 (0.0%) | 30 (100.0%) |
| Total | 103 (40.7%) | 89 (43.6%) |
Income Below Poverty Among Married-Couple Families in Stanfield
The poverty statistics for married-couple families in Stanfield show that 46.4% or 32 of the total 69 families live below the poverty line. Families with 5 or more children have the highest poverty rate of 100.0%, comprising of 32 families. On the other hand, families with no children have the lowest poverty rate of 0.0%, which includes 0 families.
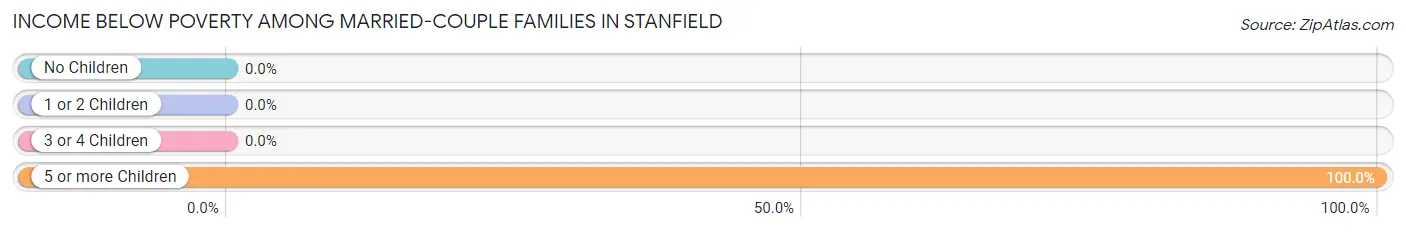
| Children | Above Poverty | Below Poverty |
| No Children | 37 (100.0%) | 0 (0.0%) |
| 1 or 2 Children | 0 (0.0%) | 0 (0.0%) |
| 3 or 4 Children | 0 (0.0%) | 0 (0.0%) |
| 5 or more Children | 0 (0.0%) | 32 (100.0%) |
| Total | 37 (53.6%) | 32 (46.4%) |
Income Below Poverty Among Single-Parent Households in Stanfield
| Children | Single Father | Single Mother |
| No Children | 0 (0.0%) | 0 (0.0%) |
| 1 or 2 Children | 0 (0.0%) | 0 (0.0%) |
| 3 or 4 Children | 0 (0.0%) | 0 (0.0%) |
| 5 or more Children | 0 (0.0%) | 0 (0.0%) |
| Total | 0 (0.0%) | 0 (0.0%) |
Income Below Poverty Among Married-Couple vs Single-Parent Households in Stanfield
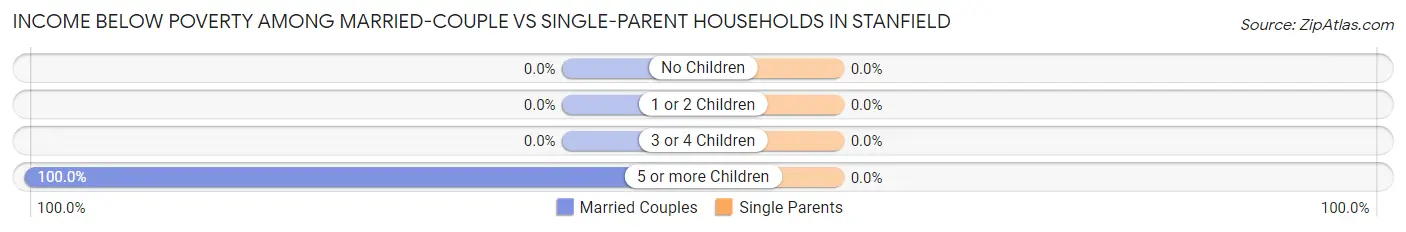
| Children | Married-Couple Families | Single-Parent Households |
| No Children | 0 (0.0%) | 0 (0.0%) |
| 1 or 2 Children | 0 (0.0%) | 0 (0.0%) |
| 3 or 4 Children | 0 (0.0%) | 0 (0.0%) |
| 5 or more Children | 32 (100.0%) | 0 (0.0%) |
| Total | 32 (46.4%) | 0 (0.0%) |
Race in Stanfield
The most populous races in Stanfield are Hispanic or Latino (340 | 74.4%), Two or more Races (294 | 64.3%), and White / Caucasian (124 | 27.1%).
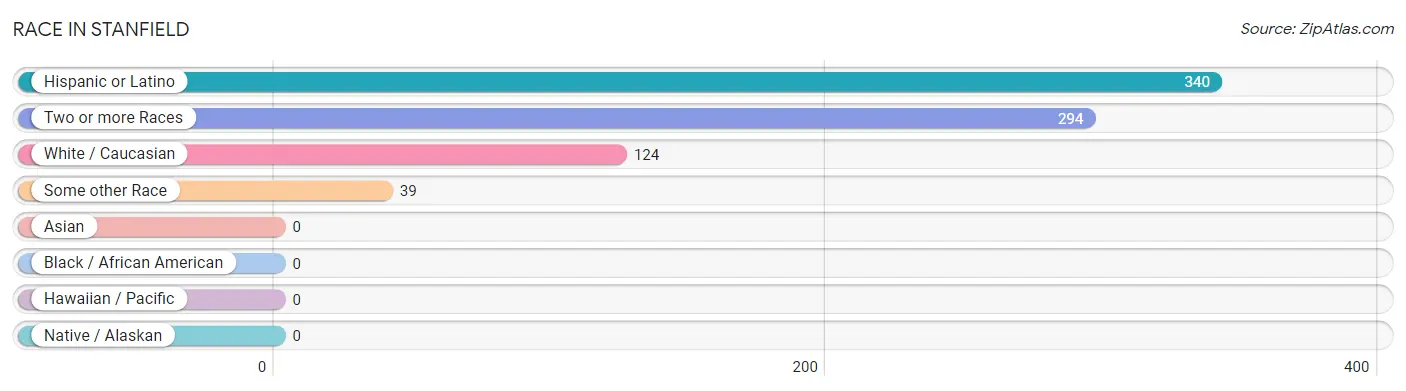
| Race | # Population | % Population |
| Asian | 0 | 0.0% |
| Black / African American | 0 | 0.0% |
| Hawaiian / Pacific | 0 | 0.0% |
| Hispanic or Latino | 340 | 74.4% |
| Native / Alaskan | 0 | 0.0% |
| White / Caucasian | 124 | 27.1% |
| Two or more Races | 294 | 64.3% |
| Some other Race | 39 | 8.5% |
| Total | 457 | 100.0% |
Ancestry in Stanfield
The most populous ancestries reported in Stanfield are Mexican (340 | 74.4%), Tohono O'Odham (124 | 27.1%), German (45 | 9.9%), Irish (42 | 9.2%), and Yaqui (32 | 7.0%), together accounting for 127.6% of all Stanfield residents.
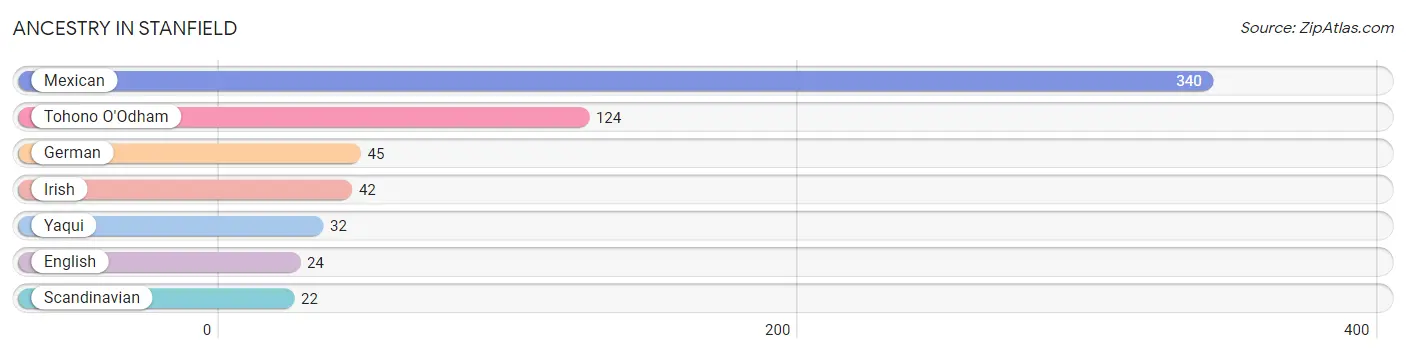
| Ancestry | # Population | % Population |
| English | 24 | 5.2% |
| German | 45 | 9.9% |
| Irish | 42 | 9.2% |
| Mexican | 340 | 74.4% |
| Scandinavian | 22 | 4.8% |
| Tohono O'Odham | 124 | 27.1% |
| Yaqui | 32 | 7.0% | View All 7 Rows |
Immigrants in Stanfield
The most numerous immigrant groups reported in Stanfield came from Central America (45 | 9.9%), Latin America (45 | 9.9%), and Mexico (45 | 9.9%), together accounting for 29.5% of all Stanfield residents.
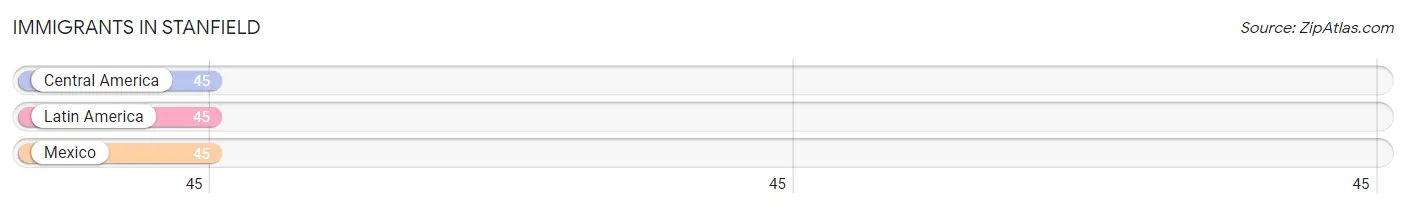
| Immigration Origin | # Population | % Population |
| Central America | 45 | 9.9% |
| Latin America | 45 | 9.9% |
| Mexico | 45 | 9.9% | View All 3 Rows |
Sex and Age in Stanfield
Sex and Age in Stanfield
The most populous age groups in Stanfield are 45 to 49 Years (85 | 33.6%) for men and Under 5 Years (48 | 23.5%) for women.
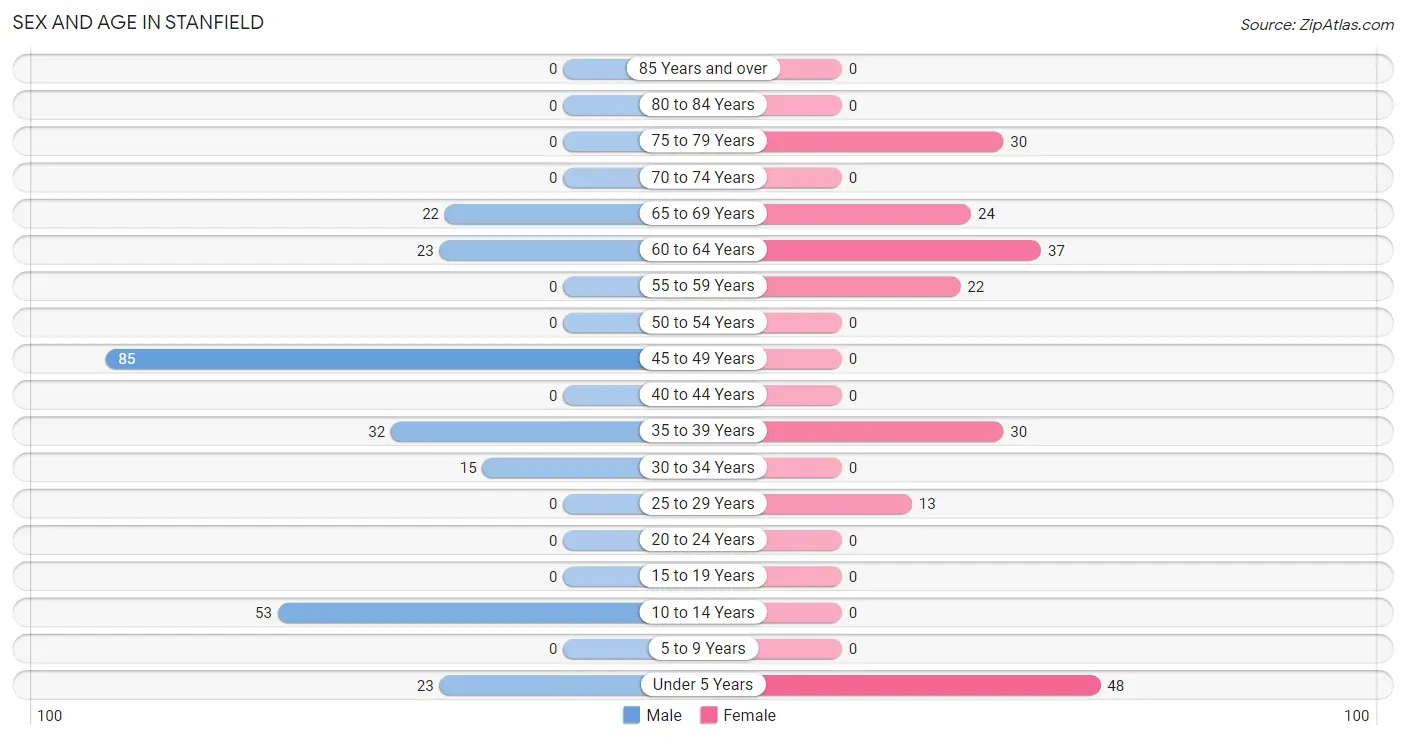
| Age Bracket | Male | Female |
| Under 5 Years | 23 (9.1%) | 48 (23.5%) |
| 5 to 9 Years | 0 (0.0%) | 0 (0.0%) |
| 10 to 14 Years | 53 (20.9%) | 0 (0.0%) |
| 15 to 19 Years | 0 (0.0%) | 0 (0.0%) |
| 20 to 24 Years | 0 (0.0%) | 0 (0.0%) |
| 25 to 29 Years | 0 (0.0%) | 13 (6.4%) |
| 30 to 34 Years | 15 (5.9%) | 0 (0.0%) |
| 35 to 39 Years | 32 (12.7%) | 30 (14.7%) |
| 40 to 44 Years | 0 (0.0%) | 0 (0.0%) |
| 45 to 49 Years | 85 (33.6%) | 0 (0.0%) |
| 50 to 54 Years | 0 (0.0%) | 0 (0.0%) |
| 55 to 59 Years | 0 (0.0%) | 22 (10.8%) |
| 60 to 64 Years | 23 (9.1%) | 37 (18.1%) |
| 65 to 69 Years | 22 (8.7%) | 24 (11.8%) |
| 70 to 74 Years | 0 (0.0%) | 0 (0.0%) |
| 75 to 79 Years | 0 (0.0%) | 30 (14.7%) |
| 80 to 84 Years | 0 (0.0%) | 0 (0.0%) |
| 85 Years and over | 0 (0.0%) | 0 (0.0%) |
| Total | 253 (100.0%) | 204 (100.0%) |
Families and Households in Stanfield
Median Family Size in Stanfield
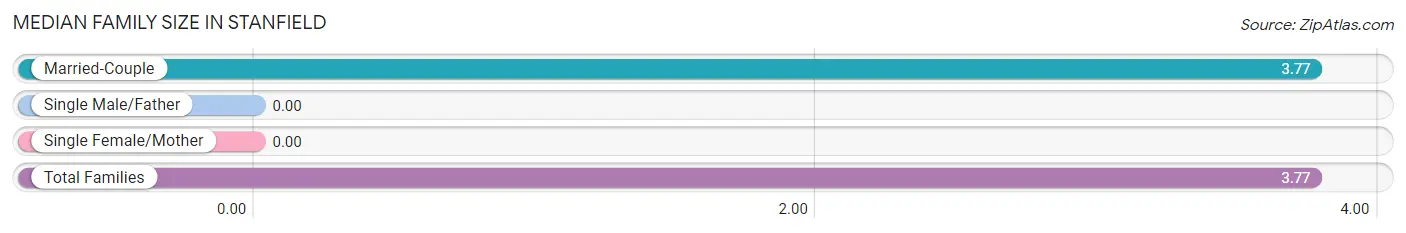
| Family Type | # Families | Family Size |
| Married-Couple | 69 (100.0%) | 3.77 |
| Single Male/Father | 0 (0.0%) | - |
| Single Female/Mother | 0 (0.0%) | - |
| Total Families | 69 (100.0%) | 3.77 |
Median Household Size in Stanfield
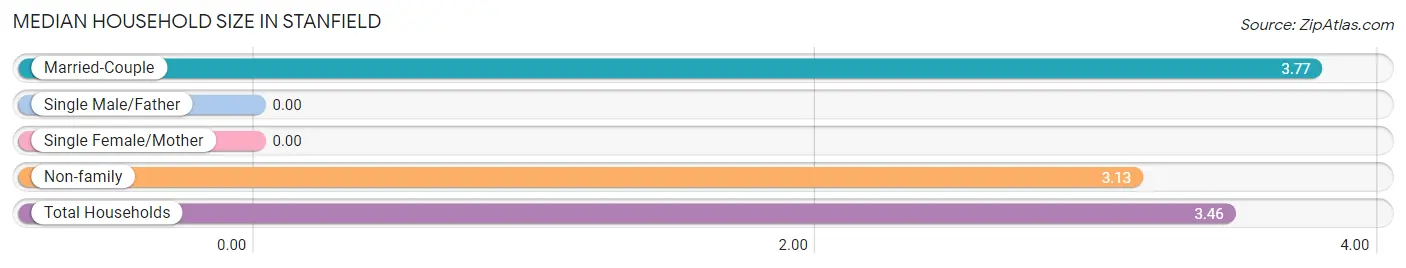
| Household Type | # Households | Household Size |
| Married-Couple | 69 (52.3%) | 3.77 |
| Single Male/Father | 0 (0.0%) | - |
| Single Female/Mother | 0 (0.0%) | - |
| Non-family | 63 (47.7%) | 3.13 |
| Total Households | 132 (100.0%) | 3.46 |
Household Size by Marriage Status in Stanfield
Out of a total of 132 households in Stanfield, 69 (52.3%) are family households, while 63 (47.7%) are nonfamily households. The most numerous type of family households are 2-person households, comprising 37, and the most common type of nonfamily households are 1-person households, comprising 41.
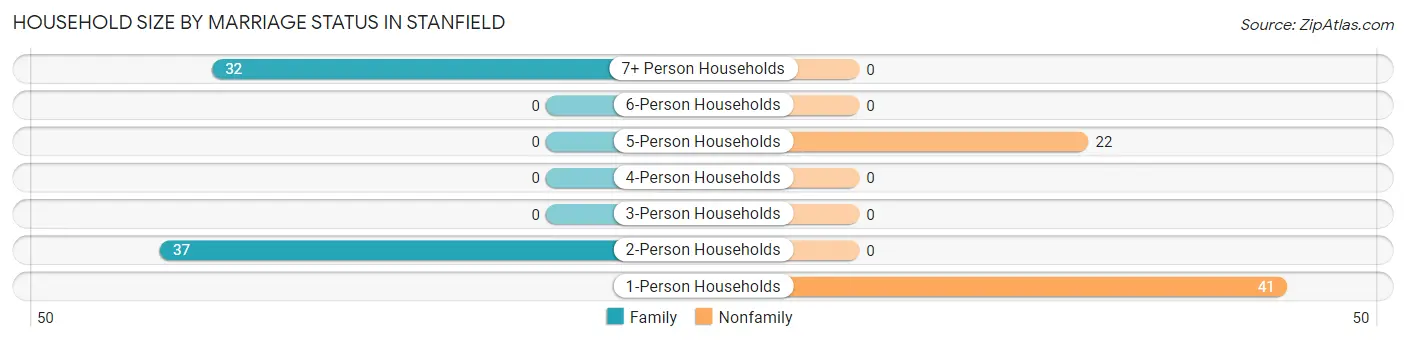
| Household Size | Family Households | Nonfamily Households |
| 1-Person Households | - | 41 (31.1%) |
| 2-Person Households | 37 (28.0%) | 0 (0.0%) |
| 3-Person Households | 0 (0.0%) | 0 (0.0%) |
| 4-Person Households | 0 (0.0%) | 0 (0.0%) |
| 5-Person Households | 0 (0.0%) | 22 (16.7%) |
| 6-Person Households | 0 (0.0%) | 0 (0.0%) |
| 7+ Person Households | 32 (24.2%) | 0 (0.0%) |
| Total | 69 (52.3%) | 63 (47.7%) |
Female Fertility in Stanfield
Fertility by Age in Stanfield
| Age Bracket | Women with Births | Births / 1,000 Women |
| 15 to 19 years | 0 (0.0%) | 0.0 |
| 20 to 34 years | 0 (0.0%) | 0.0 |
| 35 to 50 years | 0 (0.0%) | 0.0 |
| Total | 0 (0.0%) | 0.0 |
Fertility by Age by Marriage Status in Stanfield
| Age Bracket | Married | Unmarried |
| 15 to 19 years | 0 (0.0%) | 0 (0.0%) |
| 20 to 34 years | 0 (0.0%) | 0 (0.0%) |
| 35 to 50 years | 0 (0.0%) | 0 (0.0%) |
| Total | 0 (0.0%) | 0 (0.0%) |
Fertility by Education in Stanfield
| Educational Attainment | Women with Births | Births / 1,000 Women |
| Less than High School | 0 (0.0%) | 0.0 |
| High School Diploma | 0 (0.0%) | 0.0 |
| College or Associate's Degree | 0 (0.0%) | 0.0 |
| Bachelor's Degree | 0 (0.0%) | 0.0 |
| Graduate Degree | 0 (0.0%) | 0.0 |
| Total | 0 (0.0%) | 0.0 |
Fertility by Education by Marriage Status in Stanfield
| Educational Attainment | Married | Unmarried |
| Less than High School | 0 (0.0%) | 0 (0.0%) |
| High School Diploma | 0 (0.0%) | 0 (0.0%) |
| College or Associate's Degree | 0 (0.0%) | 0 (0.0%) |
| Bachelor's Degree | 0 (0.0%) | 0 (0.0%) |
| Graduate Degree | 0 (0.0%) | 0 (0.0%) |
| Total | 0 (0.0%) | 0 (0.0%) |
Employment Characteristics in Stanfield
Employment by Class of Employer in Stanfield
Among the 162 employed individuals in Stanfield, private company employees (132 | 81.5%), and local government employees (30 | 18.5%) make up the most common classes of employment.
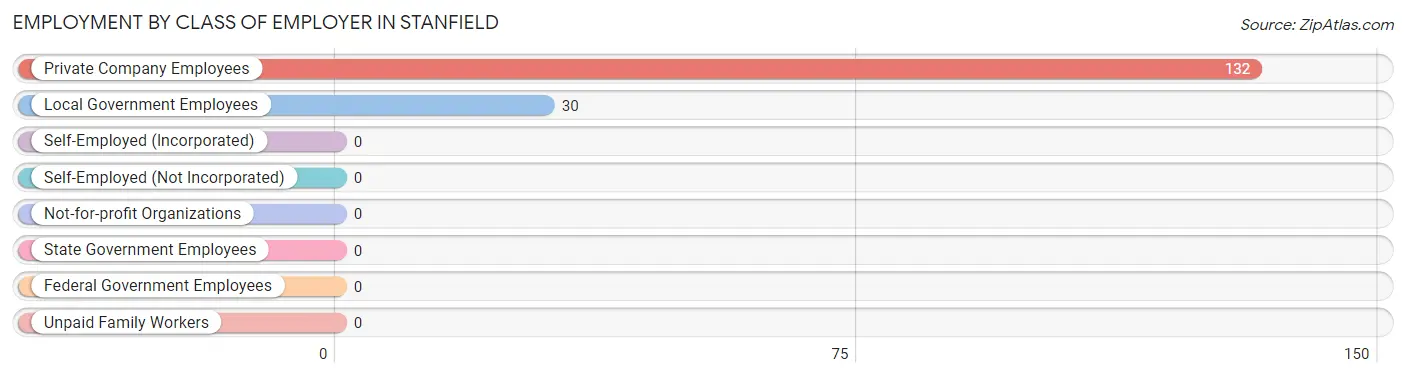
| Employer Class | # Employees | % Employees |
| Private Company Employees | 132 | 81.5% |
| Self-Employed (Incorporated) | 0 | 0.0% |
| Self-Employed (Not Incorporated) | 0 | 0.0% |
| Not-for-profit Organizations | 0 | 0.0% |
| Local Government Employees | 30 | 18.5% |
| State Government Employees | 0 | 0.0% |
| Federal Government Employees | 0 | 0.0% |
| Unpaid Family Workers | 0 | 0.0% |
| Total | 162 | 100.0% |
Employment Status by Age in Stanfield
According to the labor force statistics for Stanfield, out of the total population over 16 years of age (333), 66.1% or 220 individuals are in the labor force, with 19.5% or 43 of them unemployed. The age group with the highest labor force participation rate is 25 to 29 years, with 100.0% or 13 individuals in the labor force. Within the labor force, the 45 to 54 years age range has the highest percentage of unemployed individuals, with 50.6% or 43 of them being unemployed.
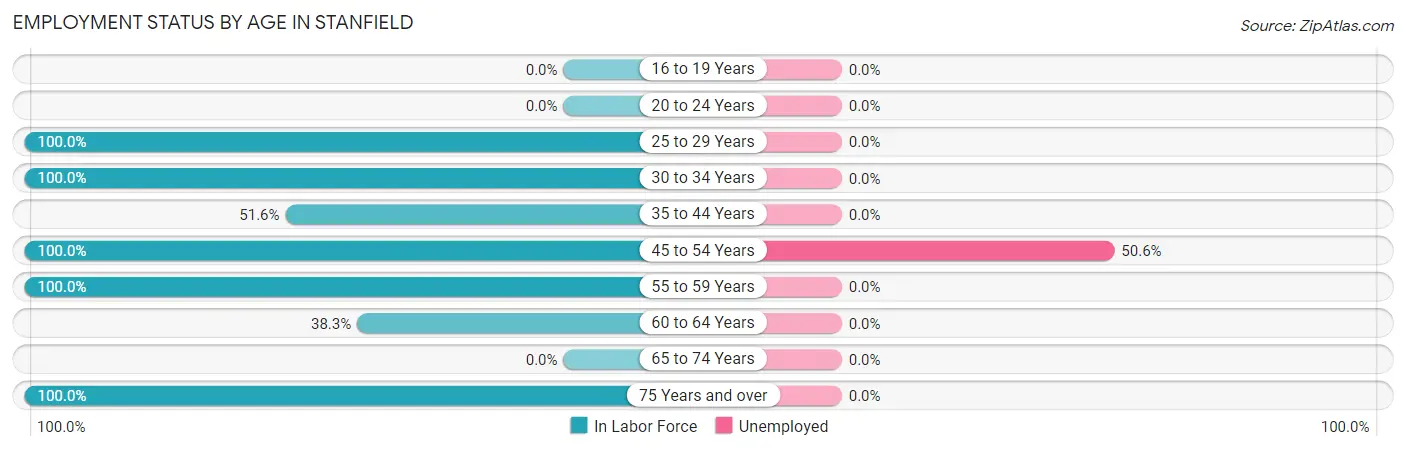
| Age Bracket | In Labor Force | Unemployed |
| 16 to 19 Years | 0 (0.0%) | 0 (0.0%) |
| 20 to 24 Years | 0 (0.0%) | 0 (0.0%) |
| 25 to 29 Years | 13 (100.0%) | 0 (0.0%) |
| 30 to 34 Years | 15 (100.0%) | 0 (0.0%) |
| 35 to 44 Years | 32 (51.6%) | 0 (0.0%) |
| 45 to 54 Years | 85 (100.0%) | 43 (50.6%) |
| 55 to 59 Years | 22 (100.0%) | 0 (0.0%) |
| 60 to 64 Years | 23 (38.3%) | 0 (0.0%) |
| 65 to 74 Years | 0 (0.0%) | 0 (0.0%) |
| 75 Years and over | 30 (100.0%) | 0 (0.0%) |
| Total | 220 (66.1%) | 43 (19.5%) |
Employment Status by Educational Attainment in Stanfield
According to labor force statistics for Stanfield, 73.9% of individuals (190) out of the total population between 25 and 64 years of age (257) are in the labor force, with 22.6% or 43 of them being unemployed. The group with the highest labor force participation rate are those with the educational attainment of college / associate degree, with 100.0% or 78 individuals in the labor force. Within the labor force, individuals with high school diploma education have the highest percentage of unemployment, with 38.4% or 43 of them being unemployed.
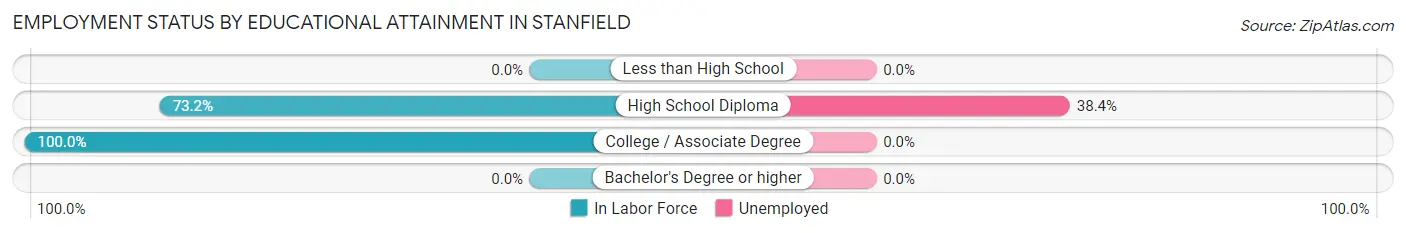
| Educational Attainment | In Labor Force | Unemployed |
| Less than High School | 0 (0.0%) | 0 (0.0%) |
| High School Diploma | 112 (73.2%) | 59 (38.4%) |
| College / Associate Degree | 78 (100.0%) | 0 (0.0%) |
| Bachelor's Degree or higher | 0 (0.0%) | 0 (0.0%) |
| Total | 190 (73.9%) | 58 (22.6%) |
Employment Occupations by Sex in Stanfield
Management, Business, Science and Arts Occupations
The most common Management, Business, Science and Arts occupations in Stanfield are Community & Social Service (30 | 17.0%), and Education Instruction & Library (30 | 17.0%).
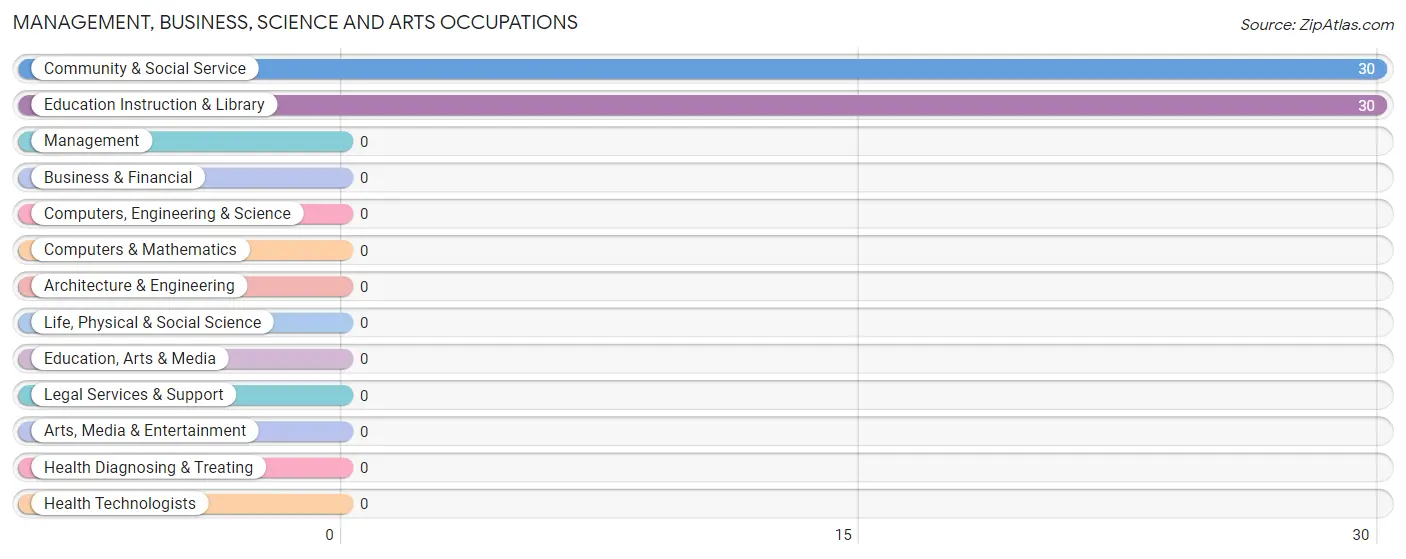
Management, Business, Science and Arts Occupations by Sex
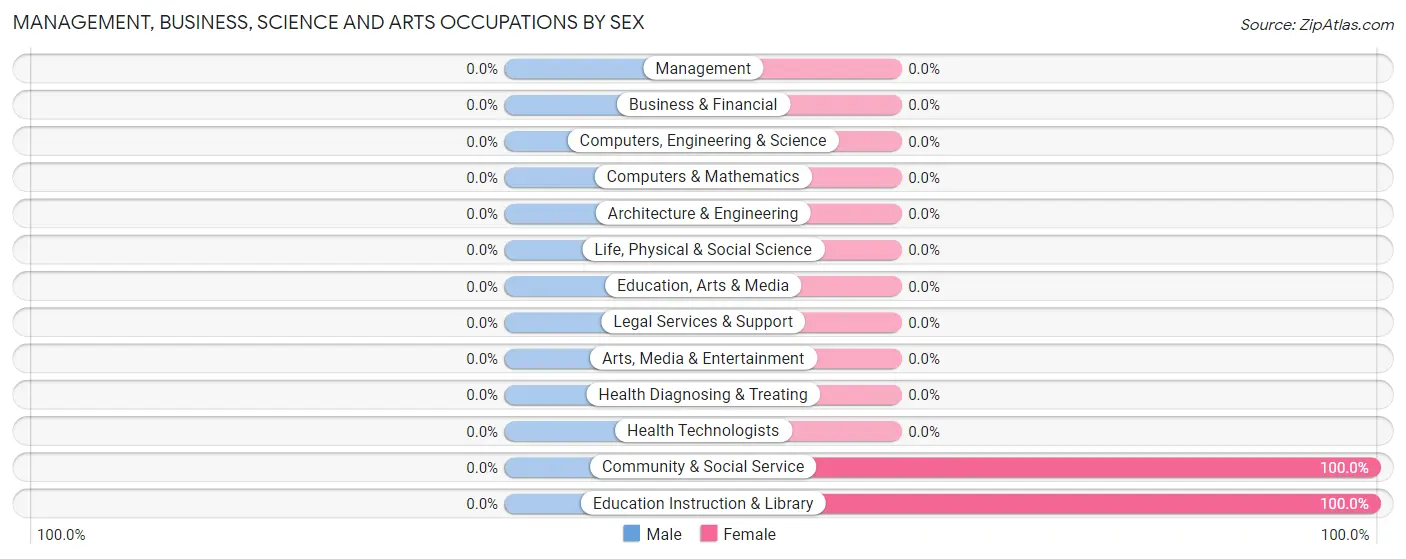
| Occupation | Male | Female |
| Management | 0 (0.0%) | 0 (0.0%) |
| Business & Financial | 0 (0.0%) | 0 (0.0%) |
| Computers, Engineering & Science | 0 (0.0%) | 0 (0.0%) |
| Computers & Mathematics | 0 (0.0%) | 0 (0.0%) |
| Architecture & Engineering | 0 (0.0%) | 0 (0.0%) |
| Life, Physical & Social Science | 0 (0.0%) | 0 (0.0%) |
| Community & Social Service | 0 (0.0%) | 30 (100.0%) |
| Education, Arts & Media | 0 (0.0%) | 0 (0.0%) |
| Legal Services & Support | 0 (0.0%) | 0 (0.0%) |
| Education Instruction & Library | 0 (0.0%) | 30 (100.0%) |
| Arts, Media & Entertainment | 0 (0.0%) | 0 (0.0%) |
| Health Diagnosing & Treating | 0 (0.0%) | 0 (0.0%) |
| Health Technologists | 0 (0.0%) | 0 (0.0%) |
| Total (Category) | 0 (0.0%) | 30 (100.0%) |
| Total (Overall) | 112 (63.3%) | 65 (36.7%) |
Services Occupations
The most common Services occupations in Stanfield are Cleaning & Maintenance (32 | 18.1%), and Food Preparation & Serving (13 | 7.3%).
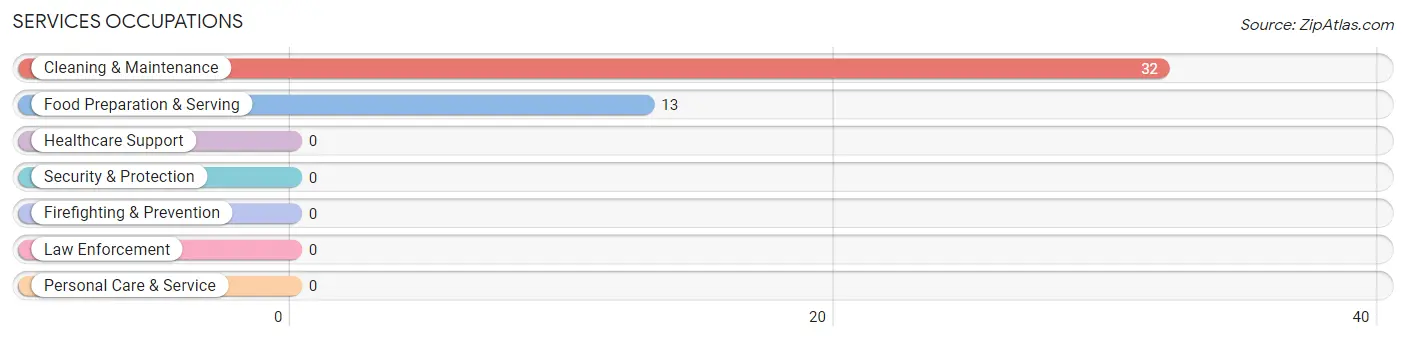
Services Occupations by Sex
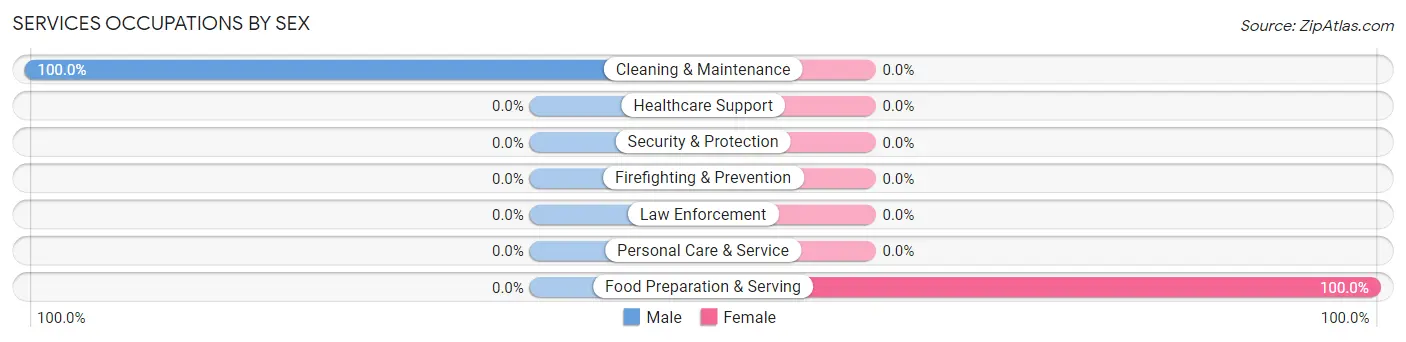
| Occupation | Male | Female |
| Healthcare Support | 0 (0.0%) | 0 (0.0%) |
| Security & Protection | 0 (0.0%) | 0 (0.0%) |
| Firefighting & Prevention | 0 (0.0%) | 0 (0.0%) |
| Law Enforcement | 0 (0.0%) | 0 (0.0%) |
| Food Preparation & Serving | 0 (0.0%) | 13 (100.0%) |
| Cleaning & Maintenance | 32 (100.0%) | 0 (0.0%) |
| Personal Care & Service | 0 (0.0%) | 0 (0.0%) |
| Total (Category) | 32 (71.1%) | 13 (28.9%) |
| Total (Overall) | 112 (63.3%) | 65 (36.7%) |
Sales and Office Occupations
Sales and Office Occupations by Sex
| Occupation | Male | Female |
| Sales & Related | 0 (0.0%) | 0 (0.0%) |
| Office & Administration | 0 (0.0%) | 0 (0.0%) |
| Total (Category) | 0 (0.0%) | 0 (0.0%) |
| Total (Overall) | 112 (63.3%) | 65 (36.7%) |
Natural Resources, Construction and Maintenance Occupations
The most common Natural Resources, Construction and Maintenance occupations in Stanfield are Construction & Extraction (42 | 23.7%), and Farming, Fishing & Forestry (15 | 8.5%).
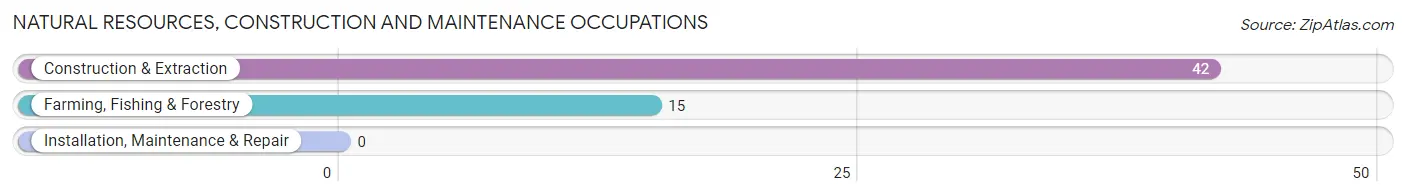
Natural Resources, Construction and Maintenance Occupations by Sex
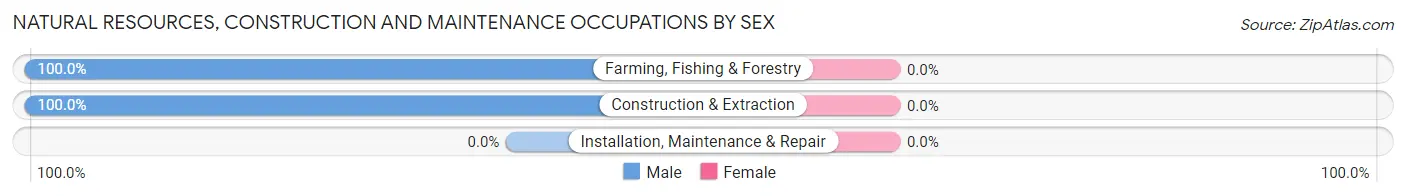
| Occupation | Male | Female |
| Farming, Fishing & Forestry | 15 (100.0%) | 0 (0.0%) |
| Construction & Extraction | 42 (100.0%) | 0 (0.0%) |
| Installation, Maintenance & Repair | 0 (0.0%) | 0 (0.0%) |
| Total (Category) | 57 (100.0%) | 0 (0.0%) |
| Total (Overall) | 112 (63.3%) | 65 (36.7%) |
Production, Transportation and Moving Occupations
The most common Production, Transportation and Moving occupations in Stanfield are , and Material Moving (45 | 25.4%).
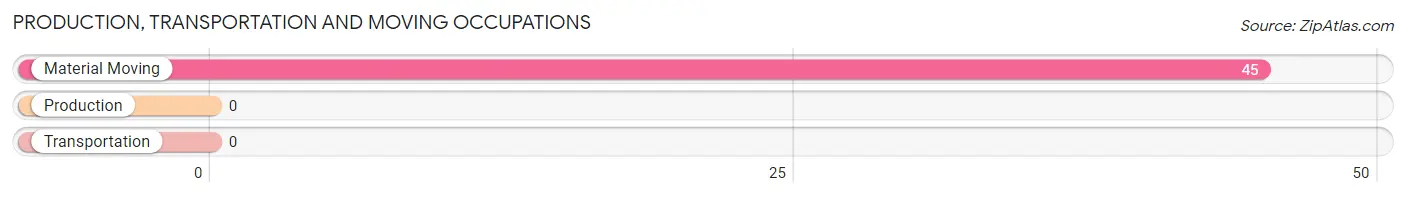
Production, Transportation and Moving Occupations by Sex
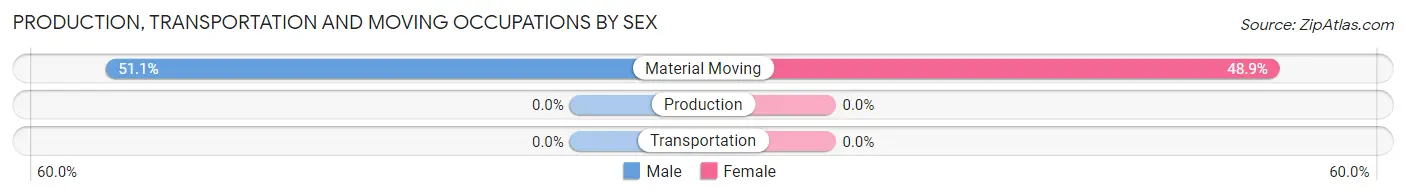
| Occupation | Male | Female |
| Production | 0 (0.0%) | 0 (0.0%) |
| Transportation | 0 (0.0%) | 0 (0.0%) |
| Material Moving | 23 (51.1%) | 22 (48.9%) |
| Total (Category) | 23 (51.1%) | 22 (48.9%) |
| Total (Overall) | 112 (63.3%) | 65 (36.7%) |
Employment Industries by Sex in Stanfield
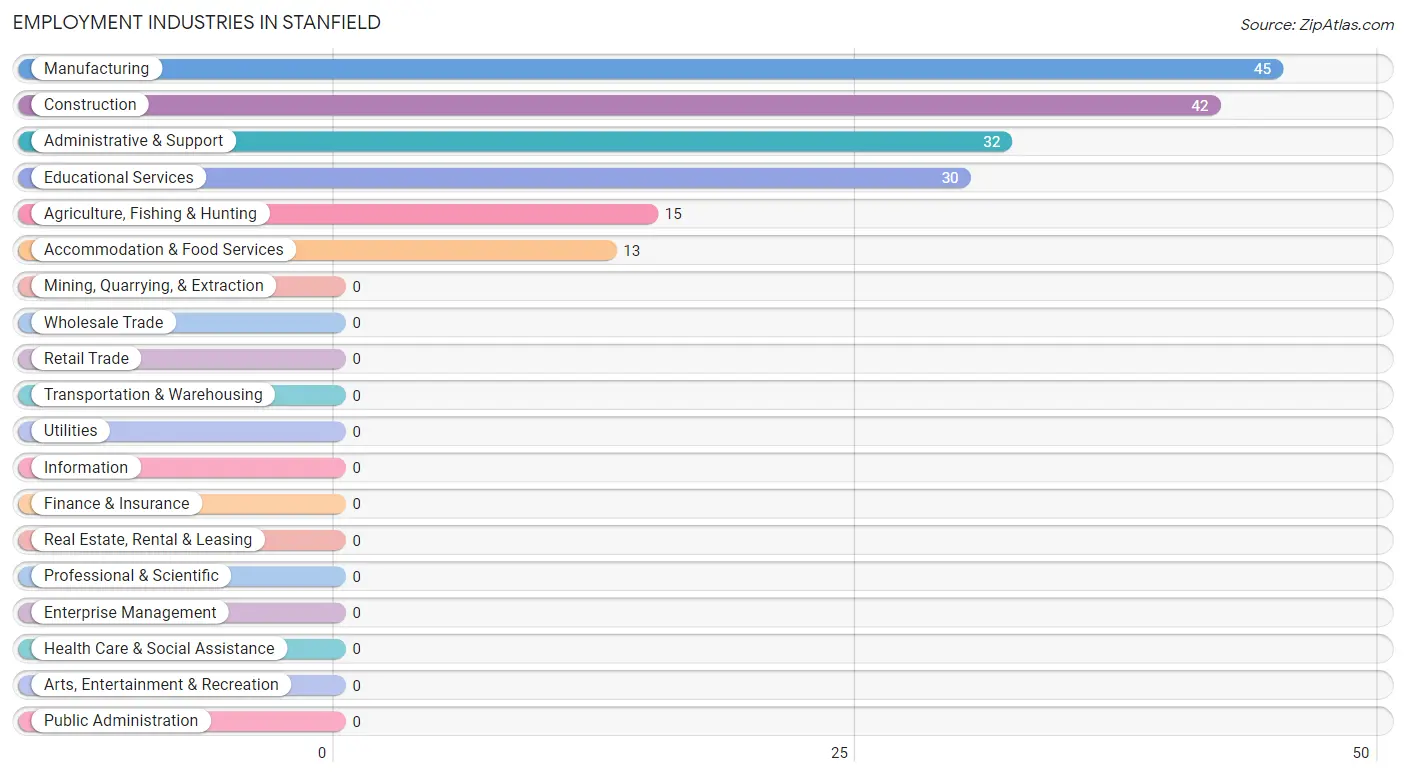
Employment Industries in Stanfield
The major employment industries in Stanfield include Manufacturing (45 | 25.4%), Construction (42 | 23.7%), Administrative & Support (32 | 18.1%), Educational Services (30 | 17.0%), and Agriculture, Fishing & Hunting (15 | 8.5%).
Employment Industries by Sex in Stanfield
The Stanfield industries that see more men than women are Agriculture, Fishing & Hunting (100.0%), Construction (100.0%), and Administrative & Support (100.0%), whereas the industries that tend to have a higher number of women are Educational Services (100.0%), Accommodation & Food Services (100.0%), and Manufacturing (48.9%).
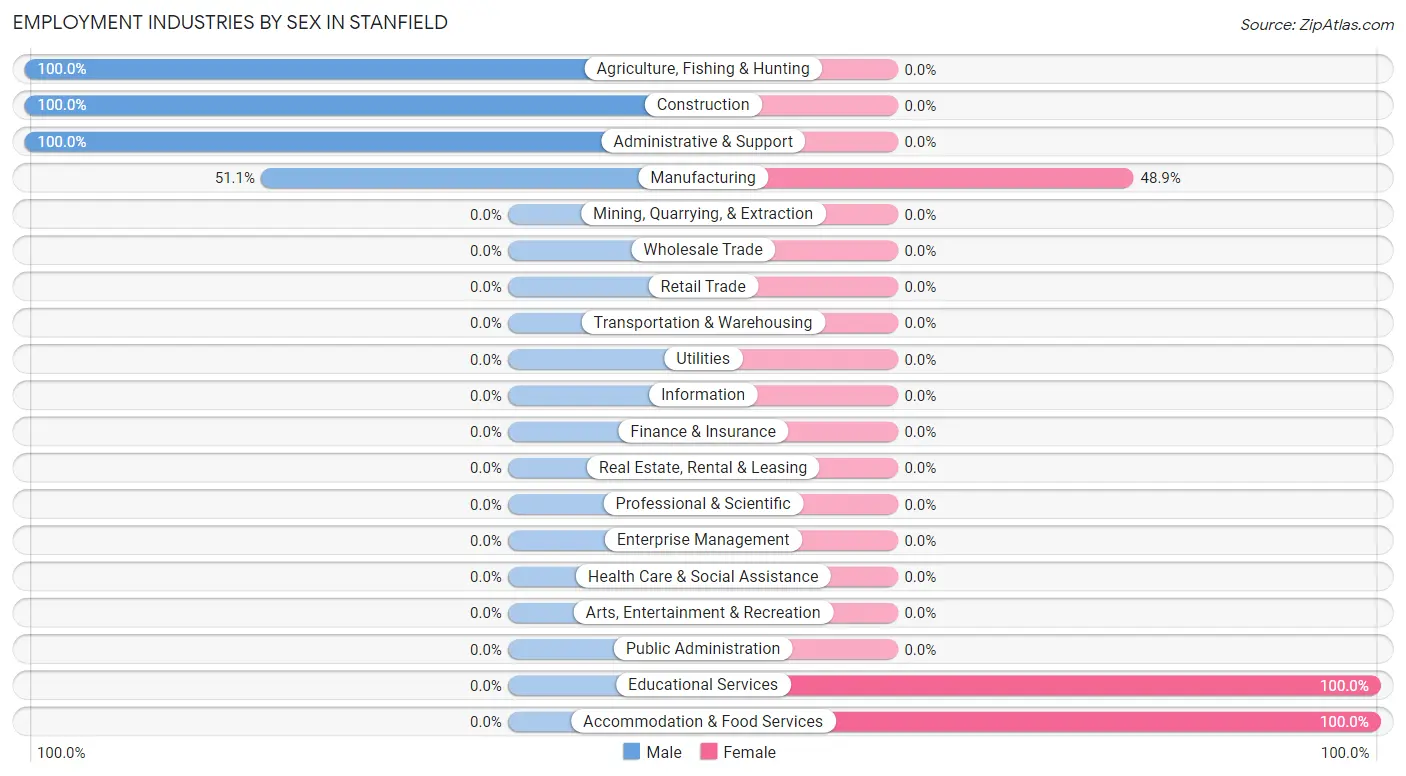
| Industry | Male | Female |
| Agriculture, Fishing & Hunting | 15 (100.0%) | 0 (0.0%) |
| Mining, Quarrying, & Extraction | 0 (0.0%) | 0 (0.0%) |
| Construction | 42 (100.0%) | 0 (0.0%) |
| Manufacturing | 23 (51.1%) | 22 (48.9%) |
| Wholesale Trade | 0 (0.0%) | 0 (0.0%) |
| Retail Trade | 0 (0.0%) | 0 (0.0%) |
| Transportation & Warehousing | 0 (0.0%) | 0 (0.0%) |
| Utilities | 0 (0.0%) | 0 (0.0%) |
| Information | 0 (0.0%) | 0 (0.0%) |
| Finance & Insurance | 0 (0.0%) | 0 (0.0%) |
| Real Estate, Rental & Leasing | 0 (0.0%) | 0 (0.0%) |
| Professional & Scientific | 0 (0.0%) | 0 (0.0%) |
| Enterprise Management | 0 (0.0%) | 0 (0.0%) |
| Administrative & Support | 32 (100.0%) | 0 (0.0%) |
| Educational Services | 0 (0.0%) | 30 (100.0%) |
| Health Care & Social Assistance | 0 (0.0%) | 0 (0.0%) |
| Arts, Entertainment & Recreation | 0 (0.0%) | 0 (0.0%) |
| Accommodation & Food Services | 0 (0.0%) | 13 (100.0%) |
| Public Administration | 0 (0.0%) | 0 (0.0%) |
| Total | 112 (63.3%) | 65 (36.7%) |
Education in Stanfield
School Enrollment in Stanfield
The most common levels of schooling among the 91 students in Stanfield are middle school (27 | 29.7%), elementary school (26 | 28.6%), and nursery / preschool (23 | 25.3%).
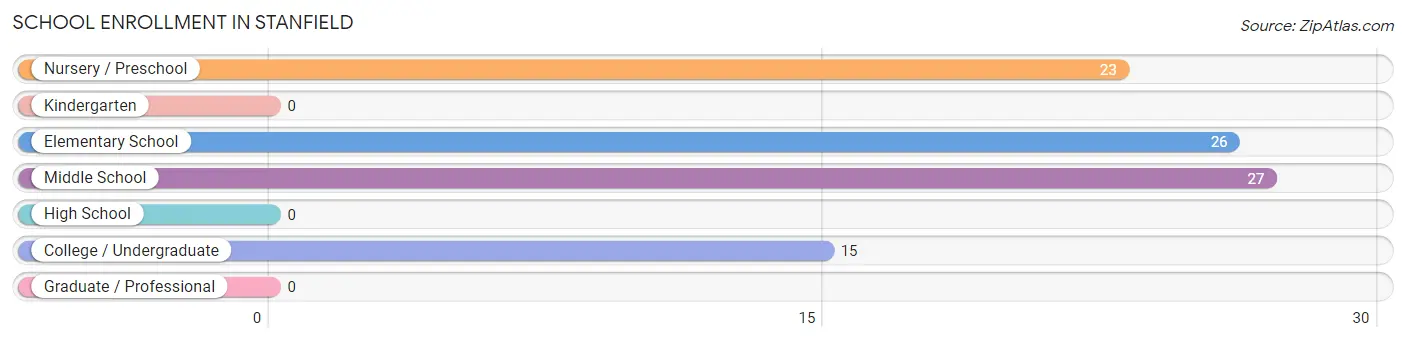
| School Level | # Students | % Students |
| Nursery / Preschool | 23 | 25.3% |
| Kindergarten | 0 | 0.0% |
| Elementary School | 26 | 28.6% |
| Middle School | 27 | 29.7% |
| High School | 0 | 0.0% |
| College / Undergraduate | 15 | 16.5% |
| Graduate / Professional | 0 | 0.0% |
| Total | 91 | 100.0% |
School Enrollment by Age by Funding Source in Stanfield
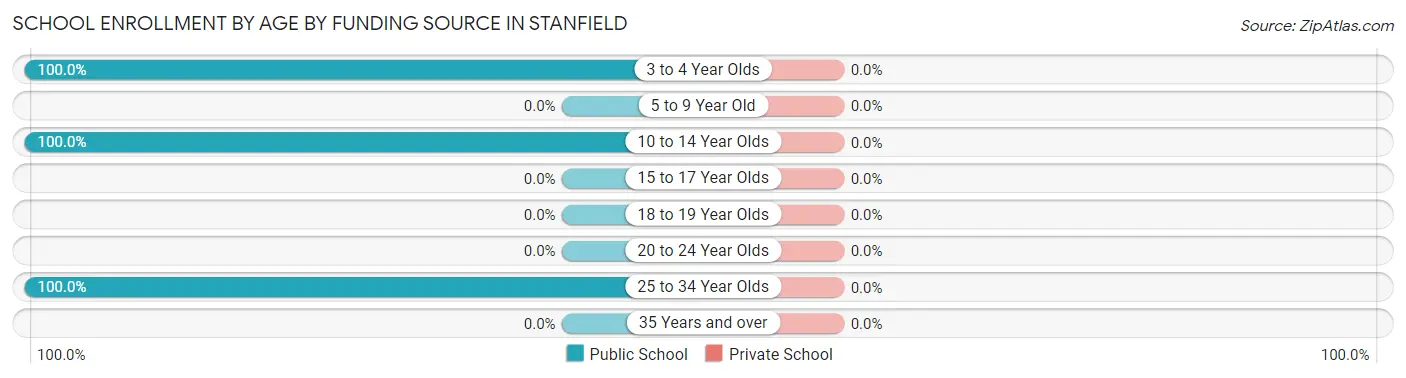
| Age Bracket | Public School | Private School |
| 3 to 4 Year Olds | 23 (100.0%) | 0 (0.0%) |
| 5 to 9 Year Old | 0 (0.0%) | 0 (0.0%) |
| 10 to 14 Year Olds | 53 (100.0%) | 0 (0.0%) |
| 15 to 17 Year Olds | 0 (0.0%) | 0 (0.0%) |
| 18 to 19 Year Olds | 0 (0.0%) | 0 (0.0%) |
| 20 to 24 Year Olds | 0 (0.0%) | 0 (0.0%) |
| 25 to 34 Year Olds | 15 (100.0%) | 0 (0.0%) |
| 35 Years and over | 0 (0.0%) | 0 (0.0%) |
| Total | 91 (100.0%) | 0 (0.0%) |
Educational Attainment by Field of Study in Stanfield
Education (24 | 52.2%), and physical & health sciences (22 | 47.8%) are the most common fields of study among 46 individuals in Stanfield who have obtained a bachelor's degree or higher.
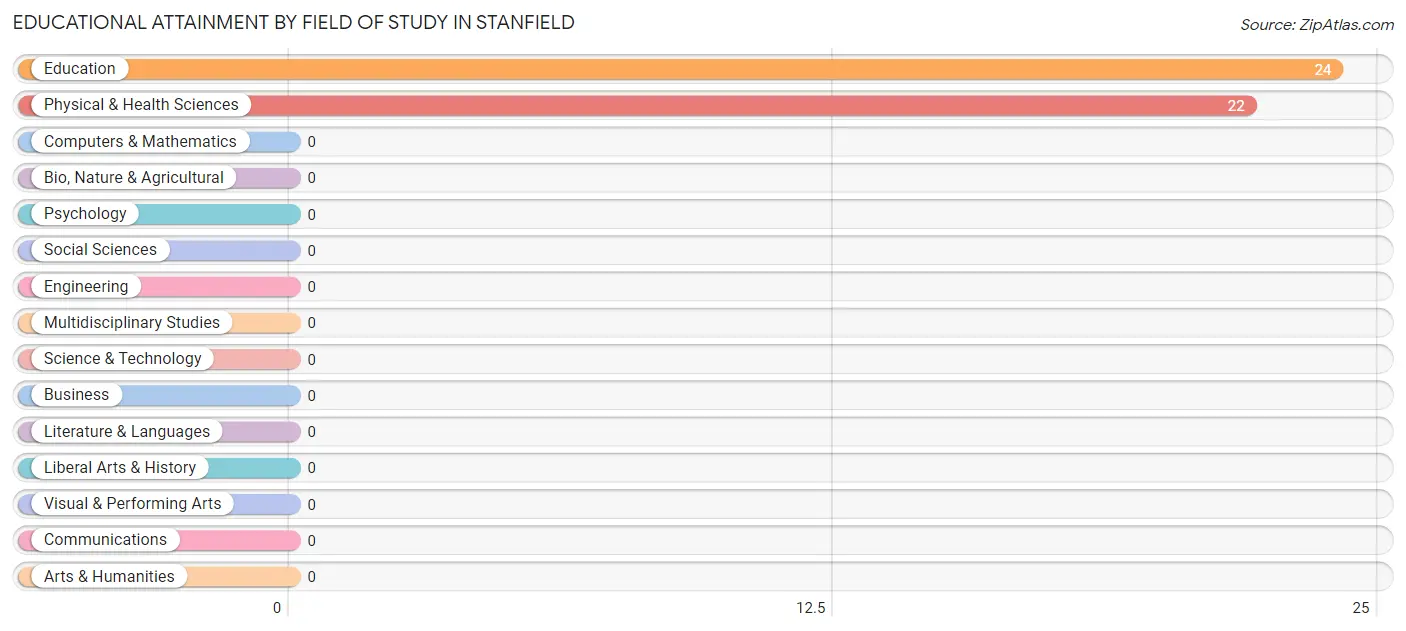
| Field of Study | # Graduates | % Graduates |
| Computers & Mathematics | 0 | 0.0% |
| Bio, Nature & Agricultural | 0 | 0.0% |
| Physical & Health Sciences | 22 | 47.8% |
| Psychology | 0 | 0.0% |
| Social Sciences | 0 | 0.0% |
| Engineering | 0 | 0.0% |
| Multidisciplinary Studies | 0 | 0.0% |
| Science & Technology | 0 | 0.0% |
| Business | 0 | 0.0% |
| Education | 24 | 52.2% |
| Literature & Languages | 0 | 0.0% |
| Liberal Arts & History | 0 | 0.0% |
| Visual & Performing Arts | 0 | 0.0% |
| Communications | 0 | 0.0% |
| Arts & Humanities | 0 | 0.0% |
| Total | 46 | 100.0% |
Transportation & Commute in Stanfield
Vehicle Availability by Sex in Stanfield
The most prevalent vehicle ownership categories in Stanfield are males with 3 vehicles (65, accounting for 67.0%) and females with 3 vehicles (35, making up 100.0%).
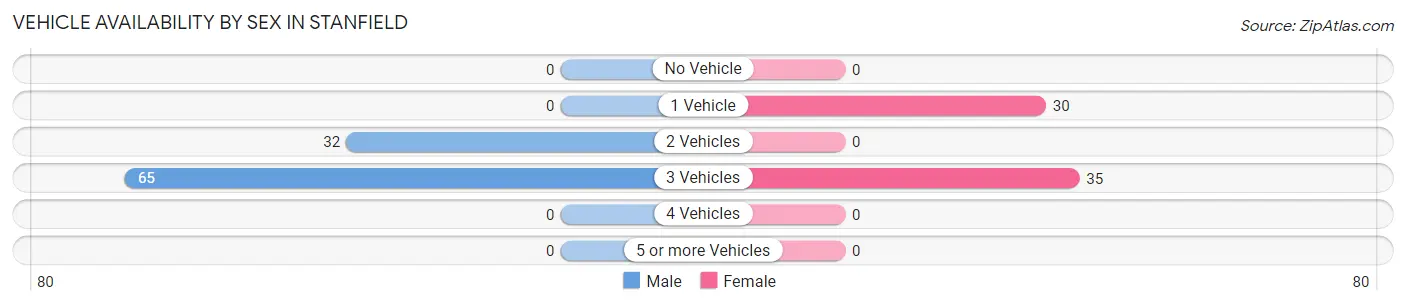
| Vehicles Available | Male | Female |
| No Vehicle | 0 (0.0%) | 0 (0.0%) |
| 1 Vehicle | 0 (0.0%) | 30 (46.2%) |
| 2 Vehicles | 32 (33.0%) | 0 (0.0%) |
| 3 Vehicles | 65 (67.0%) | 35 (53.8%) |
| 4 Vehicles | 0 (0.0%) | 0 (0.0%) |
| 5 or more Vehicles | 0 (0.0%) | 0 (0.0%) |
| Total | 97 (100.0%) | 65 (100.0%) |
Commute Time in Stanfield
The most frequently occuring commute durations in Stanfield are 10 to 14 minutes (74 commuters, 45.7%), 30 to 34 minutes (36 commuters, 22.2%), and 5 to 9 minutes (30 commuters, 18.5%).
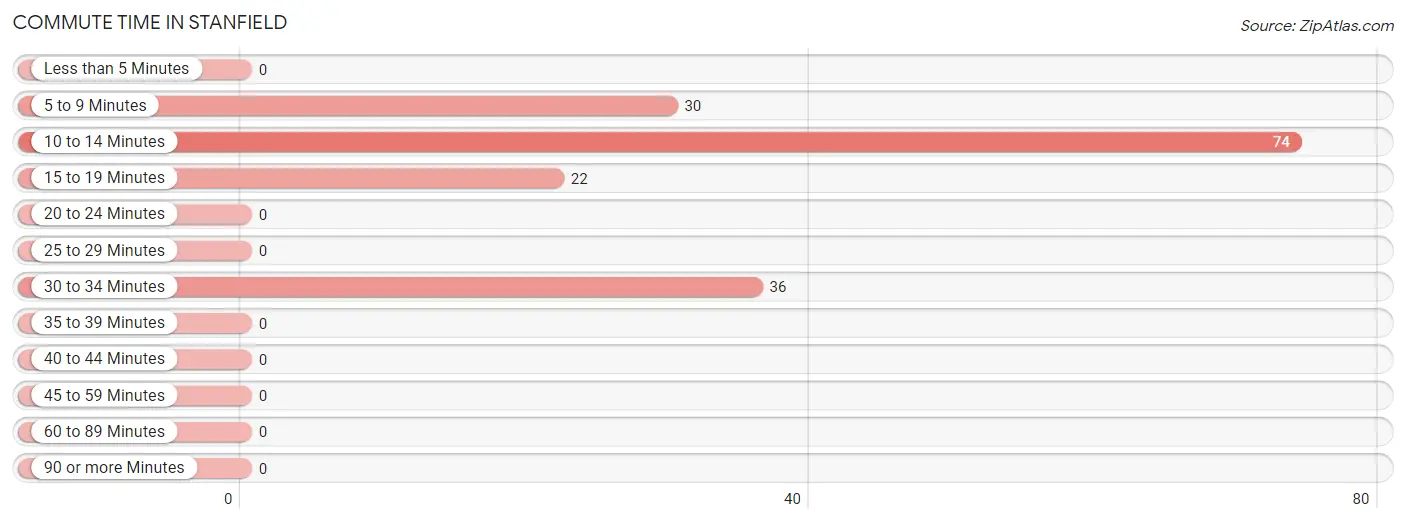
| Commute Time | # Commuters | % Commuters |
| Less than 5 Minutes | 0 | 0.0% |
| 5 to 9 Minutes | 30 | 18.5% |
| 10 to 14 Minutes | 74 | 45.7% |
| 15 to 19 Minutes | 22 | 13.6% |
| 20 to 24 Minutes | 0 | 0.0% |
| 25 to 29 Minutes | 0 | 0.0% |
| 30 to 34 Minutes | 36 | 22.2% |
| 35 to 39 Minutes | 0 | 0.0% |
| 40 to 44 Minutes | 0 | 0.0% |
| 45 to 59 Minutes | 0 | 0.0% |
| 60 to 89 Minutes | 0 | 0.0% |
| 90 or more Minutes | 0 | 0.0% |
Commute Time by Sex in Stanfield
The most common commute times in Stanfield are 10 to 14 minutes (74 commuters, 76.3%) for males and 5 to 9 minutes (30 commuters, 46.2%) for females.
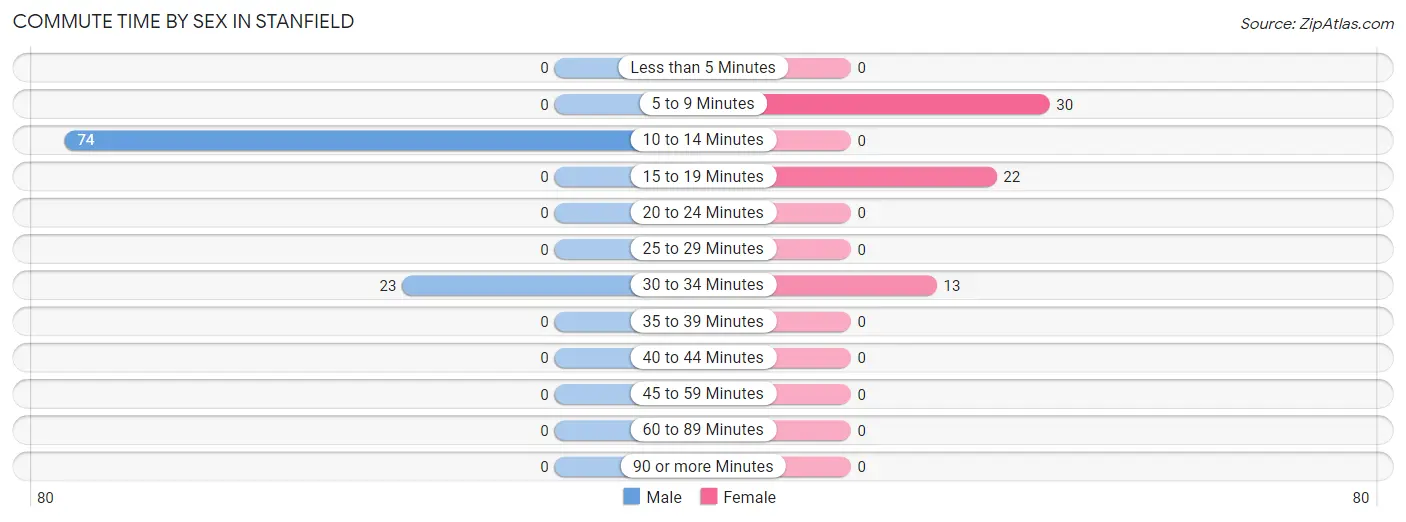
| Commute Time | Male | Female |
| Less than 5 Minutes | 0 (0.0%) | 0 (0.0%) |
| 5 to 9 Minutes | 0 (0.0%) | 30 (46.2%) |
| 10 to 14 Minutes | 74 (76.3%) | 0 (0.0%) |
| 15 to 19 Minutes | 0 (0.0%) | 22 (33.9%) |
| 20 to 24 Minutes | 0 (0.0%) | 0 (0.0%) |
| 25 to 29 Minutes | 0 (0.0%) | 0 (0.0%) |
| 30 to 34 Minutes | 23 (23.7%) | 13 (20.0%) |
| 35 to 39 Minutes | 0 (0.0%) | 0 (0.0%) |
| 40 to 44 Minutes | 0 (0.0%) | 0 (0.0%) |
| 45 to 59 Minutes | 0 (0.0%) | 0 (0.0%) |
| 60 to 89 Minutes | 0 (0.0%) | 0 (0.0%) |
| 90 or more Minutes | 0 (0.0%) | 0 (0.0%) |
Time of Departure to Work by Sex in Stanfield
The most frequent times of departure to work in Stanfield are 6:00 AM to 6:29 AM (42, 43.3%) for males and 4:00 PM to 11:59 PM (35, 53.8%) for females.
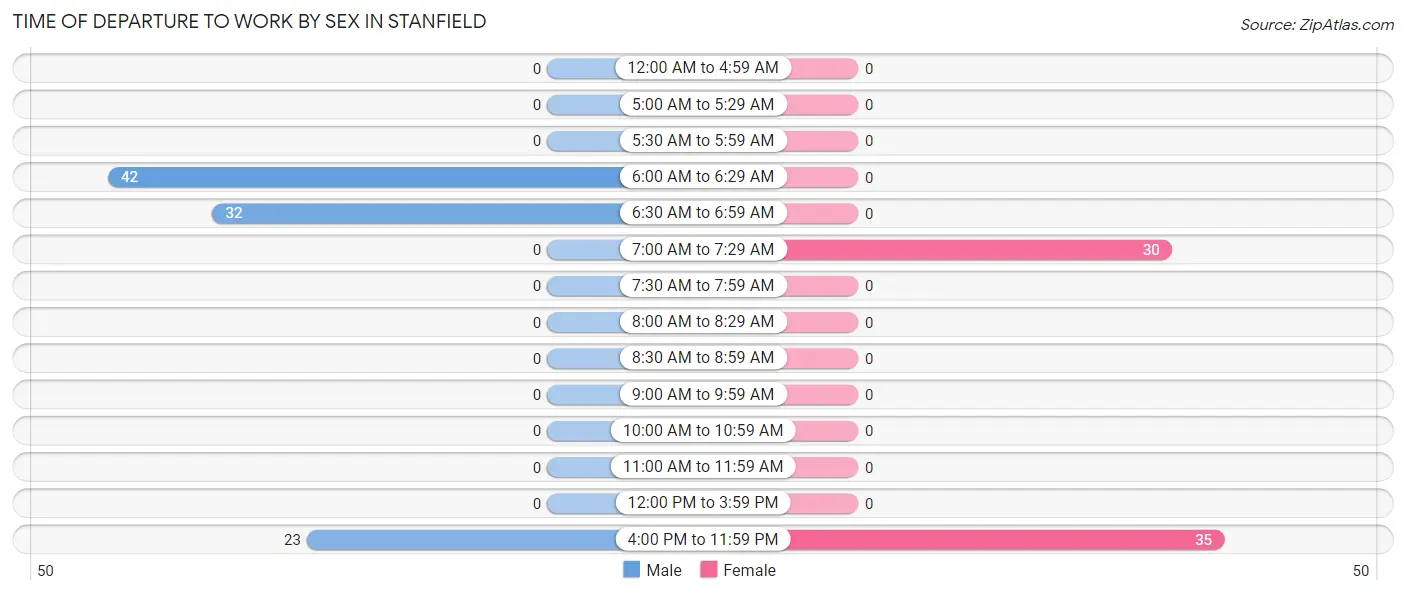
| Time of Departure | Male | Female |
| 12:00 AM to 4:59 AM | 0 (0.0%) | 0 (0.0%) |
| 5:00 AM to 5:29 AM | 0 (0.0%) | 0 (0.0%) |
| 5:30 AM to 5:59 AM | 0 (0.0%) | 0 (0.0%) |
| 6:00 AM to 6:29 AM | 42 (43.3%) | 0 (0.0%) |
| 6:30 AM to 6:59 AM | 32 (33.0%) | 0 (0.0%) |
| 7:00 AM to 7:29 AM | 0 (0.0%) | 30 (46.2%) |
| 7:30 AM to 7:59 AM | 0 (0.0%) | 0 (0.0%) |
| 8:00 AM to 8:29 AM | 0 (0.0%) | 0 (0.0%) |
| 8:30 AM to 8:59 AM | 0 (0.0%) | 0 (0.0%) |
| 9:00 AM to 9:59 AM | 0 (0.0%) | 0 (0.0%) |
| 10:00 AM to 10:59 AM | 0 (0.0%) | 0 (0.0%) |
| 11:00 AM to 11:59 AM | 0 (0.0%) | 0 (0.0%) |
| 12:00 PM to 3:59 PM | 0 (0.0%) | 0 (0.0%) |
| 4:00 PM to 11:59 PM | 23 (23.7%) | 35 (53.8%) |
| Total | 97 (100.0%) | 65 (100.0%) |
Housing Occupancy in Stanfield
Occupancy by Ownership in Stanfield
Of the total 132 dwellings in Stanfield, owner-occupied units account for 89 (67.4%), while renter-occupied units make up 43 (32.6%).
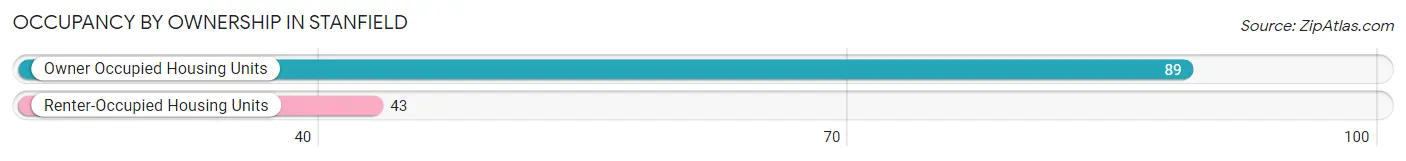
| Occupancy | # Housing Units | % Housing Units |
| Owner Occupied Housing Units | 89 | 67.4% |
| Renter-Occupied Housing Units | 43 | 32.6% |
| Total Occupied Housing Units | 132 | 100.0% |
Occupancy by Household Size in Stanfield
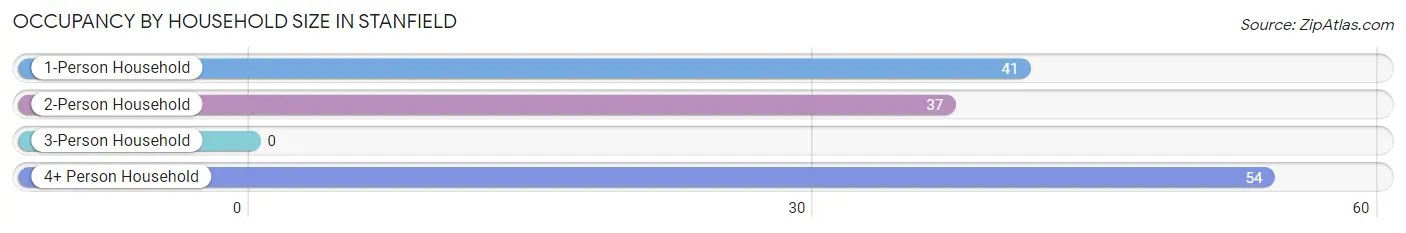
| Household Size | # Housing Units | % Housing Units |
| 1-Person Household | 41 | 31.1% |
| 2-Person Household | 37 | 28.0% |
| 3-Person Household | 0 | 0.0% |
| 4+ Person Household | 54 | 40.9% |
| Total Housing Units | 132 | 100.0% |
Occupancy by Ownership by Household Size in Stanfield
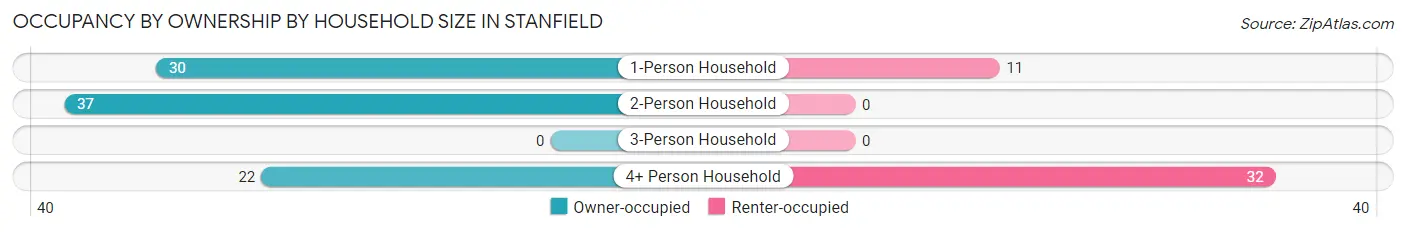
| Household Size | Owner-occupied | Renter-occupied |
| 1-Person Household | 30 (73.2%) | 11 (26.8%) |
| 2-Person Household | 37 (100.0%) | 0 (0.0%) |
| 3-Person Household | 0 (0.0%) | 0 (0.0%) |
| 4+ Person Household | 22 (40.7%) | 32 (59.3%) |
| Total Housing Units | 89 (67.4%) | 43 (32.6%) |
Occupancy by Educational Attainment in Stanfield
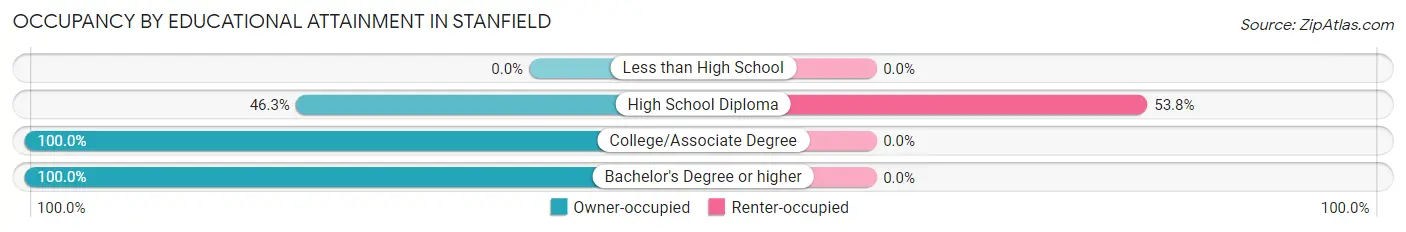
| Household Size | Owner-occupied | Renter-occupied |
| Less than High School | 0 (0.0%) | 0 (0.0%) |
| High School Diploma | 37 (46.3%) | 43 (53.7%) |
| College/Associate Degree | 30 (100.0%) | 0 (0.0%) |
| Bachelor's Degree or higher | 22 (100.0%) | 0 (0.0%) |
Occupancy by Age of Householder in Stanfield
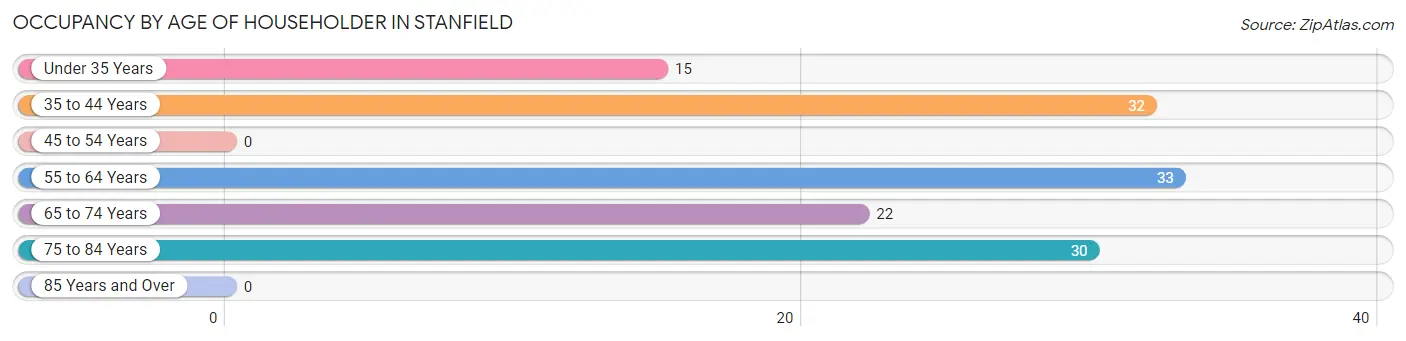
| Age Bracket | # Households | % Households |
| Under 35 Years | 15 | 11.4% |
| 35 to 44 Years | 32 | 24.2% |
| 45 to 54 Years | 0 | 0.0% |
| 55 to 64 Years | 33 | 25.0% |
| 65 to 74 Years | 22 | 16.7% |
| 75 to 84 Years | 30 | 22.7% |
| 85 Years and Over | 0 | 0.0% |
| Total | 132 | 100.0% |
Housing Finances in Stanfield
Median Income by Occupancy in Stanfield
| Occupancy Type | # Households | Median Income |
| Owner-Occupied | 89 (67.4%) | $0 |
| Renter-Occupied | 43 (32.6%) | $0 |
| Average | 132 (100.0%) | $0 |
Occupancy by Householder Income Bracket in Stanfield
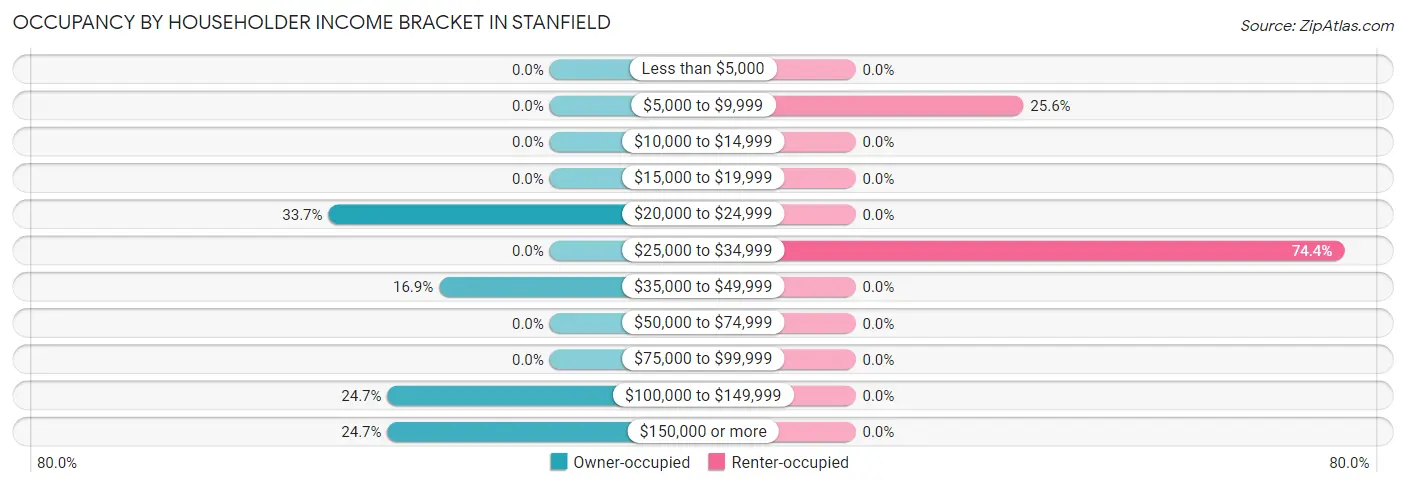
| Income Bracket | Owner-occupied | Renter-occupied |
| Less than $5,000 | 0 (0.0%) | 0 (0.0%) |
| $5,000 to $9,999 | 0 (0.0%) | 11 (25.6%) |
| $10,000 to $14,999 | 0 (0.0%) | 0 (0.0%) |
| $15,000 to $19,999 | 0 (0.0%) | 0 (0.0%) |
| $20,000 to $24,999 | 30 (33.7%) | 0 (0.0%) |
| $25,000 to $34,999 | 0 (0.0%) | 32 (74.4%) |
| $35,000 to $49,999 | 15 (16.9%) | 0 (0.0%) |
| $50,000 to $74,999 | 0 (0.0%) | 0 (0.0%) |
| $75,000 to $99,999 | 0 (0.0%) | 0 (0.0%) |
| $100,000 to $149,999 | 22 (24.7%) | 0 (0.0%) |
| $150,000 or more | 22 (24.7%) | 0 (0.0%) |
| Total | 89 (100.0%) | 43 (100.0%) |
Monthly Housing Cost Tiers in Stanfield
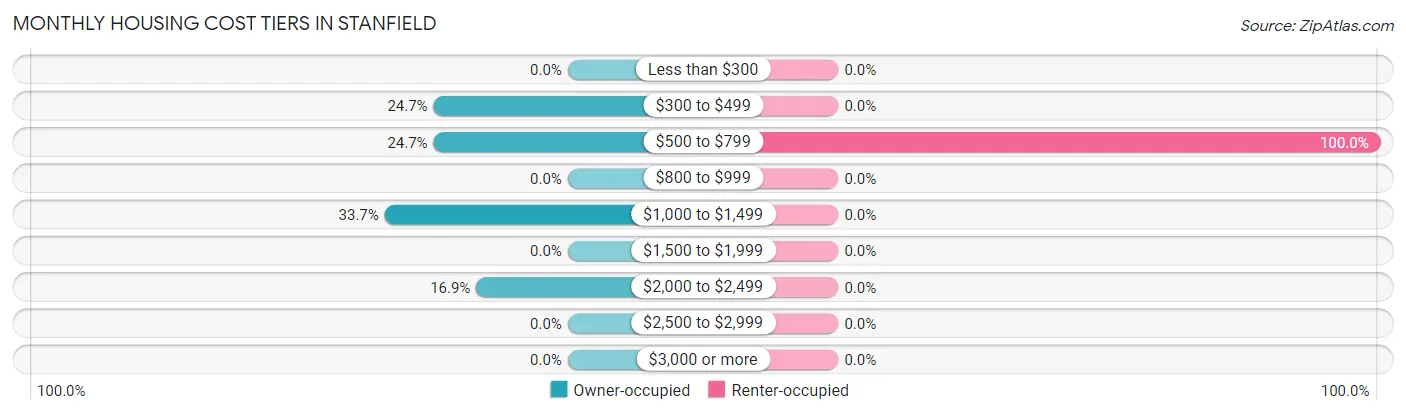
| Monthly Cost | Owner-occupied | Renter-occupied |
| Less than $300 | 0 (0.0%) | 0 (0.0%) |
| $300 to $499 | 22 (24.7%) | 0 (0.0%) |
| $500 to $799 | 22 (24.7%) | 43 (100.0%) |
| $800 to $999 | 0 (0.0%) | 0 (0.0%) |
| $1,000 to $1,499 | 30 (33.7%) | 0 (0.0%) |
| $1,500 to $1,999 | 0 (0.0%) | 0 (0.0%) |
| $2,000 to $2,499 | 15 (16.9%) | 0 (0.0%) |
| $2,500 to $2,999 | 0 (0.0%) | 0 (0.0%) |
| $3,000 or more | 0 (0.0%) | 0 (0.0%) |
| Total | 89 (100.0%) | 43 (100.0%) |
Physical Housing Characteristics in Stanfield
Housing Structures in Stanfield
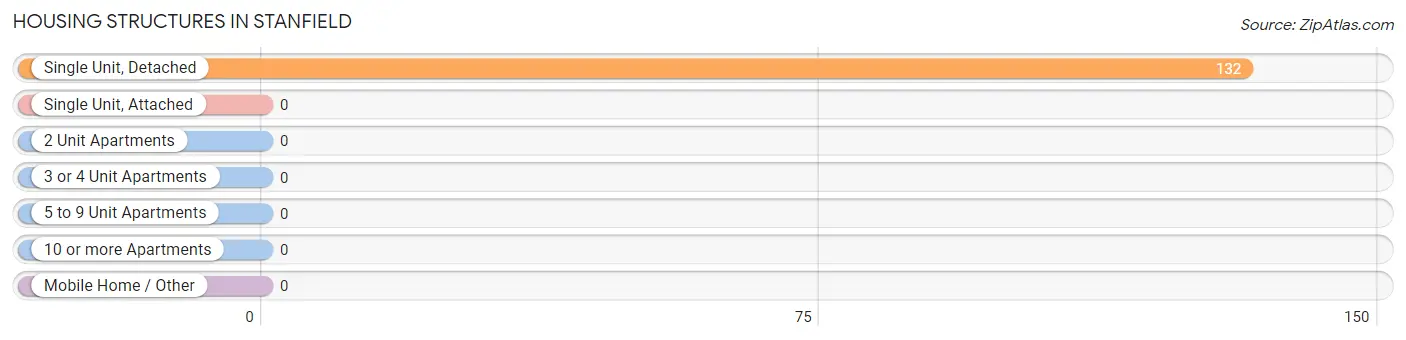
| Structure Type | # Housing Units | % Housing Units |
| Single Unit, Detached | 132 | 100.0% |
| Single Unit, Attached | 0 | 0.0% |
| 2 Unit Apartments | 0 | 0.0% |
| 3 or 4 Unit Apartments | 0 | 0.0% |
| 5 to 9 Unit Apartments | 0 | 0.0% |
| 10 or more Apartments | 0 | 0.0% |
| Mobile Home / Other | 0 | 0.0% |
| Total | 132 | 100.0% |
Housing Structures by Occupancy in Stanfield
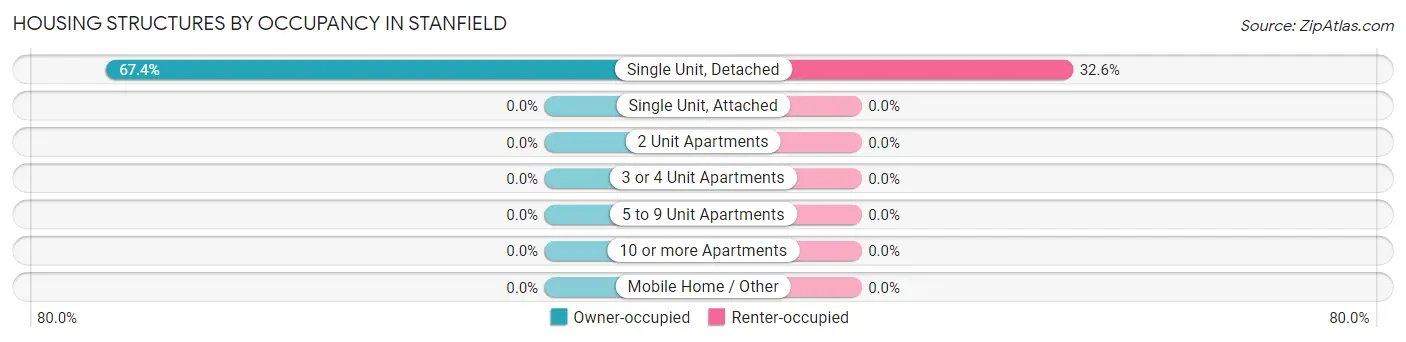
| Structure Type | Owner-occupied | Renter-occupied |
| Single Unit, Detached | 89 (67.4%) | 43 (32.6%) |
| Single Unit, Attached | 0 (0.0%) | 0 (0.0%) |
| 2 Unit Apartments | 0 (0.0%) | 0 (0.0%) |
| 3 or 4 Unit Apartments | 0 (0.0%) | 0 (0.0%) |
| 5 to 9 Unit Apartments | 0 (0.0%) | 0 (0.0%) |
| 10 or more Apartments | 0 (0.0%) | 0 (0.0%) |
| Mobile Home / Other | 0 (0.0%) | 0 (0.0%) |
| Total | 89 (67.4%) | 43 (32.6%) |
Housing Structures by Number of Rooms in Stanfield
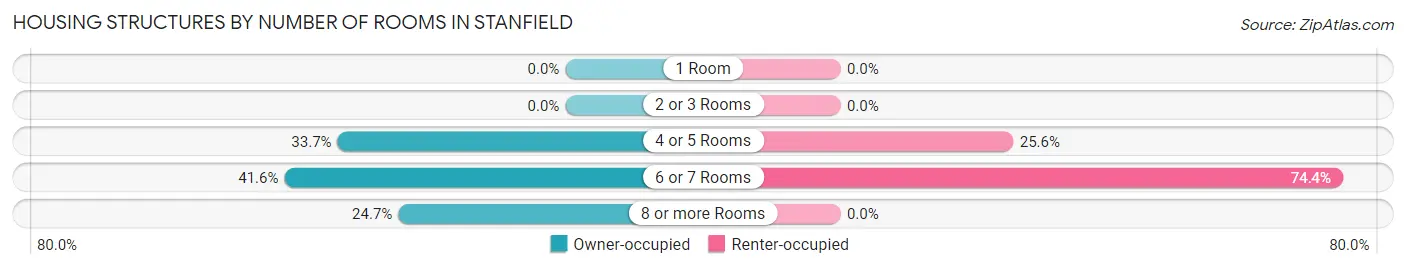
| Number of Rooms | Owner-occupied | Renter-occupied |
| 1 Room | 0 (0.0%) | 0 (0.0%) |
| 2 or 3 Rooms | 0 (0.0%) | 0 (0.0%) |
| 4 or 5 Rooms | 30 (33.7%) | 11 (25.6%) |
| 6 or 7 Rooms | 37 (41.6%) | 32 (74.4%) |
| 8 or more Rooms | 22 (24.7%) | 0 (0.0%) |
| Total | 89 (100.0%) | 43 (100.0%) |
Housing Structure by Heating Type in Stanfield
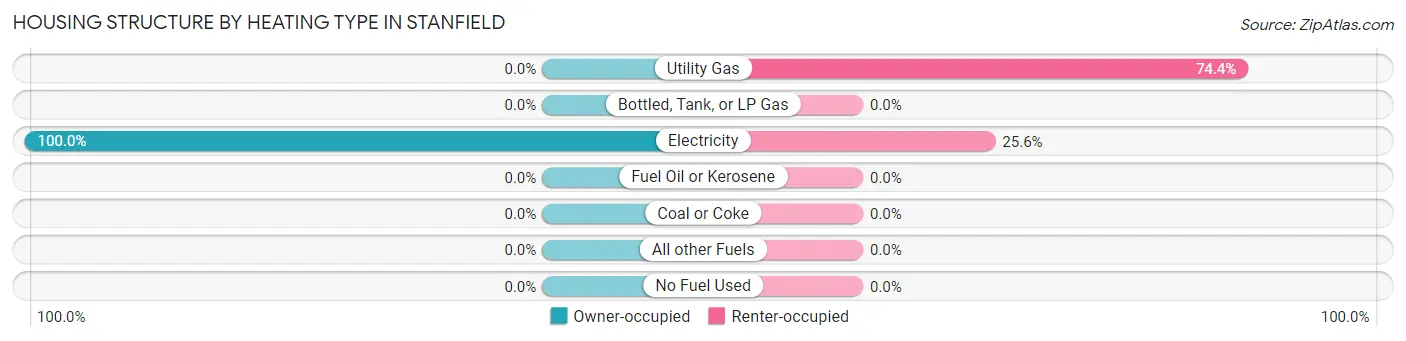
| Heating Type | Owner-occupied | Renter-occupied |
| Utility Gas | 0 (0.0%) | 32 (74.4%) |
| Bottled, Tank, or LP Gas | 0 (0.0%) | 0 (0.0%) |
| Electricity | 89 (100.0%) | 11 (25.6%) |
| Fuel Oil or Kerosene | 0 (0.0%) | 0 (0.0%) |
| Coal or Coke | 0 (0.0%) | 0 (0.0%) |
| All other Fuels | 0 (0.0%) | 0 (0.0%) |
| No Fuel Used | 0 (0.0%) | 0 (0.0%) |
| Total | 89 (100.0%) | 43 (100.0%) |
Household Vehicle Usage in Stanfield
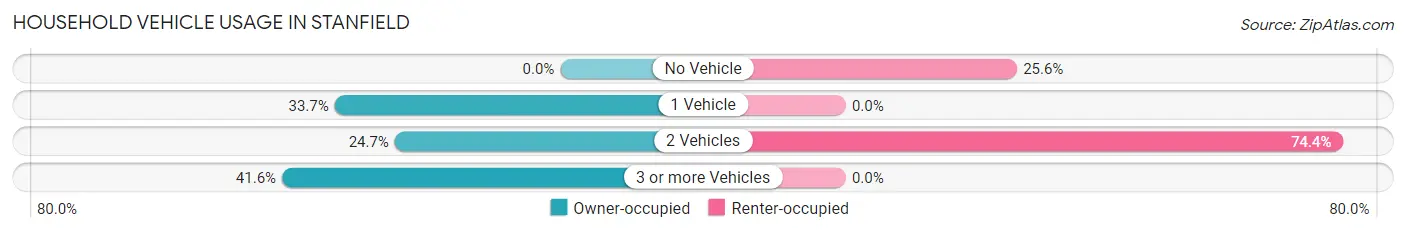
| Vehicles per Household | Owner-occupied | Renter-occupied |
| No Vehicle | 0 (0.0%) | 11 (25.6%) |
| 1 Vehicle | 30 (33.7%) | 0 (0.0%) |
| 2 Vehicles | 22 (24.7%) | 32 (74.4%) |
| 3 or more Vehicles | 37 (41.6%) | 0 (0.0%) |
| Total | 89 (100.0%) | 43 (100.0%) |
Real Estate & Mortgages in Stanfield
Real Estate and Mortgage Overview in Stanfield
| Characteristic | Without Mortgage | With Mortgage |
| Housing Units | 44 | 45 |
| Median Property Value | - | - |
| Median Household Income | - | - |
| Monthly Housing Costs | - | - |
| Real Estate Taxes | - | - |
Property Value by Mortgage Status in Stanfield
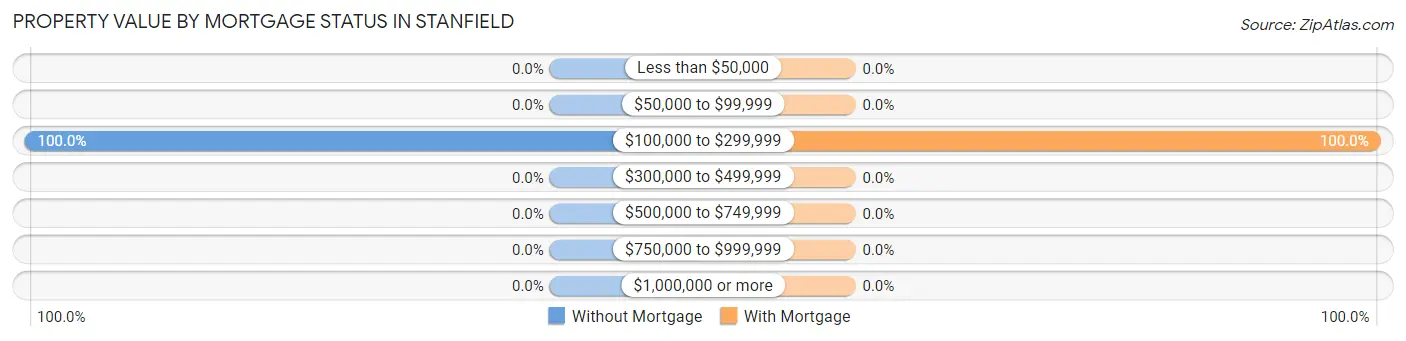
| Property Value | Without Mortgage | With Mortgage |
| Less than $50,000 | 0 (0.0%) | 0 (0.0%) |
| $50,000 to $99,999 | 0 (0.0%) | 0 (0.0%) |
| $100,000 to $299,999 | 44 (100.0%) | 45 (100.0%) |
| $300,000 to $499,999 | 0 (0.0%) | 0 (0.0%) |
| $500,000 to $749,999 | 0 (0.0%) | 0 (0.0%) |
| $750,000 to $999,999 | 0 (0.0%) | 0 (0.0%) |
| $1,000,000 or more | 0 (0.0%) | 0 (0.0%) |
| Total | 44 (100.0%) | 45 (100.0%) |
Household Income by Mortgage Status in Stanfield
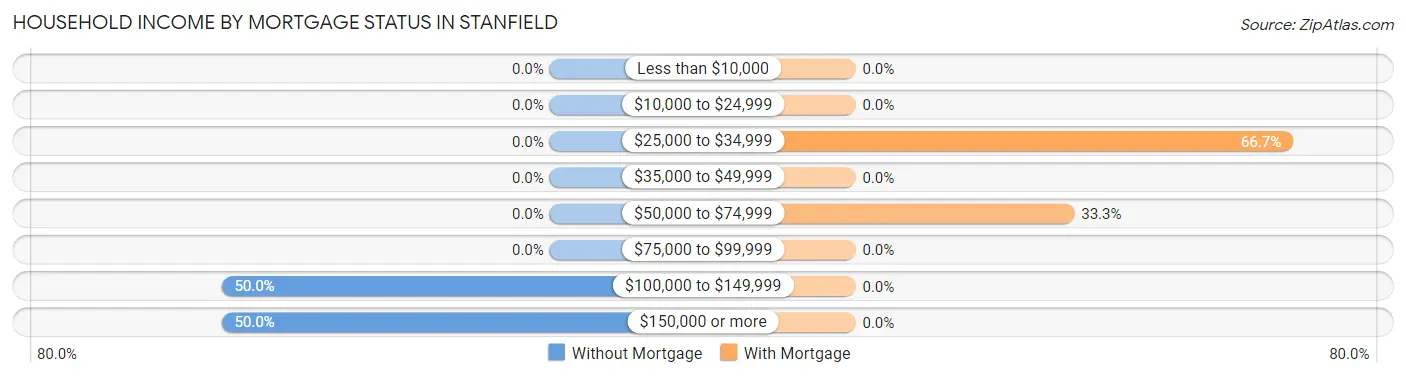
| Household Income | Without Mortgage | With Mortgage |
| Less than $10,000 | 0 (0.0%) | 0 (0.0%) |
| $10,000 to $24,999 | 0 (0.0%) | 0 (0.0%) |
| $25,000 to $34,999 | 0 (0.0%) | 30 (66.7%) |
| $35,000 to $49,999 | 0 (0.0%) | 0 (0.0%) |
| $50,000 to $74,999 | 0 (0.0%) | 15 (33.3%) |
| $75,000 to $99,999 | 0 (0.0%) | 0 (0.0%) |
| $100,000 to $149,999 | 22 (50.0%) | 0 (0.0%) |
| $150,000 or more | 22 (50.0%) | 0 (0.0%) |
| Total | 44 (100.0%) | 45 (100.0%) |
Property Value to Household Income Ratio in Stanfield
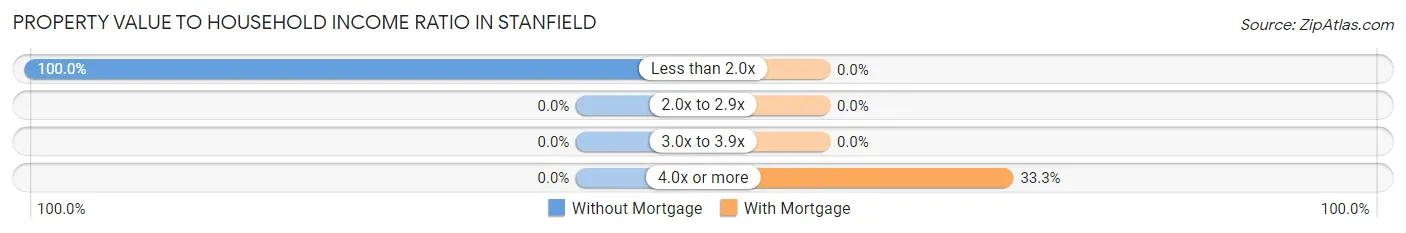
| Value-to-Income Ratio | Without Mortgage | With Mortgage |
| Less than 2.0x | 44 (100.0%) | 0 (0.0%) |
| 2.0x to 2.9x | 0 (0.0%) | 0 (0.0%) |
| 3.0x to 3.9x | 0 (0.0%) | 0 (0.0%) |
| 4.0x or more | 0 (0.0%) | 15 (33.3%) |
| Total | 44 (100.0%) | 45 (100.0%) |
Real Estate Taxes by Mortgage Status in Stanfield
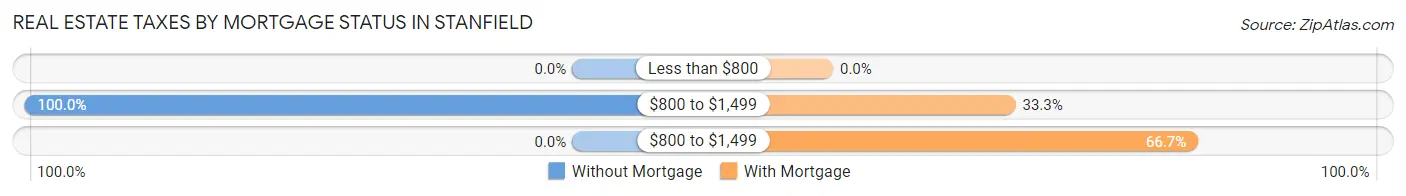
| Property Taxes | Without Mortgage | With Mortgage |
| Less than $800 | 0 (0.0%) | 0 (0.0%) |
| $800 to $1,499 | 44 (100.0%) | 15 (33.3%) |
| $800 to $1,499 | 0 (0.0%) | 30 (66.7%) |
| Total | 44 (100.0%) | 45 (100.0%) |
Health & Disability in Stanfield
Health Insurance Coverage by Age in Stanfield
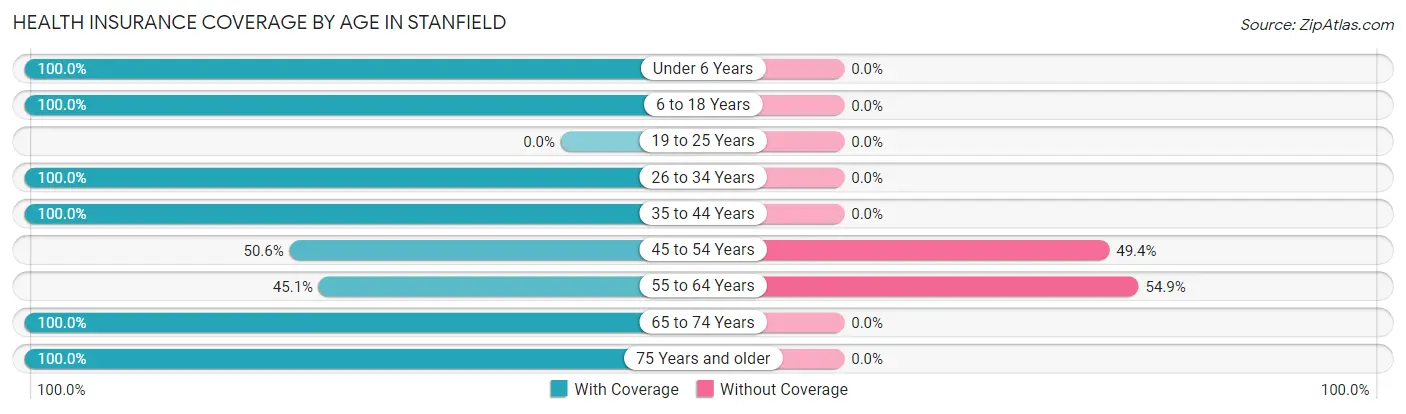
| Age Bracket | With Coverage | Without Coverage |
| Under 6 Years | 71 (100.0%) | 0 (0.0%) |
| 6 to 18 Years | 53 (100.0%) | 0 (0.0%) |
| 19 to 25 Years | 0 (0.0%) | 0 (0.0%) |
| 26 to 34 Years | 28 (100.0%) | 0 (0.0%) |
| 35 to 44 Years | 62 (100.0%) | 0 (0.0%) |
| 45 to 54 Years | 43 (50.6%) | 42 (49.4%) |
| 55 to 64 Years | 37 (45.1%) | 45 (54.9%) |
| 65 to 74 Years | 46 (100.0%) | 0 (0.0%) |
| 75 Years and older | 30 (100.0%) | 0 (0.0%) |
| Total | 370 (81.0%) | 87 (19.0%) |
Health Insurance Coverage by Citizenship Status in Stanfield
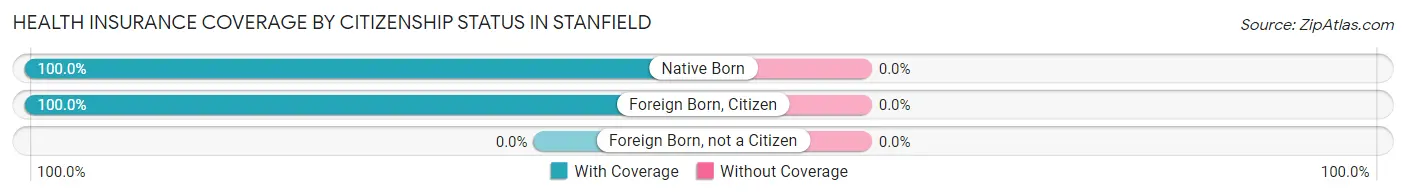
| Citizenship Status | With Coverage | Without Coverage |
| Native Born | 71 (100.0%) | 0 (0.0%) |
| Foreign Born, Citizen | 53 (100.0%) | 0 (0.0%) |
| Foreign Born, not a Citizen | 0 (0.0%) | 0 (0.0%) |
Health Insurance Coverage by Household Income in Stanfield
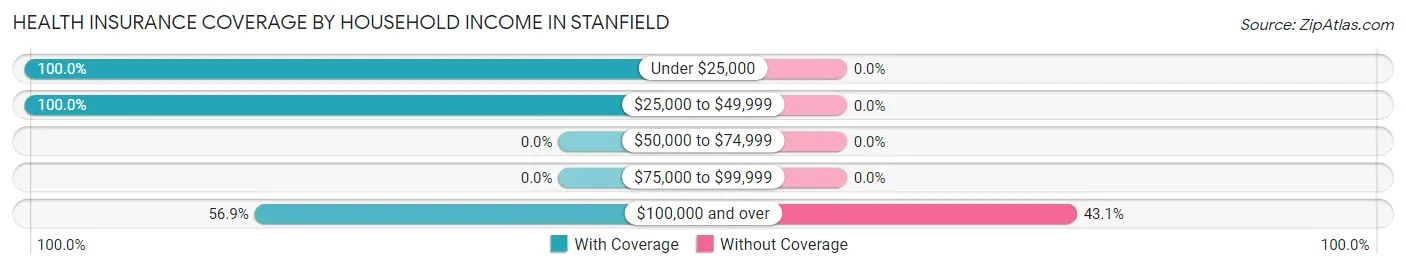
| Household Income | With Coverage | Without Coverage |
| Under $25,000 | 41 (100.0%) | 0 (0.0%) |
| $25,000 to $49,999 | 214 (100.0%) | 0 (0.0%) |
| $50,000 to $74,999 | 0 (0.0%) | 0 (0.0%) |
| $75,000 to $99,999 | 0 (0.0%) | 0 (0.0%) |
| $100,000 and over | 115 (56.9%) | 87 (43.1%) |
Public vs Private Health Insurance Coverage by Age in Stanfield
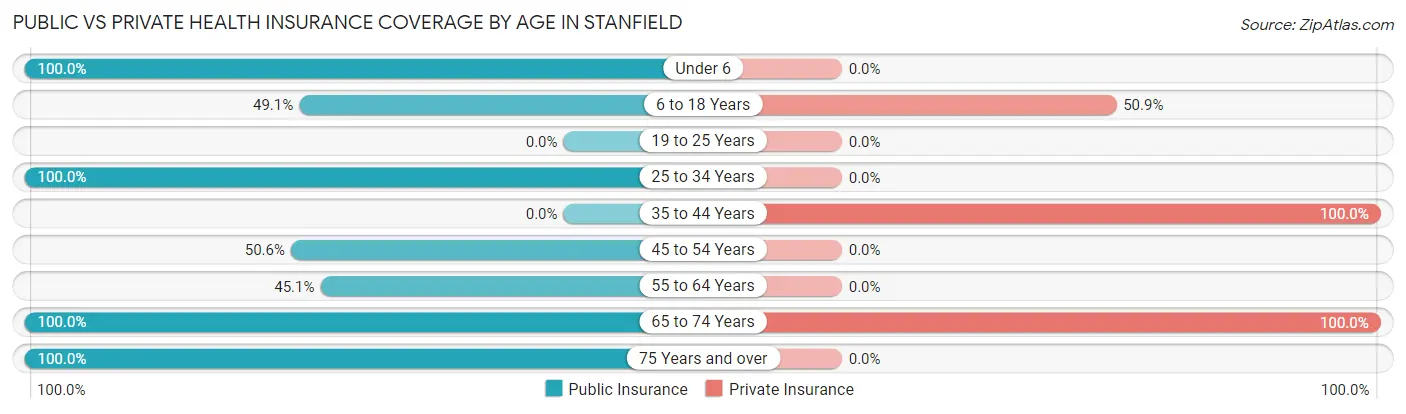
| Age Bracket | Public Insurance | Private Insurance |
| Under 6 | 71 (100.0%) | 0 (0.0%) |
| 6 to 18 Years | 26 (49.1%) | 27 (50.9%) |
| 19 to 25 Years | 0 (0.0%) | 0 (0.0%) |
| 25 to 34 Years | 28 (100.0%) | 0 (0.0%) |
| 35 to 44 Years | 0 (0.0%) | 62 (100.0%) |
| 45 to 54 Years | 43 (50.6%) | 0 (0.0%) |
| 55 to 64 Years | 37 (45.1%) | 0 (0.0%) |
| 65 to 74 Years | 46 (100.0%) | 46 (100.0%) |
| 75 Years and over | 30 (100.0%) | 0 (0.0%) |
| Total | 281 (61.5%) | 135 (29.5%) |
Disability Status by Sex by Age in Stanfield
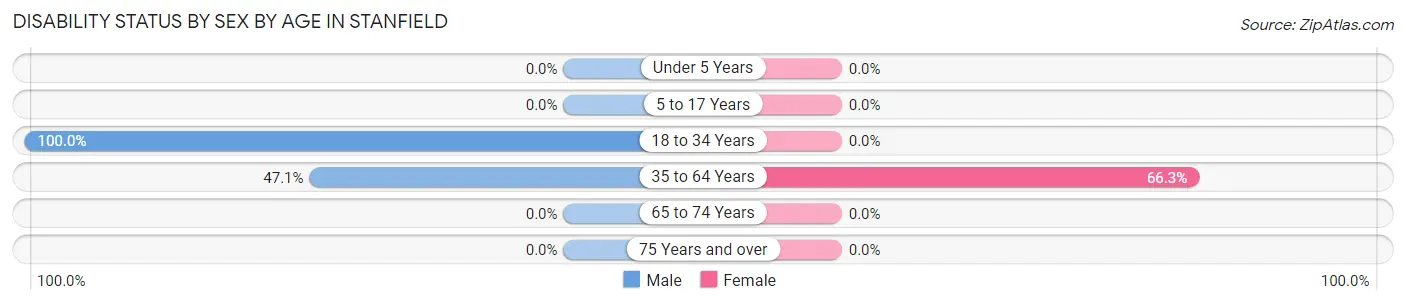
| Age Bracket | Male | Female |
| Under 5 Years | 0 (0.0%) | 0 (0.0%) |
| 5 to 17 Years | 0 (0.0%) | 0 (0.0%) |
| 18 to 34 Years | 15 (100.0%) | 0 (0.0%) |
| 35 to 64 Years | 66 (47.1%) | 59 (66.3%) |
| 65 to 74 Years | 0 (0.0%) | 0 (0.0%) |
| 75 Years and over | 0 (0.0%) | 0 (0.0%) |
Disability Class by Sex by Age in Stanfield
Disability Class: Hearing Difficulty
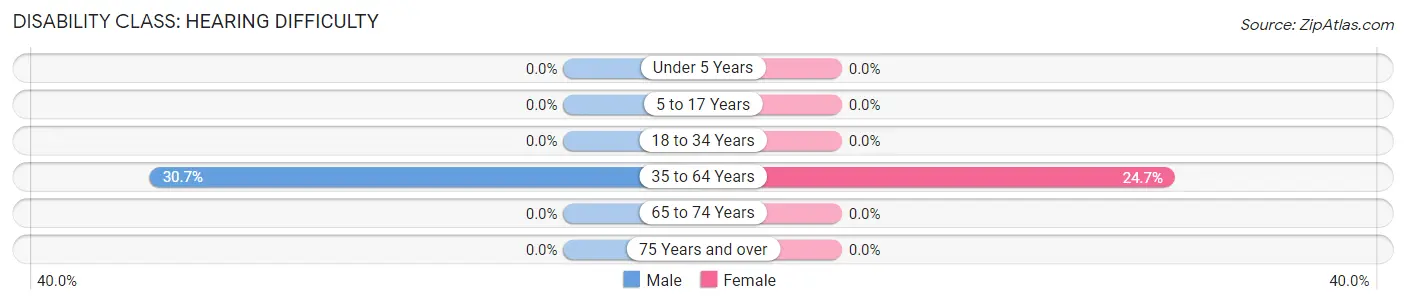
| Age Bracket | Male | Female |
| Under 5 Years | 0 (0.0%) | 0 (0.0%) |
| 5 to 17 Years | 0 (0.0%) | 0 (0.0%) |
| 18 to 34 Years | 0 (0.0%) | 0 (0.0%) |
| 35 to 64 Years | 43 (30.7%) | 22 (24.7%) |
| 65 to 74 Years | 0 (0.0%) | 0 (0.0%) |
| 75 Years and over | 0 (0.0%) | 0 (0.0%) |
Disability Class: Vision Difficulty
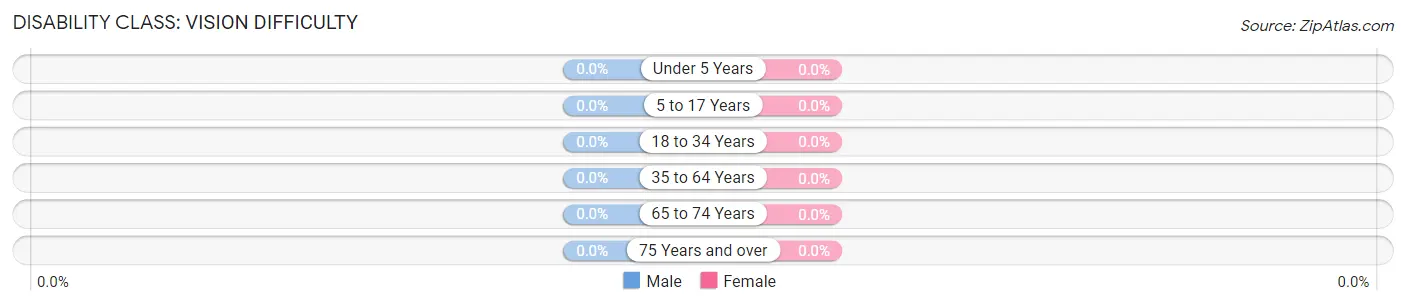
| Age Bracket | Male | Female |
| Under 5 Years | 0 (0.0%) | 0 (0.0%) |
| 5 to 17 Years | 0 (0.0%) | 0 (0.0%) |
| 18 to 34 Years | 0 (0.0%) | 0 (0.0%) |
| 35 to 64 Years | 0 (0.0%) | 0 (0.0%) |
| 65 to 74 Years | 0 (0.0%) | 0 (0.0%) |
| 75 Years and over | 0 (0.0%) | 0 (0.0%) |
Disability Class: Cognitive Difficulty
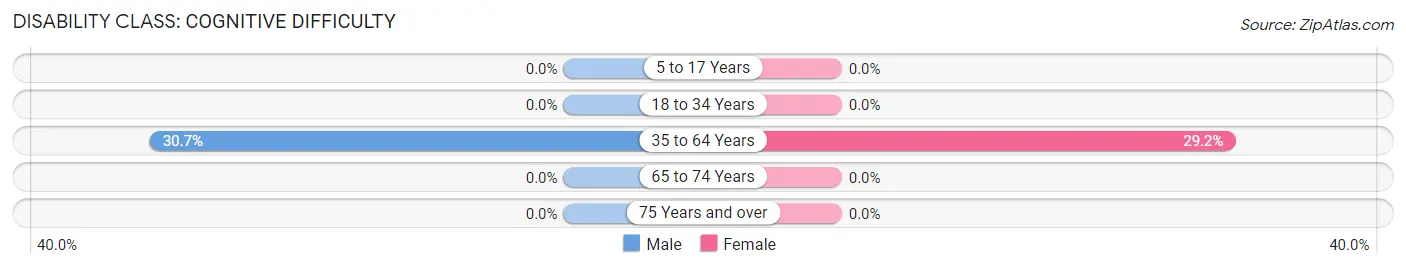
| Age Bracket | Male | Female |
| 5 to 17 Years | 0 (0.0%) | 0 (0.0%) |
| 18 to 34 Years | 0 (0.0%) | 0 (0.0%) |
| 35 to 64 Years | 43 (30.7%) | 26 (29.2%) |
| 65 to 74 Years | 0 (0.0%) | 0 (0.0%) |
| 75 Years and over | 0 (0.0%) | 0 (0.0%) |
Disability Class: Ambulatory Difficulty
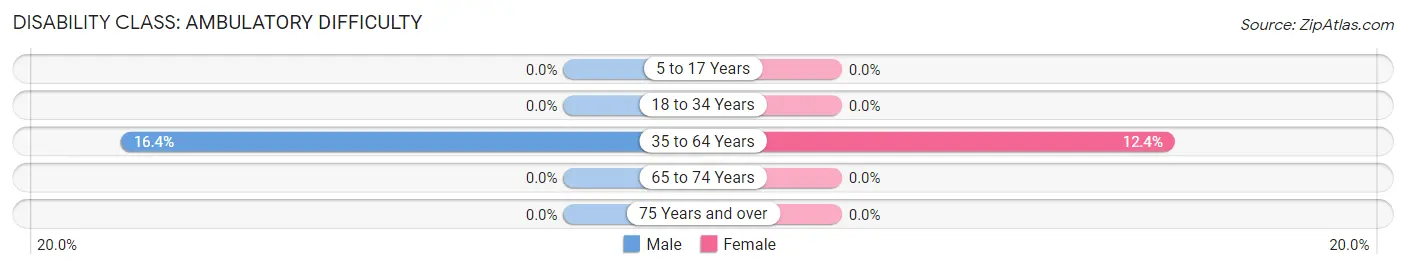
| Age Bracket | Male | Female |
| 5 to 17 Years | 0 (0.0%) | 0 (0.0%) |
| 18 to 34 Years | 0 (0.0%) | 0 (0.0%) |
| 35 to 64 Years | 23 (16.4%) | 11 (12.4%) |
| 65 to 74 Years | 0 (0.0%) | 0 (0.0%) |
| 75 Years and over | 0 (0.0%) | 0 (0.0%) |
Disability Class: Self-Care Difficulty
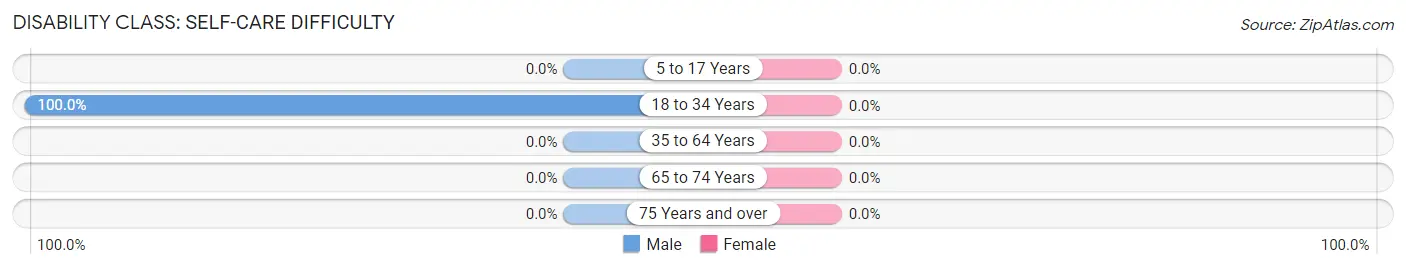
| Age Bracket | Male | Female |
| 5 to 17 Years | 0 (0.0%) | 0 (0.0%) |
| 18 to 34 Years | 15 (100.0%) | 0 (0.0%) |
| 35 to 64 Years | 0 (0.0%) | 0 (0.0%) |
| 65 to 74 Years | 0 (0.0%) | 0 (0.0%) |
| 75 Years and over | 0 (0.0%) | 0 (0.0%) |
Technology Access in Stanfield
Computing Device Access in Stanfield
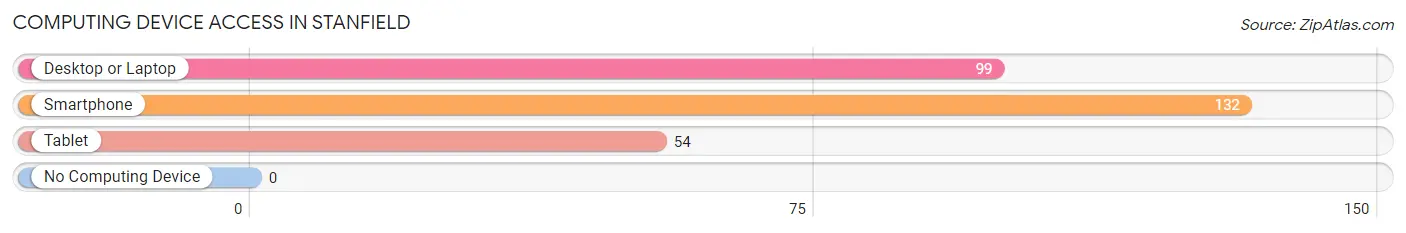
| Device Type | # Households | % Households |
| Desktop or Laptop | 99 | 75.0% |
| Smartphone | 132 | 100.0% |
| Tablet | 54 | 40.9% |
| No Computing Device | 0 | 0.0% |
| Total | 132 | 100.0% |
Internet Access in Stanfield
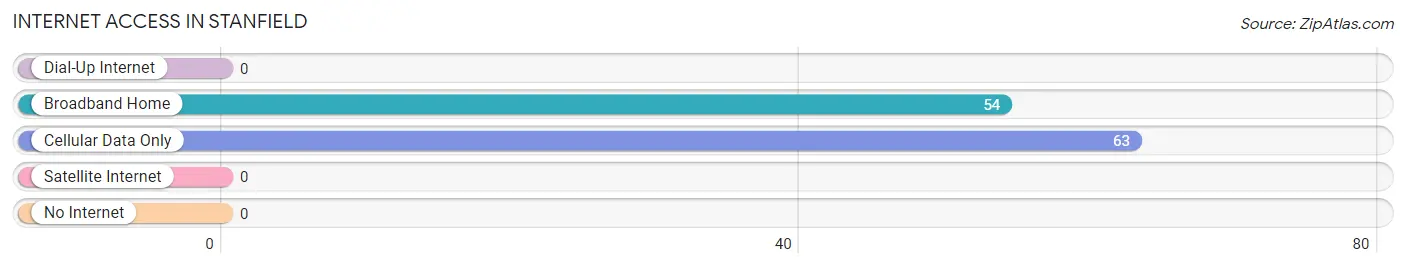
| Internet Type | # Households | % Households |
| Dial-Up Internet | 0 | 0.0% |
| Broadband Home | 54 | 40.9% |
| Cellular Data Only | 63 | 47.7% |
| Satellite Internet | 0 | 0.0% |
| No Internet | 0 | 0.0% |
| Total | 132 | 100.0% |
Stanfield Summary
Stanfield, Arizona is a small town located in the Gila River Valley of Pinal County, Arizona. It is situated about 40 miles south of Phoenix and is part of the Phoenix metropolitan area. The town was founded in 1878 and was originally known as Stanfield Station. It was named after the first postmaster, William Stanfield.
History
The area around Stanfield was first inhabited by the Hohokam people, who were a Native American tribe that lived in the area from around 300 BC to 1450 AD. The area was later settled by Mexican and American settlers in the late 1800s. The town was founded in 1878 and was originally known as Stanfield Station. It was named after the first postmaster, William Stanfield.
The town was originally a stop on the Southern Pacific Railroad line, and it was also a stagecoach stop. The town grew slowly over the years, and by the early 1900s, it had a population of around 200 people. The town was incorporated in 1910 and the population had grown to around 500 people by 1920.
Geography
Stanfield is located in the Gila River Valley of Pinal County, Arizona. It is situated about 40 miles south of Phoenix and is part of the Phoenix metropolitan area. The town is located at an elevation of 1,072 feet above sea level. The town is surrounded by desert and is located near the Gila River.
The climate in Stanfield is hot and dry, with temperatures ranging from the mid-90s in the summer to the mid-50s in the winter. The town receives an average of 8.5 inches of rain per year.
Economy
The economy of Stanfield is largely based on agriculture. The town is home to several farms and ranches, and the main crops grown in the area are cotton, alfalfa, and wheat. The town is also home to several small businesses, including a grocery store, a hardware store, and a few restaurants.
Demographics
As of the 2010 census, the population of Stanfield was 1,845. The racial makeup of the town was 75.3% White, 0.7% African American, 0.9% Native American, 0.2% Asian, 0.1% Pacific Islander, and 21.8% from other races. The median household income in Stanfield was $30,938, and the median family income was $35,938. The per capita income in Stanfield was $14,938.
Conclusion
Stanfield, Arizona is a small town located in the Gila River Valley of Pinal County, Arizona. It was founded in 1878 and was originally known as Stanfield Station. The town has a population of 1,845 and is largely based on agriculture. The town is home to several farms and ranches, and the main crops grown in the area are cotton, alfalfa, and wheat. The town is also home to several small businesses, including a grocery store, a hardware store, and a few restaurants. The town has a hot and dry climate, with temperatures ranging from the mid-90s in the summer to the mid-50s in the winter.
Common Questions
What is Per Capita Income in Stanfield?
Per Capita income in Stanfield is $20,225.
What is Income or Wage Gap in Stanfield?
Income or Wage Gap in Stanfield is 27.9%.
Women in Stanfield earn 72.1 cents for every dollar earned by a man.
What is Inequality or Gini Index in Stanfield?
Inequality or Gini Index in Stanfield is 0.44.
What is the Total Population of Stanfield?
Total Population of Stanfield is 457.
What is the Total Male Population of Stanfield?
Total Male Population of Stanfield is 253.
What is the Total Female Population of Stanfield?
Total Female Population of Stanfield is 204.
What is the Ratio of Males per 100 Females in Stanfield?
There are 124.02 Males per 100 Females in Stanfield.
What is the Ratio of Females per 100 Males in Stanfield?
There are 80.63 Females per 100 Males in Stanfield.
What is the Median Population Age in Stanfield?
Median Population Age in Stanfield is 47.3 Years.
What is the Average Family Size in Stanfield
Average Family Size in Stanfield is 3.8 People.
What is the Average Household Size in Stanfield
Average Household Size in Stanfield is 3.5 People.
How Large is the Labor Force in Stanfield?
There are 220 People in the Labor Forcein in Stanfield.
What is the Percentage of People in the Labor Force in Stanfield?
66.1% of People are in the Labor Force in Stanfield.
What is the Unemployment Rate in Stanfield?
Unemployment Rate in Stanfield is 19.5%.