Chandler, IN Map & Demographics
Chandler Map
Chandler Overview
$28,936
PER CAPITA INCOME
$72,841
AVG FAMILY INCOME
$63,500
AVG HOUSEHOLD INCOME
44.2%
WAGE / INCOME GAP [ % ]
55.8¢/ $1
WAGE / INCOME GAP [ $ ]
0.43
INEQUALITY / GINI INDEX
3,726
TOTAL POPULATION
1,788
MALE POPULATION
1,938
FEMALE POPULATION
92.26
MALES / 100 FEMALES
108.39
FEMALES / 100 MALES
36.5
MEDIAN AGE
3.0
AVG FAMILY SIZE
2.5
AVG HOUSEHOLD SIZE
2,052
LABOR FORCE [ PEOPLE ]
66.8%
PERCENT IN LABOR FORCE
9.8%
UNEMPLOYMENT RATE
Chandler Zip Codes
Chandler Area Codes
Income in Chandler
Income Overview in Chandler
Per Capita Income in Chandler is $28,936, while median incomes of families and households are $72,841 and $63,500 respectively.
| Characteristic | Number | Measure |
| Per Capita Income | 3,726 | $28,936 |
| Median Family Income | 942 | $72,841 |
| Mean Family Income | 942 | $79,065 |
| Median Household Income | 1,472 | $63,500 |
| Mean Household Income | 1,472 | $71,549 |
| Income Deficit | 942 | $0 |
| Wage / Income Gap (%) | 3,726 | 44.22% |
| Wage / Income Gap ($) | 3,726 | 55.78¢ per $1 |
| Gini / Inequality Index | 3,726 | 0.43 |
Earnings by Sex in Chandler
Average Earnings in Chandler are $36,310, $46,389 for men and $25,875 for women, a difference of 44.2%.
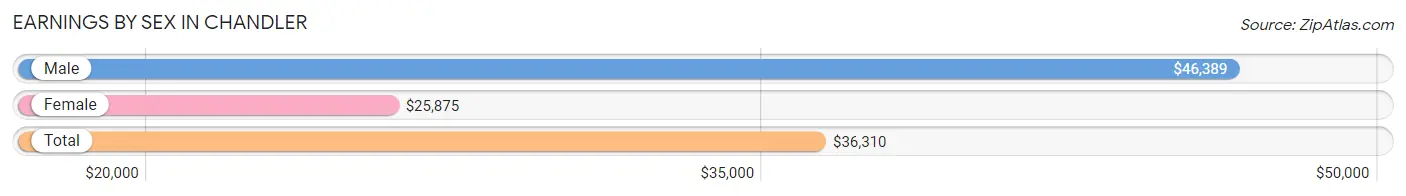
| Sex | Number | Average Earnings |
| Male | 1,122 (54.1%) | $46,389 |
| Female | 952 (45.9%) | $25,875 |
| Total | 2,074 (100.0%) | $36,310 |
Earnings by Sex by Income Bracket in Chandler
The most common earnings brackets in Chandler are $45,000 to $49,999 for men (144 | 12.8%) and $35,000 to $39,999 for women (133 | 14.0%).
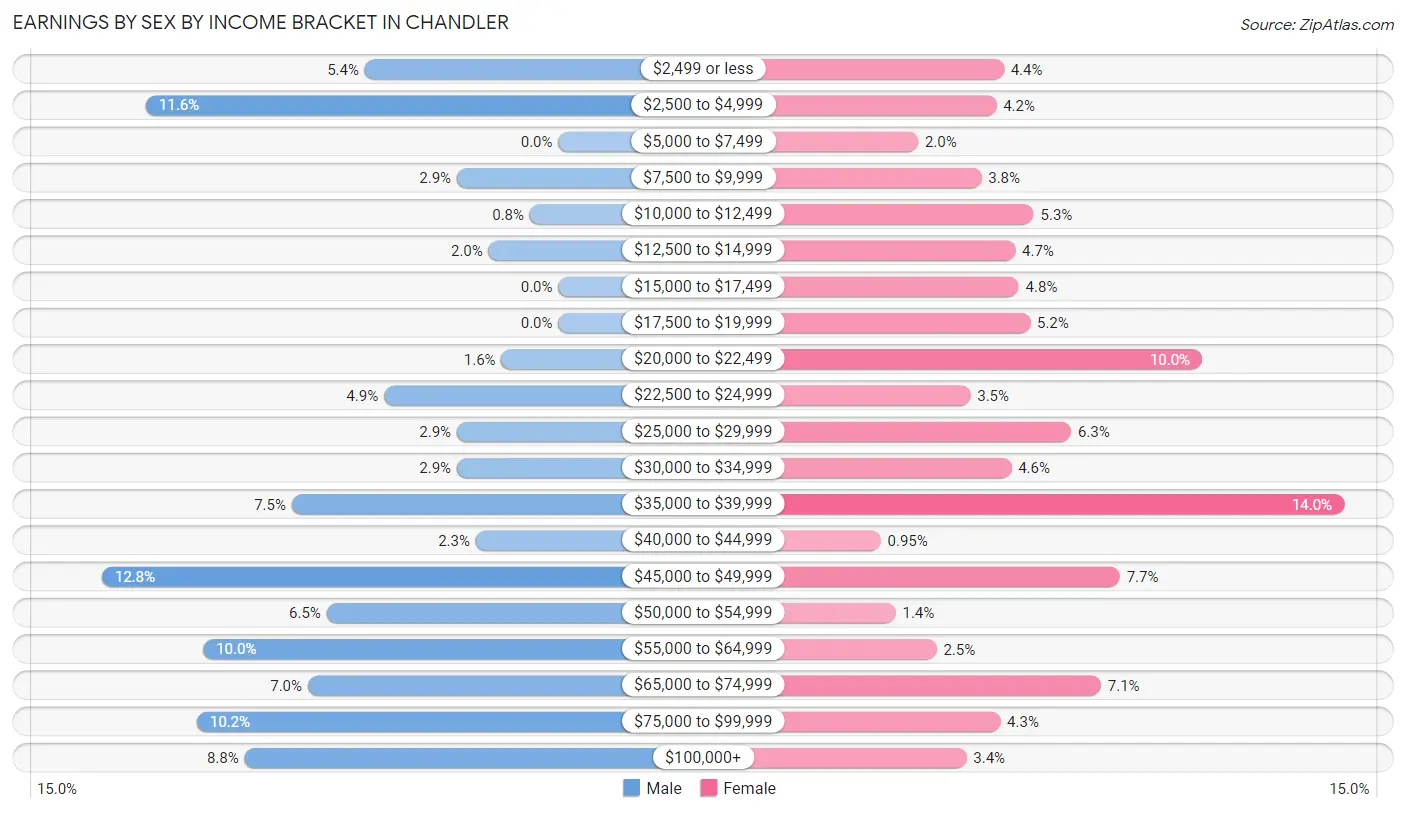
| Income | Male | Female |
| $2,499 or less | 61 (5.4%) | 42 (4.4%) |
| $2,500 to $4,999 | 130 (11.6%) | 40 (4.2%) |
| $5,000 to $7,499 | 0 (0.0%) | 19 (2.0%) |
| $7,500 to $9,999 | 32 (2.9%) | 36 (3.8%) |
| $10,000 to $12,499 | 9 (0.8%) | 50 (5.2%) |
| $12,500 to $14,999 | 22 (2.0%) | 45 (4.7%) |
| $15,000 to $17,499 | 0 (0.0%) | 46 (4.8%) |
| $17,500 to $19,999 | 0 (0.0%) | 49 (5.1%) |
| $20,000 to $22,499 | 18 (1.6%) | 95 (10.0%) |
| $22,500 to $24,999 | 55 (4.9%) | 33 (3.5%) |
| $25,000 to $29,999 | 32 (2.9%) | 60 (6.3%) |
| $30,000 to $34,999 | 32 (2.9%) | 44 (4.6%) |
| $35,000 to $39,999 | 84 (7.5%) | 133 (14.0%) |
| $40,000 to $44,999 | 26 (2.3%) | 9 (0.9%) |
| $45,000 to $49,999 | 144 (12.8%) | 73 (7.7%) |
| $50,000 to $54,999 | 73 (6.5%) | 13 (1.4%) |
| $55,000 to $64,999 | 112 (10.0%) | 24 (2.5%) |
| $65,000 to $74,999 | 79 (7.0%) | 68 (7.1%) |
| $75,000 to $99,999 | 114 (10.2%) | 41 (4.3%) |
| $100,000+ | 99 (8.8%) | 32 (3.4%) |
| Total | 1,122 (100.0%) | 952 (100.0%) |
Earnings by Sex by Educational Attainment in Chandler
Average earnings in Chandler are $53,285 for men and $31,719 for women, a difference of 40.5%. Men with an educational attainment of less than high school enjoy the highest average annual earnings of $87,845, while those with high school diploma education earn the least with $47,232. Women with an educational attainment of graduate degree earn the most with the average annual earnings of $68,309, while those with bachelor's degree education have the smallest earnings of $22,027.
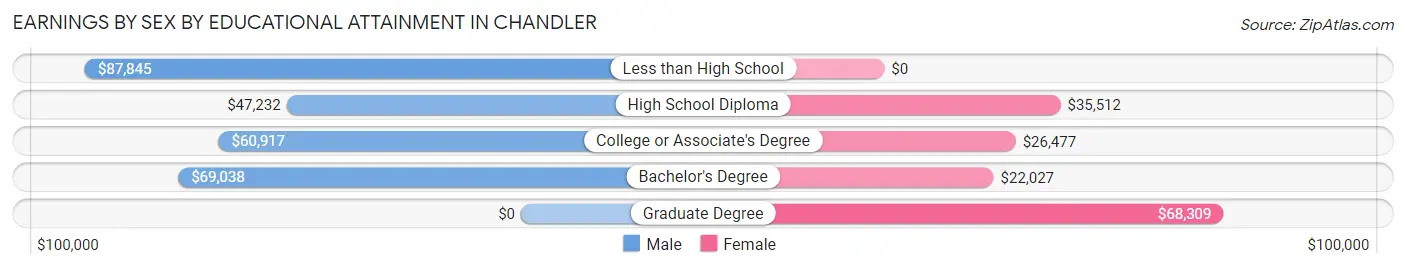
| Educational Attainment | Male Income | Female Income |
| Less than High School | $87,845 | $0 |
| High School Diploma | $47,232 | $35,512 |
| College or Associate's Degree | $60,917 | $26,477 |
| Bachelor's Degree | $69,038 | $22,027 |
| Graduate Degree | - | - |
| Total | $53,285 | $31,719 |
Family Income in Chandler
Family Income Brackets in Chandler
According to the Chandler family income data, there are 191 families falling into the $75,000 to $99,999 income range, which is the most common income bracket and makes up 20.3% of all families.
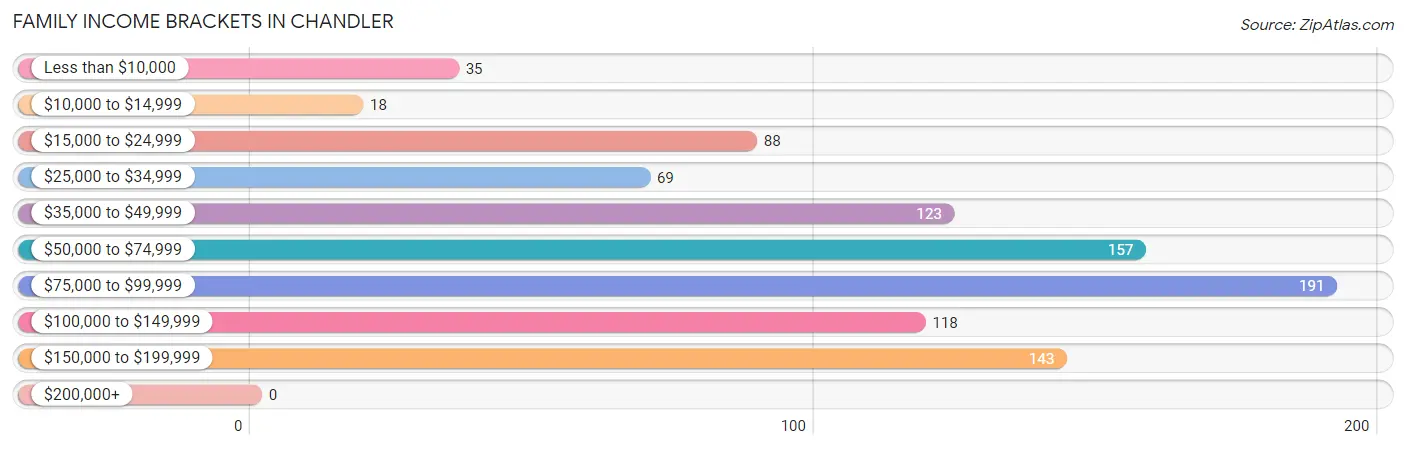
| Income Bracket | # Families | % Families |
| Less than $10,000 | 35 | 3.7% |
| $10,000 to $14,999 | 18 | 1.9% |
| $15,000 to $24,999 | 88 | 9.3% |
| $25,000 to $34,999 | 69 | 7.3% |
| $35,000 to $49,999 | 123 | 13.1% |
| $50,000 to $74,999 | 157 | 16.7% |
| $75,000 to $99,999 | 191 | 20.3% |
| $100,000 to $149,999 | 118 | 12.5% |
| $150,000 to $199,999 | 143 | 15.2% |
| $200,000+ | 0 | 0.0% |
Family Income by Famaliy Size in Chandler
4-person families (198 | 21.0%) account for the highest median family income in Chandler with $101,667 per family, while 2-person families (413 | 43.8%) have the highest median income of $35,562 per family member.
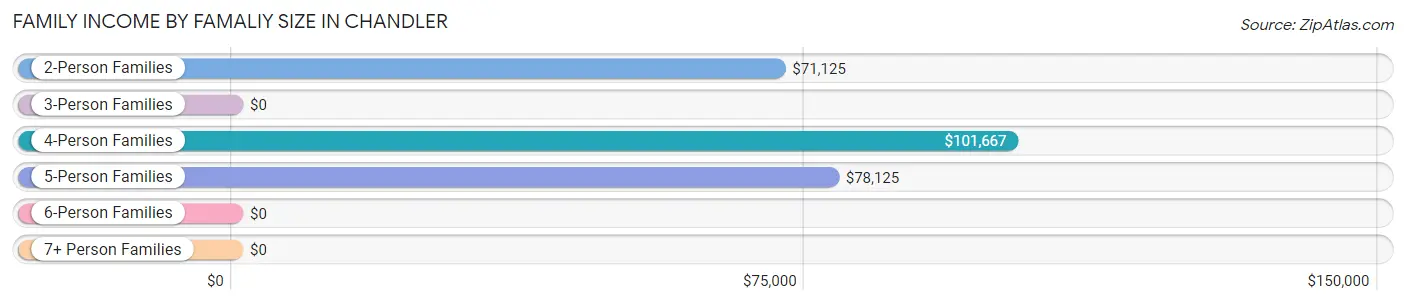
| Income Bracket | # Families | Median Income |
| 2-Person Families | 413 (43.8%) | $71,125 |
| 3-Person Families | 232 (24.6%) | $0 |
| 4-Person Families | 198 (21.0%) | $101,667 |
| 5-Person Families | 99 (10.5%) | $78,125 |
| 6-Person Families | 0 (0.0%) | $0 |
| 7+ Person Families | 0 (0.0%) | $0 |
| Total | 942 (100.0%) | $72,841 |
Family Income by Number of Earners in Chandler
The median family income in Chandler is $72,841, with families comprising 2 earners (394) having the highest median family income of $95,481, while families with no earners (76) have the lowest median family income of $32,500, accounting for 41.8% and 8.1% of families, respectively.
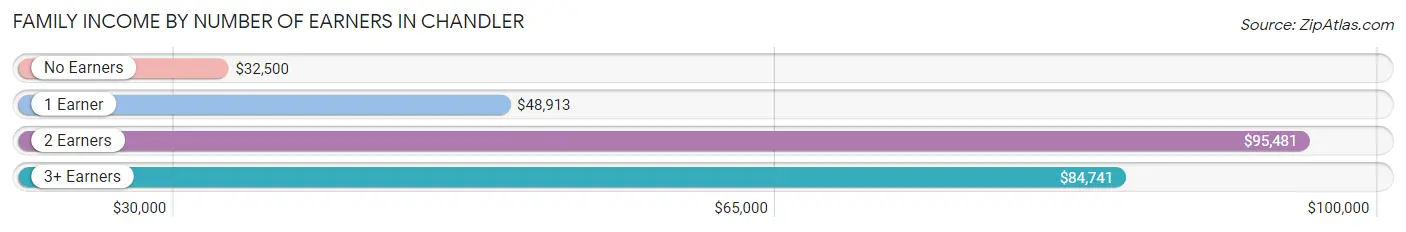
| Number of Earners | # Families | Median Income |
| No Earners | 76 (8.1%) | $32,500 |
| 1 Earner | 356 (37.8%) | $48,913 |
| 2 Earners | 394 (41.8%) | $95,481 |
| 3+ Earners | 116 (12.3%) | $84,741 |
| Total | 942 (100.0%) | $72,841 |
Household Income in Chandler
Household Income Brackets in Chandler
With 243 households falling in the category, the $75,000 to $99,999 income range is the most frequent in Chandler, accounting for 16.5% of all households. In contrast, only 22 households (1.5%) fall into the $200,000+ income bracket, making it the least populous group.
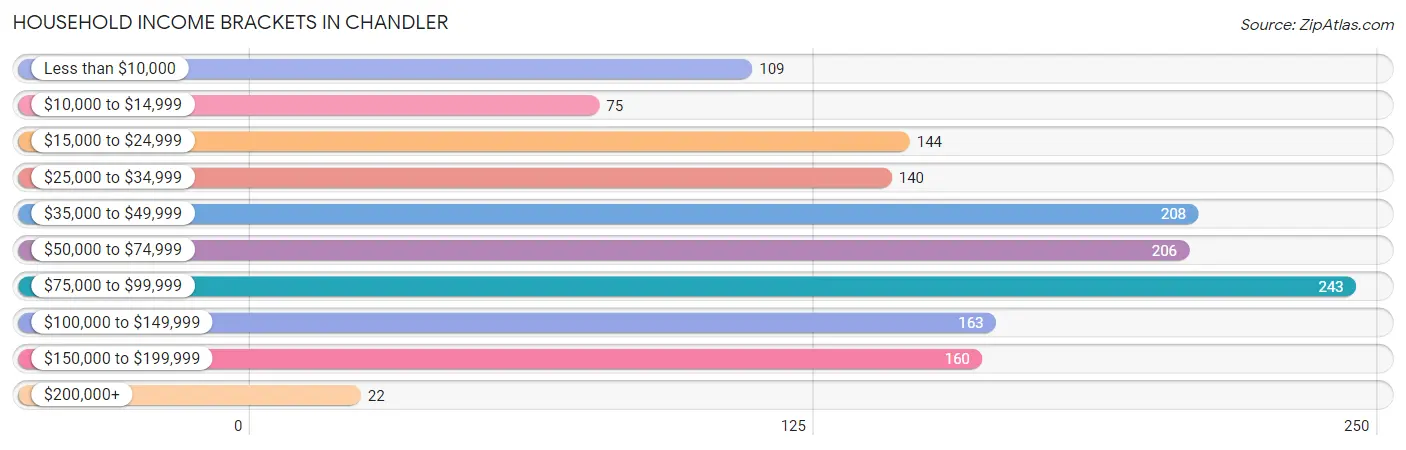
| Income Bracket | # Households | % Households |
| Less than $10,000 | 109 | 7.4% |
| $10,000 to $14,999 | 75 | 5.1% |
| $15,000 to $24,999 | 144 | 9.8% |
| $25,000 to $34,999 | 140 | 9.5% |
| $35,000 to $49,999 | 208 | 14.1% |
| $50,000 to $74,999 | 206 | 14.0% |
| $75,000 to $99,999 | 243 | 16.5% |
| $100,000 to $149,999 | 163 | 11.1% |
| $150,000 to $199,999 | 160 | 10.9% |
| $200,000+ | 22 | 1.5% |
Household Income by Householder Age in Chandler
The median household income in Chandler is $63,500, with the highest median household income of $67,250 found in the 25 to 44 years age bracket for the primary householder. A total of 634 households (43.1%) fall into this category. Meanwhile, the 15 to 24 years age bracket for the primary householder has the lowest median household income of $0, with 60 households (4.1%) in this group.
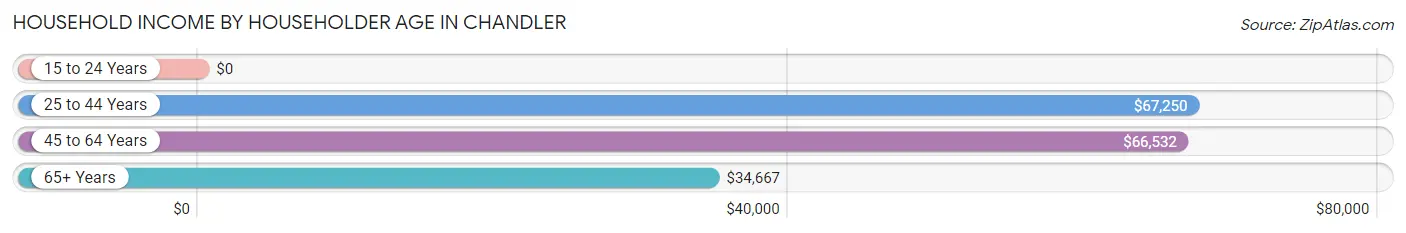
| Income Bracket | # Households | Median Income |
| 15 to 24 Years | 60 (4.1%) | $0 |
| 25 to 44 Years | 634 (43.1%) | $67,250 |
| 45 to 64 Years | 498 (33.8%) | $66,532 |
| 65+ Years | 280 (19.0%) | $34,667 |
| Total | 1,472 (100.0%) | $63,500 |
Poverty in Chandler
Income Below Poverty by Sex and Age in Chandler
With 20.7% poverty level for males and 12.3% for females among the residents of Chandler, 6 to 11 year old males and under 5 year old females are the most vulnerable to poverty, with 31 males (52.5%) and 68 females (30.2%) in their respective age groups living below the poverty level.
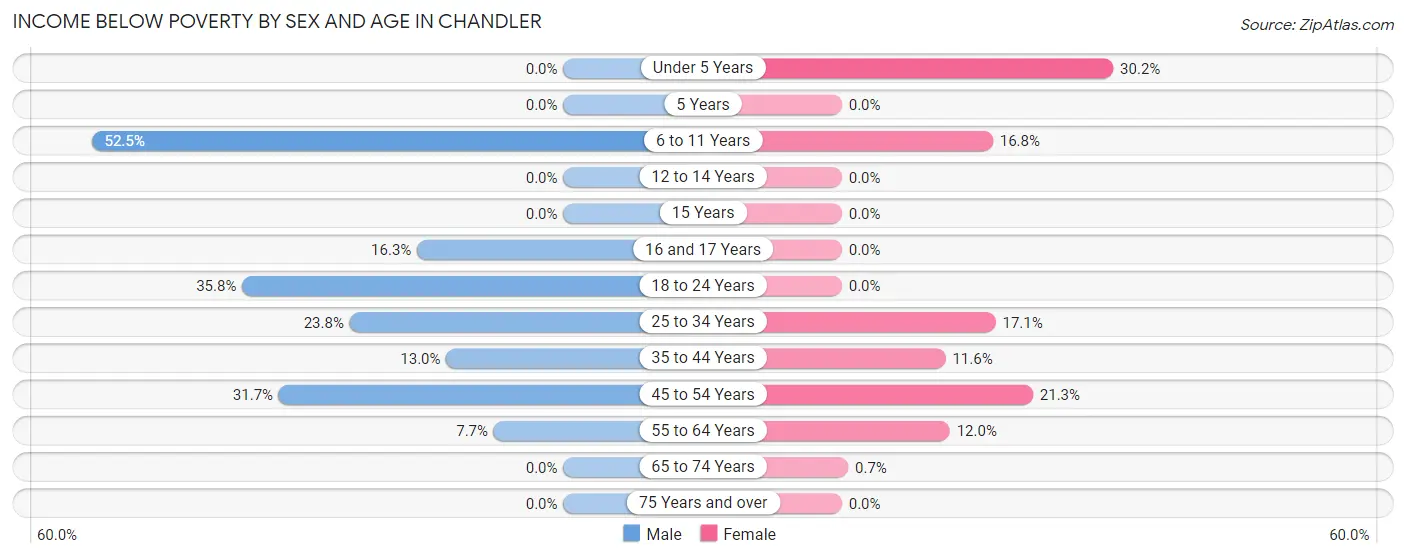
| Age Bracket | Male | Female |
| Under 5 Years | 0 (0.0%) | 68 (30.2%) |
| 5 Years | 0 (0.0%) | 0 (0.0%) |
| 6 to 11 Years | 31 (52.5%) | 18 (16.8%) |
| 12 to 14 Years | 0 (0.0%) | 0 (0.0%) |
| 15 Years | 0 (0.0%) | 0 (0.0%) |
| 16 and 17 Years | 21 (16.3%) | 0 (0.0%) |
| 18 to 24 Years | 113 (35.8%) | 0 (0.0%) |
| 25 to 34 Years | 64 (23.8%) | 38 (17.1%) |
| 35 to 44 Years | 34 (13.0%) | 38 (11.6%) |
| 45 to 54 Years | 96 (31.7%) | 50 (21.3%) |
| 55 to 64 Years | 12 (7.7%) | 25 (12.0%) |
| 65 to 74 Years | 0 (0.0%) | 1 (0.7%) |
| 75 Years and over | 0 (0.0%) | 0 (0.0%) |
| Total | 371 (20.7%) | 238 (12.3%) |
Income Above Poverty by Sex and Age in Chandler
According to the poverty statistics in Chandler, males aged under 5 years and females aged 5 years are the age groups that are most secure financially, with 100.0% of males and 100.0% of females in these age groups living above the poverty line.
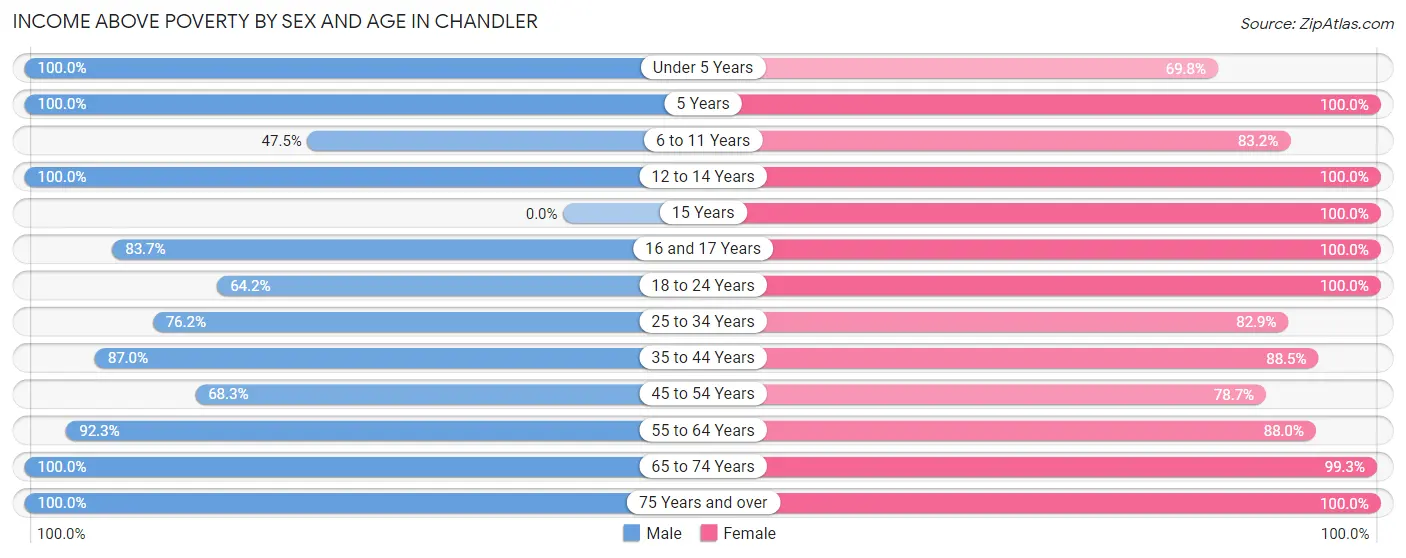
| Age Bracket | Male | Female |
| Under 5 Years | 54 (100.0%) | 157 (69.8%) |
| 5 Years | 45 (100.0%) | 29 (100.0%) |
| 6 to 11 Years | 28 (47.5%) | 89 (83.2%) |
| 12 to 14 Years | 61 (100.0%) | 49 (100.0%) |
| 15 Years | 0 (0.0%) | 25 (100.0%) |
| 16 and 17 Years | 108 (83.7%) | 43 (100.0%) |
| 18 to 24 Years | 203 (64.2%) | 185 (100.0%) |
| 25 to 34 Years | 205 (76.2%) | 184 (82.9%) |
| 35 to 44 Years | 227 (87.0%) | 291 (88.4%) |
| 45 to 54 Years | 207 (68.3%) | 185 (78.7%) |
| 55 to 64 Years | 143 (92.3%) | 183 (88.0%) |
| 65 to 74 Years | 60 (100.0%) | 141 (99.3%) |
| 75 Years and over | 76 (100.0%) | 139 (100.0%) |
| Total | 1,417 (79.2%) | 1,700 (87.7%) |
Income Below Poverty Among Married-Couple Families in Chandler
The poverty statistics for married-couple families in Chandler show that 2.4% or 16 of the total 681 families live below the poverty line. Families with 3 or 4 children have the highest poverty rate of 23.5%, comprising of 16 families. On the other hand, families with no children have the lowest poverty rate of 0.0%, which includes 0 families.
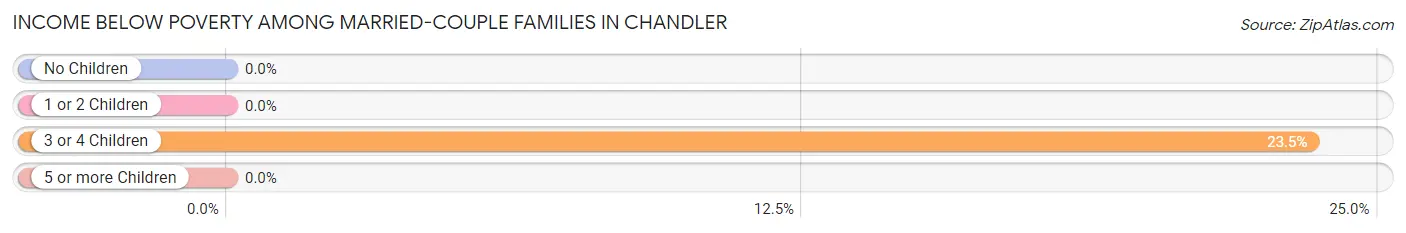
| Children | Above Poverty | Below Poverty |
| No Children | 322 (100.0%) | 0 (0.0%) |
| 1 or 2 Children | 291 (100.0%) | 0 (0.0%) |
| 3 or 4 Children | 52 (76.5%) | 16 (23.5%) |
| 5 or more Children | 0 (0.0%) | 0 (0.0%) |
| Total | 665 (97.7%) | 16 (2.4%) |
Income Below Poverty Among Single-Parent Households in Chandler
According to the poverty data in Chandler, 55.9% or 76 single-father households and 39.2% or 49 single-mother households are living below the poverty line. Among single-father households, those with no children have the highest poverty rate, with 76 households (76.0%) experiencing poverty. Likewise, among single-mother households, those with 1 or 2 children have the highest poverty rate, with 49 households (62.0%) falling below the poverty line.

| Children | Single Father | Single Mother |
| No Children | 76 (76.0%) | 0 (0.0%) |
| 1 or 2 Children | 0 (0.0%) | 49 (62.0%) |
| 3 or 4 Children | 0 (0.0%) | 0 (0.0%) |
| 5 or more Children | 0 (0.0%) | 0 (0.0%) |
| Total | 76 (55.9%) | 49 (39.2%) |
Income Below Poverty Among Married-Couple vs Single-Parent Households in Chandler
The poverty data for Chandler shows that 16 of the married-couple family households (2.4%) and 125 of the single-parent households (47.9%) are living below the poverty level. Within the married-couple family households, those with 3 or 4 children have the highest poverty rate, with 16 households (23.5%) falling below the poverty line. Among the single-parent households, those with no children have the highest poverty rate, with 76 household (55.9%) living below poverty.
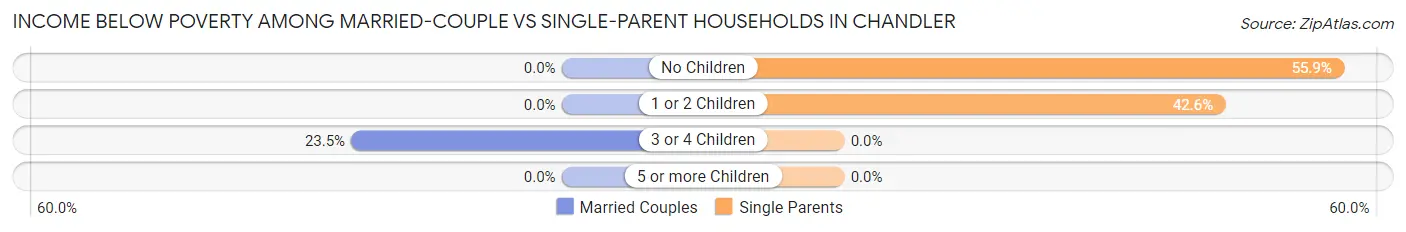
| Children | Married-Couple Families | Single-Parent Households |
| No Children | 0 (0.0%) | 76 (55.9%) |
| 1 or 2 Children | 0 (0.0%) | 49 (42.6%) |
| 3 or 4 Children | 16 (23.5%) | 0 (0.0%) |
| 5 or more Children | 0 (0.0%) | 0 (0.0%) |
| Total | 16 (2.4%) | 125 (47.9%) |
Race in Chandler
The most populous races in Chandler are White / Caucasian (3,602 | 96.7%), Two or more Races (117 | 3.1%), and Hispanic or Latino (50 | 1.3%).
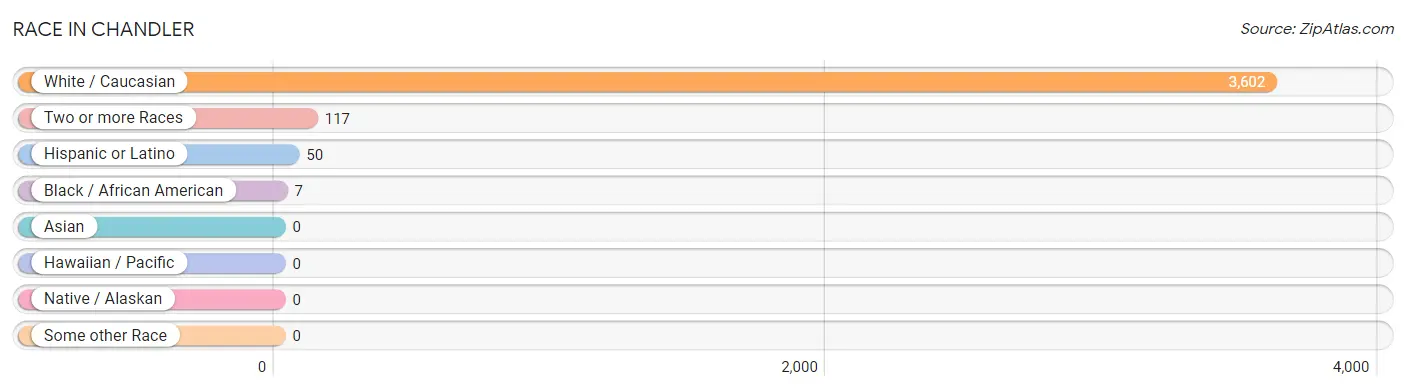
| Race | # Population | % Population |
| Asian | 0 | 0.0% |
| Black / African American | 7 | 0.2% |
| Hawaiian / Pacific | 0 | 0.0% |
| Hispanic or Latino | 50 | 1.3% |
| Native / Alaskan | 0 | 0.0% |
| White / Caucasian | 3,602 | 96.7% |
| Two or more Races | 117 | 3.1% |
| Some other Race | 0 | 0.0% |
| Total | 3,726 | 100.0% |
Ancestry in Chandler
The most populous ancestries reported in Chandler are German (638 | 17.1%), Irish (494 | 13.3%), English (423 | 11.4%), American (249 | 6.7%), and French (195 | 5.2%), together accounting for 53.6% of all Chandler residents.
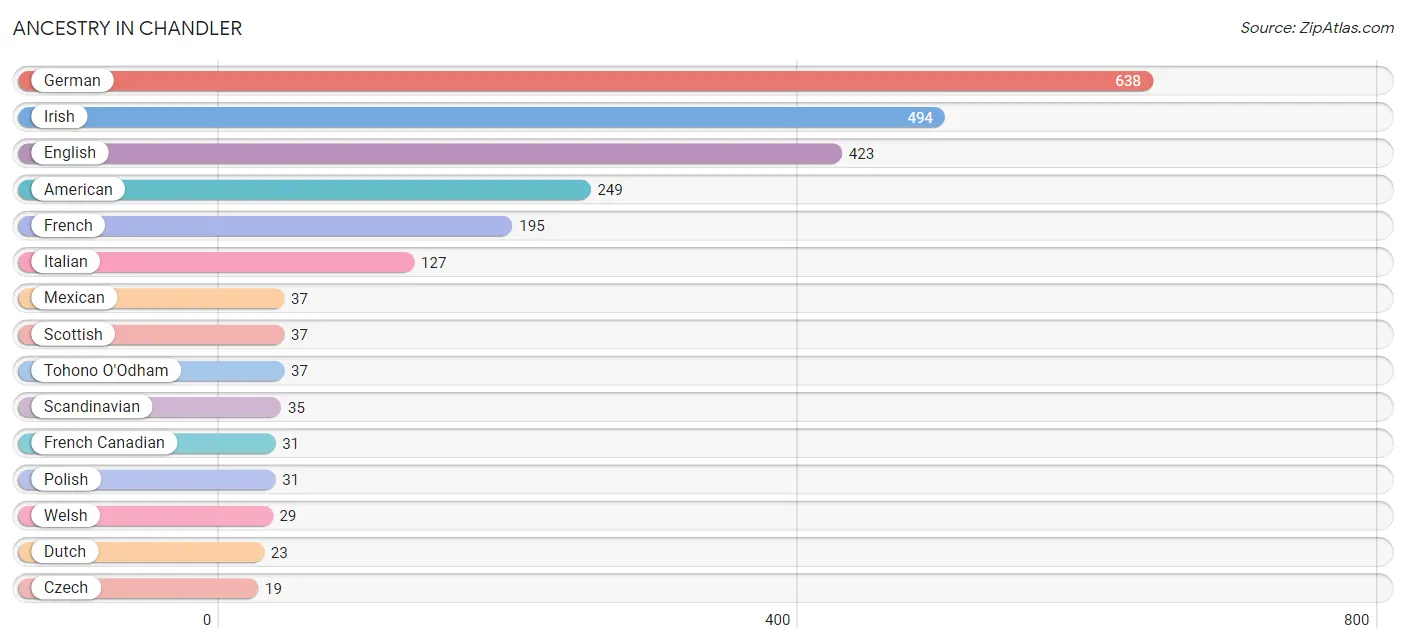
| Ancestry | # Population | % Population |
| American | 249 | 6.7% |
| British | 14 | 0.4% |
| Central American Indian | 13 | 0.4% |
| Cherokee | 2 | 0.1% |
| Czech | 19 | 0.5% |
| Dutch | 23 | 0.6% |
| English | 423 | 11.4% |
| European | 11 | 0.3% |
| French | 195 | 5.2% |
| French Canadian | 31 | 0.8% |
| German | 638 | 17.1% |
| Irish | 494 | 13.3% |
| Italian | 127 | 3.4% |
| Mexican | 37 | 1.0% |
| Polish | 31 | 0.8% |
| Puerto Rican | 13 | 0.4% |
| Scandinavian | 35 | 0.9% |
| Scottish | 37 | 1.0% |
| Tohono O'Odham | 37 | 1.0% |
| Welsh | 29 | 0.8% | View All 20 Rows |
Immigrants in Chandler

| Immigration Origin | # Population | % Population | View All 0 Rows |
Sex and Age in Chandler
Sex and Age in Chandler
The most populous age groups in Chandler are 20 to 24 Years (295 | 16.5%) for men and 40 to 44 Years (227 | 11.7%) for women.
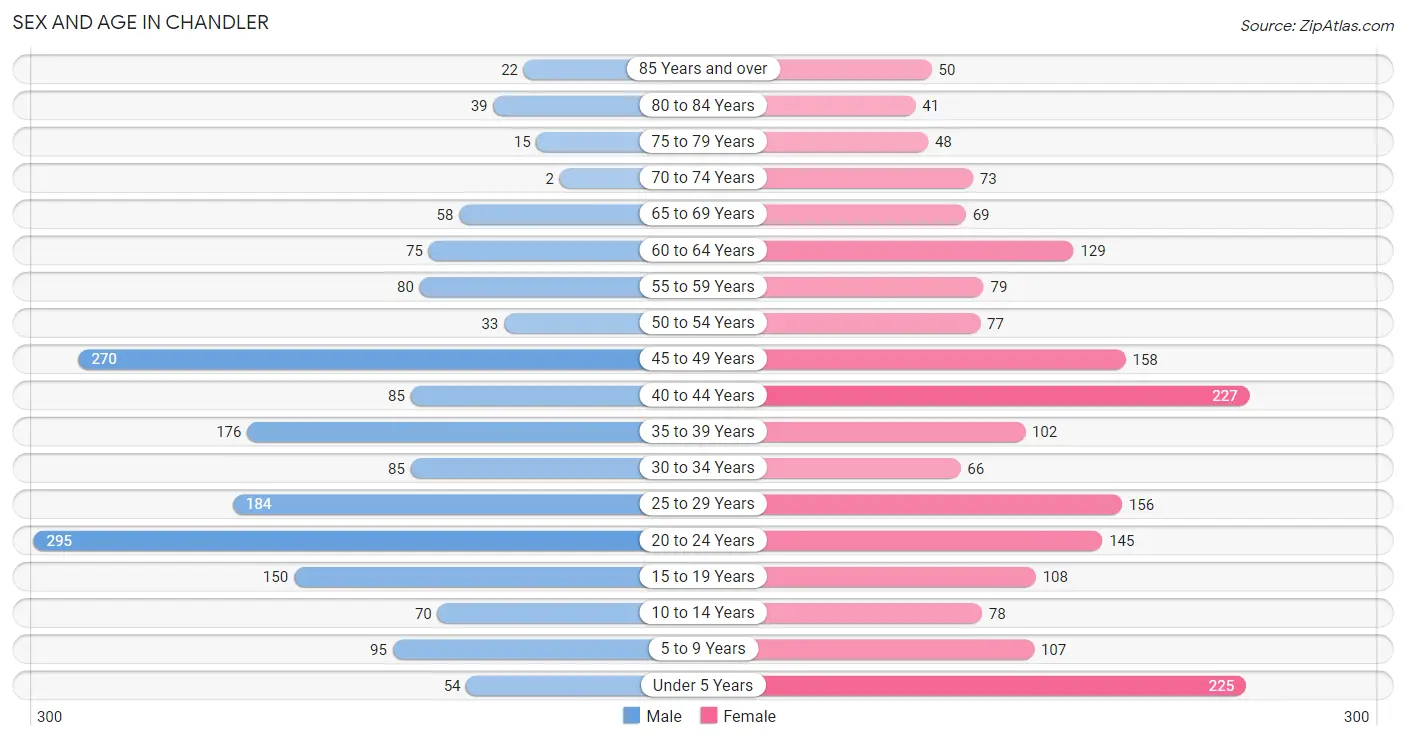
| Age Bracket | Male | Female |
| Under 5 Years | 54 (3.0%) | 225 (11.6%) |
| 5 to 9 Years | 95 (5.3%) | 107 (5.5%) |
| 10 to 14 Years | 70 (3.9%) | 78 (4.0%) |
| 15 to 19 Years | 150 (8.4%) | 108 (5.6%) |
| 20 to 24 Years | 295 (16.5%) | 145 (7.5%) |
| 25 to 29 Years | 184 (10.3%) | 156 (8.1%) |
| 30 to 34 Years | 85 (4.8%) | 66 (3.4%) |
| 35 to 39 Years | 176 (9.8%) | 102 (5.3%) |
| 40 to 44 Years | 85 (4.8%) | 227 (11.7%) |
| 45 to 49 Years | 270 (15.1%) | 158 (8.2%) |
| 50 to 54 Years | 33 (1.8%) | 77 (4.0%) |
| 55 to 59 Years | 80 (4.5%) | 79 (4.1%) |
| 60 to 64 Years | 75 (4.2%) | 129 (6.7%) |
| 65 to 69 Years | 58 (3.2%) | 69 (3.6%) |
| 70 to 74 Years | 2 (0.1%) | 73 (3.8%) |
| 75 to 79 Years | 15 (0.8%) | 48 (2.5%) |
| 80 to 84 Years | 39 (2.2%) | 41 (2.1%) |
| 85 Years and over | 22 (1.2%) | 50 (2.6%) |
| Total | 1,788 (100.0%) | 1,938 (100.0%) |
Families and Households in Chandler
Median Family Size in Chandler
The median family size in Chandler is 3.05 persons per family, with single female/mother families (125 | 13.3%) accounting for the largest median family size of 3.17 persons per family. On the other hand, single male/father families (136 | 14.4%) represent the smallest median family size with 2.88 persons per family.
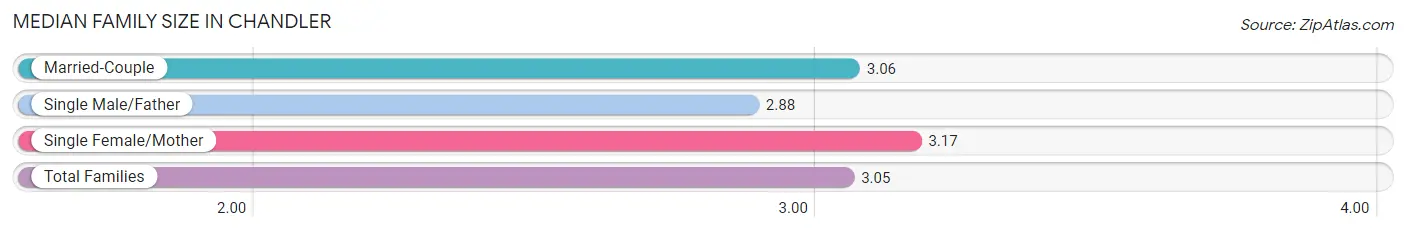
| Family Type | # Families | Family Size |
| Married-Couple | 681 (72.3%) | 3.06 |
| Single Male/Father | 136 (14.4%) | 2.88 |
| Single Female/Mother | 125 (13.3%) | 3.17 |
| Total Families | 942 (100.0%) | 3.05 |
Median Household Size in Chandler
The median household size in Chandler is 2.53 persons per household, with single female/mother households (125 | 8.5%) accounting for the largest median household size of 3.58 persons per household. non-family households (530 | 36.0%) represent the smallest median household size with 1.42 persons per household.
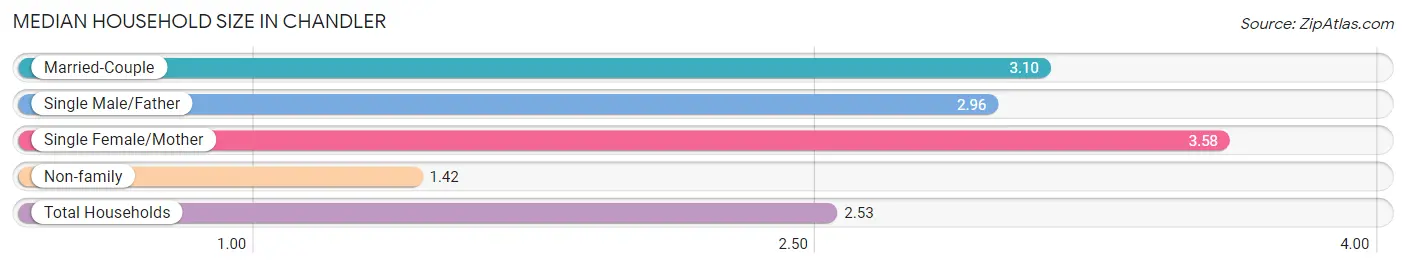
| Household Type | # Households | Household Size |
| Married-Couple | 681 (46.3%) | 3.10 |
| Single Male/Father | 136 (9.2%) | 2.96 |
| Single Female/Mother | 125 (8.5%) | 3.58 |
| Non-family | 530 (36.0%) | 1.42 |
| Total Households | 1,472 (100.0%) | 2.53 |
Household Size by Marriage Status in Chandler
Out of a total of 1,472 households in Chandler, 942 (64.0%) are family households, while 530 (36.0%) are nonfamily households. The most numerous type of family households are 2-person households, comprising 371, and the most common type of nonfamily households are 1-person households, comprising 374.
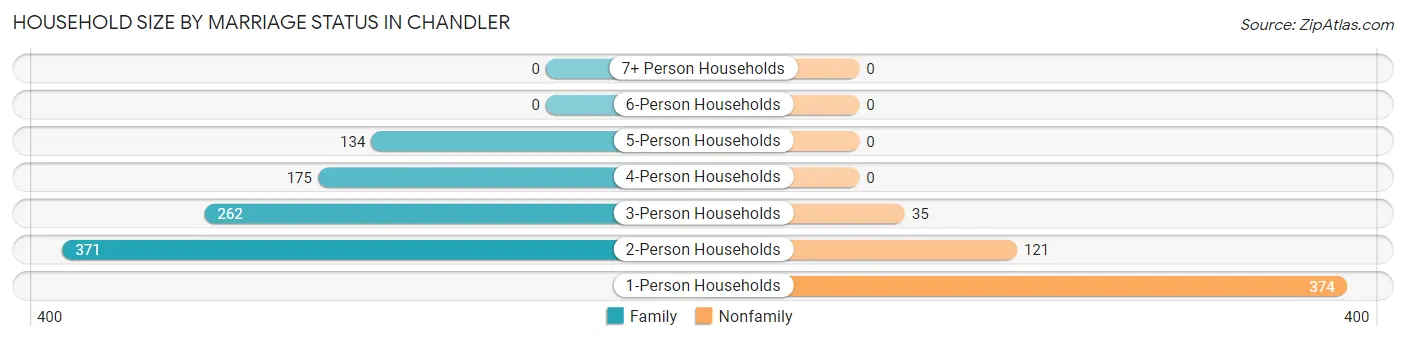
| Household Size | Family Households | Nonfamily Households |
| 1-Person Households | - | 374 (25.4%) |
| 2-Person Households | 371 (25.2%) | 121 (8.2%) |
| 3-Person Households | 262 (17.8%) | 35 (2.4%) |
| 4-Person Households | 175 (11.9%) | 0 (0.0%) |
| 5-Person Households | 134 (9.1%) | 0 (0.0%) |
| 6-Person Households | 0 (0.0%) | 0 (0.0%) |
| 7+ Person Households | 0 (0.0%) | 0 (0.0%) |
| Total | 942 (64.0%) | 530 (36.0%) |
Female Fertility in Chandler
Fertility by Age in Chandler
Average fertility rate in Chandler is 34.0 births per 1,000 women. Women in the age bracket of 20 to 34 years have the highest fertility rate with 60.0 births per 1,000 women. Women in the age bracket of 20 to 34 years acount for 64.7% of all women with births.
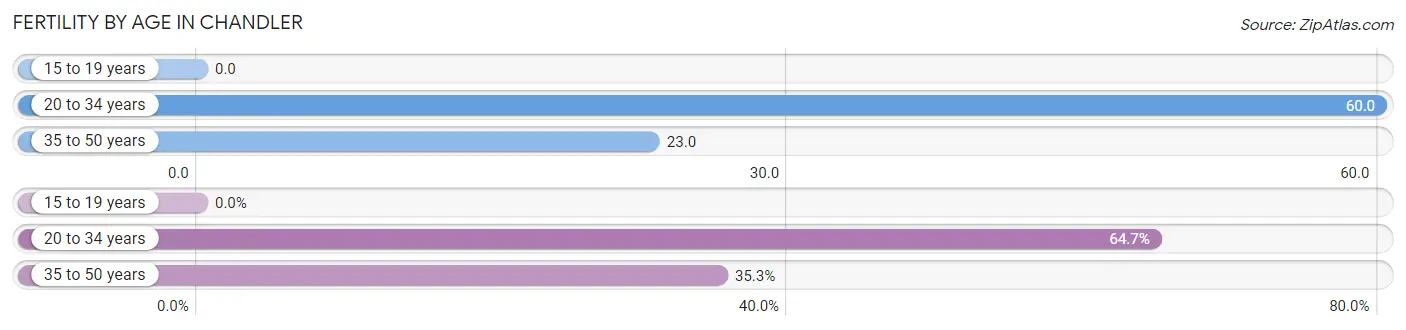
| Age Bracket | Women with Births | Births / 1,000 Women |
| 15 to 19 years | 0 (0.0%) | 0.0 |
| 20 to 34 years | 22 (64.7%) | 60.0 |
| 35 to 50 years | 12 (35.3%) | 23.0 |
| Total | 34 (100.0%) | 34.0 |
Fertility by Age by Marriage Status in Chandler
64.7% of women with births (34) in Chandler are married. The highest percentage of unmarried women with births falls into 35 to 50 years age bracket with 100.0% of them unmarried at the time of birth, while the lowest percentage of unmarried women with births belong to 20 to 34 years age bracket with 0.0% of them unmarried.
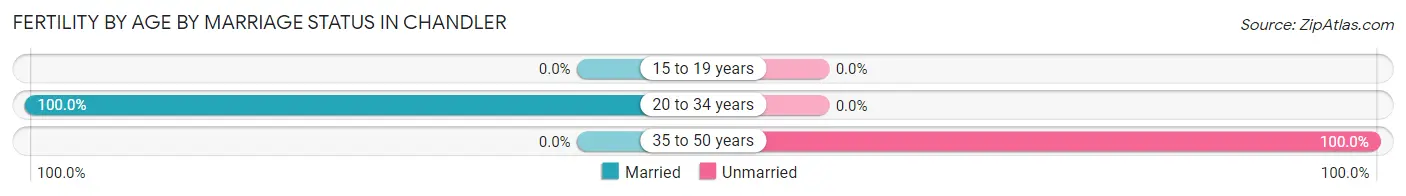
| Age Bracket | Married | Unmarried |
| 15 to 19 years | 0 (0.0%) | 0 (0.0%) |
| 20 to 34 years | 22 (100.0%) | 0 (0.0%) |
| 35 to 50 years | 0 (0.0%) | 12 (100.0%) |
| Total | 22 (64.7%) | 12 (35.3%) |
Fertility by Education in Chandler
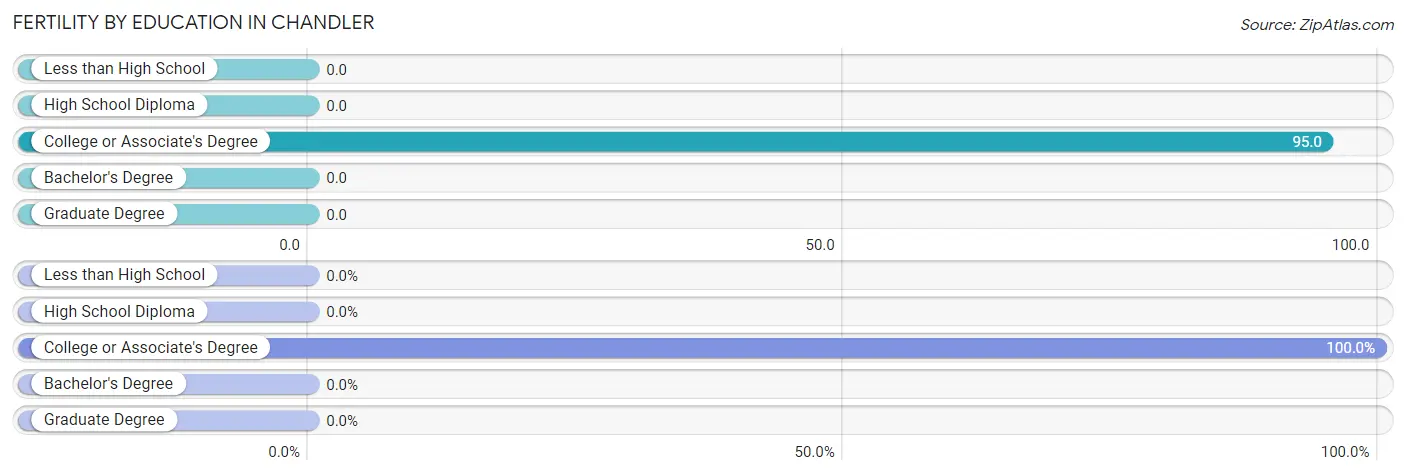
| Educational Attainment | Women with Births | Births / 1,000 Women |
| Less than High School | 0 (0.0%) | 0.0 |
| High School Diploma | 0 (0.0%) | 0.0 |
| College or Associate's Degree | 34 (100.0%) | 95.0 |
| Bachelor's Degree | 0 (0.0%) | 0.0 |
| Graduate Degree | 0 (0.0%) | 0.0 |
| Total | 34 (100.0%) | 34.0 |
Fertility by Education by Marriage Status in Chandler
35.3% of women with births in Chandler are unmarried. Women with the educational attainment of college or associate's degree are most likely to be married with 64.7% of them married at childbirth, while women with the educational attainment of college or associate's degree are least likely to be married with 35.3% of them unmarried at childbirth.
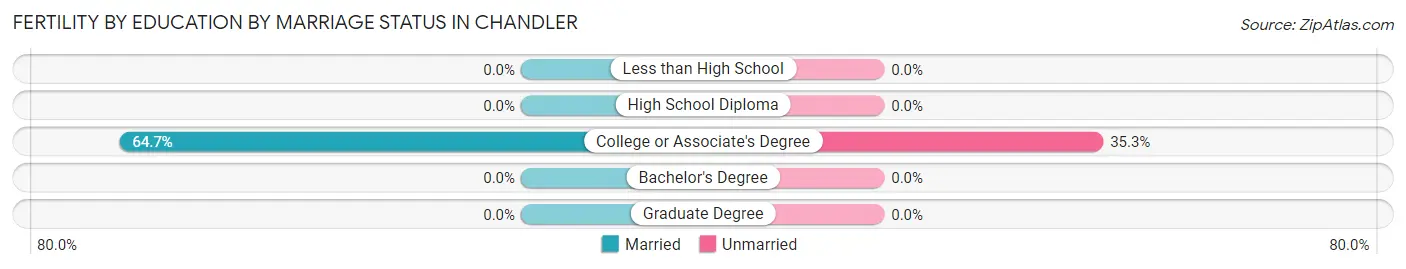
| Educational Attainment | Married | Unmarried |
| Less than High School | 0 (0.0%) | 0 (0.0%) |
| High School Diploma | 0 (0.0%) | 0 (0.0%) |
| College or Associate's Degree | 22 (64.7%) | 12 (35.3%) |
| Bachelor's Degree | 0 (0.0%) | 0 (0.0%) |
| Graduate Degree | 0 (0.0%) | 0 (0.0%) |
| Total | 22 (64.7%) | 12 (35.3%) |
Employment Characteristics in Chandler
Employment by Class of Employer in Chandler
Among the 1,820 employed individuals in Chandler, private company employees (1,290 | 70.9%), local government employees (202 | 11.1%), and not-for-profit organizations (185 | 10.2%) make up the most common classes of employment.
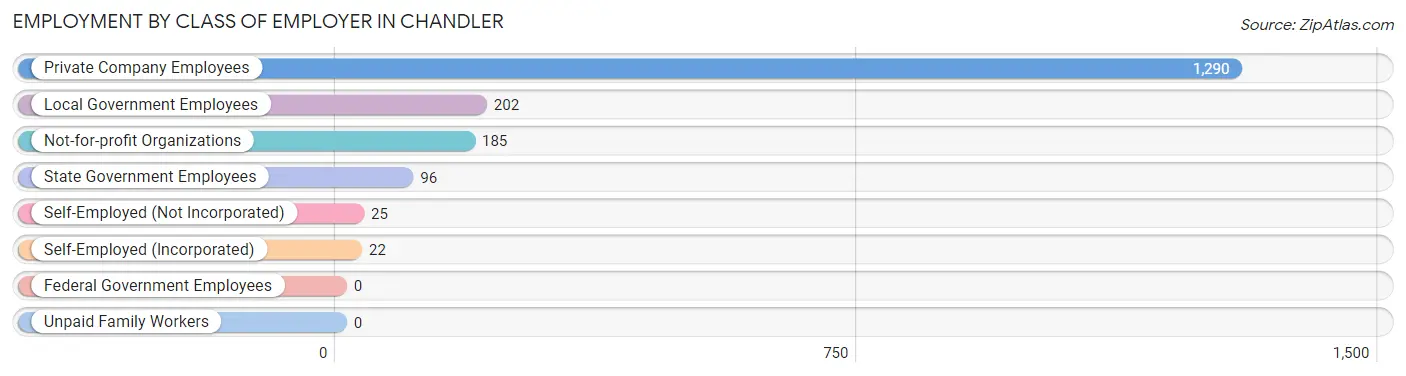
| Employer Class | # Employees | % Employees |
| Private Company Employees | 1,290 | 70.9% |
| Self-Employed (Incorporated) | 22 | 1.2% |
| Self-Employed (Not Incorporated) | 25 | 1.4% |
| Not-for-profit Organizations | 185 | 10.2% |
| Local Government Employees | 202 | 11.1% |
| State Government Employees | 96 | 5.3% |
| Federal Government Employees | 0 | 0.0% |
| Unpaid Family Workers | 0 | 0.0% |
| Total | 1,820 | 100.0% |
Employment Status by Age in Chandler
According to the labor force statistics for Chandler, out of the total population over 16 years of age (3,072), 66.8% or 2,052 individuals are in the labor force, with 9.8% or 201 of them unemployed. The age group with the highest labor force participation rate is 35 to 44 years, with 89.8% or 530 individuals in the labor force. Within the labor force, the 20 to 24 years age range has the highest percentage of unemployed individuals, with 31.8% or 115 of them being unemployed.
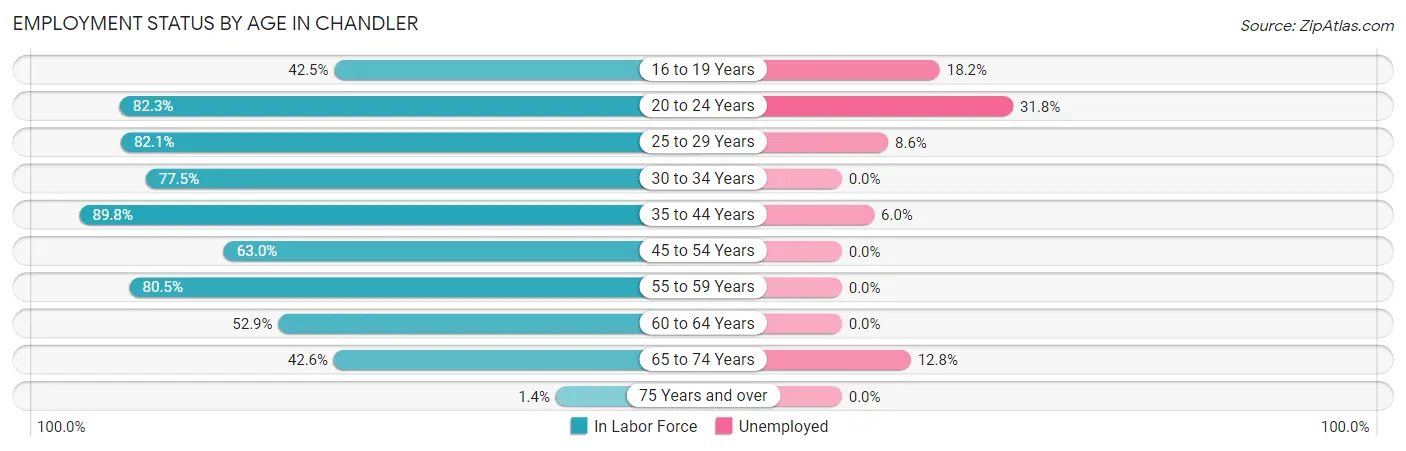
| Age Bracket | In Labor Force | Unemployed |
| 16 to 19 Years | 99 (42.5%) | 18 (18.2%) |
| 20 to 24 Years | 362 (82.3%) | 115 (31.8%) |
| 25 to 29 Years | 279 (82.1%) | 24 (8.6%) |
| 30 to 34 Years | 117 (77.5%) | 0 (0.0%) |
| 35 to 44 Years | 530 (89.8%) | 32 (6.0%) |
| 45 to 54 Years | 339 (63.0%) | 0 (0.0%) |
| 55 to 59 Years | 128 (80.5%) | 0 (0.0%) |
| 60 to 64 Years | 108 (52.9%) | 0 (0.0%) |
| 65 to 74 Years | 86 (42.6%) | 11 (12.8%) |
| 75 Years and over | 3 (1.4%) | 0 (0.0%) |
| Total | 2,052 (66.8%) | 201 (9.8%) |
Employment Status by Educational Attainment in Chandler
According to labor force statistics for Chandler, 75.7% of individuals (1,500) out of the total population between 25 and 64 years of age (1,982) are in the labor force, with 3.7% or 56 of them being unemployed. The group with the highest labor force participation rate are those with the educational attainment of bachelor's degree or higher, with 92.4% or 375 individuals in the labor force. Within the labor force, individuals with high school diploma education have the highest percentage of unemployment, with 5.9% or 37 of them being unemployed.
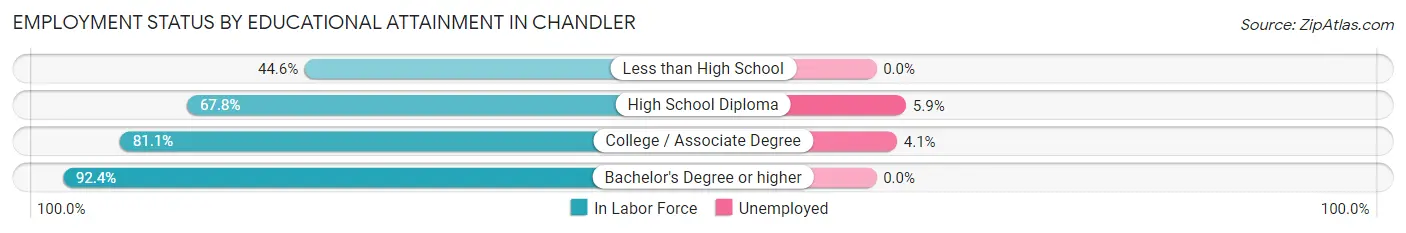
| Educational Attainment | In Labor Force | Unemployed |
| Less than High School | 37 (44.6%) | 0 (0.0%) |
| High School Diploma | 622 (67.8%) | 54 (5.9%) |
| College / Associate Degree | 467 (81.1%) | 24 (4.1%) |
| Bachelor's Degree or higher | 375 (92.4%) | 0 (0.0%) |
| Total | 1,500 (75.7%) | 73 (3.7%) |
Employment Occupations by Sex in Chandler
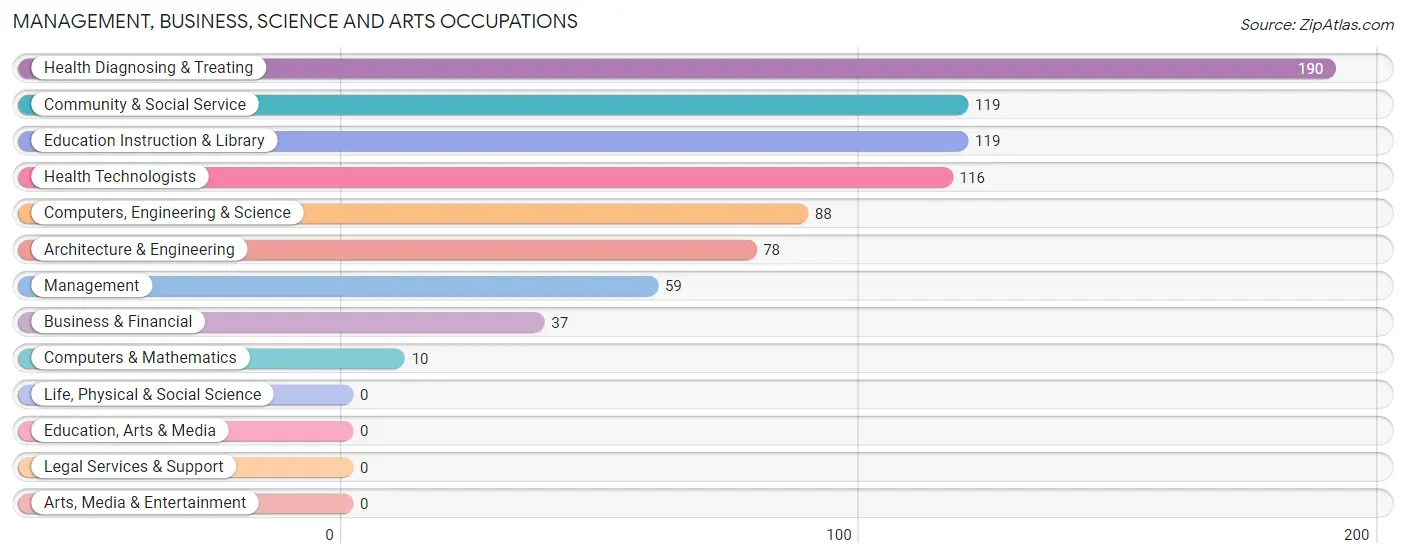
Management, Business, Science and Arts Occupations
The most common Management, Business, Science and Arts occupations in Chandler are Health Diagnosing & Treating (190 | 10.3%), Community & Social Service (119 | 6.4%), Education Instruction & Library (119 | 6.4%), Health Technologists (116 | 6.3%), and Computers, Engineering & Science (88 | 4.8%).
Management, Business, Science and Arts Occupations by Sex
Within the Management, Business, Science and Arts occupations in Chandler, the most male-oriented occupations are Computers, Engineering & Science (100.0%), Computers & Mathematics (100.0%), and Architecture & Engineering (100.0%), while the most female-oriented occupations are Health Diagnosing & Treating (100.0%), Health Technologists (100.0%), and Community & Social Service (79.8%).
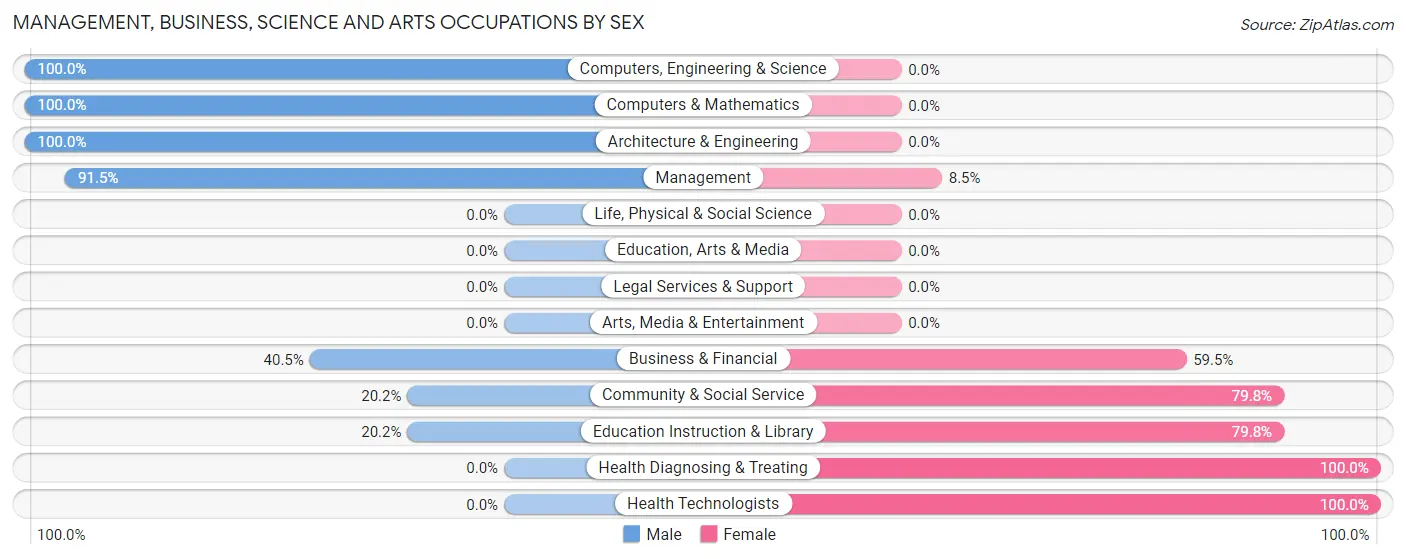
| Occupation | Male | Female |
| Management | 54 (91.5%) | 5 (8.5%) |
| Business & Financial | 15 (40.5%) | 22 (59.5%) |
| Computers, Engineering & Science | 88 (100.0%) | 0 (0.0%) |
| Computers & Mathematics | 10 (100.0%) | 0 (0.0%) |
| Architecture & Engineering | 78 (100.0%) | 0 (0.0%) |
| Life, Physical & Social Science | 0 (0.0%) | 0 (0.0%) |
| Community & Social Service | 24 (20.2%) | 95 (79.8%) |
| Education, Arts & Media | 0 (0.0%) | 0 (0.0%) |
| Legal Services & Support | 0 (0.0%) | 0 (0.0%) |
| Education Instruction & Library | 24 (20.2%) | 95 (79.8%) |
| Arts, Media & Entertainment | 0 (0.0%) | 0 (0.0%) |
| Health Diagnosing & Treating | 0 (0.0%) | 190 (100.0%) |
| Health Technologists | 0 (0.0%) | 116 (100.0%) |
| Total (Category) | 181 (36.7%) | 312 (63.3%) |
| Total (Overall) | 970 (52.4%) | 881 (47.6%) |
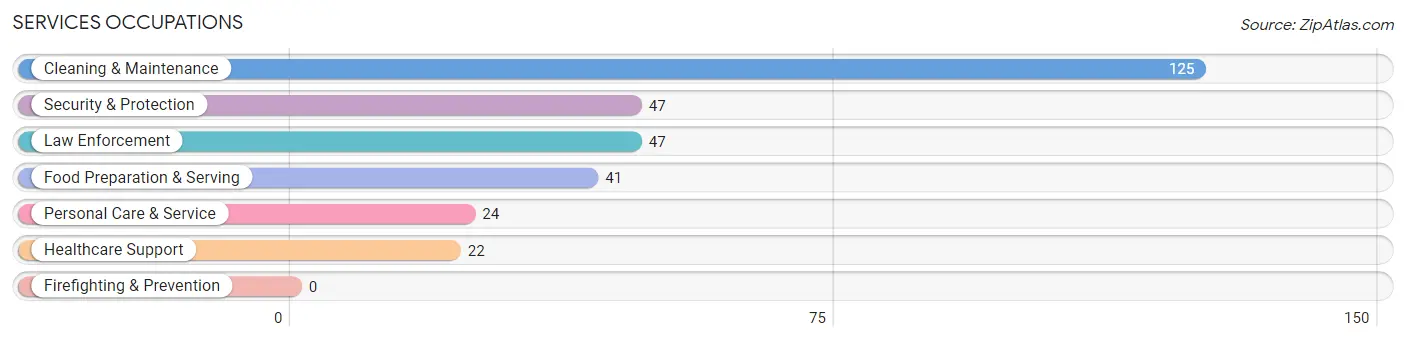
Services Occupations
The most common Services occupations in Chandler are Cleaning & Maintenance (125 | 6.8%), Security & Protection (47 | 2.5%), Law Enforcement (47 | 2.5%), Food Preparation & Serving (41 | 2.2%), and Personal Care & Service (24 | 1.3%).
Services Occupations by Sex
Within the Services occupations in Chandler, the most male-oriented occupations are Security & Protection (100.0%), Law Enforcement (100.0%), and Cleaning & Maintenance (68.0%), while the most female-oriented occupations are Healthcare Support (100.0%), Food Preparation & Serving (100.0%), and Personal Care & Service (100.0%).
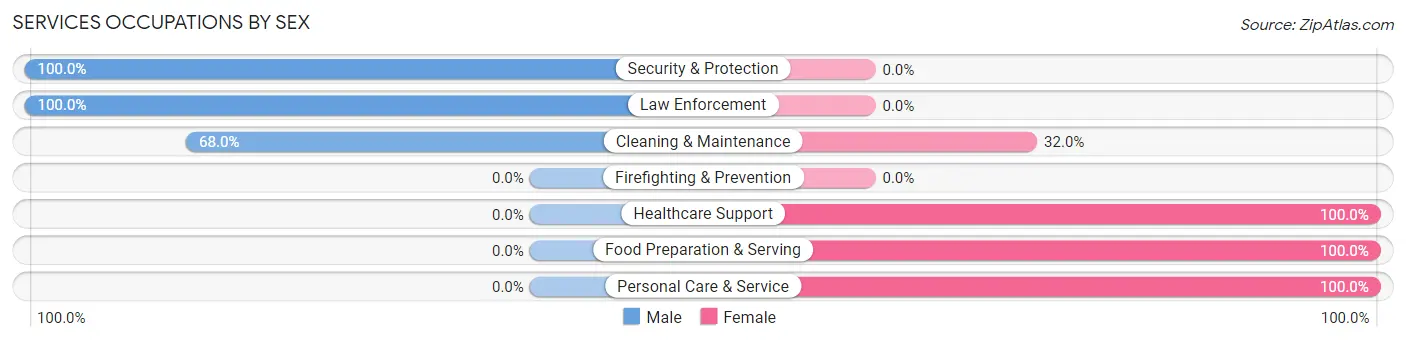
| Occupation | Male | Female |
| Healthcare Support | 0 (0.0%) | 22 (100.0%) |
| Security & Protection | 47 (100.0%) | 0 (0.0%) |
| Firefighting & Prevention | 0 (0.0%) | 0 (0.0%) |
| Law Enforcement | 47 (100.0%) | 0 (0.0%) |
| Food Preparation & Serving | 0 (0.0%) | 41 (100.0%) |
| Cleaning & Maintenance | 85 (68.0%) | 40 (32.0%) |
| Personal Care & Service | 0 (0.0%) | 24 (100.0%) |
| Total (Category) | 132 (51.0%) | 127 (49.0%) |
| Total (Overall) | 970 (52.4%) | 881 (47.6%) |
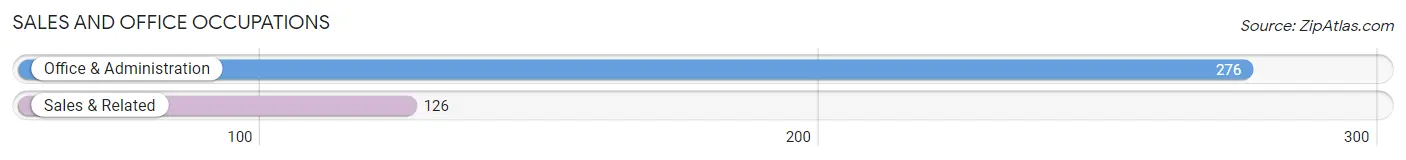
Sales and Office Occupations
The most common Sales and Office occupations in Chandler are Office & Administration (276 | 14.9%), and Sales & Related (126 | 6.8%).
Sales and Office Occupations by Sex
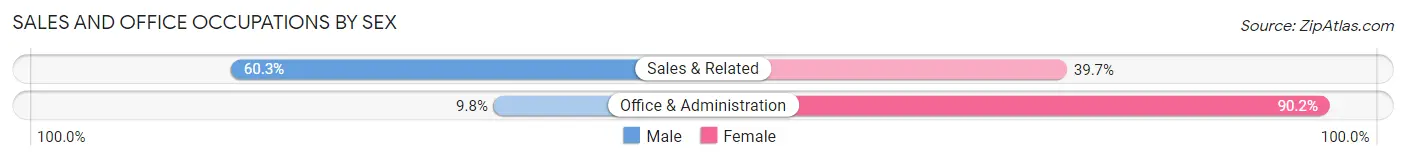
| Occupation | Male | Female |
| Sales & Related | 76 (60.3%) | 50 (39.7%) |
| Office & Administration | 27 (9.8%) | 249 (90.2%) |
| Total (Category) | 103 (25.6%) | 299 (74.4%) |
| Total (Overall) | 970 (52.4%) | 881 (47.6%) |
Natural Resources, Construction and Maintenance Occupations
The most common Natural Resources, Construction and Maintenance occupations in Chandler are Construction & Extraction (117 | 6.3%), Installation, Maintenance & Repair (77 | 4.2%), and Farming, Fishing & Forestry (9 | 0.5%).
Natural Resources, Construction and Maintenance Occupations by Sex
| Occupation | Male | Female |
| Farming, Fishing & Forestry | 9 (100.0%) | 0 (0.0%) |
| Construction & Extraction | 117 (100.0%) | 0 (0.0%) |
| Installation, Maintenance & Repair | 77 (100.0%) | 0 (0.0%) |
| Total (Category) | 203 (100.0%) | 0 (0.0%) |
| Total (Overall) | 970 (52.4%) | 881 (47.6%) |
Production, Transportation and Moving Occupations
The most common Production, Transportation and Moving occupations in Chandler are Production (350 | 18.9%), Material Moving (76 | 4.1%), and Transportation (68 | 3.7%).
Production, Transportation and Moving Occupations by Sex
| Occupation | Male | Female |
| Production | 246 (70.3%) | 104 (29.7%) |
| Transportation | 51 (75.0%) | 17 (25.0%) |
| Material Moving | 54 (71.1%) | 22 (28.9%) |
| Total (Category) | 351 (71.1%) | 143 (28.9%) |
| Total (Overall) | 970 (52.4%) | 881 (47.6%) |
Employment Industries by Sex in Chandler
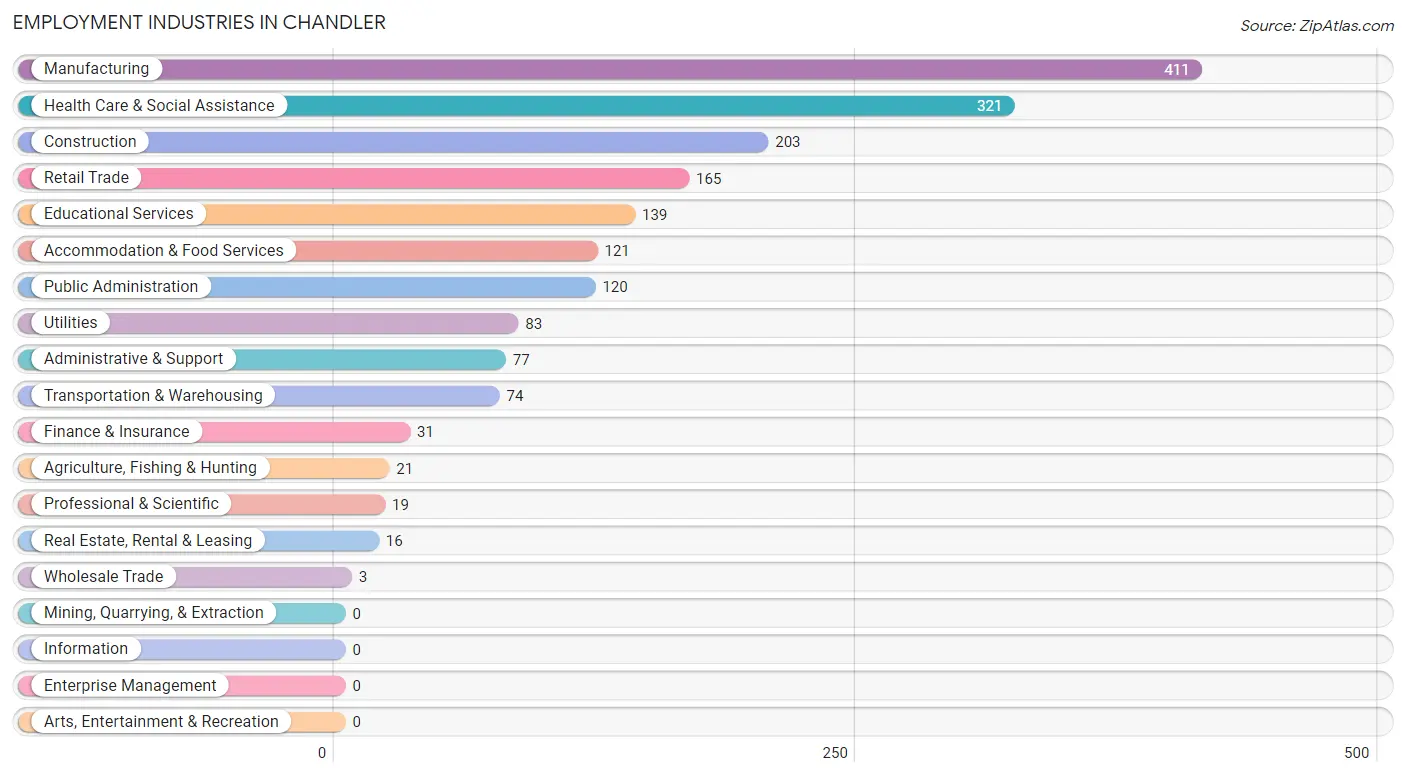
Employment Industries in Chandler
The major employment industries in Chandler include Manufacturing (411 | 22.2%), Health Care & Social Assistance (321 | 17.3%), Construction (203 | 11.0%), Retail Trade (165 | 8.9%), and Educational Services (139 | 7.5%).
Employment Industries by Sex in Chandler
The Chandler industries that see more men than women are Real Estate, Rental & Leasing (100.0%), Utilities (92.8%), and Construction (86.7%), whereas the industries that tend to have a higher number of women are Wholesale Trade (100.0%), Finance & Insurance (100.0%), and Health Care & Social Assistance (95.3%).
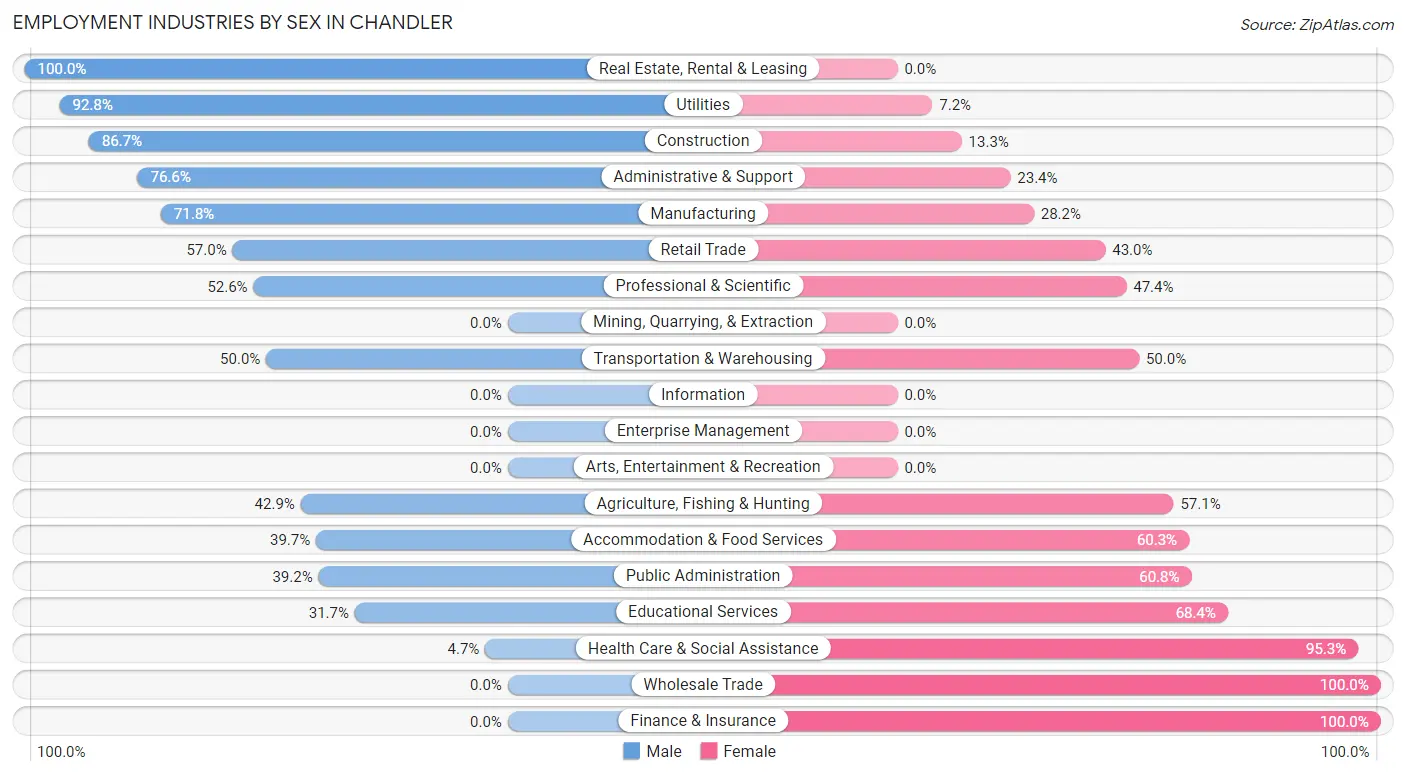
| Industry | Male | Female |
| Agriculture, Fishing & Hunting | 9 (42.9%) | 12 (57.1%) |
| Mining, Quarrying, & Extraction | 0 (0.0%) | 0 (0.0%) |
| Construction | 176 (86.7%) | 27 (13.3%) |
| Manufacturing | 295 (71.8%) | 116 (28.2%) |
| Wholesale Trade | 0 (0.0%) | 3 (100.0%) |
| Retail Trade | 94 (57.0%) | 71 (43.0%) |
| Transportation & Warehousing | 37 (50.0%) | 37 (50.0%) |
| Utilities | 77 (92.8%) | 6 (7.2%) |
| Information | 0 (0.0%) | 0 (0.0%) |
| Finance & Insurance | 0 (0.0%) | 31 (100.0%) |
| Real Estate, Rental & Leasing | 16 (100.0%) | 0 (0.0%) |
| Professional & Scientific | 10 (52.6%) | 9 (47.4%) |
| Enterprise Management | 0 (0.0%) | 0 (0.0%) |
| Administrative & Support | 59 (76.6%) | 18 (23.4%) |
| Educational Services | 44 (31.7%) | 95 (68.3%) |
| Health Care & Social Assistance | 15 (4.7%) | 306 (95.3%) |
| Arts, Entertainment & Recreation | 0 (0.0%) | 0 (0.0%) |
| Accommodation & Food Services | 48 (39.7%) | 73 (60.3%) |
| Public Administration | 47 (39.2%) | 73 (60.8%) |
| Total | 970 (52.4%) | 881 (47.6%) |
Education in Chandler
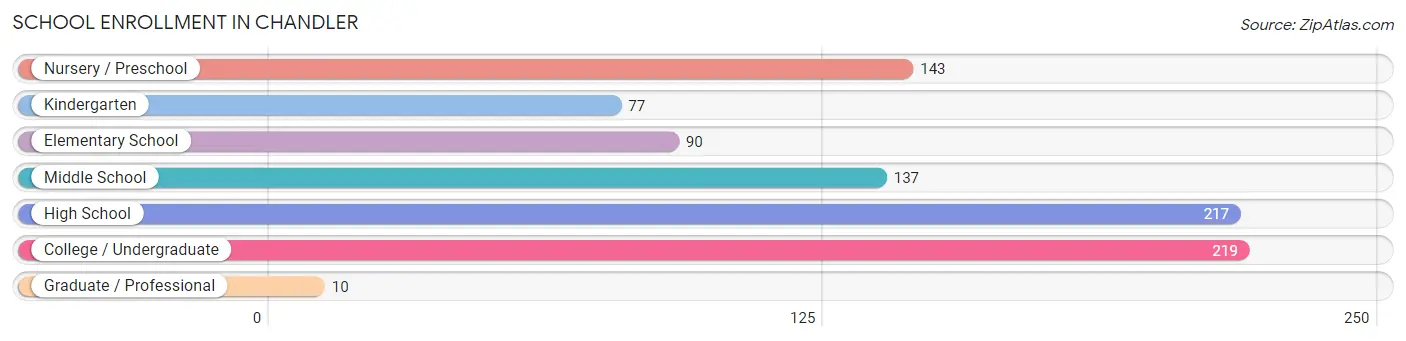
School Enrollment in Chandler
The most common levels of schooling among the 893 students in Chandler are college / undergraduate (219 | 24.5%), high school (217 | 24.3%), and nursery / preschool (143 | 16.0%).
| School Level | # Students | % Students |
| Nursery / Preschool | 143 | 16.0% |
| Kindergarten | 77 | 8.6% |
| Elementary School | 90 | 10.1% |
| Middle School | 137 | 15.3% |
| High School | 217 | 24.3% |
| College / Undergraduate | 219 | 24.5% |
| Graduate / Professional | 10 | 1.1% |
| Total | 893 | 100.0% |
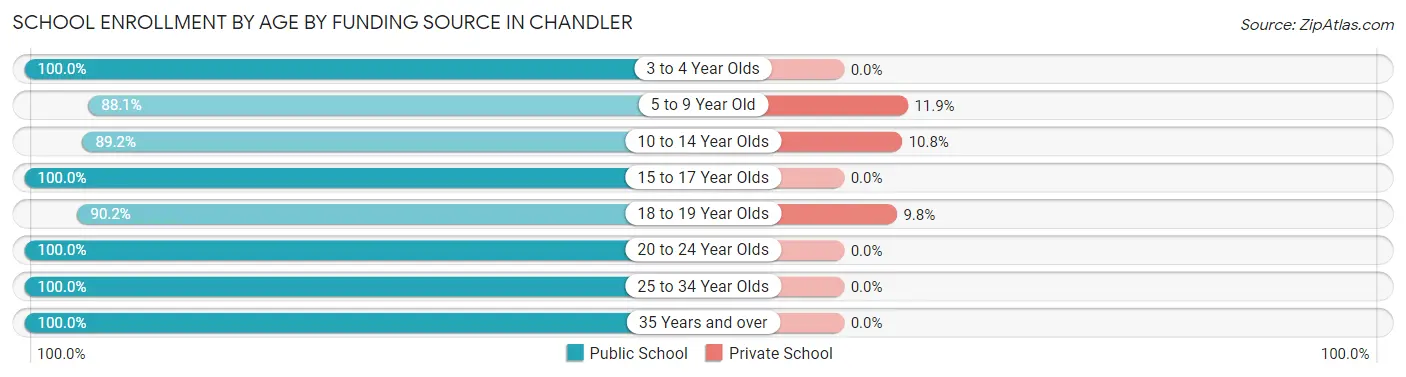
School Enrollment by Age by Funding Source in Chandler
Out of a total of 893 students who are enrolled in schools in Chandler, 46 (5.2%) attend a private institution, while the remaining 847 (94.8%) are enrolled in public schools. The age group of 5 to 9 year old has the highest likelihood of being enrolled in private schools, with 24 (11.9% in the age bracket) enrolled. Conversely, the age group of 3 to 4 year olds has the lowest likelihood of being enrolled in a private school, with 97 (100.0% in the age bracket) attending a public institution.
| Age Bracket | Public School | Private School |
| 3 to 4 Year Olds | 97 (100.0%) | 0 (0.0%) |
| 5 to 9 Year Old | 178 (88.1%) | 24 (11.9%) |
| 10 to 14 Year Olds | 132 (89.2%) | 16 (10.8%) |
| 15 to 17 Year Olds | 197 (100.0%) | 0 (0.0%) |
| 18 to 19 Year Olds | 55 (90.2%) | 6 (9.8%) |
| 20 to 24 Year Olds | 41 (100.0%) | 0 (0.0%) |
| 25 to 34 Year Olds | 21 (100.0%) | 0 (0.0%) |
| 35 Years and over | 126 (100.0%) | 0 (0.0%) |
| Total | 847 (94.8%) | 46 (5.2%) |
Educational Attainment by Field of Study in Chandler
Arts & humanities (106 | 24.3%), business (76 | 17.4%), visual & performing arts (74 | 16.9%), education (64 | 14.6%), and engineering (32 | 7.3%) are the most common fields of study among 437 individuals in Chandler who have obtained a bachelor's degree or higher.
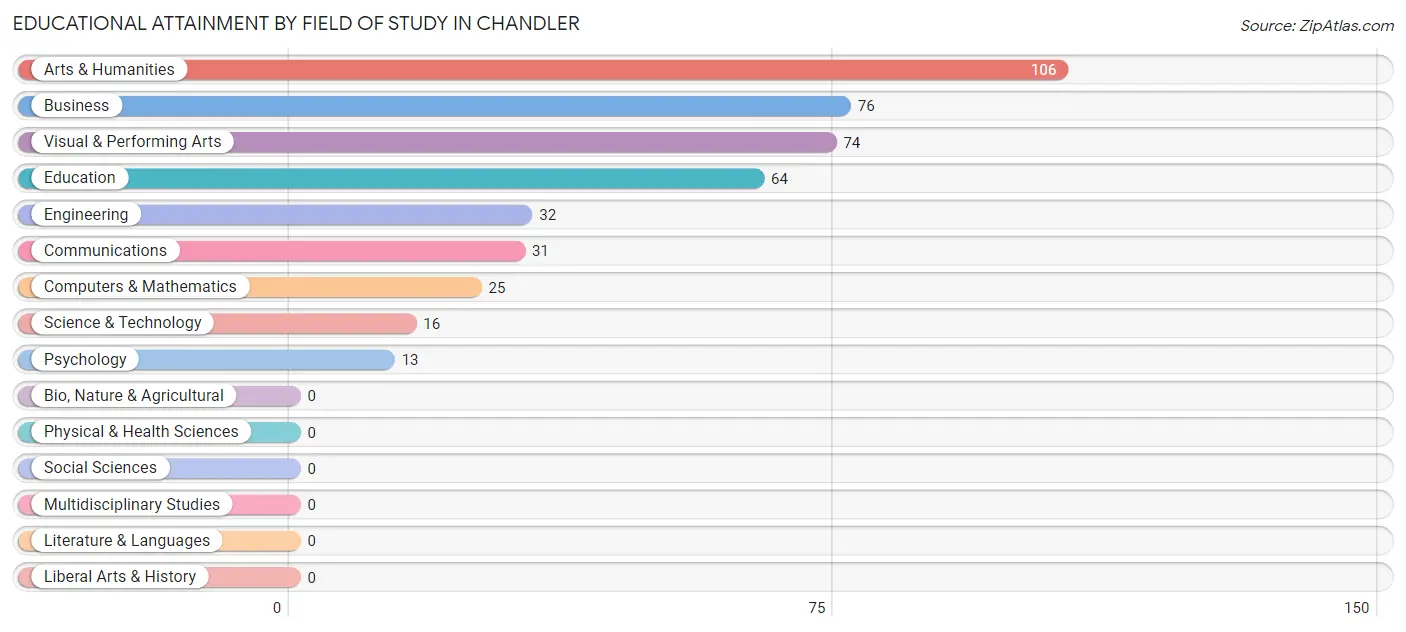
| Field of Study | # Graduates | % Graduates |
| Computers & Mathematics | 25 | 5.7% |
| Bio, Nature & Agricultural | 0 | 0.0% |
| Physical & Health Sciences | 0 | 0.0% |
| Psychology | 13 | 3.0% |
| Social Sciences | 0 | 0.0% |
| Engineering | 32 | 7.3% |
| Multidisciplinary Studies | 0 | 0.0% |
| Science & Technology | 16 | 3.7% |
| Business | 76 | 17.4% |
| Education | 64 | 14.6% |
| Literature & Languages | 0 | 0.0% |
| Liberal Arts & History | 0 | 0.0% |
| Visual & Performing Arts | 74 | 16.9% |
| Communications | 31 | 7.1% |
| Arts & Humanities | 106 | 24.3% |
| Total | 437 | 100.0% |
Transportation & Commute in Chandler
Vehicle Availability by Sex in Chandler
The most prevalent vehicle ownership categories in Chandler are males with 2 vehicles (464, accounting for 47.8%) and females with 2 vehicles (461, making up 54.6%).
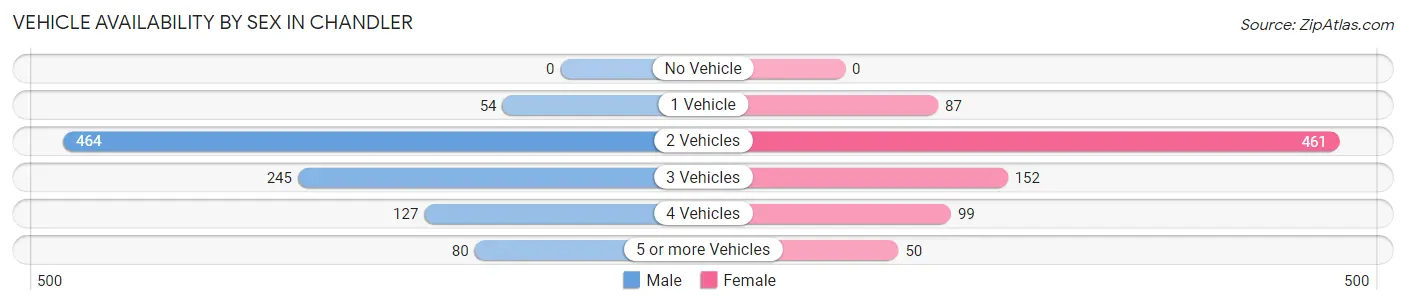
| Vehicles Available | Male | Female |
| No Vehicle | 0 (0.0%) | 0 (0.0%) |
| 1 Vehicle | 54 (5.6%) | 87 (10.2%) |
| 2 Vehicles | 464 (47.8%) | 461 (54.3%) |
| 3 Vehicles | 245 (25.3%) | 152 (17.9%) |
| 4 Vehicles | 127 (13.1%) | 99 (11.7%) |
| 5 or more Vehicles | 80 (8.3%) | 50 (5.9%) |
| Total | 970 (100.0%) | 849 (100.0%) |
Commute Time in Chandler
The most frequently occuring commute durations in Chandler are 15 to 19 minutes (356 commuters, 20.6%), 30 to 34 minutes (344 commuters, 19.9%), and 20 to 24 minutes (281 commuters, 16.3%).
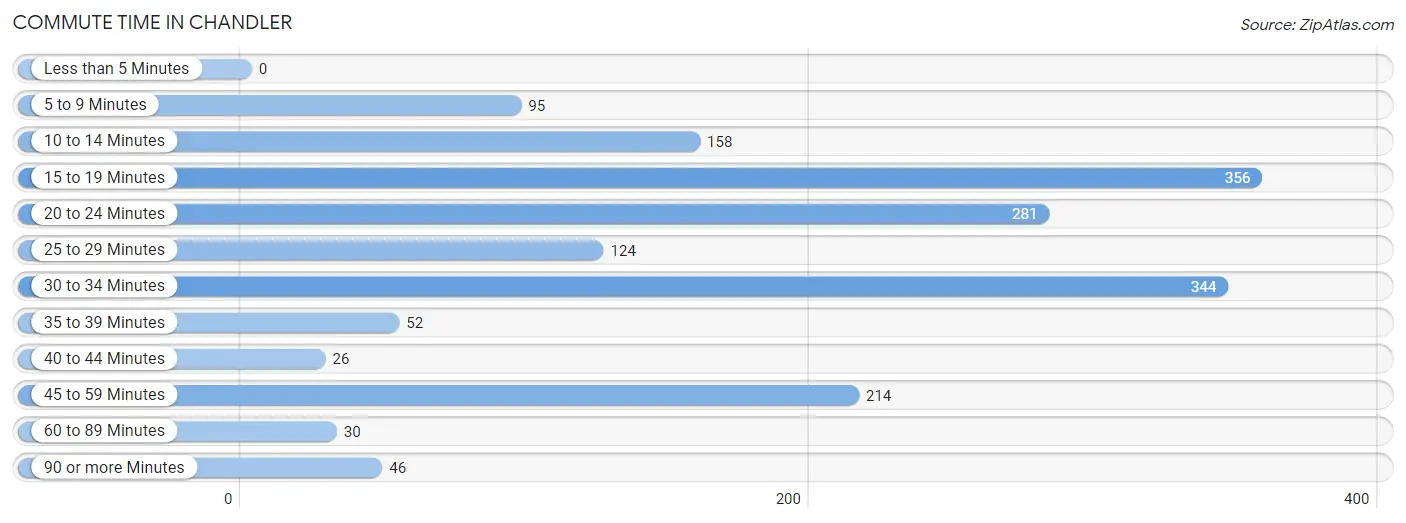
| Commute Time | # Commuters | % Commuters |
| Less than 5 Minutes | 0 | 0.0% |
| 5 to 9 Minutes | 95 | 5.5% |
| 10 to 14 Minutes | 158 | 9.1% |
| 15 to 19 Minutes | 356 | 20.6% |
| 20 to 24 Minutes | 281 | 16.3% |
| 25 to 29 Minutes | 124 | 7.2% |
| 30 to 34 Minutes | 344 | 19.9% |
| 35 to 39 Minutes | 52 | 3.0% |
| 40 to 44 Minutes | 26 | 1.5% |
| 45 to 59 Minutes | 214 | 12.4% |
| 60 to 89 Minutes | 30 | 1.7% |
| 90 or more Minutes | 46 | 2.7% |
Commute Time by Sex in Chandler
The most common commute times in Chandler are 45 to 59 minutes (213 commuters, 22.0%) for males and 15 to 19 minutes (175 commuters, 23.2%) for females.
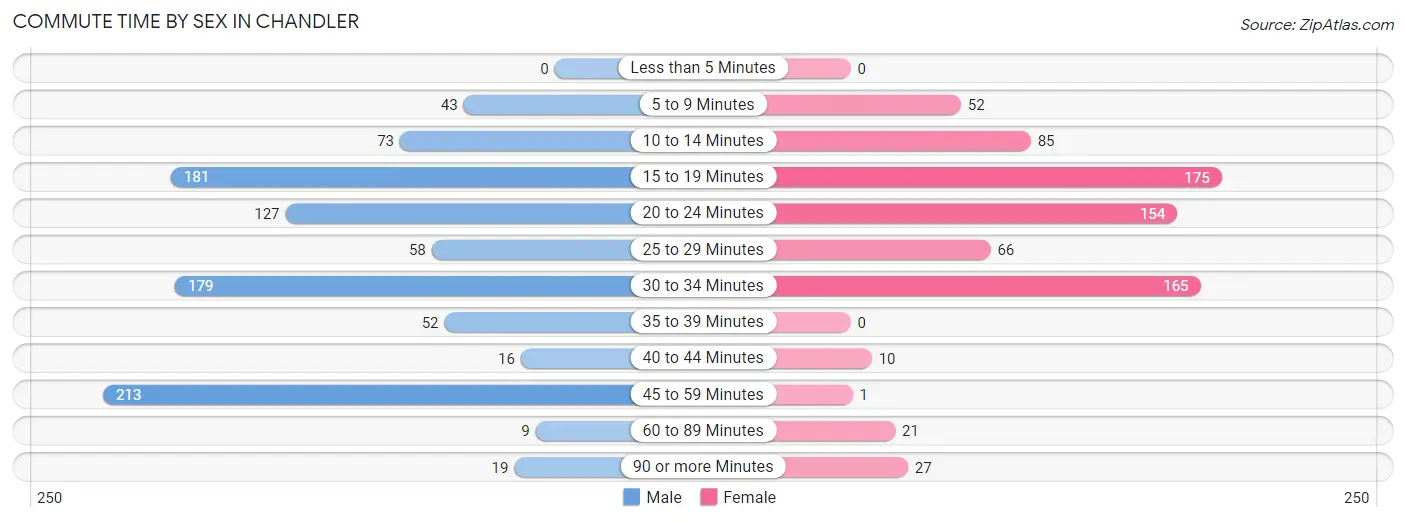
| Commute Time | Male | Female |
| Less than 5 Minutes | 0 (0.0%) | 0 (0.0%) |
| 5 to 9 Minutes | 43 (4.4%) | 52 (6.9%) |
| 10 to 14 Minutes | 73 (7.5%) | 85 (11.2%) |
| 15 to 19 Minutes | 181 (18.7%) | 175 (23.2%) |
| 20 to 24 Minutes | 127 (13.1%) | 154 (20.4%) |
| 25 to 29 Minutes | 58 (6.0%) | 66 (8.7%) |
| 30 to 34 Minutes | 179 (18.4%) | 165 (21.8%) |
| 35 to 39 Minutes | 52 (5.4%) | 0 (0.0%) |
| 40 to 44 Minutes | 16 (1.7%) | 10 (1.3%) |
| 45 to 59 Minutes | 213 (22.0%) | 1 (0.1%) |
| 60 to 89 Minutes | 9 (0.9%) | 21 (2.8%) |
| 90 or more Minutes | 19 (2.0%) | 27 (3.6%) |
Time of Departure to Work by Sex in Chandler
The most frequent times of departure to work in Chandler are 4:00 PM to 11:59 PM (256, 26.4%) for males and 7:00 AM to 7:29 AM (177, 23.4%) for females.
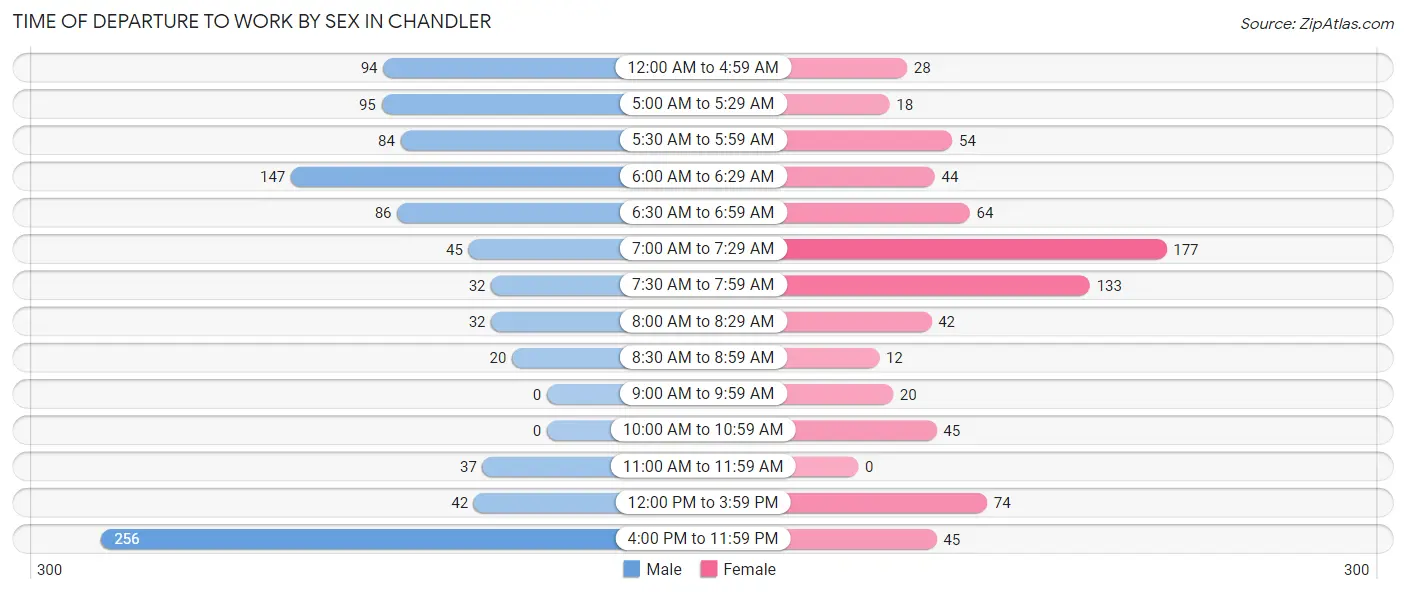
| Time of Departure | Male | Female |
| 12:00 AM to 4:59 AM | 94 (9.7%) | 28 (3.7%) |
| 5:00 AM to 5:29 AM | 95 (9.8%) | 18 (2.4%) |
| 5:30 AM to 5:59 AM | 84 (8.7%) | 54 (7.1%) |
| 6:00 AM to 6:29 AM | 147 (15.1%) | 44 (5.8%) |
| 6:30 AM to 6:59 AM | 86 (8.9%) | 64 (8.5%) |
| 7:00 AM to 7:29 AM | 45 (4.6%) | 177 (23.4%) |
| 7:30 AM to 7:59 AM | 32 (3.3%) | 133 (17.6%) |
| 8:00 AM to 8:29 AM | 32 (3.3%) | 42 (5.6%) |
| 8:30 AM to 8:59 AM | 20 (2.1%) | 12 (1.6%) |
| 9:00 AM to 9:59 AM | 0 (0.0%) | 20 (2.6%) |
| 10:00 AM to 10:59 AM | 0 (0.0%) | 45 (5.9%) |
| 11:00 AM to 11:59 AM | 37 (3.8%) | 0 (0.0%) |
| 12:00 PM to 3:59 PM | 42 (4.3%) | 74 (9.8%) |
| 4:00 PM to 11:59 PM | 256 (26.4%) | 45 (5.9%) |
| Total | 970 (100.0%) | 756 (100.0%) |
Housing Occupancy in Chandler
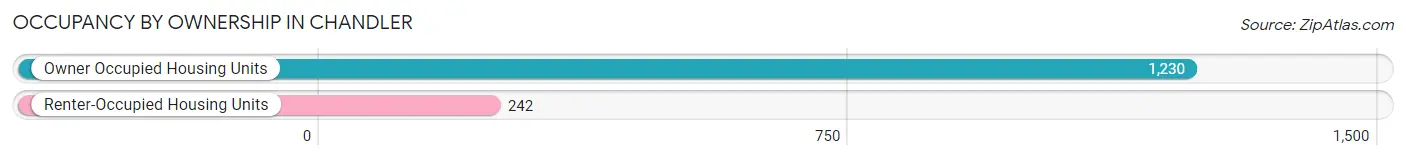
Occupancy by Ownership in Chandler
Of the total 1,472 dwellings in Chandler, owner-occupied units account for 1,230 (83.6%), while renter-occupied units make up 242 (16.4%).
| Occupancy | # Housing Units | % Housing Units |
| Owner Occupied Housing Units | 1,230 | 83.6% |
| Renter-Occupied Housing Units | 242 | 16.4% |
| Total Occupied Housing Units | 1,472 | 100.0% |
Occupancy by Household Size in Chandler
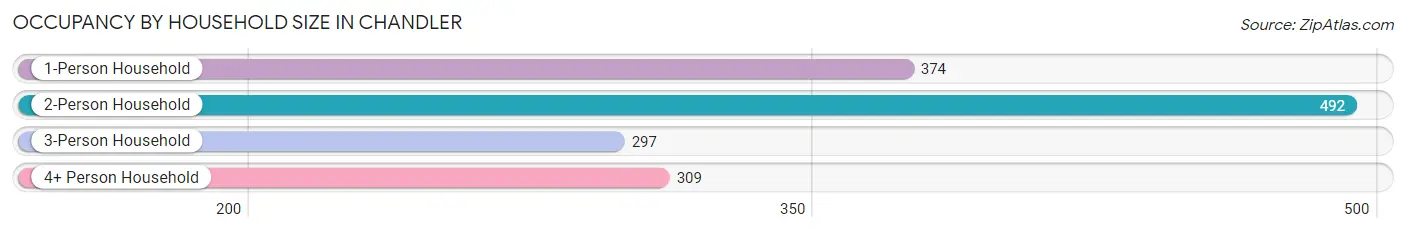
| Household Size | # Housing Units | % Housing Units |
| 1-Person Household | 374 | 25.4% |
| 2-Person Household | 492 | 33.4% |
| 3-Person Household | 297 | 20.2% |
| 4+ Person Household | 309 | 21.0% |
| Total Housing Units | 1,472 | 100.0% |
Occupancy by Ownership by Household Size in Chandler
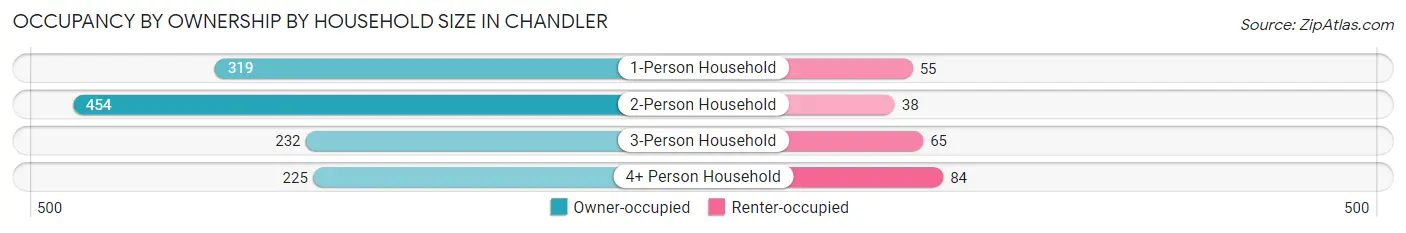
| Household Size | Owner-occupied | Renter-occupied |
| 1-Person Household | 319 (85.3%) | 55 (14.7%) |
| 2-Person Household | 454 (92.3%) | 38 (7.7%) |
| 3-Person Household | 232 (78.1%) | 65 (21.9%) |
| 4+ Person Household | 225 (72.8%) | 84 (27.2%) |
| Total Housing Units | 1,230 (83.6%) | 242 (16.4%) |
Occupancy by Educational Attainment in Chandler
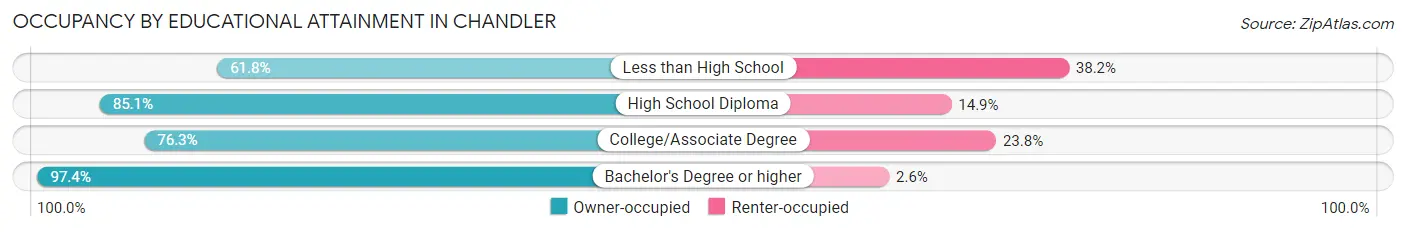
| Household Size | Owner-occupied | Renter-occupied |
| Less than High School | 55 (61.8%) | 34 (38.2%) |
| High School Diploma | 605 (85.1%) | 106 (14.9%) |
| College/Associate Degree | 305 (76.2%) | 95 (23.7%) |
| Bachelor's Degree or higher | 265 (97.4%) | 7 (2.6%) |
Occupancy by Age of Householder in Chandler
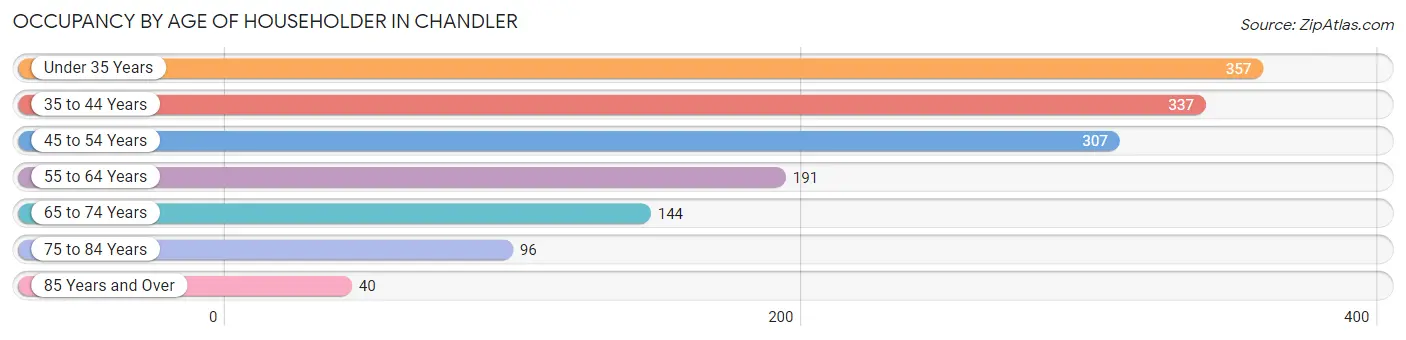
| Age Bracket | # Households | % Households |
| Under 35 Years | 357 | 24.2% |
| 35 to 44 Years | 337 | 22.9% |
| 45 to 54 Years | 307 | 20.9% |
| 55 to 64 Years | 191 | 13.0% |
| 65 to 74 Years | 144 | 9.8% |
| 75 to 84 Years | 96 | 6.5% |
| 85 Years and Over | 40 | 2.7% |
| Total | 1,472 | 100.0% |
Housing Finances in Chandler
Median Income by Occupancy in Chandler
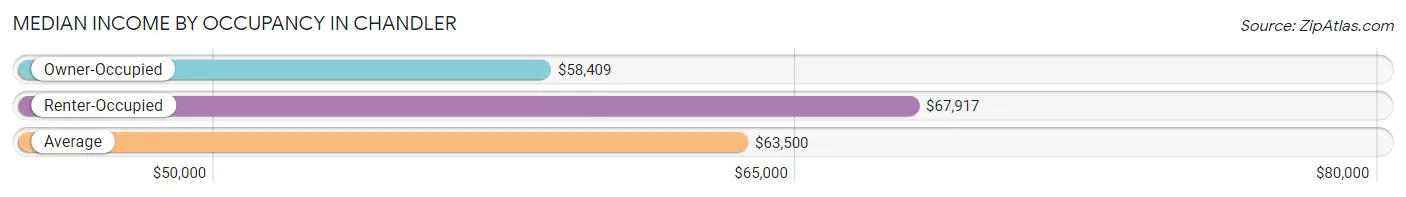
| Occupancy Type | # Households | Median Income |
| Owner-Occupied | 1,230 (83.6%) | $58,409 |
| Renter-Occupied | 242 (16.4%) | $67,917 |
| Average | 1,472 (100.0%) | $63,500 |
Occupancy by Householder Income Bracket in Chandler
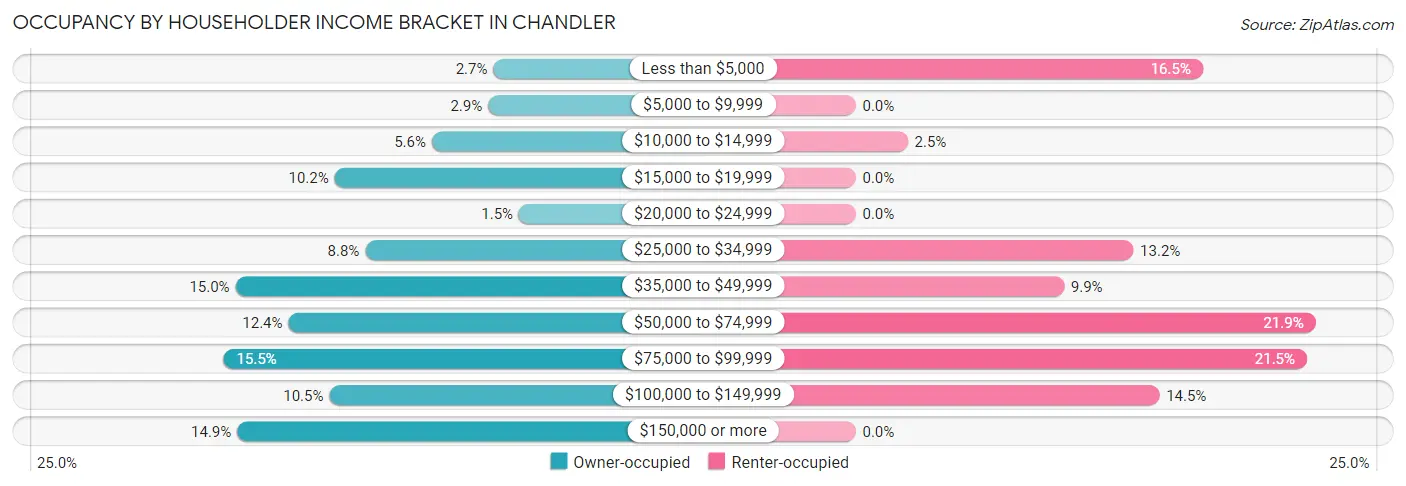
| Income Bracket | Owner-occupied | Renter-occupied |
| Less than $5,000 | 33 (2.7%) | 40 (16.5%) |
| $5,000 to $9,999 | 36 (2.9%) | 0 (0.0%) |
| $10,000 to $14,999 | 69 (5.6%) | 6 (2.5%) |
| $15,000 to $19,999 | 126 (10.2%) | 0 (0.0%) |
| $20,000 to $24,999 | 18 (1.5%) | 0 (0.0%) |
| $25,000 to $34,999 | 108 (8.8%) | 32 (13.2%) |
| $35,000 to $49,999 | 184 (15.0%) | 24 (9.9%) |
| $50,000 to $74,999 | 153 (12.4%) | 53 (21.9%) |
| $75,000 to $99,999 | 191 (15.5%) | 52 (21.5%) |
| $100,000 to $149,999 | 129 (10.5%) | 35 (14.5%) |
| $150,000 or more | 183 (14.9%) | 0 (0.0%) |
| Total | 1,230 (100.0%) | 242 (100.0%) |
Monthly Housing Cost Tiers in Chandler
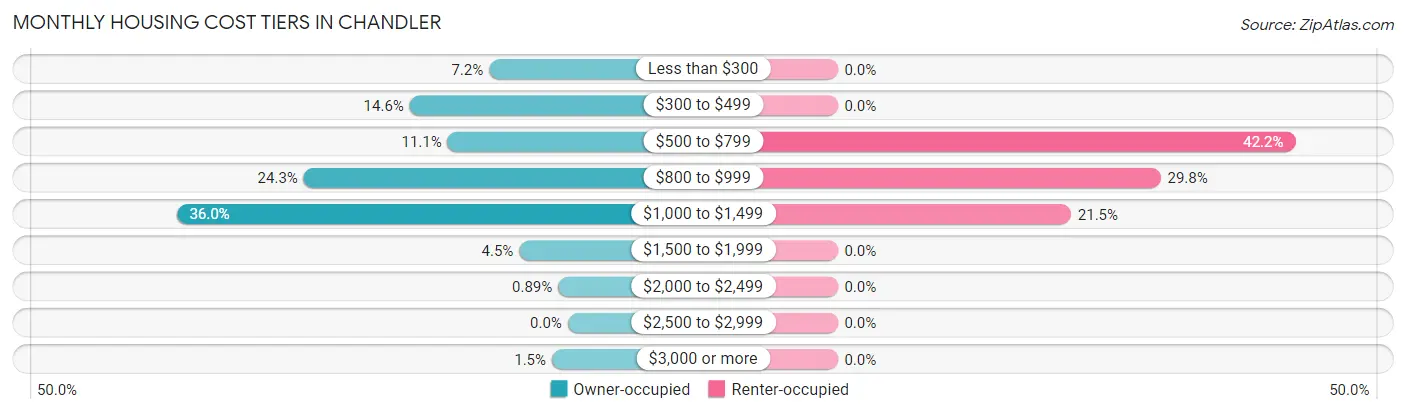
| Monthly Cost | Owner-occupied | Renter-occupied |
| Less than $300 | 89 (7.2%) | 0 (0.0%) |
| $300 to $499 | 179 (14.5%) | 0 (0.0%) |
| $500 to $799 | 136 (11.1%) | 102 (42.1%) |
| $800 to $999 | 299 (24.3%) | 72 (29.7%) |
| $1,000 to $1,499 | 443 (36.0%) | 52 (21.5%) |
| $1,500 to $1,999 | 55 (4.5%) | 0 (0.0%) |
| $2,000 to $2,499 | 11 (0.9%) | 0 (0.0%) |
| $2,500 to $2,999 | 0 (0.0%) | 0 (0.0%) |
| $3,000 or more | 18 (1.5%) | 0 (0.0%) |
| Total | 1,230 (100.0%) | 242 (100.0%) |
Physical Housing Characteristics in Chandler
Housing Structures in Chandler
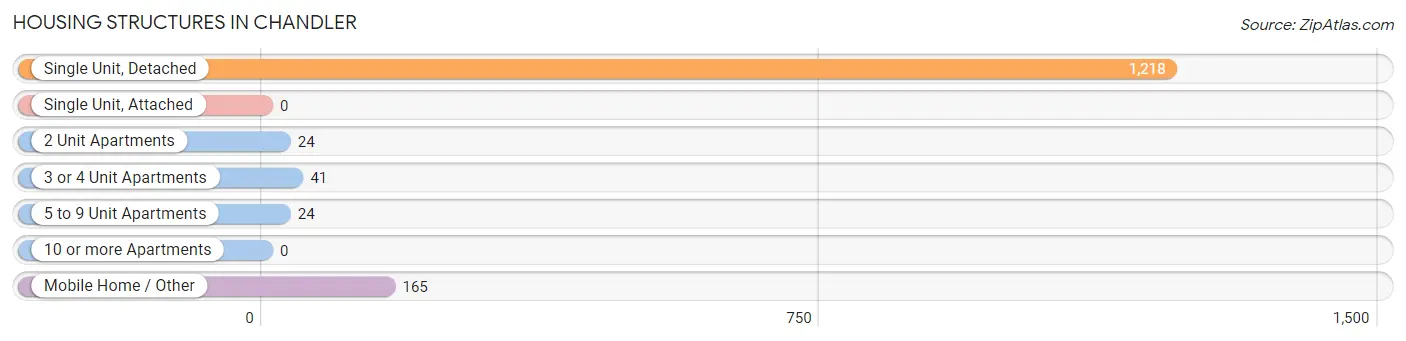
| Structure Type | # Housing Units | % Housing Units |
| Single Unit, Detached | 1,218 | 82.7% |
| Single Unit, Attached | 0 | 0.0% |
| 2 Unit Apartments | 24 | 1.6% |
| 3 or 4 Unit Apartments | 41 | 2.8% |
| 5 to 9 Unit Apartments | 24 | 1.6% |
| 10 or more Apartments | 0 | 0.0% |
| Mobile Home / Other | 165 | 11.2% |
| Total | 1,472 | 100.0% |
Housing Structures by Occupancy in Chandler
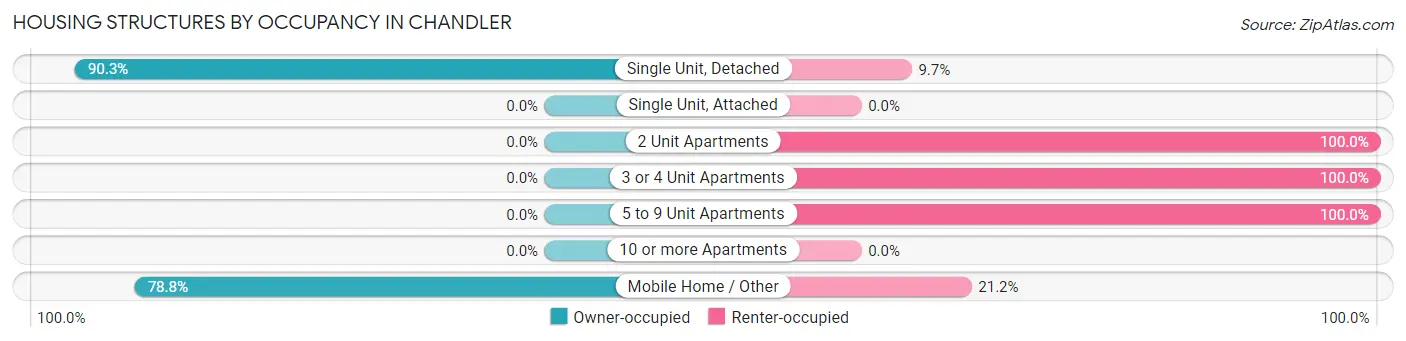
| Structure Type | Owner-occupied | Renter-occupied |
| Single Unit, Detached | 1,100 (90.3%) | 118 (9.7%) |
| Single Unit, Attached | 0 (0.0%) | 0 (0.0%) |
| 2 Unit Apartments | 0 (0.0%) | 24 (100.0%) |
| 3 or 4 Unit Apartments | 0 (0.0%) | 41 (100.0%) |
| 5 to 9 Unit Apartments | 0 (0.0%) | 24 (100.0%) |
| 10 or more Apartments | 0 (0.0%) | 0 (0.0%) |
| Mobile Home / Other | 130 (78.8%) | 35 (21.2%) |
| Total | 1,230 (83.6%) | 242 (16.4%) |
Housing Structures by Number of Rooms in Chandler
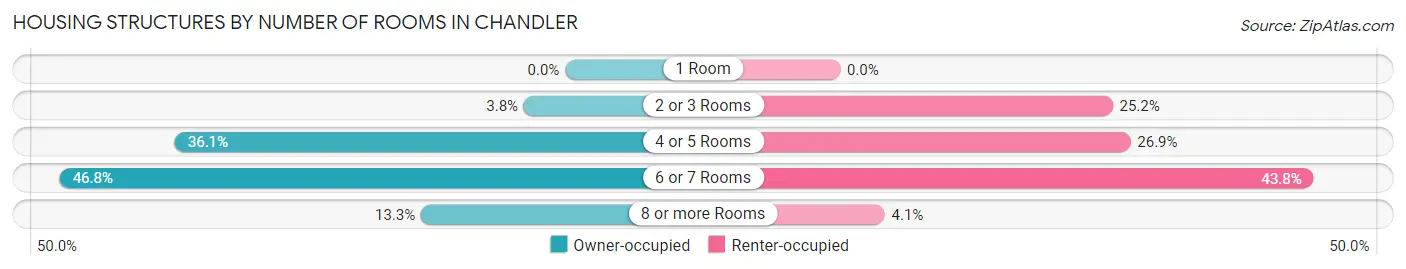
| Number of Rooms | Owner-occupied | Renter-occupied |
| 1 Room | 0 (0.0%) | 0 (0.0%) |
| 2 or 3 Rooms | 47 (3.8%) | 61 (25.2%) |
| 4 or 5 Rooms | 444 (36.1%) | 65 (26.9%) |
| 6 or 7 Rooms | 575 (46.8%) | 106 (43.8%) |
| 8 or more Rooms | 164 (13.3%) | 10 (4.1%) |
| Total | 1,230 (100.0%) | 242 (100.0%) |
Housing Structure by Heating Type in Chandler
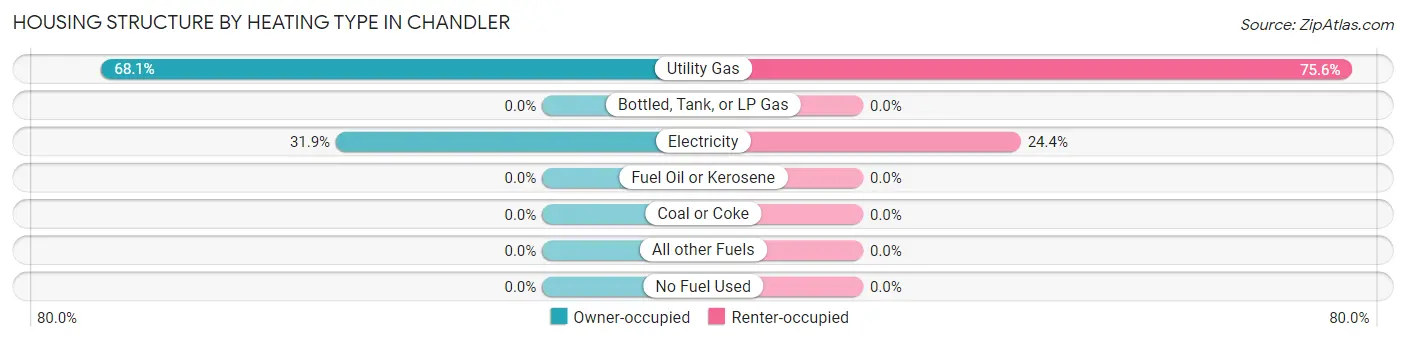
| Heating Type | Owner-occupied | Renter-occupied |
| Utility Gas | 838 (68.1%) | 183 (75.6%) |
| Bottled, Tank, or LP Gas | 0 (0.0%) | 0 (0.0%) |
| Electricity | 392 (31.9%) | 59 (24.4%) |
| Fuel Oil or Kerosene | 0 (0.0%) | 0 (0.0%) |
| Coal or Coke | 0 (0.0%) | 0 (0.0%) |
| All other Fuels | 0 (0.0%) | 0 (0.0%) |
| No Fuel Used | 0 (0.0%) | 0 (0.0%) |
| Total | 1,230 (100.0%) | 242 (100.0%) |
Household Vehicle Usage in Chandler
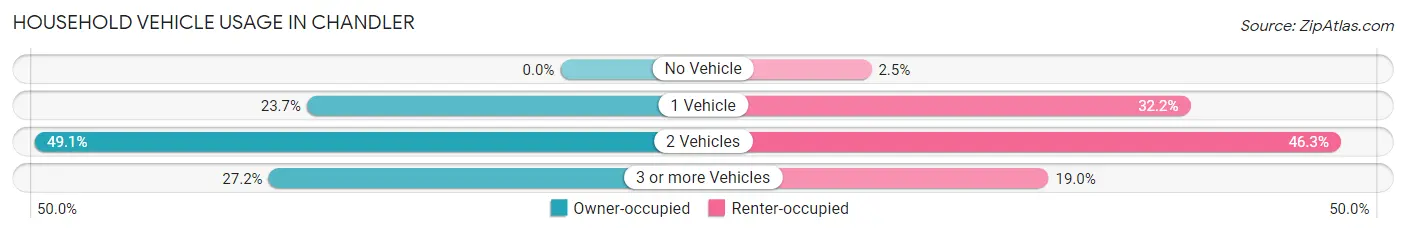
| Vehicles per Household | Owner-occupied | Renter-occupied |
| No Vehicle | 0 (0.0%) | 6 (2.5%) |
| 1 Vehicle | 291 (23.7%) | 78 (32.2%) |
| 2 Vehicles | 604 (49.1%) | 112 (46.3%) |
| 3 or more Vehicles | 335 (27.2%) | 46 (19.0%) |
| Total | 1,230 (100.0%) | 242 (100.0%) |
Real Estate & Mortgages in Chandler
Real Estate and Mortgage Overview in Chandler
| Characteristic | Without Mortgage | With Mortgage |
| Housing Units | 379 | 851 |
| Median Property Value | $88,900 | $134,200 |
| Median Household Income | $35,481 | $179 |
| Monthly Housing Costs | $419 | $18 |
| Real Estate Taxes | $604 | $35 |
Property Value by Mortgage Status in Chandler
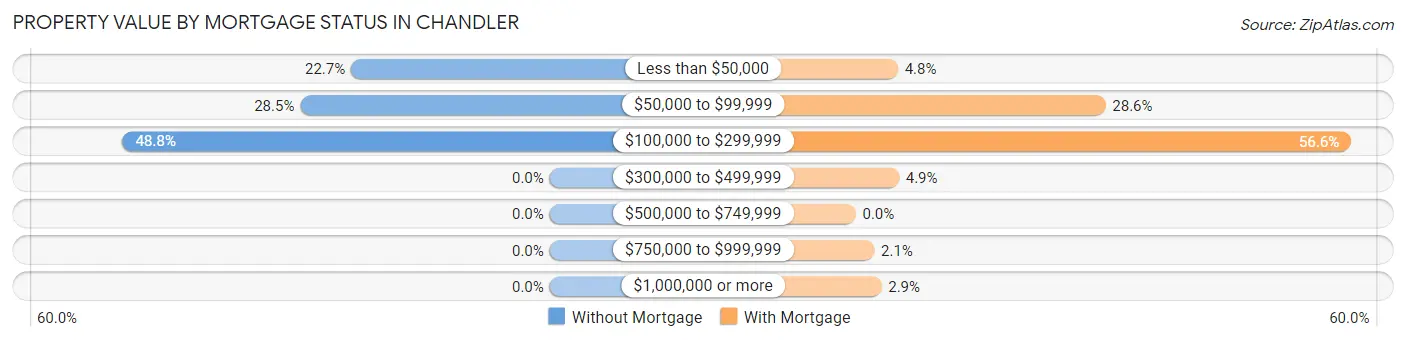
| Property Value | Without Mortgage | With Mortgage |
| Less than $50,000 | 86 (22.7%) | 41 (4.8%) |
| $50,000 to $99,999 | 108 (28.5%) | 243 (28.5%) |
| $100,000 to $299,999 | 185 (48.8%) | 482 (56.6%) |
| $300,000 to $499,999 | 0 (0.0%) | 42 (4.9%) |
| $500,000 to $749,999 | 0 (0.0%) | 0 (0.0%) |
| $750,000 to $999,999 | 0 (0.0%) | 18 (2.1%) |
| $1,000,000 or more | 0 (0.0%) | 25 (2.9%) |
| Total | 379 (100.0%) | 851 (100.0%) |
Household Income by Mortgage Status in Chandler
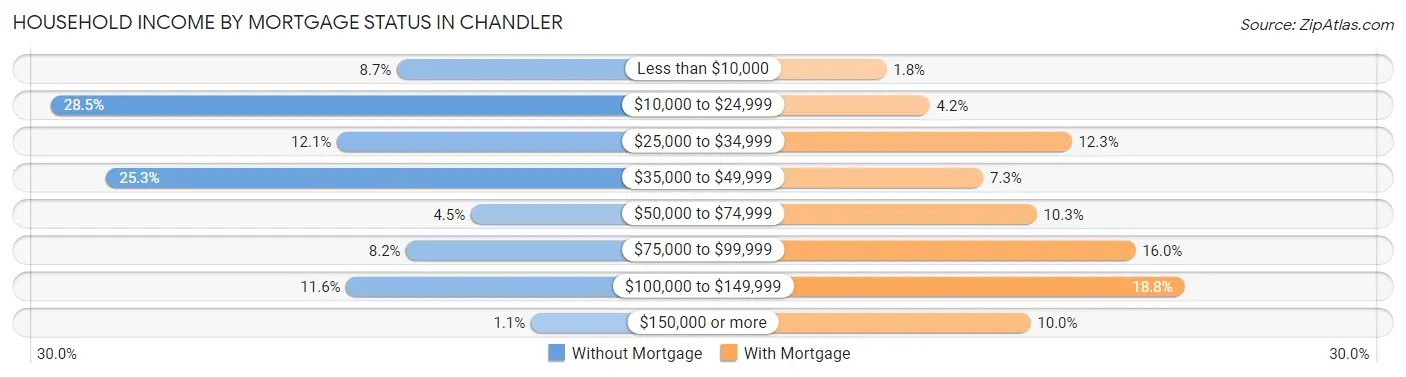
| Household Income | Without Mortgage | With Mortgage |
| Less than $10,000 | 33 (8.7%) | 15 (1.8%) |
| $10,000 to $24,999 | 108 (28.5%) | 36 (4.2%) |
| $25,000 to $34,999 | 46 (12.1%) | 105 (12.3%) |
| $35,000 to $49,999 | 96 (25.3%) | 62 (7.3%) |
| $50,000 to $74,999 | 17 (4.5%) | 88 (10.3%) |
| $75,000 to $99,999 | 31 (8.2%) | 136 (16.0%) |
| $100,000 to $149,999 | 44 (11.6%) | 160 (18.8%) |
| $150,000 or more | 4 (1.1%) | 85 (10.0%) |
| Total | 379 (100.0%) | 851 (100.0%) |
Property Value to Household Income Ratio in Chandler
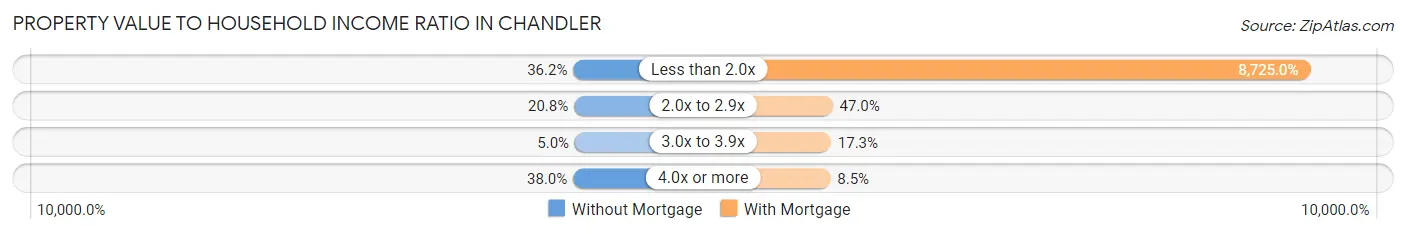
| Value-to-Income Ratio | Without Mortgage | With Mortgage |
| Less than 2.0x | 137 (36.1%) | 74,250 (8,725.0%) |
| 2.0x to 2.9x | 79 (20.8%) | 400 (47.0%) |
| 3.0x to 3.9x | 19 (5.0%) | 147 (17.3%) |
| 4.0x or more | 144 (38.0%) | 72 (8.5%) |
| Total | 379 (100.0%) | 851 (100.0%) |
Real Estate Taxes by Mortgage Status in Chandler
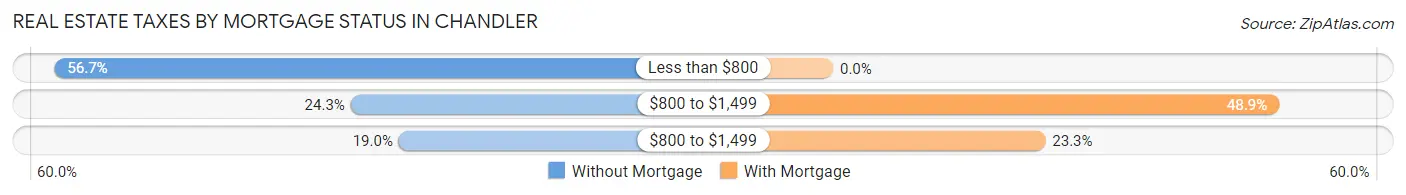
| Property Taxes | Without Mortgage | With Mortgage |
| Less than $800 | 215 (56.7%) | 0 (0.0%) |
| $800 to $1,499 | 92 (24.3%) | 416 (48.9%) |
| $800 to $1,499 | 72 (19.0%) | 198 (23.3%) |
| Total | 379 (100.0%) | 851 (100.0%) |
Health & Disability in Chandler
Health Insurance Coverage by Age in Chandler
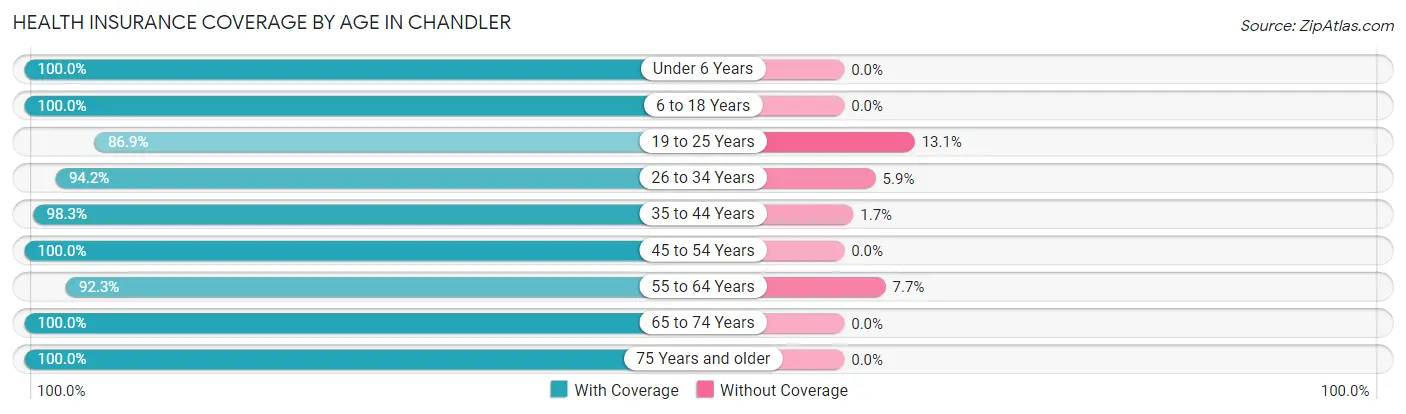
| Age Bracket | With Coverage | Without Coverage |
| Under 6 Years | 353 (100.0%) | 0 (0.0%) |
| 6 to 18 Years | 499 (100.0%) | 0 (0.0%) |
| 19 to 25 Years | 483 (86.9%) | 73 (13.1%) |
| 26 to 34 Years | 386 (94.2%) | 24 (5.9%) |
| 35 to 44 Years | 580 (98.3%) | 10 (1.7%) |
| 45 to 54 Years | 538 (100.0%) | 0 (0.0%) |
| 55 to 64 Years | 335 (92.3%) | 28 (7.7%) |
| 65 to 74 Years | 202 (100.0%) | 0 (0.0%) |
| 75 Years and older | 215 (100.0%) | 0 (0.0%) |
| Total | 3,591 (96.4%) | 135 (3.6%) |
Health Insurance Coverage by Citizenship Status in Chandler
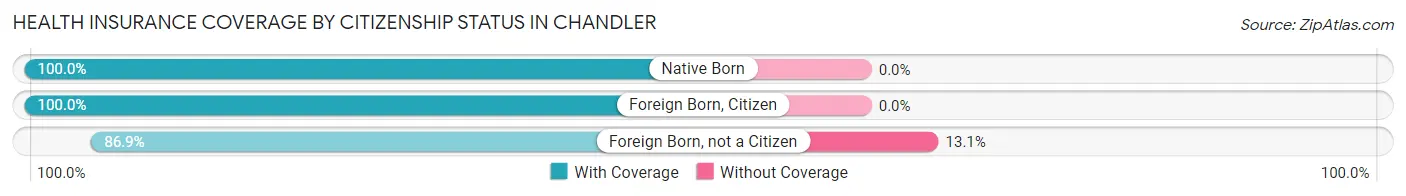
| Citizenship Status | With Coverage | Without Coverage |
| Native Born | 353 (100.0%) | 0 (0.0%) |
| Foreign Born, Citizen | 499 (100.0%) | 0 (0.0%) |
| Foreign Born, not a Citizen | 483 (86.9%) | 73 (13.1%) |
Health Insurance Coverage by Household Income in Chandler
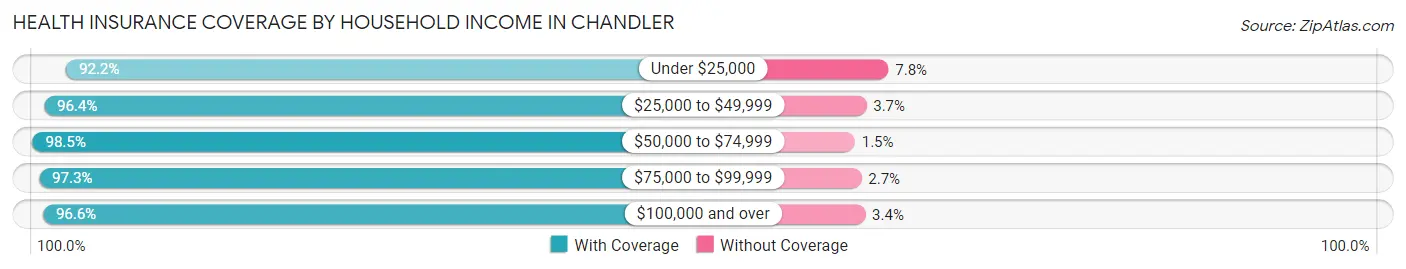
| Household Income | With Coverage | Without Coverage |
| Under $25,000 | 498 (92.2%) | 42 (7.8%) |
| $25,000 to $49,999 | 607 (96.4%) | 23 (3.6%) |
| $50,000 to $74,999 | 656 (98.5%) | 10 (1.5%) |
| $75,000 to $99,999 | 642 (97.3%) | 18 (2.7%) |
| $100,000 and over | 1,180 (96.6%) | 42 (3.4%) |
Public vs Private Health Insurance Coverage by Age in Chandler
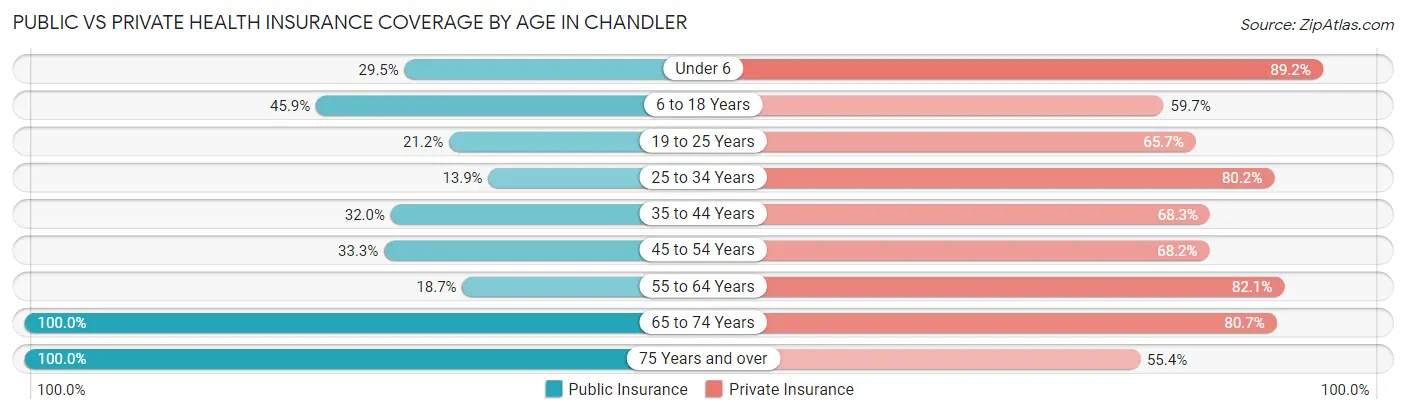
| Age Bracket | Public Insurance | Private Insurance |
| Under 6 | 104 (29.5%) | 315 (89.2%) |
| 6 to 18 Years | 229 (45.9%) | 298 (59.7%) |
| 19 to 25 Years | 118 (21.2%) | 365 (65.6%) |
| 25 to 34 Years | 57 (13.9%) | 329 (80.2%) |
| 35 to 44 Years | 189 (32.0%) | 403 (68.3%) |
| 45 to 54 Years | 179 (33.3%) | 367 (68.2%) |
| 55 to 64 Years | 68 (18.7%) | 298 (82.1%) |
| 65 to 74 Years | 202 (100.0%) | 163 (80.7%) |
| 75 Years and over | 215 (100.0%) | 119 (55.3%) |
| Total | 1,361 (36.5%) | 2,657 (71.3%) |
Disability Status by Sex by Age in Chandler
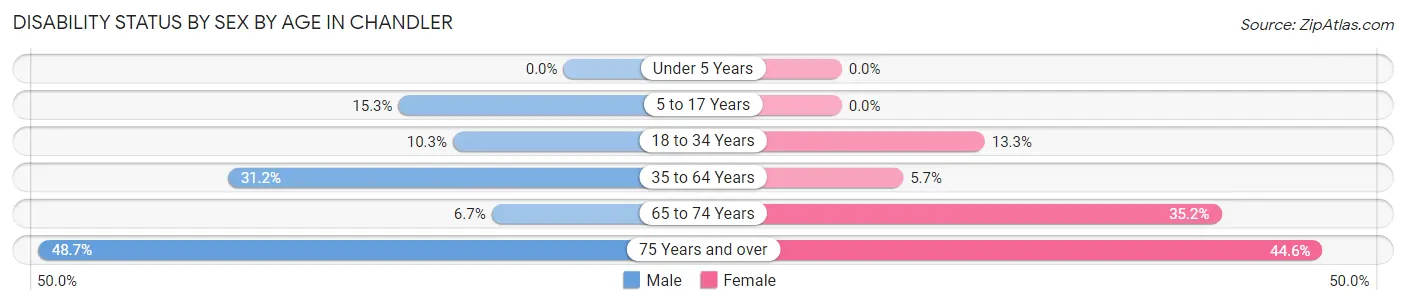
| Age Bracket | Male | Female |
| Under 5 Years | 0 (0.0%) | 0 (0.0%) |
| 5 to 17 Years | 45 (15.3%) | 0 (0.0%) |
| 18 to 34 Years | 60 (10.3%) | 54 (13.3%) |
| 35 to 64 Years | 224 (31.1%) | 44 (5.7%) |
| 65 to 74 Years | 4 (6.7%) | 50 (35.2%) |
| 75 Years and over | 37 (48.7%) | 62 (44.6%) |
Disability Class by Sex by Age in Chandler
Disability Class: Hearing Difficulty
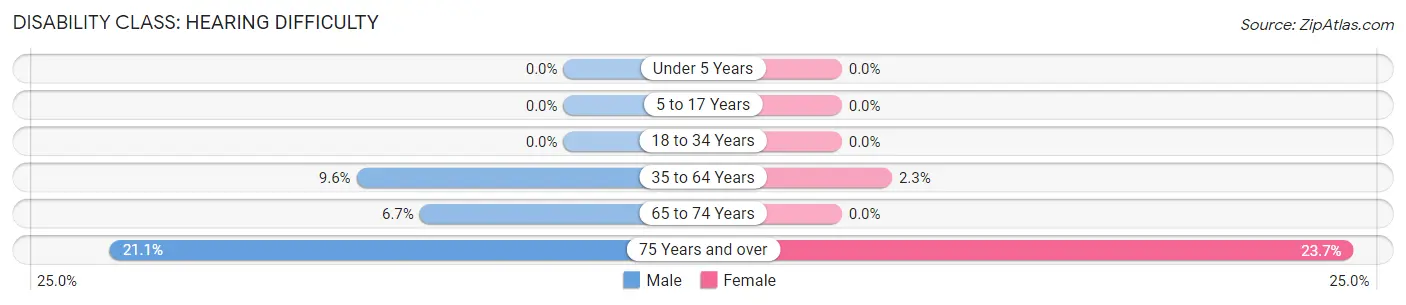
| Age Bracket | Male | Female |
| Under 5 Years | 0 (0.0%) | 0 (0.0%) |
| 5 to 17 Years | 0 (0.0%) | 0 (0.0%) |
| 18 to 34 Years | 0 (0.0%) | 0 (0.0%) |
| 35 to 64 Years | 69 (9.6%) | 18 (2.3%) |
| 65 to 74 Years | 4 (6.7%) | 0 (0.0%) |
| 75 Years and over | 16 (21.0%) | 33 (23.7%) |
Disability Class: Vision Difficulty
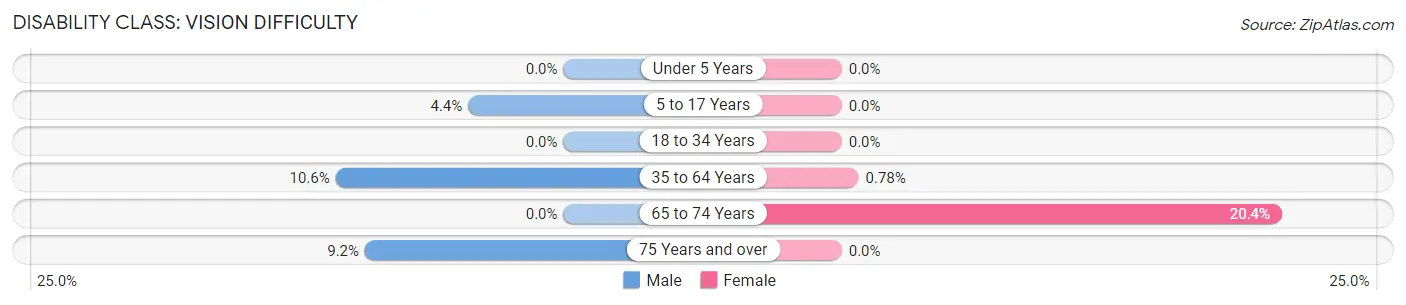
| Age Bracket | Male | Female |
| Under 5 Years | 0 (0.0%) | 0 (0.0%) |
| 5 to 17 Years | 13 (4.4%) | 0 (0.0%) |
| 18 to 34 Years | 0 (0.0%) | 0 (0.0%) |
| 35 to 64 Years | 76 (10.6%) | 6 (0.8%) |
| 65 to 74 Years | 0 (0.0%) | 29 (20.4%) |
| 75 Years and over | 7 (9.2%) | 0 (0.0%) |
Disability Class: Cognitive Difficulty
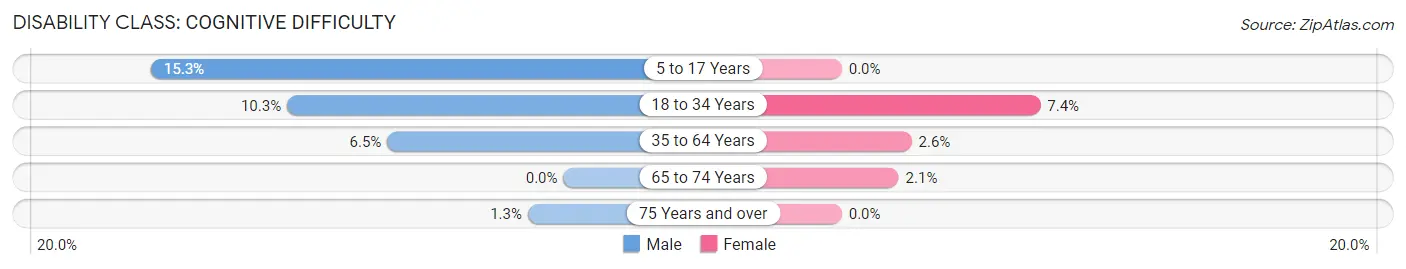
| Age Bracket | Male | Female |
| 5 to 17 Years | 45 (15.3%) | 0 (0.0%) |
| 18 to 34 Years | 60 (10.3%) | 30 (7.4%) |
| 35 to 64 Years | 47 (6.5%) | 20 (2.6%) |
| 65 to 74 Years | 0 (0.0%) | 3 (2.1%) |
| 75 Years and over | 1 (1.3%) | 0 (0.0%) |
Disability Class: Ambulatory Difficulty
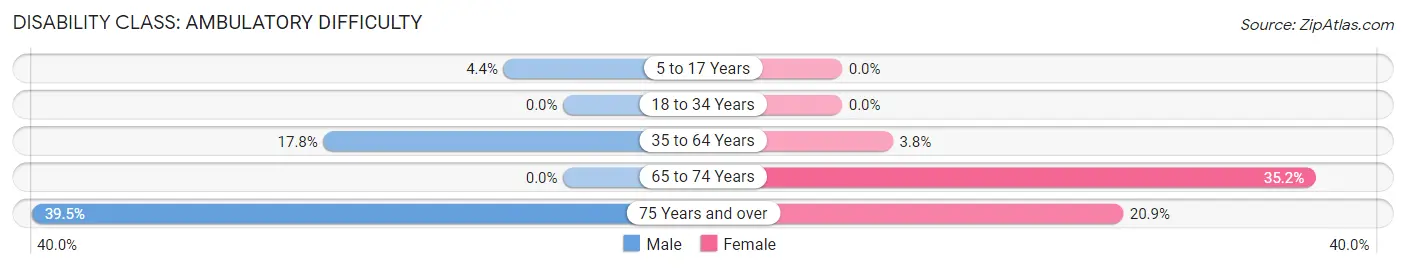
| Age Bracket | Male | Female |
| 5 to 17 Years | 13 (4.4%) | 0 (0.0%) |
| 18 to 34 Years | 0 (0.0%) | 0 (0.0%) |
| 35 to 64 Years | 128 (17.8%) | 29 (3.8%) |
| 65 to 74 Years | 0 (0.0%) | 50 (35.2%) |
| 75 Years and over | 30 (39.5%) | 29 (20.9%) |
Disability Class: Self-Care Difficulty
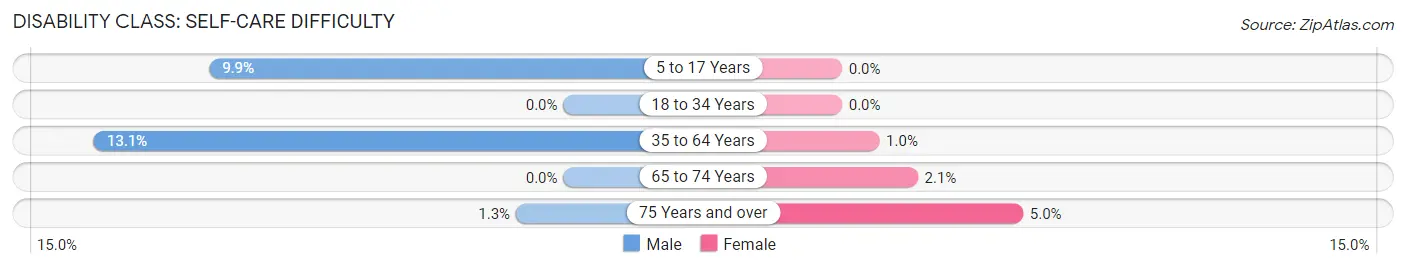
| Age Bracket | Male | Female |
| 5 to 17 Years | 29 (9.9%) | 0 (0.0%) |
| 18 to 34 Years | 0 (0.0%) | 0 (0.0%) |
| 35 to 64 Years | 94 (13.1%) | 8 (1.0%) |
| 65 to 74 Years | 0 (0.0%) | 3 (2.1%) |
| 75 Years and over | 1 (1.3%) | 7 (5.0%) |
Technology Access in Chandler
Computing Device Access in Chandler
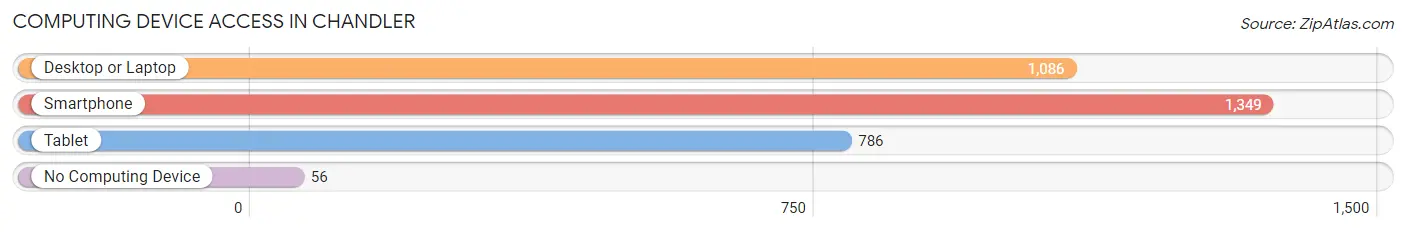
| Device Type | # Households | % Households |
| Desktop or Laptop | 1,086 | 73.8% |
| Smartphone | 1,349 | 91.6% |
| Tablet | 786 | 53.4% |
| No Computing Device | 56 | 3.8% |
| Total | 1,472 | 100.0% |
Internet Access in Chandler
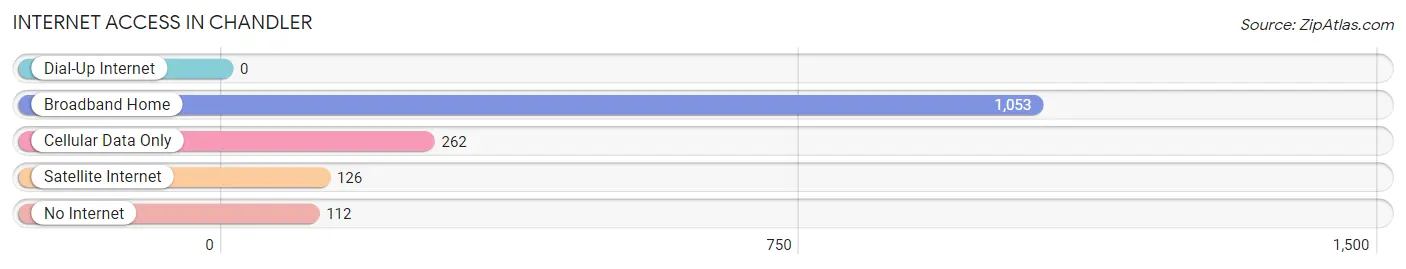
| Internet Type | # Households | % Households |
| Dial-Up Internet | 0 | 0.0% |
| Broadband Home | 1,053 | 71.5% |
| Cellular Data Only | 262 | 17.8% |
| Satellite Internet | 126 | 8.6% |
| No Internet | 112 | 7.6% |
| Total | 1,472 | 100.0% |
Chandler Summary
Chandler, Indiana is a small town located in Warrick County, Indiana. It is situated on the banks of the Wabash River, about 20 miles east of Evansville. The town was founded in 1837 and has a population of approximately 2,000 people.
History
Chandler was founded in 1837 by William Chandler, a settler from Kentucky. He purchased the land from the federal government and named the town after himself. The town was originally a farming community, but soon developed into a small industrial center. The first industry in Chandler was a sawmill, which was built in 1845. This was followed by a gristmill, a woolen mill, and a brickyard.
In the late 19th century, Chandler became a popular tourist destination. The town was known for its scenic beauty and its many recreational activities, such as fishing, boating, and swimming. The town also had a number of hotels and resorts, which attracted visitors from all over the country.
In the early 20th century, Chandler experienced a period of growth and prosperity. The town was home to several factories, including a glass factory, a furniture factory, and a canning factory. The town also had a number of stores, restaurants, and other businesses.
Geography
Chandler is located in Warrick County, Indiana. It is situated on the banks of the Wabash River, about 20 miles east of Evansville. The town is surrounded by rolling hills and farmland. The climate in Chandler is humid continental, with hot summers and cold winters.
Economy
The economy of Chandler is largely based on agriculture and manufacturing. The town is home to several factories, including a glass factory, a furniture factory, and a canning factory. The town also has a number of stores, restaurants, and other businesses.
Demographics
As of the 2010 census, the population of Chandler was 2,000. The racial makeup of the town was 97.2% White, 0.7% African American, 0.3% Native American, 0.2% Asian, 0.1% Pacific Islander, 0.3% from other races, and 1.3% from two or more races. The median household income in Chandler was $37,500, and the median family income was $45,000. The per capita income in Chandler was $19,000.
Conclusion
Chandler, Indiana is a small town located in Warrick County, Indiana. It was founded in 1837 and has a population of approximately 2,000 people. The town is largely based on agriculture and manufacturing, and is home to several factories, stores, restaurants, and other businesses. The town has a humid continental climate, with hot summers and cold winters. The population of Chandler is 97.2% White, 0.7% African American, 0.3% Native American, 0.2% Asian, 0.1% Pacific Islander, 0.3% from other races, and 1.3% from two or more races. The median household income in Chandler was $37,500, and the median family income was $45,000.
Common Questions
What is Per Capita Income in Chandler?
Per Capita income in Chandler is $28,936.
What is the Median Family Income in Chandler?
Median Family Income in Chandler is $72,841.
What is the Median Household income in Chandler?
Median Household Income in Chandler is $63,500.
What is Income or Wage Gap in Chandler?
Income or Wage Gap in Chandler is 44.2%.
Women in Chandler earn 55.8 cents for every dollar earned by a man.
What is Inequality or Gini Index in Chandler?
Inequality or Gini Index in Chandler is 0.43.
What is the Total Population of Chandler?
Total Population of Chandler is 3,726.
What is the Total Male Population of Chandler?
Total Male Population of Chandler is 1,788.
What is the Total Female Population of Chandler?
Total Female Population of Chandler is 1,938.
What is the Ratio of Males per 100 Females in Chandler?
There are 92.26 Males per 100 Females in Chandler.
What is the Ratio of Females per 100 Males in Chandler?
There are 108.39 Females per 100 Males in Chandler.
What is the Median Population Age in Chandler?
Median Population Age in Chandler is 36.5 Years.
What is the Average Family Size in Chandler
Average Family Size in Chandler is 3.0 People.
What is the Average Household Size in Chandler
Average Household Size in Chandler is 2.5 People.
How Large is the Labor Force in Chandler?
There are 2,052 People in the Labor Forcein in Chandler.
What is the Percentage of People in the Labor Force in Chandler?
66.8% of People are in the Labor Force in Chandler.
What is the Unemployment Rate in Chandler?
Unemployment Rate in Chandler is 9.8%.