San Carlos, AZ Map & Demographics
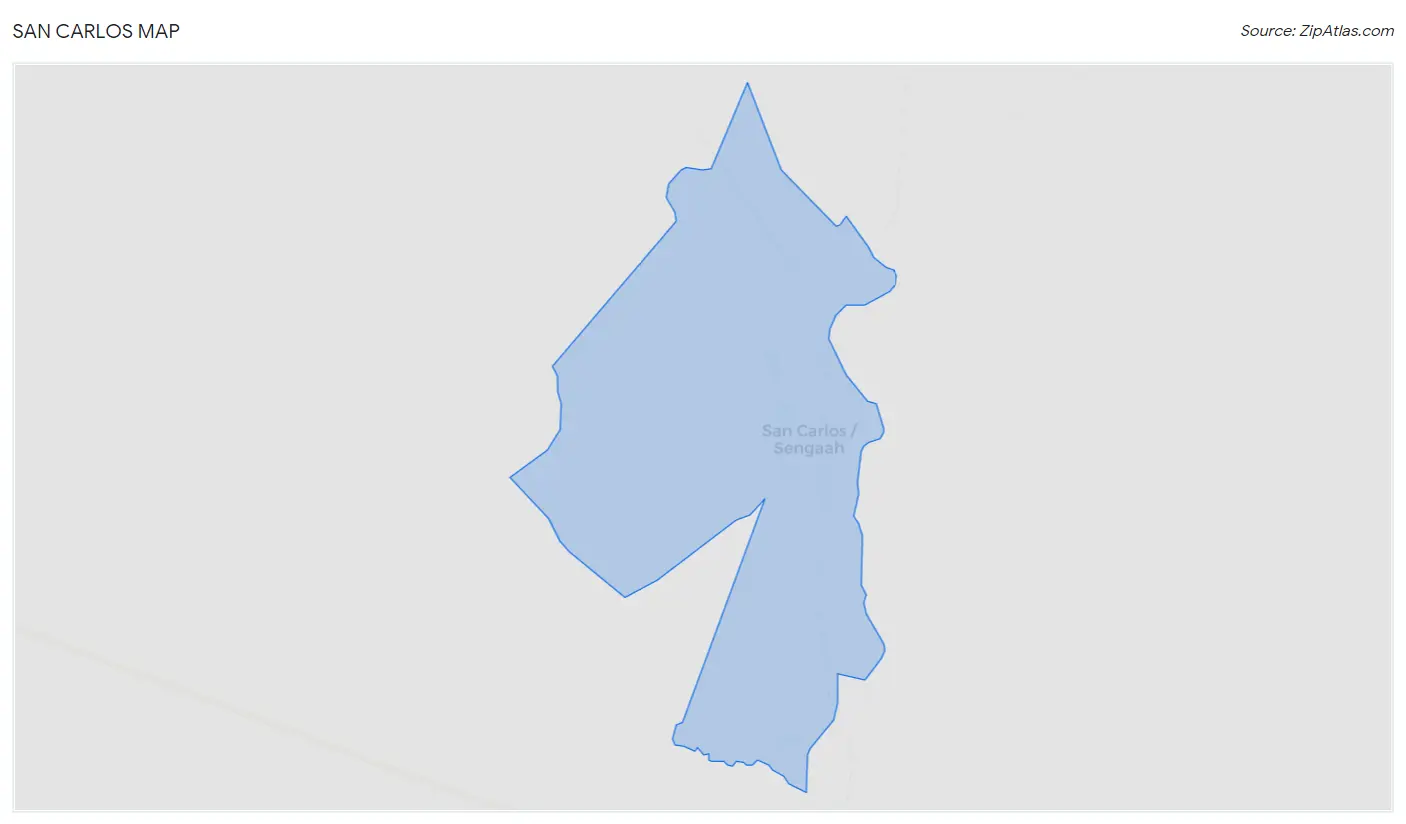
San Carlos Map
San Carlos Overview
$11,850
PER CAPITA INCOME
$41,030
AVG FAMILY INCOME
$38,125
AVG HOUSEHOLD INCOME
7.4%
WAGE / INCOME GAP [ % ]
92.6¢/ $1
WAGE / INCOME GAP [ $ ]
$18,090
FAMILY INCOME DEFICIT
0.54
INEQUALITY / GINI INDEX
4,405
TOTAL POPULATION
2,112
MALE POPULATION
2,293
FEMALE POPULATION
92.11
MALES / 100 FEMALES
108.57
FEMALES / 100 MALES
26.5
MEDIAN AGE
4.3
AVG FAMILY SIZE
4.3
AVG HOUSEHOLD SIZE
1,483
LABOR FORCE [ PEOPLE ]
49.7%
PERCENT IN LABOR FORCE
19.6%
UNEMPLOYMENT RATE
San Carlos Zip Codes
San Carlos Area Codes
Income in San Carlos
Income Overview in San Carlos
Per Capita Income in San Carlos is $11,850, while median incomes of families and households are $41,030 and $38,125 respectively.
| Characteristic | Number | Measure |
| Per Capita Income | 4,405 | $11,850 |
| Median Family Income | 897 | $41,030 |
| Mean Family Income | 897 | $45,989 |
| Median Household Income | 1,014 | $38,125 |
| Mean Household Income | 1,014 | $53,310 |
| Income Deficit | 897 | $18,090 |
| Wage / Income Gap (%) | 4,405 | 7.45% |
| Wage / Income Gap ($) | 4,405 | 92.55¢ per $1 |
| Gini / Inequality Index | 4,405 | 0.54 |
Earnings by Sex in San Carlos
Average Earnings in San Carlos are $25,326, $23,990 for men and $25,920 for women, a difference of 7.4%.
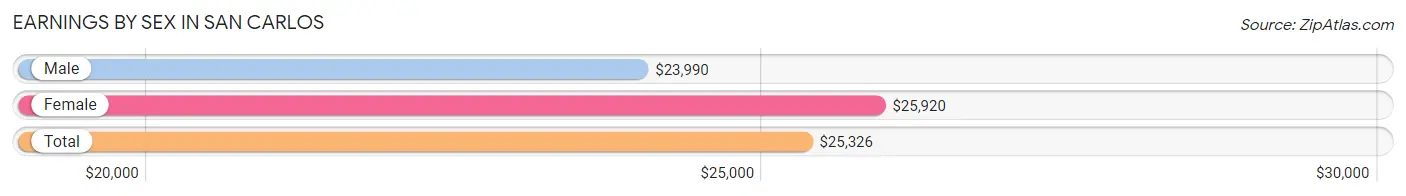
| Sex | Number | Average Earnings |
| Male | 561 (40.0%) | $23,990 |
| Female | 841 (60.0%) | $25,920 |
| Total | 1,402 (100.0%) | $25,326 |
Earnings by Sex by Income Bracket in San Carlos
The most common earnings brackets in San Carlos are $20,000 to $22,499 for men (70 | 12.5%) and $20,000 to $22,499 for women (126 | 15.0%).
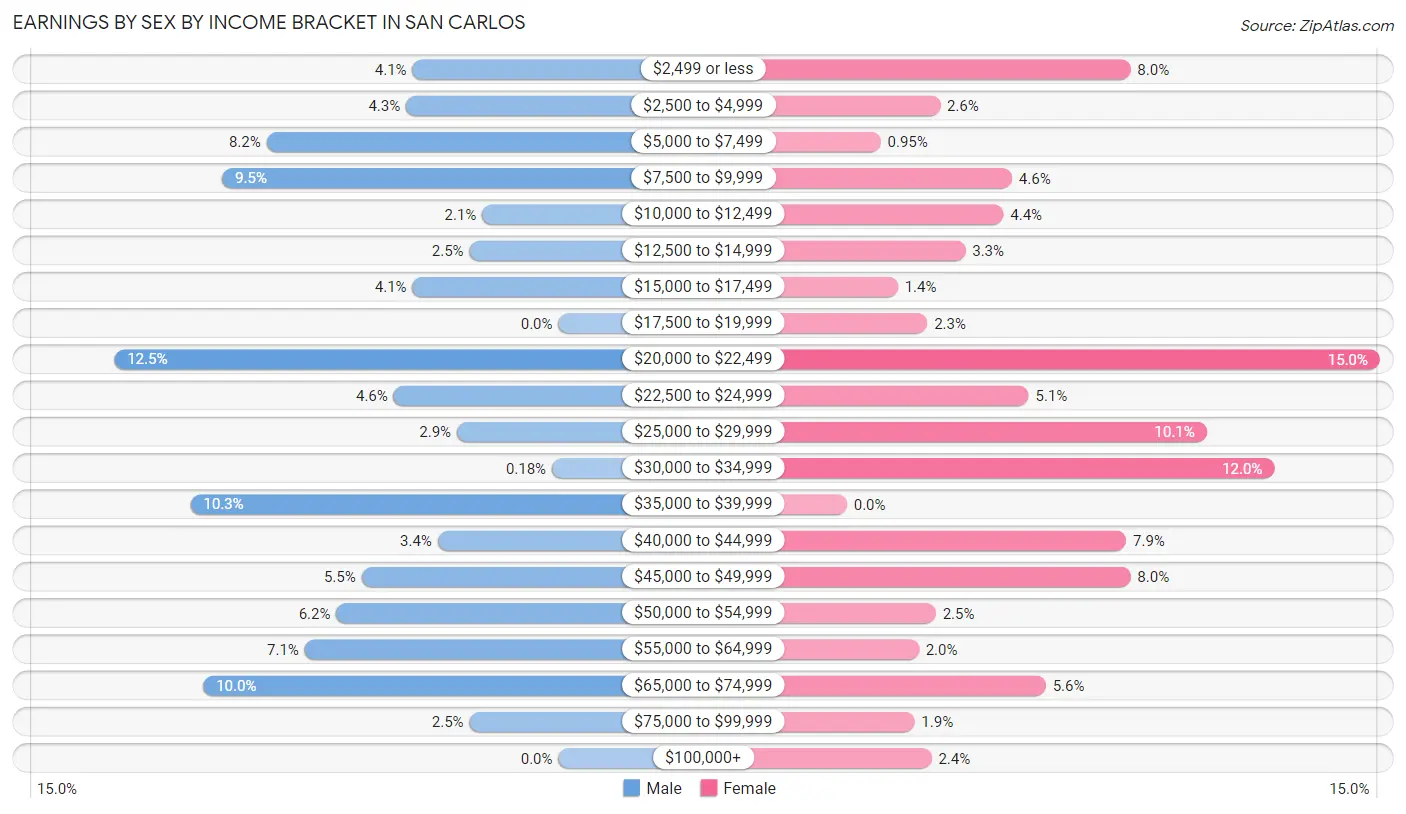
| Income | Male | Female |
| $2,499 or less | 23 (4.1%) | 67 (8.0%) |
| $2,500 to $4,999 | 24 (4.3%) | 22 (2.6%) |
| $5,000 to $7,499 | 46 (8.2%) | 8 (0.9%) |
| $7,500 to $9,999 | 53 (9.5%) | 39 (4.6%) |
| $10,000 to $12,499 | 12 (2.1%) | 37 (4.4%) |
| $12,500 to $14,999 | 14 (2.5%) | 28 (3.3%) |
| $15,000 to $17,499 | 23 (4.1%) | 12 (1.4%) |
| $17,500 to $19,999 | 0 (0.0%) | 19 (2.3%) |
| $20,000 to $22,499 | 70 (12.5%) | 126 (15.0%) |
| $22,500 to $24,999 | 26 (4.6%) | 43 (5.1%) |
| $25,000 to $29,999 | 16 (2.9%) | 85 (10.1%) |
| $30,000 to $34,999 | 1 (0.2%) | 101 (12.0%) |
| $35,000 to $39,999 | 58 (10.3%) | 0 (0.0%) |
| $40,000 to $44,999 | 19 (3.4%) | 66 (7.9%) |
| $45,000 to $49,999 | 31 (5.5%) | 67 (8.0%) |
| $50,000 to $54,999 | 35 (6.2%) | 21 (2.5%) |
| $55,000 to $64,999 | 40 (7.1%) | 17 (2.0%) |
| $65,000 to $74,999 | 56 (10.0%) | 47 (5.6%) |
| $75,000 to $99,999 | 14 (2.5%) | 16 (1.9%) |
| $100,000+ | 0 (0.0%) | 20 (2.4%) |
| Total | 561 (100.0%) | 841 (100.0%) |
Earnings by Sex by Educational Attainment in San Carlos
Average earnings in San Carlos are $24,231 for men and $26,108 for women, a difference of 7.2%. Men with an educational attainment of college or associate's degree enjoy the highest average annual earnings of $54,844, while those with high school diploma education earn the least with $20,745. Women with an educational attainment of graduate degree earn the most with the average annual earnings of $73,160, while those with high school diploma education have the smallest earnings of $22,152.
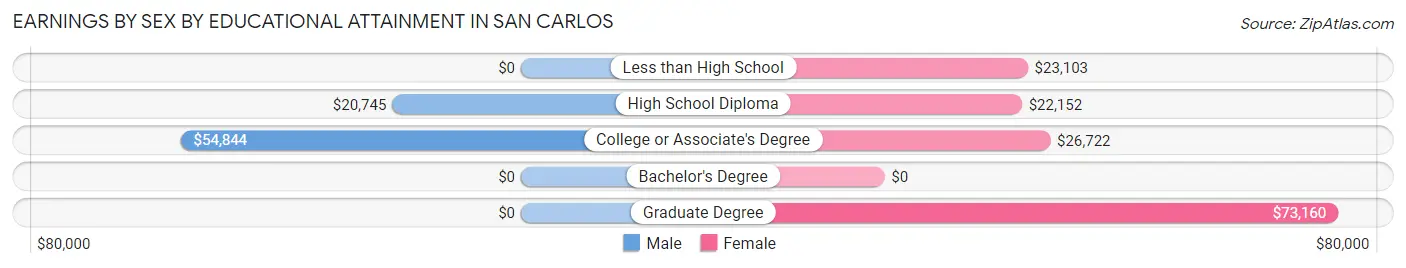
| Educational Attainment | Male Income | Female Income |
| Less than High School | - | - |
| High School Diploma | $20,745 | $22,152 |
| College or Associate's Degree | $54,844 | $26,722 |
| Bachelor's Degree | - | - |
| Graduate Degree | - | - |
| Total | $24,231 | $26,108 |
Family Income in San Carlos
Family Income Brackets in San Carlos
According to the San Carlos family income data, there are 247 families falling into the $35,000 to $49,999 income range, which is the most common income bracket and makes up 27.5% of all families.
| Income Bracket | # Families | % Families |
| Less than $10,000 | 180 | 20.1% |
| $10,000 to $14,999 | 92 | 10.3% |
| $15,000 to $24,999 | 72 | 8.0% |
| $25,000 to $34,999 | 47 | 5.2% |
| $35,000 to $49,999 | 247 | 27.5% |
| $50,000 to $74,999 | 73 | 8.1% |
| $75,000 to $99,999 | 64 | 7.1% |
| $100,000 to $149,999 | 113 | 12.6% |
| $150,000 to $199,999 | 0 | 0.0% |
| $200,000+ | 9 | 1.0% |
Family Income by Famaliy Size in San Carlos
7+ person families (96 | 10.7%) account for the highest median family income in San Carlos with $49,327 per family, while 2-person families (232 | 25.9%) have the highest median income of $20,490 per family member.
| Income Bracket | # Families | Median Income |
| 2-Person Families | 232 (25.9%) | $40,981 |
| 3-Person Families | 108 (12.0%) | $0 |
| 4-Person Families | 223 (24.9%) | $0 |
| 5-Person Families | 139 (15.5%) | $28,988 |
| 6-Person Families | 99 (11.0%) | $41,146 |
| 7+ Person Families | 96 (10.7%) | $49,327 |
| Total | 897 (100.0%) | $41,030 |
Family Income by Number of Earners in San Carlos
| Number of Earners | # Families | Median Income |
| No Earners | 261 (29.1%) | $9,375 |
| 1 Earner | 331 (36.9%) | $39,844 |
| 2 Earners | 205 (22.9%) | $81,250 |
| 3+ Earners | 100 (11.2%) | $0 |
| Total | 897 (100.0%) | $41,030 |
Household Income in San Carlos
Household Income Brackets in San Carlos
With 258 households falling in the category, the less than $10,000 income range is the most frequent in San Carlos, accounting for 25.4% of all households. In contrast, only 9 households (0.9%) fall into the $200,000+ income bracket, making it the least populous group.
| Income Bracket | # Households | % Households |
| Less than $10,000 | 258 | 25.4% |
| $10,000 to $14,999 | 64 | 6.3% |
| $15,000 to $24,999 | 117 | 11.5% |
| $25,000 to $34,999 | 63 | 6.2% |
| $35,000 to $49,999 | 168 | 16.6% |
| $50,000 to $74,999 | 79 | 7.8% |
| $75,000 to $99,999 | 27 | 2.7% |
| $100,000 to $149,999 | 150 | 14.8% |
| $150,000 to $199,999 | 79 | 7.8% |
| $200,000+ | 9 | 0.9% |
Household Income by Householder Age in San Carlos
The median household income in San Carlos is $38,125, with the highest median household income of $28,984 found in the 45 to 64 years age bracket for the primary householder. A total of 510 households (50.3%) fall into this category. Meanwhile, the 15 to 24 years age bracket for the primary householder has the lowest median household income of $0, with 47 households (4.6%) in this group.
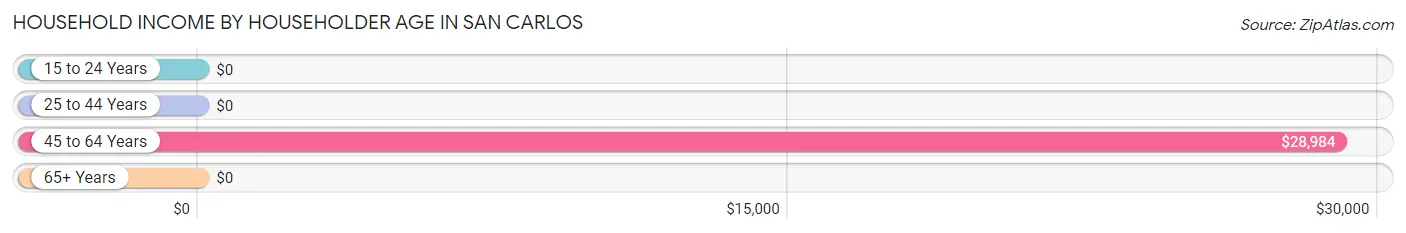
| Income Bracket | # Households | Median Income |
| 15 to 24 Years | 47 (4.6%) | $0 |
| 25 to 44 Years | 274 (27.0%) | $0 |
| 45 to 64 Years | 510 (50.3%) | $28,984 |
| 65+ Years | 183 (18.0%) | $0 |
| Total | 1,014 (100.0%) | $38,125 |
Poverty in San Carlos
Income Below Poverty by Sex and Age in San Carlos
With 53.6% poverty level for males and 51.2% for females among the residents of San Carlos, 5 year old males and 16 and 17 year old females are the most vulnerable to poverty, with 19 males (100.0%) and 21 females (100.0%) in their respective age groups living below the poverty level.
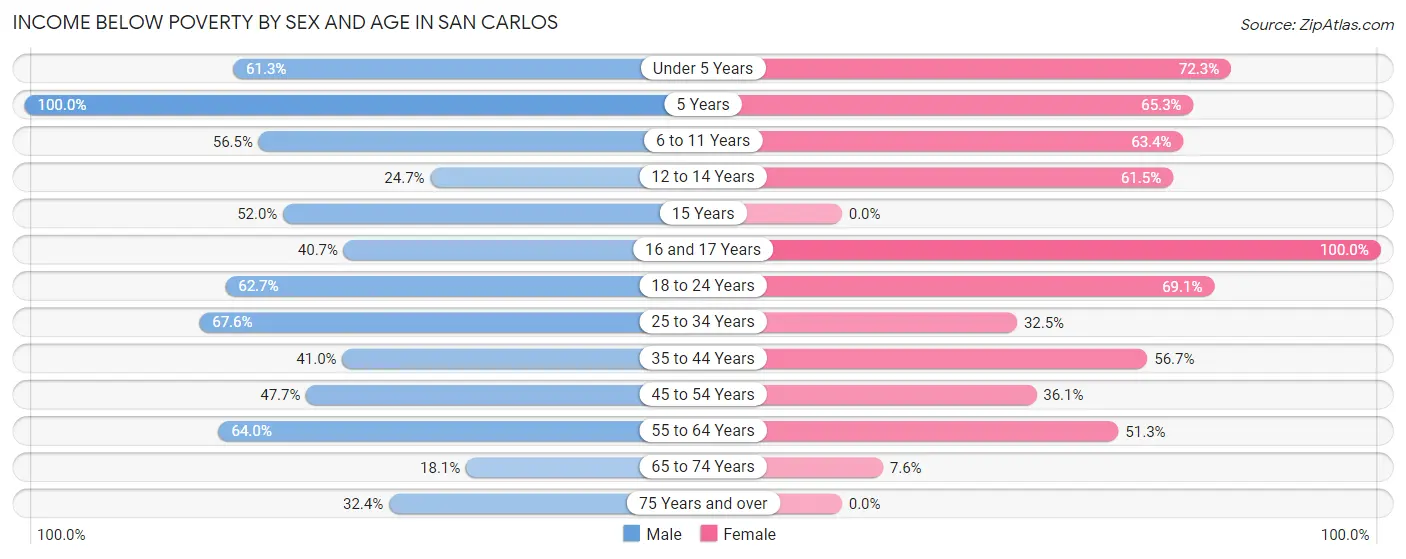
| Age Bracket | Male | Female |
| Under 5 Years | 95 (61.3%) | 151 (72.3%) |
| 5 Years | 19 (100.0%) | 62 (65.3%) |
| 6 to 11 Years | 199 (56.5%) | 130 (63.4%) |
| 12 to 14 Years | 19 (24.7%) | 134 (61.5%) |
| 15 Years | 26 (52.0%) | 0 (0.0%) |
| 16 and 17 Years | 22 (40.7%) | 21 (100.0%) |
| 18 to 24 Years | 165 (62.7%) | 197 (69.1%) |
| 25 to 34 Years | 248 (67.6%) | 132 (32.5%) |
| 35 to 44 Years | 73 (41.0%) | 169 (56.7%) |
| 45 to 54 Years | 125 (47.7%) | 74 (36.1%) |
| 55 to 64 Years | 96 (64.0%) | 96 (51.3%) |
| 65 to 74 Years | 24 (18.0%) | 8 (7.6%) |
| 75 Years and over | 11 (32.4%) | 0 (0.0%) |
| Total | 1,122 (53.6%) | 1,174 (51.2%) |
Income Above Poverty by Sex and Age in San Carlos
According to the poverty statistics in San Carlos, males aged 65 to 74 years and females aged 15 years are the age groups that are most secure financially, with 82.0% of males and 100.0% of females in these age groups living above the poverty line.
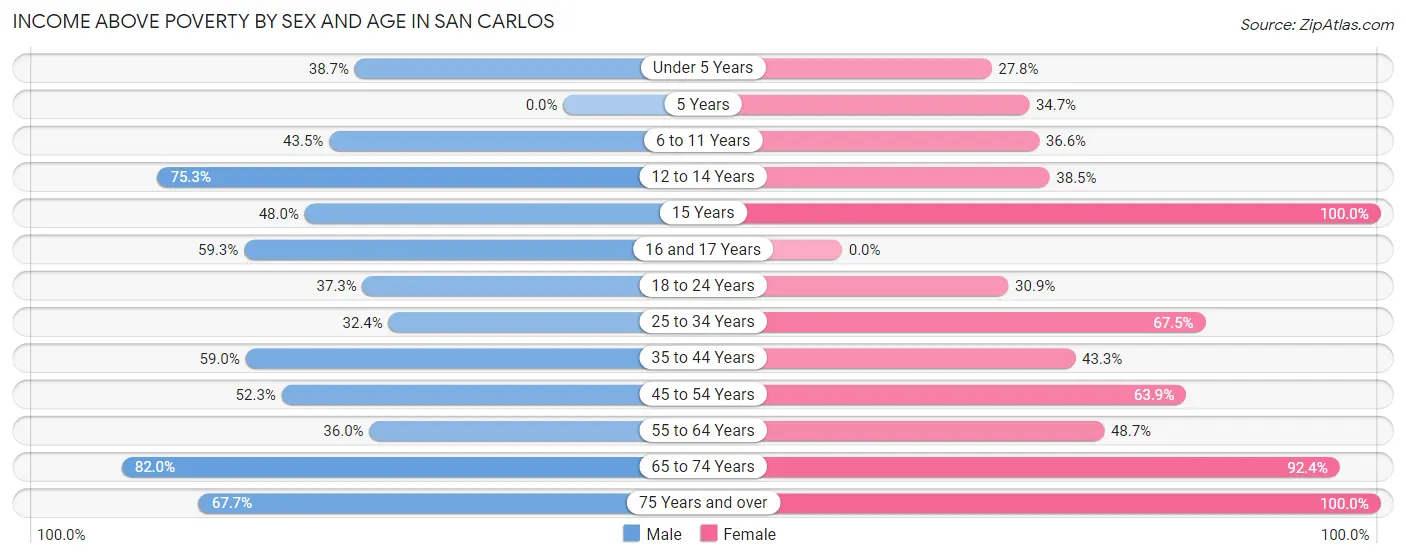
| Age Bracket | Male | Female |
| Under 5 Years | 60 (38.7%) | 58 (27.8%) |
| 5 Years | 0 (0.0%) | 33 (34.7%) |
| 6 to 11 Years | 153 (43.5%) | 75 (36.6%) |
| 12 to 14 Years | 58 (75.3%) | 84 (38.5%) |
| 15 Years | 24 (48.0%) | 41 (100.0%) |
| 16 and 17 Years | 32 (59.3%) | 0 (0.0%) |
| 18 to 24 Years | 98 (37.3%) | 88 (30.9%) |
| 25 to 34 Years | 119 (32.4%) | 274 (67.5%) |
| 35 to 44 Years | 105 (59.0%) | 129 (43.3%) |
| 45 to 54 Years | 137 (52.3%) | 131 (63.9%) |
| 55 to 64 Years | 54 (36.0%) | 91 (48.7%) |
| 65 to 74 Years | 109 (82.0%) | 97 (92.4%) |
| 75 Years and over | 23 (67.6%) | 18 (100.0%) |
| Total | 972 (46.4%) | 1,119 (48.8%) |
Income Below Poverty Among Married-Couple Families in San Carlos
The poverty statistics for married-couple families in San Carlos show that 28.2% or 93 of the total 330 families live below the poverty line. Families with 3 or 4 children have the highest poverty rate of 41.3%, comprising of 52 families. On the other hand, families with 1 or 2 children have the lowest poverty rate of 0.0%, which includes 0 families.
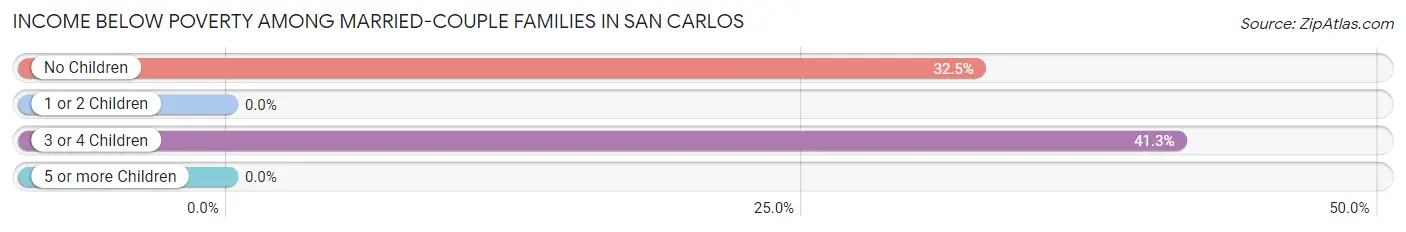
| Children | Above Poverty | Below Poverty |
| No Children | 85 (67.5%) | 41 (32.5%) |
| 1 or 2 Children | 78 (100.0%) | 0 (0.0%) |
| 3 or 4 Children | 74 (58.7%) | 52 (41.3%) |
| 5 or more Children | 0 (0.0%) | 0 (0.0%) |
| Total | 237 (71.8%) | 93 (28.2%) |
Income Below Poverty Among Single-Parent Households in San Carlos
According to the poverty data in San Carlos, 42.1% or 72 single-father households and 61.9% or 245 single-mother households are living below the poverty line. Among single-father households, those with 3 or 4 children have the highest poverty rate, with 56 households (100.0%) experiencing poverty. Likewise, among single-mother households, those with 5 or more children have the highest poverty rate, with 18 households (100.0%) falling below the poverty line.
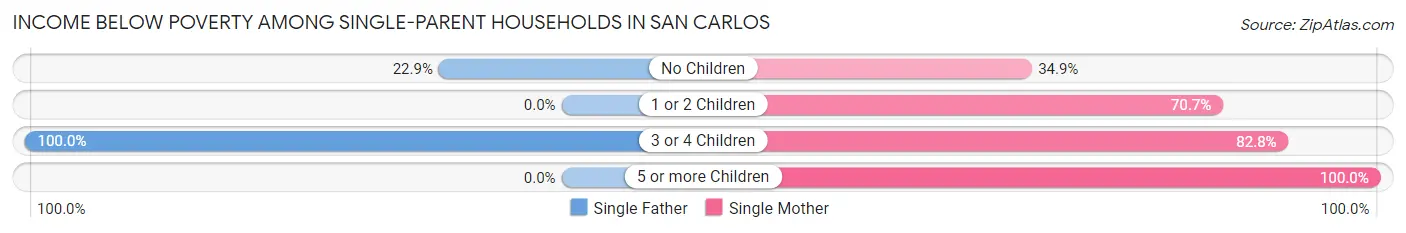
| Children | Single Father | Single Mother |
| No Children | 16 (22.9%) | 51 (34.9%) |
| 1 or 2 Children | 0 (0.0%) | 94 (70.7%) |
| 3 or 4 Children | 56 (100.0%) | 82 (82.8%) |
| 5 or more Children | 0 (0.0%) | 18 (100.0%) |
| Total | 72 (42.1%) | 245 (61.9%) |
Income Below Poverty Among Married-Couple vs Single-Parent Households in San Carlos
The poverty data for San Carlos shows that 93 of the married-couple family households (28.2%) and 317 of the single-parent households (55.9%) are living below the poverty level. Within the married-couple family households, those with 3 or 4 children have the highest poverty rate, with 52 households (41.3%) falling below the poverty line. Among the single-parent households, those with 5 or more children have the highest poverty rate, with 18 household (100.0%) living below poverty.
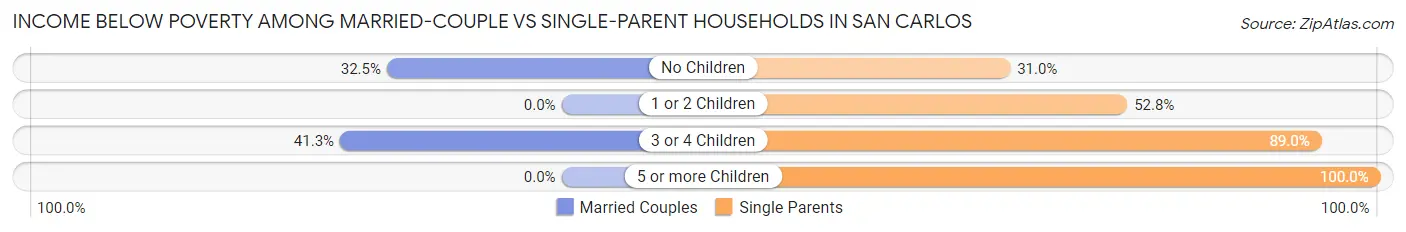
| Children | Married-Couple Families | Single-Parent Households |
| No Children | 41 (32.5%) | 67 (31.0%) |
| 1 or 2 Children | 0 (0.0%) | 94 (52.8%) |
| 3 or 4 Children | 52 (41.3%) | 138 (89.0%) |
| 5 or more Children | 0 (0.0%) | 18 (100.0%) |
| Total | 93 (28.2%) | 317 (55.9%) |
Race in San Carlos
The most populous races in San Carlos are Native / Alaskan (3,740 | 84.9%), Two or more Races (546 | 12.4%), and Hispanic or Latino (117 | 2.7%).
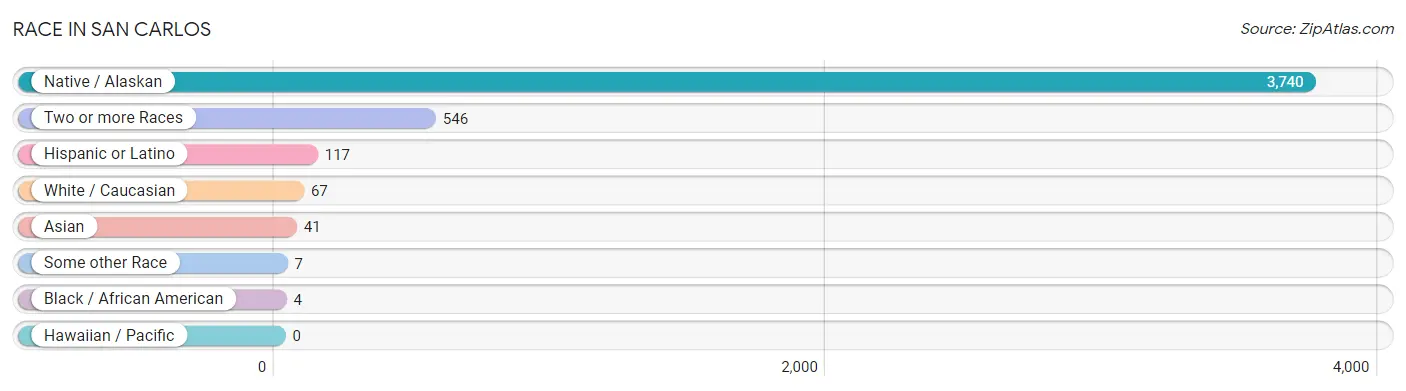
| Race | # Population | % Population |
| Asian | 41 | 0.9% |
| Black / African American | 4 | 0.1% |
| Hawaiian / Pacific | 0 | 0.0% |
| Hispanic or Latino | 117 | 2.7% |
| Native / Alaskan | 3,740 | 84.9% |
| White / Caucasian | 67 | 1.5% |
| Two or more Races | 546 | 12.4% |
| Some other Race | 7 | 0.2% |
| Total | 4,405 | 100.0% |
Ancestry in San Carlos
The most populous ancestries reported in San Carlos are Apache (3,518 | 79.9%), Navajo (268 | 6.1%), Scotch-Irish (157 | 3.6%), Scottish (113 | 2.6%), and Pueblo (100 | 2.3%), together accounting for 94.3% of all San Carlos residents.
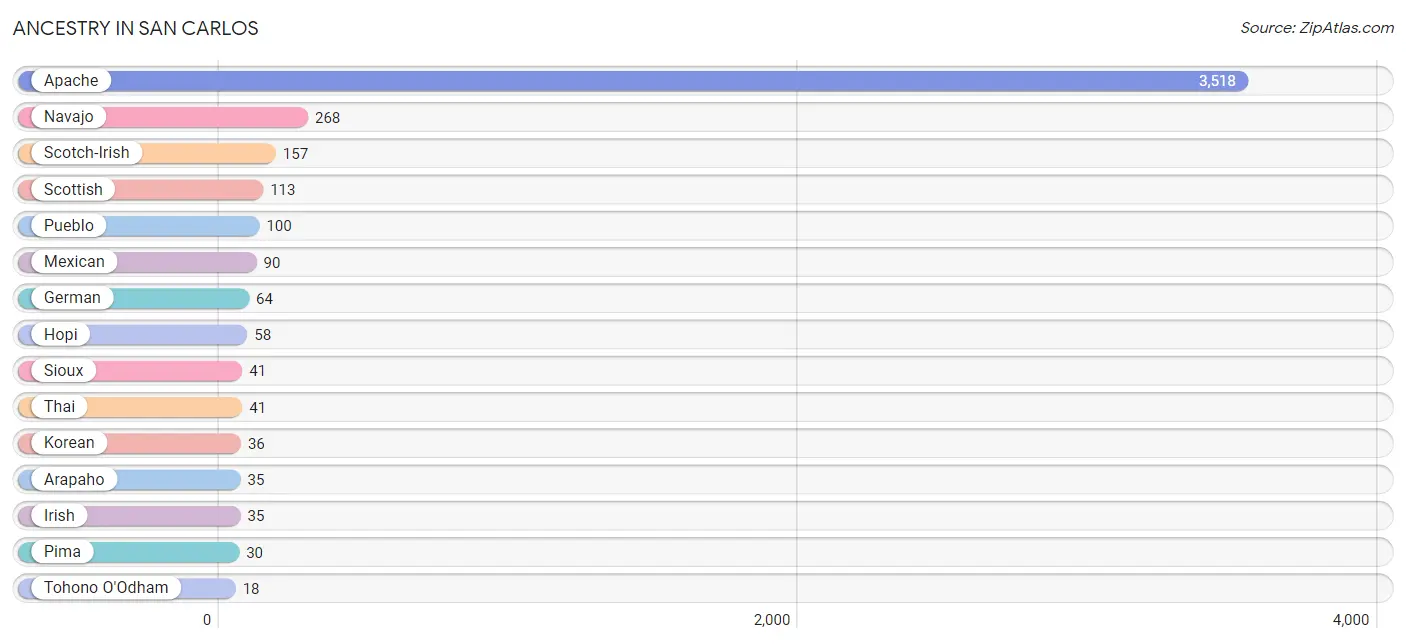
| Ancestry | # Population | % Population |
| African | 2 | 0.1% |
| Apache | 3,518 | 79.9% |
| Arapaho | 35 | 0.8% |
| German | 64 | 1.5% |
| Hopi | 58 | 1.3% |
| Irish | 35 | 0.8% |
| Korean | 36 | 0.8% |
| Mexican | 90 | 2.0% |
| Navajo | 268 | 6.1% |
| Pima | 30 | 0.7% |
| Pueblo | 100 | 2.3% |
| Scotch-Irish | 157 | 3.6% |
| Scottish | 113 | 2.6% |
| Sioux | 41 | 0.9% |
| Subsaharan African | 2 | 0.1% |
| Thai | 41 | 0.9% |
| Tohono O'Odham | 18 | 0.4% | View All 17 Rows |
Immigrants in San Carlos
The most numerous immigrant groups reported in San Carlos came from Asia (41 | 0.9%), India (41 | 0.9%), South Central Asia (41 | 0.9%), Central America (1 | 0.0%), and Latin America (1 | 0.0%), together accounting for 2.8% of all San Carlos residents.
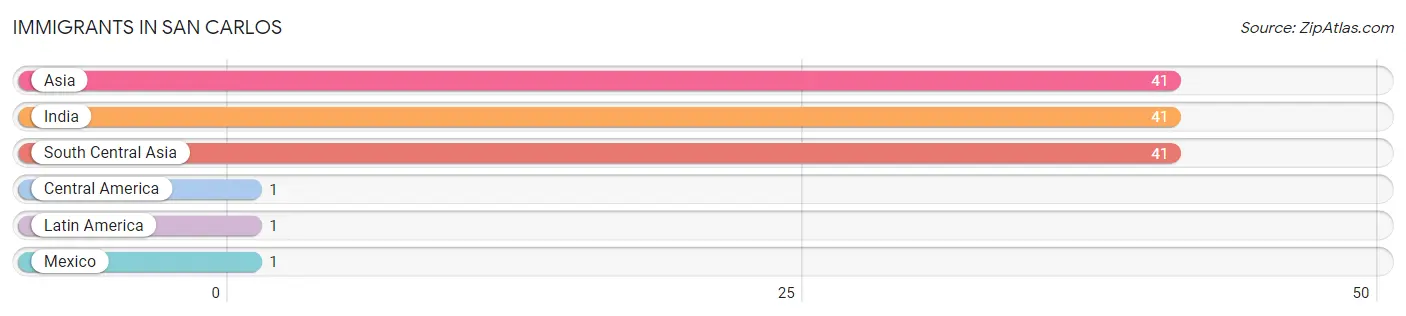
| Immigration Origin | # Population | % Population |
| Asia | 41 | 0.9% |
| Central America | 1 | 0.0% |
| India | 41 | 0.9% |
| Latin America | 1 | 0.0% |
| Mexico | 1 | 0.0% |
| South Central Asia | 41 | 0.9% | View All 6 Rows |
Sex and Age in San Carlos
Sex and Age in San Carlos
The most populous age groups in San Carlos are 5 to 9 Years (246 | 11.7%) for men and 10 to 14 Years (307 | 13.4%) for women.
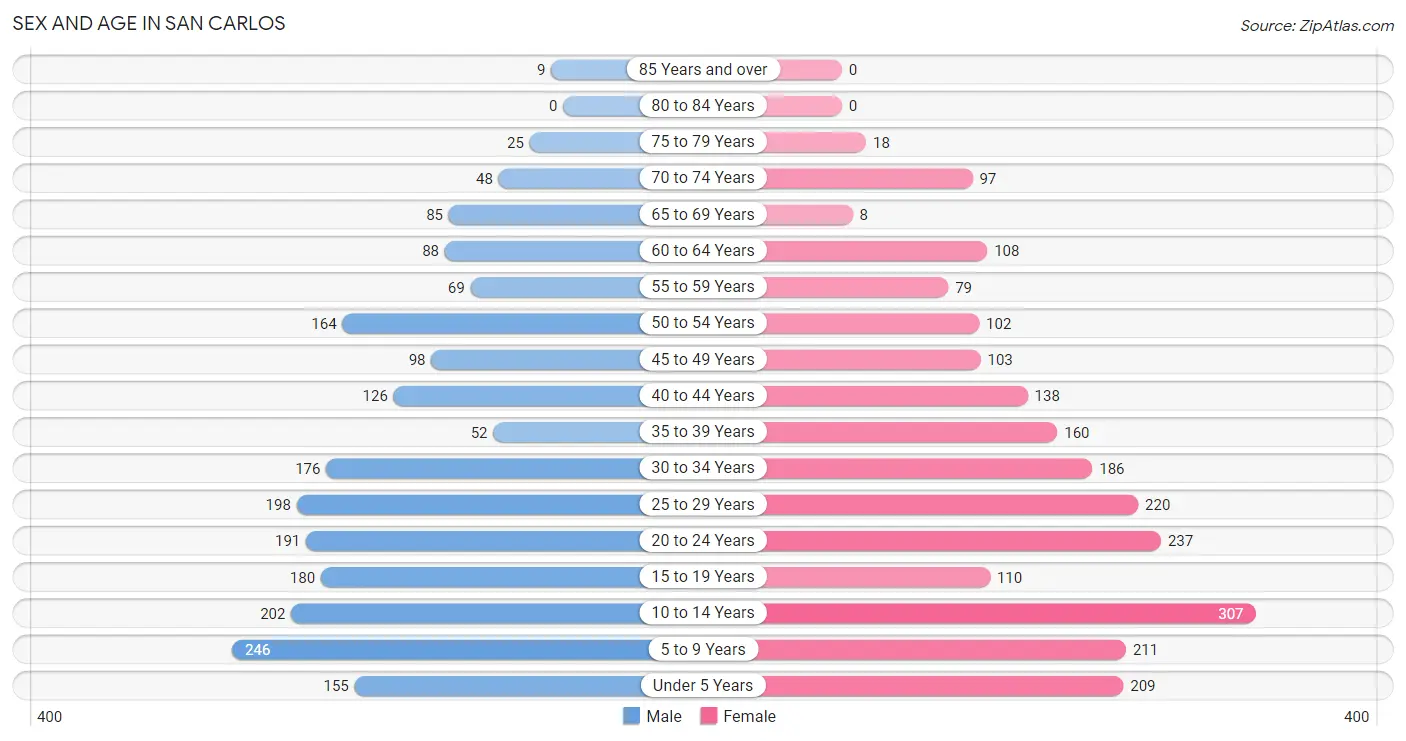
| Age Bracket | Male | Female |
| Under 5 Years | 155 (7.3%) | 209 (9.1%) |
| 5 to 9 Years | 246 (11.7%) | 211 (9.2%) |
| 10 to 14 Years | 202 (9.6%) | 307 (13.4%) |
| 15 to 19 Years | 180 (8.5%) | 110 (4.8%) |
| 20 to 24 Years | 191 (9.0%) | 237 (10.3%) |
| 25 to 29 Years | 198 (9.4%) | 220 (9.6%) |
| 30 to 34 Years | 176 (8.3%) | 186 (8.1%) |
| 35 to 39 Years | 52 (2.5%) | 160 (7.0%) |
| 40 to 44 Years | 126 (6.0%) | 138 (6.0%) |
| 45 to 49 Years | 98 (4.6%) | 103 (4.5%) |
| 50 to 54 Years | 164 (7.8%) | 102 (4.4%) |
| 55 to 59 Years | 69 (3.3%) | 79 (3.5%) |
| 60 to 64 Years | 88 (4.2%) | 108 (4.7%) |
| 65 to 69 Years | 85 (4.0%) | 8 (0.4%) |
| 70 to 74 Years | 48 (2.3%) | 97 (4.2%) |
| 75 to 79 Years | 25 (1.2%) | 18 (0.8%) |
| 80 to 84 Years | 0 (0.0%) | 0 (0.0%) |
| 85 Years and over | 9 (0.4%) | 0 (0.0%) |
| Total | 2,112 (100.0%) | 2,293 (100.0%) |
Families and Households in San Carlos
Median Family Size in San Carlos
The median family size in San Carlos is 4.33 persons per family, with married-couple families (330 | 36.8%) accounting for the largest median family size of 5.15 persons per family. On the other hand, single female/mother families (396 | 44.2%) represent the smallest median family size with 3.60 persons per family.
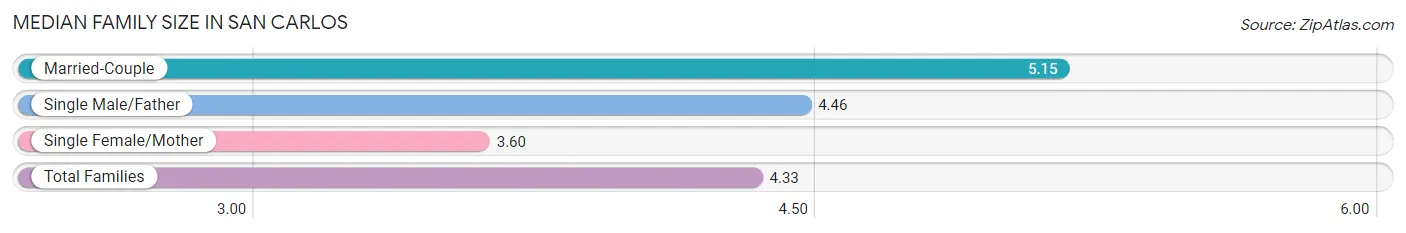
| Family Type | # Families | Family Size |
| Married-Couple | 330 (36.8%) | 5.15 |
| Single Male/Father | 171 (19.1%) | 4.46 |
| Single Female/Mother | 396 (44.2%) | 3.60 |
| Total Families | 897 (100.0%) | 4.33 |
Median Household Size in San Carlos
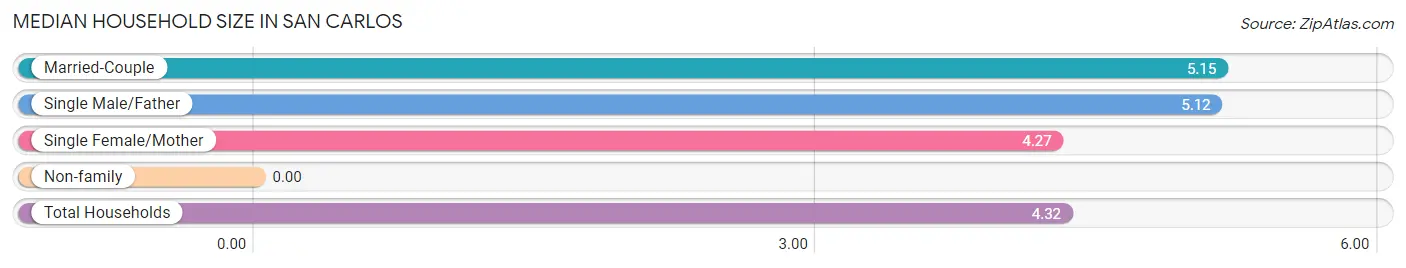
| Household Type | # Households | Household Size |
| Married-Couple | 330 (32.5%) | 5.15 |
| Single Male/Father | 171 (16.9%) | 5.12 |
| Single Female/Mother | 396 (39.1%) | 4.27 |
| Non-family | 117 (11.5%) | - |
| Total Households | 1,014 (100.0%) | 4.32 |
Household Size by Marriage Status in San Carlos
Out of a total of 1,014 households in San Carlos, 897 (88.5%) are family households, while 117 (11.5%) are nonfamily households. The most numerous type of family households are 6-person households, comprising 276, and the most common type of nonfamily households are 1-person households, comprising 117.
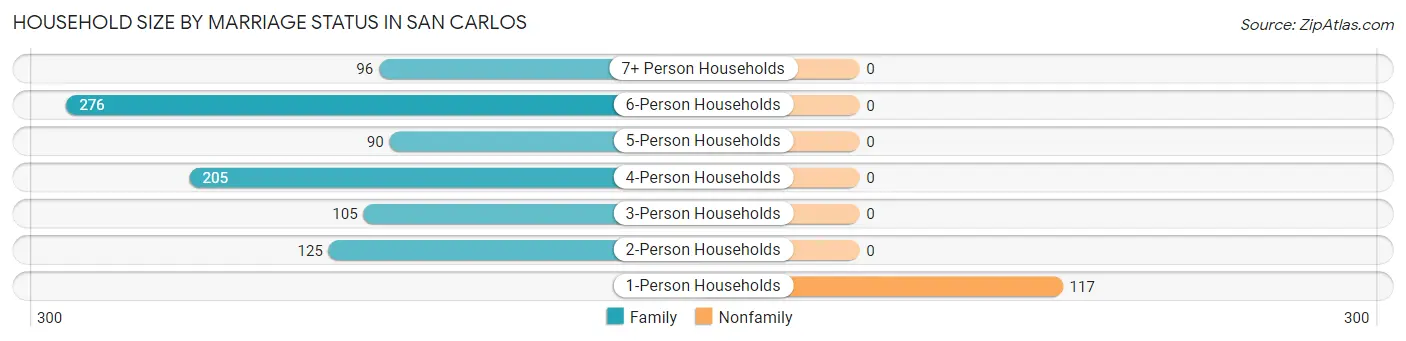
| Household Size | Family Households | Nonfamily Households |
| 1-Person Households | - | 117 (11.5%) |
| 2-Person Households | 125 (12.3%) | 0 (0.0%) |
| 3-Person Households | 105 (10.4%) | 0 (0.0%) |
| 4-Person Households | 205 (20.2%) | 0 (0.0%) |
| 5-Person Households | 90 (8.9%) | 0 (0.0%) |
| 6-Person Households | 276 (27.2%) | 0 (0.0%) |
| 7+ Person Households | 96 (9.5%) | 0 (0.0%) |
| Total | 897 (88.5%) | 117 (11.5%) |
Female Fertility in San Carlos
Fertility by Age in San Carlos
Average fertility rate in San Carlos is 60.0 births per 1,000 women. Women in the age bracket of 20 to 34 years have the highest fertility rate with 112.0 births per 1,000 women. Women in the age bracket of 20 to 34 years acount for 100.0% of all women with births.
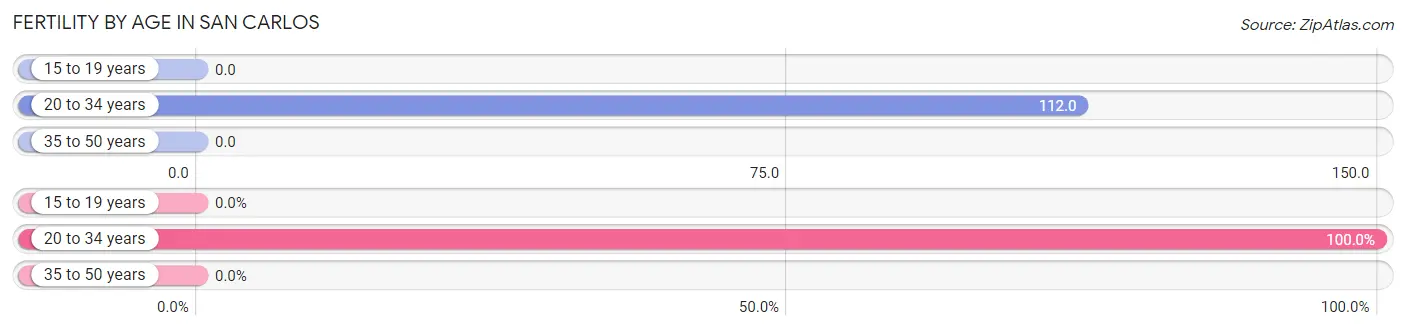
| Age Bracket | Women with Births | Births / 1,000 Women |
| 15 to 19 years | 0 (0.0%) | 0.0 |
| 20 to 34 years | 72 (100.0%) | 112.0 |
| 35 to 50 years | 0 (0.0%) | 0.0 |
| Total | 72 (100.0%) | 60.0 |
Fertility by Age by Marriage Status in San Carlos
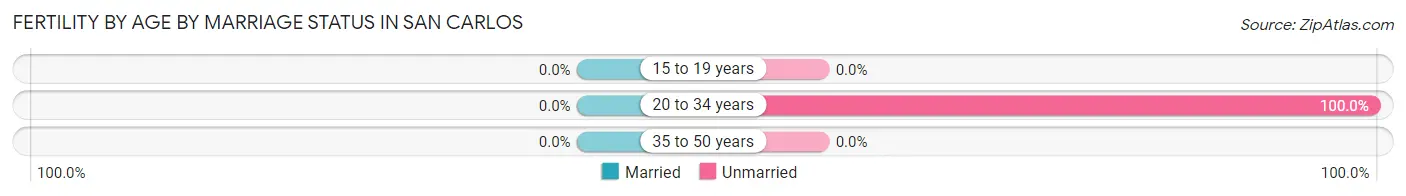
| Age Bracket | Married | Unmarried |
| 15 to 19 years | 0 (0.0%) | 0 (0.0%) |
| 20 to 34 years | 0 (0.0%) | 72 (100.0%) |
| 35 to 50 years | 0 (0.0%) | 0 (0.0%) |
| Total | 0 (0.0%) | 72 (100.0%) |
Fertility by Education in San Carlos
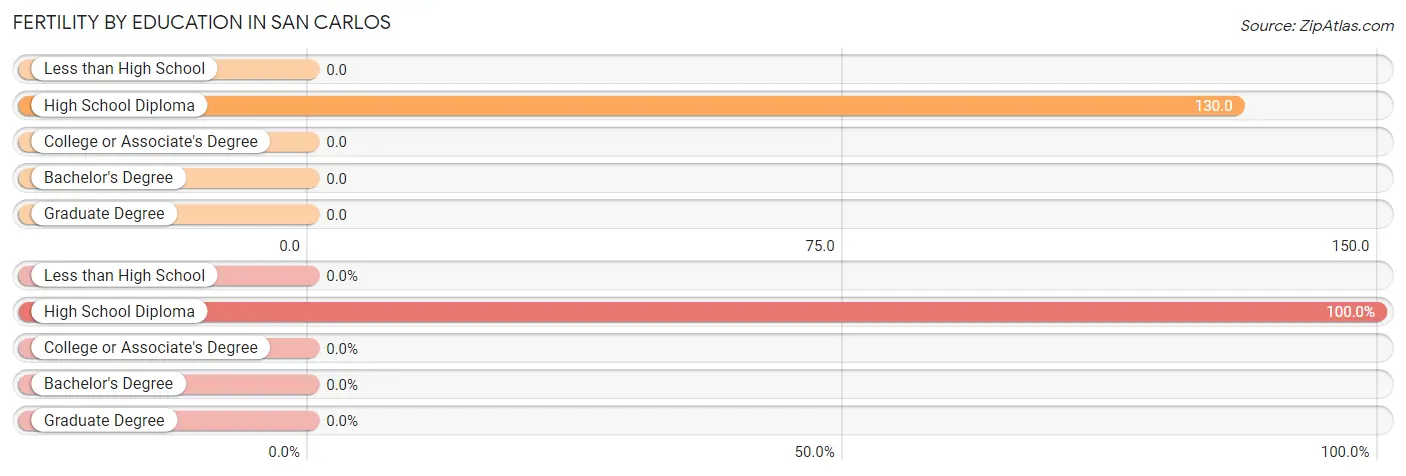
| Educational Attainment | Women with Births | Births / 1,000 Women |
| Less than High School | 0 (0.0%) | 0.0 |
| High School Diploma | 72 (100.0%) | 130.0 |
| College or Associate's Degree | 0 (0.0%) | 0.0 |
| Bachelor's Degree | 0 (0.0%) | 0.0 |
| Graduate Degree | 0 (0.0%) | 0.0 |
| Total | 72 (100.0%) | 60.0 |
Fertility by Education by Marriage Status in San Carlos
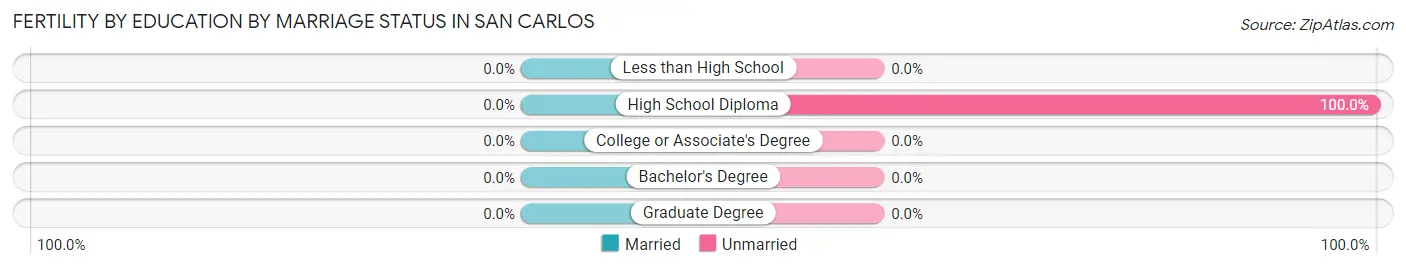
| Educational Attainment | Married | Unmarried |
| Less than High School | 0 (0.0%) | 0 (0.0%) |
| High School Diploma | 0 (0.0%) | 72 (100.0%) |
| College or Associate's Degree | 0 (0.0%) | 0 (0.0%) |
| Bachelor's Degree | 0 (0.0%) | 0 (0.0%) |
| Graduate Degree | 0 (0.0%) | 0 (0.0%) |
| Total | 0 (0.0%) | 72 (100.0%) |
Employment Characteristics in San Carlos
Employment by Class of Employer in San Carlos
Among the 1,133 employed individuals in San Carlos, private company employees (524 | 46.3%), local government employees (284 | 25.1%), and state government employees (249 | 22.0%) make up the most common classes of employment.
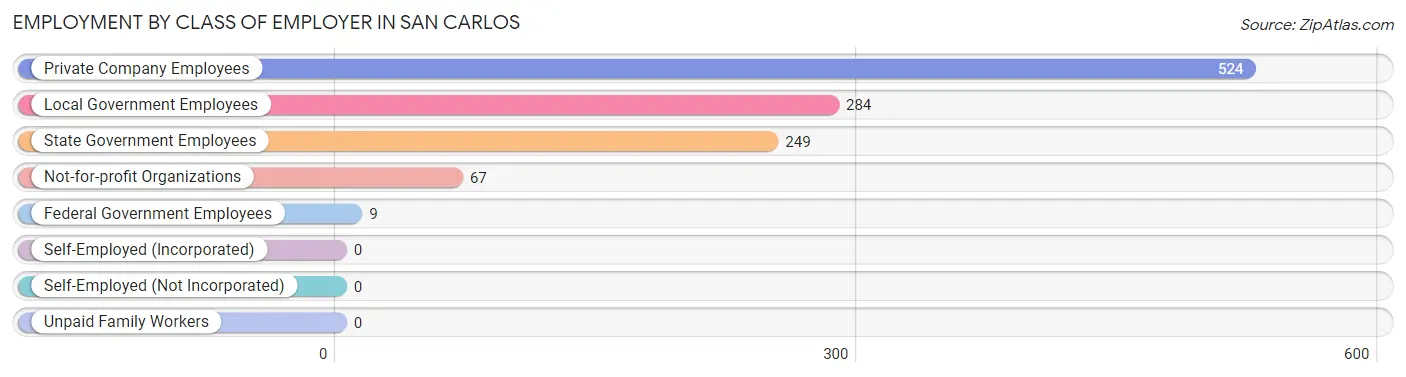
| Employer Class | # Employees | % Employees |
| Private Company Employees | 524 | 46.3% |
| Self-Employed (Incorporated) | 0 | 0.0% |
| Self-Employed (Not Incorporated) | 0 | 0.0% |
| Not-for-profit Organizations | 67 | 5.9% |
| Local Government Employees | 284 | 25.1% |
| State Government Employees | 249 | 22.0% |
| Federal Government Employees | 9 | 0.8% |
| Unpaid Family Workers | 0 | 0.0% |
| Total | 1,133 | 100.0% |
Employment Status by Age in San Carlos
According to the labor force statistics for San Carlos, out of the total population over 16 years of age (2,984), 49.7% or 1,483 individuals are in the labor force, with 19.6% or 291 of them unemployed. The age group with the highest labor force participation rate is 30 to 34 years, with 75.7% or 274 individuals in the labor force. Within the labor force, the 25 to 29 years age range has the highest percentage of unemployed individuals, with 40.2% or 125 of them being unemployed.
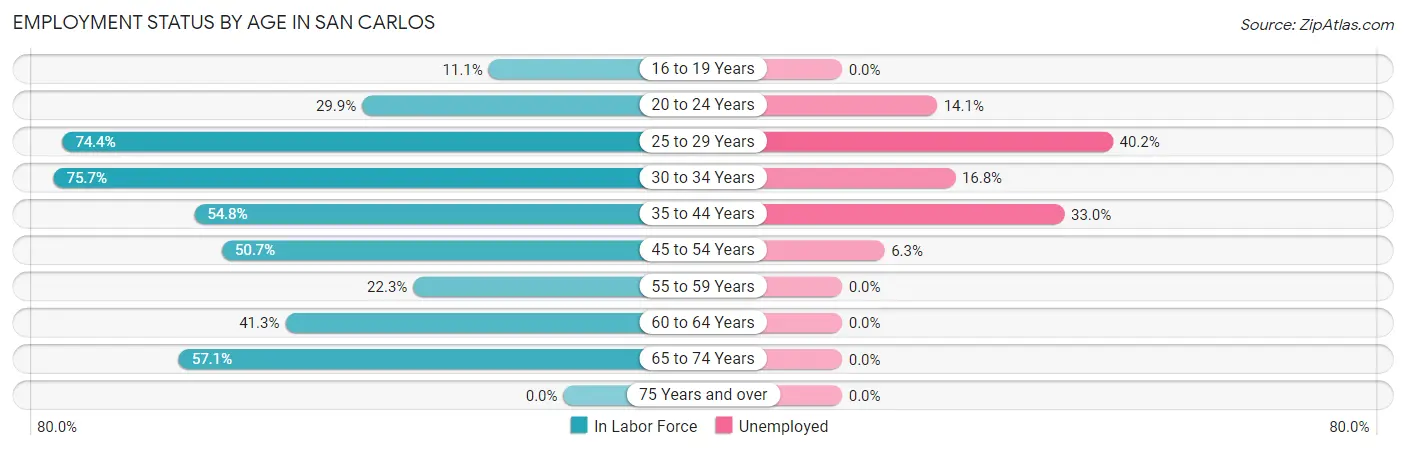
| Age Bracket | In Labor Force | Unemployed |
| 16 to 19 Years | 22 (11.1%) | 0 (0.0%) |
| 20 to 24 Years | 128 (29.9%) | 18 (14.1%) |
| 25 to 29 Years | 311 (74.4%) | 125 (40.2%) |
| 30 to 34 Years | 274 (75.7%) | 46 (16.8%) |
| 35 to 44 Years | 261 (54.8%) | 86 (33.0%) |
| 45 to 54 Years | 237 (50.7%) | 15 (6.3%) |
| 55 to 59 Years | 33 (22.3%) | 0 (0.0%) |
| 60 to 64 Years | 81 (41.3%) | 0 (0.0%) |
| 65 to 74 Years | 136 (57.1%) | 0 (0.0%) |
| 75 Years and over | 0 (0.0%) | 0 (0.0%) |
| Total | 1,483 (49.7%) | 291 (19.6%) |
Employment Status by Educational Attainment in San Carlos
According to labor force statistics for San Carlos, 57.9% of individuals (1,197) out of the total population between 25 and 64 years of age (2,067) are in the labor force, with 22.7% or 272 of them being unemployed. The group with the highest labor force participation rate are those with the educational attainment of bachelor's degree or higher, with 76.8% or 73 individuals in the labor force. Within the labor force, individuals with less than high school education have the highest percentage of unemployment, with 56.7% or 115 of them being unemployed.
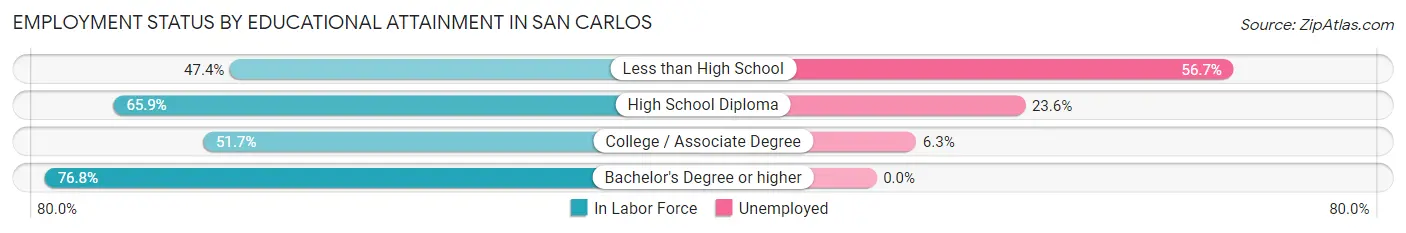
| Educational Attainment | In Labor Force | Unemployed |
| Less than High School | 203 (47.4%) | 243 (56.7%) |
| High School Diploma | 571 (65.9%) | 205 (23.6%) |
| College / Associate Degree | 350 (51.7%) | 43 (6.3%) |
| Bachelor's Degree or higher | 73 (76.8%) | 0 (0.0%) |
| Total | 1,197 (57.9%) | 469 (22.7%) |
Employment Occupations by Sex in San Carlos
Management, Business, Science and Arts Occupations
The most common Management, Business, Science and Arts occupations in San Carlos are Community & Social Service (109 | 9.1%), Management (98 | 8.2%), Education Instruction & Library (83 | 7.0%), Arts, Media & Entertainment (24 | 2.0%), and Business & Financial (15 | 1.3%).
Management, Business, Science and Arts Occupations by Sex
Within the Management, Business, Science and Arts occupations in San Carlos, the most male-oriented occupations are Computers, Engineering & Science (100.0%), Architecture & Engineering (100.0%), and Education, Arts & Media (100.0%), while the most female-oriented occupations are Business & Financial (100.0%), Arts, Media & Entertainment (100.0%), and Health Diagnosing & Treating (100.0%).
| Occupation | Male | Female |
| Management | 43 (43.9%) | 55 (56.1%) |
| Business & Financial | 0 (0.0%) | 15 (100.0%) |
| Computers, Engineering & Science | 12 (100.0%) | 0 (0.0%) |
| Computers & Mathematics | 0 (0.0%) | 0 (0.0%) |
| Architecture & Engineering | 12 (100.0%) | 0 (0.0%) |
| Life, Physical & Social Science | 0 (0.0%) | 0 (0.0%) |
| Community & Social Service | 21 (19.3%) | 88 (80.7%) |
| Education, Arts & Media | 2 (100.0%) | 0 (0.0%) |
| Legal Services & Support | 0 (0.0%) | 0 (0.0%) |
| Education Instruction & Library | 19 (22.9%) | 64 (77.1%) |
| Arts, Media & Entertainment | 0 (0.0%) | 24 (100.0%) |
| Health Diagnosing & Treating | 0 (0.0%) | 12 (100.0%) |
| Health Technologists | 0 (0.0%) | 12 (100.0%) |
| Total (Category) | 76 (30.9%) | 170 (69.1%) |
| Total (Overall) | 469 (39.3%) | 724 (60.7%) |
Services Occupations
The most common Services occupations in San Carlos are Security & Protection (192 | 16.1%), Firefighting & Prevention (192 | 16.1%), Cleaning & Maintenance (152 | 12.7%), Food Preparation & Serving (63 | 5.3%), and Personal Care & Service (44 | 3.7%).
Services Occupations by Sex
Within the Services occupations in San Carlos, the most male-oriented occupations are Security & Protection (58.9%), Firefighting & Prevention (58.9%), and Cleaning & Maintenance (35.5%), while the most female-oriented occupations are Healthcare Support (100.0%), Personal Care & Service (100.0%), and Food Preparation & Serving (74.6%).
| Occupation | Male | Female |
| Healthcare Support | 0 (0.0%) | 27 (100.0%) |
| Security & Protection | 113 (58.9%) | 79 (41.1%) |
| Firefighting & Prevention | 113 (58.9%) | 79 (41.1%) |
| Law Enforcement | 0 (0.0%) | 0 (0.0%) |
| Food Preparation & Serving | 16 (25.4%) | 47 (74.6%) |
| Cleaning & Maintenance | 54 (35.5%) | 98 (64.5%) |
| Personal Care & Service | 0 (0.0%) | 44 (100.0%) |
| Total (Category) | 183 (38.3%) | 295 (61.7%) |
| Total (Overall) | 469 (39.3%) | 724 (60.7%) |
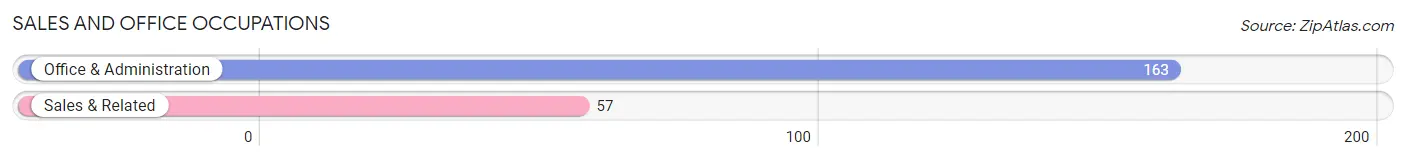
Sales and Office Occupations
The most common Sales and Office occupations in San Carlos are Office & Administration (163 | 13.7%), and Sales & Related (57 | 4.8%).
Sales and Office Occupations by Sex
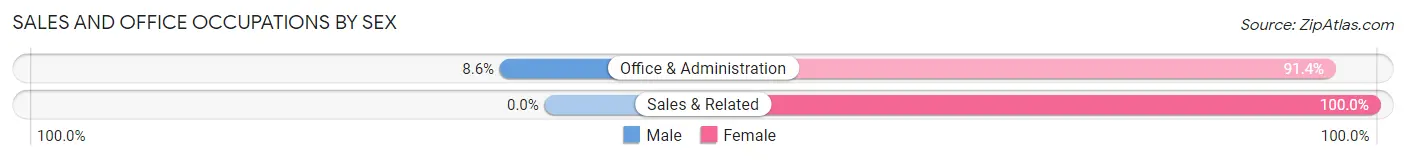
| Occupation | Male | Female |
| Sales & Related | 0 (0.0%) | 57 (100.0%) |
| Office & Administration | 14 (8.6%) | 149 (91.4%) |
| Total (Category) | 14 (6.4%) | 206 (93.6%) |
| Total (Overall) | 469 (39.3%) | 724 (60.7%) |
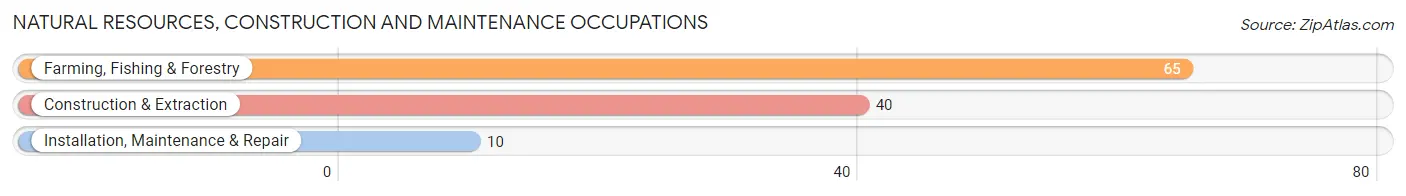
Natural Resources, Construction and Maintenance Occupations
The most common Natural Resources, Construction and Maintenance occupations in San Carlos are Farming, Fishing & Forestry (65 | 5.4%), Construction & Extraction (40 | 3.4%), and Installation, Maintenance & Repair (10 | 0.8%).
Natural Resources, Construction and Maintenance Occupations by Sex
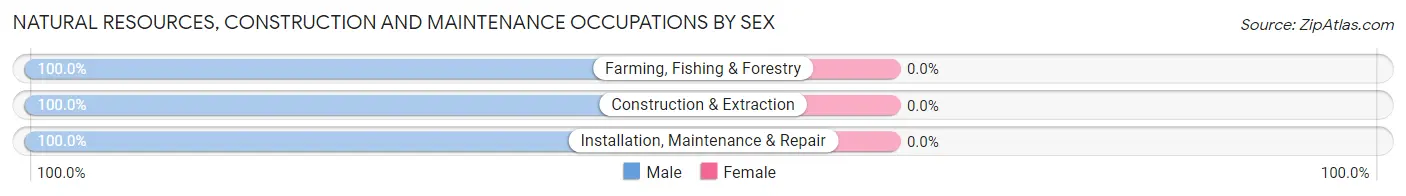
| Occupation | Male | Female |
| Farming, Fishing & Forestry | 65 (100.0%) | 0 (0.0%) |
| Construction & Extraction | 40 (100.0%) | 0 (0.0%) |
| Installation, Maintenance & Repair | 10 (100.0%) | 0 (0.0%) |
| Total (Category) | 115 (100.0%) | 0 (0.0%) |
| Total (Overall) | 469 (39.3%) | 724 (60.7%) |
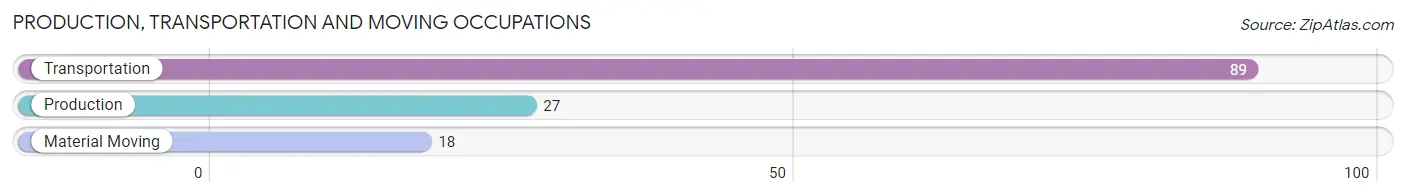
Production, Transportation and Moving Occupations
The most common Production, Transportation and Moving occupations in San Carlos are Transportation (89 | 7.5%), Production (27 | 2.3%), and Material Moving (18 | 1.5%).
Production, Transportation and Moving Occupations by Sex
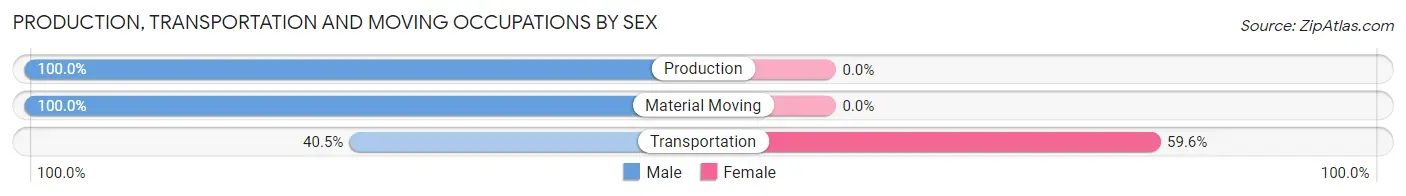
| Occupation | Male | Female |
| Production | 27 (100.0%) | 0 (0.0%) |
| Transportation | 36 (40.5%) | 53 (59.6%) |
| Material Moving | 18 (100.0%) | 0 (0.0%) |
| Total (Category) | 81 (60.5%) | 53 (39.6%) |
| Total (Overall) | 469 (39.3%) | 724 (60.7%) |
Employment Industries by Sex in San Carlos
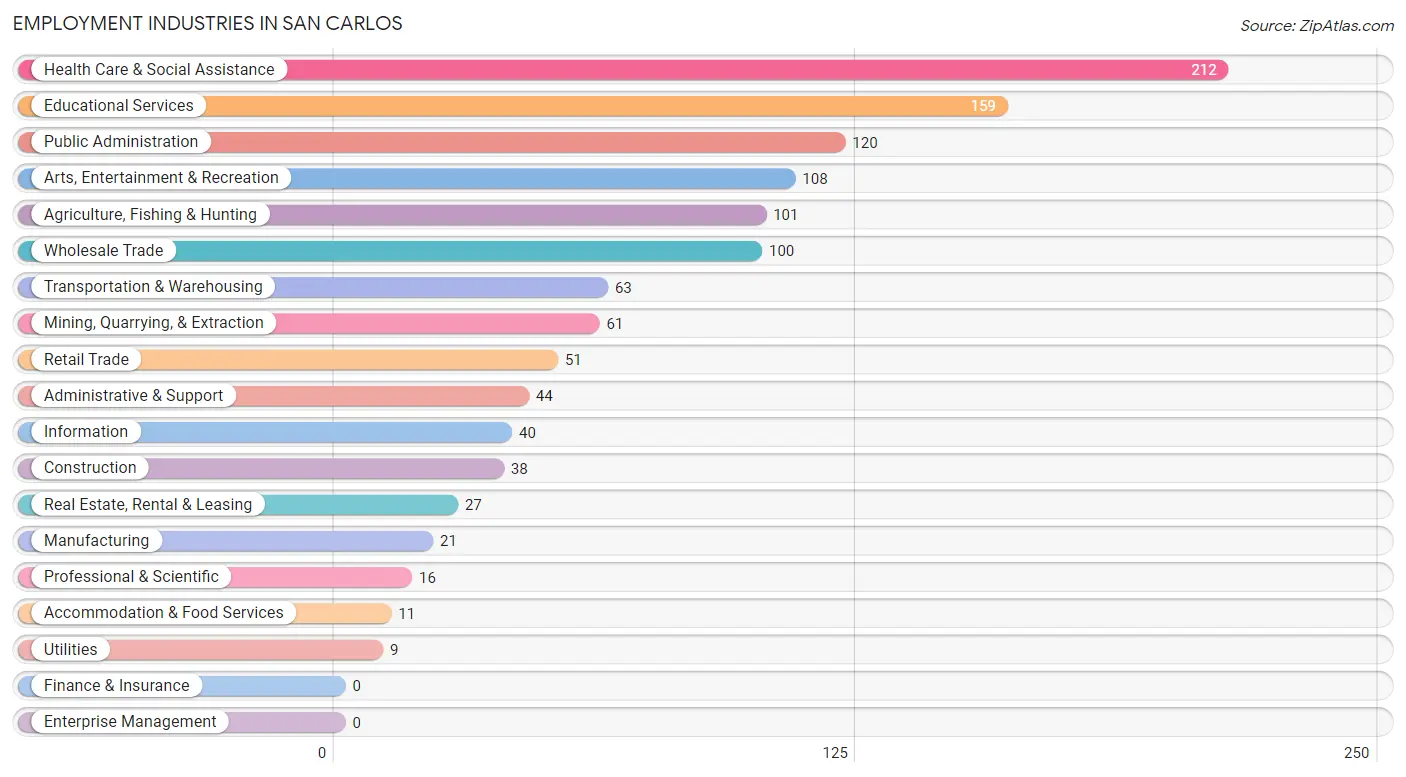
Employment Industries in San Carlos
The major employment industries in San Carlos include Health Care & Social Assistance (212 | 17.8%), Educational Services (159 | 13.3%), Public Administration (120 | 10.1%), Arts, Entertainment & Recreation (108 | 9.0%), and Agriculture, Fishing & Hunting (101 | 8.5%).
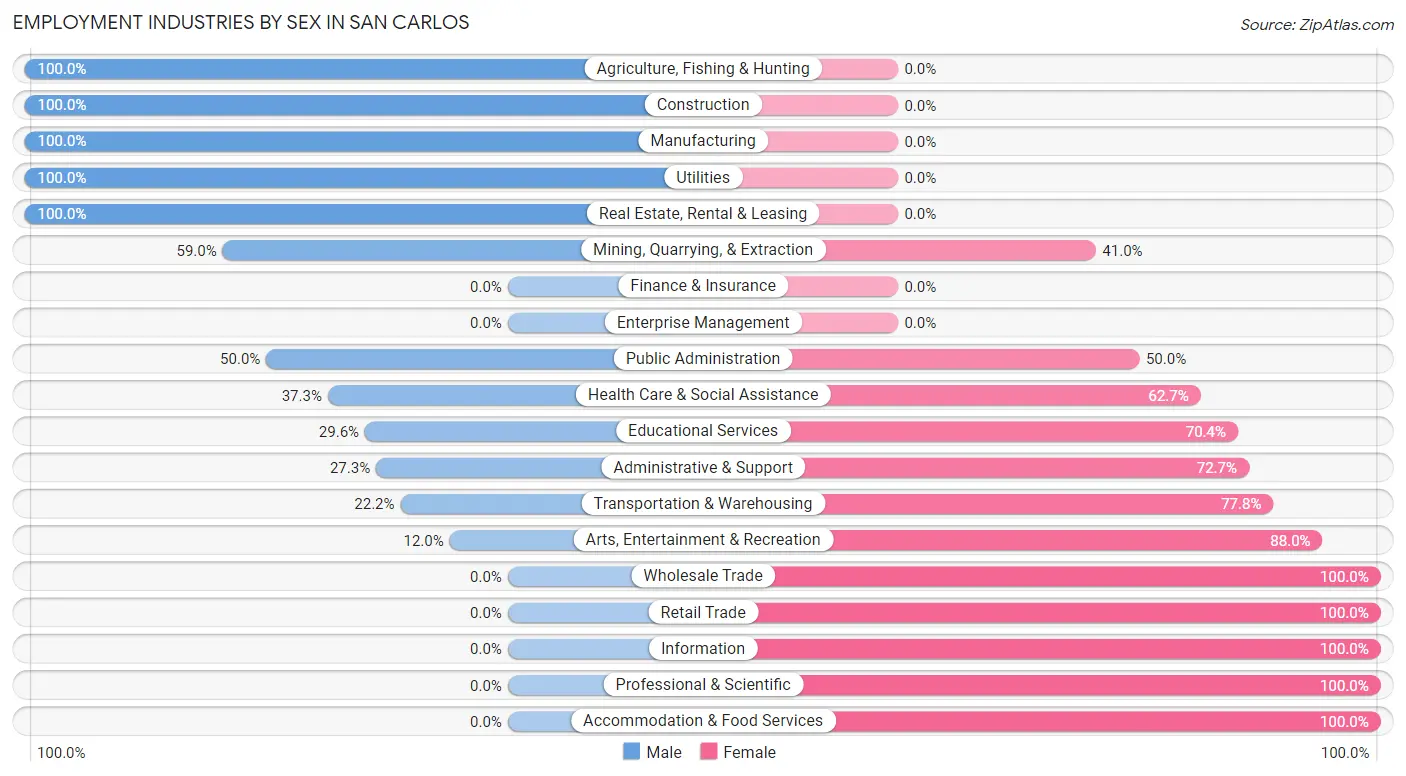
Employment Industries by Sex in San Carlos
The San Carlos industries that see more men than women are Agriculture, Fishing & Hunting (100.0%), Construction (100.0%), and Manufacturing (100.0%), whereas the industries that tend to have a higher number of women are Wholesale Trade (100.0%), Retail Trade (100.0%), and Information (100.0%).
| Industry | Male | Female |
| Agriculture, Fishing & Hunting | 101 (100.0%) | 0 (0.0%) |
| Mining, Quarrying, & Extraction | 36 (59.0%) | 25 (41.0%) |
| Construction | 38 (100.0%) | 0 (0.0%) |
| Manufacturing | 21 (100.0%) | 0 (0.0%) |
| Wholesale Trade | 0 (0.0%) | 100 (100.0%) |
| Retail Trade | 0 (0.0%) | 51 (100.0%) |
| Transportation & Warehousing | 14 (22.2%) | 49 (77.8%) |
| Utilities | 9 (100.0%) | 0 (0.0%) |
| Information | 0 (0.0%) | 40 (100.0%) |
| Finance & Insurance | 0 (0.0%) | 0 (0.0%) |
| Real Estate, Rental & Leasing | 27 (100.0%) | 0 (0.0%) |
| Professional & Scientific | 0 (0.0%) | 16 (100.0%) |
| Enterprise Management | 0 (0.0%) | 0 (0.0%) |
| Administrative & Support | 12 (27.3%) | 32 (72.7%) |
| Educational Services | 47 (29.6%) | 112 (70.4%) |
| Health Care & Social Assistance | 79 (37.3%) | 133 (62.7%) |
| Arts, Entertainment & Recreation | 13 (12.0%) | 95 (88.0%) |
| Accommodation & Food Services | 0 (0.0%) | 11 (100.0%) |
| Public Administration | 60 (50.0%) | 60 (50.0%) |
| Total | 469 (39.3%) | 724 (60.7%) |
Education in San Carlos
School Enrollment in San Carlos
The most common levels of schooling among the 1,313 students in San Carlos are middle school (409 | 31.1%), elementary school (380 | 28.9%), and high school (212 | 16.2%).
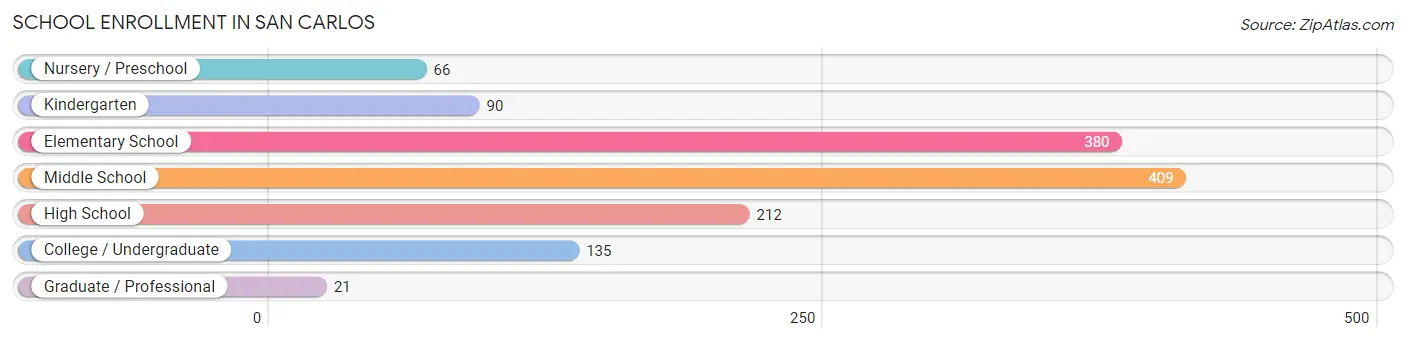
| School Level | # Students | % Students |
| Nursery / Preschool | 66 | 5.0% |
| Kindergarten | 90 | 6.9% |
| Elementary School | 380 | 28.9% |
| Middle School | 409 | 31.1% |
| High School | 212 | 16.2% |
| College / Undergraduate | 135 | 10.3% |
| Graduate / Professional | 21 | 1.6% |
| Total | 1,313 | 100.0% |
School Enrollment by Age by Funding Source in San Carlos
Out of a total of 1,313 students who are enrolled in schools in San Carlos, 106 (8.1%) attend a private institution, while the remaining 1,207 (91.9%) are enrolled in public schools. The age group of 35 years and over has the highest likelihood of being enrolled in private schools, with 17 (36.2% in the age bracket) enrolled. Conversely, the age group of 3 to 4 year olds has the lowest likelihood of being enrolled in a private school, with 66 (100.0% in the age bracket) attending a public institution.
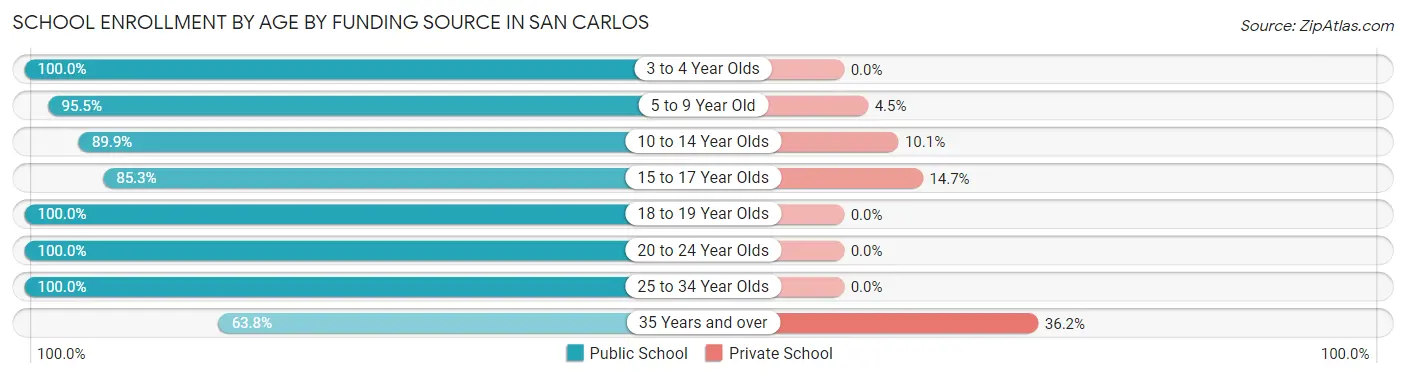
| Age Bracket | Public School | Private School |
| 3 to 4 Year Olds | 66 (100.0%) | 0 (0.0%) |
| 5 to 9 Year Old | 384 (95.5%) | 18 (4.5%) |
| 10 to 14 Year Olds | 444 (89.9%) | 50 (10.1%) |
| 15 to 17 Year Olds | 128 (85.3%) | 22 (14.7%) |
| 18 to 19 Year Olds | 57 (100.0%) | 0 (0.0%) |
| 20 to 24 Year Olds | 40 (100.0%) | 0 (0.0%) |
| 25 to 34 Year Olds | 57 (100.0%) | 0 (0.0%) |
| 35 Years and over | 30 (63.8%) | 17 (36.2%) |
| Total | 1,207 (91.9%) | 106 (8.1%) |
Educational Attainment by Field of Study in San Carlos
Education (53 | 32.7%), computers & mathematics (22 | 13.6%), social sciences (20 | 12.3%), communications (20 | 12.3%), and engineering (19 | 11.7%) are the most common fields of study among 162 individuals in San Carlos who have obtained a bachelor's degree or higher.
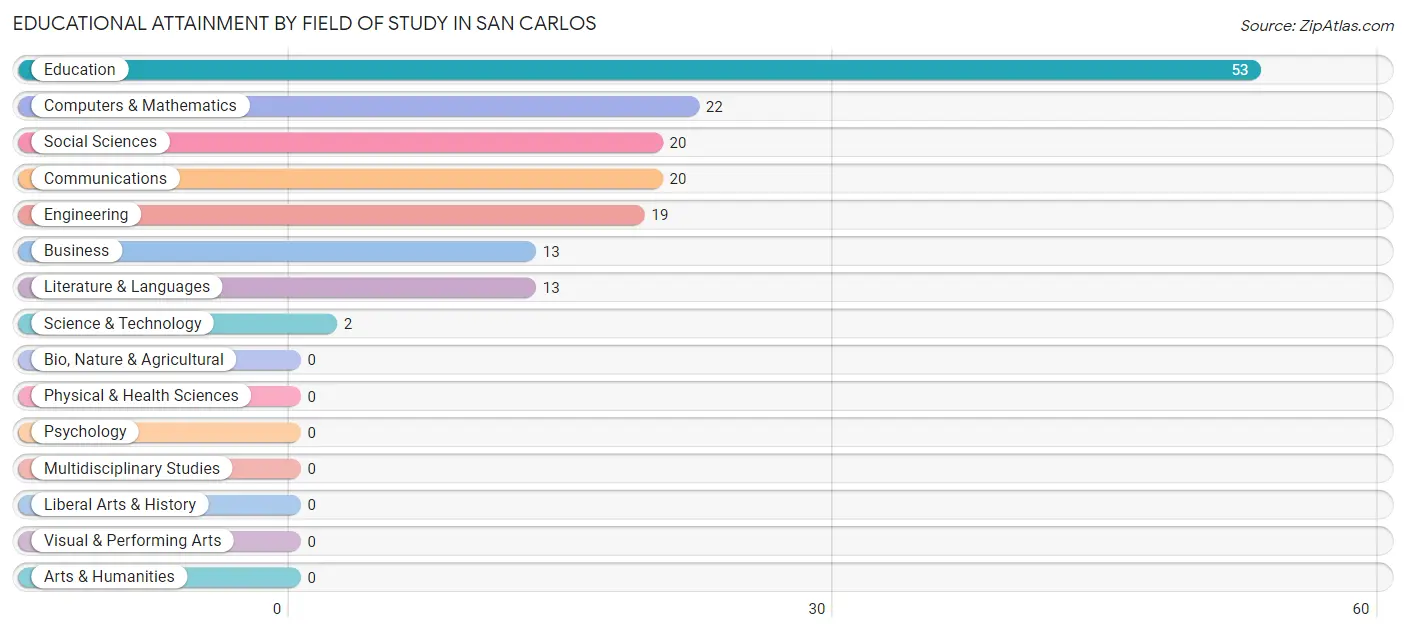
| Field of Study | # Graduates | % Graduates |
| Computers & Mathematics | 22 | 13.6% |
| Bio, Nature & Agricultural | 0 | 0.0% |
| Physical & Health Sciences | 0 | 0.0% |
| Psychology | 0 | 0.0% |
| Social Sciences | 20 | 12.3% |
| Engineering | 19 | 11.7% |
| Multidisciplinary Studies | 0 | 0.0% |
| Science & Technology | 2 | 1.2% |
| Business | 13 | 8.0% |
| Education | 53 | 32.7% |
| Literature & Languages | 13 | 8.0% |
| Liberal Arts & History | 0 | 0.0% |
| Visual & Performing Arts | 0 | 0.0% |
| Communications | 20 | 12.3% |
| Arts & Humanities | 0 | 0.0% |
| Total | 162 | 100.0% |
Transportation & Commute in San Carlos
Vehicle Availability by Sex in San Carlos
The most prevalent vehicle ownership categories in San Carlos are males with 1 vehicle (201, accounting for 47.5%) and females with 1 vehicle (302, making up 28.4%).
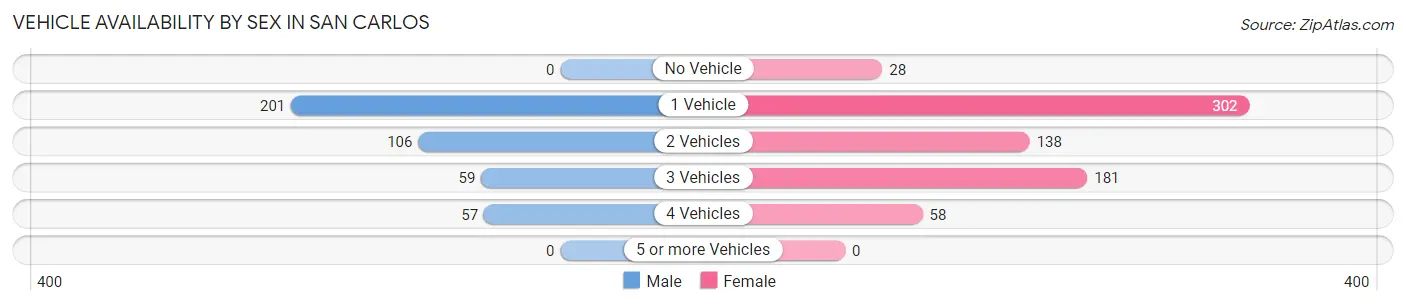
| Vehicles Available | Male | Female |
| No Vehicle | 0 (0.0%) | 28 (4.0%) |
| 1 Vehicle | 201 (47.5%) | 302 (42.7%) |
| 2 Vehicles | 106 (25.1%) | 138 (19.5%) |
| 3 Vehicles | 59 (14.0%) | 181 (25.6%) |
| 4 Vehicles | 57 (13.5%) | 58 (8.2%) |
| 5 or more Vehicles | 0 (0.0%) | 0 (0.0%) |
| Total | 423 (100.0%) | 707 (100.0%) |
Commute Time in San Carlos
The most frequently occuring commute durations in San Carlos are 30 to 34 minutes (243 commuters, 22.3%), 10 to 14 minutes (182 commuters, 16.7%), and 15 to 19 minutes (167 commuters, 15.3%).
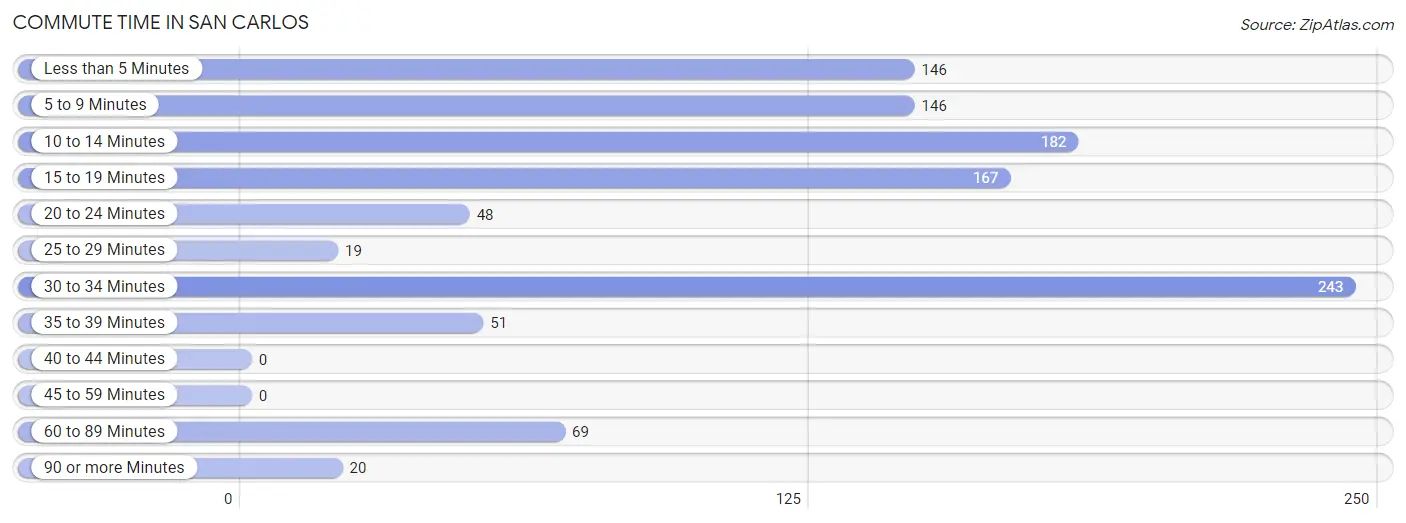
| Commute Time | # Commuters | % Commuters |
| Less than 5 Minutes | 146 | 13.4% |
| 5 to 9 Minutes | 146 | 13.4% |
| 10 to 14 Minutes | 182 | 16.7% |
| 15 to 19 Minutes | 167 | 15.3% |
| 20 to 24 Minutes | 48 | 4.4% |
| 25 to 29 Minutes | 19 | 1.7% |
| 30 to 34 Minutes | 243 | 22.3% |
| 35 to 39 Minutes | 51 | 4.7% |
| 40 to 44 Minutes | 0 | 0.0% |
| 45 to 59 Minutes | 0 | 0.0% |
| 60 to 89 Minutes | 69 | 6.3% |
| 90 or more Minutes | 20 | 1.8% |
Commute Time by Sex in San Carlos
The most common commute times in San Carlos are 15 to 19 minutes (96 commuters, 22.6%) for males and 30 to 34 minutes (207 commuters, 31.0%) for females.
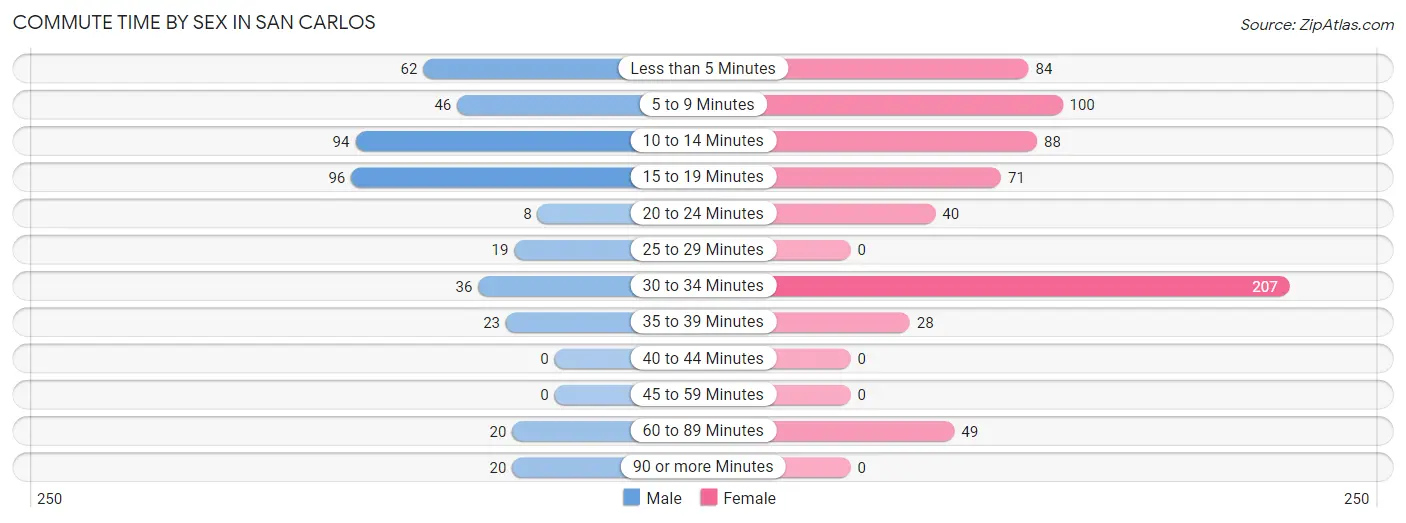
| Commute Time | Male | Female |
| Less than 5 Minutes | 62 (14.6%) | 84 (12.6%) |
| 5 to 9 Minutes | 46 (10.8%) | 100 (15.0%) |
| 10 to 14 Minutes | 94 (22.2%) | 88 (13.2%) |
| 15 to 19 Minutes | 96 (22.6%) | 71 (10.6%) |
| 20 to 24 Minutes | 8 (1.9%) | 40 (6.0%) |
| 25 to 29 Minutes | 19 (4.5%) | 0 (0.0%) |
| 30 to 34 Minutes | 36 (8.5%) | 207 (31.0%) |
| 35 to 39 Minutes | 23 (5.4%) | 28 (4.2%) |
| 40 to 44 Minutes | 0 (0.0%) | 0 (0.0%) |
| 45 to 59 Minutes | 0 (0.0%) | 0 (0.0%) |
| 60 to 89 Minutes | 20 (4.7%) | 49 (7.3%) |
| 90 or more Minutes | 20 (4.7%) | 0 (0.0%) |
Time of Departure to Work by Sex in San Carlos
The most frequent times of departure to work in San Carlos are 6:00 AM to 6:29 AM (106, 25.0%) for males and 7:00 AM to 7:29 AM (166, 24.9%) for females.
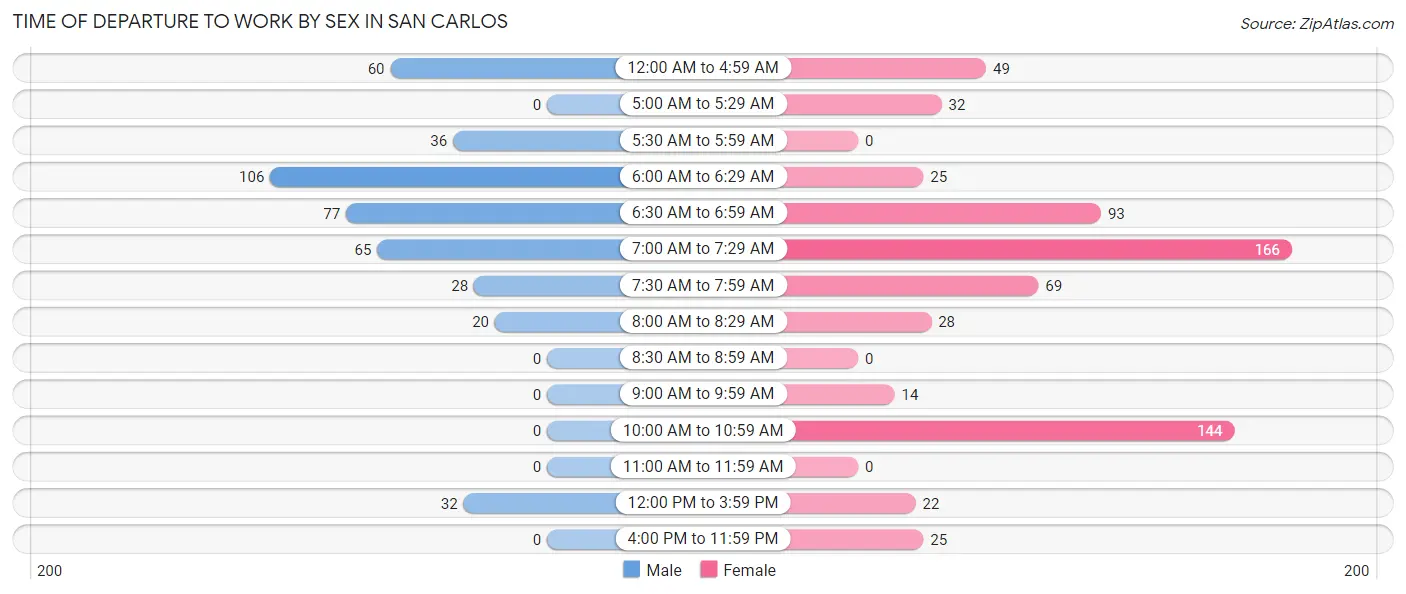
| Time of Departure | Male | Female |
| 12:00 AM to 4:59 AM | 60 (14.1%) | 49 (7.3%) |
| 5:00 AM to 5:29 AM | 0 (0.0%) | 32 (4.8%) |
| 5:30 AM to 5:59 AM | 36 (8.5%) | 0 (0.0%) |
| 6:00 AM to 6:29 AM | 106 (25.0%) | 25 (3.7%) |
| 6:30 AM to 6:59 AM | 77 (18.2%) | 93 (13.9%) |
| 7:00 AM to 7:29 AM | 65 (15.3%) | 166 (24.9%) |
| 7:30 AM to 7:59 AM | 28 (6.6%) | 69 (10.3%) |
| 8:00 AM to 8:29 AM | 20 (4.7%) | 28 (4.2%) |
| 8:30 AM to 8:59 AM | 0 (0.0%) | 0 (0.0%) |
| 9:00 AM to 9:59 AM | 0 (0.0%) | 14 (2.1%) |
| 10:00 AM to 10:59 AM | 0 (0.0%) | 144 (21.6%) |
| 11:00 AM to 11:59 AM | 0 (0.0%) | 0 (0.0%) |
| 12:00 PM to 3:59 PM | 32 (7.5%) | 22 (3.3%) |
| 4:00 PM to 11:59 PM | 0 (0.0%) | 25 (3.7%) |
| Total | 424 (100.0%) | 667 (100.0%) |
Housing Occupancy in San Carlos
Occupancy by Ownership in San Carlos
Of the total 1,014 dwellings in San Carlos, owner-occupied units account for 505 (49.8%), while renter-occupied units make up 509 (50.2%).
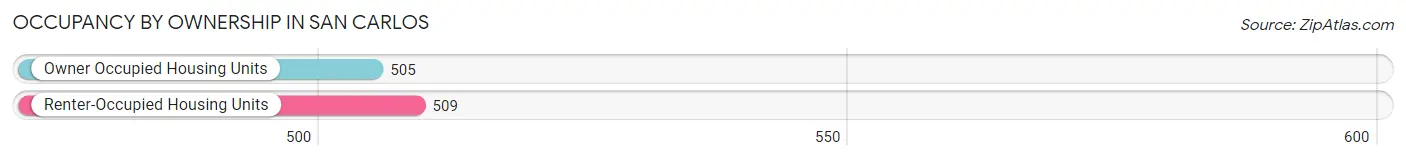
| Occupancy | # Housing Units | % Housing Units |
| Owner Occupied Housing Units | 505 | 49.8% |
| Renter-Occupied Housing Units | 509 | 50.2% |
| Total Occupied Housing Units | 1,014 | 100.0% |
Occupancy by Household Size in San Carlos
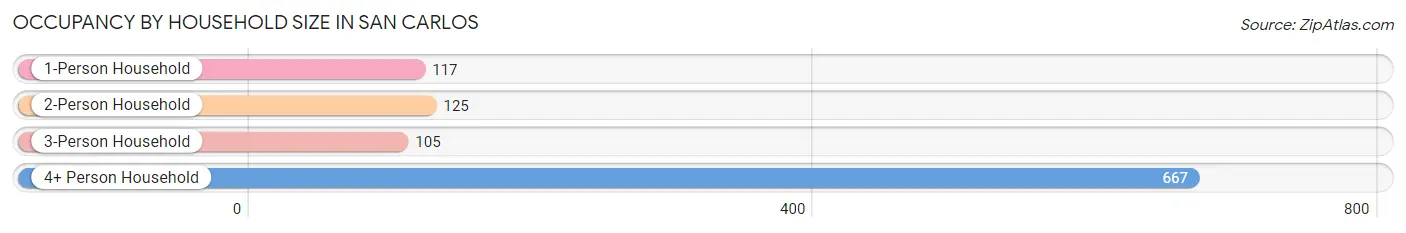
| Household Size | # Housing Units | % Housing Units |
| 1-Person Household | 117 | 11.5% |
| 2-Person Household | 125 | 12.3% |
| 3-Person Household | 105 | 10.4% |
| 4+ Person Household | 667 | 65.8% |
| Total Housing Units | 1,014 | 100.0% |
Occupancy by Ownership by Household Size in San Carlos
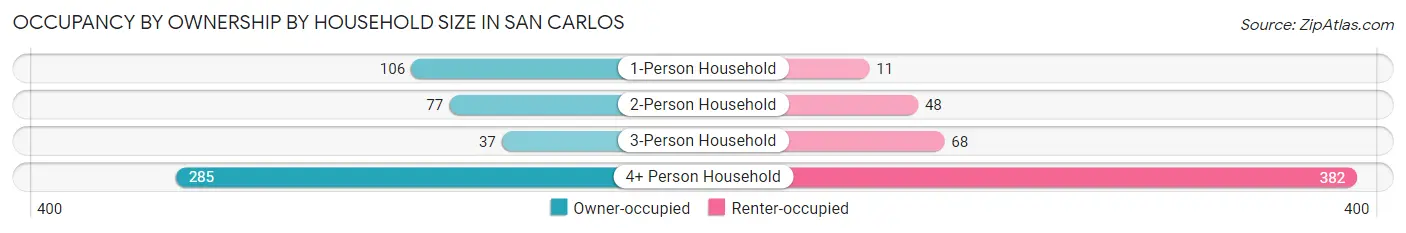
| Household Size | Owner-occupied | Renter-occupied |
| 1-Person Household | 106 (90.6%) | 11 (9.4%) |
| 2-Person Household | 77 (61.6%) | 48 (38.4%) |
| 3-Person Household | 37 (35.2%) | 68 (64.8%) |
| 4+ Person Household | 285 (42.7%) | 382 (57.3%) |
| Total Housing Units | 505 (49.8%) | 509 (50.2%) |
Occupancy by Educational Attainment in San Carlos
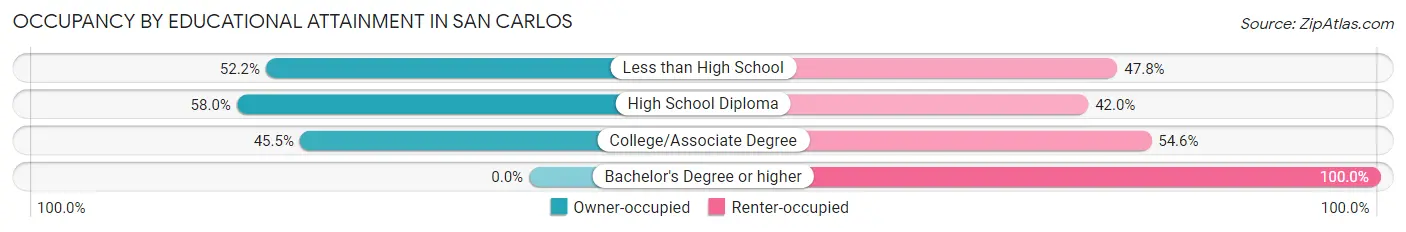
| Household Size | Owner-occupied | Renter-occupied |
| Less than High School | 108 (52.2%) | 99 (47.8%) |
| High School Diploma | 222 (58.0%) | 161 (42.0%) |
| College/Associate Degree | 175 (45.5%) | 210 (54.5%) |
| Bachelor's Degree or higher | 0 (0.0%) | 39 (100.0%) |
Occupancy by Age of Householder in San Carlos
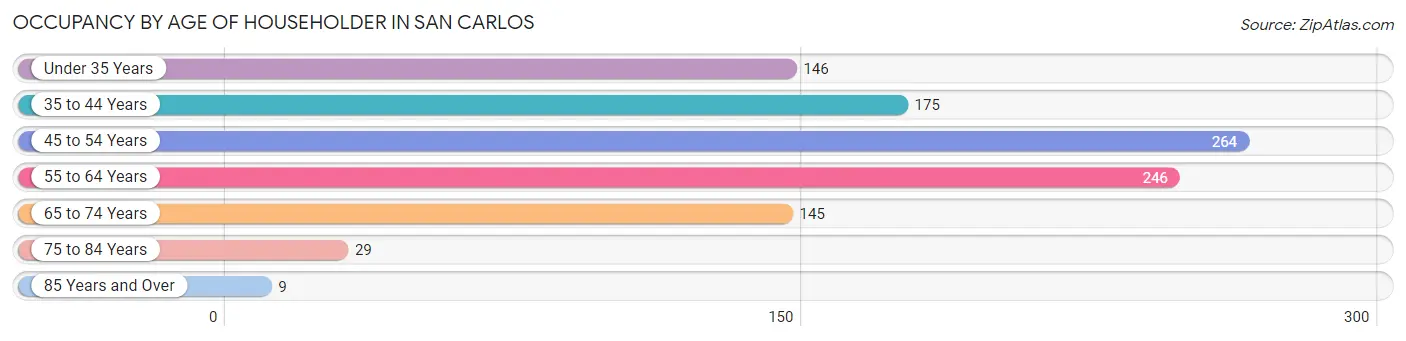
| Age Bracket | # Households | % Households |
| Under 35 Years | 146 | 14.4% |
| 35 to 44 Years | 175 | 17.3% |
| 45 to 54 Years | 264 | 26.0% |
| 55 to 64 Years | 246 | 24.3% |
| 65 to 74 Years | 145 | 14.3% |
| 75 to 84 Years | 29 | 2.9% |
| 85 Years and Over | 9 | 0.9% |
| Total | 1,014 | 100.0% |
Housing Finances in San Carlos
Median Income by Occupancy in San Carlos
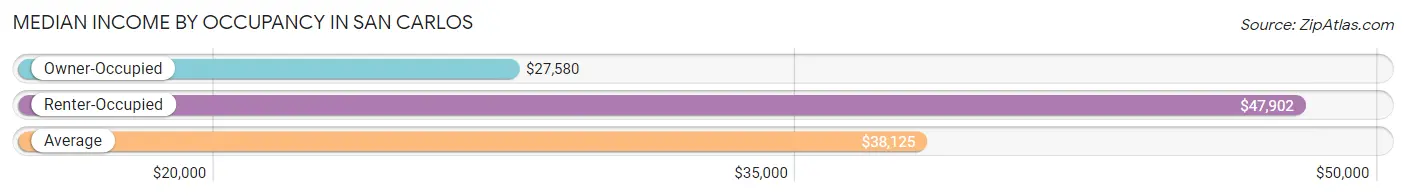
| Occupancy Type | # Households | Median Income |
| Owner-Occupied | 505 (49.8%) | $27,580 |
| Renter-Occupied | 509 (50.2%) | $47,902 |
| Average | 1,014 (100.0%) | $38,125 |
Occupancy by Householder Income Bracket in San Carlos
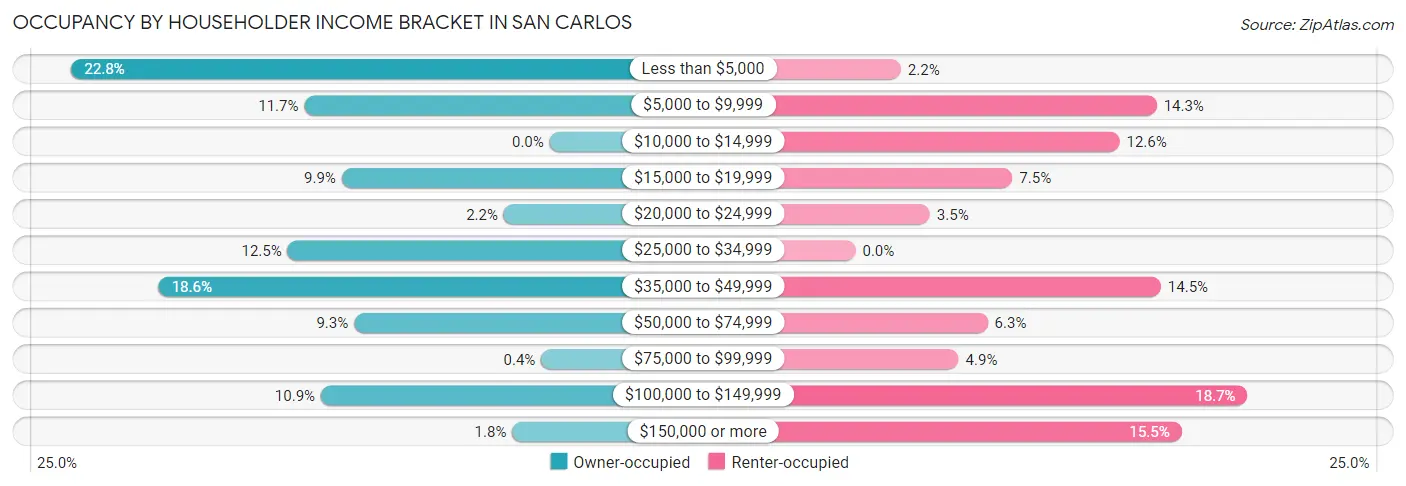
| Income Bracket | Owner-occupied | Renter-occupied |
| Less than $5,000 | 115 (22.8%) | 11 (2.2%) |
| $5,000 to $9,999 | 59 (11.7%) | 73 (14.3%) |
| $10,000 to $14,999 | 0 (0.0%) | 64 (12.6%) |
| $15,000 to $19,999 | 50 (9.9%) | 38 (7.5%) |
| $20,000 to $24,999 | 11 (2.2%) | 18 (3.5%) |
| $25,000 to $34,999 | 63 (12.5%) | 0 (0.0%) |
| $35,000 to $49,999 | 94 (18.6%) | 74 (14.5%) |
| $50,000 to $74,999 | 47 (9.3%) | 32 (6.3%) |
| $75,000 to $99,999 | 2 (0.4%) | 25 (4.9%) |
| $100,000 to $149,999 | 55 (10.9%) | 95 (18.7%) |
| $150,000 or more | 9 (1.8%) | 79 (15.5%) |
| Total | 505 (100.0%) | 509 (100.0%) |
Monthly Housing Cost Tiers in San Carlos
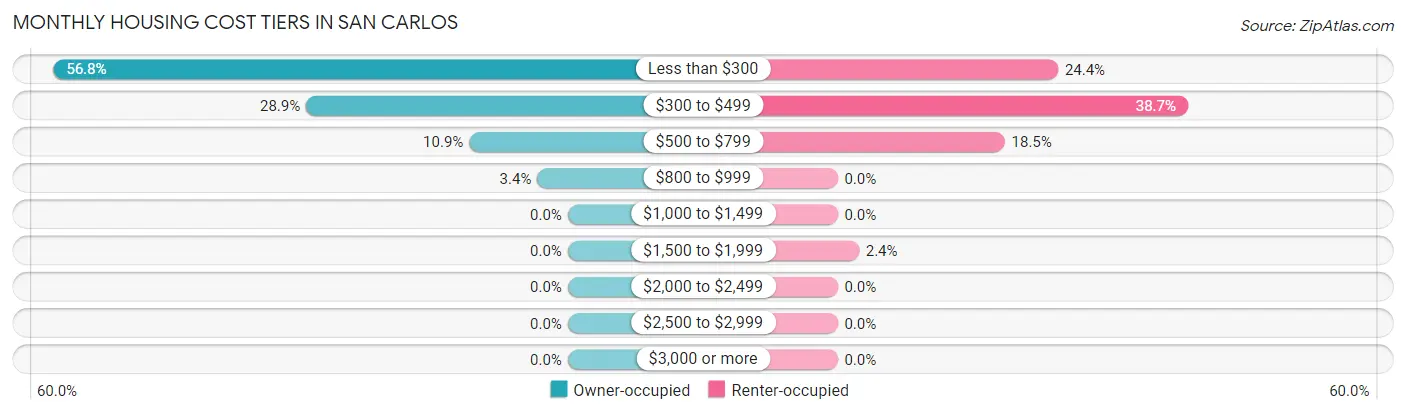
| Monthly Cost | Owner-occupied | Renter-occupied |
| Less than $300 | 287 (56.8%) | 124 (24.4%) |
| $300 to $499 | 146 (28.9%) | 197 (38.7%) |
| $500 to $799 | 55 (10.9%) | 94 (18.5%) |
| $800 to $999 | 17 (3.4%) | 0 (0.0%) |
| $1,000 to $1,499 | 0 (0.0%) | 0 (0.0%) |
| $1,500 to $1,999 | 0 (0.0%) | 12 (2.4%) |
| $2,000 to $2,499 | 0 (0.0%) | 0 (0.0%) |
| $2,500 to $2,999 | 0 (0.0%) | 0 (0.0%) |
| $3,000 or more | 0 (0.0%) | 0 (0.0%) |
| Total | 505 (100.0%) | 509 (100.0%) |
Physical Housing Characteristics in San Carlos
Housing Structures in San Carlos
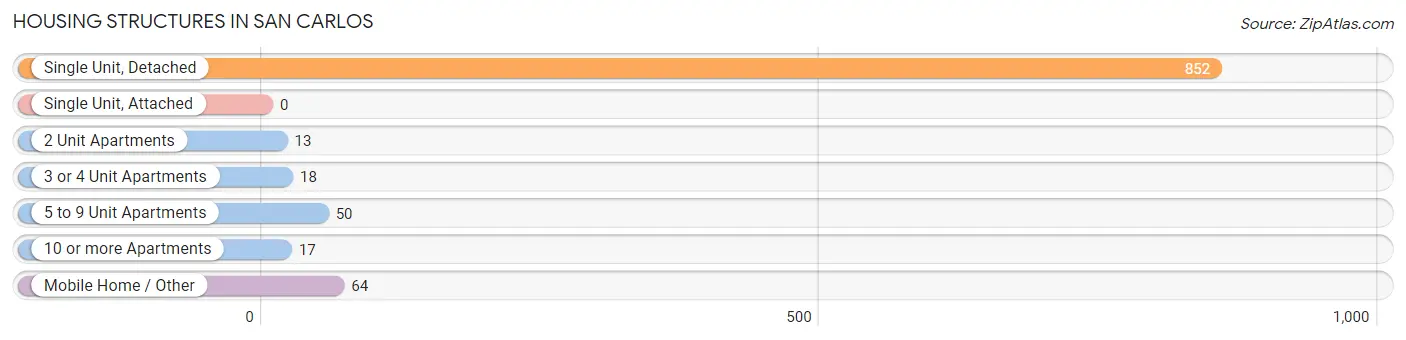
| Structure Type | # Housing Units | % Housing Units |
| Single Unit, Detached | 852 | 84.0% |
| Single Unit, Attached | 0 | 0.0% |
| 2 Unit Apartments | 13 | 1.3% |
| 3 or 4 Unit Apartments | 18 | 1.8% |
| 5 to 9 Unit Apartments | 50 | 4.9% |
| 10 or more Apartments | 17 | 1.7% |
| Mobile Home / Other | 64 | 6.3% |
| Total | 1,014 | 100.0% |
Housing Structures by Occupancy in San Carlos
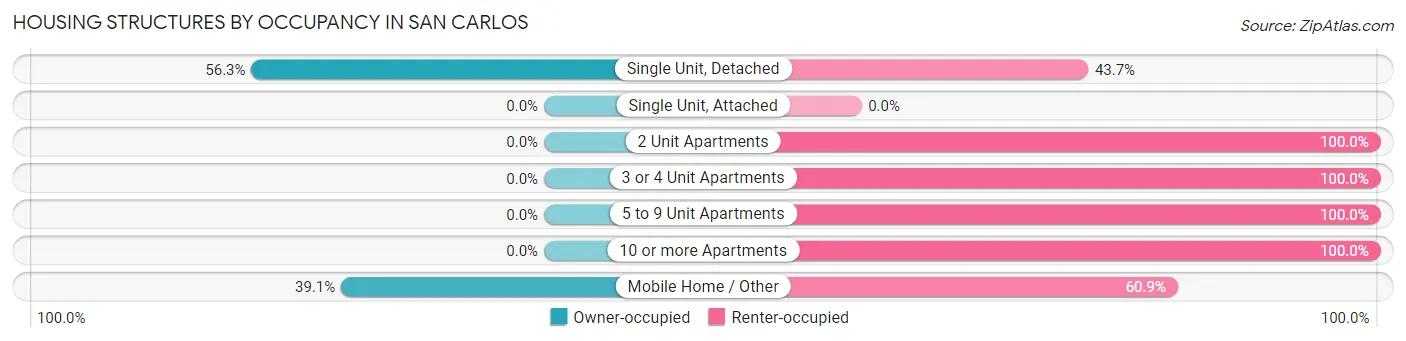
| Structure Type | Owner-occupied | Renter-occupied |
| Single Unit, Detached | 480 (56.3%) | 372 (43.7%) |
| Single Unit, Attached | 0 (0.0%) | 0 (0.0%) |
| 2 Unit Apartments | 0 (0.0%) | 13 (100.0%) |
| 3 or 4 Unit Apartments | 0 (0.0%) | 18 (100.0%) |
| 5 to 9 Unit Apartments | 0 (0.0%) | 50 (100.0%) |
| 10 or more Apartments | 0 (0.0%) | 17 (100.0%) |
| Mobile Home / Other | 25 (39.1%) | 39 (60.9%) |
| Total | 505 (49.8%) | 509 (50.2%) |
Housing Structures by Number of Rooms in San Carlos
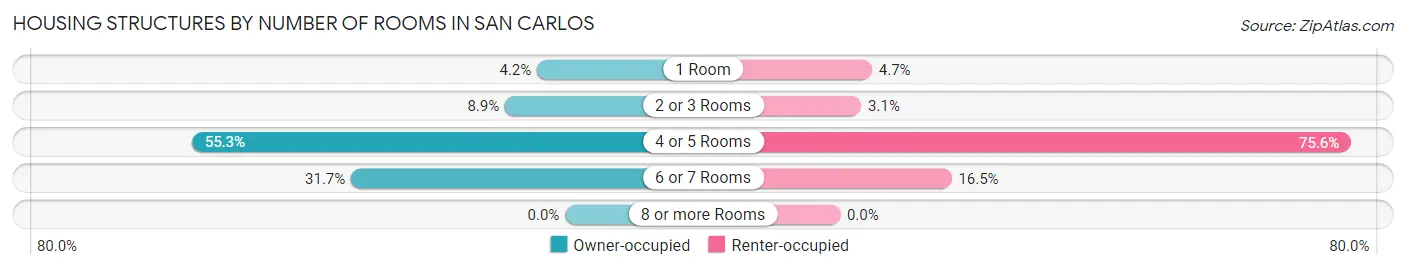
| Number of Rooms | Owner-occupied | Renter-occupied |
| 1 Room | 21 (4.2%) | 24 (4.7%) |
| 2 or 3 Rooms | 45 (8.9%) | 16 (3.1%) |
| 4 or 5 Rooms | 279 (55.2%) | 385 (75.6%) |
| 6 or 7 Rooms | 160 (31.7%) | 84 (16.5%) |
| 8 or more Rooms | 0 (0.0%) | 0 (0.0%) |
| Total | 505 (100.0%) | 509 (100.0%) |
Housing Structure by Heating Type in San Carlos
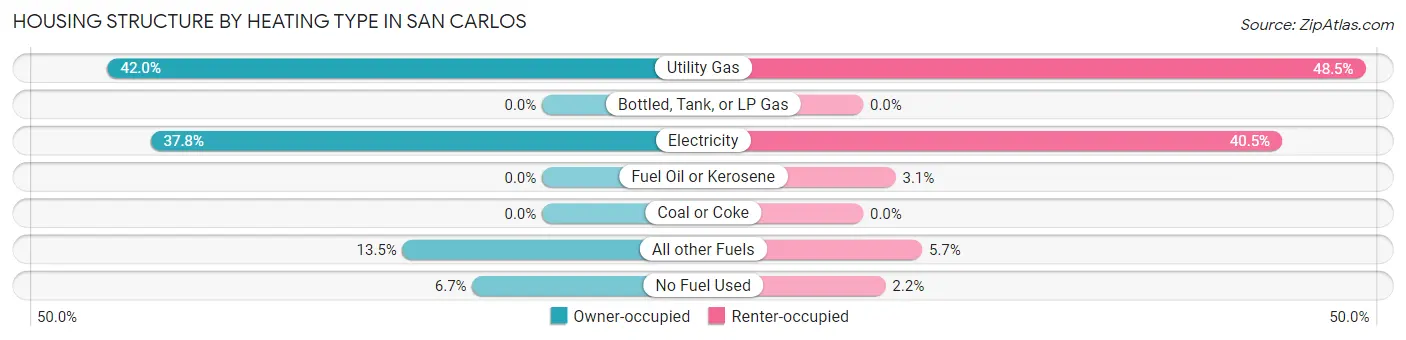
| Heating Type | Owner-occupied | Renter-occupied |
| Utility Gas | 212 (42.0%) | 247 (48.5%) |
| Bottled, Tank, or LP Gas | 0 (0.0%) | 0 (0.0%) |
| Electricity | 191 (37.8%) | 206 (40.5%) |
| Fuel Oil or Kerosene | 0 (0.0%) | 16 (3.1%) |
| Coal or Coke | 0 (0.0%) | 0 (0.0%) |
| All other Fuels | 68 (13.5%) | 29 (5.7%) |
| No Fuel Used | 34 (6.7%) | 11 (2.2%) |
| Total | 505 (100.0%) | 509 (100.0%) |
Household Vehicle Usage in San Carlos
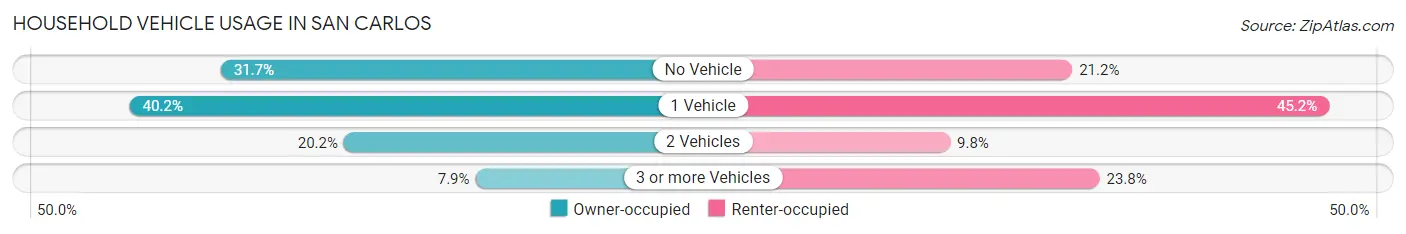
| Vehicles per Household | Owner-occupied | Renter-occupied |
| No Vehicle | 160 (31.7%) | 108 (21.2%) |
| 1 Vehicle | 203 (40.2%) | 230 (45.2%) |
| 2 Vehicles | 102 (20.2%) | 50 (9.8%) |
| 3 or more Vehicles | 40 (7.9%) | 121 (23.8%) |
| Total | 505 (100.0%) | 509 (100.0%) |
Real Estate & Mortgages in San Carlos
Real Estate and Mortgage Overview in San Carlos
| Characteristic | Without Mortgage | With Mortgage |
| Housing Units | 398 | 107 |
| Median Property Value | $42,400 | $67,600 |
| Median Household Income | $19,688 | $0 |
| Monthly Housing Costs | $172 | $0 |
| Real Estate Taxes | - | - |
Property Value by Mortgage Status in San Carlos
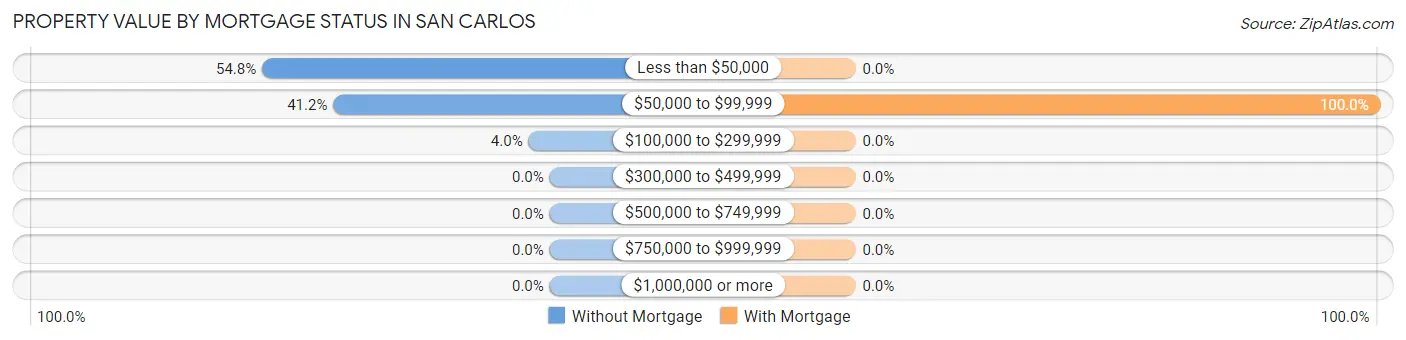
| Property Value | Without Mortgage | With Mortgage |
| Less than $50,000 | 218 (54.8%) | 0 (0.0%) |
| $50,000 to $99,999 | 164 (41.2%) | 107 (100.0%) |
| $100,000 to $299,999 | 16 (4.0%) | 0 (0.0%) |
| $300,000 to $499,999 | 0 (0.0%) | 0 (0.0%) |
| $500,000 to $749,999 | 0 (0.0%) | 0 (0.0%) |
| $750,000 to $999,999 | 0 (0.0%) | 0 (0.0%) |
| $1,000,000 or more | 0 (0.0%) | 0 (0.0%) |
| Total | 398 (100.0%) | 107 (100.0%) |
Household Income by Mortgage Status in San Carlos
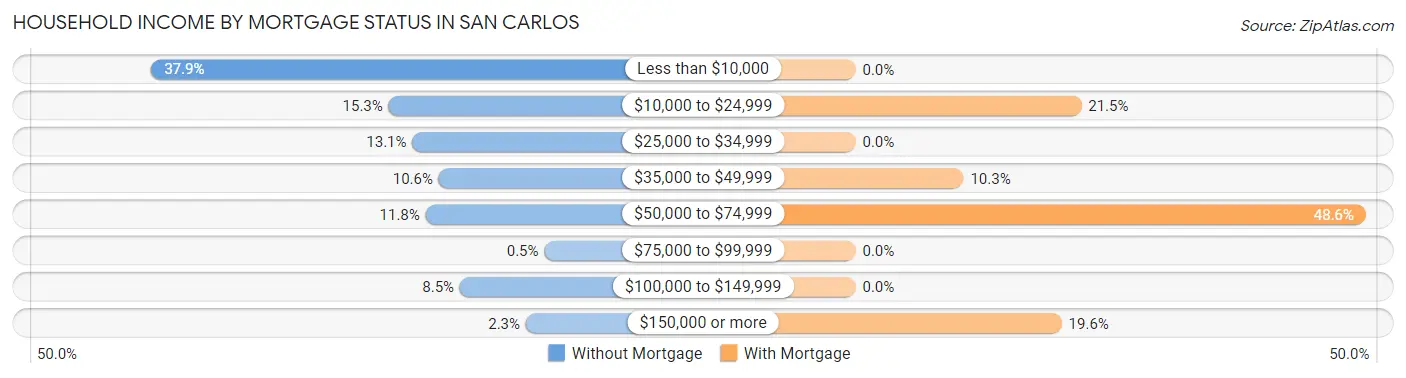
| Household Income | Without Mortgage | With Mortgage |
| Less than $10,000 | 151 (37.9%) | 0 (0.0%) |
| $10,000 to $24,999 | 61 (15.3%) | 23 (21.5%) |
| $25,000 to $34,999 | 52 (13.1%) | 0 (0.0%) |
| $35,000 to $49,999 | 42 (10.5%) | 11 (10.3%) |
| $50,000 to $74,999 | 47 (11.8%) | 52 (48.6%) |
| $75,000 to $99,999 | 2 (0.5%) | 0 (0.0%) |
| $100,000 to $149,999 | 34 (8.5%) | 0 (0.0%) |
| $150,000 or more | 9 (2.3%) | 21 (19.6%) |
| Total | 398 (100.0%) | 107 (100.0%) |
Property Value to Household Income Ratio in San Carlos
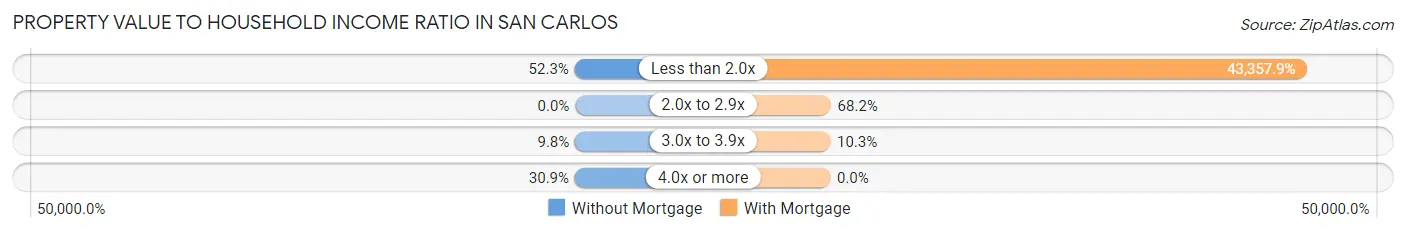
| Value-to-Income Ratio | Without Mortgage | With Mortgage |
| Less than 2.0x | 208 (52.3%) | 46,393 (43,357.9%) |
| 2.0x to 2.9x | 0 (0.0%) | 73 (68.2%) |
| 3.0x to 3.9x | 39 (9.8%) | 11 (10.3%) |
| 4.0x or more | 123 (30.9%) | 0 (0.0%) |
| Total | 398 (100.0%) | 107 (100.0%) |
Real Estate Taxes by Mortgage Status in San Carlos
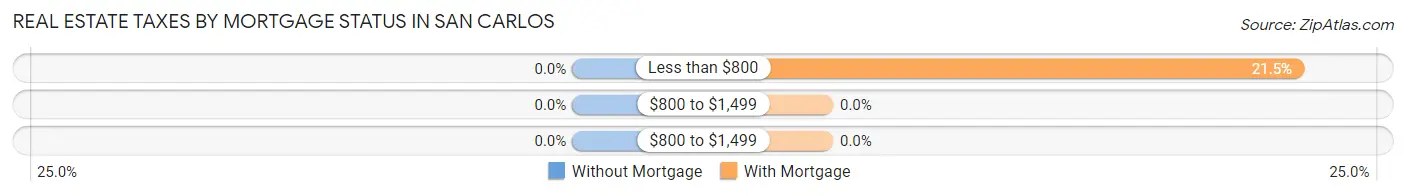
| Property Taxes | Without Mortgage | With Mortgage |
| Less than $800 | 0 (0.0%) | 23 (21.5%) |
| $800 to $1,499 | 0 (0.0%) | 0 (0.0%) |
| $800 to $1,499 | 0 (0.0%) | 0 (0.0%) |
| Total | 398 (100.0%) | 107 (100.0%) |
Health & Disability in San Carlos
Health Insurance Coverage by Age in San Carlos
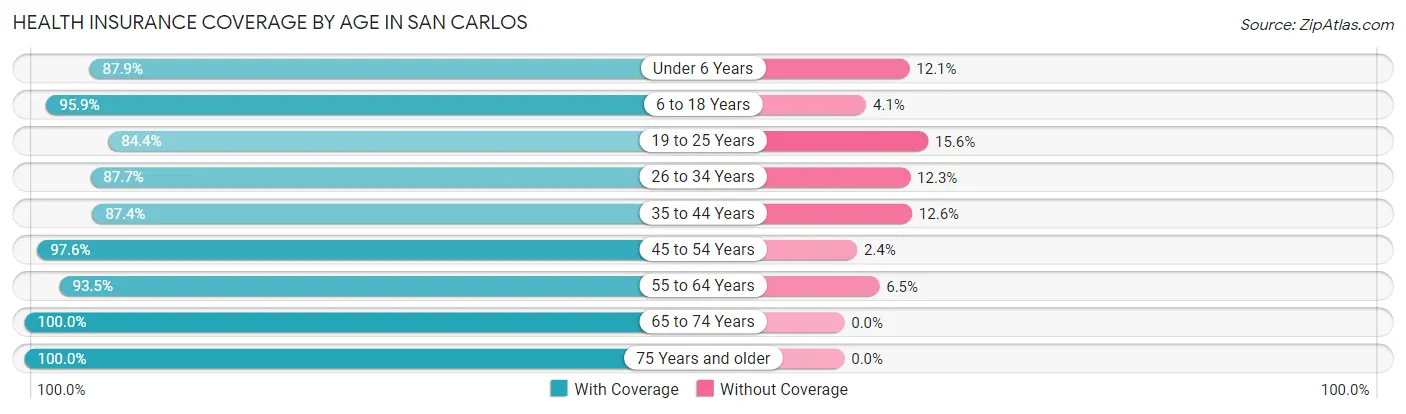
| Age Bracket | With Coverage | Without Coverage |
| Under 6 Years | 420 (87.9%) | 58 (12.1%) |
| 6 to 18 Years | 1,015 (95.9%) | 43 (4.1%) |
| 19 to 25 Years | 497 (84.4%) | 92 (15.6%) |
| 26 to 34 Years | 607 (87.7%) | 85 (12.3%) |
| 35 to 44 Years | 416 (87.4%) | 60 (12.6%) |
| 45 to 54 Years | 456 (97.6%) | 11 (2.4%) |
| 55 to 64 Years | 315 (93.5%) | 22 (6.5%) |
| 65 to 74 Years | 238 (100.0%) | 0 (0.0%) |
| 75 Years and older | 52 (100.0%) | 0 (0.0%) |
| Total | 4,016 (91.5%) | 371 (8.5%) |
Health Insurance Coverage by Citizenship Status in San Carlos
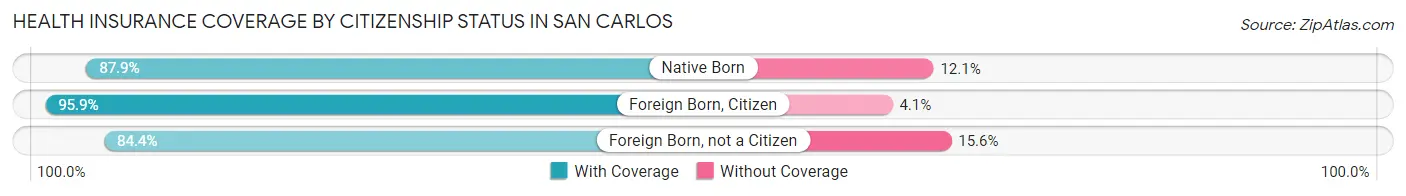
| Citizenship Status | With Coverage | Without Coverage |
| Native Born | 420 (87.9%) | 58 (12.1%) |
| Foreign Born, Citizen | 1,015 (95.9%) | 43 (4.1%) |
| Foreign Born, not a Citizen | 497 (84.4%) | 92 (15.6%) |
Health Insurance Coverage by Household Income in San Carlos
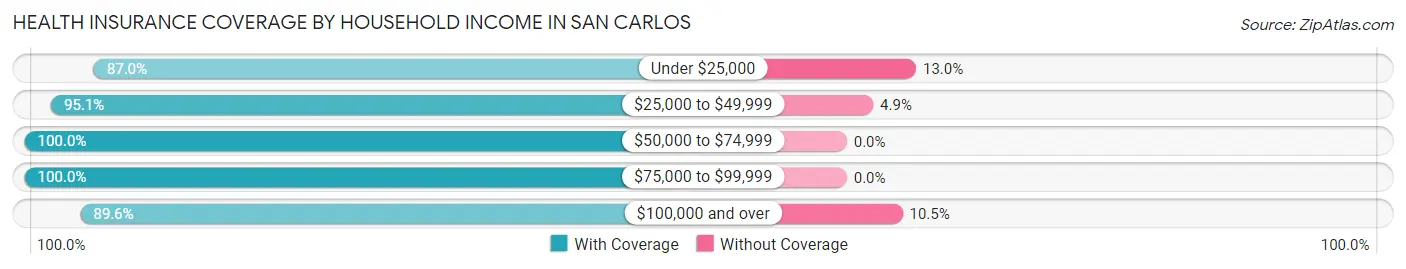
| Household Income | With Coverage | Without Coverage |
| Under $25,000 | 1,368 (87.0%) | 204 (13.0%) |
| $25,000 to $49,999 | 981 (95.1%) | 51 (4.9%) |
| $50,000 to $74,999 | 518 (100.0%) | 0 (0.0%) |
| $75,000 to $99,999 | 150 (100.0%) | 0 (0.0%) |
| $100,000 and over | 994 (89.5%) | 116 (10.4%) |
Public vs Private Health Insurance Coverage by Age in San Carlos
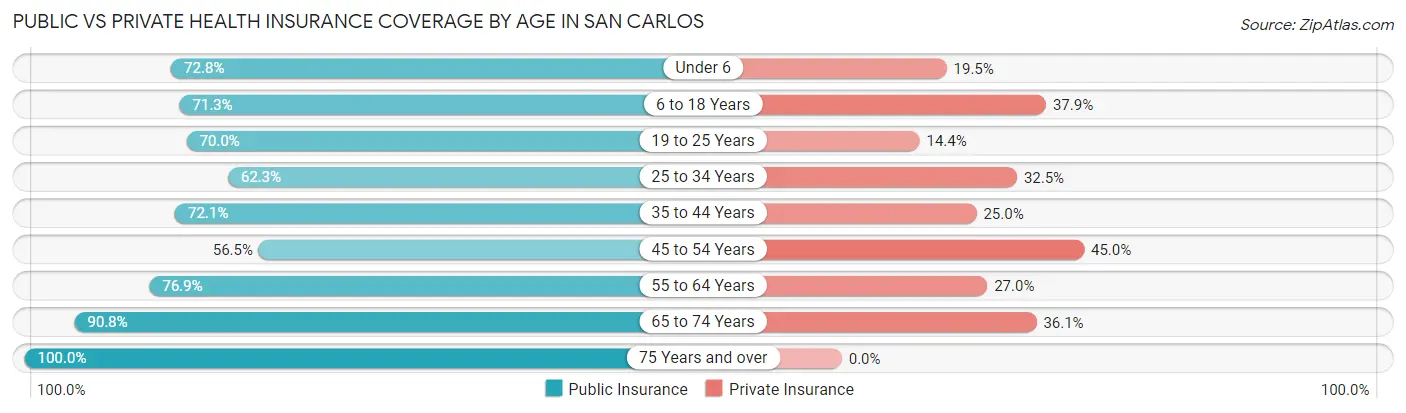
| Age Bracket | Public Insurance | Private Insurance |
| Under 6 | 348 (72.8%) | 93 (19.5%) |
| 6 to 18 Years | 754 (71.3%) | 401 (37.9%) |
| 19 to 25 Years | 412 (70.0%) | 85 (14.4%) |
| 25 to 34 Years | 431 (62.3%) | 225 (32.5%) |
| 35 to 44 Years | 343 (72.1%) | 119 (25.0%) |
| 45 to 54 Years | 264 (56.5%) | 210 (45.0%) |
| 55 to 64 Years | 259 (76.8%) | 91 (27.0%) |
| 65 to 74 Years | 216 (90.8%) | 86 (36.1%) |
| 75 Years and over | 52 (100.0%) | 0 (0.0%) |
| Total | 3,079 (70.2%) | 1,310 (29.9%) |
Disability Status by Sex by Age in San Carlos
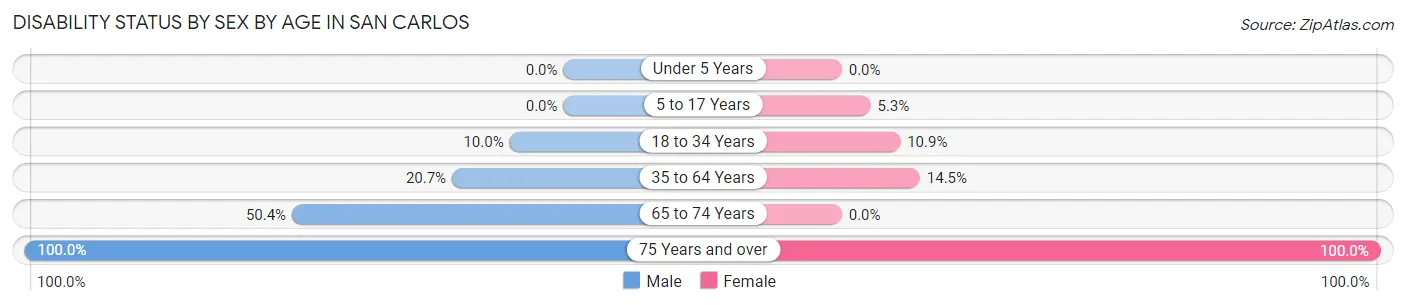
| Age Bracket | Male | Female |
| Under 5 Years | 0 (0.0%) | 0 (0.0%) |
| 5 to 17 Years | 0 (0.0%) | 31 (5.3%) |
| 18 to 34 Years | 63 (10.0%) | 75 (10.8%) |
| 35 to 64 Years | 122 (20.7%) | 100 (14.5%) |
| 65 to 74 Years | 67 (50.4%) | 0 (0.0%) |
| 75 Years and over | 34 (100.0%) | 18 (100.0%) |
Disability Class by Sex by Age in San Carlos
Disability Class: Hearing Difficulty
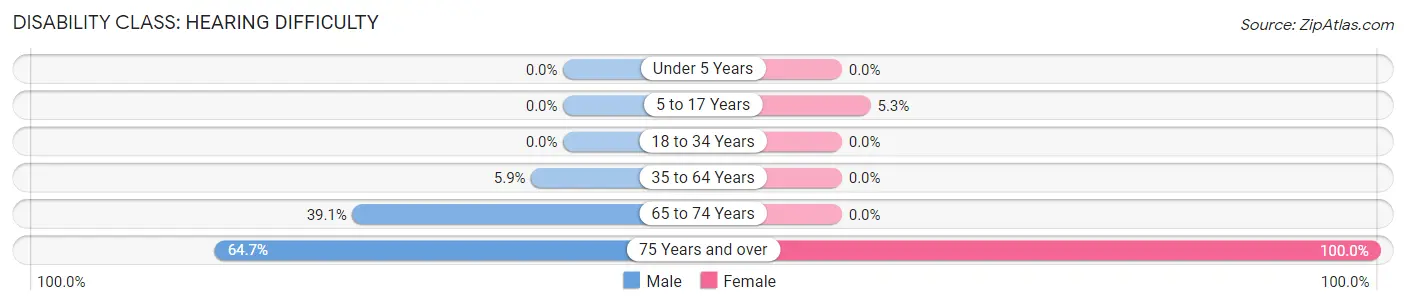
| Age Bracket | Male | Female |
| Under 5 Years | 0 (0.0%) | 0 (0.0%) |
| 5 to 17 Years | 0 (0.0%) | 31 (5.3%) |
| 18 to 34 Years | 0 (0.0%) | 0 (0.0%) |
| 35 to 64 Years | 35 (5.9%) | 0 (0.0%) |
| 65 to 74 Years | 52 (39.1%) | 0 (0.0%) |
| 75 Years and over | 22 (64.7%) | 18 (100.0%) |
Disability Class: Vision Difficulty
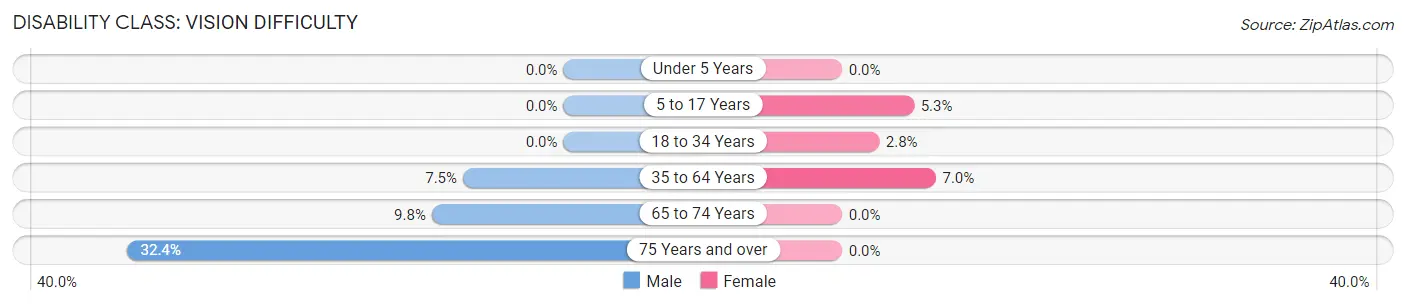
| Age Bracket | Male | Female |
| Under 5 Years | 0 (0.0%) | 0 (0.0%) |
| 5 to 17 Years | 0 (0.0%) | 31 (5.3%) |
| 18 to 34 Years | 0 (0.0%) | 19 (2.8%) |
| 35 to 64 Years | 44 (7.5%) | 48 (7.0%) |
| 65 to 74 Years | 13 (9.8%) | 0 (0.0%) |
| 75 Years and over | 11 (32.4%) | 0 (0.0%) |
Disability Class: Cognitive Difficulty
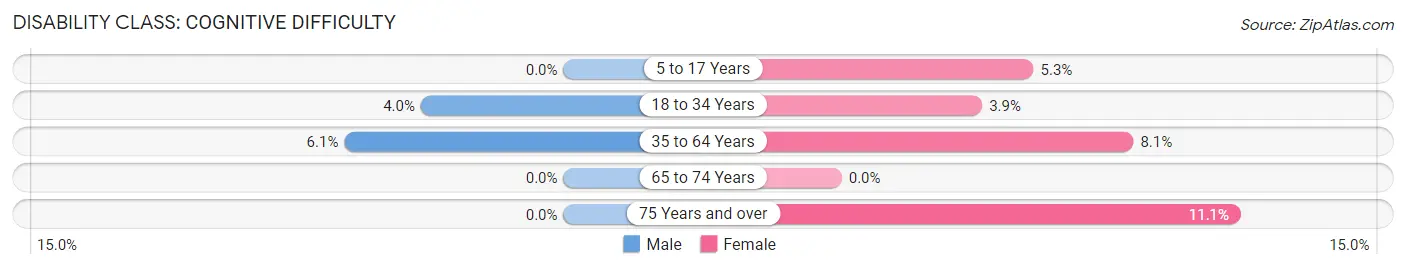
| Age Bracket | Male | Female |
| 5 to 17 Years | 0 (0.0%) | 31 (5.3%) |
| 18 to 34 Years | 25 (4.0%) | 27 (3.9%) |
| 35 to 64 Years | 36 (6.1%) | 56 (8.1%) |
| 65 to 74 Years | 0 (0.0%) | 0 (0.0%) |
| 75 Years and over | 0 (0.0%) | 2 (11.1%) |
Disability Class: Ambulatory Difficulty
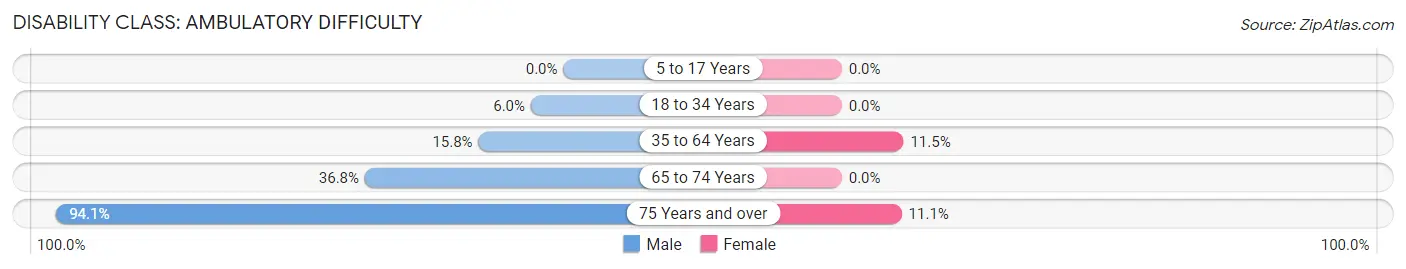
| Age Bracket | Male | Female |
| 5 to 17 Years | 0 (0.0%) | 0 (0.0%) |
| 18 to 34 Years | 38 (6.0%) | 0 (0.0%) |
| 35 to 64 Years | 93 (15.8%) | 79 (11.5%) |
| 65 to 74 Years | 49 (36.8%) | 0 (0.0%) |
| 75 Years and over | 32 (94.1%) | 2 (11.1%) |
Disability Class: Self-Care Difficulty
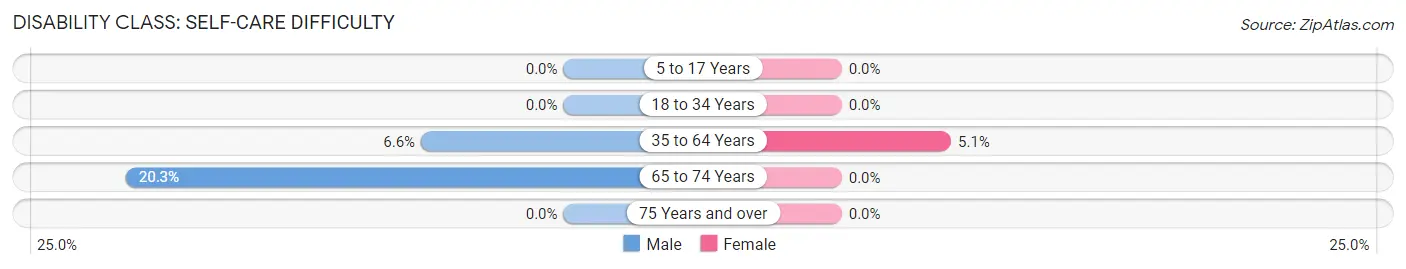
| Age Bracket | Male | Female |
| 5 to 17 Years | 0 (0.0%) | 0 (0.0%) |
| 18 to 34 Years | 0 (0.0%) | 0 (0.0%) |
| 35 to 64 Years | 39 (6.6%) | 35 (5.1%) |
| 65 to 74 Years | 27 (20.3%) | 0 (0.0%) |
| 75 Years and over | 0 (0.0%) | 0 (0.0%) |
Technology Access in San Carlos
Computing Device Access in San Carlos
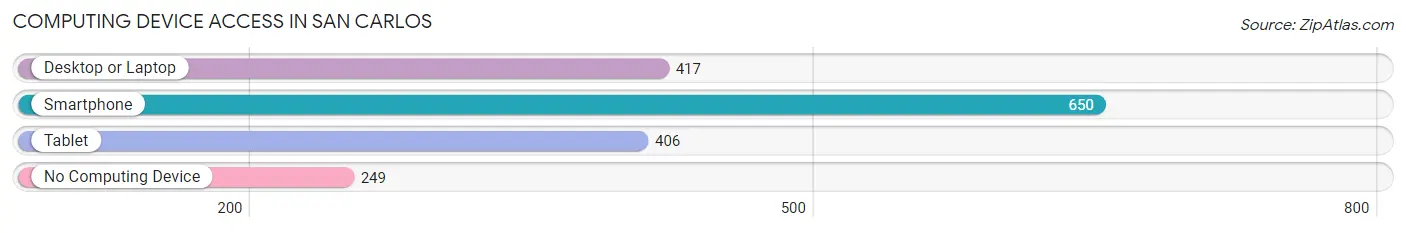
| Device Type | # Households | % Households |
| Desktop or Laptop | 417 | 41.1% |
| Smartphone | 650 | 64.1% |
| Tablet | 406 | 40.0% |
| No Computing Device | 249 | 24.6% |
| Total | 1,014 | 100.0% |
Internet Access in San Carlos
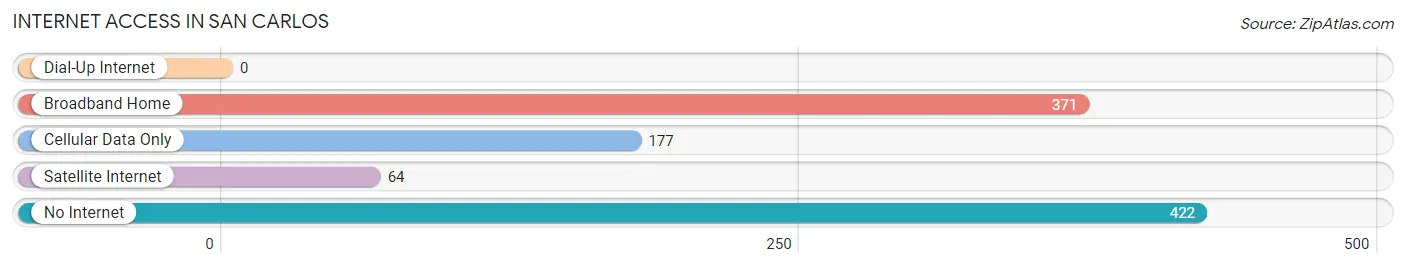
| Internet Type | # Households | % Households |
| Dial-Up Internet | 0 | 0.0% |
| Broadband Home | 371 | 36.6% |
| Cellular Data Only | 177 | 17.5% |
| Satellite Internet | 64 | 6.3% |
| No Internet | 422 | 41.6% |
| Total | 1,014 | 100.0% |
San Carlos Summary
San Carlos, Arizona is a small town located in the Gila County of Arizona. It is situated on the San Carlos Apache Indian Reservation, which is the largest Indian reservation in the state. The town is located in the foothills of the Mogollon Rim, and is surrounded by the San Carlos Lake, the San Carlos River, and the San Carlos Apache National Forest. The town has a population of approximately 2,000 people, and is the largest town on the reservation.
History
The San Carlos Apache Indian Reservation was established in 1871, and the town of San Carlos was founded in 1872. The town was originally called San Carlos Station, and was established as a trading post for the Apache people. The town was later renamed San Carlos, and was incorporated in 1891.
The town was originally a small farming community, and the main crops grown were corn, beans, and squash. The town also had a small sawmill, and a few stores. In the early 1900s, the town began to grow, and the population increased to over 1,000 people.
In the 1950s, the town began to decline, and the population decreased to around 500 people. In the 1970s, the town began to experience a resurgence, and the population increased to over 1,500 people.
Geography
San Carlos is located in the Gila County of Arizona, and is situated on the San Carlos Apache Indian Reservation. The town is located in the foothills of the Mogollon Rim, and is surrounded by the San Carlos Lake, the San Carlos River, and the San Carlos Apache National Forest. The town is located at an elevation of 4,500 feet, and has a total area of 4.2 square miles.
Economy
The economy of San Carlos is largely based on tourism, and the town is a popular destination for outdoor recreation. The town is home to several tourist attractions, including the San Carlos Apache Cultural Center, the San Carlos Apache Museum, and the San Carlos Apache National Monument. The town is also home to several casinos, and the San Carlos Apache Tribe operates a casino in the town.
The town is also home to several businesses, including restaurants, hotels, and retail stores. The town is also home to several manufacturing companies, and the San Carlos Apache Tribe operates a manufacturing plant in the town.
Demographics
As of the 2010 census, the population of San Carlos was 2,053. The racial makeup of the town was 94.3% Native American, 2.2% White, 0.3% African American, 0.2% Asian, 0.1% Pacific Islander, 0.7% from other races, and 2.4% from two or more races. The median household income was $20,972, and the median family income was $25,972. The per capita income was $10,972.
Conclusion
San Carlos, Arizona is a small town located in the Gila County of Arizona. It is situated on the San Carlos Apache Indian Reservation, which is the largest Indian reservation in the state. The town has a population of approximately 2,000 people, and is the largest town on the reservation. The economy of San Carlos is largely based on tourism, and the town is a popular destination for outdoor recreation. The town is also home to several businesses, including restaurants, hotels, and retail stores. The racial makeup of the town is 94.3% Native American, 2.2% White, 0.3% African American, 0.2% Asian, 0.1% Pacific Islander, 0.7% from other races, and 2.4% from two or more races.
Common Questions
What is Per Capita Income in San Carlos?
Per Capita income in San Carlos is $11,850.
What is the Median Family Income in San Carlos?
Median Family Income in San Carlos is $41,030.
What is the Median Household income in San Carlos?
Median Household Income in San Carlos is $38,125.
What is Income or Wage Gap in San Carlos?
Income or Wage Gap in San Carlos is 7.4%.
Women in San Carlos earn 92.6 cents for every dollar earned by a man.
What is Family Income Deficit in San Carlos?
Family Income Deficit in San Carlos is $18,090.
Families that are below poverty line in San Carlos earn $18,090 less on average than the poverty threshold level.
What is Inequality or Gini Index in San Carlos?
Inequality or Gini Index in San Carlos is 0.54.
What is the Total Population of San Carlos?
Total Population of San Carlos is 4,405.
What is the Total Male Population of San Carlos?
Total Male Population of San Carlos is 2,112.
What is the Total Female Population of San Carlos?
Total Female Population of San Carlos is 2,293.
What is the Ratio of Males per 100 Females in San Carlos?
There are 92.11 Males per 100 Females in San Carlos.
What is the Ratio of Females per 100 Males in San Carlos?
There are 108.57 Females per 100 Males in San Carlos.
What is the Median Population Age in San Carlos?
Median Population Age in San Carlos is 26.5 Years.
What is the Average Family Size in San Carlos
Average Family Size in San Carlos is 4.3 People.
What is the Average Household Size in San Carlos
Average Household Size in San Carlos is 4.3 People.
How Large is the Labor Force in San Carlos?
There are 1,483 People in the Labor Forcein in San Carlos.
What is the Percentage of People in the Labor Force in San Carlos?
49.7% of People are in the Labor Force in San Carlos.
What is the Unemployment Rate in San Carlos?
Unemployment Rate in San Carlos is 19.6%.