Schurz, NV Map & Demographics
Schurz Map
Schurz Overview
$18,840
PER CAPITA INCOME
$34,107
AVG FAMILY INCOME
$29,583
AVG HOUSEHOLD INCOME
34.9%
WAGE / INCOME GAP [ % ]
65.1¢/ $1
WAGE / INCOME GAP [ $ ]
$10,945
FAMILY INCOME DEFICIT
0.50
INEQUALITY / GINI INDEX
896
TOTAL POPULATION
397
MALE POPULATION
499
FEMALE POPULATION
79.56
MALES / 100 FEMALES
125.69
FEMALES / 100 MALES
31.6
MEDIAN AGE
3.6
AVG FAMILY SIZE
2.8
AVG HOUSEHOLD SIZE
366
LABOR FORCE [ PEOPLE ]
53.9%
PERCENT IN LABOR FORCE
15.8%
UNEMPLOYMENT RATE
Schurz Zip Codes
Schurz Area Codes
Income in Schurz
Income Overview in Schurz
Per Capita Income in Schurz is $18,840, while median incomes of families and households are $34,107 and $29,583 respectively.
| Characteristic | Number | Measure |
| Per Capita Income | 896 | $18,840 |
| Median Family Income | 199 | $34,107 |
| Mean Family Income | 199 | $50,772 |
| Median Household Income | 315 | $29,583 |
| Mean Household Income | 315 | $43,443 |
| Income Deficit | 199 | $10,945 |
| Wage / Income Gap (%) | 896 | 34.88% |
| Wage / Income Gap ($) | 896 | 65.12¢ per $1 |
| Gini / Inequality Index | 896 | 0.50 |
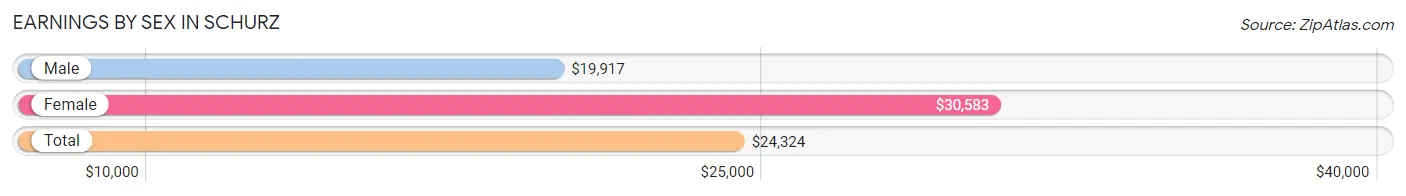
Earnings by Sex in Schurz
Average Earnings in Schurz are $24,324, $19,917 for men and $30,583 for women, a difference of 34.9%.
| Sex | Number | Average Earnings |
| Male | 189 (48.2%) | $19,917 |
| Female | 203 (51.8%) | $30,583 |
| Total | 392 (100.0%) | $24,324 |
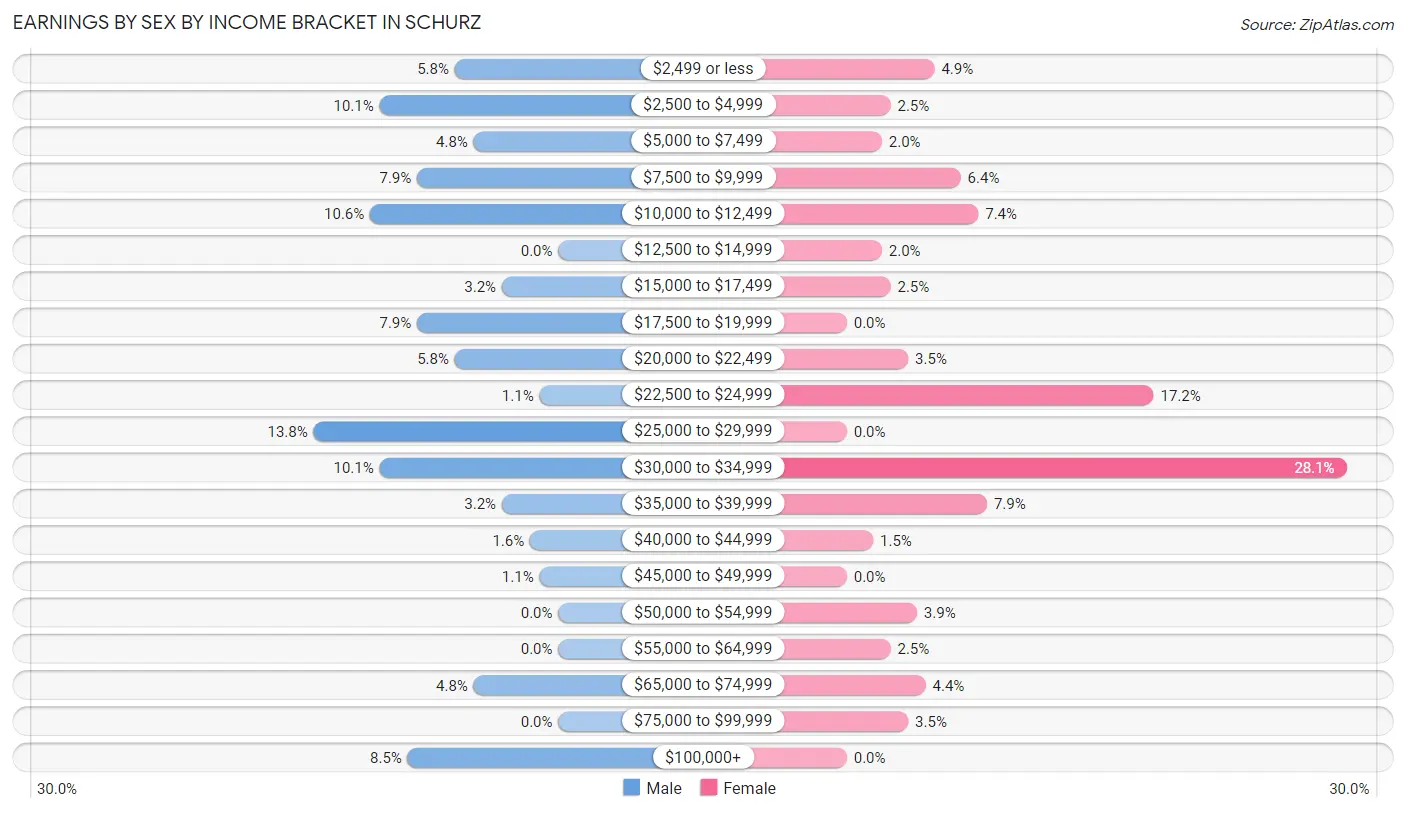
Earnings by Sex by Income Bracket in Schurz
The most common earnings brackets in Schurz are $25,000 to $29,999 for men (26 | 13.8%) and $30,000 to $34,999 for women (57 | 28.1%).
| Income | Male | Female |
| $2,499 or less | 11 (5.8%) | 10 (4.9%) |
| $2,500 to $4,999 | 19 (10.1%) | 5 (2.5%) |
| $5,000 to $7,499 | 9 (4.8%) | 4 (2.0%) |
| $7,500 to $9,999 | 15 (7.9%) | 13 (6.4%) |
| $10,000 to $12,499 | 20 (10.6%) | 15 (7.4%) |
| $12,500 to $14,999 | 0 (0.0%) | 4 (2.0%) |
| $15,000 to $17,499 | 6 (3.2%) | 5 (2.5%) |
| $17,500 to $19,999 | 15 (7.9%) | 0 (0.0%) |
| $20,000 to $22,499 | 11 (5.8%) | 7 (3.5%) |
| $22,500 to $24,999 | 2 (1.1%) | 35 (17.2%) |
| $25,000 to $29,999 | 26 (13.8%) | 0 (0.0%) |
| $30,000 to $34,999 | 19 (10.1%) | 57 (28.1%) |
| $35,000 to $39,999 | 6 (3.2%) | 16 (7.9%) |
| $40,000 to $44,999 | 3 (1.6%) | 3 (1.5%) |
| $45,000 to $49,999 | 2 (1.1%) | 0 (0.0%) |
| $50,000 to $54,999 | 0 (0.0%) | 8 (3.9%) |
| $55,000 to $64,999 | 0 (0.0%) | 5 (2.5%) |
| $65,000 to $74,999 | 9 (4.8%) | 9 (4.4%) |
| $75,000 to $99,999 | 0 (0.0%) | 7 (3.5%) |
| $100,000+ | 16 (8.5%) | 0 (0.0%) |
| Total | 189 (100.0%) | 203 (100.0%) |
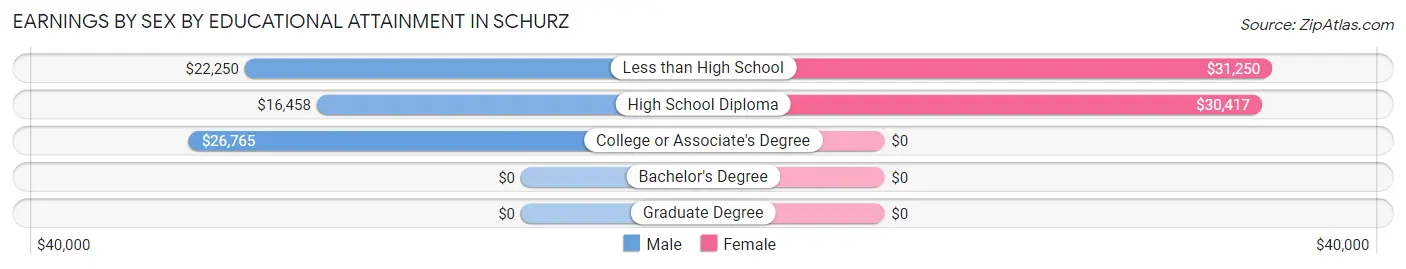
Earnings by Sex by Educational Attainment in Schurz
Average earnings in Schurz are $25,096 for men and $30,750 for women, a difference of 18.4%. Men with an educational attainment of college or associate's degree enjoy the highest average annual earnings of $26,765, while those with high school diploma education earn the least with $16,458. Women with an educational attainment of less than high school earn the most with the average annual earnings of $31,250, while those with high school diploma education have the smallest earnings of $30,417.
| Educational Attainment | Male Income | Female Income |
| Less than High School | $22,250 | $31,250 |
| High School Diploma | $16,458 | $30,417 |
| College or Associate's Degree | $26,765 | $0 |
| Bachelor's Degree | - | - |
| Graduate Degree | - | - |
| Total | $25,096 | $30,750 |
Family Income in Schurz
Family Income Brackets in Schurz
According to the Schurz family income data, there are 54 families falling into the $15,000 to $24,999 income range, which is the most common income bracket and makes up 27.1% of all families. Conversely, the $150,000 to $199,999 income bracket is the least frequent group with only 3 families (1.5%) belonging to this category.
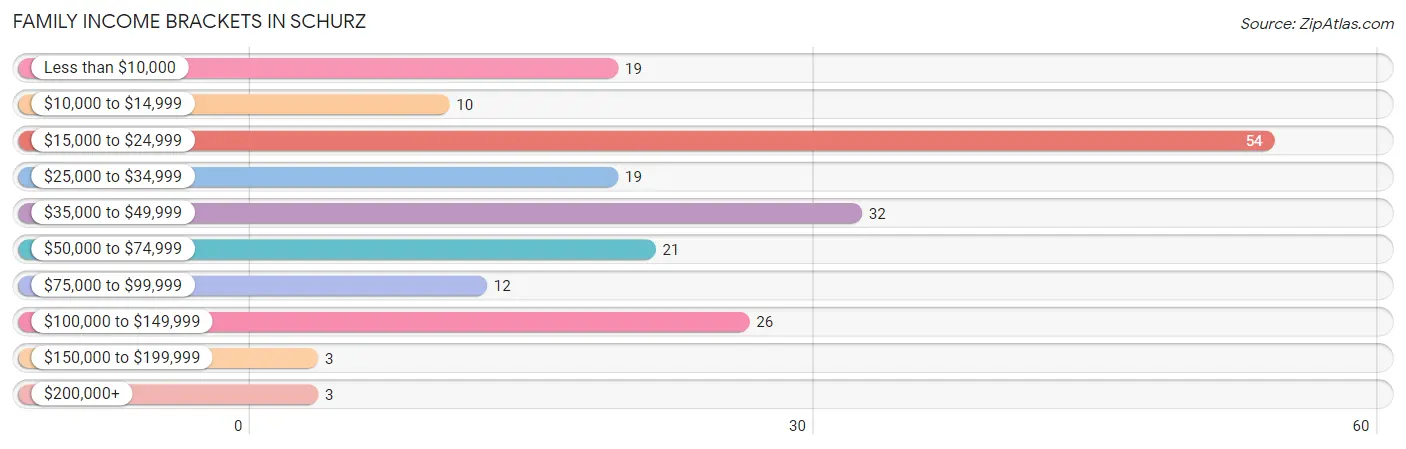
| Income Bracket | # Families | % Families |
| Less than $10,000 | 19 | 9.5% |
| $10,000 to $14,999 | 10 | 5.0% |
| $15,000 to $24,999 | 54 | 27.1% |
| $25,000 to $34,999 | 19 | 9.5% |
| $35,000 to $49,999 | 32 | 16.1% |
| $50,000 to $74,999 | 21 | 10.6% |
| $75,000 to $99,999 | 12 | 6.0% |
| $100,000 to $149,999 | 26 | 13.1% |
| $150,000 to $199,999 | 3 | 1.5% |
| $200,000+ | 3 | 1.5% |
Family Income by Famaliy Size in Schurz
2-person families (86 | 43.2%) account for the highest median family income in Schurz with $36,000 per family, while 2-person families (86 | 43.2%) have the highest median income of $18,000 per family member.
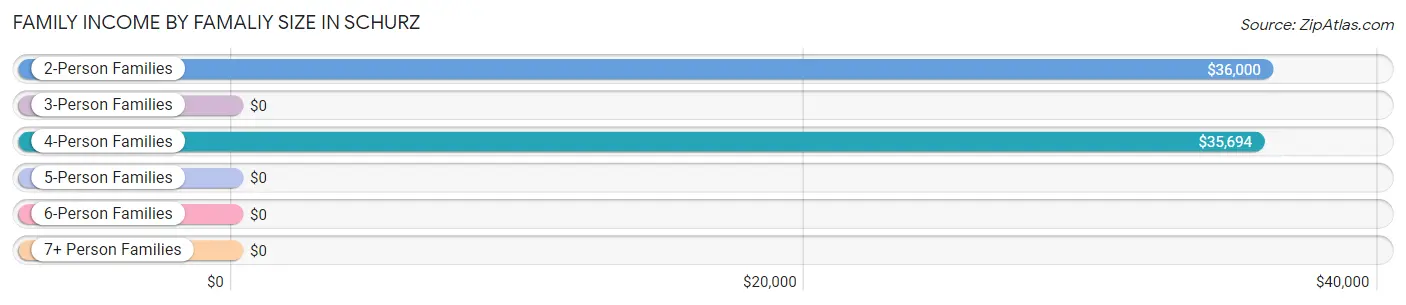
| Income Bracket | # Families | Median Income |
| 2-Person Families | 86 (43.2%) | $36,000 |
| 3-Person Families | 45 (22.6%) | $0 |
| 4-Person Families | 29 (14.6%) | $35,694 |
| 5-Person Families | 26 (13.1%) | $0 |
| 6-Person Families | 13 (6.5%) | $0 |
| 7+ Person Families | 0 (0.0%) | $0 |
| Total | 199 (100.0%) | $34,107 |
Family Income by Number of Earners in Schurz
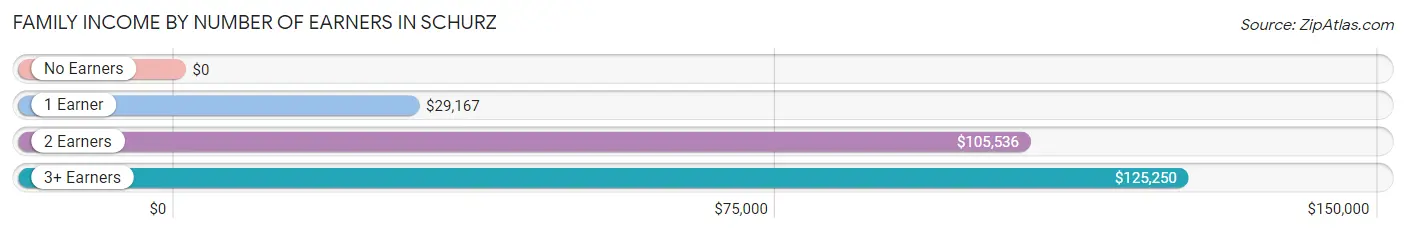
| Number of Earners | # Families | Median Income |
| No Earners | 41 (20.6%) | $0 |
| 1 Earner | 110 (55.3%) | $29,167 |
| 2 Earners | 39 (19.6%) | $105,536 |
| 3+ Earners | 9 (4.5%) | $125,250 |
| Total | 199 (100.0%) | $34,107 |
Household Income in Schurz
Household Income Brackets in Schurz
With 70 households falling in the category, the $15,000 to $24,999 income range is the most frequent in Schurz, accounting for 22.2% of all households. In contrast, only 3 households (0.9%) fall into the $150,000 to $199,999 income bracket, making it the least populous group.
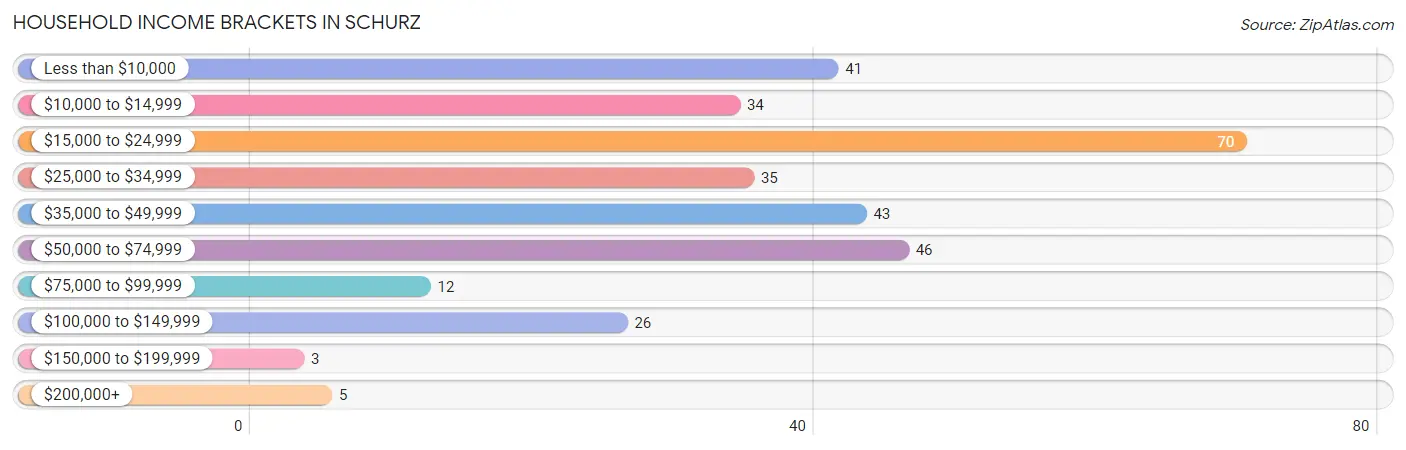
| Income Bracket | # Households | % Households |
| Less than $10,000 | 41 | 13.0% |
| $10,000 to $14,999 | 34 | 10.8% |
| $15,000 to $24,999 | 70 | 22.2% |
| $25,000 to $34,999 | 35 | 11.1% |
| $35,000 to $49,999 | 43 | 13.7% |
| $50,000 to $74,999 | 46 | 14.6% |
| $75,000 to $99,999 | 12 | 3.8% |
| $100,000 to $149,999 | 26 | 8.3% |
| $150,000 to $199,999 | 3 | 1.0% |
| $200,000+ | 5 | 1.6% |
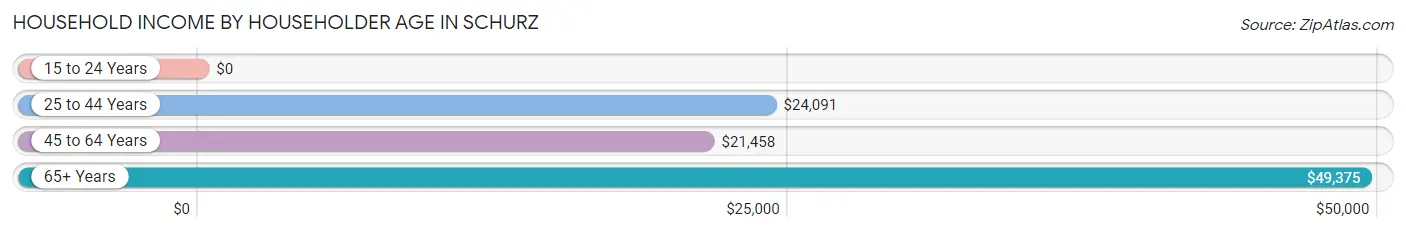
Household Income by Householder Age in Schurz
The median household income in Schurz is $29,583, with the highest median household income of $49,375 found in the 65+ years age bracket for the primary householder. A total of 94 households (29.8%) fall into this category. Meanwhile, the 15 to 24 years age bracket for the primary householder has the lowest median household income of $0, with 4 households (1.3%) in this group.
| Income Bracket | # Households | Median Income |
| 15 to 24 Years | 4 (1.3%) | $0 |
| 25 to 44 Years | 100 (31.8%) | $24,091 |
| 45 to 64 Years | 117 (37.1%) | $21,458 |
| 65+ Years | 94 (29.8%) | $49,375 |
| Total | 315 (100.0%) | $29,583 |
Poverty in Schurz
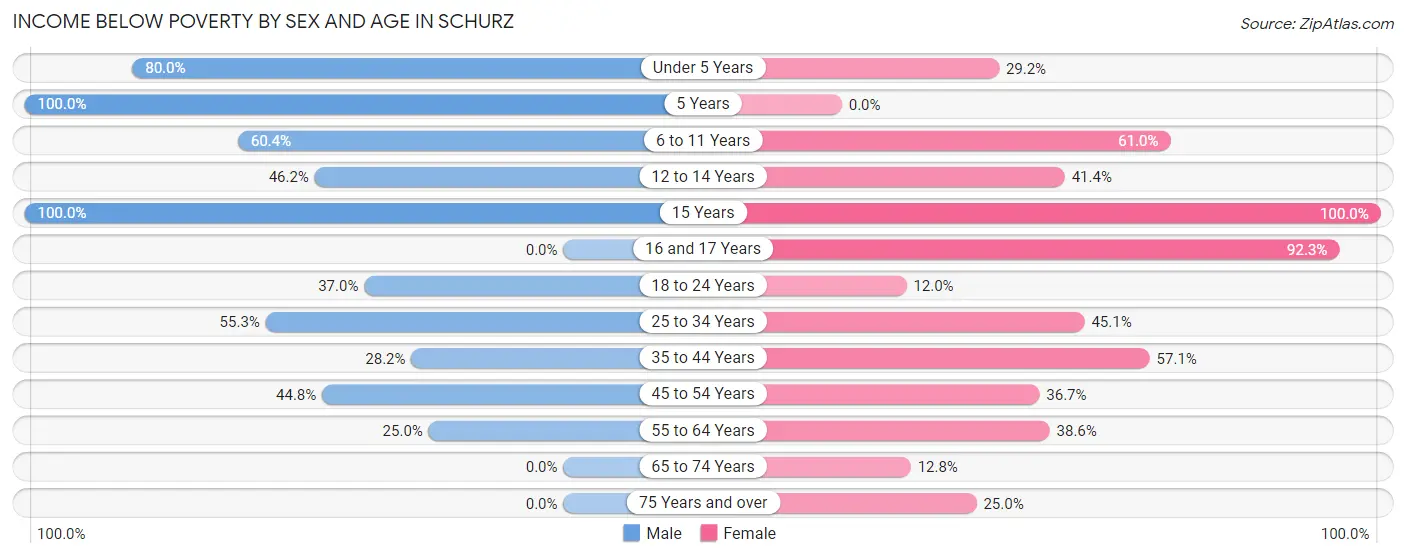
Income Below Poverty by Sex and Age in Schurz
With 42.6% poverty level for males and 34.9% for females among the residents of Schurz, 5 year old males and 15 year old females are the most vulnerable to poverty, with 10 males (100.0%) and 4 females (100.0%) in their respective age groups living below the poverty level.
| Age Bracket | Male | Female |
| Under 5 Years | 32 (80.0%) | 7 (29.2%) |
| 5 Years | 10 (100.0%) | 0 (0.0%) |
| 6 to 11 Years | 29 (60.4%) | 25 (61.0%) |
| 12 to 14 Years | 6 (46.2%) | 12 (41.4%) |
| 15 Years | 5 (100.0%) | 4 (100.0%) |
| 16 and 17 Years | 0 (0.0%) | 12 (92.3%) |
| 18 to 24 Years | 17 (37.0%) | 9 (12.0%) |
| 25 to 34 Years | 21 (55.3%) | 41 (45.1%) |
| 35 to 44 Years | 11 (28.2%) | 12 (57.1%) |
| 45 to 54 Years | 30 (44.8%) | 11 (36.7%) |
| 55 to 64 Years | 8 (25.0%) | 27 (38.6%) |
| 65 to 74 Years | 0 (0.0%) | 11 (12.8%) |
| 75 Years and over | 0 (0.0%) | 3 (25.0%) |
| Total | 169 (42.6%) | 174 (34.9%) |
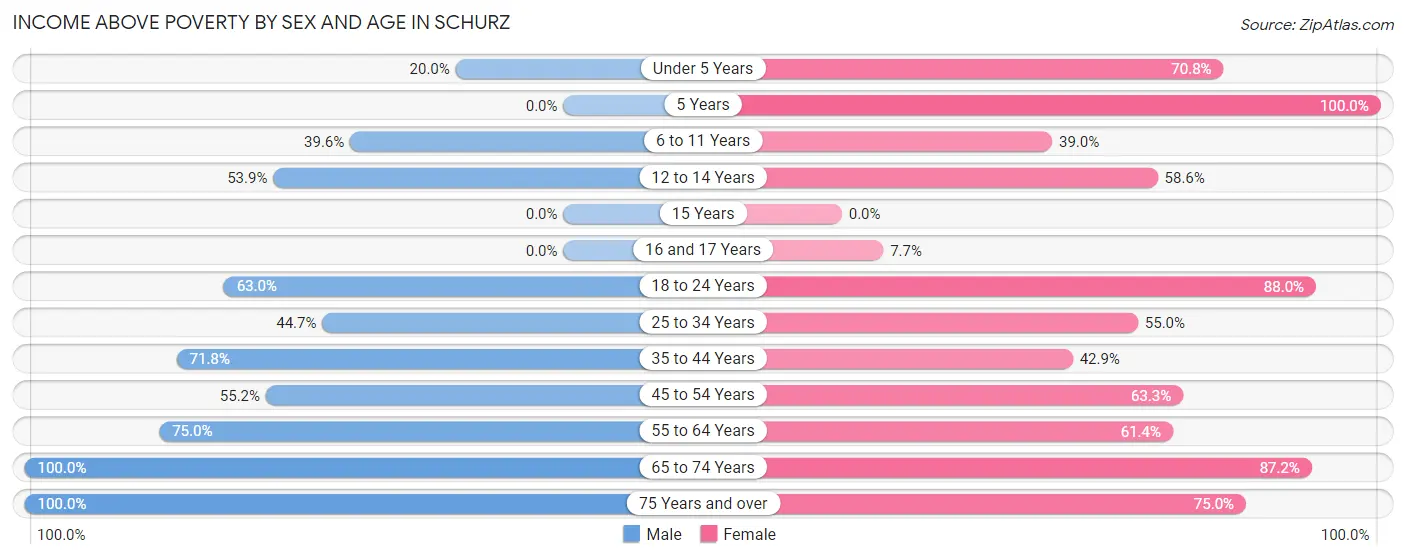
Income Above Poverty by Sex and Age in Schurz
According to the poverty statistics in Schurz, males aged 65 to 74 years and females aged 5 years are the age groups that are most secure financially, with 100.0% of males and 100.0% of females in these age groups living above the poverty line.
| Age Bracket | Male | Female |
| Under 5 Years | 8 (20.0%) | 17 (70.8%) |
| 5 Years | 0 (0.0%) | 3 (100.0%) |
| 6 to 11 Years | 19 (39.6%) | 16 (39.0%) |
| 12 to 14 Years | 7 (53.8%) | 17 (58.6%) |
| 15 Years | 0 (0.0%) | 0 (0.0%) |
| 16 and 17 Years | 0 (0.0%) | 1 (7.7%) |
| 18 to 24 Years | 29 (63.0%) | 66 (88.0%) |
| 25 to 34 Years | 17 (44.7%) | 50 (54.9%) |
| 35 to 44 Years | 28 (71.8%) | 9 (42.9%) |
| 45 to 54 Years | 37 (55.2%) | 19 (63.3%) |
| 55 to 64 Years | 24 (75.0%) | 43 (61.4%) |
| 65 to 74 Years | 47 (100.0%) | 75 (87.2%) |
| 75 Years and over | 12 (100.0%) | 9 (75.0%) |
| Total | 228 (57.4%) | 325 (65.1%) |
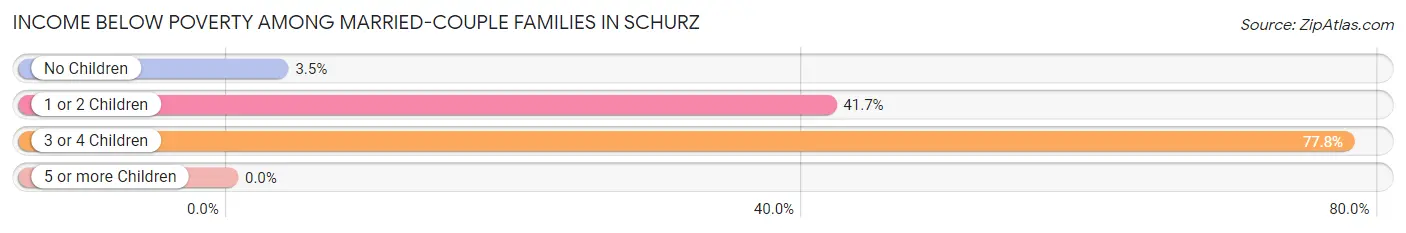
Income Below Poverty Among Married-Couple Families in Schurz
The poverty statistics for married-couple families in Schurz show that 17.9% or 14 of the total 78 families live below the poverty line. Families with 3 or 4 children have the highest poverty rate of 77.8%, comprising of 7 families. On the other hand, families with no children have the lowest poverty rate of 3.5%, which includes 2 families.
| Children | Above Poverty | Below Poverty |
| No Children | 55 (96.5%) | 2 (3.5%) |
| 1 or 2 Children | 7 (58.3%) | 5 (41.7%) |
| 3 or 4 Children | 2 (22.2%) | 7 (77.8%) |
| 5 or more Children | 0 (0.0%) | 0 (0.0%) |
| Total | 64 (82.1%) | 14 (17.9%) |
Income Below Poverty Among Single-Parent Households in Schurz
According to the poverty data in Schurz, 70.5% or 31 single-father households and 40.3% or 31 single-mother households are living below the poverty line. Among single-father households, those with 1 or 2 children have the highest poverty rate, with 15 households (100.0%) experiencing poverty. Likewise, among single-mother households, those with 5 or more children have the highest poverty rate, with 6 households (100.0%) falling below the poverty line.
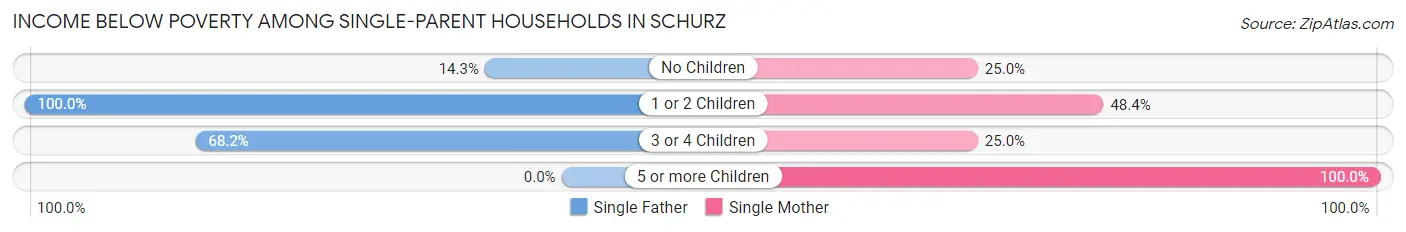
| Children | Single Father | Single Mother |
| No Children | 1 (14.3%) | 4 (25.0%) |
| 1 or 2 Children | 15 (100.0%) | 15 (48.4%) |
| 3 or 4 Children | 15 (68.2%) | 6 (25.0%) |
| 5 or more Children | 0 (0.0%) | 6 (100.0%) |
| Total | 31 (70.5%) | 31 (40.3%) |
Income Below Poverty Among Married-Couple vs Single-Parent Households in Schurz
The poverty data for Schurz shows that 14 of the married-couple family households (17.9%) and 62 of the single-parent households (51.2%) are living below the poverty level. Within the married-couple family households, those with 3 or 4 children have the highest poverty rate, with 7 households (77.8%) falling below the poverty line. Among the single-parent households, those with 5 or more children have the highest poverty rate, with 6 household (100.0%) living below poverty.
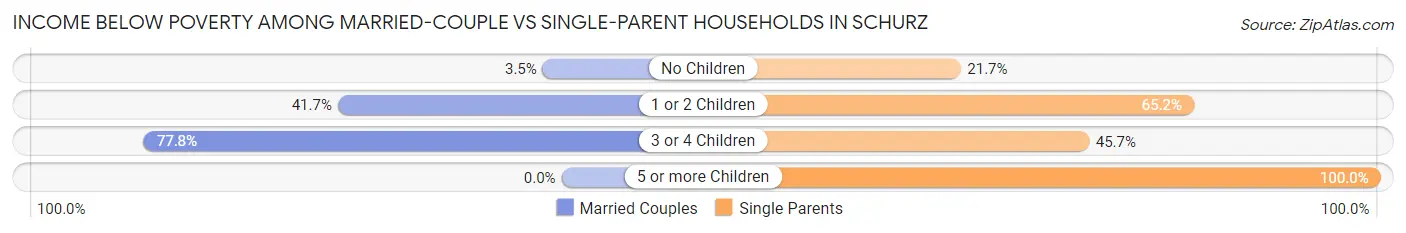
| Children | Married-Couple Families | Single-Parent Households |
| No Children | 2 (3.5%) | 5 (21.7%) |
| 1 or 2 Children | 5 (41.7%) | 30 (65.2%) |
| 3 or 4 Children | 7 (77.8%) | 21 (45.7%) |
| 5 or more Children | 0 (0.0%) | 6 (100.0%) |
| Total | 14 (17.9%) | 62 (51.2%) |
Race in Schurz
The most populous races in Schurz are Native / Alaskan (729 | 81.4%), Hispanic or Latino (146 | 16.3%), and White / Caucasian (89 | 9.9%).
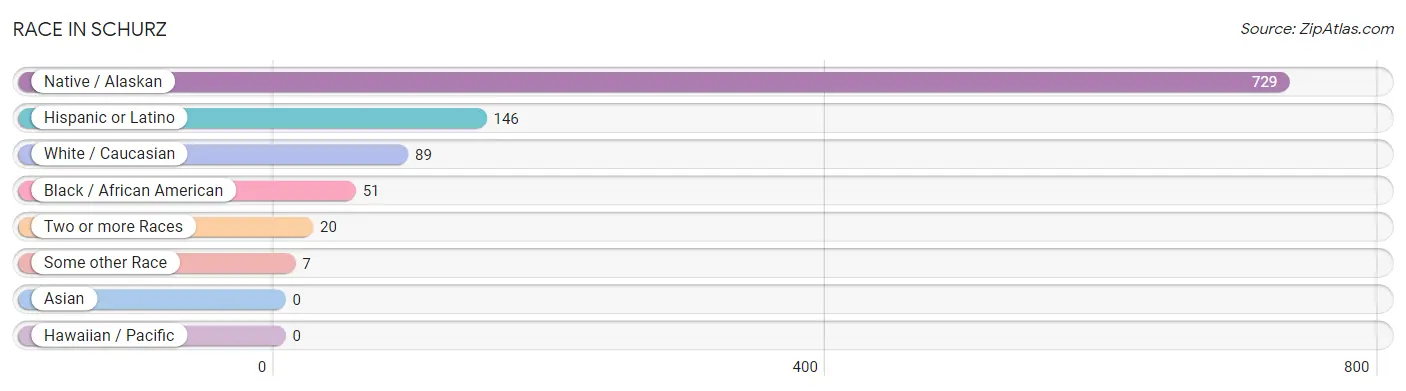
| Race | # Population | % Population |
| Asian | 0 | 0.0% |
| Black / African American | 51 | 5.7% |
| Hawaiian / Pacific | 0 | 0.0% |
| Hispanic or Latino | 146 | 16.3% |
| Native / Alaskan | 729 | 81.4% |
| White / Caucasian | 89 | 9.9% |
| Two or more Races | 20 | 2.2% |
| Some other Race | 7 | 0.8% |
| Total | 896 | 100.0% |
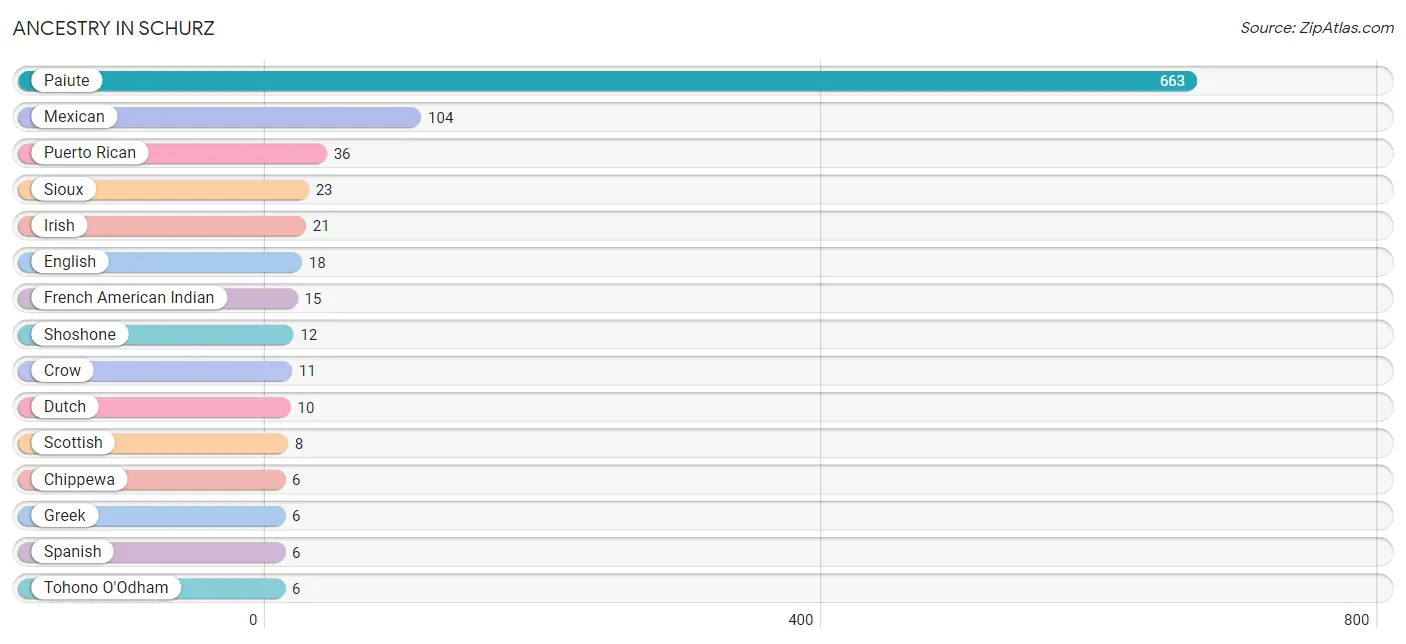
Ancestry in Schurz
The most populous ancestries reported in Schurz are Paiute (663 | 74.0%), Mexican (104 | 11.6%), Puerto Rican (36 | 4.0%), Sioux (23 | 2.6%), and Irish (21 | 2.3%), together accounting for 94.5% of all Schurz residents.
| Ancestry | # Population | % Population |
| Basque | 3 | 0.3% |
| Chippewa | 6 | 0.7% |
| Creek | 3 | 0.3% |
| Crow | 11 | 1.2% |
| Czech | 3 | 0.3% |
| Danish | 2 | 0.2% |
| Dutch | 10 | 1.1% |
| English | 18 | 2.0% |
| European | 5 | 0.6% |
| French American Indian | 15 | 1.7% |
| Greek | 6 | 0.7% |
| Irish | 21 | 2.3% |
| Mexican | 104 | 11.6% |
| Paiute | 663 | 74.0% |
| Pueblo | 4 | 0.4% |
| Puerto Rican | 36 | 4.0% |
| Scandinavian | 5 | 0.6% |
| Scottish | 8 | 0.9% |
| Shoshone | 12 | 1.3% |
| Sioux | 23 | 2.6% |
| Spanish | 6 | 0.7% |
| Tohono O'Odham | 6 | 0.7% |
| Welsh | 2 | 0.2% | View All 23 Rows |
Immigrants in Schurz
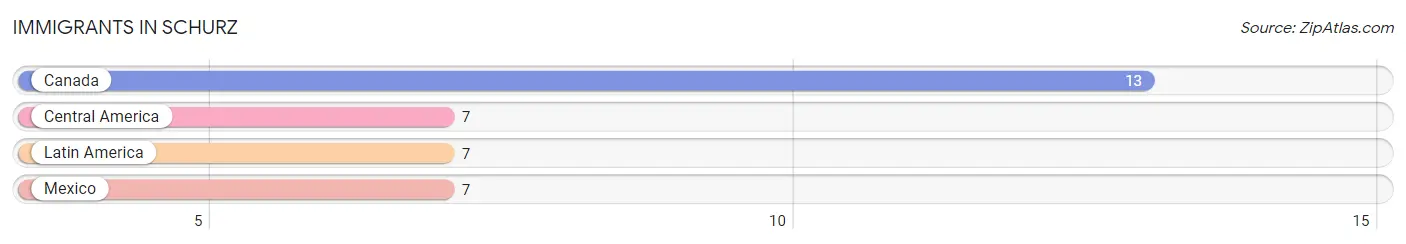
The most numerous immigrant groups reported in Schurz came from Canada (13 | 1.5%), Central America (7 | 0.8%), Latin America (7 | 0.8%), and Mexico (7 | 0.8%), together accounting for 3.8% of all Schurz residents.
| Immigration Origin | # Population | % Population |
| Canada | 13 | 1.5% |
| Central America | 7 | 0.8% |
| Latin America | 7 | 0.8% |
| Mexico | 7 | 0.8% | View All 4 Rows |
Sex and Age in Schurz
Sex and Age in Schurz
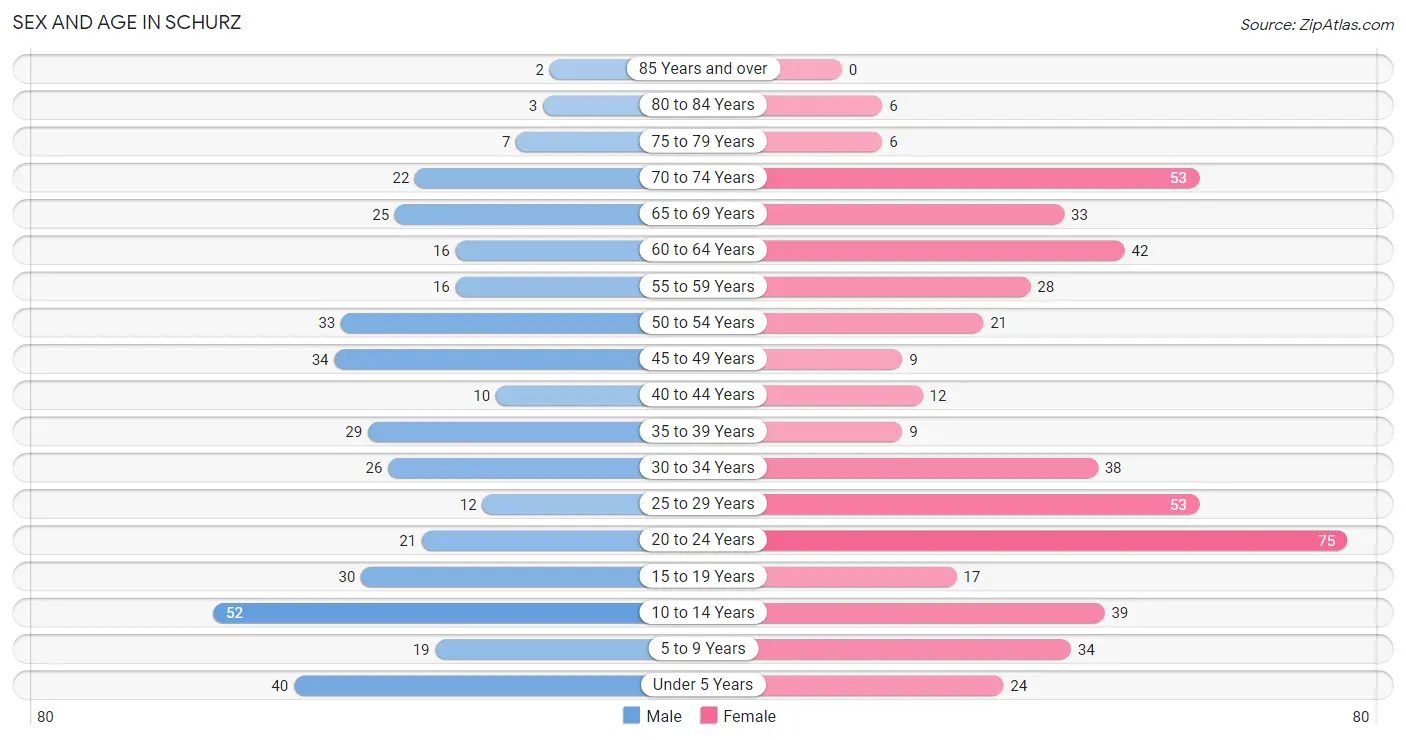
The most populous age groups in Schurz are 10 to 14 Years (52 | 13.1%) for men and 20 to 24 Years (75 | 15.0%) for women.
| Age Bracket | Male | Female |
| Under 5 Years | 40 (10.1%) | 24 (4.8%) |
| 5 to 9 Years | 19 (4.8%) | 34 (6.8%) |
| 10 to 14 Years | 52 (13.1%) | 39 (7.8%) |
| 15 to 19 Years | 30 (7.6%) | 17 (3.4%) |
| 20 to 24 Years | 21 (5.3%) | 75 (15.0%) |
| 25 to 29 Years | 12 (3.0%) | 53 (10.6%) |
| 30 to 34 Years | 26 (6.6%) | 38 (7.6%) |
| 35 to 39 Years | 29 (7.3%) | 9 (1.8%) |
| 40 to 44 Years | 10 (2.5%) | 12 (2.4%) |
| 45 to 49 Years | 34 (8.6%) | 9 (1.8%) |
| 50 to 54 Years | 33 (8.3%) | 21 (4.2%) |
| 55 to 59 Years | 16 (4.0%) | 28 (5.6%) |
| 60 to 64 Years | 16 (4.0%) | 42 (8.4%) |
| 65 to 69 Years | 25 (6.3%) | 33 (6.6%) |
| 70 to 74 Years | 22 (5.5%) | 53 (10.6%) |
| 75 to 79 Years | 7 (1.8%) | 6 (1.2%) |
| 80 to 84 Years | 3 (0.8%) | 6 (1.2%) |
| 85 Years and over | 2 (0.5%) | 0 (0.0%) |
| Total | 397 (100.0%) | 499 (100.0%) |
Families and Households in Schurz
Median Family Size in Schurz
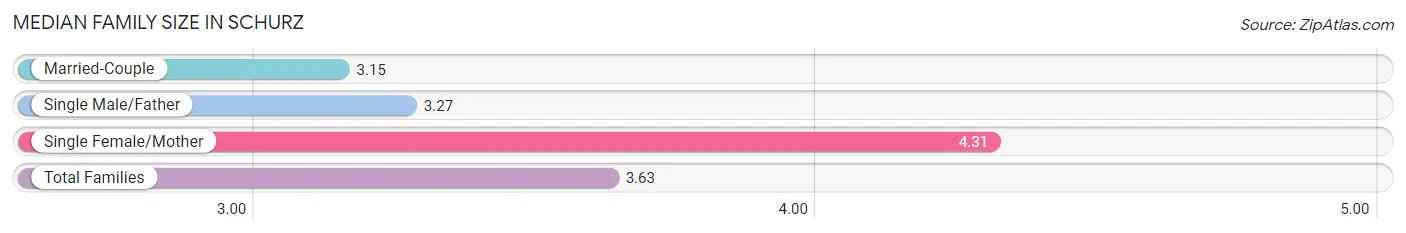
The median family size in Schurz is 3.63 persons per family, with single female/mother families (77 | 38.7%) accounting for the largest median family size of 4.31 persons per family. On the other hand, married-couple families (78 | 39.2%) represent the smallest median family size with 3.15 persons per family.
| Family Type | # Families | Family Size |
| Married-Couple | 78 (39.2%) | 3.15 |
| Single Male/Father | 44 (22.1%) | 3.27 |
| Single Female/Mother | 77 (38.7%) | 4.31 |
| Total Families | 199 (100.0%) | 3.63 |
Median Household Size in Schurz
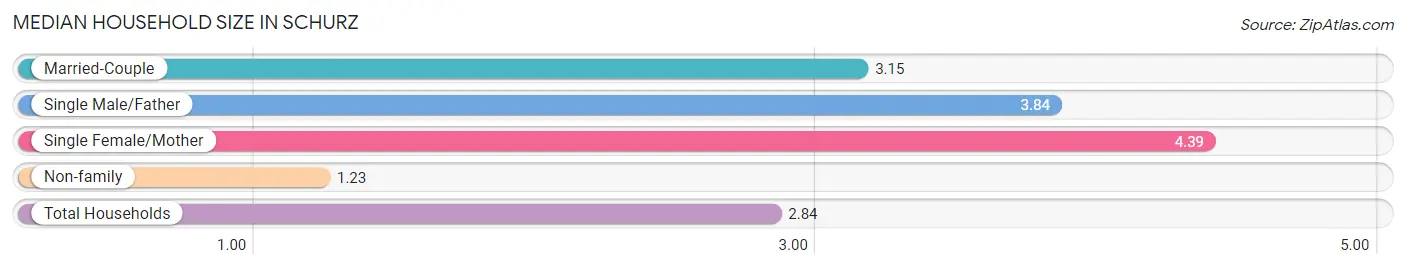
The median household size in Schurz is 2.84 persons per household, with single female/mother households (77 | 24.4%) accounting for the largest median household size of 4.39 persons per household. non-family households (116 | 36.8%) represent the smallest median household size with 1.23 persons per household.
| Household Type | # Households | Household Size |
| Married-Couple | 78 (24.8%) | 3.15 |
| Single Male/Father | 44 (14.0%) | 3.84 |
| Single Female/Mother | 77 (24.4%) | 4.39 |
| Non-family | 116 (36.8%) | 1.23 |
| Total Households | 315 (100.0%) | 2.84 |
Household Size by Marriage Status in Schurz
Out of a total of 315 households in Schurz, 199 (63.2%) are family households, while 116 (36.8%) are nonfamily households. The most numerous type of family households are 2-person households, comprising 70, and the most common type of nonfamily households are 1-person households, comprising 104.
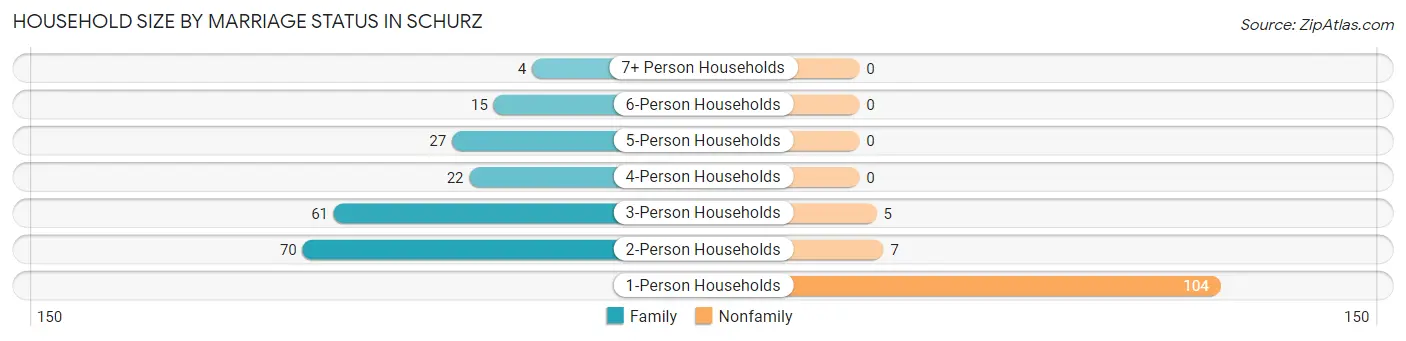
| Household Size | Family Households | Nonfamily Households |
| 1-Person Households | - | 104 (33.0%) |
| 2-Person Households | 70 (22.2%) | 7 (2.2%) |
| 3-Person Households | 61 (19.4%) | 5 (1.6%) |
| 4-Person Households | 22 (7.0%) | 0 (0.0%) |
| 5-Person Households | 27 (8.6%) | 0 (0.0%) |
| 6-Person Households | 15 (4.8%) | 0 (0.0%) |
| 7+ Person Households | 4 (1.3%) | 0 (0.0%) |
| Total | 199 (63.2%) | 116 (36.8%) |
Female Fertility in Schurz
Fertility by Age in Schurz
Average fertility rate in Schurz is 69.0 births per 1,000 women. Women in the age bracket of 35 to 50 years have the highest fertility rate with 121.0 births per 1,000 women. Women in the age bracket of 20 to 34 years acount for 73.3% of all women with births.
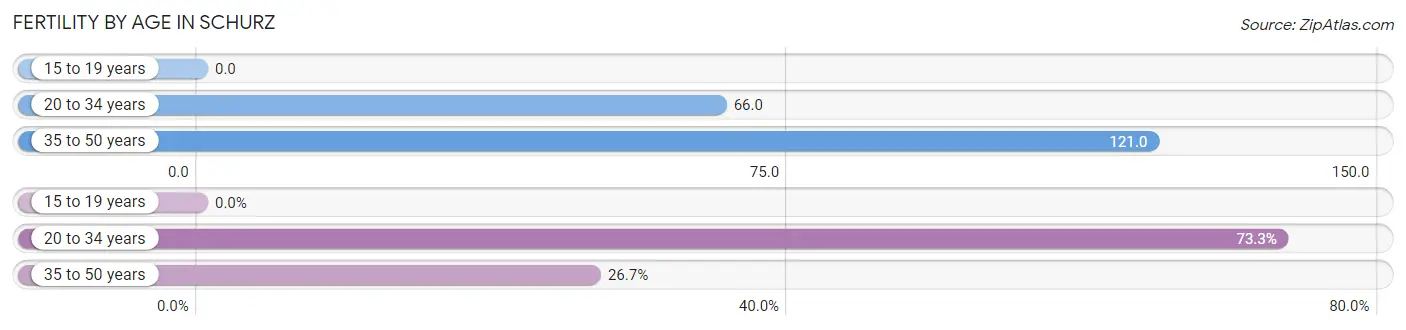
| Age Bracket | Women with Births | Births / 1,000 Women |
| 15 to 19 years | 0 (0.0%) | 0.0 |
| 20 to 34 years | 11 (73.3%) | 66.0 |
| 35 to 50 years | 4 (26.7%) | 121.0 |
| Total | 15 (100.0%) | 69.0 |
Fertility by Age by Marriage Status in Schurz
26.7% of women with births (15) in Schurz are married. The highest percentage of unmarried women with births falls into 20 to 34 years age bracket with 100.0% of them unmarried at the time of birth, while the lowest percentage of unmarried women with births belong to 35 to 50 years age bracket with 0.0% of them unmarried.
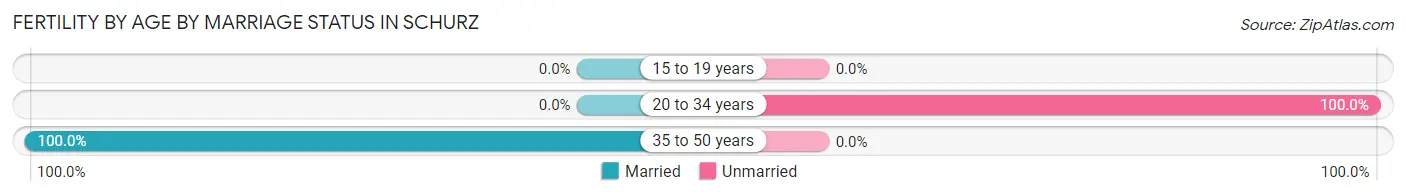
| Age Bracket | Married | Unmarried |
| 15 to 19 years | 0 (0.0%) | 0 (0.0%) |
| 20 to 34 years | 0 (0.0%) | 11 (100.0%) |
| 35 to 50 years | 4 (100.0%) | 0 (0.0%) |
| Total | 4 (26.7%) | 11 (73.3%) |
Fertility by Education in Schurz
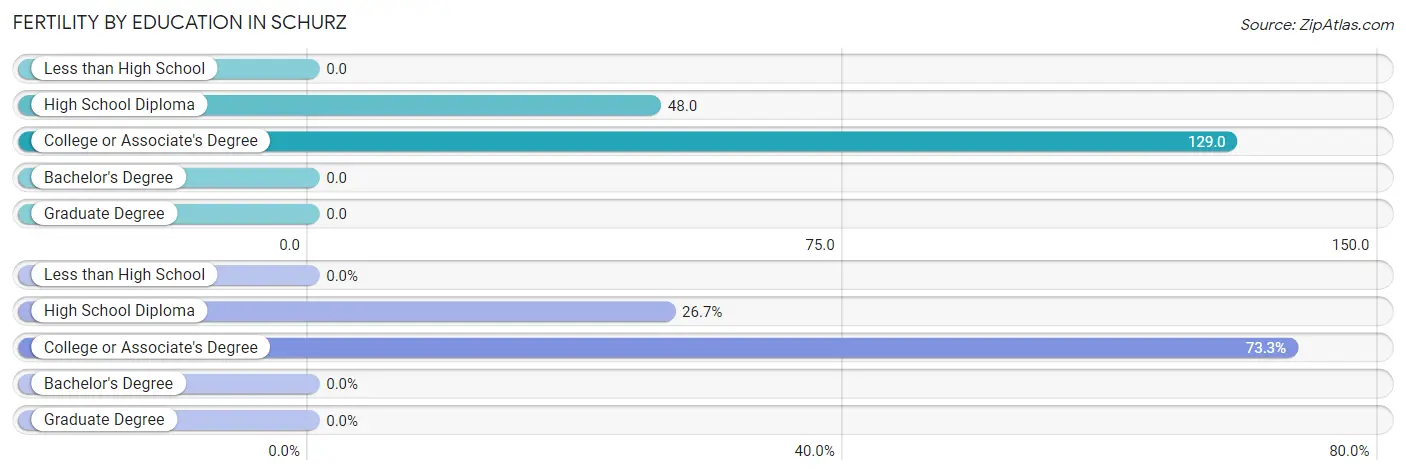
| Educational Attainment | Women with Births | Births / 1,000 Women |
| Less than High School | 0 (0.0%) | 0.0 |
| High School Diploma | 4 (26.7%) | 48.0 |
| College or Associate's Degree | 11 (73.3%) | 129.0 |
| Bachelor's Degree | 0 (0.0%) | 0.0 |
| Graduate Degree | 0 (0.0%) | 0.0 |
| Total | 15 (100.0%) | 69.0 |
Fertility by Education by Marriage Status in Schurz
73.3% of women with births in Schurz are unmarried. Women with the educational attainment of college or associate's degree are most likely to be married with 36.4% of them married at childbirth, while women with the educational attainment of high school diploma are least likely to be married with 100.0% of them unmarried at childbirth.
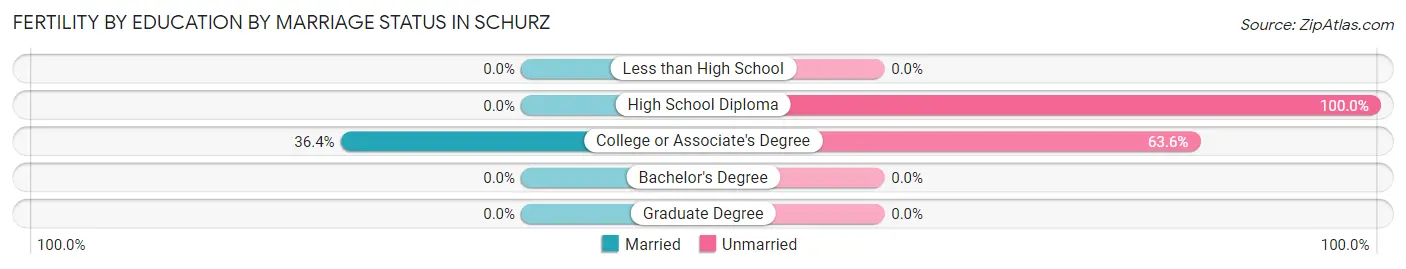
| Educational Attainment | Married | Unmarried |
| Less than High School | 0 (0.0%) | 0 (0.0%) |
| High School Diploma | 0 (0.0%) | 4 (100.0%) |
| College or Associate's Degree | 4 (36.4%) | 7 (63.6%) |
| Bachelor's Degree | 0 (0.0%) | 0 (0.0%) |
| Graduate Degree | 0 (0.0%) | 0 (0.0%) |
| Total | 4 (26.7%) | 11 (73.3%) |
Employment Characteristics in Schurz
Employment by Class of Employer in Schurz
Among the 285 employed individuals in Schurz, private company employees (82 | 28.8%), federal government employees (80 | 28.1%), and local government employees (78 | 27.4%) make up the most common classes of employment.
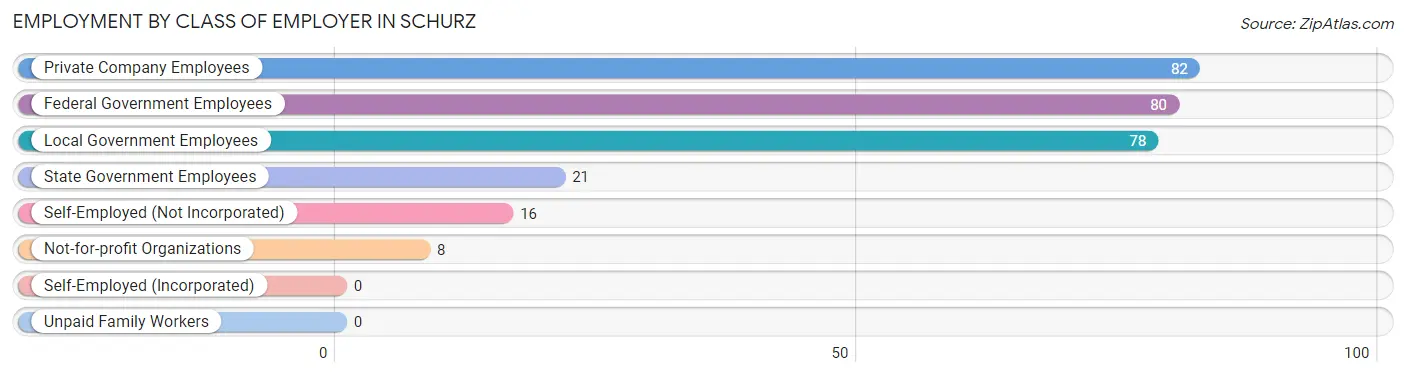
| Employer Class | # Employees | % Employees |
| Private Company Employees | 82 | 28.8% |
| Self-Employed (Incorporated) | 0 | 0.0% |
| Self-Employed (Not Incorporated) | 16 | 5.6% |
| Not-for-profit Organizations | 8 | 2.8% |
| Local Government Employees | 78 | 27.4% |
| State Government Employees | 21 | 7.4% |
| Federal Government Employees | 80 | 28.1% |
| Unpaid Family Workers | 0 | 0.0% |
| Total | 285 | 100.0% |
Employment Status by Age in Schurz
According to the labor force statistics for Schurz, out of the total population over 16 years of age (679), 53.9% or 366 individuals are in the labor force, with 15.8% or 58 of them unemployed. The age group with the highest labor force participation rate is 20 to 24 years, with 90.6% or 87 individuals in the labor force. Within the labor force, the 45 to 54 years age range has the highest percentage of unemployed individuals, with 28.8% or 17 of them being unemployed.
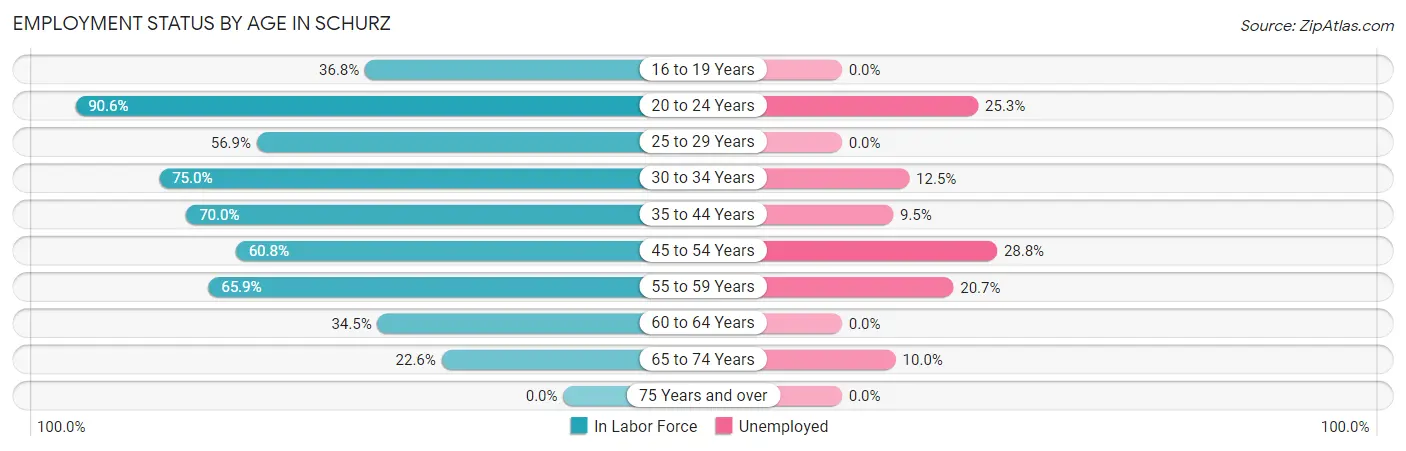
| Age Bracket | In Labor Force | Unemployed |
| 16 to 19 Years | 14 (36.8%) | 0 (0.0%) |
| 20 to 24 Years | 87 (90.6%) | 22 (25.3%) |
| 25 to 29 Years | 37 (56.9%) | 0 (0.0%) |
| 30 to 34 Years | 48 (75.0%) | 6 (12.5%) |
| 35 to 44 Years | 42 (70.0%) | 4 (9.5%) |
| 45 to 54 Years | 59 (60.8%) | 17 (28.8%) |
| 55 to 59 Years | 29 (65.9%) | 6 (20.7%) |
| 60 to 64 Years | 20 (34.5%) | 0 (0.0%) |
| 65 to 74 Years | 30 (22.6%) | 3 (10.0%) |
| 75 Years and over | 0 (0.0%) | 0 (0.0%) |
| Total | 366 (53.9%) | 58 (15.8%) |
Employment Status by Educational Attainment in Schurz
According to labor force statistics for Schurz, 60.6% of individuals (235) out of the total population between 25 and 64 years of age (388) are in the labor force, with 14.0% or 33 of them being unemployed. The group with the highest labor force participation rate are those with the educational attainment of bachelor's degree or higher, with 87.1% or 27 individuals in the labor force. Within the labor force, individuals with less than high school education have the highest percentage of unemployment, with 34.1% or 14 of them being unemployed.
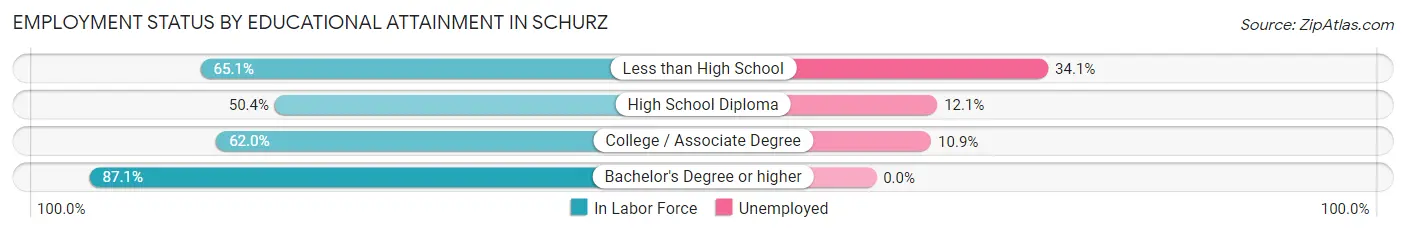
| Educational Attainment | In Labor Force | Unemployed |
| Less than High School | 41 (65.1%) | 21 (34.1%) |
| High School Diploma | 66 (50.4%) | 16 (12.1%) |
| College / Associate Degree | 101 (62.0%) | 18 (10.9%) |
| Bachelor's Degree or higher | 27 (87.1%) | 0 (0.0%) |
| Total | 235 (60.6%) | 54 (14.0%) |
Employment Occupations by Sex in Schurz
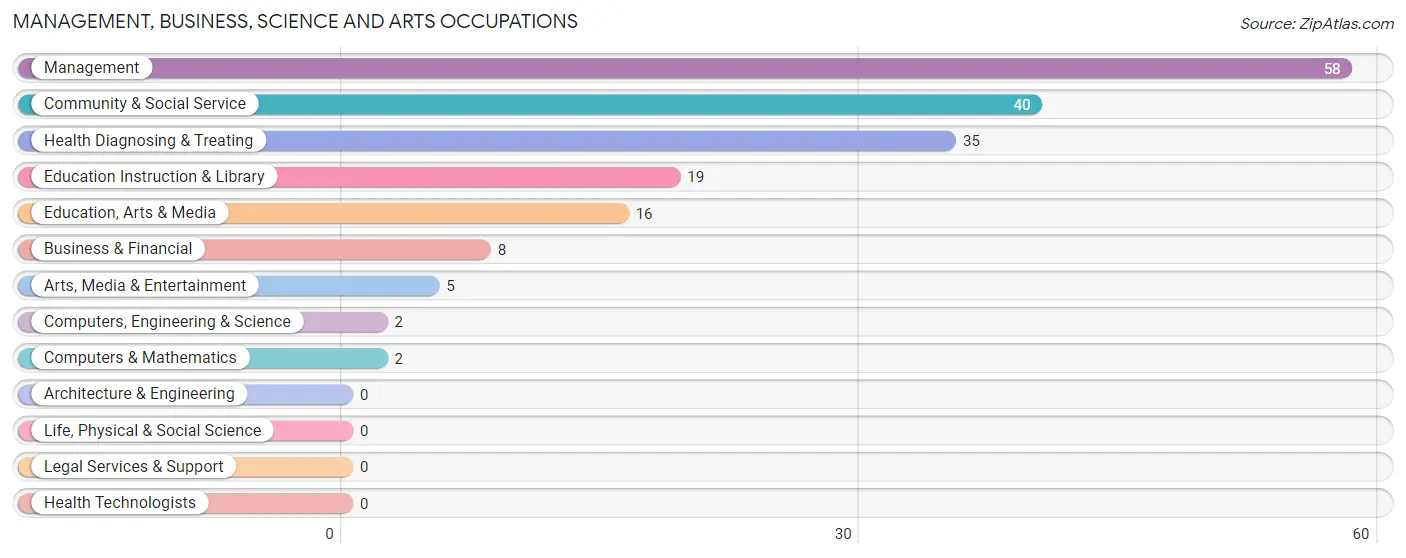
Management, Business, Science and Arts Occupations
The most common Management, Business, Science and Arts occupations in Schurz are Management (58 | 18.8%), Community & Social Service (40 | 13.0%), Health Diagnosing & Treating (35 | 11.4%), Education Instruction & Library (19 | 6.2%), and Education, Arts & Media (16 | 5.2%).
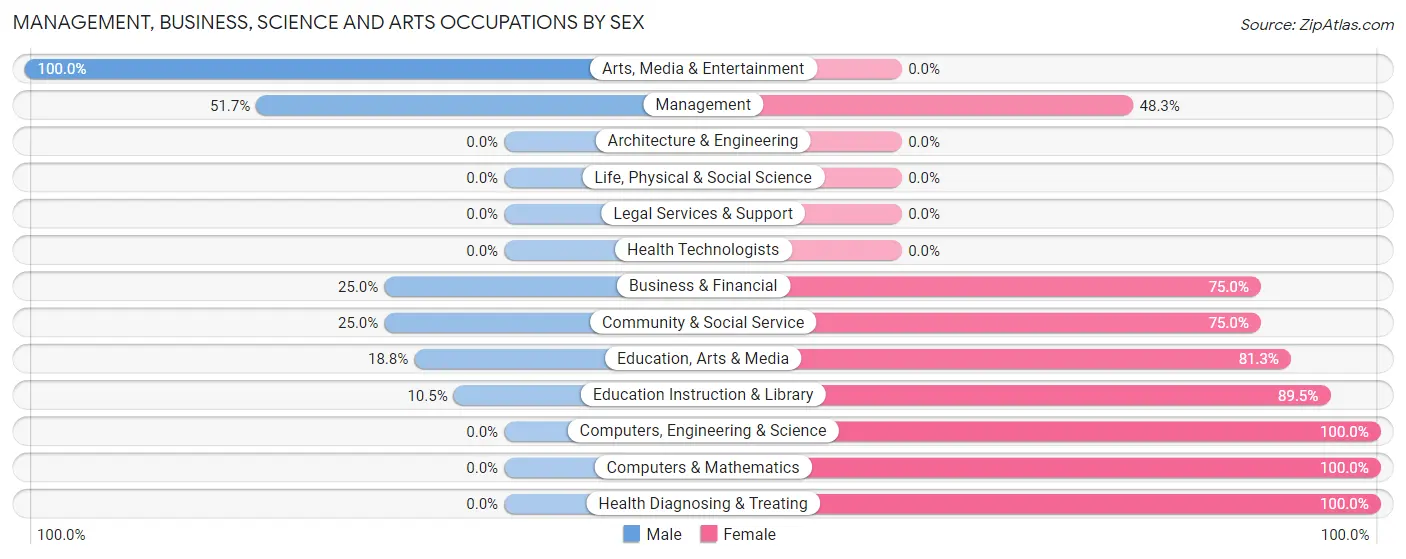
Management, Business, Science and Arts Occupations by Sex
Within the Management, Business, Science and Arts occupations in Schurz, the most male-oriented occupations are Arts, Media & Entertainment (100.0%), Management (51.7%), and Business & Financial (25.0%), while the most female-oriented occupations are Computers, Engineering & Science (100.0%), Computers & Mathematics (100.0%), and Health Diagnosing & Treating (100.0%).
| Occupation | Male | Female |
| Management | 30 (51.7%) | 28 (48.3%) |
| Business & Financial | 2 (25.0%) | 6 (75.0%) |
| Computers, Engineering & Science | 0 (0.0%) | 2 (100.0%) |
| Computers & Mathematics | 0 (0.0%) | 2 (100.0%) |
| Architecture & Engineering | 0 (0.0%) | 0 (0.0%) |
| Life, Physical & Social Science | 0 (0.0%) | 0 (0.0%) |
| Community & Social Service | 10 (25.0%) | 30 (75.0%) |
| Education, Arts & Media | 3 (18.8%) | 13 (81.2%) |
| Legal Services & Support | 0 (0.0%) | 0 (0.0%) |
| Education Instruction & Library | 2 (10.5%) | 17 (89.5%) |
| Arts, Media & Entertainment | 5 (100.0%) | 0 (0.0%) |
| Health Diagnosing & Treating | 0 (0.0%) | 35 (100.0%) |
| Health Technologists | 0 (0.0%) | 0 (0.0%) |
| Total (Category) | 42 (29.4%) | 101 (70.6%) |
| Total (Overall) | 141 (45.8%) | 167 (54.2%) |
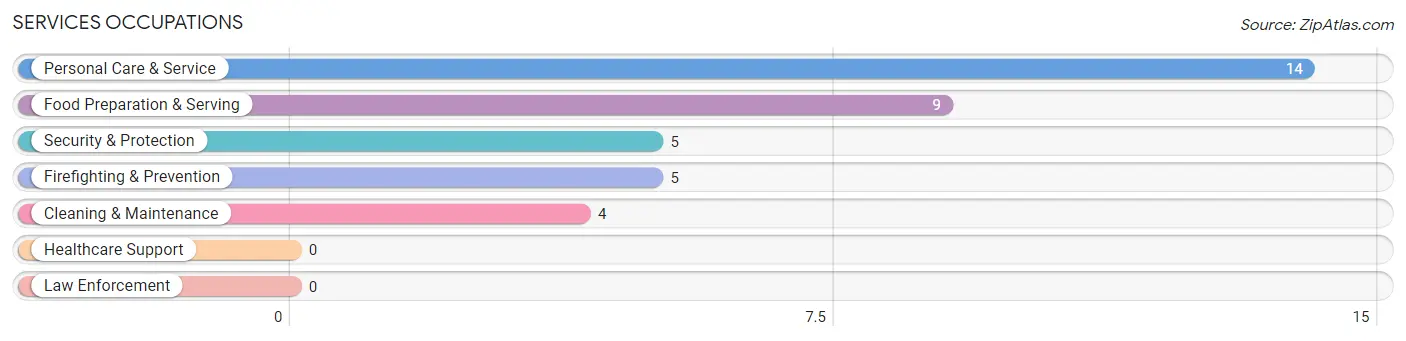
Services Occupations
The most common Services occupations in Schurz are Personal Care & Service (14 | 4.5%), Food Preparation & Serving (9 | 2.9%), Security & Protection (5 | 1.6%), Firefighting & Prevention (5 | 1.6%), and Cleaning & Maintenance (4 | 1.3%).
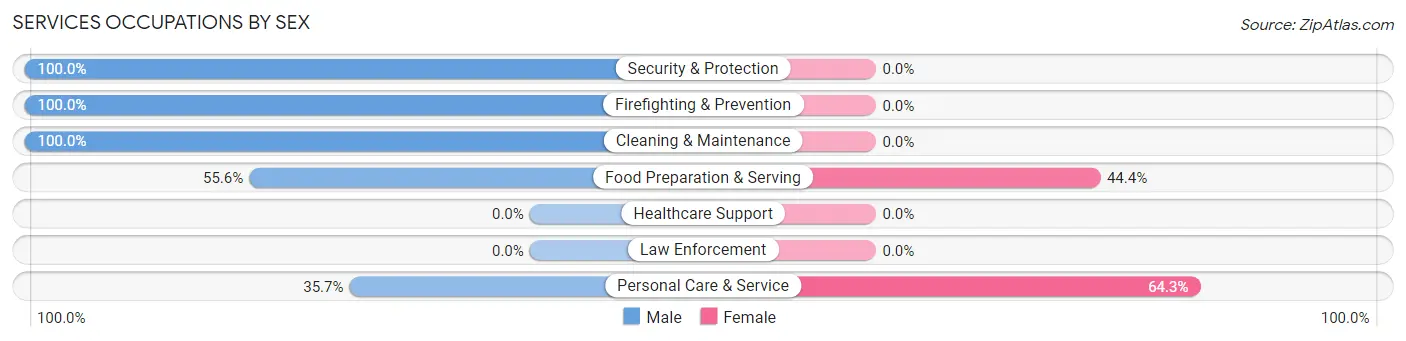
Services Occupations by Sex
Within the Services occupations in Schurz, the most male-oriented occupations are Security & Protection (100.0%), Firefighting & Prevention (100.0%), and Cleaning & Maintenance (100.0%), while the most female-oriented occupations are Personal Care & Service (64.3%), and Food Preparation & Serving (44.4%).
| Occupation | Male | Female |
| Healthcare Support | 0 (0.0%) | 0 (0.0%) |
| Security & Protection | 5 (100.0%) | 0 (0.0%) |
| Firefighting & Prevention | 5 (100.0%) | 0 (0.0%) |
| Law Enforcement | 0 (0.0%) | 0 (0.0%) |
| Food Preparation & Serving | 5 (55.6%) | 4 (44.4%) |
| Cleaning & Maintenance | 4 (100.0%) | 0 (0.0%) |
| Personal Care & Service | 5 (35.7%) | 9 (64.3%) |
| Total (Category) | 19 (59.4%) | 13 (40.6%) |
| Total (Overall) | 141 (45.8%) | 167 (54.2%) |
Sales and Office Occupations
The most common Sales and Office occupations in Schurz are Office & Administration (19 | 6.2%), and Sales & Related (12 | 3.9%).
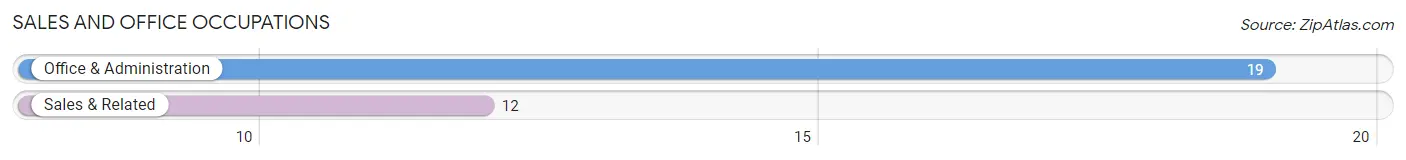
Sales and Office Occupations by Sex
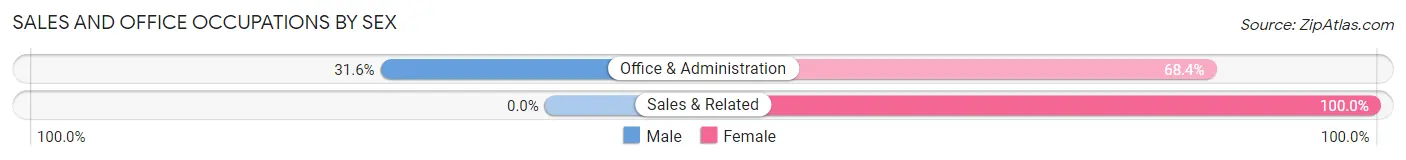
| Occupation | Male | Female |
| Sales & Related | 0 (0.0%) | 12 (100.0%) |
| Office & Administration | 6 (31.6%) | 13 (68.4%) |
| Total (Category) | 6 (19.4%) | 25 (80.6%) |
| Total (Overall) | 141 (45.8%) | 167 (54.2%) |
Natural Resources, Construction and Maintenance Occupations
The most common Natural Resources, Construction and Maintenance occupations in Schurz are , and Construction & Extraction (18 | 5.8%).
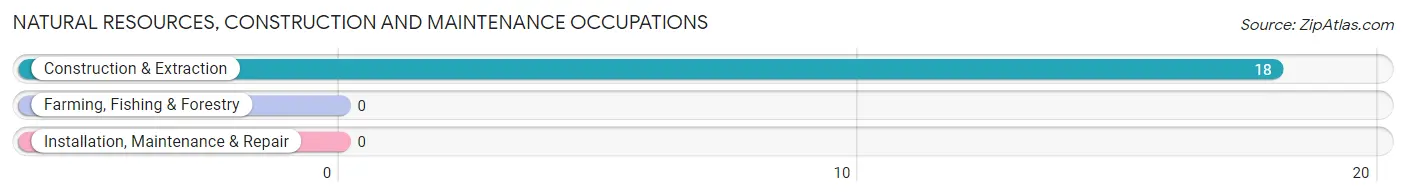
Natural Resources, Construction and Maintenance Occupations by Sex
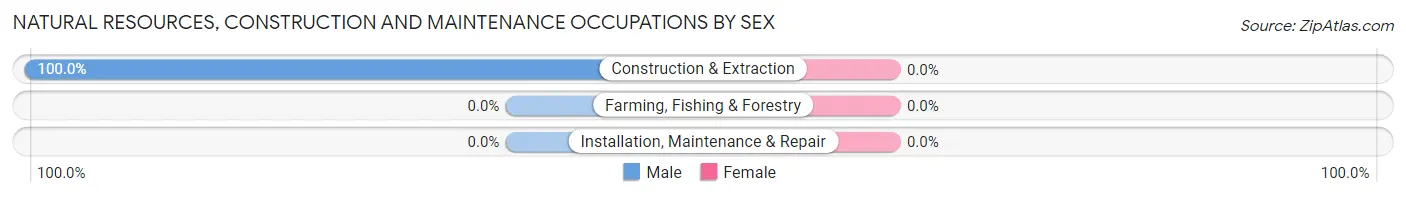
| Occupation | Male | Female |
| Farming, Fishing & Forestry | 0 (0.0%) | 0 (0.0%) |
| Construction & Extraction | 18 (100.0%) | 0 (0.0%) |
| Installation, Maintenance & Repair | 0 (0.0%) | 0 (0.0%) |
| Total (Category) | 18 (100.0%) | 0 (0.0%) |
| Total (Overall) | 141 (45.8%) | 167 (54.2%) |
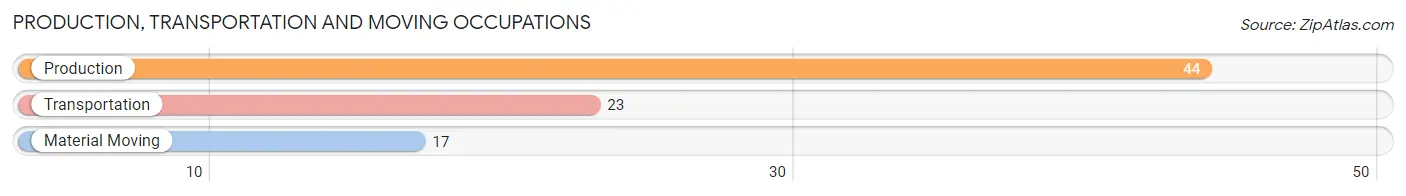
Production, Transportation and Moving Occupations
The most common Production, Transportation and Moving occupations in Schurz are Production (44 | 14.3%), Transportation (23 | 7.5%), and Material Moving (17 | 5.5%).
Production, Transportation and Moving Occupations by Sex
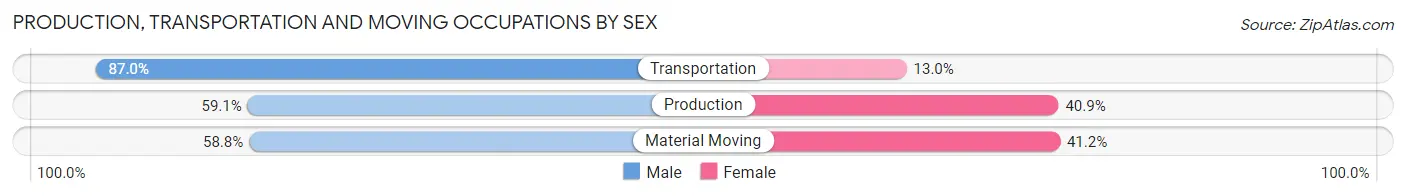
| Occupation | Male | Female |
| Production | 26 (59.1%) | 18 (40.9%) |
| Transportation | 20 (87.0%) | 3 (13.0%) |
| Material Moving | 10 (58.8%) | 7 (41.2%) |
| Total (Category) | 56 (66.7%) | 28 (33.3%) |
| Total (Overall) | 141 (45.8%) | 167 (54.2%) |
Employment Industries by Sex in Schurz
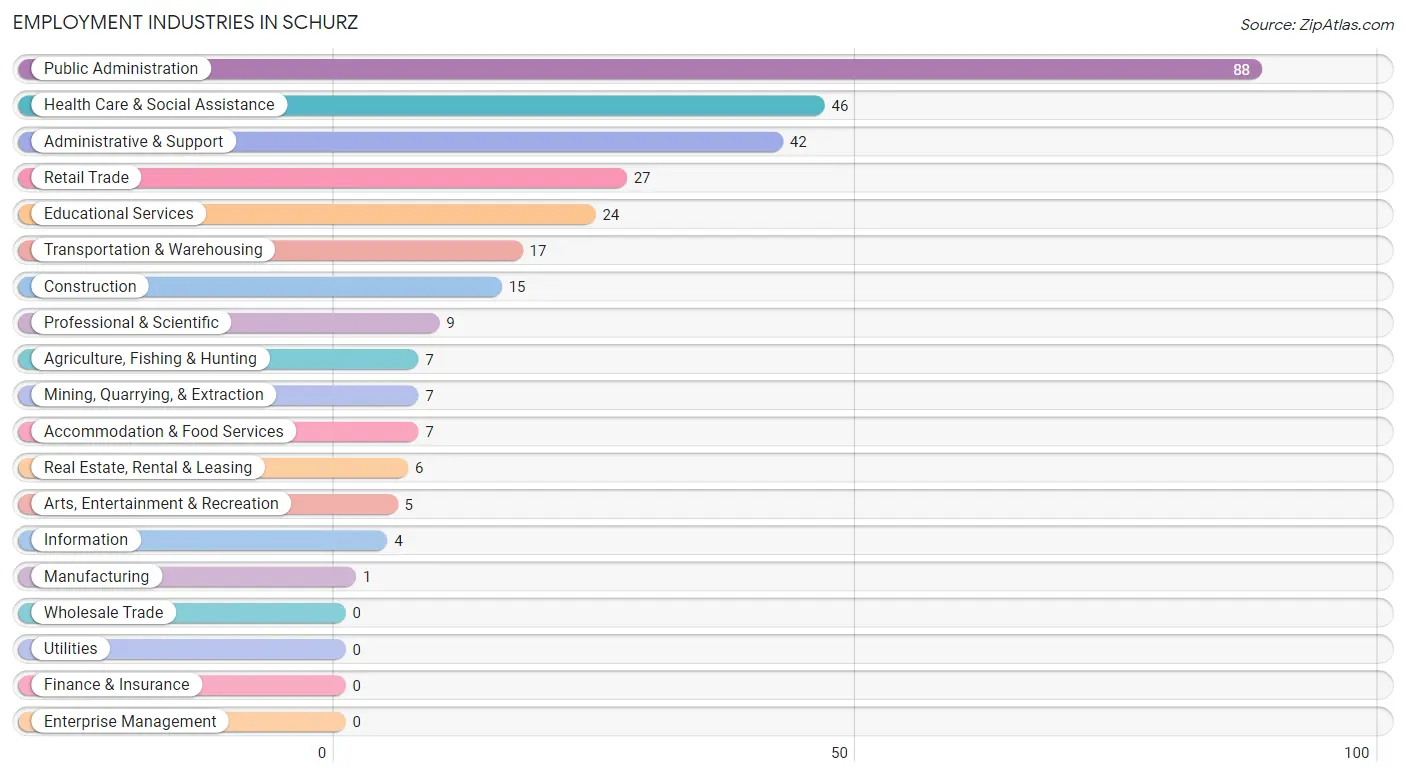
Employment Industries in Schurz
The major employment industries in Schurz include Public Administration (88 | 28.6%), Health Care & Social Assistance (46 | 14.9%), Administrative & Support (42 | 13.6%), Retail Trade (27 | 8.8%), and Educational Services (24 | 7.8%).
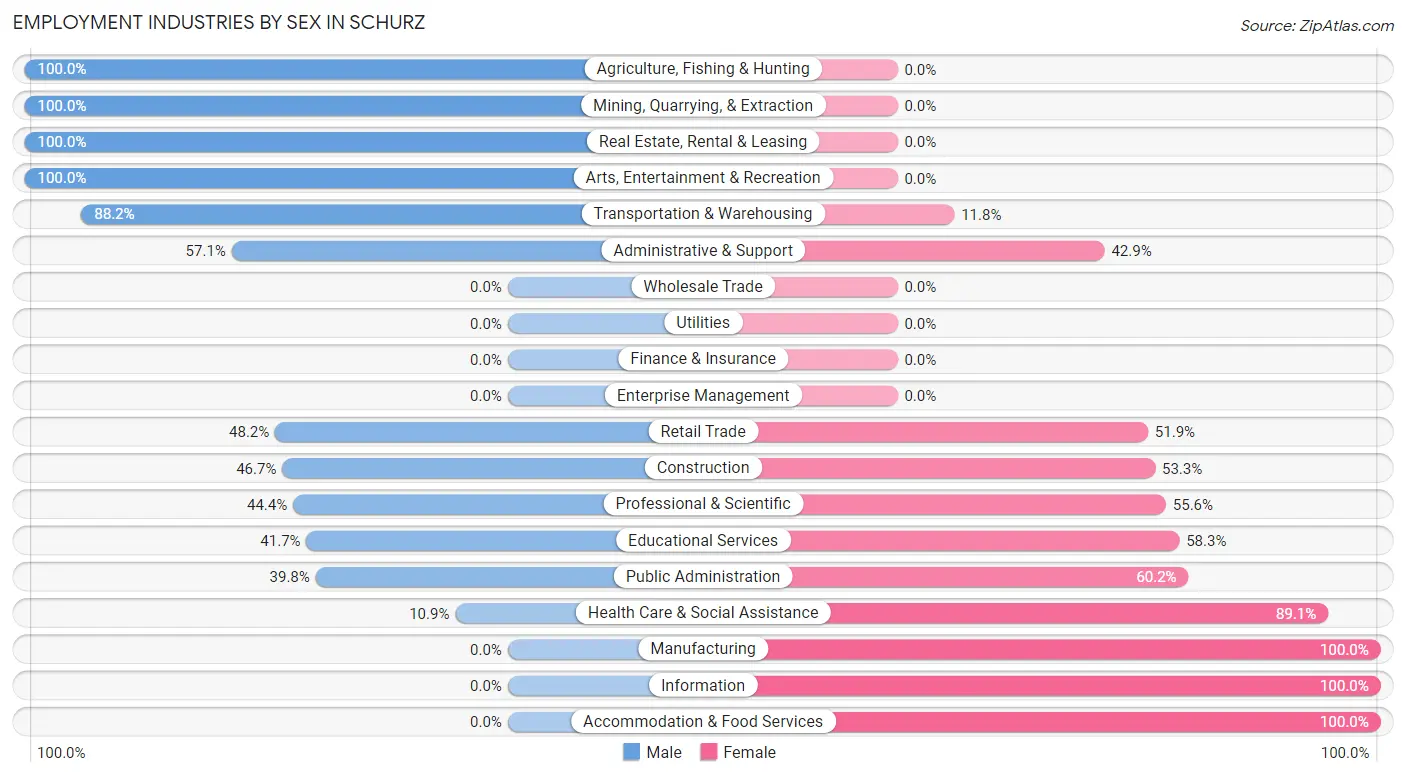
Employment Industries by Sex in Schurz
The Schurz industries that see more men than women are Agriculture, Fishing & Hunting (100.0%), Mining, Quarrying, & Extraction (100.0%), and Real Estate, Rental & Leasing (100.0%), whereas the industries that tend to have a higher number of women are Manufacturing (100.0%), Information (100.0%), and Accommodation & Food Services (100.0%).
| Industry | Male | Female |
| Agriculture, Fishing & Hunting | 7 (100.0%) | 0 (0.0%) |
| Mining, Quarrying, & Extraction | 7 (100.0%) | 0 (0.0%) |
| Construction | 7 (46.7%) | 8 (53.3%) |
| Manufacturing | 0 (0.0%) | 1 (100.0%) |
| Wholesale Trade | 0 (0.0%) | 0 (0.0%) |
| Retail Trade | 13 (48.1%) | 14 (51.8%) |
| Transportation & Warehousing | 15 (88.2%) | 2 (11.8%) |
| Utilities | 0 (0.0%) | 0 (0.0%) |
| Information | 0 (0.0%) | 4 (100.0%) |
| Finance & Insurance | 0 (0.0%) | 0 (0.0%) |
| Real Estate, Rental & Leasing | 6 (100.0%) | 0 (0.0%) |
| Professional & Scientific | 4 (44.4%) | 5 (55.6%) |
| Enterprise Management | 0 (0.0%) | 0 (0.0%) |
| Administrative & Support | 24 (57.1%) | 18 (42.9%) |
| Educational Services | 10 (41.7%) | 14 (58.3%) |
| Health Care & Social Assistance | 5 (10.9%) | 41 (89.1%) |
| Arts, Entertainment & Recreation | 5 (100.0%) | 0 (0.0%) |
| Accommodation & Food Services | 0 (0.0%) | 7 (100.0%) |
| Public Administration | 35 (39.8%) | 53 (60.2%) |
| Total | 141 (45.8%) | 167 (54.2%) |
Education in Schurz
School Enrollment in Schurz
The most common levels of schooling among the 180 students in Schurz are high school (59 | 32.8%), middle school (51 | 28.3%), and elementary school (37 | 20.6%).
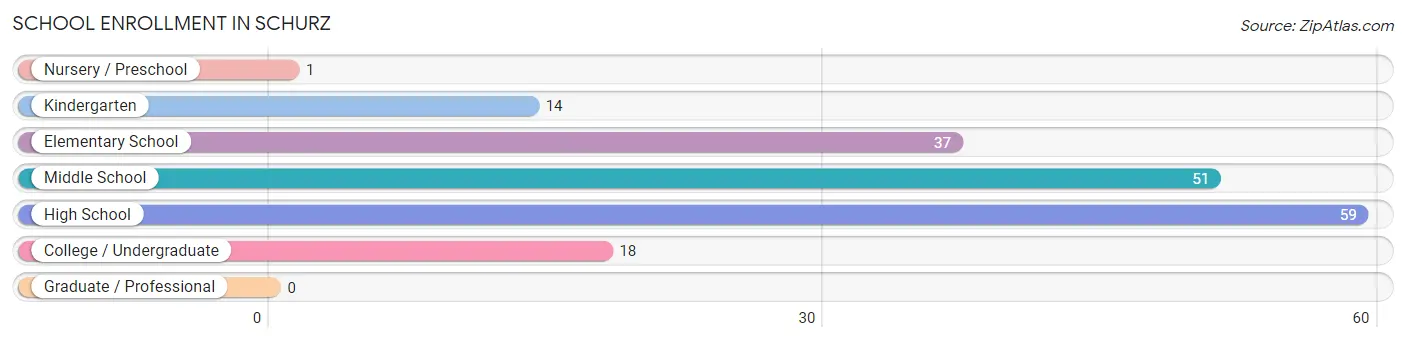
| School Level | # Students | % Students |
| Nursery / Preschool | 1 | 0.6% |
| Kindergarten | 14 | 7.8% |
| Elementary School | 37 | 20.6% |
| Middle School | 51 | 28.3% |
| High School | 59 | 32.8% |
| College / Undergraduate | 18 | 10.0% |
| Graduate / Professional | 0 | 0.0% |
| Total | 180 | 100.0% |
School Enrollment by Age by Funding Source in Schurz
Out of a total of 180 students who are enrolled in schools in Schurz, 24 (13.3%) attend a private institution, while the remaining 156 (86.7%) are enrolled in public schools. The age group of 35 years and over has the highest likelihood of being enrolled in private schools, with 6 (100.0% in the age bracket) enrolled. Conversely, the age group of 3 to 4 year olds has the lowest likelihood of being enrolled in a private school, with 6 (100.0% in the age bracket) attending a public institution.
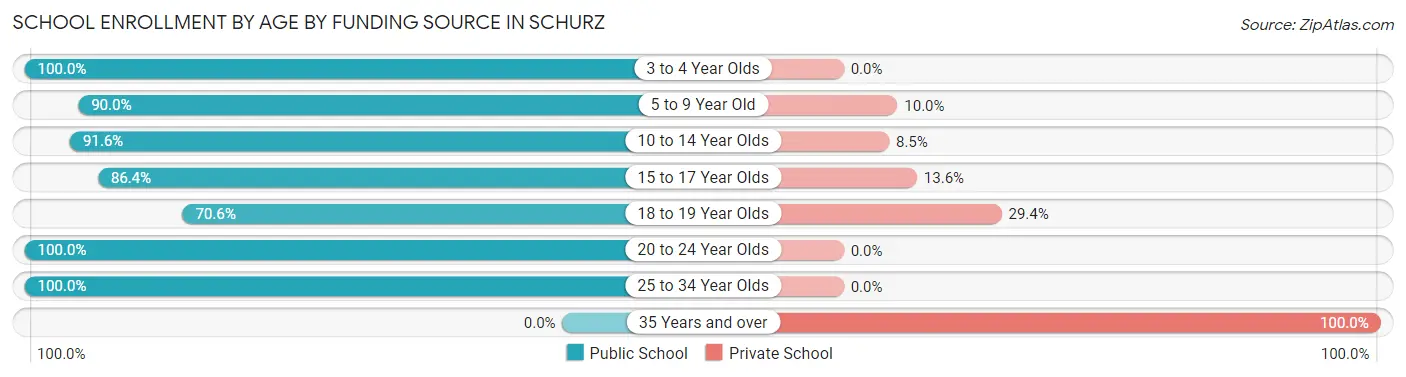
| Age Bracket | Public School | Private School |
| 3 to 4 Year Olds | 6 (100.0%) | 0 (0.0%) |
| 5 to 9 Year Old | 36 (90.0%) | 4 (10.0%) |
| 10 to 14 Year Olds | 65 (91.5%) | 6 (8.5%) |
| 15 to 17 Year Olds | 19 (86.4%) | 3 (13.6%) |
| 18 to 19 Year Olds | 12 (70.6%) | 5 (29.4%) |
| 20 to 24 Year Olds | 5 (100.0%) | 0 (0.0%) |
| 25 to 34 Year Olds | 13 (100.0%) | 0 (0.0%) |
| 35 Years and over | 0 (0.0%) | 6 (100.0%) |
| Total | 156 (86.7%) | 24 (13.3%) |
Educational Attainment by Field of Study in Schurz
Education (24 | 34.8%), bio, nature & agricultural (15 | 21.7%), business (14 | 20.3%), engineering (5 | 7.2%), and psychology (4 | 5.8%) are the most common fields of study among 69 individuals in Schurz who have obtained a bachelor's degree or higher.
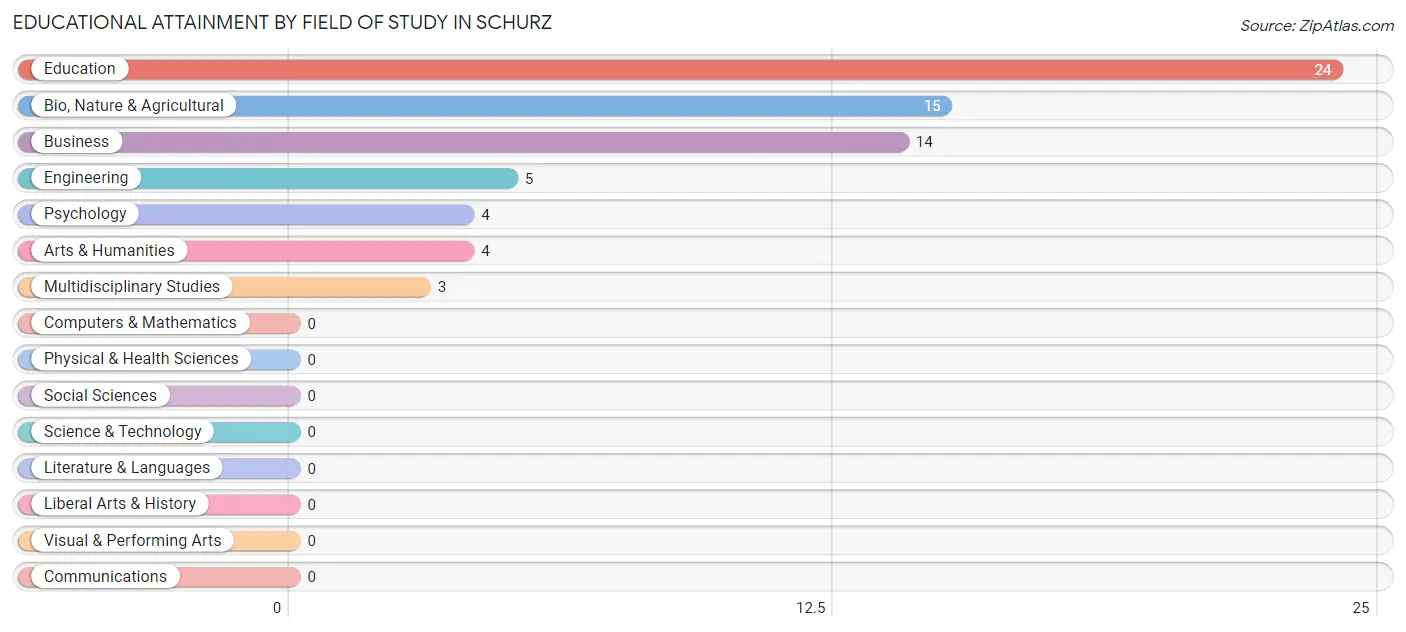
| Field of Study | # Graduates | % Graduates |
| Computers & Mathematics | 0 | 0.0% |
| Bio, Nature & Agricultural | 15 | 21.7% |
| Physical & Health Sciences | 0 | 0.0% |
| Psychology | 4 | 5.8% |
| Social Sciences | 0 | 0.0% |
| Engineering | 5 | 7.2% |
| Multidisciplinary Studies | 3 | 4.3% |
| Science & Technology | 0 | 0.0% |
| Business | 14 | 20.3% |
| Education | 24 | 34.8% |
| Literature & Languages | 0 | 0.0% |
| Liberal Arts & History | 0 | 0.0% |
| Visual & Performing Arts | 0 | 0.0% |
| Communications | 0 | 0.0% |
| Arts & Humanities | 4 | 5.8% |
| Total | 69 | 100.0% |
Transportation & Commute in Schurz
Vehicle Availability by Sex in Schurz
The most prevalent vehicle ownership categories in Schurz are males with 1 vehicle (70, accounting for 49.6%) and females with 1 vehicle (34, making up 48.6%).
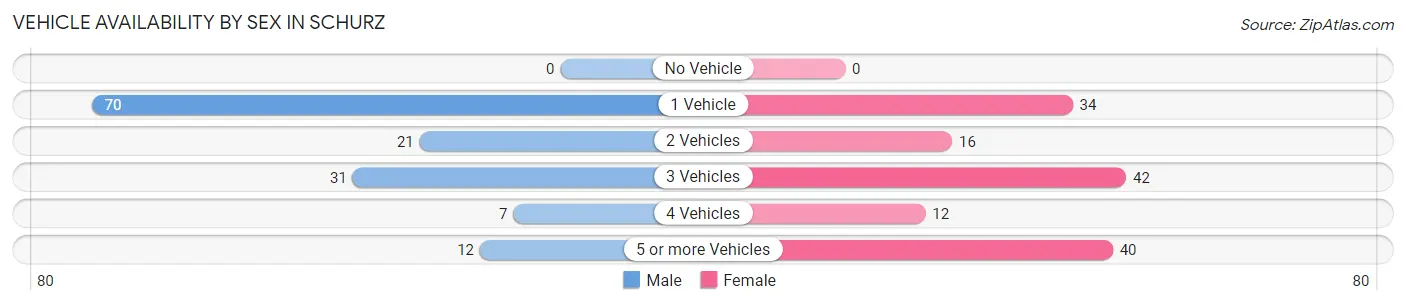
| Vehicles Available | Male | Female |
| No Vehicle | 0 (0.0%) | 0 (0.0%) |
| 1 Vehicle | 70 (49.6%) | 34 (23.6%) |
| 2 Vehicles | 21 (14.9%) | 16 (11.1%) |
| 3 Vehicles | 31 (22.0%) | 42 (29.2%) |
| 4 Vehicles | 7 (5.0%) | 12 (8.3%) |
| 5 or more Vehicles | 12 (8.5%) | 40 (27.8%) |
| Total | 141 (100.0%) | 144 (100.0%) |
Commute Time in Schurz
The most frequently occuring commute durations in Schurz are 5 to 9 minutes (103 commuters, 39.3%), 30 to 34 minutes (54 commuters, 20.6%), and 10 to 14 minutes (32 commuters, 12.2%).
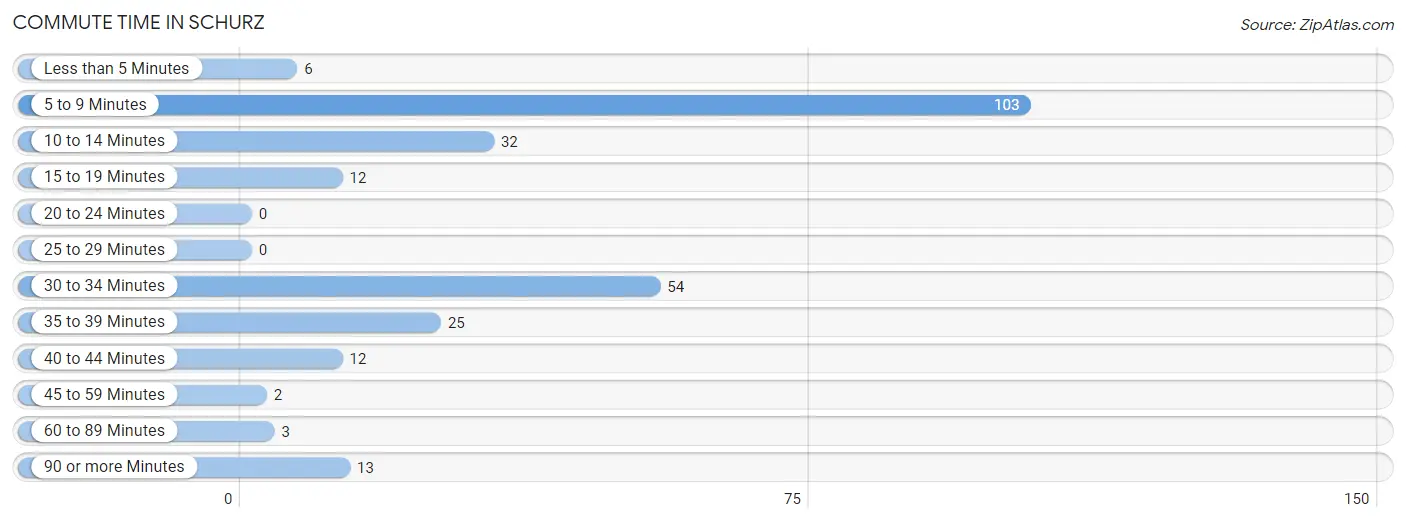
| Commute Time | # Commuters | % Commuters |
| Less than 5 Minutes | 6 | 2.3% |
| 5 to 9 Minutes | 103 | 39.3% |
| 10 to 14 Minutes | 32 | 12.2% |
| 15 to 19 Minutes | 12 | 4.6% |
| 20 to 24 Minutes | 0 | 0.0% |
| 25 to 29 Minutes | 0 | 0.0% |
| 30 to 34 Minutes | 54 | 20.6% |
| 35 to 39 Minutes | 25 | 9.5% |
| 40 to 44 Minutes | 12 | 4.6% |
| 45 to 59 Minutes | 2 | 0.8% |
| 60 to 89 Minutes | 3 | 1.1% |
| 90 or more Minutes | 13 | 5.0% |
Commute Time by Sex in Schurz
The most common commute times in Schurz are 30 to 34 minutes (48 commuters, 37.5%) for males and 5 to 9 minutes (74 commuters, 55.2%) for females.
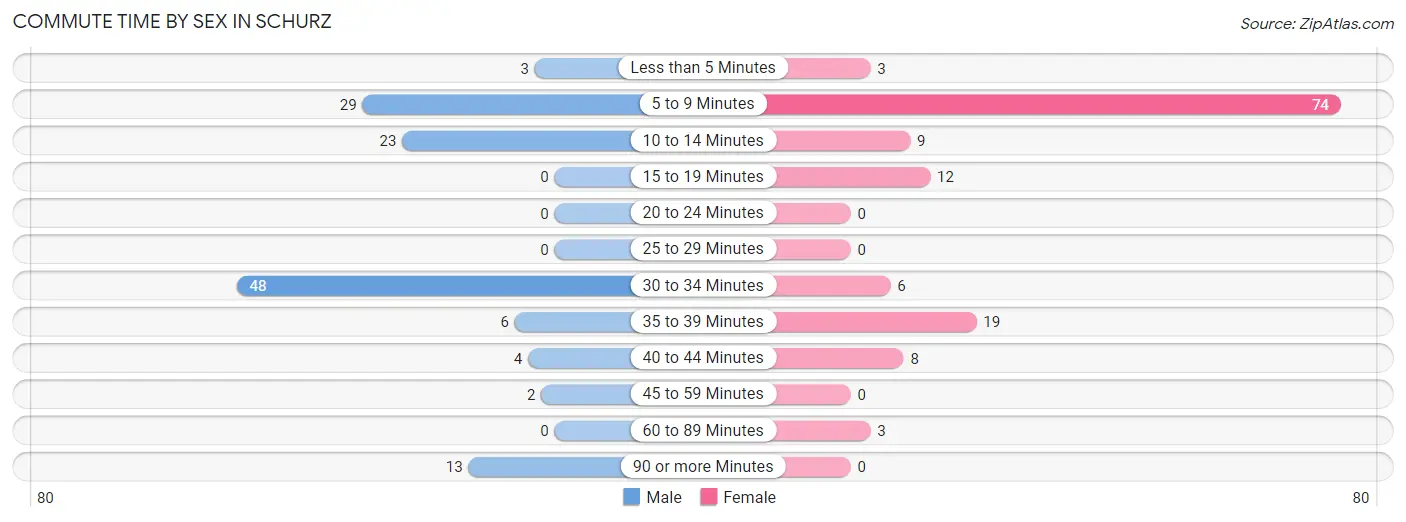
| Commute Time | Male | Female |
| Less than 5 Minutes | 3 (2.3%) | 3 (2.2%) |
| 5 to 9 Minutes | 29 (22.7%) | 74 (55.2%) |
| 10 to 14 Minutes | 23 (18.0%) | 9 (6.7%) |
| 15 to 19 Minutes | 0 (0.0%) | 12 (9.0%) |
| 20 to 24 Minutes | 0 (0.0%) | 0 (0.0%) |
| 25 to 29 Minutes | 0 (0.0%) | 0 (0.0%) |
| 30 to 34 Minutes | 48 (37.5%) | 6 (4.5%) |
| 35 to 39 Minutes | 6 (4.7%) | 19 (14.2%) |
| 40 to 44 Minutes | 4 (3.1%) | 8 (6.0%) |
| 45 to 59 Minutes | 2 (1.6%) | 0 (0.0%) |
| 60 to 89 Minutes | 0 (0.0%) | 3 (2.2%) |
| 90 or more Minutes | 13 (10.2%) | 0 (0.0%) |
Time of Departure to Work by Sex in Schurz
The most frequent times of departure to work in Schurz are 12:00 AM to 4:59 AM (39, 30.5%) for males and 7:30 AM to 7:59 AM (69, 51.5%) for females.
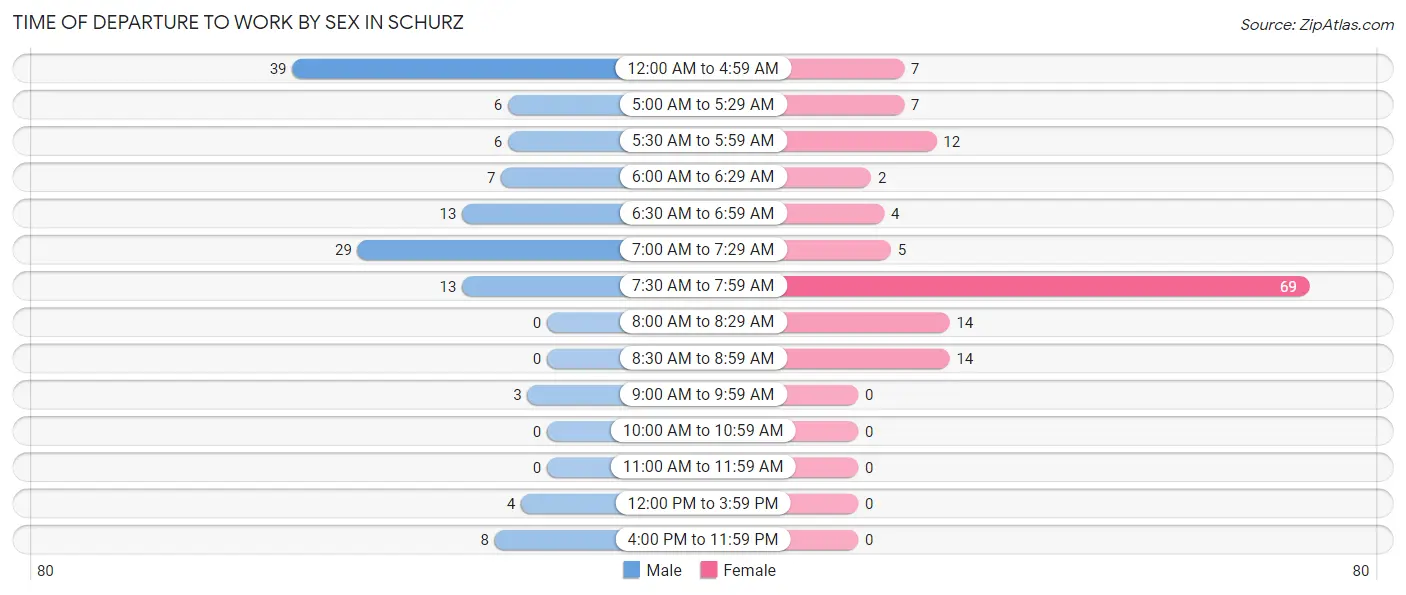
| Time of Departure | Male | Female |
| 12:00 AM to 4:59 AM | 39 (30.5%) | 7 (5.2%) |
| 5:00 AM to 5:29 AM | 6 (4.7%) | 7 (5.2%) |
| 5:30 AM to 5:59 AM | 6 (4.7%) | 12 (9.0%) |
| 6:00 AM to 6:29 AM | 7 (5.5%) | 2 (1.5%) |
| 6:30 AM to 6:59 AM | 13 (10.2%) | 4 (3.0%) |
| 7:00 AM to 7:29 AM | 29 (22.7%) | 5 (3.7%) |
| 7:30 AM to 7:59 AM | 13 (10.2%) | 69 (51.5%) |
| 8:00 AM to 8:29 AM | 0 (0.0%) | 14 (10.4%) |
| 8:30 AM to 8:59 AM | 0 (0.0%) | 14 (10.4%) |
| 9:00 AM to 9:59 AM | 3 (2.3%) | 0 (0.0%) |
| 10:00 AM to 10:59 AM | 0 (0.0%) | 0 (0.0%) |
| 11:00 AM to 11:59 AM | 0 (0.0%) | 0 (0.0%) |
| 12:00 PM to 3:59 PM | 4 (3.1%) | 0 (0.0%) |
| 4:00 PM to 11:59 PM | 8 (6.2%) | 0 (0.0%) |
| Total | 128 (100.0%) | 134 (100.0%) |
Housing Occupancy in Schurz
Occupancy by Ownership in Schurz
Of the total 315 dwellings in Schurz, owner-occupied units account for 207 (65.7%), while renter-occupied units make up 108 (34.3%).
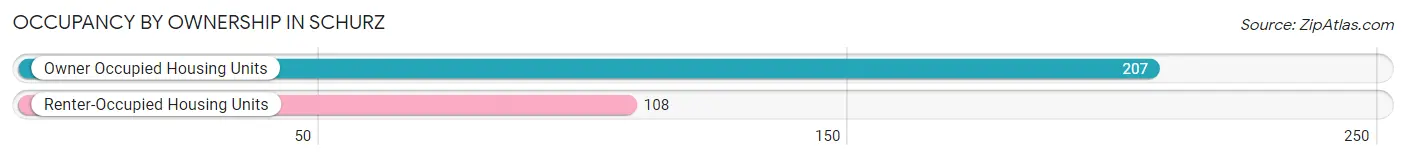
| Occupancy | # Housing Units | % Housing Units |
| Owner Occupied Housing Units | 207 | 65.7% |
| Renter-Occupied Housing Units | 108 | 34.3% |
| Total Occupied Housing Units | 315 | 100.0% |
Occupancy by Household Size in Schurz
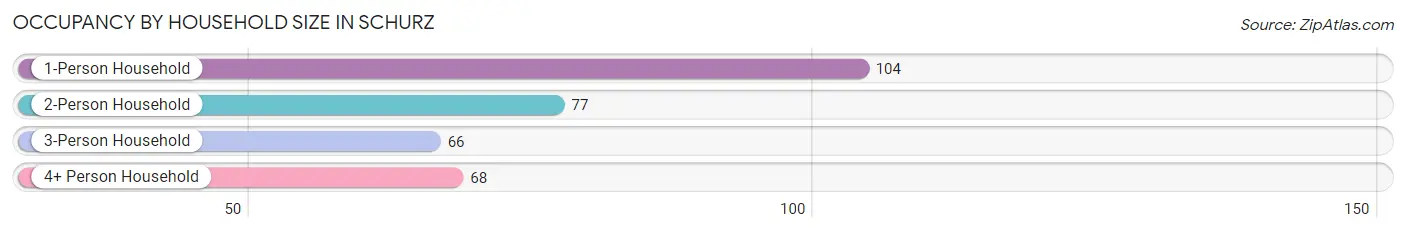
| Household Size | # Housing Units | % Housing Units |
| 1-Person Household | 104 | 33.0% |
| 2-Person Household | 77 | 24.4% |
| 3-Person Household | 66 | 20.9% |
| 4+ Person Household | 68 | 21.6% |
| Total Housing Units | 315 | 100.0% |
Occupancy by Ownership by Household Size in Schurz
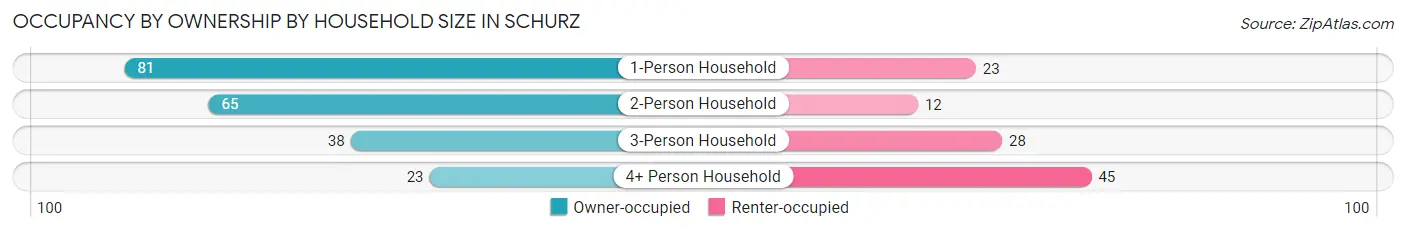
| Household Size | Owner-occupied | Renter-occupied |
| 1-Person Household | 81 (77.9%) | 23 (22.1%) |
| 2-Person Household | 65 (84.4%) | 12 (15.6%) |
| 3-Person Household | 38 (57.6%) | 28 (42.4%) |
| 4+ Person Household | 23 (33.8%) | 45 (66.2%) |
| Total Housing Units | 207 (65.7%) | 108 (34.3%) |
Occupancy by Educational Attainment in Schurz
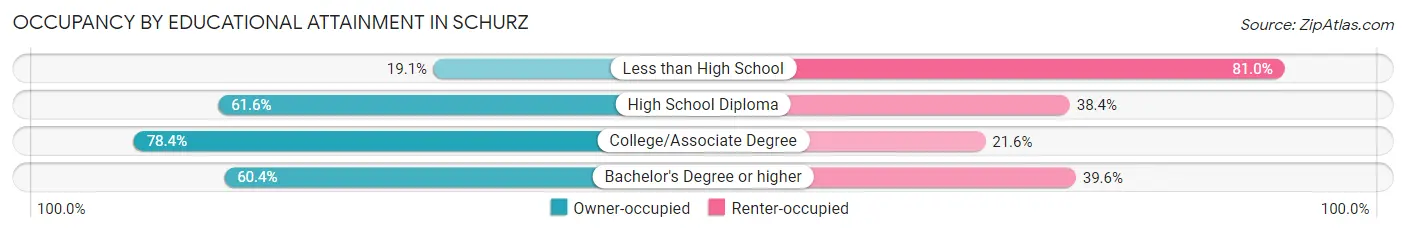
| Household Size | Owner-occupied | Renter-occupied |
| Less than High School | 4 (19.1%) | 17 (80.9%) |
| High School Diploma | 69 (61.6%) | 43 (38.4%) |
| College/Associate Degree | 105 (78.4%) | 29 (21.6%) |
| Bachelor's Degree or higher | 29 (60.4%) | 19 (39.6%) |
Occupancy by Age of Householder in Schurz
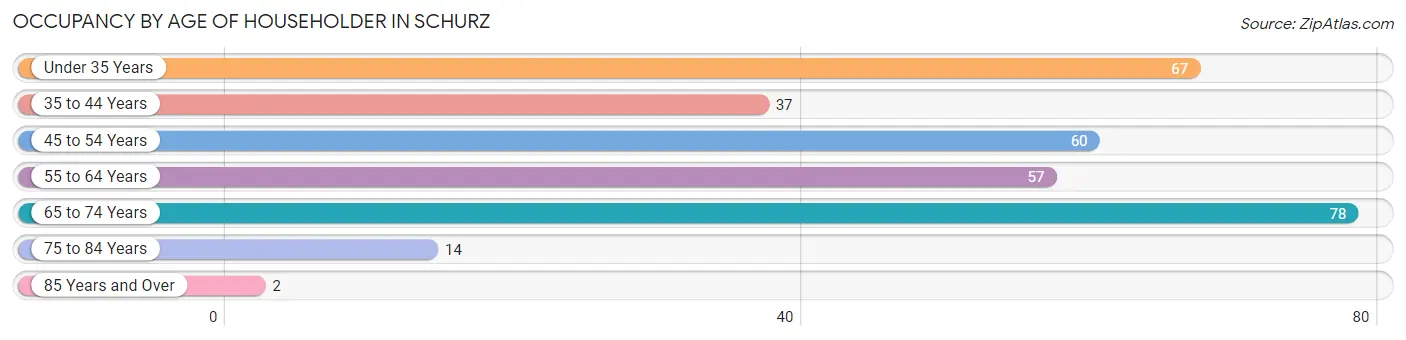
| Age Bracket | # Households | % Households |
| Under 35 Years | 67 | 21.3% |
| 35 to 44 Years | 37 | 11.7% |
| 45 to 54 Years | 60 | 19.1% |
| 55 to 64 Years | 57 | 18.1% |
| 65 to 74 Years | 78 | 24.8% |
| 75 to 84 Years | 14 | 4.4% |
| 85 Years and Over | 2 | 0.6% |
| Total | 315 | 100.0% |
Housing Finances in Schurz
Median Income by Occupancy in Schurz
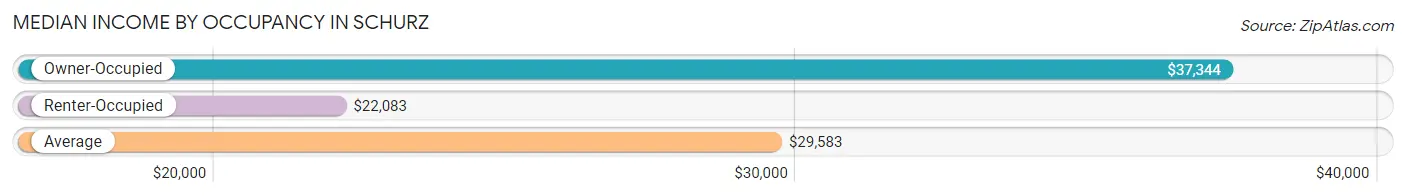
| Occupancy Type | # Households | Median Income |
| Owner-Occupied | 207 (65.7%) | $37,344 |
| Renter-Occupied | 108 (34.3%) | $22,083 |
| Average | 315 (100.0%) | $29,583 |
Occupancy by Householder Income Bracket in Schurz
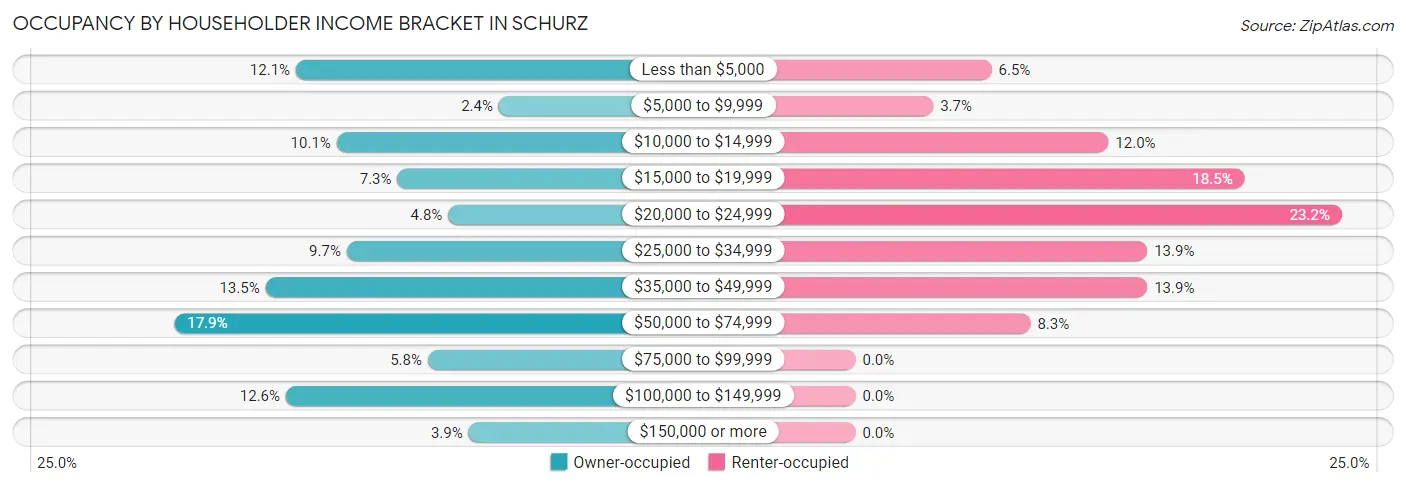
| Income Bracket | Owner-occupied | Renter-occupied |
| Less than $5,000 | 25 (12.1%) | 7 (6.5%) |
| $5,000 to $9,999 | 5 (2.4%) | 4 (3.7%) |
| $10,000 to $14,999 | 21 (10.1%) | 13 (12.0%) |
| $15,000 to $19,999 | 15 (7.2%) | 20 (18.5%) |
| $20,000 to $24,999 | 10 (4.8%) | 25 (23.2%) |
| $25,000 to $34,999 | 20 (9.7%) | 15 (13.9%) |
| $35,000 to $49,999 | 28 (13.5%) | 15 (13.9%) |
| $50,000 to $74,999 | 37 (17.9%) | 9 (8.3%) |
| $75,000 to $99,999 | 12 (5.8%) | 0 (0.0%) |
| $100,000 to $149,999 | 26 (12.6%) | 0 (0.0%) |
| $150,000 or more | 8 (3.9%) | 0 (0.0%) |
| Total | 207 (100.0%) | 108 (100.0%) |
Monthly Housing Cost Tiers in Schurz
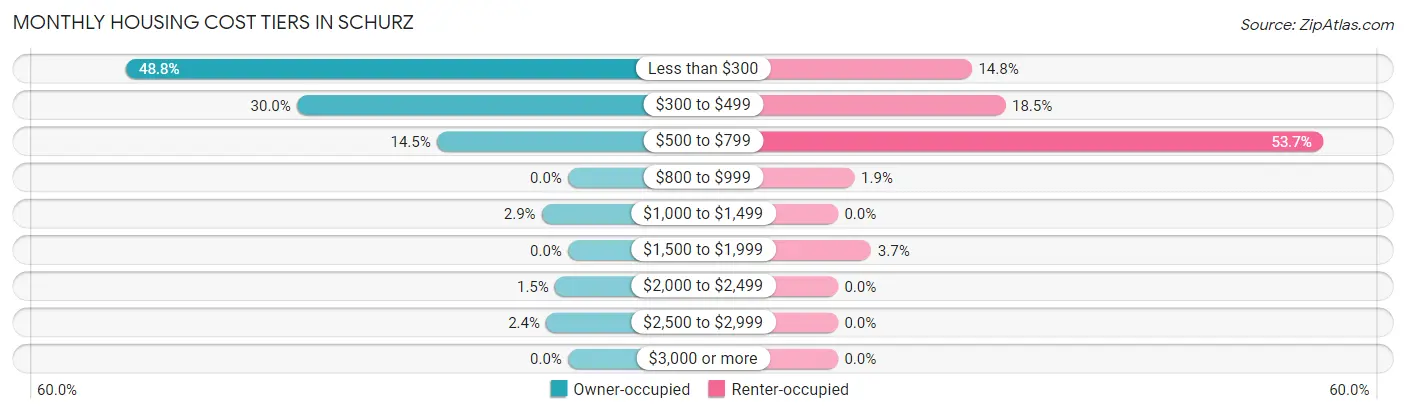
| Monthly Cost | Owner-occupied | Renter-occupied |
| Less than $300 | 101 (48.8%) | 16 (14.8%) |
| $300 to $499 | 62 (29.9%) | 20 (18.5%) |
| $500 to $799 | 30 (14.5%) | 58 (53.7%) |
| $800 to $999 | 0 (0.0%) | 2 (1.8%) |
| $1,000 to $1,499 | 6 (2.9%) | 0 (0.0%) |
| $1,500 to $1,999 | 0 (0.0%) | 4 (3.7%) |
| $2,000 to $2,499 | 3 (1.5%) | 0 (0.0%) |
| $2,500 to $2,999 | 5 (2.4%) | 0 (0.0%) |
| $3,000 or more | 0 (0.0%) | 0 (0.0%) |
| Total | 207 (100.0%) | 108 (100.0%) |
Physical Housing Characteristics in Schurz
Housing Structures in Schurz
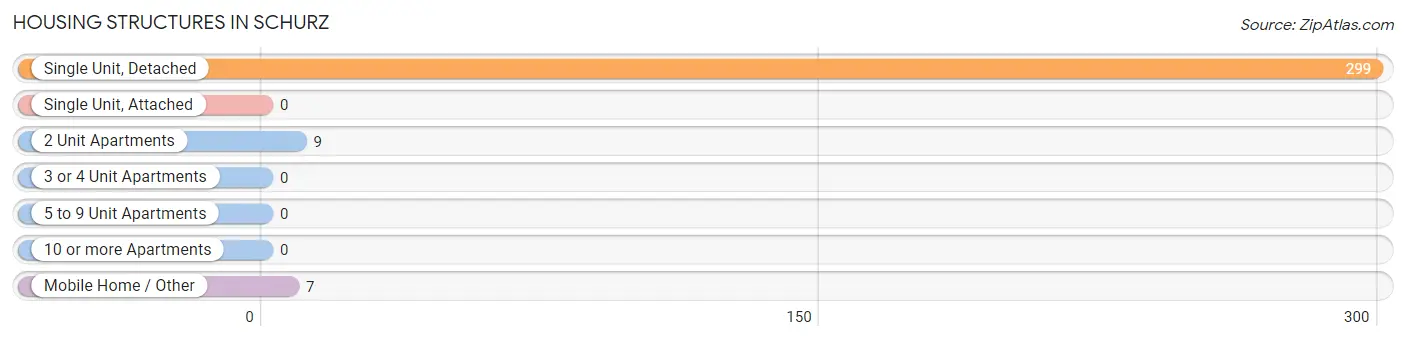
| Structure Type | # Housing Units | % Housing Units |
| Single Unit, Detached | 299 | 94.9% |
| Single Unit, Attached | 0 | 0.0% |
| 2 Unit Apartments | 9 | 2.9% |
| 3 or 4 Unit Apartments | 0 | 0.0% |
| 5 to 9 Unit Apartments | 0 | 0.0% |
| 10 or more Apartments | 0 | 0.0% |
| Mobile Home / Other | 7 | 2.2% |
| Total | 315 | 100.0% |
Housing Structures by Occupancy in Schurz
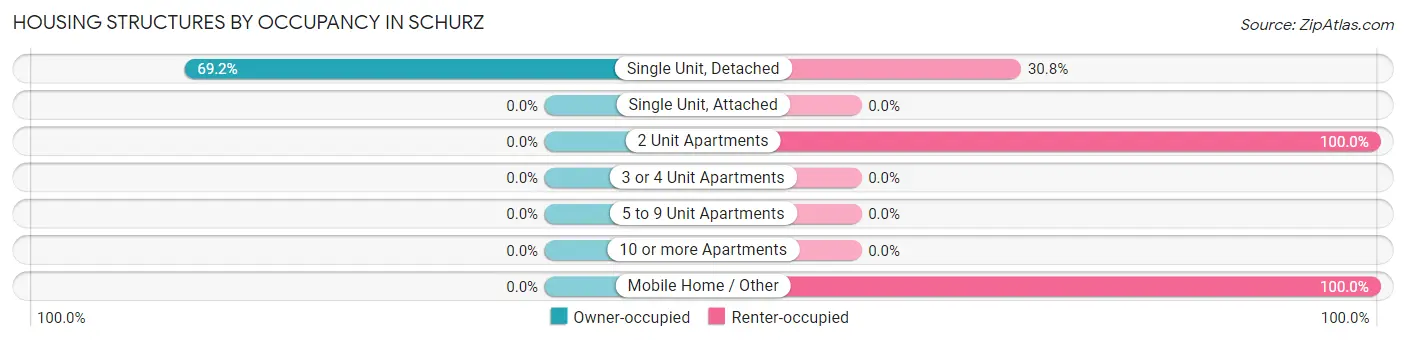
| Structure Type | Owner-occupied | Renter-occupied |
| Single Unit, Detached | 207 (69.2%) | 92 (30.8%) |
| Single Unit, Attached | 0 (0.0%) | 0 (0.0%) |
| 2 Unit Apartments | 0 (0.0%) | 9 (100.0%) |
| 3 or 4 Unit Apartments | 0 (0.0%) | 0 (0.0%) |
| 5 to 9 Unit Apartments | 0 (0.0%) | 0 (0.0%) |
| 10 or more Apartments | 0 (0.0%) | 0 (0.0%) |
| Mobile Home / Other | 0 (0.0%) | 7 (100.0%) |
| Total | 207 (65.7%) | 108 (34.3%) |
Housing Structures by Number of Rooms in Schurz
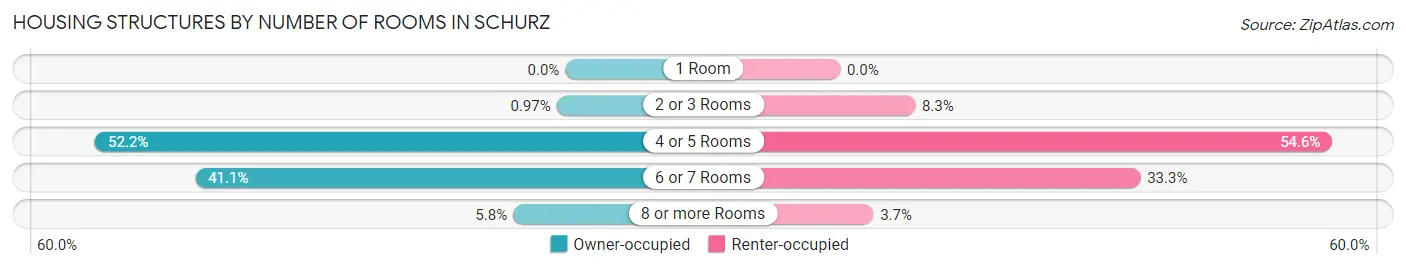
| Number of Rooms | Owner-occupied | Renter-occupied |
| 1 Room | 0 (0.0%) | 0 (0.0%) |
| 2 or 3 Rooms | 2 (1.0%) | 9 (8.3%) |
| 4 or 5 Rooms | 108 (52.2%) | 59 (54.6%) |
| 6 or 7 Rooms | 85 (41.1%) | 36 (33.3%) |
| 8 or more Rooms | 12 (5.8%) | 4 (3.7%) |
| Total | 207 (100.0%) | 108 (100.0%) |
Housing Structure by Heating Type in Schurz
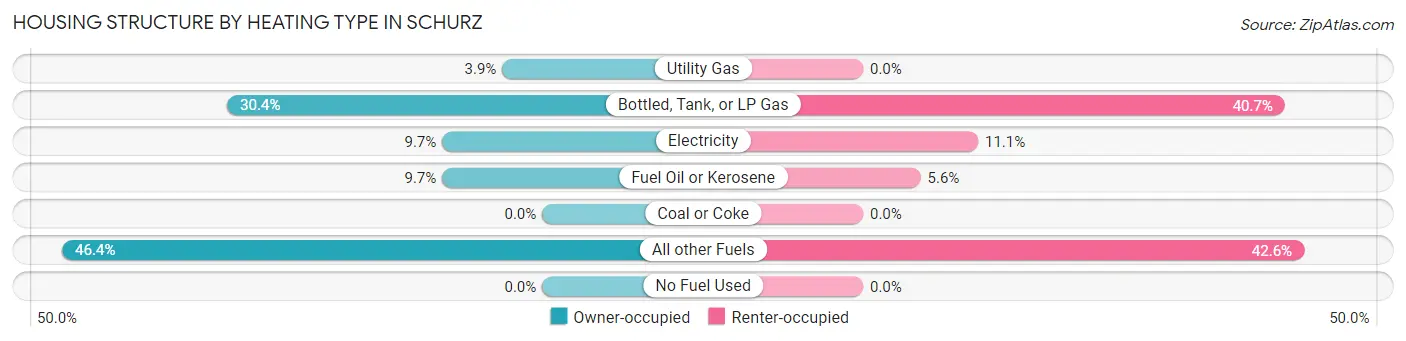
| Heating Type | Owner-occupied | Renter-occupied |
| Utility Gas | 8 (3.9%) | 0 (0.0%) |
| Bottled, Tank, or LP Gas | 63 (30.4%) | 44 (40.7%) |
| Electricity | 20 (9.7%) | 12 (11.1%) |
| Fuel Oil or Kerosene | 20 (9.7%) | 6 (5.6%) |
| Coal or Coke | 0 (0.0%) | 0 (0.0%) |
| All other Fuels | 96 (46.4%) | 46 (42.6%) |
| No Fuel Used | 0 (0.0%) | 0 (0.0%) |
| Total | 207 (100.0%) | 108 (100.0%) |
Household Vehicle Usage in Schurz
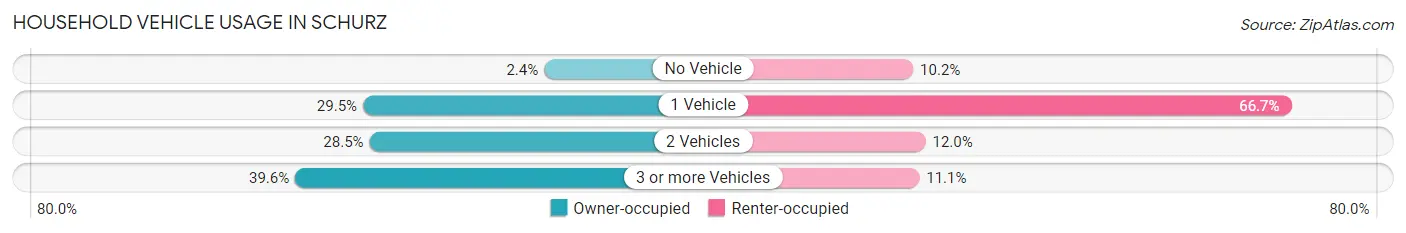
| Vehicles per Household | Owner-occupied | Renter-occupied |
| No Vehicle | 5 (2.4%) | 11 (10.2%) |
| 1 Vehicle | 61 (29.5%) | 72 (66.7%) |
| 2 Vehicles | 59 (28.5%) | 13 (12.0%) |
| 3 or more Vehicles | 82 (39.6%) | 12 (11.1%) |
| Total | 207 (100.0%) | 108 (100.0%) |
Real Estate & Mortgages in Schurz
Real Estate and Mortgage Overview in Schurz
| Characteristic | Without Mortgage | With Mortgage |
| Housing Units | 150 | 57 |
| Median Property Value | $59,600 | $99,500 |
| Median Household Income | $34,773 | $3 |
| Monthly Housing Costs | $240 | $0 |
| Real Estate Taxes | $199 | $40 |
Property Value by Mortgage Status in Schurz
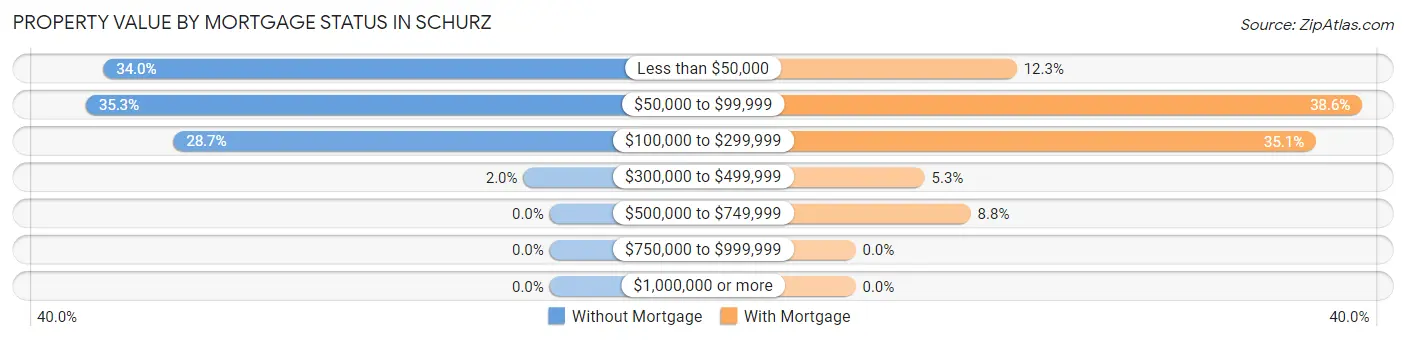
| Property Value | Without Mortgage | With Mortgage |
| Less than $50,000 | 51 (34.0%) | 7 (12.3%) |
| $50,000 to $99,999 | 53 (35.3%) | 22 (38.6%) |
| $100,000 to $299,999 | 43 (28.7%) | 20 (35.1%) |
| $300,000 to $499,999 | 3 (2.0%) | 3 (5.3%) |
| $500,000 to $749,999 | 0 (0.0%) | 5 (8.8%) |
| $750,000 to $999,999 | 0 (0.0%) | 0 (0.0%) |
| $1,000,000 or more | 0 (0.0%) | 0 (0.0%) |
| Total | 150 (100.0%) | 57 (100.0%) |
Household Income by Mortgage Status in Schurz
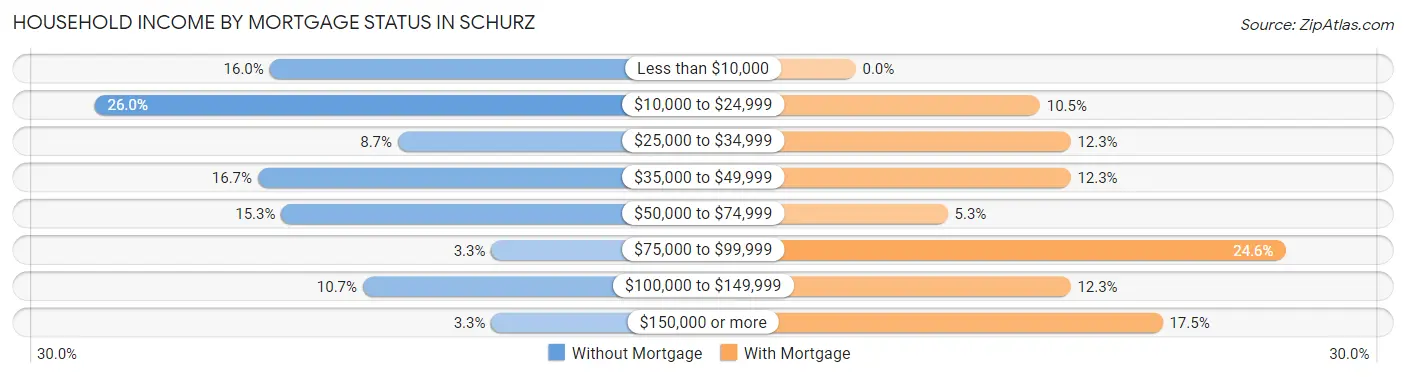
| Household Income | Without Mortgage | With Mortgage |
| Less than $10,000 | 24 (16.0%) | 0 (0.0%) |
| $10,000 to $24,999 | 39 (26.0%) | 6 (10.5%) |
| $25,000 to $34,999 | 13 (8.7%) | 7 (12.3%) |
| $35,000 to $49,999 | 25 (16.7%) | 7 (12.3%) |
| $50,000 to $74,999 | 23 (15.3%) | 3 (5.3%) |
| $75,000 to $99,999 | 5 (3.3%) | 14 (24.6%) |
| $100,000 to $149,999 | 16 (10.7%) | 7 (12.3%) |
| $150,000 or more | 5 (3.3%) | 10 (17.5%) |
| Total | 150 (100.0%) | 57 (100.0%) |
Property Value to Household Income Ratio in Schurz
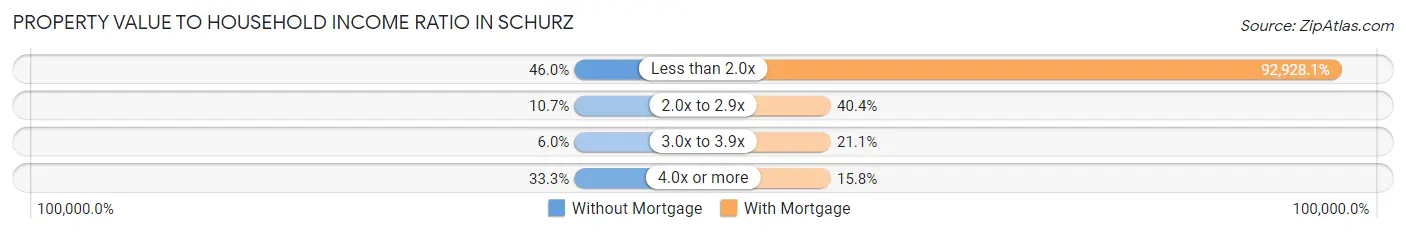
| Value-to-Income Ratio | Without Mortgage | With Mortgage |
| Less than 2.0x | 69 (46.0%) | 52,969 (92,928.1%) |
| 2.0x to 2.9x | 16 (10.7%) | 23 (40.4%) |
| 3.0x to 3.9x | 9 (6.0%) | 12 (21.0%) |
| 4.0x or more | 50 (33.3%) | 9 (15.8%) |
| Total | 150 (100.0%) | 57 (100.0%) |
Real Estate Taxes by Mortgage Status in Schurz
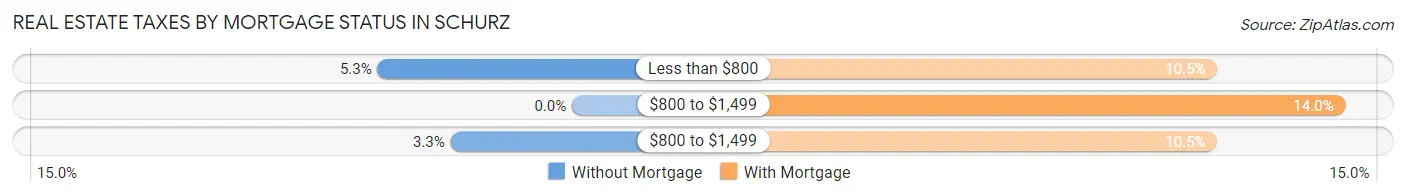
| Property Taxes | Without Mortgage | With Mortgage |
| Less than $800 | 8 (5.3%) | 6 (10.5%) |
| $800 to $1,499 | 0 (0.0%) | 8 (14.0%) |
| $800 to $1,499 | 5 (3.3%) | 6 (10.5%) |
| Total | 150 (100.0%) | 57 (100.0%) |
Health & Disability in Schurz
Health Insurance Coverage by Age in Schurz
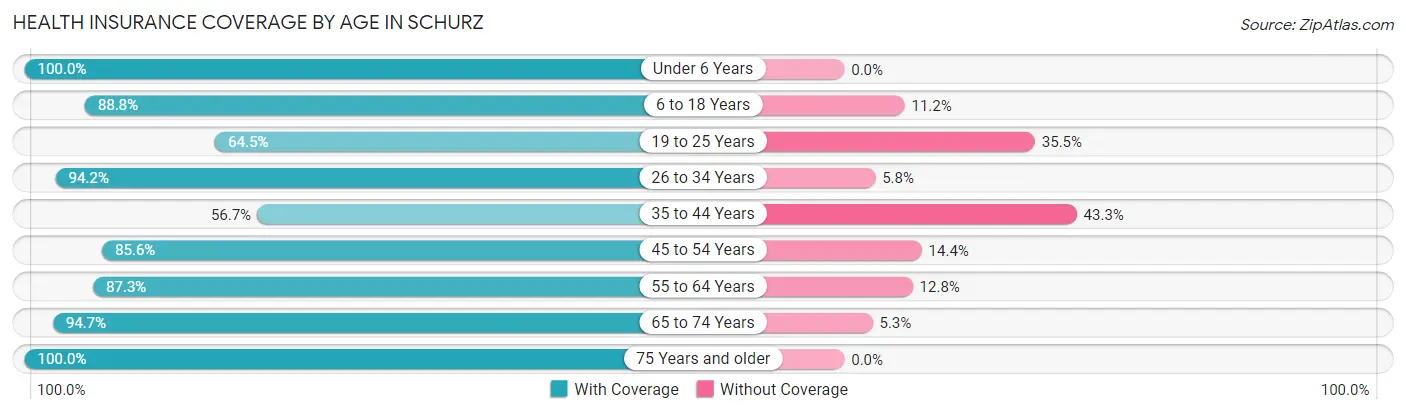
| Age Bracket | With Coverage | Without Coverage |
| Under 6 Years | 77 (100.0%) | 0 (0.0%) |
| 6 to 18 Years | 158 (88.8%) | 20 (11.2%) |
| 19 to 25 Years | 78 (64.5%) | 43 (35.5%) |
| 26 to 34 Years | 98 (94.2%) | 6 (5.8%) |
| 35 to 44 Years | 34 (56.7%) | 26 (43.3%) |
| 45 to 54 Years | 83 (85.6%) | 14 (14.4%) |
| 55 to 64 Years | 89 (87.3%) | 13 (12.8%) |
| 65 to 74 Years | 126 (94.7%) | 7 (5.3%) |
| 75 Years and older | 24 (100.0%) | 0 (0.0%) |
| Total | 767 (85.6%) | 129 (14.4%) |
Health Insurance Coverage by Citizenship Status in Schurz
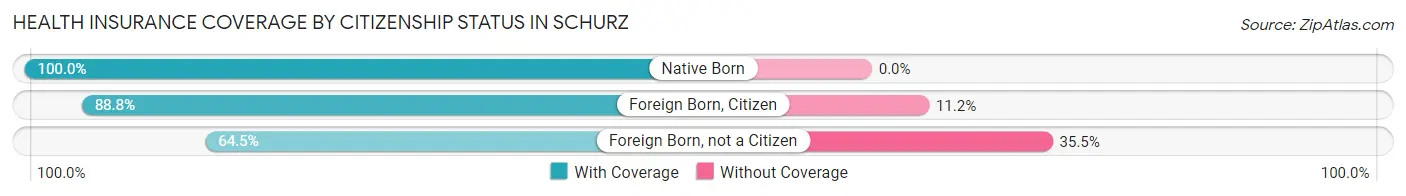
| Citizenship Status | With Coverage | Without Coverage |
| Native Born | 77 (100.0%) | 0 (0.0%) |
| Foreign Born, Citizen | 158 (88.8%) | 20 (11.2%) |
| Foreign Born, not a Citizen | 78 (64.5%) | 43 (35.5%) |
Health Insurance Coverage by Household Income in Schurz
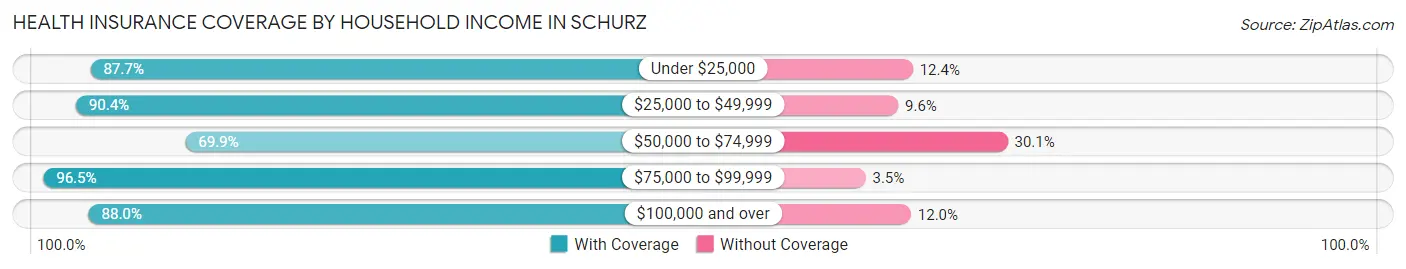
| Household Income | With Coverage | Without Coverage |
| Under $25,000 | 298 (87.6%) | 42 (12.3%) |
| $25,000 to $49,999 | 188 (90.4%) | 20 (9.6%) |
| $50,000 to $74,999 | 116 (69.9%) | 50 (30.1%) |
| $75,000 to $99,999 | 55 (96.5%) | 2 (3.5%) |
| $100,000 and over | 110 (88.0%) | 15 (12.0%) |
Public vs Private Health Insurance Coverage by Age in Schurz
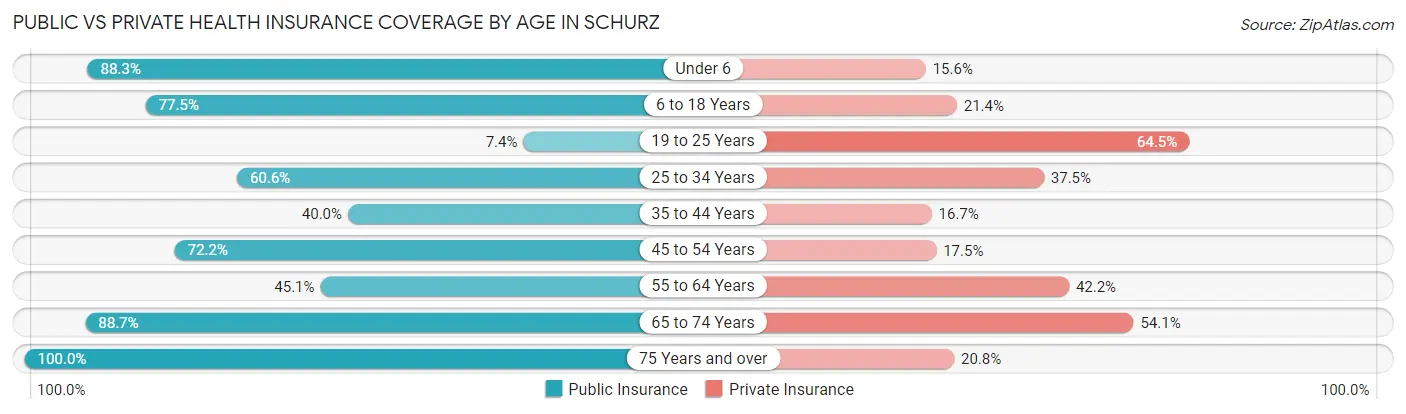
| Age Bracket | Public Insurance | Private Insurance |
| Under 6 | 68 (88.3%) | 12 (15.6%) |
| 6 to 18 Years | 138 (77.5%) | 38 (21.3%) |
| 19 to 25 Years | 9 (7.4%) | 78 (64.5%) |
| 25 to 34 Years | 63 (60.6%) | 39 (37.5%) |
| 35 to 44 Years | 24 (40.0%) | 10 (16.7%) |
| 45 to 54 Years | 70 (72.2%) | 17 (17.5%) |
| 55 to 64 Years | 46 (45.1%) | 43 (42.2%) |
| 65 to 74 Years | 118 (88.7%) | 72 (54.1%) |
| 75 Years and over | 24 (100.0%) | 5 (20.8%) |
| Total | 560 (62.5%) | 314 (35.0%) |
Disability Status by Sex by Age in Schurz
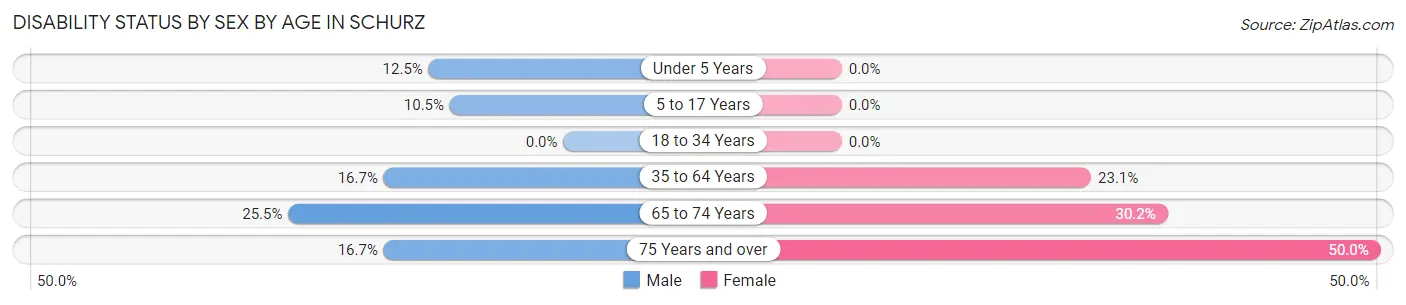
| Age Bracket | Male | Female |
| Under 5 Years | 5 (12.5%) | 0 (0.0%) |
| 5 to 17 Years | 8 (10.5%) | 0 (0.0%) |
| 18 to 34 Years | 0 (0.0%) | 0 (0.0%) |
| 35 to 64 Years | 23 (16.7%) | 28 (23.1%) |
| 65 to 74 Years | 12 (25.5%) | 26 (30.2%) |
| 75 Years and over | 2 (16.7%) | 6 (50.0%) |
Disability Class by Sex by Age in Schurz
Disability Class: Hearing Difficulty
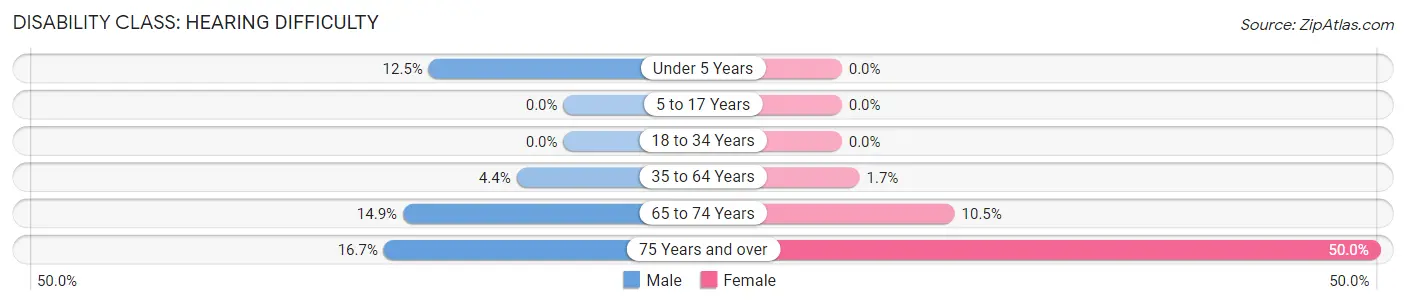
| Age Bracket | Male | Female |
| Under 5 Years | 5 (12.5%) | 0 (0.0%) |
| 5 to 17 Years | 0 (0.0%) | 0 (0.0%) |
| 18 to 34 Years | 0 (0.0%) | 0 (0.0%) |
| 35 to 64 Years | 6 (4.3%) | 2 (1.7%) |
| 65 to 74 Years | 7 (14.9%) | 9 (10.5%) |
| 75 Years and over | 2 (16.7%) | 6 (50.0%) |
Disability Class: Vision Difficulty
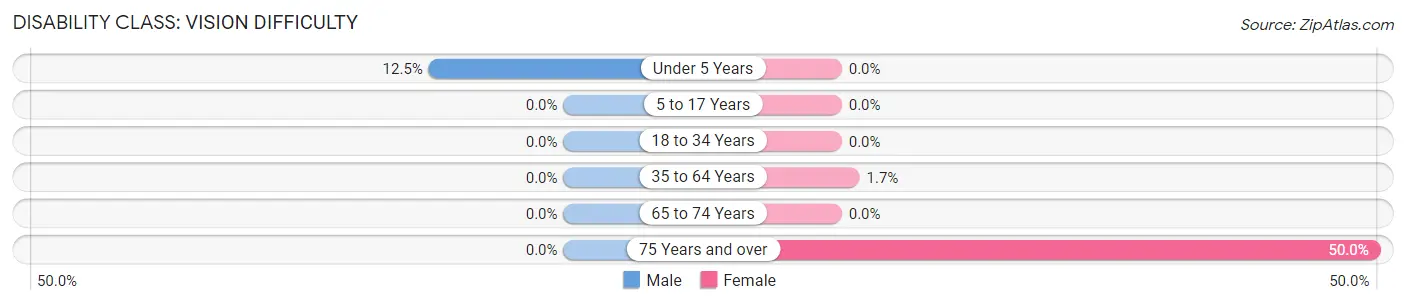
| Age Bracket | Male | Female |
| Under 5 Years | 5 (12.5%) | 0 (0.0%) |
| 5 to 17 Years | 0 (0.0%) | 0 (0.0%) |
| 18 to 34 Years | 0 (0.0%) | 0 (0.0%) |
| 35 to 64 Years | 0 (0.0%) | 2 (1.7%) |
| 65 to 74 Years | 0 (0.0%) | 0 (0.0%) |
| 75 Years and over | 0 (0.0%) | 6 (50.0%) |
Disability Class: Cognitive Difficulty
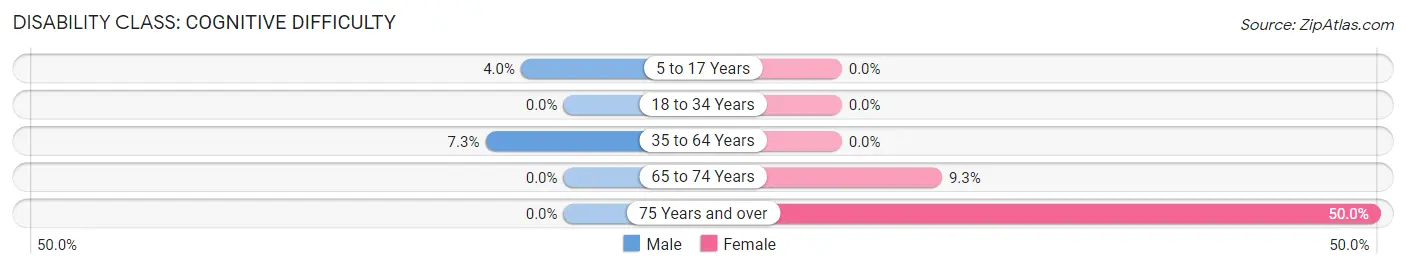
| Age Bracket | Male | Female |
| 5 to 17 Years | 3 (4.0%) | 0 (0.0%) |
| 18 to 34 Years | 0 (0.0%) | 0 (0.0%) |
| 35 to 64 Years | 10 (7.2%) | 0 (0.0%) |
| 65 to 74 Years | 0 (0.0%) | 8 (9.3%) |
| 75 Years and over | 0 (0.0%) | 6 (50.0%) |
Disability Class: Ambulatory Difficulty
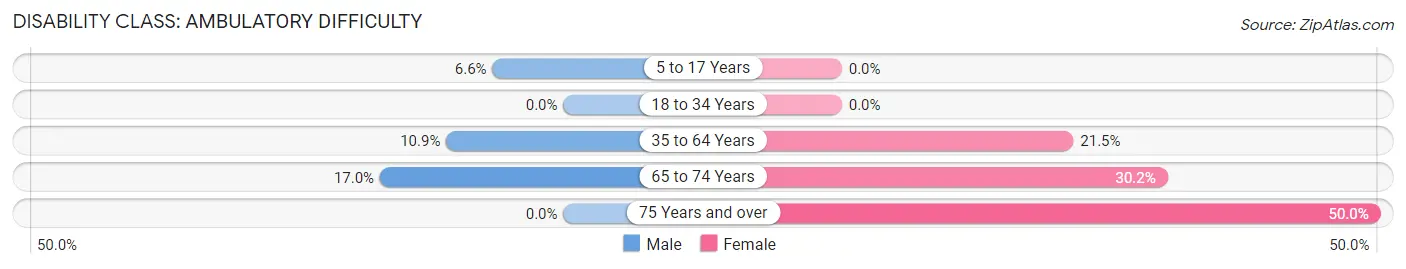
| Age Bracket | Male | Female |
| 5 to 17 Years | 5 (6.6%) | 0 (0.0%) |
| 18 to 34 Years | 0 (0.0%) | 0 (0.0%) |
| 35 to 64 Years | 15 (10.9%) | 26 (21.5%) |
| 65 to 74 Years | 8 (17.0%) | 26 (30.2%) |
| 75 Years and over | 0 (0.0%) | 6 (50.0%) |
Disability Class: Self-Care Difficulty
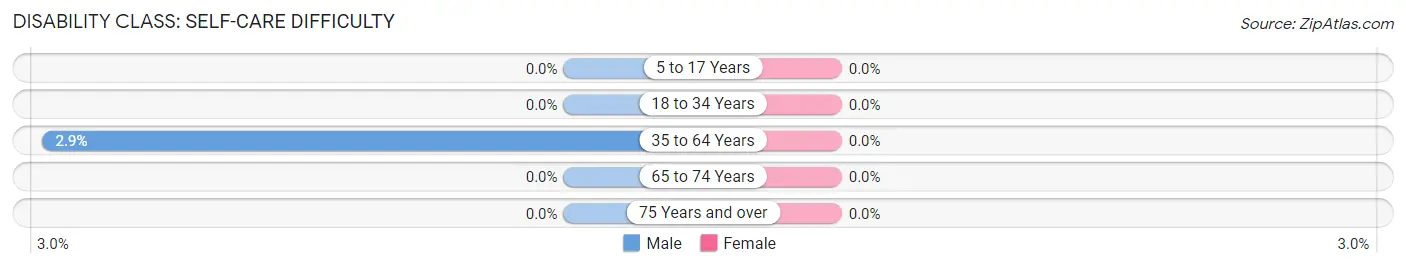
| Age Bracket | Male | Female |
| 5 to 17 Years | 0 (0.0%) | 0 (0.0%) |
| 18 to 34 Years | 0 (0.0%) | 0 (0.0%) |
| 35 to 64 Years | 4 (2.9%) | 0 (0.0%) |
| 65 to 74 Years | 0 (0.0%) | 0 (0.0%) |
| 75 Years and over | 0 (0.0%) | 0 (0.0%) |
Technology Access in Schurz
Computing Device Access in Schurz
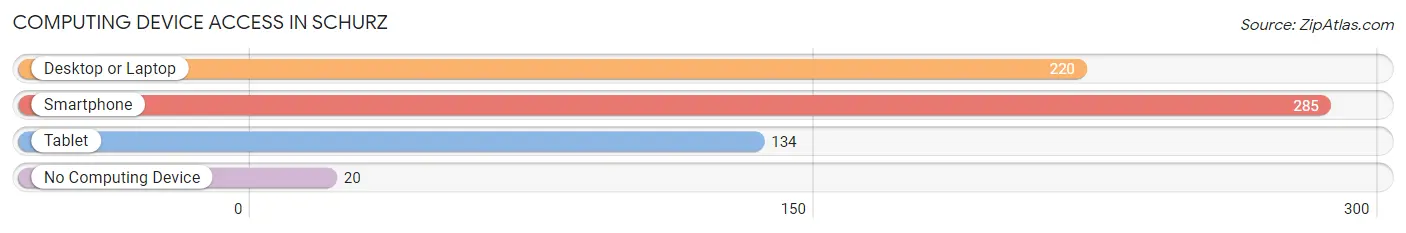
| Device Type | # Households | % Households |
| Desktop or Laptop | 220 | 69.8% |
| Smartphone | 285 | 90.5% |
| Tablet | 134 | 42.5% |
| No Computing Device | 20 | 6.4% |
| Total | 315 | 100.0% |
Internet Access in Schurz
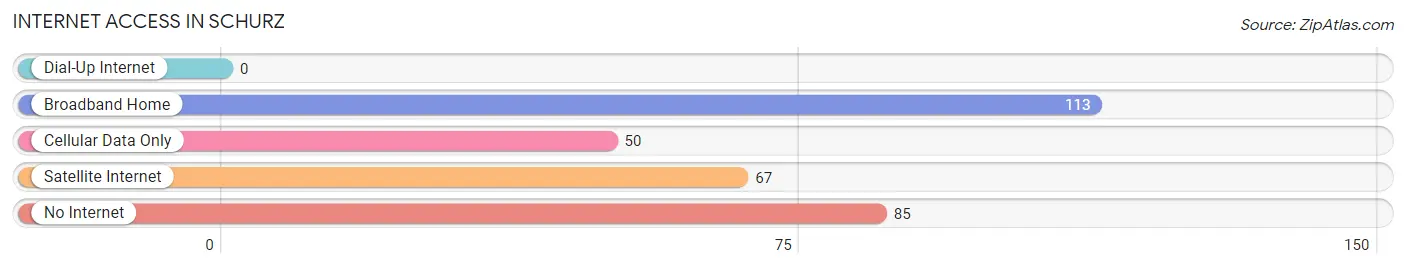
| Internet Type | # Households | % Households |
| Dial-Up Internet | 0 | 0.0% |
| Broadband Home | 113 | 35.9% |
| Cellular Data Only | 50 | 15.9% |
| Satellite Internet | 67 | 21.3% |
| No Internet | 85 | 27.0% |
| Total | 315 | 100.0% |
Schurz Summary
Schurz is a small unincorporated community located in Mineral County, Nevada. It is situated on the Walker River Indian Reservation, approximately 30 miles south of Hawthorne. The population of Schurz was estimated to be 545 in 2019.
History
Schurz was originally established in 1868 as a trading post for the Walker River Paiute Tribe. The town was named after Carl Schurz, a German-American statesman and reformer who served as Secretary of the Interior under President Rutherford B. Hayes. In 1872, the town was officially incorporated and the first post office was established.
In the late 19th century, Schurz became a popular stop for travelers on the Central Pacific Railroad. The town was also home to a number of businesses, including a hotel, saloon, and general store.
In the early 20th century, Schurz experienced a period of growth and prosperity. The town was home to a number of businesses, including a bank, newspaper, and several stores. In addition, the town was home to a number of churches, including the Catholic Church of the Immaculate Conception, which was built in 1910.
Geography
Schurz is located in Mineral County, Nevada, approximately 30 miles south of Hawthorne. The town is situated on the Walker River Indian Reservation, which is home to the Walker River Paiute Tribe. The town is located at an elevation of 4,890 feet and has a total area of 0.6 square miles.
The climate in Schurz is semi-arid, with hot summers and cold winters. The average annual temperature is 54°F, with an average high of 86°F in July and an average low of 22°F in January. The average annual precipitation is 8.5 inches, with most of the precipitation occurring in the winter months.
Economy
The economy of Schurz is largely based on tourism and agriculture. The town is home to a number of tourist attractions, including the Walker River Paiute Tribe Museum and the Schurz Historical Museum. In addition, the town is home to a number of agricultural businesses, including cattle ranches and alfalfa farms.
The town is also home to a number of businesses, including a grocery store, gas station, and several restaurants. In addition, the town is home to a number of government offices, including the Mineral County Sheriff’s Office and the Walker River Paiute Tribe Office.
Demographics
The population of Schurz was estimated to be 545 in 2019. The town is predominantly Native American, with the majority of the population belonging to the Walker River Paiute Tribe. The town is also home to a small Hispanic population, as well as a number of other ethnicities.
The median household income in Schurz is $30,000, and the median home value is $90,000. The town has a poverty rate of 28.3%, which is higher than the national average. The town also has a high unemployment rate of 11.2%.
Conclusion
Schurz is a small unincorporated community located in Mineral County, Nevada. It is situated on the Walker River Indian Reservation, approximately 30 miles south of Hawthorne. The population of Schurz was estimated to be 545 in 2019. The town is predominantly Native American, with the majority of the population belonging to the Walker River Paiute Tribe. The economy of Schurz is largely based on tourism and agriculture, and the town is home to a number of businesses, including a grocery store, gas station, and several restaurants. The median household income in Schurz is $30,000, and the median home value is $90,000. The town has a poverty rate of 28.3%, which is higher than the national average.
Common Questions
What is Per Capita Income in Schurz?
Per Capita income in Schurz is $18,840.
What is the Median Family Income in Schurz?
Median Family Income in Schurz is $34,107.
What is the Median Household income in Schurz?
Median Household Income in Schurz is $29,583.
What is Income or Wage Gap in Schurz?
Income or Wage Gap in Schurz is 34.9%.
Women in Schurz earn 65.1 cents for every dollar earned by a man.
What is Family Income Deficit in Schurz?
Family Income Deficit in Schurz is $10,945.
Families that are below poverty line in Schurz earn $10,945 less on average than the poverty threshold level.
What is Inequality or Gini Index in Schurz?
Inequality or Gini Index in Schurz is 0.50.
What is the Total Population of Schurz?
Total Population of Schurz is 896.
What is the Total Male Population of Schurz?
Total Male Population of Schurz is 397.
What is the Total Female Population of Schurz?
Total Female Population of Schurz is 499.
What is the Ratio of Males per 100 Females in Schurz?
There are 79.56 Males per 100 Females in Schurz.
What is the Ratio of Females per 100 Males in Schurz?
There are 125.69 Females per 100 Males in Schurz.
What is the Median Population Age in Schurz?
Median Population Age in Schurz is 31.6 Years.
What is the Average Family Size in Schurz
Average Family Size in Schurz is 3.6 People.
What is the Average Household Size in Schurz
Average Household Size in Schurz is 2.8 People.
How Large is the Labor Force in Schurz?
There are 366 People in the Labor Forcein in Schurz.
What is the Percentage of People in the Labor Force in Schurz?
53.9% of People are in the Labor Force in Schurz.
What is the Unemployment Rate in Schurz?
Unemployment Rate in Schurz is 15.8%.