Hubbard, OR Map & Demographics
Hubbard Map
Hubbard Overview
$31,747
PER CAPITA INCOME
$83,500
AVG FAMILY INCOME
$89,016
AVG HOUSEHOLD INCOME
2.8%
WAGE / INCOME GAP [ % ]
97.2¢/ $1
WAGE / INCOME GAP [ $ ]
0.34
INEQUALITY / GINI INDEX
3,427
TOTAL POPULATION
1,745
MALE POPULATION
1,682
FEMALE POPULATION
103.75
MALES / 100 FEMALES
96.39
FEMALES / 100 MALES
38.2
MEDIAN AGE
3.2
AVG FAMILY SIZE
3.0
AVG HOUSEHOLD SIZE
1,925
LABOR FORCE [ PEOPLE ]
74.4%
PERCENT IN LABOR FORCE
2.5%
UNEMPLOYMENT RATE
Hubbard Zip Codes
Income in Hubbard
Income Overview in Hubbard
Per Capita Income in Hubbard is $31,747, while median incomes of families and households are $83,500 and $89,016 respectively.
| Characteristic | Number | Measure |
| Per Capita Income | 3,427 | $31,747 |
| Median Family Income | 886 | $83,500 |
| Mean Family Income | 886 | $92,690 |
| Median Household Income | 1,142 | $89,016 |
| Mean Household Income | 1,142 | $93,665 |
| Income Deficit | 886 | $0 |
| Wage / Income Gap (%) | 3,427 | 2.85% |
| Wage / Income Gap ($) | 3,427 | 97.15¢ per $1 |
| Gini / Inequality Index | 3,427 | 0.34 |
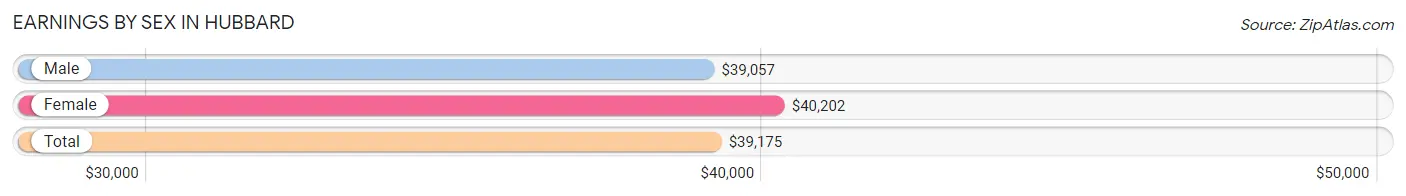
Earnings by Sex in Hubbard
Average Earnings in Hubbard are $39,175, $39,057 for men and $40,202 for women, a difference of 2.9%.
| Sex | Number | Average Earnings |
| Male | 1,024 (53.2%) | $39,057 |
| Female | 899 (46.8%) | $40,202 |
| Total | 1,923 (100.0%) | $39,175 |
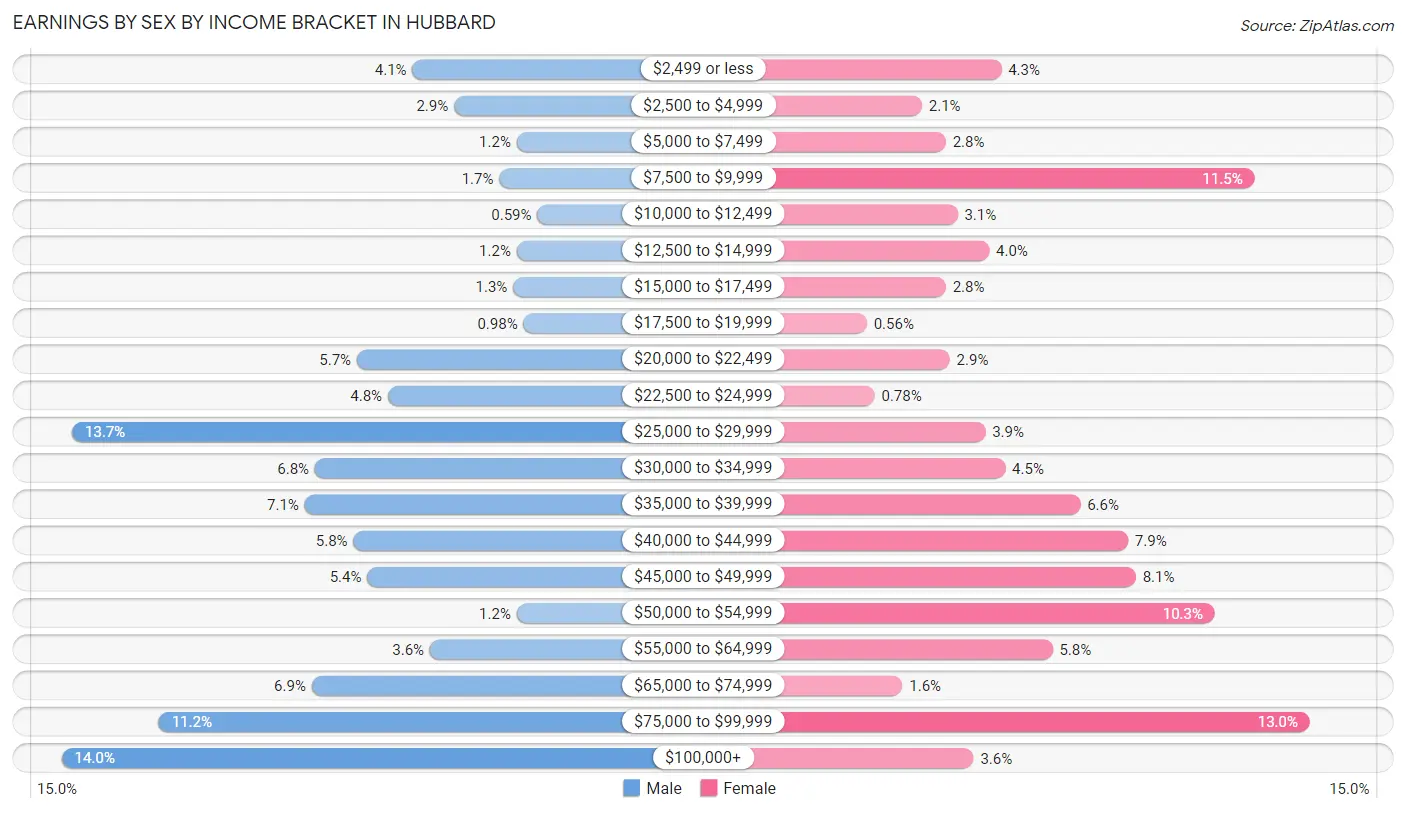
Earnings by Sex by Income Bracket in Hubbard
The most common earnings brackets in Hubbard are $100,000+ for men (143 | 14.0%) and $75,000 to $99,999 for women (117 | 13.0%).
| Income | Male | Female |
| $2,499 or less | 42 (4.1%) | 39 (4.3%) |
| $2,500 to $4,999 | 30 (2.9%) | 19 (2.1%) |
| $5,000 to $7,499 | 12 (1.2%) | 25 (2.8%) |
| $7,500 to $9,999 | 17 (1.7%) | 103 (11.5%) |
| $10,000 to $12,499 | 6 (0.6%) | 28 (3.1%) |
| $12,500 to $14,999 | 12 (1.2%) | 36 (4.0%) |
| $15,000 to $17,499 | 13 (1.3%) | 25 (2.8%) |
| $17,500 to $19,999 | 10 (1.0%) | 5 (0.6%) |
| $20,000 to $22,499 | 58 (5.7%) | 26 (2.9%) |
| $22,500 to $24,999 | 49 (4.8%) | 7 (0.8%) |
| $25,000 to $29,999 | 140 (13.7%) | 35 (3.9%) |
| $30,000 to $34,999 | 70 (6.8%) | 40 (4.4%) |
| $35,000 to $39,999 | 73 (7.1%) | 59 (6.6%) |
| $40,000 to $44,999 | 59 (5.8%) | 71 (7.9%) |
| $45,000 to $49,999 | 55 (5.4%) | 73 (8.1%) |
| $50,000 to $54,999 | 12 (1.2%) | 93 (10.3%) |
| $55,000 to $64,999 | 37 (3.6%) | 52 (5.8%) |
| $65,000 to $74,999 | 71 (6.9%) | 14 (1.6%) |
| $75,000 to $99,999 | 115 (11.2%) | 117 (13.0%) |
| $100,000+ | 143 (14.0%) | 32 (3.6%) |
| Total | 1,024 (100.0%) | 899 (100.0%) |
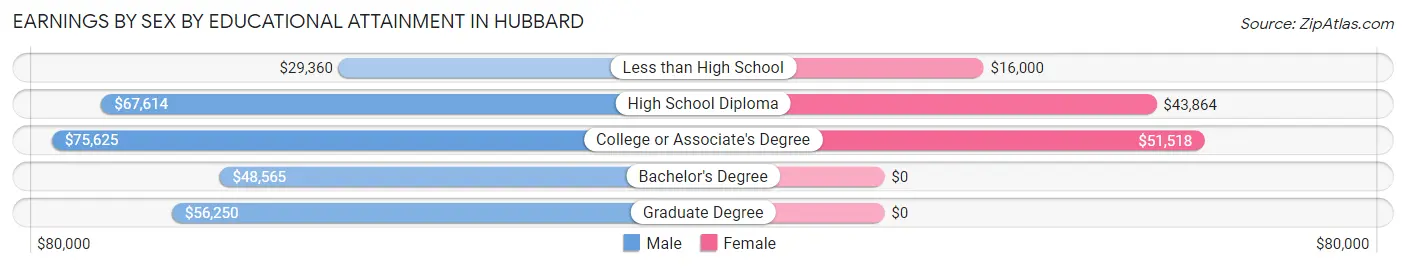
Earnings by Sex by Educational Attainment in Hubbard
Average earnings in Hubbard are $41,412 for men and $44,875 for women, a difference of 7.7%. Men with an educational attainment of college or associate's degree enjoy the highest average annual earnings of $75,625, while those with less than high school education earn the least with $29,360. Women with an educational attainment of college or associate's degree earn the most with the average annual earnings of $51,518, while those with less than high school education have the smallest earnings of $16,000.
| Educational Attainment | Male Income | Female Income |
| Less than High School | $29,360 | $16,000 |
| High School Diploma | $67,614 | $43,864 |
| College or Associate's Degree | $75,625 | $51,518 |
| Bachelor's Degree | $48,565 | $0 |
| Graduate Degree | $56,250 | $0 |
| Total | $41,412 | $44,875 |
Family Income in Hubbard
Family Income Brackets in Hubbard
According to the Hubbard family income data, there are 258 families falling into the $50,000 to $74,999 income range, which is the most common income bracket and makes up 29.1% of all families. Conversely, the less than $10,000 income bracket is the least frequent group with only 11 families (1.2%) belonging to this category.
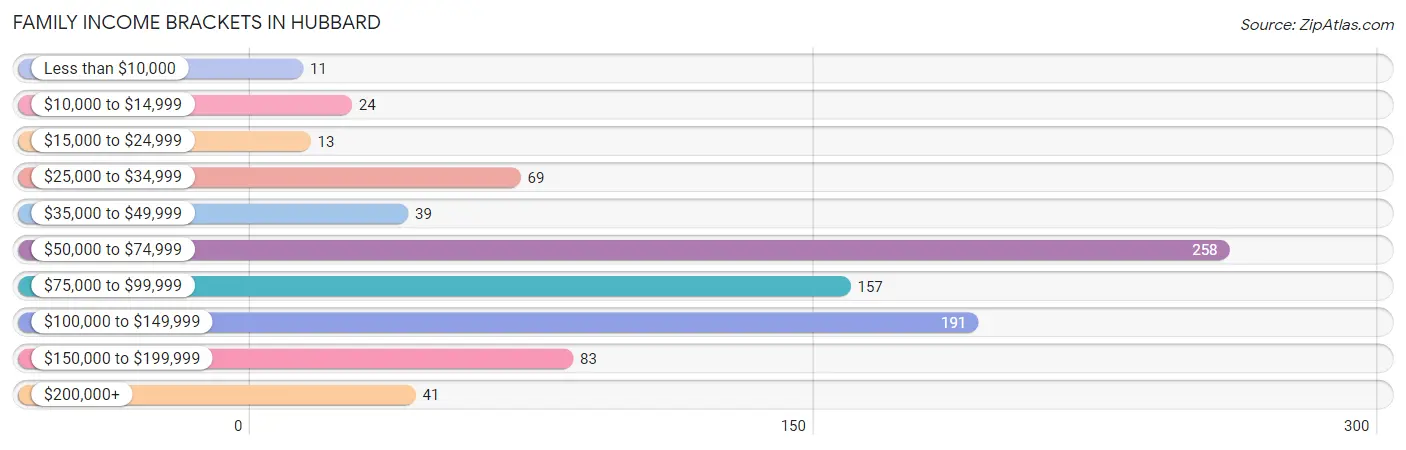
| Income Bracket | # Families | % Families |
| Less than $10,000 | 11 | 1.2% |
| $10,000 to $14,999 | 24 | 2.7% |
| $15,000 to $24,999 | 13 | 1.5% |
| $25,000 to $34,999 | 69 | 7.8% |
| $35,000 to $49,999 | 39 | 4.4% |
| $50,000 to $74,999 | 258 | 29.1% |
| $75,000 to $99,999 | 157 | 17.7% |
| $100,000 to $149,999 | 191 | 21.6% |
| $150,000 to $199,999 | 83 | 9.4% |
| $200,000+ | 41 | 4.6% |
Family Income by Famaliy Size in Hubbard
4-person families (164 | 18.5%) account for the highest median family income in Hubbard with $115,500 per family, while 2-person families (433 | 48.9%) have the highest median income of $42,070 per family member.
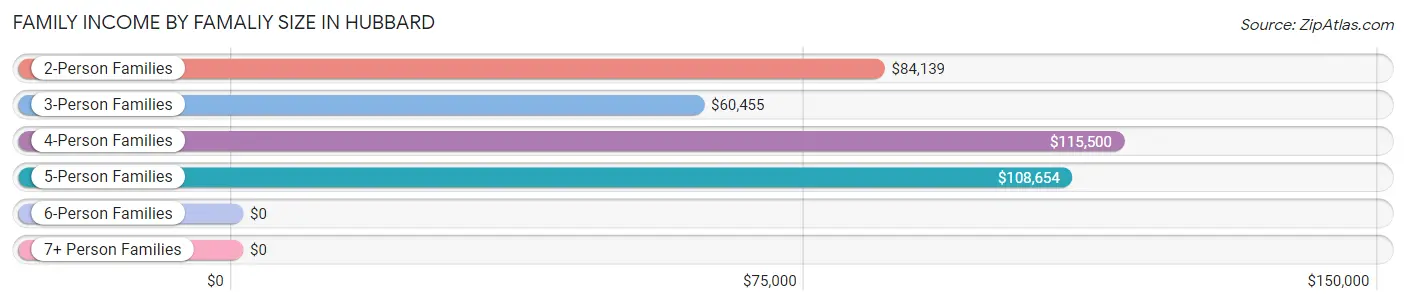
| Income Bracket | # Families | Median Income |
| 2-Person Families | 433 (48.9%) | $84,139 |
| 3-Person Families | 192 (21.7%) | $60,455 |
| 4-Person Families | 164 (18.5%) | $115,500 |
| 5-Person Families | 34 (3.8%) | $108,654 |
| 6-Person Families | 0 (0.0%) | $0 |
| 7+ Person Families | 63 (7.1%) | $0 |
| Total | 886 (100.0%) | $83,500 |
Family Income by Number of Earners in Hubbard
The median family income in Hubbard is $83,500, with families comprising 3+ earners (71) having the highest median family income of $115,096, while families with 1 earner (251) have the lowest median family income of $51,397, accounting for 8.0% and 28.3% of families, respectively.
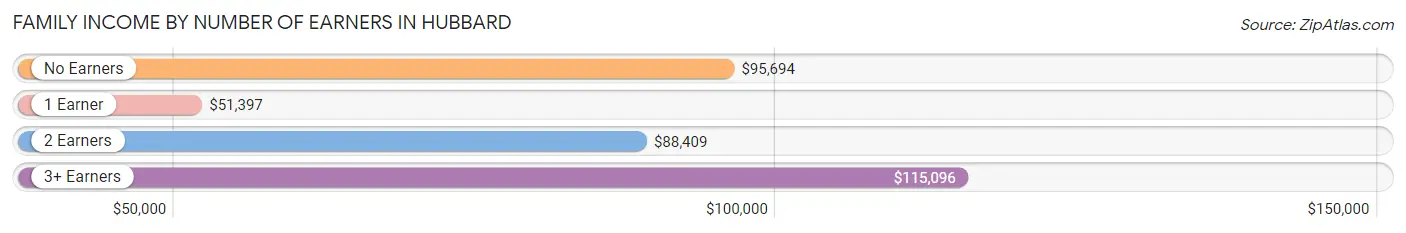
| Number of Earners | # Families | Median Income |
| No Earners | 58 (6.6%) | $95,694 |
| 1 Earner | 251 (28.3%) | $51,397 |
| 2 Earners | 506 (57.1%) | $88,409 |
| 3+ Earners | 71 (8.0%) | $115,096 |
| Total | 886 (100.0%) | $83,500 |
Household Income in Hubbard
Household Income Brackets in Hubbard
With 271 households falling in the category, the $100,000 to $149,999 income range is the most frequent in Hubbard, accounting for 23.7% of all households. In contrast, only 13 households (1.1%) fall into the less than $10,000 income bracket, making it the least populous group.
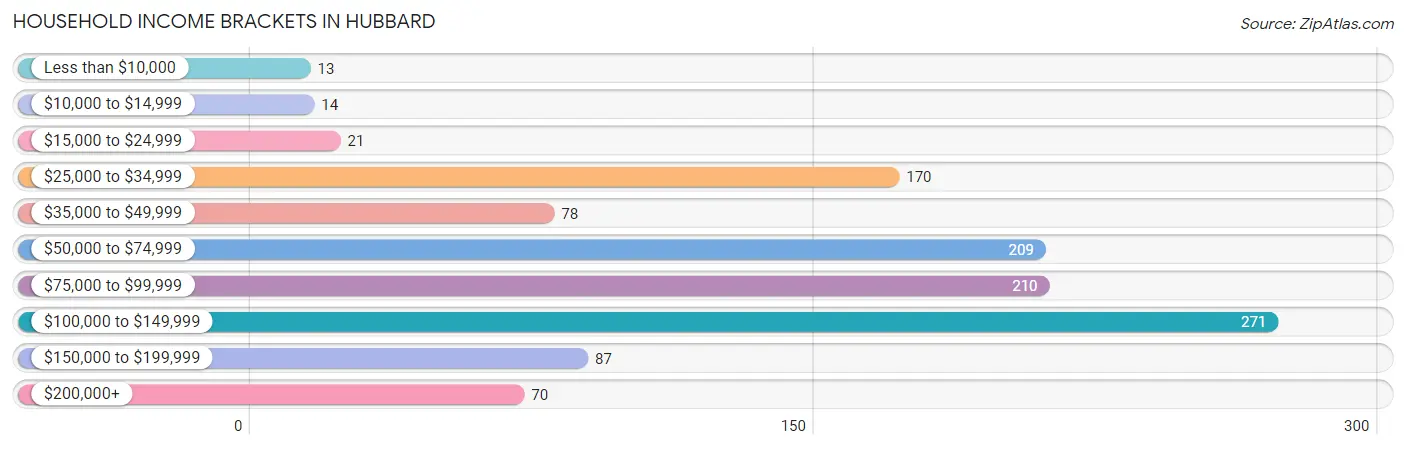
| Income Bracket | # Households | % Households |
| Less than $10,000 | 13 | 1.1% |
| $10,000 to $14,999 | 14 | 1.2% |
| $15,000 to $24,999 | 21 | 1.8% |
| $25,000 to $34,999 | 170 | 14.9% |
| $35,000 to $49,999 | 78 | 6.8% |
| $50,000 to $74,999 | 209 | 18.3% |
| $75,000 to $99,999 | 210 | 18.4% |
| $100,000 to $149,999 | 271 | 23.7% |
| $150,000 to $199,999 | 87 | 7.6% |
| $200,000+ | 70 | 6.1% |
Household Income by Householder Age in Hubbard
The median household income in Hubbard is $89,016, with the highest median household income of $97,273 found in the 45 to 64 years age bracket for the primary householder. A total of 372 households (32.6%) fall into this category. Meanwhile, the 15 to 24 years age bracket for the primary householder has the lowest median household income of $0, with 17 households (1.5%) in this group.
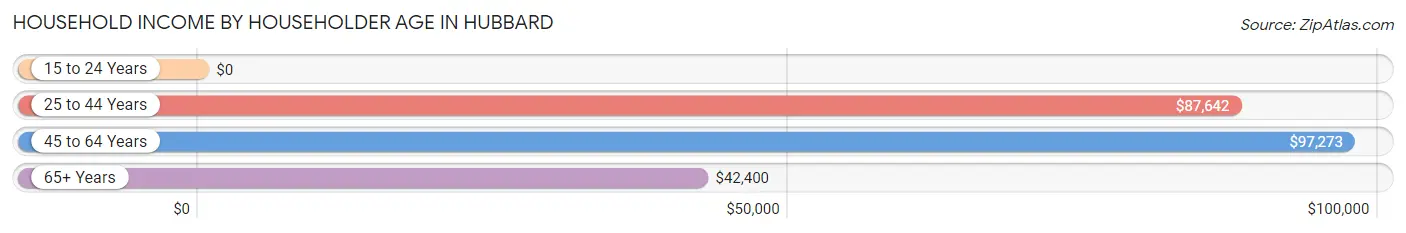
| Income Bracket | # Households | Median Income |
| 15 to 24 Years | 17 (1.5%) | $0 |
| 25 to 44 Years | 549 (48.1%) | $87,642 |
| 45 to 64 Years | 372 (32.6%) | $97,273 |
| 65+ Years | 204 (17.9%) | $42,400 |
| Total | 1,142 (100.0%) | $89,016 |
Poverty in Hubbard
Income Below Poverty by Sex and Age in Hubbard
With 9.5% poverty level for males and 13.0% for females among the residents of Hubbard, 15 year old males and 12 to 14 year old females are the most vulnerable to poverty, with 7 males (53.8%) and 53 females (75.7%) in their respective age groups living below the poverty level.
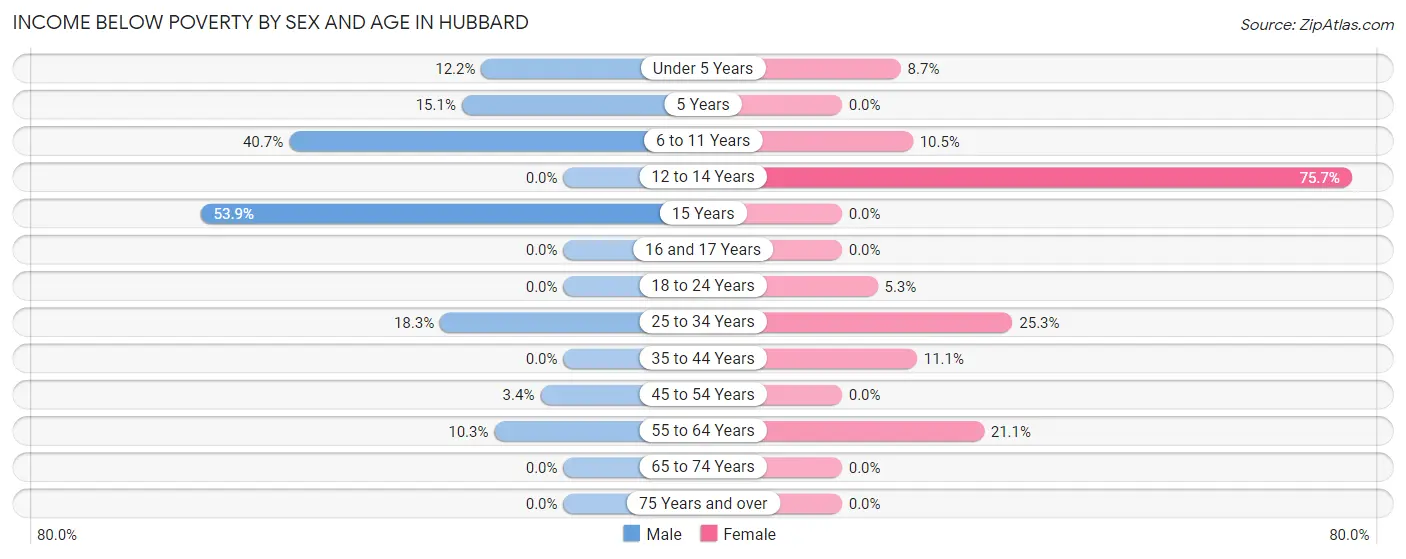
| Age Bracket | Male | Female |
| Under 5 Years | 19 (12.2%) | 9 (8.7%) |
| 5 Years | 8 (15.1%) | 0 (0.0%) |
| 6 to 11 Years | 55 (40.7%) | 14 (10.5%) |
| 12 to 14 Years | 0 (0.0%) | 53 (75.7%) |
| 15 Years | 7 (53.8%) | 0 (0.0%) |
| 16 and 17 Years | 0 (0.0%) | 0 (0.0%) |
| 18 to 24 Years | 0 (0.0%) | 6 (5.3%) |
| 25 to 34 Years | 37 (18.3%) | 57 (25.3%) |
| 35 to 44 Years | 0 (0.0%) | 40 (11.1%) |
| 45 to 54 Years | 6 (3.4%) | 0 (0.0%) |
| 55 to 64 Years | 33 (10.2%) | 39 (21.1%) |
| 65 to 74 Years | 0 (0.0%) | 0 (0.0%) |
| 75 Years and over | 0 (0.0%) | 0 (0.0%) |
| Total | 165 (9.5%) | 218 (13.0%) |
Income Above Poverty by Sex and Age in Hubbard
According to the poverty statistics in Hubbard, males aged 12 to 14 years and females aged 5 years are the age groups that are most secure financially, with 100.0% of males and 100.0% of females in these age groups living above the poverty line.
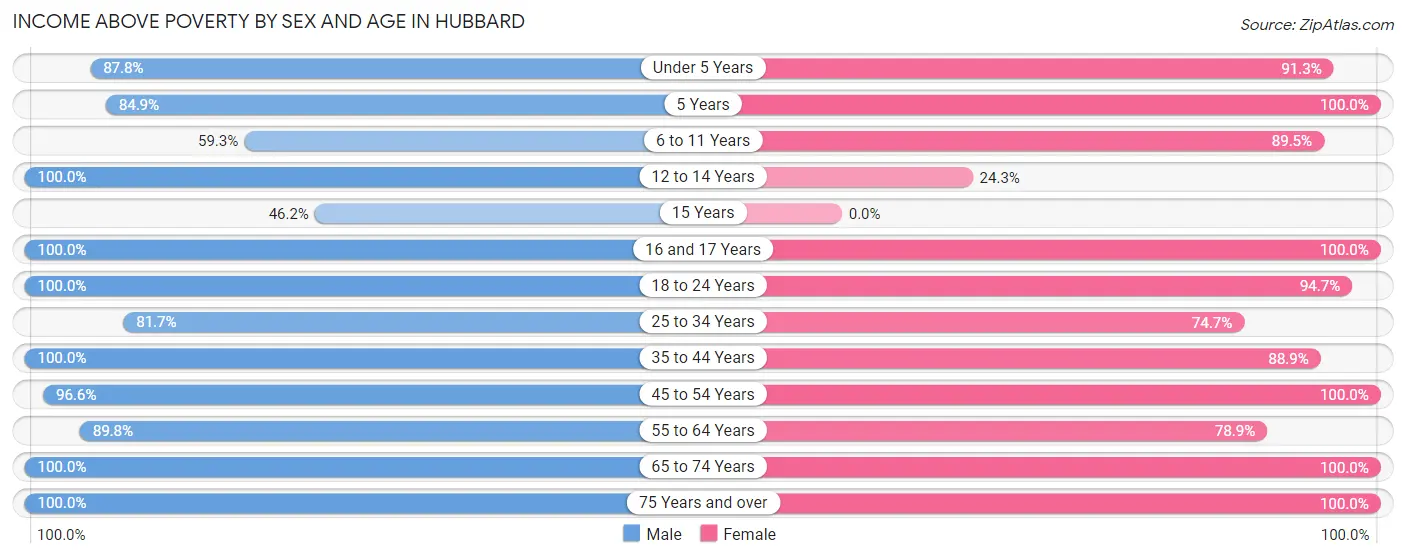
| Age Bracket | Male | Female |
| Under 5 Years | 137 (87.8%) | 94 (91.3%) |
| 5 Years | 45 (84.9%) | 17 (100.0%) |
| 6 to 11 Years | 80 (59.3%) | 119 (89.5%) |
| 12 to 14 Years | 160 (100.0%) | 17 (24.3%) |
| 15 Years | 6 (46.2%) | 0 (0.0%) |
| 16 and 17 Years | 25 (100.0%) | 100 (100.0%) |
| 18 to 24 Years | 109 (100.0%) | 107 (94.7%) |
| 25 to 34 Years | 165 (81.7%) | 168 (74.7%) |
| 35 to 44 Years | 260 (100.0%) | 319 (88.9%) |
| 45 to 54 Years | 169 (96.6%) | 186 (100.0%) |
| 55 to 64 Years | 289 (89.7%) | 146 (78.9%) |
| 65 to 74 Years | 97 (100.0%) | 102 (100.0%) |
| 75 Years and over | 38 (100.0%) | 89 (100.0%) |
| Total | 1,580 (90.5%) | 1,464 (87.0%) |
Income Below Poverty Among Married-Couple Families in Hubbard
The poverty statistics for married-couple families in Hubbard show that 3.5% or 19 of the total 547 families live below the poverty line. Families with 1 or 2 children have the highest poverty rate of 8.9%, comprising of 19 families. On the other hand, families with no children have the lowest poverty rate of 0.0%, which includes 0 families.
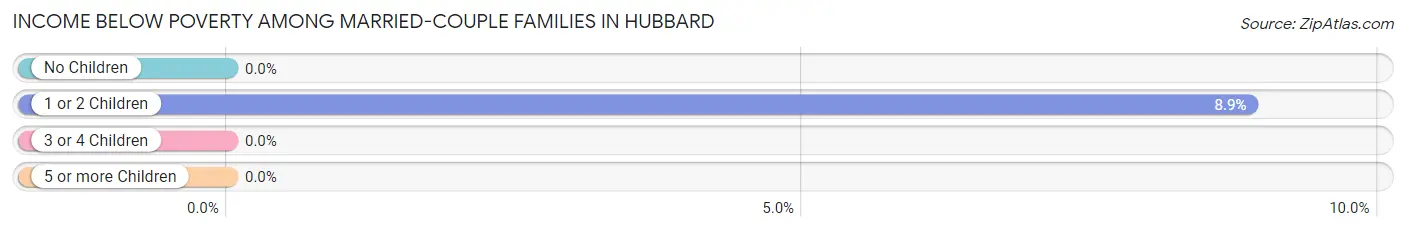
| Children | Above Poverty | Below Poverty |
| No Children | 282 (100.0%) | 0 (0.0%) |
| 1 or 2 Children | 195 (91.1%) | 19 (8.9%) |
| 3 or 4 Children | 28 (100.0%) | 0 (0.0%) |
| 5 or more Children | 23 (100.0%) | 0 (0.0%) |
| Total | 528 (96.5%) | 19 (3.5%) |
Income Below Poverty Among Single-Parent Households in Hubbard
According to the poverty data in Hubbard, 11.0% or 10 single-father households and 16.1% or 40 single-mother households are living below the poverty line. Among single-father households, those with 5 or more children have the highest poverty rate, with 10 households (100.0%) experiencing poverty. Likewise, among single-mother households, those with 1 or 2 children have the highest poverty rate, with 40 households (26.5%) falling below the poverty line.
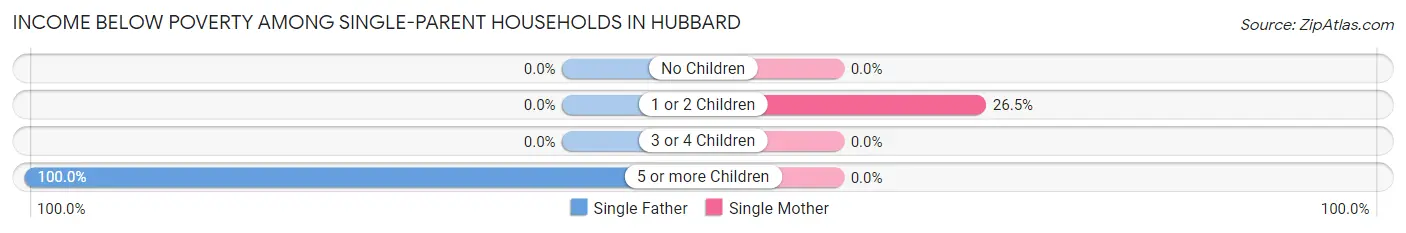
| Children | Single Father | Single Mother |
| No Children | 0 (0.0%) | 0 (0.0%) |
| 1 or 2 Children | 0 (0.0%) | 40 (26.5%) |
| 3 or 4 Children | 0 (0.0%) | 0 (0.0%) |
| 5 or more Children | 10 (100.0%) | 0 (0.0%) |
| Total | 10 (11.0%) | 40 (16.1%) |
Income Below Poverty Among Married-Couple vs Single-Parent Households in Hubbard
The poverty data for Hubbard shows that 19 of the married-couple family households (3.5%) and 50 of the single-parent households (14.7%) are living below the poverty level. Within the married-couple family households, those with 1 or 2 children have the highest poverty rate, with 19 households (8.9%) falling below the poverty line. Among the single-parent households, those with 5 or more children have the highest poverty rate, with 10 household (100.0%) living below poverty.
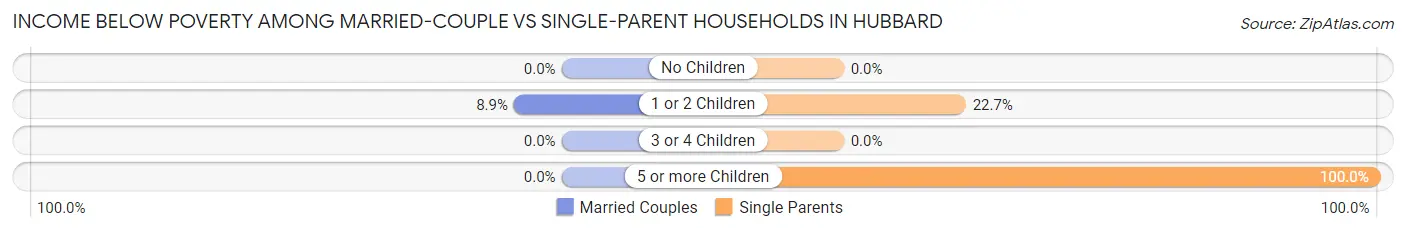
| Children | Married-Couple Families | Single-Parent Households |
| No Children | 0 (0.0%) | 0 (0.0%) |
| 1 or 2 Children | 19 (8.9%) | 40 (22.7%) |
| 3 or 4 Children | 0 (0.0%) | 0 (0.0%) |
| 5 or more Children | 0 (0.0%) | 10 (100.0%) |
| Total | 19 (3.5%) | 50 (14.7%) |
Race in Hubbard
The most populous races in Hubbard are White / Caucasian (2,625 | 76.6%), Hispanic or Latino (1,488 | 43.4%), and Some other Race (369 | 10.8%).
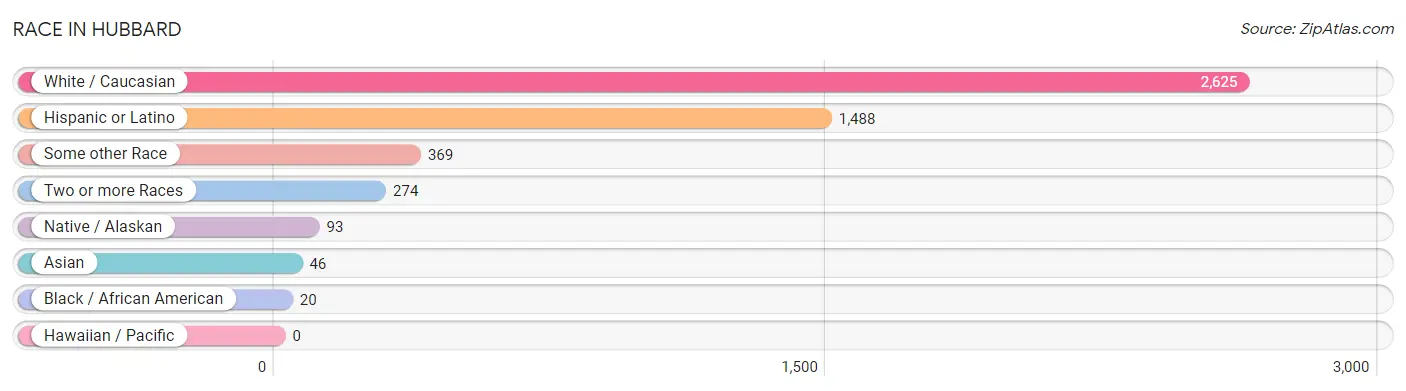
| Race | # Population | % Population |
| Asian | 46 | 1.3% |
| Black / African American | 20 | 0.6% |
| Hawaiian / Pacific | 0 | 0.0% |
| Hispanic or Latino | 1,488 | 43.4% |
| Native / Alaskan | 93 | 2.7% |
| White / Caucasian | 2,625 | 76.6% |
| Two or more Races | 274 | 8.0% |
| Some other Race | 369 | 10.8% |
| Total | 3,427 | 100.0% |
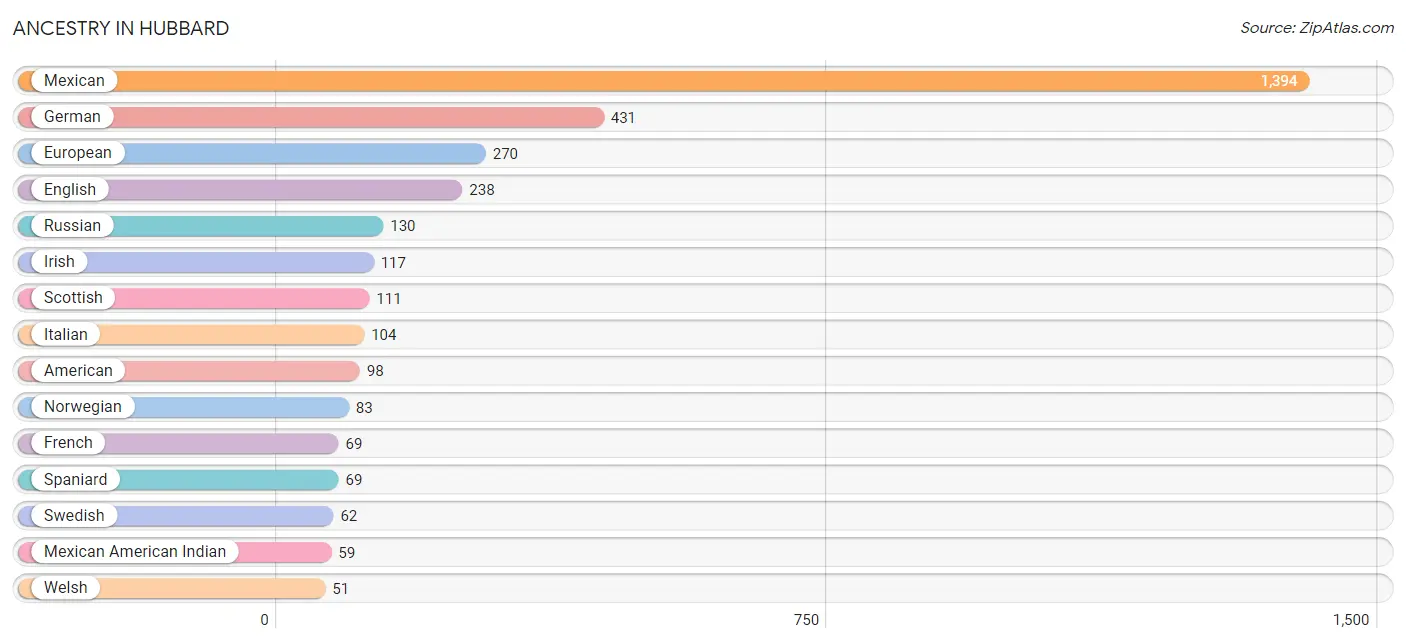
Ancestry in Hubbard
The most populous ancestries reported in Hubbard are Mexican (1,394 | 40.7%), German (431 | 12.6%), European (270 | 7.9%), English (238 | 6.9%), and Russian (130 | 3.8%), together accounting for 71.9% of all Hubbard residents.
| Ancestry | # Population | % Population |
| American | 98 | 2.9% |
| Austrian | 5 | 0.2% |
| Bangladeshi | 9 | 0.3% |
| Bhutanese | 13 | 0.4% |
| Cherokee | 9 | 0.3% |
| Cuban | 6 | 0.2% |
| Czech | 5 | 0.2% |
| Czechoslovakian | 6 | 0.2% |
| Dutch | 24 | 0.7% |
| Eastern European | 2 | 0.1% |
| English | 238 | 6.9% |
| European | 270 | 7.9% |
| French | 69 | 2.0% |
| French Canadian | 21 | 0.6% |
| German | 431 | 12.6% |
| Hungarian | 18 | 0.5% |
| Irish | 117 | 3.4% |
| Italian | 104 | 3.0% |
| Korean | 27 | 0.8% |
| Mexican | 1,394 | 40.7% |
| Mexican American Indian | 59 | 1.7% |
| Norwegian | 83 | 2.4% |
| Polish | 7 | 0.2% |
| Portuguese | 17 | 0.5% |
| Russian | 130 | 3.8% |
| Scottish | 111 | 3.2% |
| Spaniard | 69 | 2.0% |
| Spanish | 9 | 0.3% |
| Sri Lankan | 6 | 0.2% |
| Swedish | 62 | 1.8% |
| Swiss | 48 | 1.4% |
| Thai | 4 | 0.1% |
| Tohono O'Odham | 27 | 0.8% |
| Welsh | 51 | 1.5% |
| Yugoslavian | 19 | 0.5% | View All 35 Rows |
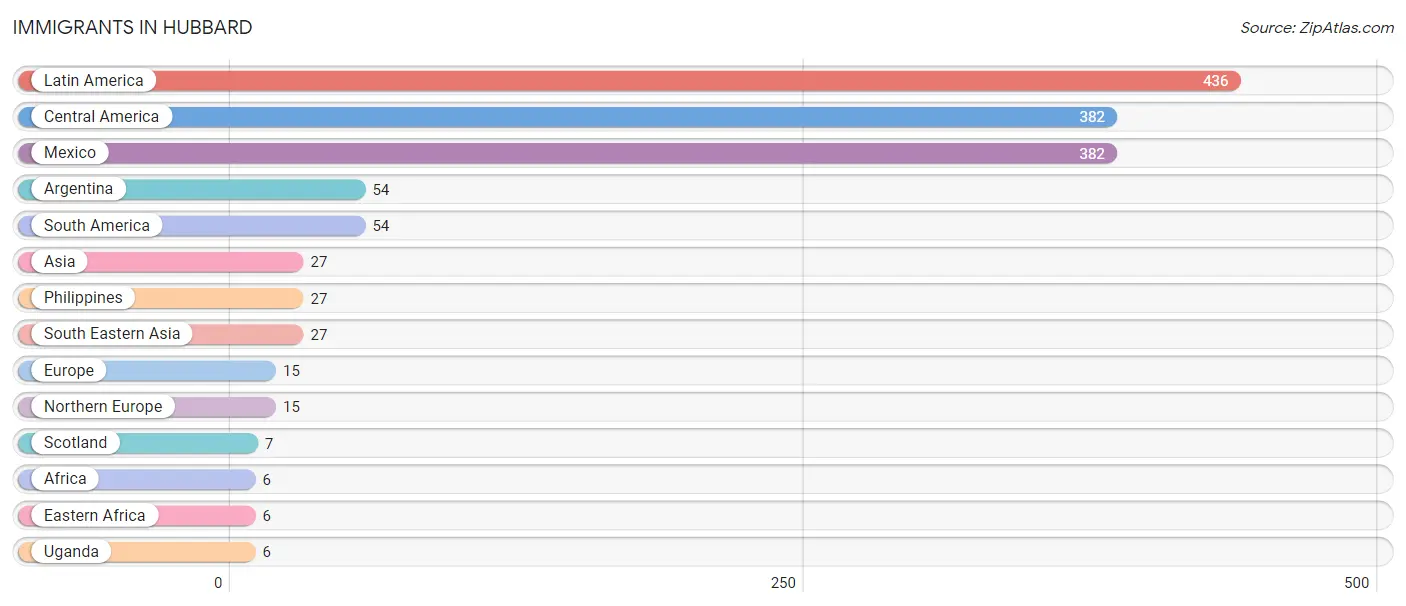
Immigrants in Hubbard
The most numerous immigrant groups reported in Hubbard came from Latin America (436 | 12.7%), Central America (382 | 11.2%), Mexico (382 | 11.2%), Argentina (54 | 1.6%), and South America (54 | 1.6%), together accounting for 38.2% of all Hubbard residents.
| Immigration Origin | # Population | % Population |
| Africa | 6 | 0.2% |
| Argentina | 54 | 1.6% |
| Asia | 27 | 0.8% |
| Central America | 382 | 11.2% |
| Eastern Africa | 6 | 0.2% |
| Europe | 15 | 0.4% |
| Latin America | 436 | 12.7% |
| Mexico | 382 | 11.2% |
| Northern Europe | 15 | 0.4% |
| Philippines | 27 | 0.8% |
| Scotland | 7 | 0.2% |
| South America | 54 | 1.6% |
| South Eastern Asia | 27 | 0.8% |
| Uganda | 6 | 0.2% | View All 14 Rows |
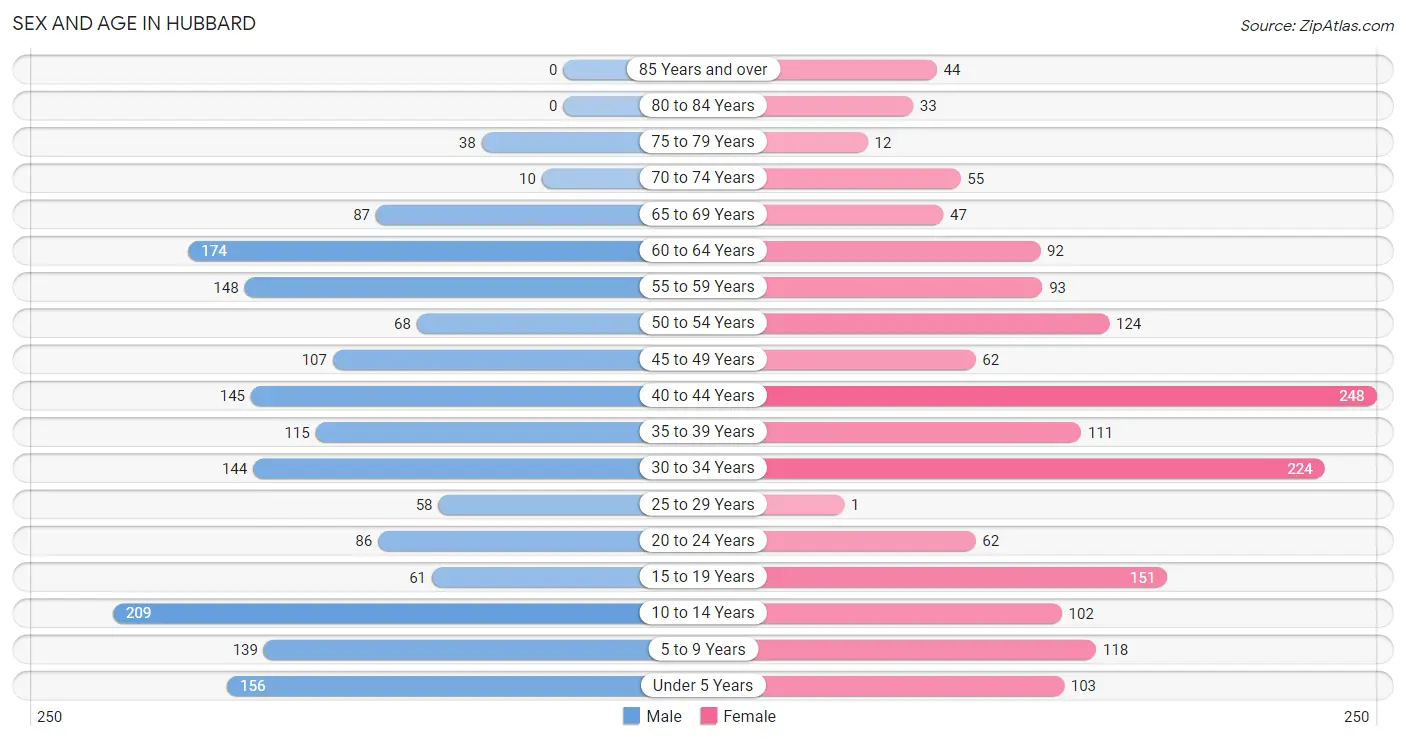
Sex and Age in Hubbard
Sex and Age in Hubbard
The most populous age groups in Hubbard are 10 to 14 Years (209 | 12.0%) for men and 40 to 44 Years (248 | 14.7%) for women.
| Age Bracket | Male | Female |
| Under 5 Years | 156 (8.9%) | 103 (6.1%) |
| 5 to 9 Years | 139 (8.0%) | 118 (7.0%) |
| 10 to 14 Years | 209 (12.0%) | 102 (6.1%) |
| 15 to 19 Years | 61 (3.5%) | 151 (9.0%) |
| 20 to 24 Years | 86 (4.9%) | 62 (3.7%) |
| 25 to 29 Years | 58 (3.3%) | 1 (0.1%) |
| 30 to 34 Years | 144 (8.3%) | 224 (13.3%) |
| 35 to 39 Years | 115 (6.6%) | 111 (6.6%) |
| 40 to 44 Years | 145 (8.3%) | 248 (14.7%) |
| 45 to 49 Years | 107 (6.1%) | 62 (3.7%) |
| 50 to 54 Years | 68 (3.9%) | 124 (7.4%) |
| 55 to 59 Years | 148 (8.5%) | 93 (5.5%) |
| 60 to 64 Years | 174 (10.0%) | 92 (5.5%) |
| 65 to 69 Years | 87 (5.0%) | 47 (2.8%) |
| 70 to 74 Years | 10 (0.6%) | 55 (3.3%) |
| 75 to 79 Years | 38 (2.2%) | 12 (0.7%) |
| 80 to 84 Years | 0 (0.0%) | 33 (2.0%) |
| 85 Years and over | 0 (0.0%) | 44 (2.6%) |
| Total | 1,745 (100.0%) | 1,682 (100.0%) |
Families and Households in Hubbard
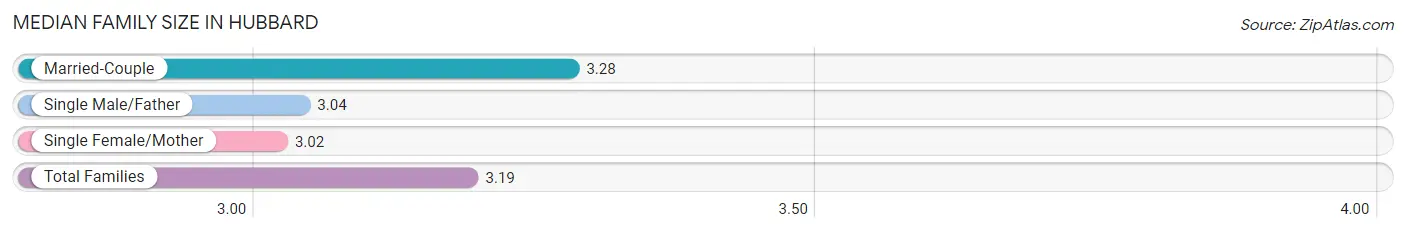
Median Family Size in Hubbard
The median family size in Hubbard is 3.19 persons per family, with married-couple families (547 | 61.7%) accounting for the largest median family size of 3.28 persons per family. On the other hand, single female/mother families (248 | 28.0%) represent the smallest median family size with 3.02 persons per family.
| Family Type | # Families | Family Size |
| Married-Couple | 547 (61.7%) | 3.28 |
| Single Male/Father | 91 (10.3%) | 3.04 |
| Single Female/Mother | 248 (28.0%) | 3.02 |
| Total Families | 886 (100.0%) | 3.19 |
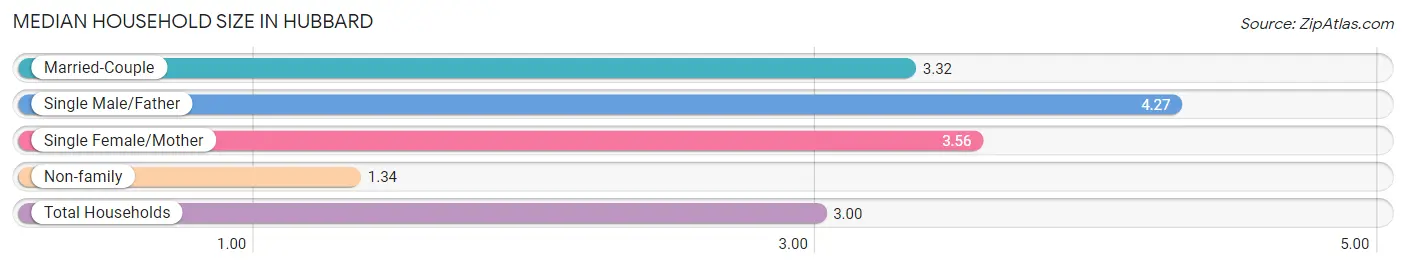
Median Household Size in Hubbard
The median household size in Hubbard is 3.00 persons per household, with single male/father households (91 | 8.0%) accounting for the largest median household size of 4.27 persons per household. non-family households (256 | 22.4%) represent the smallest median household size with 1.34 persons per household.
| Household Type | # Households | Household Size |
| Married-Couple | 547 (47.9%) | 3.32 |
| Single Male/Father | 91 (8.0%) | 4.27 |
| Single Female/Mother | 248 (21.7%) | 3.56 |
| Non-family | 256 (22.4%) | 1.34 |
| Total Households | 1,142 (100.0%) | 3.00 |
Household Size by Marriage Status in Hubbard
Out of a total of 1,142 households in Hubbard, 886 (77.6%) are family households, while 256 (22.4%) are nonfamily households. The most numerous type of family households are 2-person households, comprising 321, and the most common type of nonfamily households are 1-person households, comprising 190.
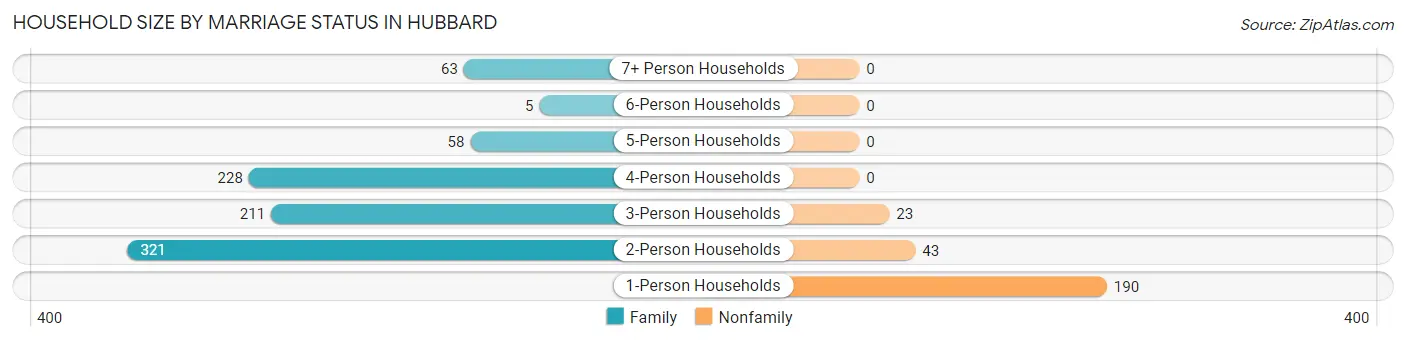
| Household Size | Family Households | Nonfamily Households |
| 1-Person Households | - | 190 (16.6%) |
| 2-Person Households | 321 (28.1%) | 43 (3.8%) |
| 3-Person Households | 211 (18.5%) | 23 (2.0%) |
| 4-Person Households | 228 (20.0%) | 0 (0.0%) |
| 5-Person Households | 58 (5.1%) | 0 (0.0%) |
| 6-Person Households | 5 (0.4%) | 0 (0.0%) |
| 7+ Person Households | 63 (5.5%) | 0 (0.0%) |
| Total | 886 (77.6%) | 256 (22.4%) |
Female Fertility in Hubbard
Fertility by Age in Hubbard
Average fertility rate in Hubbard is 36.0 births per 1,000 women. Women in the age bracket of 20 to 34 years have the highest fertility rate with 87.0 births per 1,000 women. Women in the age bracket of 20 to 34 years acount for 80.6% of all women with births.
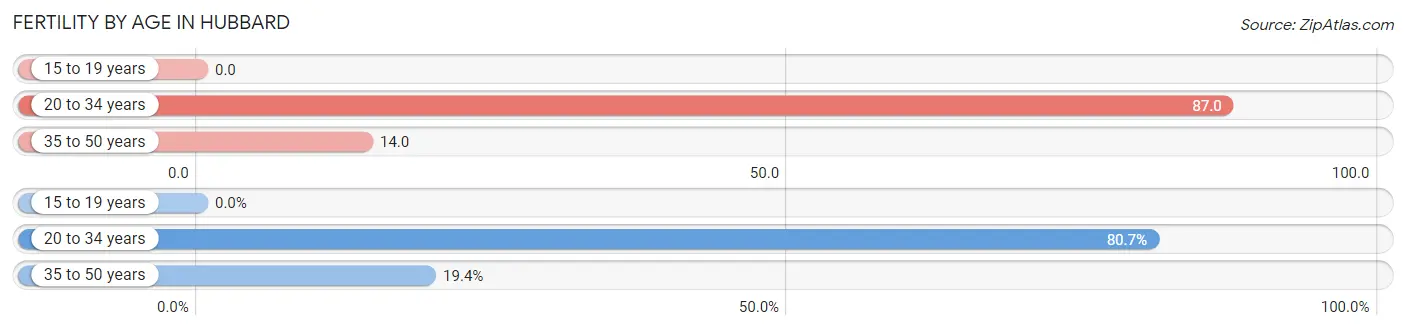
| Age Bracket | Women with Births | Births / 1,000 Women |
| 15 to 19 years | 0 (0.0%) | 0.0 |
| 20 to 34 years | 25 (80.6%) | 87.0 |
| 35 to 50 years | 6 (19.4%) | 14.0 |
| Total | 31 (100.0%) | 36.0 |
Fertility by Age by Marriage Status in Hubbard
74.2% of women with births (31) in Hubbard are married. The highest percentage of unmarried women with births falls into 20 to 34 years age bracket with 32.0% of them unmarried at the time of birth, while the lowest percentage of unmarried women with births belong to 35 to 50 years age bracket with 0.0% of them unmarried.
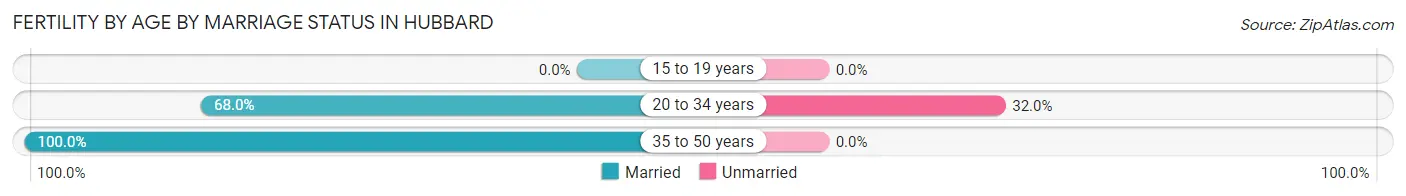
| Age Bracket | Married | Unmarried |
| 15 to 19 years | 0 (0.0%) | 0 (0.0%) |
| 20 to 34 years | 17 (68.0%) | 8 (32.0%) |
| 35 to 50 years | 6 (100.0%) | 0 (0.0%) |
| Total | 23 (74.2%) | 8 (25.8%) |
Fertility by Education in Hubbard
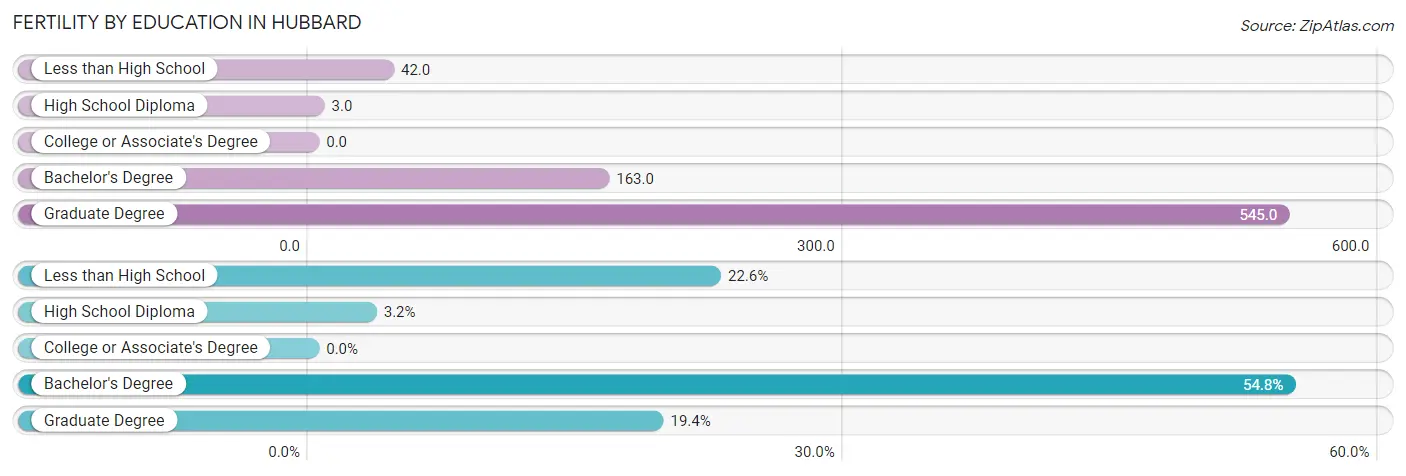
| Educational Attainment | Women with Births | Births / 1,000 Women |
| Less than High School | 7 (22.6%) | 42.0 |
| High School Diploma | 1 (3.2%) | 3.0 |
| College or Associate's Degree | 0 (0.0%) | 0.0 |
| Bachelor's Degree | 17 (54.8%) | 163.0 |
| Graduate Degree | 6 (19.4%) | 545.0 |
| Total | 31 (100.0%) | 36.0 |
Fertility by Education by Marriage Status in Hubbard
25.8% of women with births in Hubbard are unmarried. Women with the educational attainment of bachelor's degree are most likely to be married with 100.0% of them married at childbirth, while women with the educational attainment of less than high school are least likely to be married with 100.0% of them unmarried at childbirth.
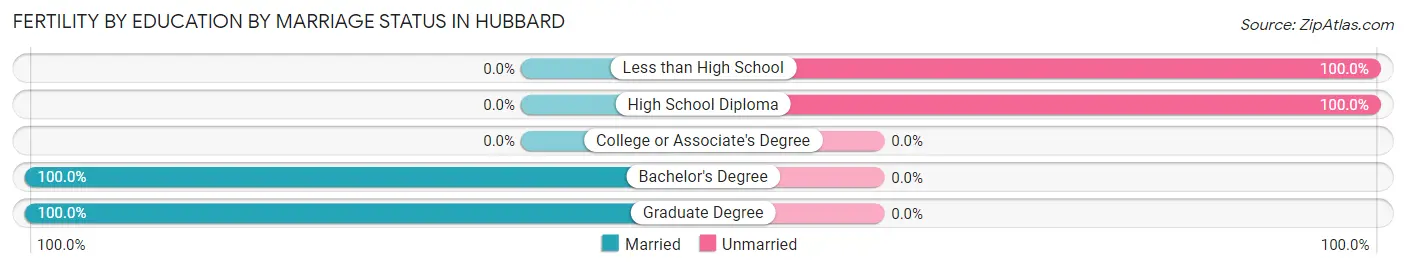
| Educational Attainment | Married | Unmarried |
| Less than High School | 0 (0.0%) | 7 (100.0%) |
| High School Diploma | 0 (0.0%) | 1 (100.0%) |
| College or Associate's Degree | 0 (0.0%) | 0 (0.0%) |
| Bachelor's Degree | 17 (100.0%) | 0 (0.0%) |
| Graduate Degree | 6 (100.0%) | 0 (0.0%) |
| Total | 23 (74.2%) | 8 (25.8%) |
Employment Characteristics in Hubbard
Employment by Class of Employer in Hubbard
Among the 1,783 employed individuals in Hubbard, private company employees (1,331 | 74.7%), not-for-profit organizations (127 | 7.1%), and self-employed (incorporated) (101 | 5.7%) make up the most common classes of employment.
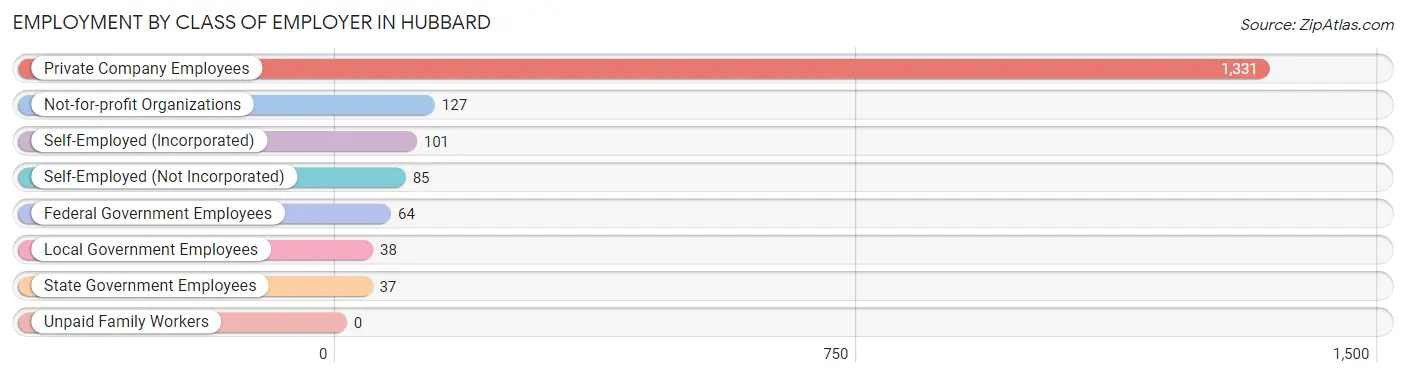
| Employer Class | # Employees | % Employees |
| Private Company Employees | 1,331 | 74.7% |
| Self-Employed (Incorporated) | 101 | 5.7% |
| Self-Employed (Not Incorporated) | 85 | 4.8% |
| Not-for-profit Organizations | 127 | 7.1% |
| Local Government Employees | 38 | 2.1% |
| State Government Employees | 37 | 2.1% |
| Federal Government Employees | 64 | 3.6% |
| Unpaid Family Workers | 0 | 0.0% |
| Total | 1,783 | 100.0% |
Employment Status by Age in Hubbard
According to the labor force statistics for Hubbard, out of the total population over 16 years of age (2,587), 74.4% or 1,925 individuals are in the labor force, with 2.5% or 48 of them unemployed. The age group with the highest labor force participation rate is 35 to 44 years, with 95.3% or 590 individuals in the labor force. Within the labor force, the 45 to 54 years age range has the highest percentage of unemployed individuals, with 4.5% or 15 of them being unemployed.
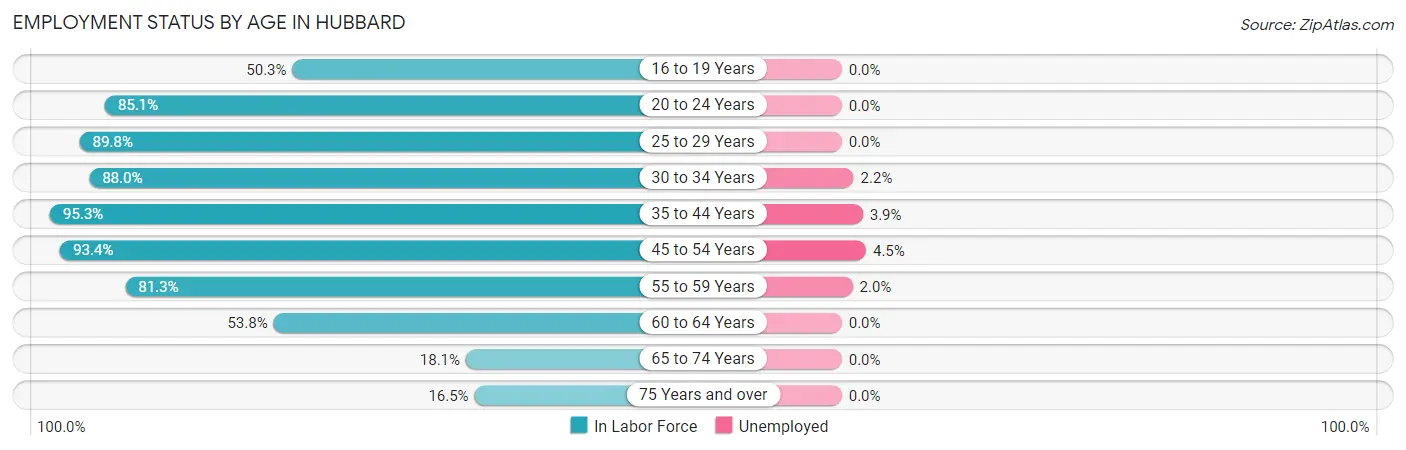
| Age Bracket | In Labor Force | Unemployed |
| 16 to 19 Years | 100 (50.3%) | 0 (0.0%) |
| 20 to 24 Years | 126 (85.1%) | 0 (0.0%) |
| 25 to 29 Years | 53 (89.8%) | 0 (0.0%) |
| 30 to 34 Years | 324 (88.0%) | 7 (2.2%) |
| 35 to 44 Years | 590 (95.3%) | 23 (3.9%) |
| 45 to 54 Years | 337 (93.4%) | 15 (4.5%) |
| 55 to 59 Years | 196 (81.3%) | 4 (2.0%) |
| 60 to 64 Years | 143 (53.8%) | 0 (0.0%) |
| 65 to 74 Years | 36 (18.1%) | 0 (0.0%) |
| 75 Years and over | 21 (16.5%) | 0 (0.0%) |
| Total | 1,925 (74.4%) | 48 (2.5%) |
Employment Status by Educational Attainment in Hubbard
According to labor force statistics for Hubbard, 85.8% of individuals (1,642) out of the total population between 25 and 64 years of age (1,914) are in the labor force, with 3.0% or 49 of them being unemployed. The group with the highest labor force participation rate are those with the educational attainment of college / associate degree, with 92.3% or 470 individuals in the labor force. Within the labor force, individuals with college / associate degree education have the highest percentage of unemployment, with 6.4% or 30 of them being unemployed.
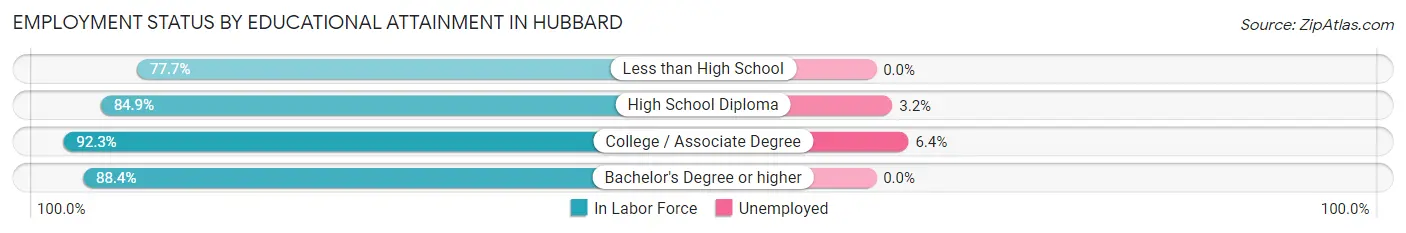
| Educational Attainment | In Labor Force | Unemployed |
| Less than High School | 328 (77.7%) | 0 (0.0%) |
| High School Diploma | 587 (84.9%) | 22 (3.2%) |
| College / Associate Degree | 470 (92.3%) | 33 (6.4%) |
| Bachelor's Degree or higher | 258 (88.4%) | 0 (0.0%) |
| Total | 1,642 (85.8%) | 57 (3.0%) |
Employment Occupations by Sex in Hubbard
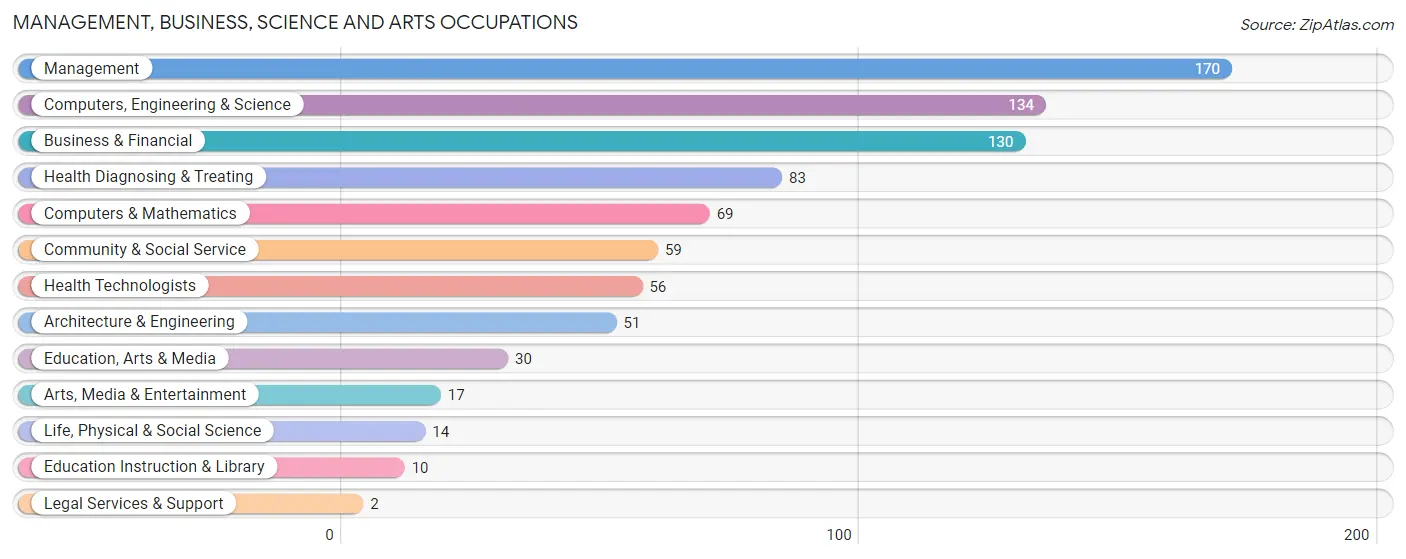
Management, Business, Science and Arts Occupations
The most common Management, Business, Science and Arts occupations in Hubbard are Management (170 | 9.1%), Computers, Engineering & Science (134 | 7.1%), Business & Financial (130 | 6.9%), Health Diagnosing & Treating (83 | 4.4%), and Computers & Mathematics (69 | 3.7%).
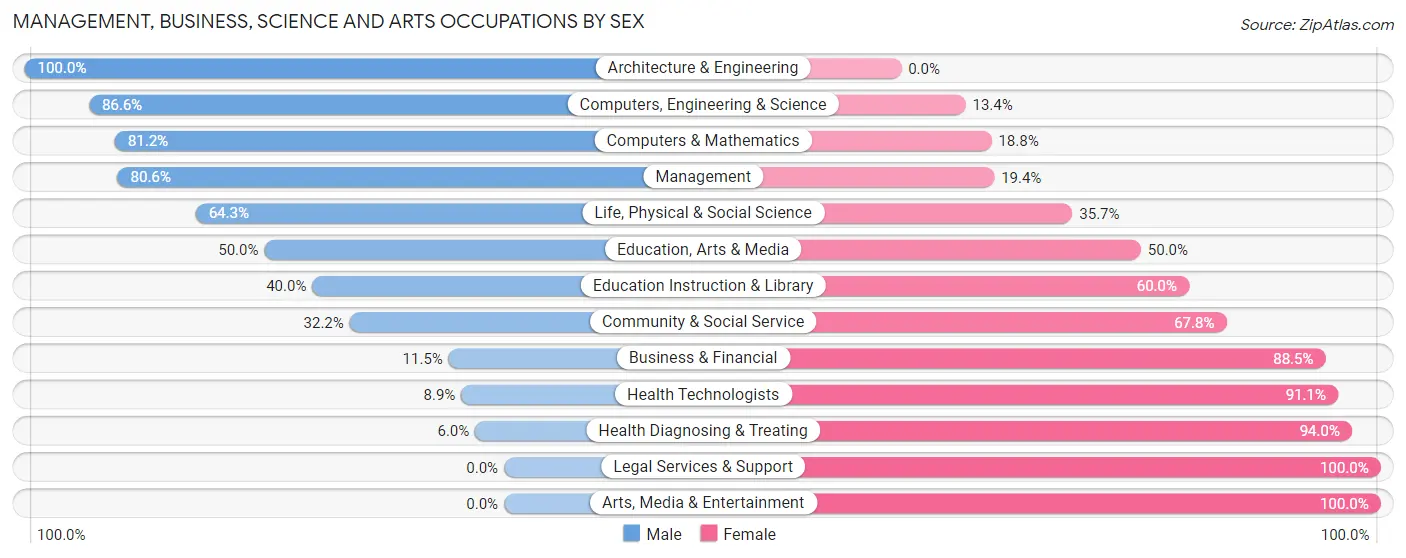
Management, Business, Science and Arts Occupations by Sex
Within the Management, Business, Science and Arts occupations in Hubbard, the most male-oriented occupations are Architecture & Engineering (100.0%), Computers, Engineering & Science (86.6%), and Computers & Mathematics (81.2%), while the most female-oriented occupations are Legal Services & Support (100.0%), Arts, Media & Entertainment (100.0%), and Health Diagnosing & Treating (94.0%).
| Occupation | Male | Female |
| Management | 137 (80.6%) | 33 (19.4%) |
| Business & Financial | 15 (11.5%) | 115 (88.5%) |
| Computers, Engineering & Science | 116 (86.6%) | 18 (13.4%) |
| Computers & Mathematics | 56 (81.2%) | 13 (18.8%) |
| Architecture & Engineering | 51 (100.0%) | 0 (0.0%) |
| Life, Physical & Social Science | 9 (64.3%) | 5 (35.7%) |
| Community & Social Service | 19 (32.2%) | 40 (67.8%) |
| Education, Arts & Media | 15 (50.0%) | 15 (50.0%) |
| Legal Services & Support | 0 (0.0%) | 2 (100.0%) |
| Education Instruction & Library | 4 (40.0%) | 6 (60.0%) |
| Arts, Media & Entertainment | 0 (0.0%) | 17 (100.0%) |
| Health Diagnosing & Treating | 5 (6.0%) | 78 (94.0%) |
| Health Technologists | 5 (8.9%) | 51 (91.1%) |
| Total (Category) | 292 (50.7%) | 284 (49.3%) |
| Total (Overall) | 996 (53.1%) | 881 (46.9%) |
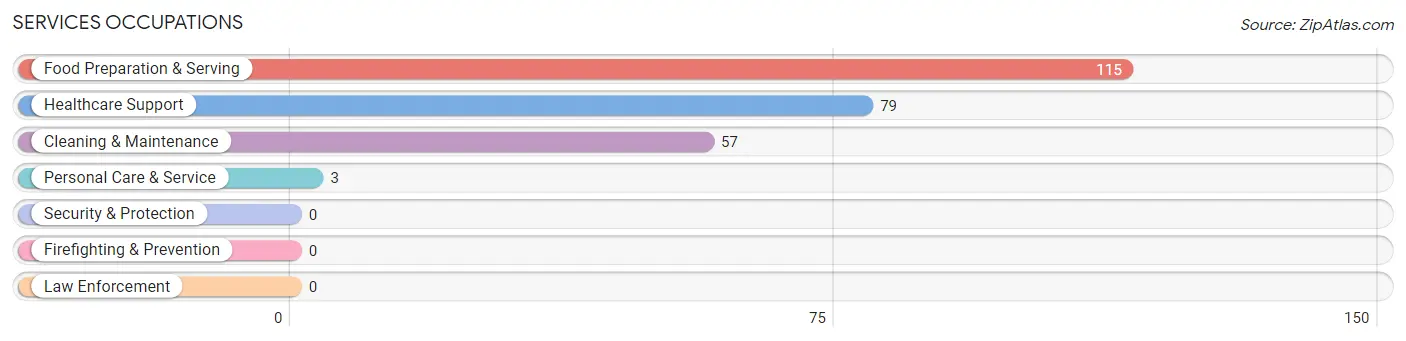
Services Occupations
The most common Services occupations in Hubbard are Food Preparation & Serving (115 | 6.1%), Healthcare Support (79 | 4.2%), Cleaning & Maintenance (57 | 3.0%), and Personal Care & Service (3 | 0.2%).
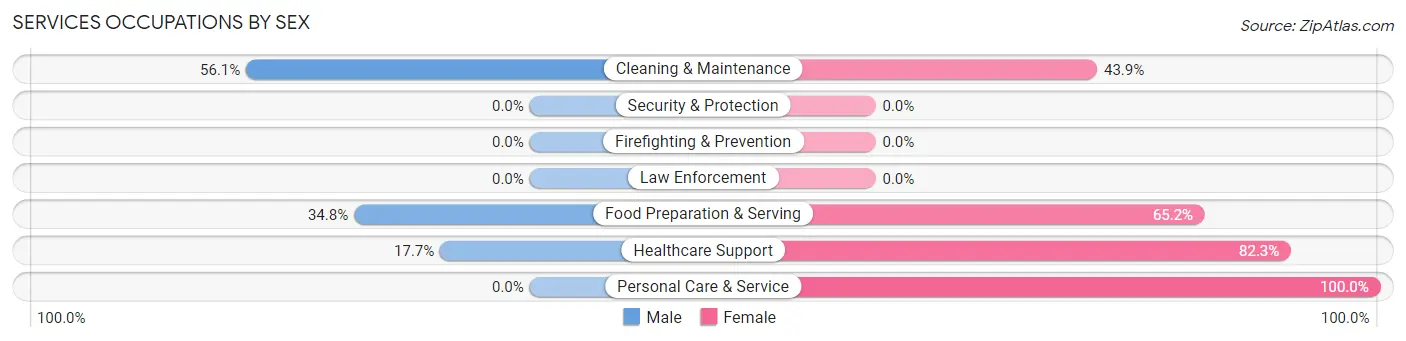
Services Occupations by Sex
Within the Services occupations in Hubbard, the most male-oriented occupations are Cleaning & Maintenance (56.1%), Food Preparation & Serving (34.8%), and Healthcare Support (17.7%), while the most female-oriented occupations are Personal Care & Service (100.0%), Healthcare Support (82.3%), and Food Preparation & Serving (65.2%).
| Occupation | Male | Female |
| Healthcare Support | 14 (17.7%) | 65 (82.3%) |
| Security & Protection | 0 (0.0%) | 0 (0.0%) |
| Firefighting & Prevention | 0 (0.0%) | 0 (0.0%) |
| Law Enforcement | 0 (0.0%) | 0 (0.0%) |
| Food Preparation & Serving | 40 (34.8%) | 75 (65.2%) |
| Cleaning & Maintenance | 32 (56.1%) | 25 (43.9%) |
| Personal Care & Service | 0 (0.0%) | 3 (100.0%) |
| Total (Category) | 86 (33.9%) | 168 (66.1%) |
| Total (Overall) | 996 (53.1%) | 881 (46.9%) |
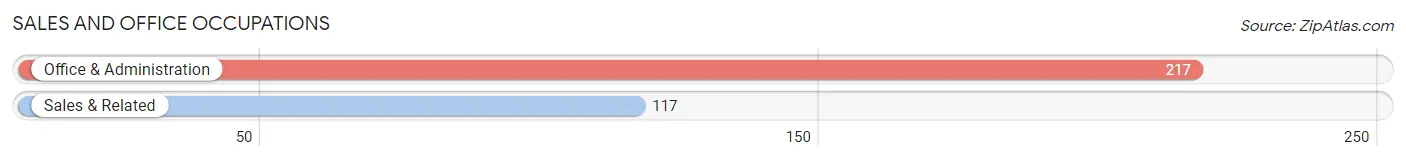
Sales and Office Occupations
The most common Sales and Office occupations in Hubbard are Office & Administration (217 | 11.6%), and Sales & Related (117 | 6.2%).
Sales and Office Occupations by Sex
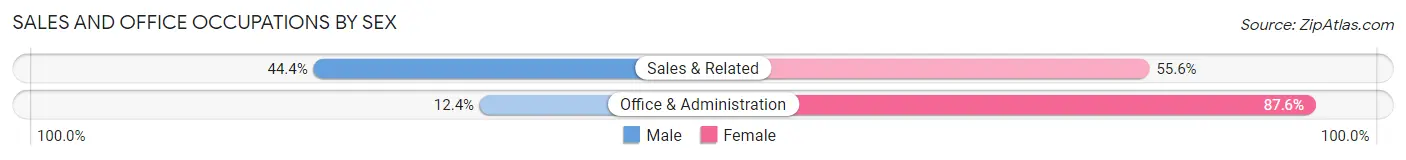
| Occupation | Male | Female |
| Sales & Related | 52 (44.4%) | 65 (55.6%) |
| Office & Administration | 27 (12.4%) | 190 (87.6%) |
| Total (Category) | 79 (23.6%) | 255 (76.3%) |
| Total (Overall) | 996 (53.1%) | 881 (46.9%) |
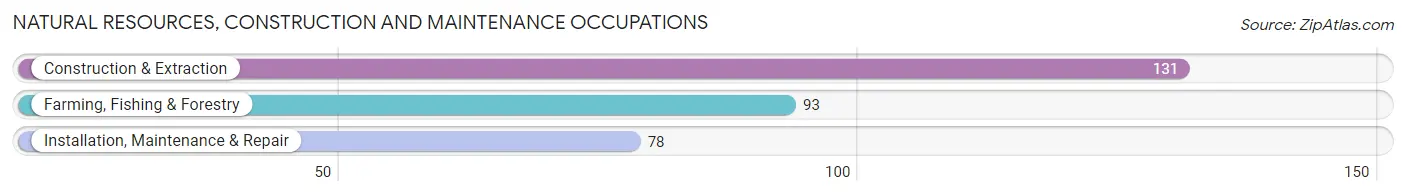
Natural Resources, Construction and Maintenance Occupations
The most common Natural Resources, Construction and Maintenance occupations in Hubbard are Construction & Extraction (131 | 7.0%), Farming, Fishing & Forestry (93 | 5.0%), and Installation, Maintenance & Repair (78 | 4.2%).
Natural Resources, Construction and Maintenance Occupations by Sex
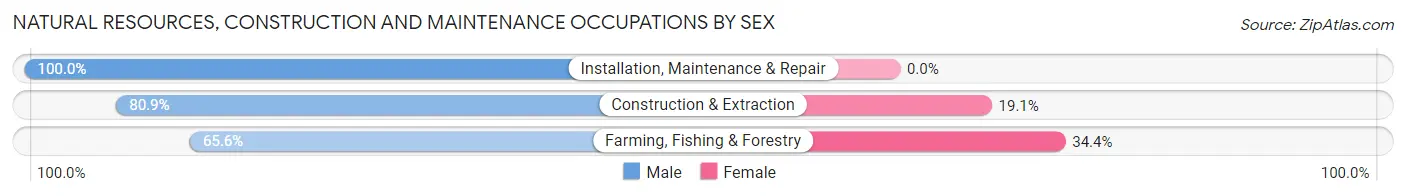
| Occupation | Male | Female |
| Farming, Fishing & Forestry | 61 (65.6%) | 32 (34.4%) |
| Construction & Extraction | 106 (80.9%) | 25 (19.1%) |
| Installation, Maintenance & Repair | 78 (100.0%) | 0 (0.0%) |
| Total (Category) | 245 (81.1%) | 57 (18.9%) |
| Total (Overall) | 996 (53.1%) | 881 (46.9%) |
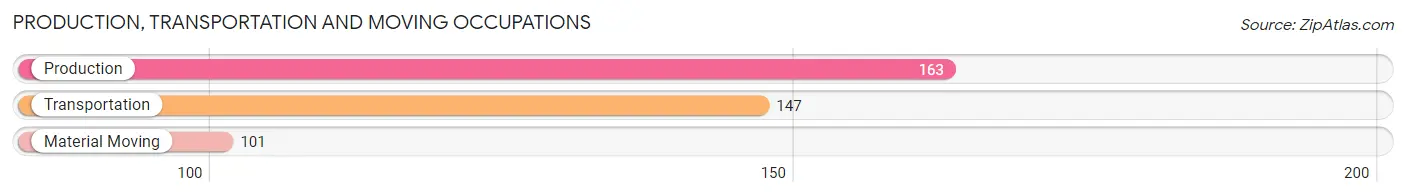
Production, Transportation and Moving Occupations
The most common Production, Transportation and Moving occupations in Hubbard are Production (163 | 8.7%), Transportation (147 | 7.8%), and Material Moving (101 | 5.4%).
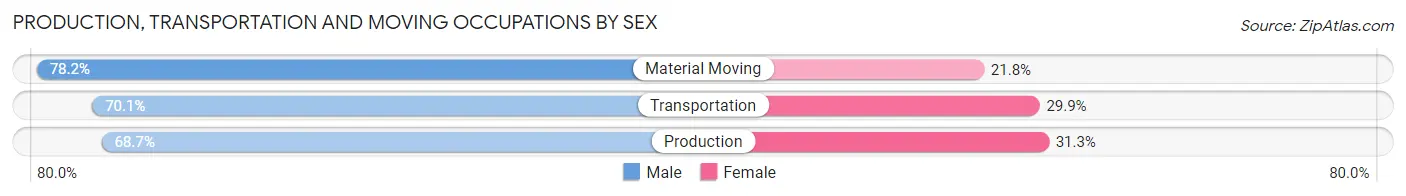
Production, Transportation and Moving Occupations by Sex
| Occupation | Male | Female |
| Production | 112 (68.7%) | 51 (31.3%) |
| Transportation | 103 (70.1%) | 44 (29.9%) |
| Material Moving | 79 (78.2%) | 22 (21.8%) |
| Total (Category) | 294 (71.5%) | 117 (28.5%) |
| Total (Overall) | 996 (53.1%) | 881 (46.9%) |
Employment Industries by Sex in Hubbard
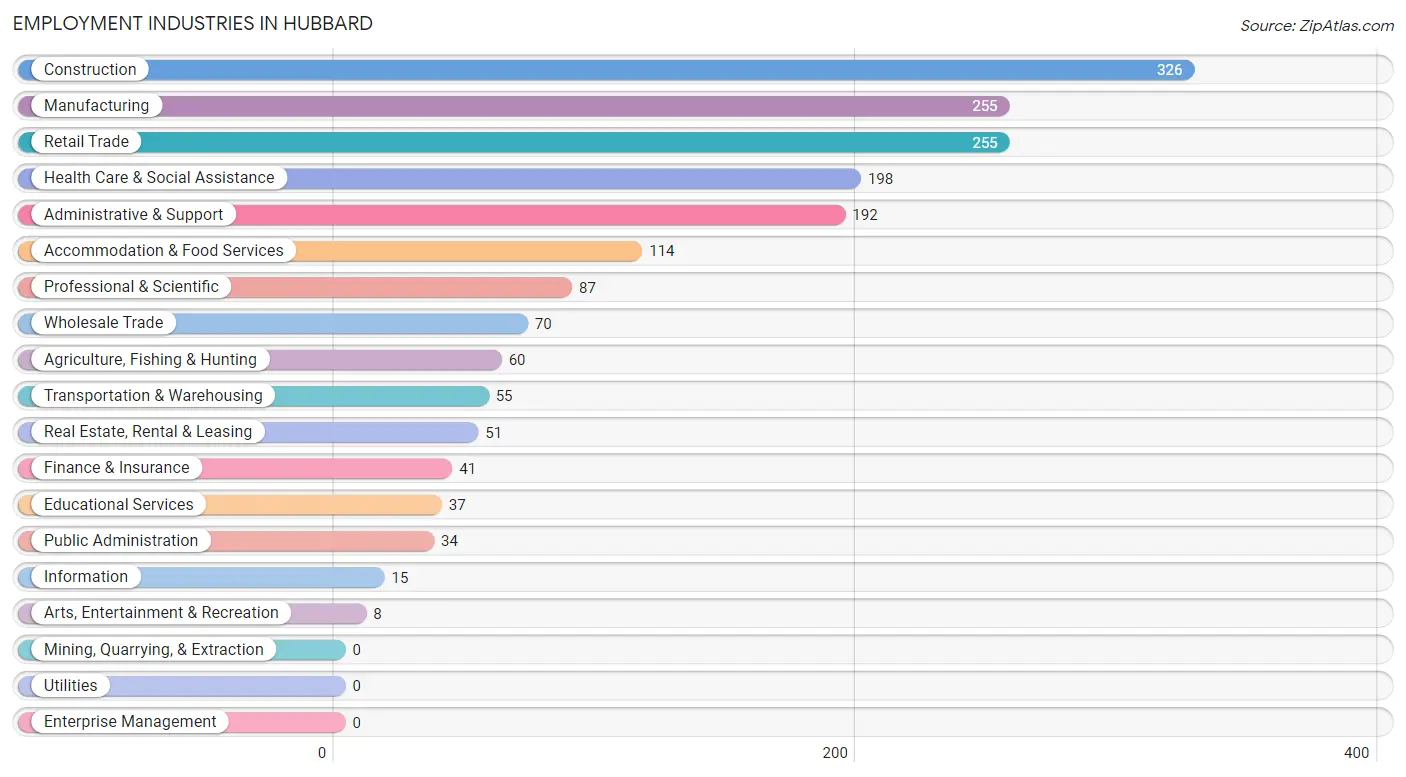
Employment Industries in Hubbard
The major employment industries in Hubbard include Construction (326 | 17.4%), Manufacturing (255 | 13.6%), Retail Trade (255 | 13.6%), Health Care & Social Assistance (198 | 10.5%), and Administrative & Support (192 | 10.2%).
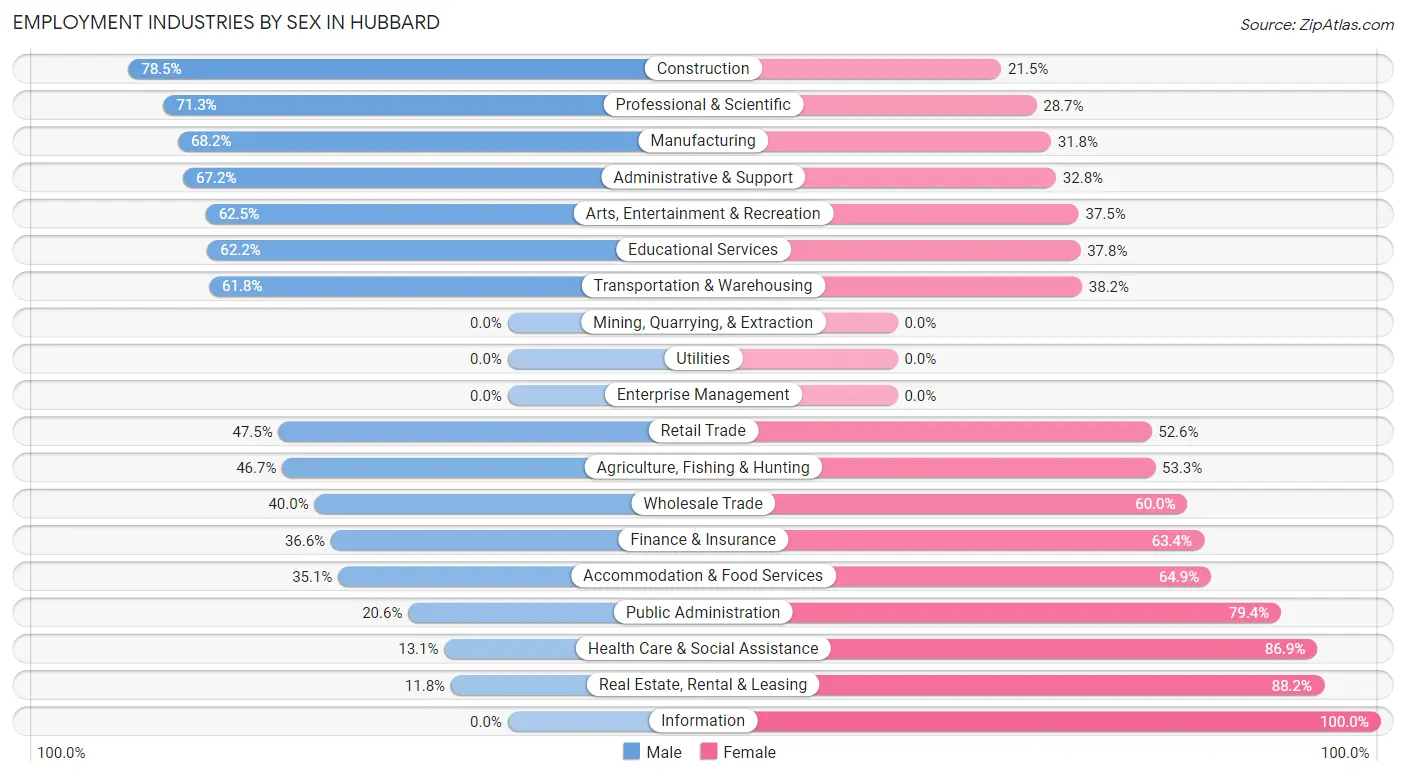
Employment Industries by Sex in Hubbard
The Hubbard industries that see more men than women are Construction (78.5%), Professional & Scientific (71.3%), and Manufacturing (68.2%), whereas the industries that tend to have a higher number of women are Information (100.0%), Real Estate, Rental & Leasing (88.2%), and Health Care & Social Assistance (86.9%).
| Industry | Male | Female |
| Agriculture, Fishing & Hunting | 28 (46.7%) | 32 (53.3%) |
| Mining, Quarrying, & Extraction | 0 (0.0%) | 0 (0.0%) |
| Construction | 256 (78.5%) | 70 (21.5%) |
| Manufacturing | 174 (68.2%) | 81 (31.8%) |
| Wholesale Trade | 28 (40.0%) | 42 (60.0%) |
| Retail Trade | 121 (47.4%) | 134 (52.5%) |
| Transportation & Warehousing | 34 (61.8%) | 21 (38.2%) |
| Utilities | 0 (0.0%) | 0 (0.0%) |
| Information | 0 (0.0%) | 15 (100.0%) |
| Finance & Insurance | 15 (36.6%) | 26 (63.4%) |
| Real Estate, Rental & Leasing | 6 (11.8%) | 45 (88.2%) |
| Professional & Scientific | 62 (71.3%) | 25 (28.7%) |
| Enterprise Management | 0 (0.0%) | 0 (0.0%) |
| Administrative & Support | 129 (67.2%) | 63 (32.8%) |
| Educational Services | 23 (62.2%) | 14 (37.8%) |
| Health Care & Social Assistance | 26 (13.1%) | 172 (86.9%) |
| Arts, Entertainment & Recreation | 5 (62.5%) | 3 (37.5%) |
| Accommodation & Food Services | 40 (35.1%) | 74 (64.9%) |
| Public Administration | 7 (20.6%) | 27 (79.4%) |
| Total | 996 (53.1%) | 881 (46.9%) |
Education in Hubbard
School Enrollment in Hubbard
The most common levels of schooling among the 786 students in Hubbard are high school (254 | 32.3%), middle school (185 | 23.5%), and elementary school (169 | 21.5%).
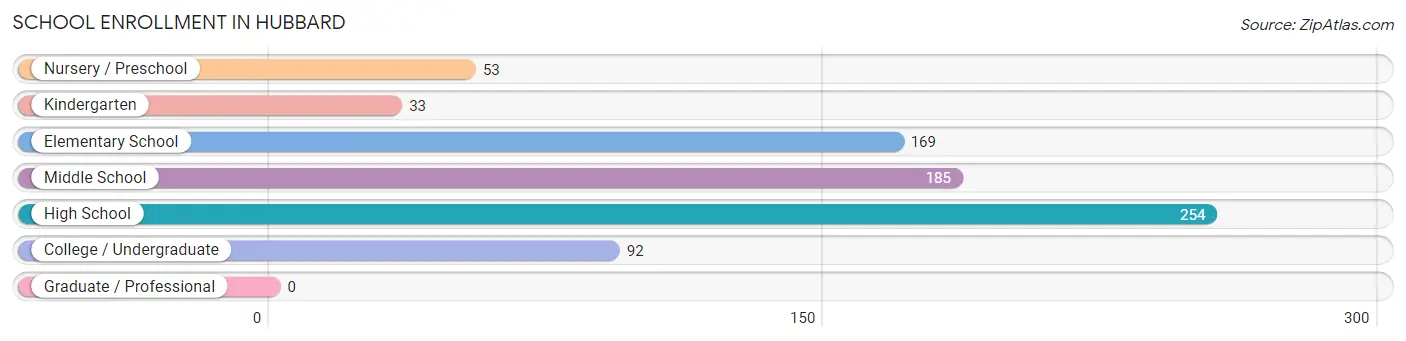
| School Level | # Students | % Students |
| Nursery / Preschool | 53 | 6.7% |
| Kindergarten | 33 | 4.2% |
| Elementary School | 169 | 21.5% |
| Middle School | 185 | 23.5% |
| High School | 254 | 32.3% |
| College / Undergraduate | 92 | 11.7% |
| Graduate / Professional | 0 | 0.0% |
| Total | 786 | 100.0% |
School Enrollment by Age by Funding Source in Hubbard
Out of a total of 786 students who are enrolled in schools in Hubbard, 97 (12.3%) attend a private institution, while the remaining 689 (87.7%) are enrolled in public schools. The age group of 35 years and over has the highest likelihood of being enrolled in private schools, with 9 (47.4% in the age bracket) enrolled. Conversely, the age group of 18 to 19 year olds has the lowest likelihood of being enrolled in a private school, with 67 (100.0% in the age bracket) attending a public institution.
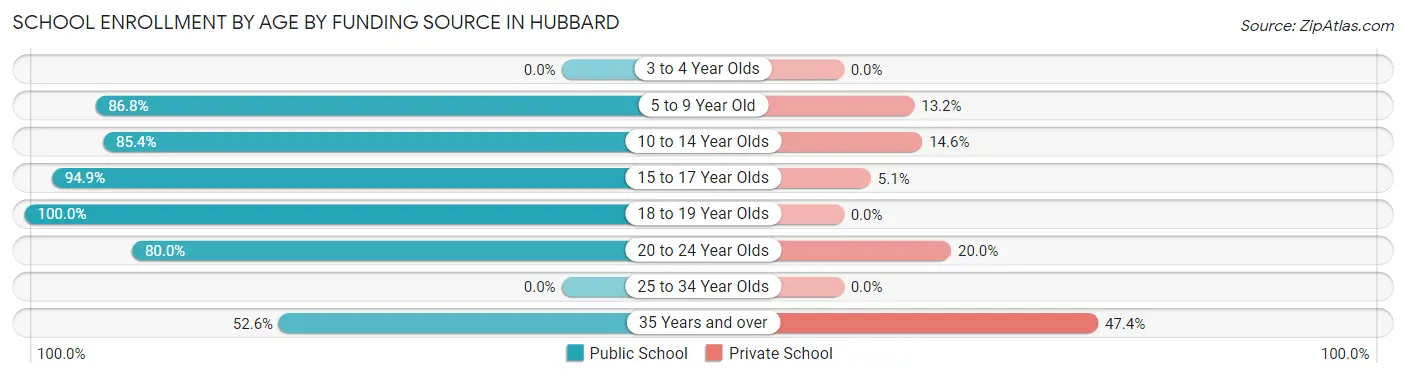
| Age Bracket | Public School | Private School |
| 3 to 4 Year Olds | 0 (0.0%) | 0 (0.0%) |
| 5 to 9 Year Old | 198 (86.8%) | 30 (13.2%) |
| 10 to 14 Year Olds | 251 (85.4%) | 43 (14.6%) |
| 15 to 17 Year Olds | 131 (94.9%) | 7 (5.1%) |
| 18 to 19 Year Olds | 67 (100.0%) | 0 (0.0%) |
| 20 to 24 Year Olds | 32 (80.0%) | 8 (20.0%) |
| 25 to 34 Year Olds | 0 (0.0%) | 0 (0.0%) |
| 35 Years and over | 10 (52.6%) | 9 (47.4%) |
| Total | 689 (87.7%) | 97 (12.3%) |
Educational Attainment by Field of Study in Hubbard
Business (152 | 42.8%), science & technology (56 | 15.8%), education (28 | 7.9%), physical & health sciences (21 | 5.9%), and communications (21 | 5.9%) are the most common fields of study among 355 individuals in Hubbard who have obtained a bachelor's degree or higher.
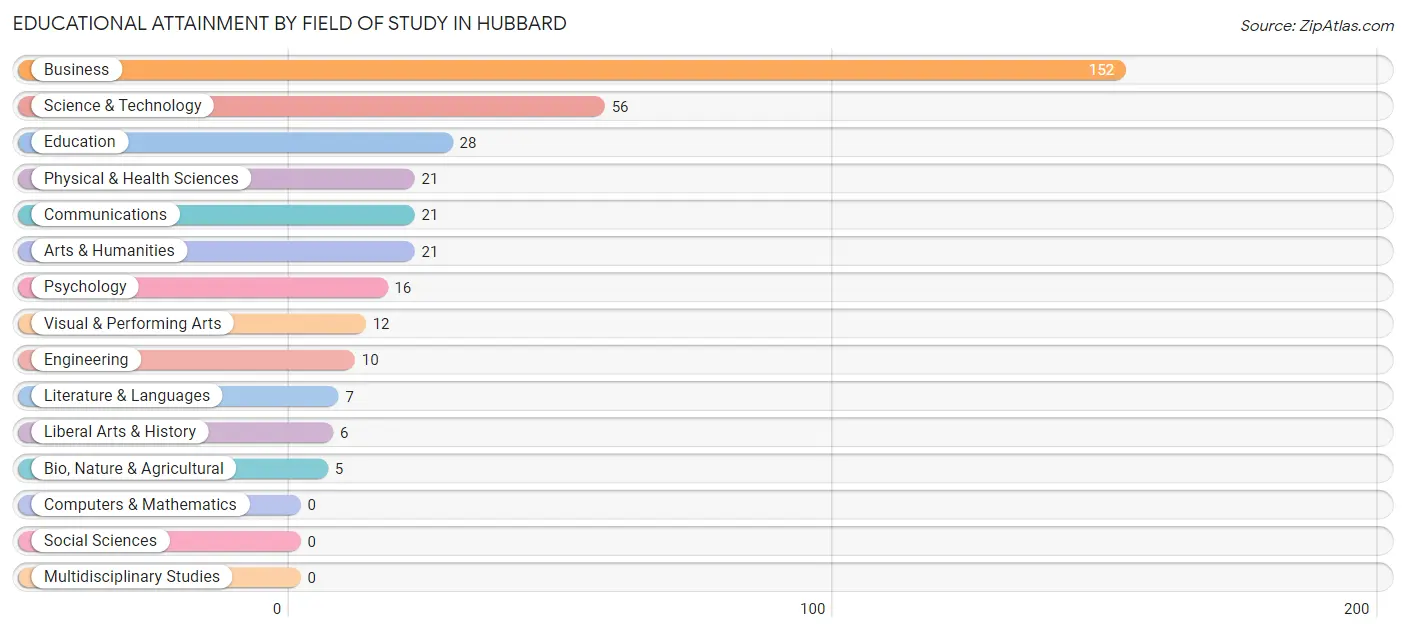
| Field of Study | # Graduates | % Graduates |
| Computers & Mathematics | 0 | 0.0% |
| Bio, Nature & Agricultural | 5 | 1.4% |
| Physical & Health Sciences | 21 | 5.9% |
| Psychology | 16 | 4.5% |
| Social Sciences | 0 | 0.0% |
| Engineering | 10 | 2.8% |
| Multidisciplinary Studies | 0 | 0.0% |
| Science & Technology | 56 | 15.8% |
| Business | 152 | 42.8% |
| Education | 28 | 7.9% |
| Literature & Languages | 7 | 2.0% |
| Liberal Arts & History | 6 | 1.7% |
| Visual & Performing Arts | 12 | 3.4% |
| Communications | 21 | 5.9% |
| Arts & Humanities | 21 | 5.9% |
| Total | 355 | 100.0% |
Transportation & Commute in Hubbard
Vehicle Availability by Sex in Hubbard
The most prevalent vehicle ownership categories in Hubbard are males with 2 vehicles (384, accounting for 41.7%) and females with 2 vehicles (498, making up 44.6%).
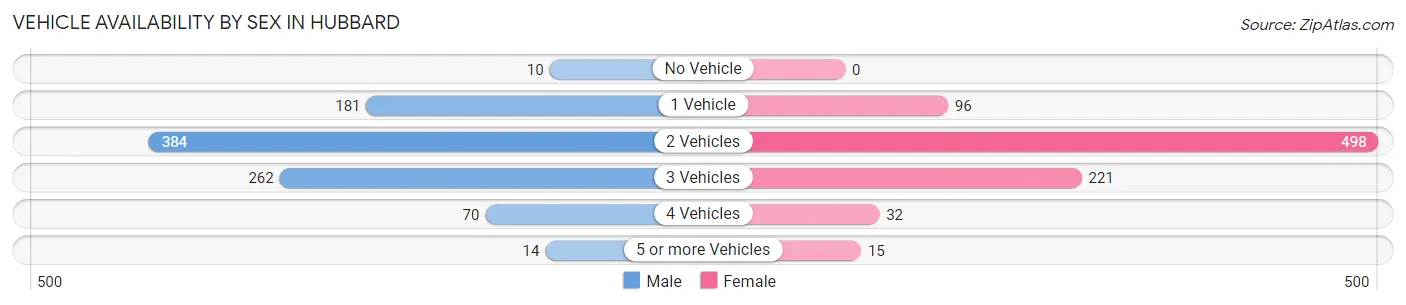
| Vehicles Available | Male | Female |
| No Vehicle | 10 (1.1%) | 0 (0.0%) |
| 1 Vehicle | 181 (19.7%) | 96 (11.1%) |
| 2 Vehicles | 384 (41.7%) | 498 (57.8%) |
| 3 Vehicles | 262 (28.4%) | 221 (25.6%) |
| 4 Vehicles | 70 (7.6%) | 32 (3.7%) |
| 5 or more Vehicles | 14 (1.5%) | 15 (1.7%) |
| Total | 921 (100.0%) | 862 (100.0%) |
Commute Time in Hubbard
The most frequently occuring commute durations in Hubbard are 15 to 19 minutes (453 commuters, 27.4%), 30 to 34 minutes (268 commuters, 16.2%), and 45 to 59 minutes (214 commuters, 13.0%).
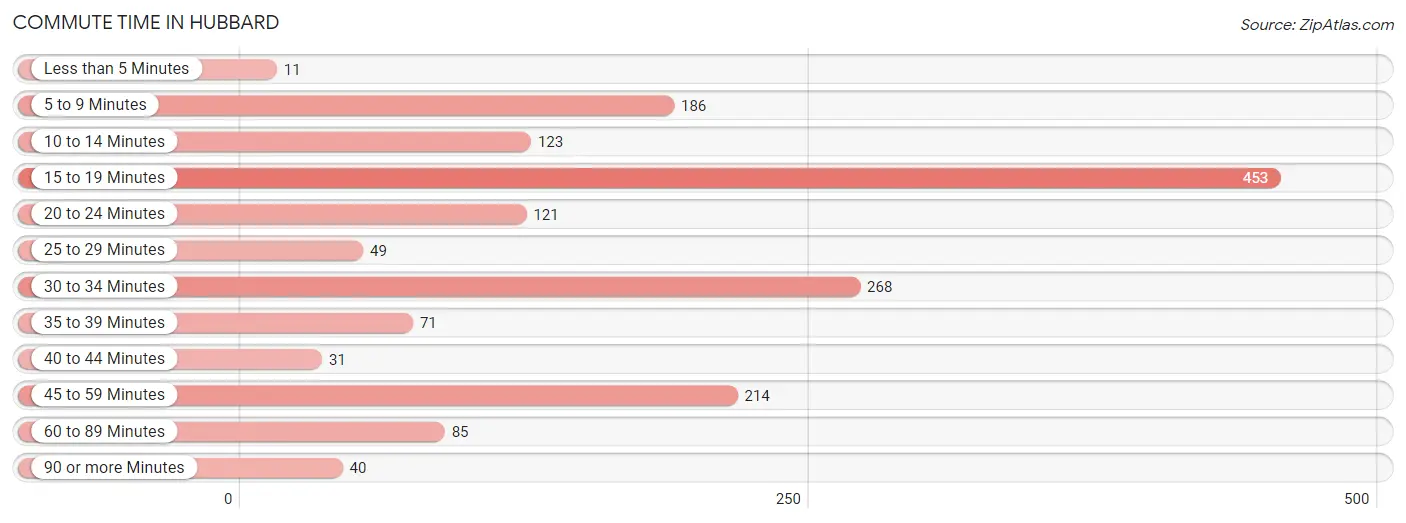
| Commute Time | # Commuters | % Commuters |
| Less than 5 Minutes | 11 | 0.7% |
| 5 to 9 Minutes | 186 | 11.3% |
| 10 to 14 Minutes | 123 | 7.4% |
| 15 to 19 Minutes | 453 | 27.4% |
| 20 to 24 Minutes | 121 | 7.3% |
| 25 to 29 Minutes | 49 | 3.0% |
| 30 to 34 Minutes | 268 | 16.2% |
| 35 to 39 Minutes | 71 | 4.3% |
| 40 to 44 Minutes | 31 | 1.9% |
| 45 to 59 Minutes | 214 | 13.0% |
| 60 to 89 Minutes | 85 | 5.1% |
| 90 or more Minutes | 40 | 2.4% |
Commute Time by Sex in Hubbard
The most common commute times in Hubbard are 15 to 19 minutes (291 commuters, 33.0%) for males and 15 to 19 minutes (162 commuters, 21.1%) for females.
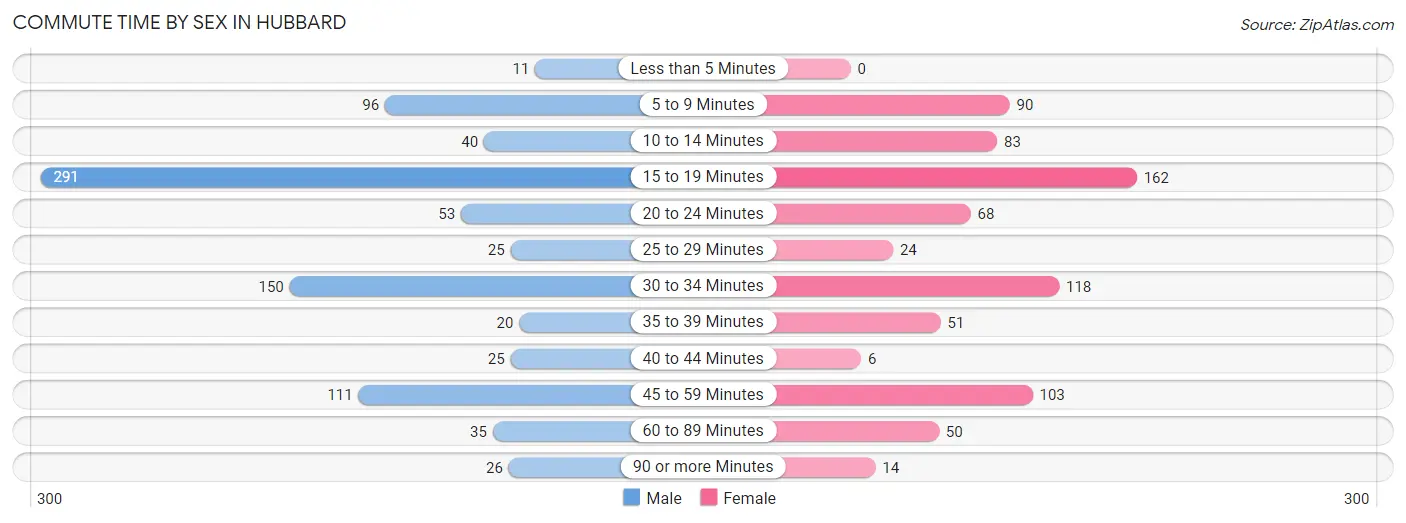
| Commute Time | Male | Female |
| Less than 5 Minutes | 11 (1.3%) | 0 (0.0%) |
| 5 to 9 Minutes | 96 (10.9%) | 90 (11.7%) |
| 10 to 14 Minutes | 40 (4.5%) | 83 (10.8%) |
| 15 to 19 Minutes | 291 (33.0%) | 162 (21.1%) |
| 20 to 24 Minutes | 53 (6.0%) | 68 (8.8%) |
| 25 to 29 Minutes | 25 (2.8%) | 24 (3.1%) |
| 30 to 34 Minutes | 150 (17.0%) | 118 (15.3%) |
| 35 to 39 Minutes | 20 (2.3%) | 51 (6.6%) |
| 40 to 44 Minutes | 25 (2.8%) | 6 (0.8%) |
| 45 to 59 Minutes | 111 (12.6%) | 103 (13.4%) |
| 60 to 89 Minutes | 35 (4.0%) | 50 (6.5%) |
| 90 or more Minutes | 26 (2.9%) | 14 (1.8%) |
Time of Departure to Work by Sex in Hubbard
The most frequent times of departure to work in Hubbard are 6:30 AM to 6:59 AM (213, 24.1%) for males and 7:30 AM to 7:59 AM (138, 17.9%) for females.
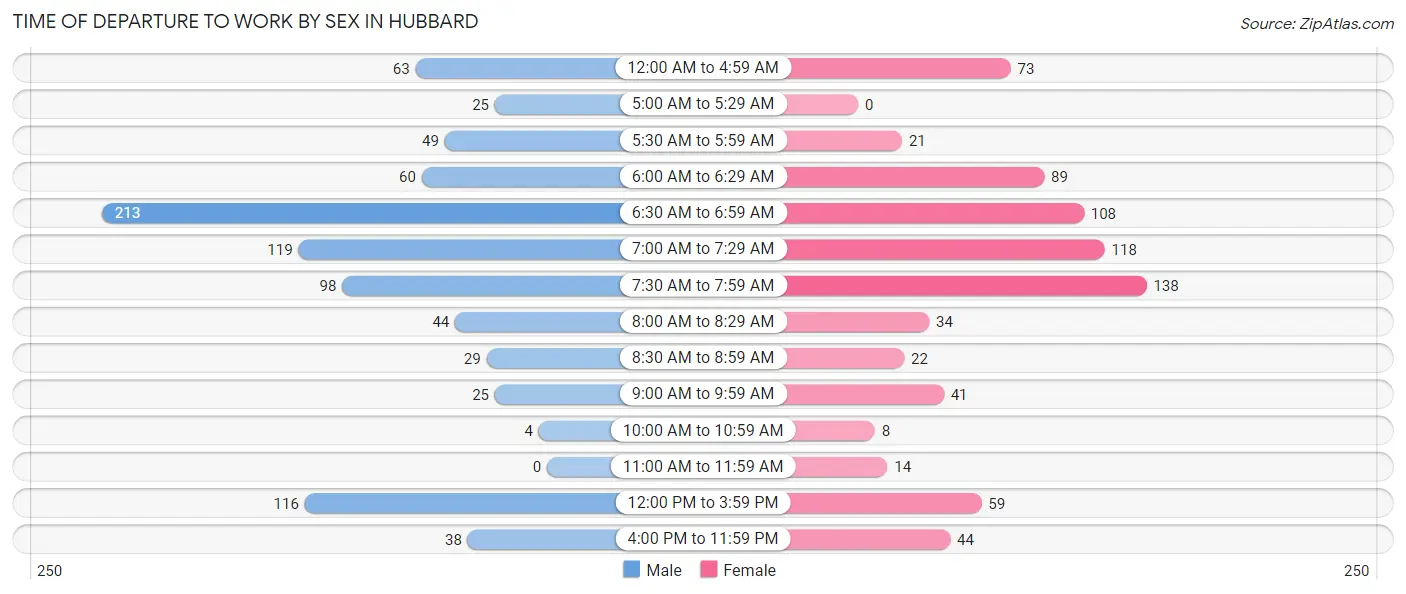
| Time of Departure | Male | Female |
| 12:00 AM to 4:59 AM | 63 (7.1%) | 73 (9.5%) |
| 5:00 AM to 5:29 AM | 25 (2.8%) | 0 (0.0%) |
| 5:30 AM to 5:59 AM | 49 (5.6%) | 21 (2.7%) |
| 6:00 AM to 6:29 AM | 60 (6.8%) | 89 (11.6%) |
| 6:30 AM to 6:59 AM | 213 (24.1%) | 108 (14.0%) |
| 7:00 AM to 7:29 AM | 119 (13.5%) | 118 (15.3%) |
| 7:30 AM to 7:59 AM | 98 (11.1%) | 138 (17.9%) |
| 8:00 AM to 8:29 AM | 44 (5.0%) | 34 (4.4%) |
| 8:30 AM to 8:59 AM | 29 (3.3%) | 22 (2.9%) |
| 9:00 AM to 9:59 AM | 25 (2.8%) | 41 (5.3%) |
| 10:00 AM to 10:59 AM | 4 (0.4%) | 8 (1.0%) |
| 11:00 AM to 11:59 AM | 0 (0.0%) | 14 (1.8%) |
| 12:00 PM to 3:59 PM | 116 (13.1%) | 59 (7.7%) |
| 4:00 PM to 11:59 PM | 38 (4.3%) | 44 (5.7%) |
| Total | 883 (100.0%) | 769 (100.0%) |
Housing Occupancy in Hubbard
Occupancy by Ownership in Hubbard
Of the total 1,142 dwellings in Hubbard, owner-occupied units account for 844 (73.9%), while renter-occupied units make up 298 (26.1%).
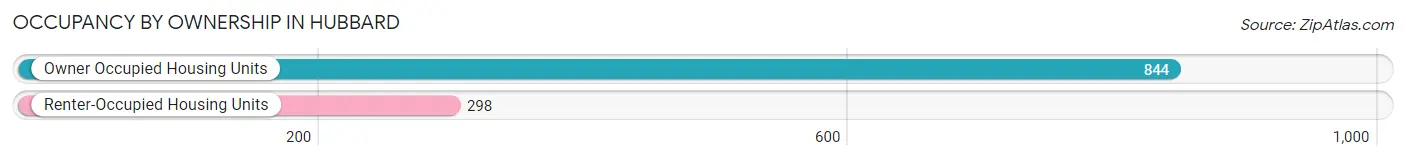
| Occupancy | # Housing Units | % Housing Units |
| Owner Occupied Housing Units | 844 | 73.9% |
| Renter-Occupied Housing Units | 298 | 26.1% |
| Total Occupied Housing Units | 1,142 | 100.0% |
Occupancy by Household Size in Hubbard
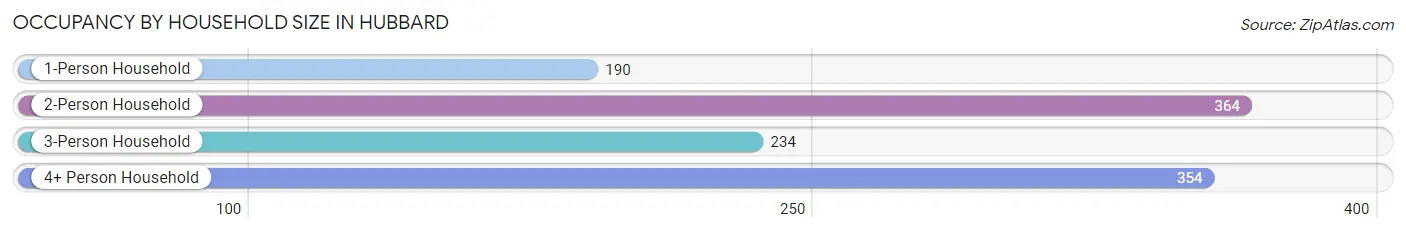
| Household Size | # Housing Units | % Housing Units |
| 1-Person Household | 190 | 16.6% |
| 2-Person Household | 364 | 31.9% |
| 3-Person Household | 234 | 20.5% |
| 4+ Person Household | 354 | 31.0% |
| Total Housing Units | 1,142 | 100.0% |
Occupancy by Ownership by Household Size in Hubbard
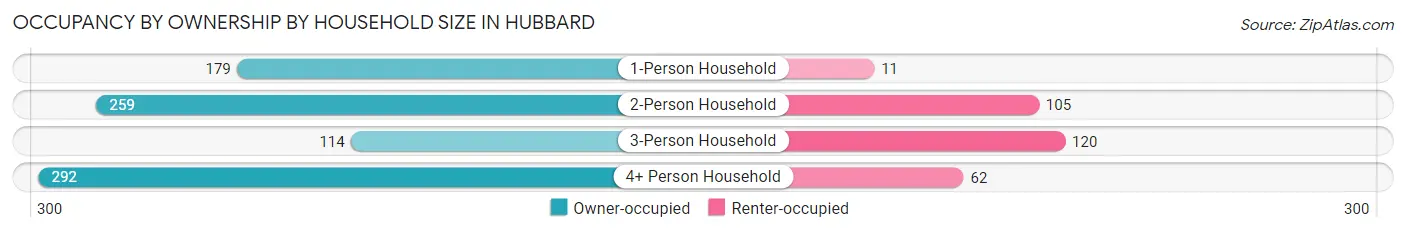
| Household Size | Owner-occupied | Renter-occupied |
| 1-Person Household | 179 (94.2%) | 11 (5.8%) |
| 2-Person Household | 259 (71.2%) | 105 (28.8%) |
| 3-Person Household | 114 (48.7%) | 120 (51.3%) |
| 4+ Person Household | 292 (82.5%) | 62 (17.5%) |
| Total Housing Units | 844 (73.9%) | 298 (26.1%) |
Occupancy by Educational Attainment in Hubbard
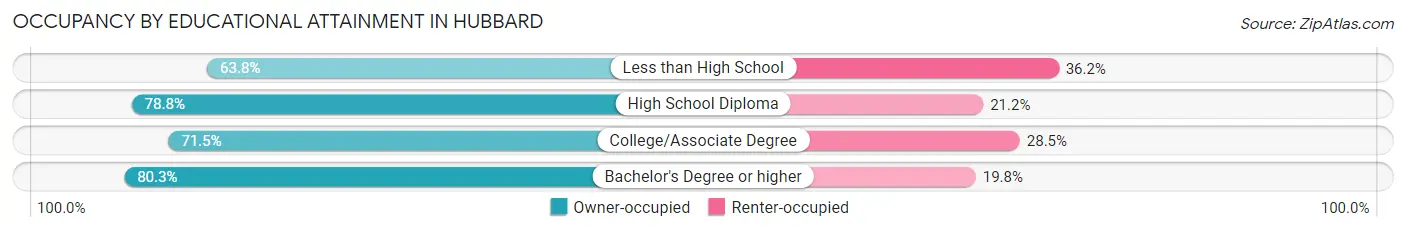
| Household Size | Owner-occupied | Renter-occupied |
| Less than High School | 134 (63.8%) | 76 (36.2%) |
| High School Diploma | 319 (78.8%) | 86 (21.2%) |
| College/Associate Degree | 261 (71.5%) | 104 (28.5%) |
| Bachelor's Degree or higher | 130 (80.2%) | 32 (19.8%) |
Occupancy by Age of Householder in Hubbard
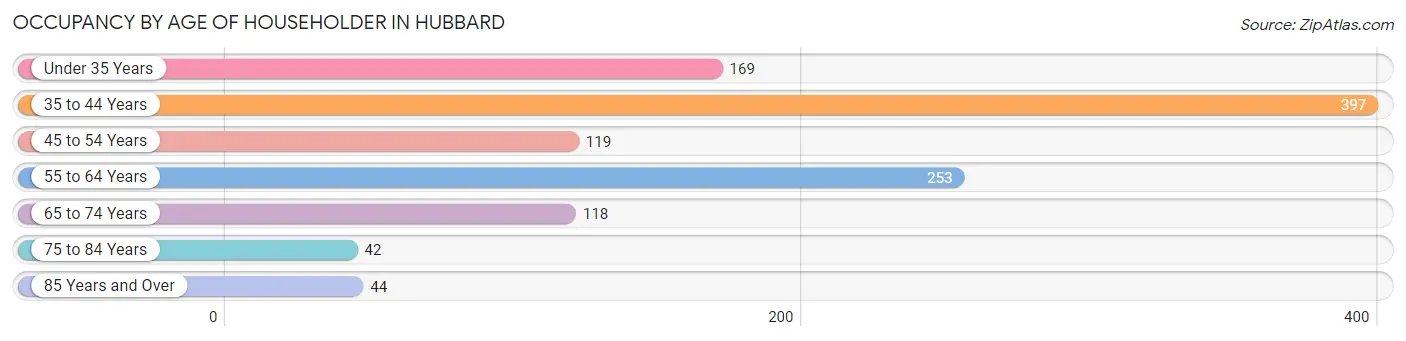
| Age Bracket | # Households | % Households |
| Under 35 Years | 169 | 14.8% |
| 35 to 44 Years | 397 | 34.8% |
| 45 to 54 Years | 119 | 10.4% |
| 55 to 64 Years | 253 | 22.2% |
| 65 to 74 Years | 118 | 10.3% |
| 75 to 84 Years | 42 | 3.7% |
| 85 Years and Over | 44 | 3.8% |
| Total | 1,142 | 100.0% |
Housing Finances in Hubbard
Median Income by Occupancy in Hubbard
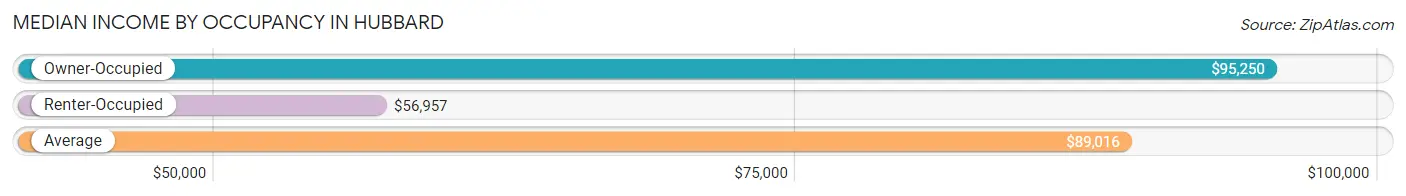
| Occupancy Type | # Households | Median Income |
| Owner-Occupied | 844 (73.9%) | $95,250 |
| Renter-Occupied | 298 (26.1%) | $56,957 |
| Average | 1,142 (100.0%) | $89,016 |
Occupancy by Householder Income Bracket in Hubbard
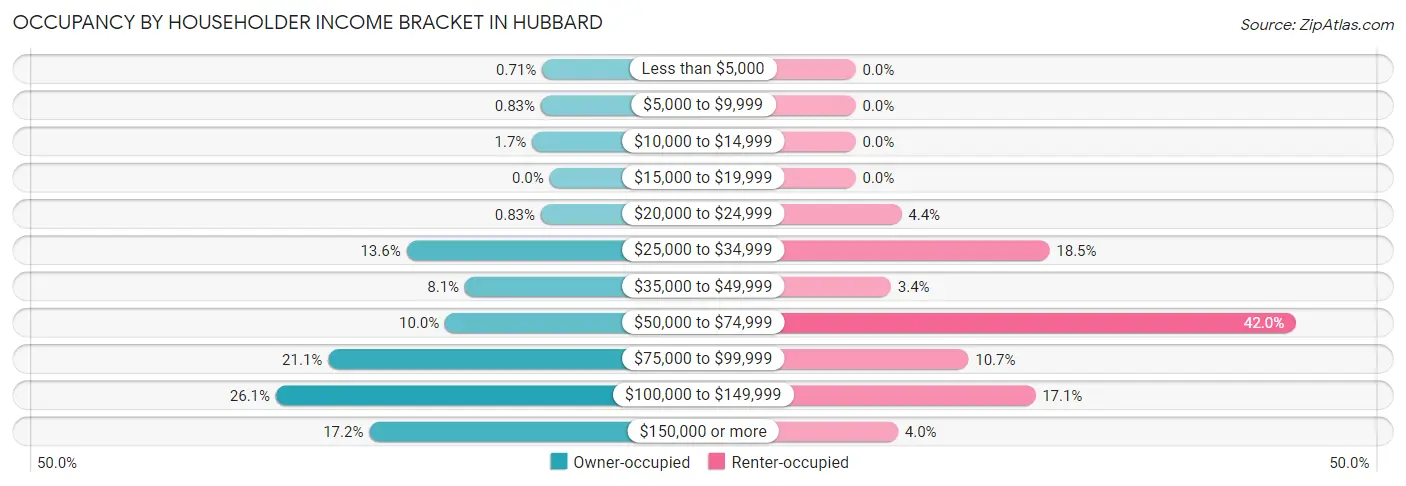
| Income Bracket | Owner-occupied | Renter-occupied |
| Less than $5,000 | 6 (0.7%) | 0 (0.0%) |
| $5,000 to $9,999 | 7 (0.8%) | 0 (0.0%) |
| $10,000 to $14,999 | 14 (1.7%) | 0 (0.0%) |
| $15,000 to $19,999 | 0 (0.0%) | 0 (0.0%) |
| $20,000 to $24,999 | 7 (0.8%) | 13 (4.4%) |
| $25,000 to $34,999 | 115 (13.6%) | 55 (18.5%) |
| $35,000 to $49,999 | 68 (8.1%) | 10 (3.4%) |
| $50,000 to $74,999 | 84 (10.0%) | 125 (41.9%) |
| $75,000 to $99,999 | 178 (21.1%) | 32 (10.7%) |
| $100,000 to $149,999 | 220 (26.1%) | 51 (17.1%) |
| $150,000 or more | 145 (17.2%) | 12 (4.0%) |
| Total | 844 (100.0%) | 298 (100.0%) |
Monthly Housing Cost Tiers in Hubbard
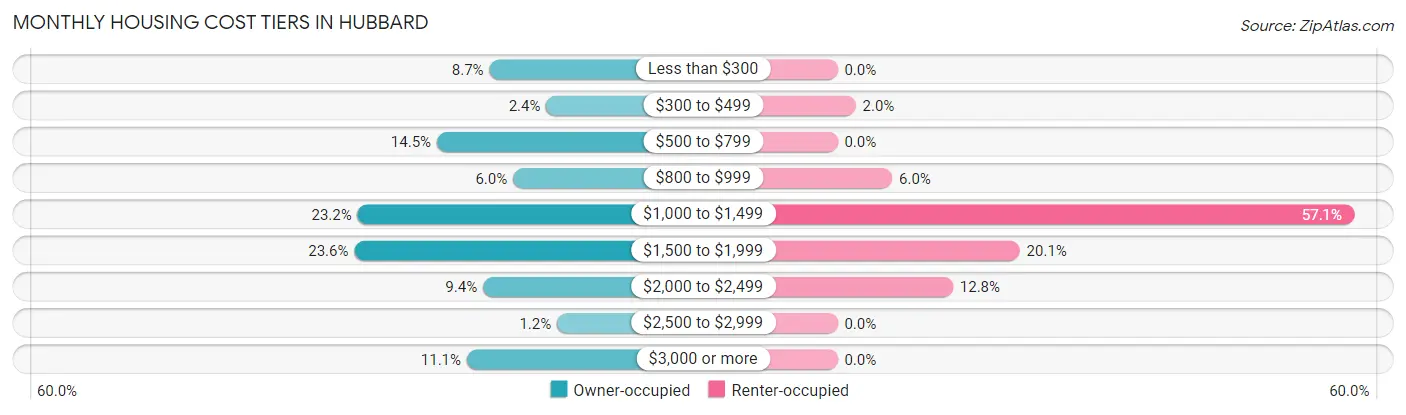
| Monthly Cost | Owner-occupied | Renter-occupied |
| Less than $300 | 73 (8.6%) | 0 (0.0%) |
| $300 to $499 | 20 (2.4%) | 6 (2.0%) |
| $500 to $799 | 122 (14.4%) | 0 (0.0%) |
| $800 to $999 | 51 (6.0%) | 18 (6.0%) |
| $1,000 to $1,499 | 196 (23.2%) | 170 (57.1%) |
| $1,500 to $1,999 | 199 (23.6%) | 60 (20.1%) |
| $2,000 to $2,499 | 79 (9.4%) | 38 (12.8%) |
| $2,500 to $2,999 | 10 (1.2%) | 0 (0.0%) |
| $3,000 or more | 94 (11.1%) | 0 (0.0%) |
| Total | 844 (100.0%) | 298 (100.0%) |
Physical Housing Characteristics in Hubbard
Housing Structures in Hubbard
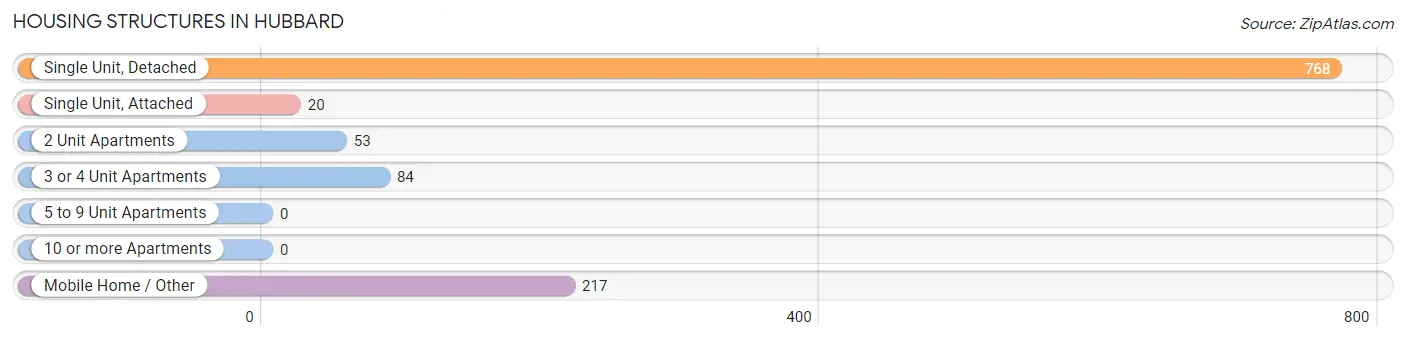
| Structure Type | # Housing Units | % Housing Units |
| Single Unit, Detached | 768 | 67.2% |
| Single Unit, Attached | 20 | 1.8% |
| 2 Unit Apartments | 53 | 4.6% |
| 3 or 4 Unit Apartments | 84 | 7.4% |
| 5 to 9 Unit Apartments | 0 | 0.0% |
| 10 or more Apartments | 0 | 0.0% |
| Mobile Home / Other | 217 | 19.0% |
| Total | 1,142 | 100.0% |
Housing Structures by Occupancy in Hubbard
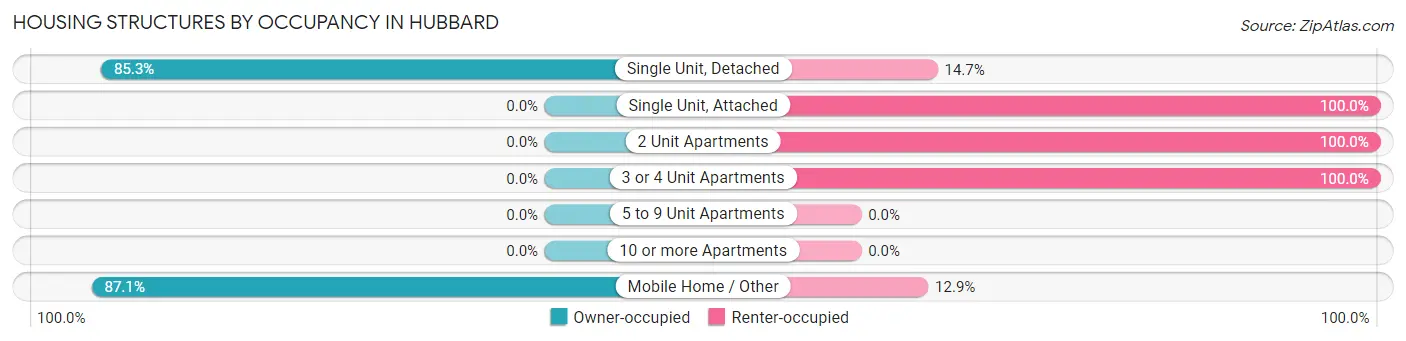
| Structure Type | Owner-occupied | Renter-occupied |
| Single Unit, Detached | 655 (85.3%) | 113 (14.7%) |
| Single Unit, Attached | 0 (0.0%) | 20 (100.0%) |
| 2 Unit Apartments | 0 (0.0%) | 53 (100.0%) |
| 3 or 4 Unit Apartments | 0 (0.0%) | 84 (100.0%) |
| 5 to 9 Unit Apartments | 0 (0.0%) | 0 (0.0%) |
| 10 or more Apartments | 0 (0.0%) | 0 (0.0%) |
| Mobile Home / Other | 189 (87.1%) | 28 (12.9%) |
| Total | 844 (73.9%) | 298 (26.1%) |
Housing Structures by Number of Rooms in Hubbard
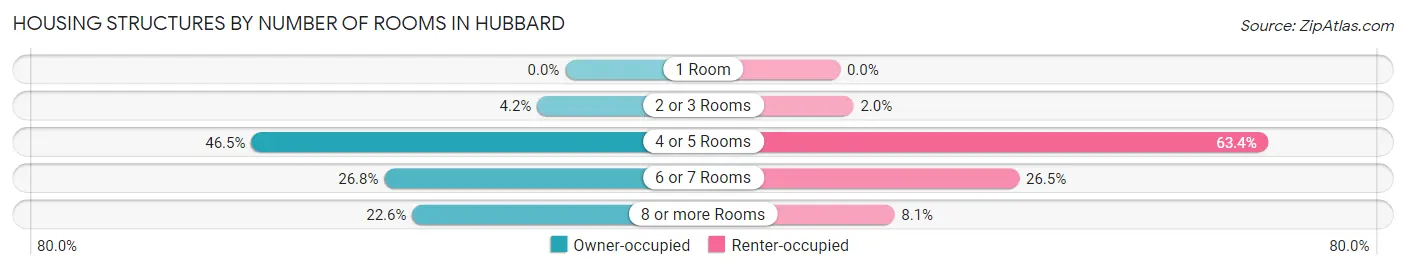
| Number of Rooms | Owner-occupied | Renter-occupied |
| 1 Room | 0 (0.0%) | 0 (0.0%) |
| 2 or 3 Rooms | 35 (4.2%) | 6 (2.0%) |
| 4 or 5 Rooms | 392 (46.5%) | 189 (63.4%) |
| 6 or 7 Rooms | 226 (26.8%) | 79 (26.5%) |
| 8 or more Rooms | 191 (22.6%) | 24 (8.1%) |
| Total | 844 (100.0%) | 298 (100.0%) |
Housing Structure by Heating Type in Hubbard
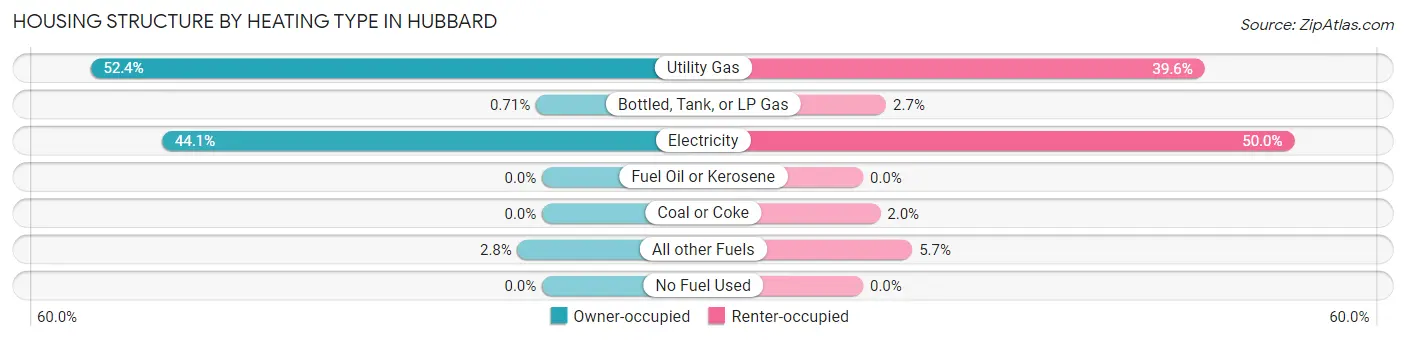
| Heating Type | Owner-occupied | Renter-occupied |
| Utility Gas | 442 (52.4%) | 118 (39.6%) |
| Bottled, Tank, or LP Gas | 6 (0.7%) | 8 (2.7%) |
| Electricity | 372 (44.1%) | 149 (50.0%) |
| Fuel Oil or Kerosene | 0 (0.0%) | 0 (0.0%) |
| Coal or Coke | 0 (0.0%) | 6 (2.0%) |
| All other Fuels | 24 (2.8%) | 17 (5.7%) |
| No Fuel Used | 0 (0.0%) | 0 (0.0%) |
| Total | 844 (100.0%) | 298 (100.0%) |
Household Vehicle Usage in Hubbard
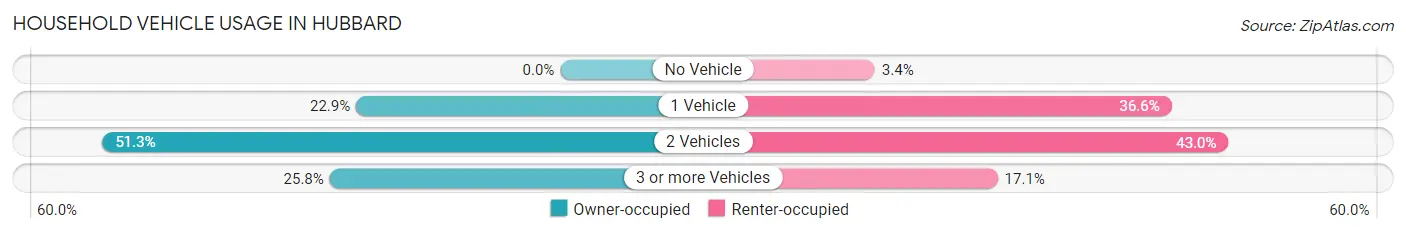
| Vehicles per Household | Owner-occupied | Renter-occupied |
| No Vehicle | 0 (0.0%) | 10 (3.4%) |
| 1 Vehicle | 193 (22.9%) | 109 (36.6%) |
| 2 Vehicles | 433 (51.3%) | 128 (42.9%) |
| 3 or more Vehicles | 218 (25.8%) | 51 (17.1%) |
| Total | 844 (100.0%) | 298 (100.0%) |
Real Estate & Mortgages in Hubbard
Real Estate and Mortgage Overview in Hubbard
| Characteristic | Without Mortgage | With Mortgage |
| Housing Units | 297 | 547 |
| Median Property Value | - | - |
| Median Household Income | $50,486 | $106 |
| Monthly Housing Costs | $709 | $94 |
| Real Estate Taxes | - | - |
Property Value by Mortgage Status in Hubbard
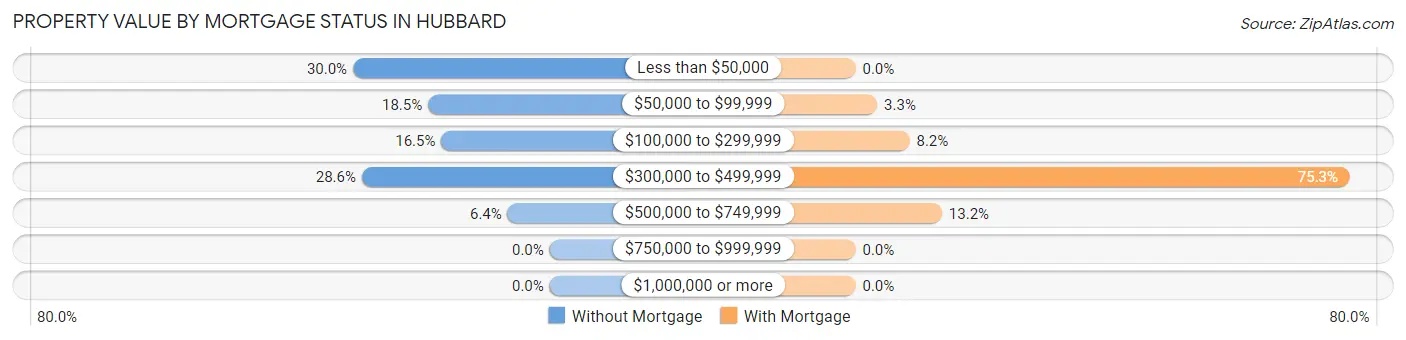
| Property Value | Without Mortgage | With Mortgage |
| Less than $50,000 | 89 (30.0%) | 0 (0.0%) |
| $50,000 to $99,999 | 55 (18.5%) | 18 (3.3%) |
| $100,000 to $299,999 | 49 (16.5%) | 45 (8.2%) |
| $300,000 to $499,999 | 85 (28.6%) | 412 (75.3%) |
| $500,000 to $749,999 | 19 (6.4%) | 72 (13.2%) |
| $750,000 to $999,999 | 0 (0.0%) | 0 (0.0%) |
| $1,000,000 or more | 0 (0.0%) | 0 (0.0%) |
| Total | 297 (100.0%) | 547 (100.0%) |
Household Income by Mortgage Status in Hubbard
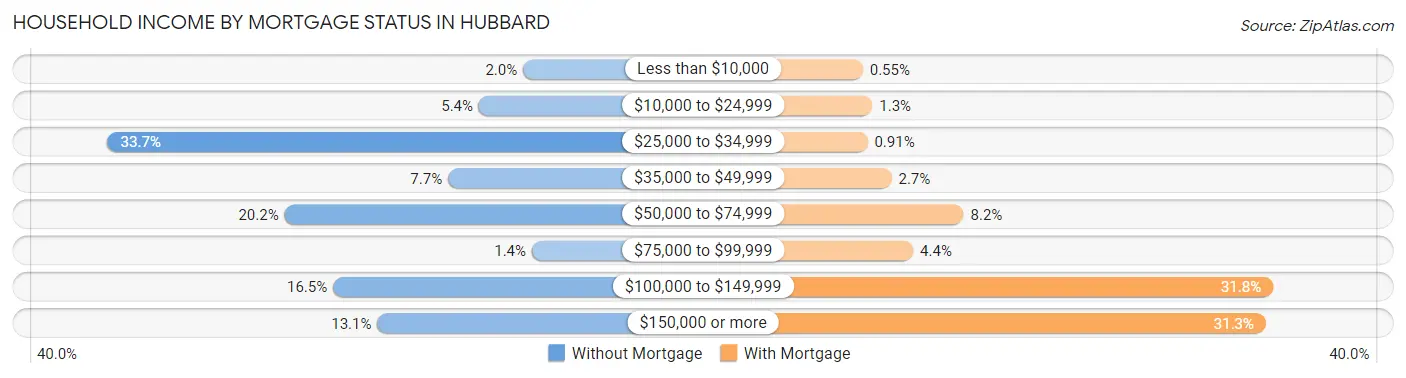
| Household Income | Without Mortgage | With Mortgage |
| Less than $10,000 | 6 (2.0%) | 3 (0.5%) |
| $10,000 to $24,999 | 16 (5.4%) | 7 (1.3%) |
| $25,000 to $34,999 | 100 (33.7%) | 5 (0.9%) |
| $35,000 to $49,999 | 23 (7.7%) | 15 (2.7%) |
| $50,000 to $74,999 | 60 (20.2%) | 45 (8.2%) |
| $75,000 to $99,999 | 4 (1.3%) | 24 (4.4%) |
| $100,000 to $149,999 | 49 (16.5%) | 174 (31.8%) |
| $150,000 or more | 39 (13.1%) | 171 (31.3%) |
| Total | 297 (100.0%) | 547 (100.0%) |
Property Value to Household Income Ratio in Hubbard
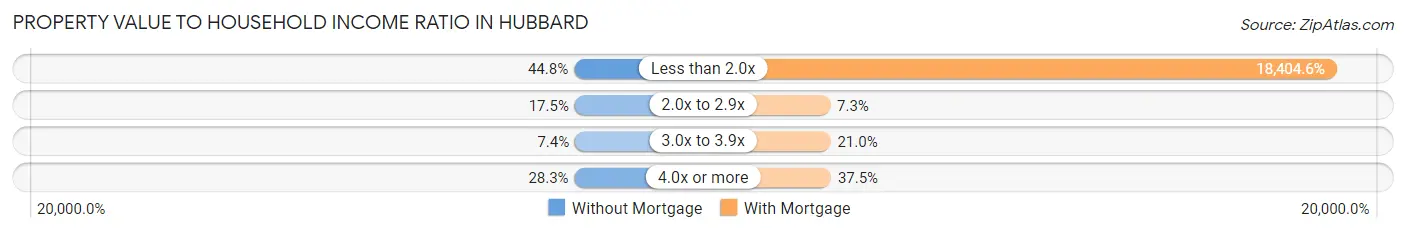
| Value-to-Income Ratio | Without Mortgage | With Mortgage |
| Less than 2.0x | 133 (44.8%) | 100,673 (18,404.6%) |
| 2.0x to 2.9x | 52 (17.5%) | 40 (7.3%) |
| 3.0x to 3.9x | 22 (7.4%) | 115 (21.0%) |
| 4.0x or more | 84 (28.3%) | 205 (37.5%) |
| Total | 297 (100.0%) | 547 (100.0%) |
Real Estate Taxes by Mortgage Status in Hubbard
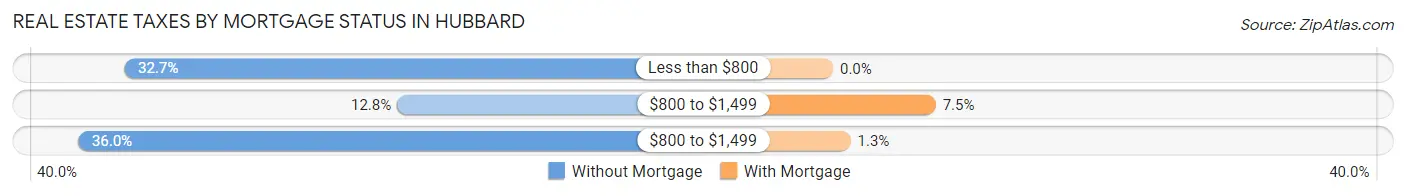
| Property Taxes | Without Mortgage | With Mortgage |
| Less than $800 | 97 (32.7%) | 0 (0.0%) |
| $800 to $1,499 | 38 (12.8%) | 41 (7.5%) |
| $800 to $1,499 | 107 (36.0%) | 7 (1.3%) |
| Total | 297 (100.0%) | 547 (100.0%) |
Health & Disability in Hubbard
Health Insurance Coverage by Age in Hubbard
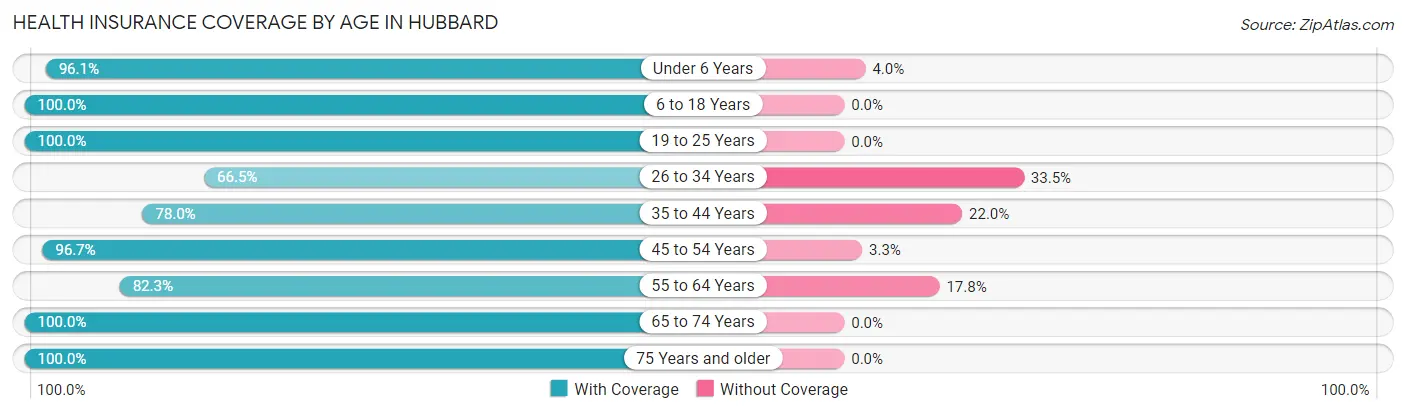
| Age Bracket | With Coverage | Without Coverage |
| Under 6 Years | 316 (96.1%) | 13 (4.0%) |
| 6 to 18 Years | 673 (100.0%) | 0 (0.0%) |
| 19 to 25 Years | 185 (100.0%) | 0 (0.0%) |
| 26 to 34 Years | 284 (66.5%) | 143 (33.5%) |
| 35 to 44 Years | 483 (78.0%) | 136 (22.0%) |
| 45 to 54 Years | 349 (96.7%) | 12 (3.3%) |
| 55 to 64 Years | 417 (82.3%) | 90 (17.7%) |
| 65 to 74 Years | 199 (100.0%) | 0 (0.0%) |
| 75 Years and older | 127 (100.0%) | 0 (0.0%) |
| Total | 3,033 (88.5%) | 394 (11.5%) |
Health Insurance Coverage by Citizenship Status in Hubbard
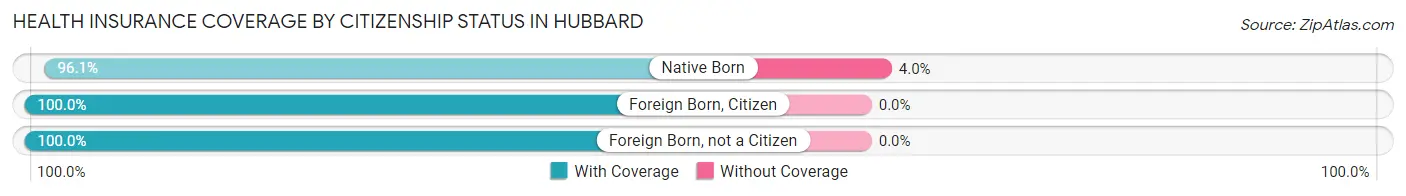
| Citizenship Status | With Coverage | Without Coverage |
| Native Born | 316 (96.1%) | 13 (4.0%) |
| Foreign Born, Citizen | 673 (100.0%) | 0 (0.0%) |
| Foreign Born, not a Citizen | 185 (100.0%) | 0 (0.0%) |
Health Insurance Coverage by Household Income in Hubbard
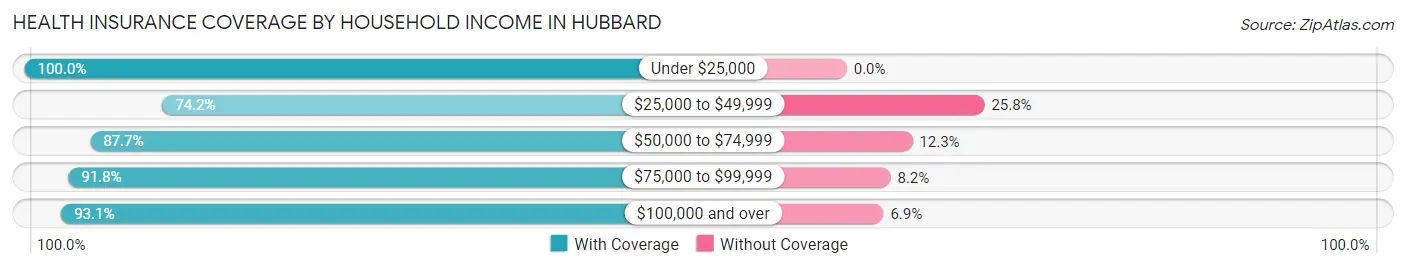
| Household Income | With Coverage | Without Coverage |
| Under $25,000 | 56 (100.0%) | 0 (0.0%) |
| $25,000 to $49,999 | 469 (74.2%) | 163 (25.8%) |
| $50,000 to $74,999 | 556 (87.7%) | 78 (12.3%) |
| $75,000 to $99,999 | 583 (91.8%) | 52 (8.2%) |
| $100,000 and over | 1,369 (93.1%) | 101 (6.9%) |
Public vs Private Health Insurance Coverage by Age in Hubbard
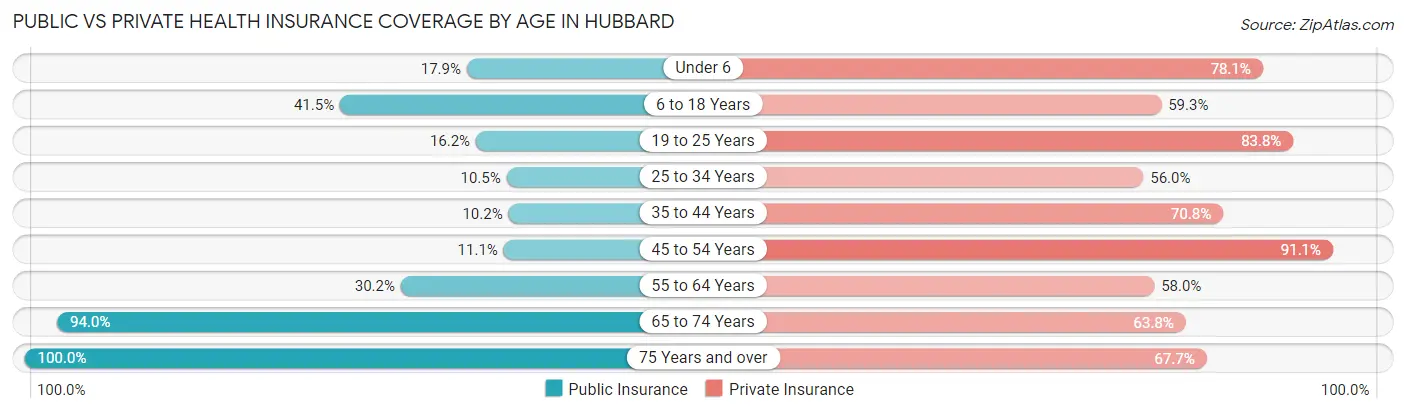
| Age Bracket | Public Insurance | Private Insurance |
| Under 6 | 59 (17.9%) | 257 (78.1%) |
| 6 to 18 Years | 279 (41.5%) | 399 (59.3%) |
| 19 to 25 Years | 30 (16.2%) | 155 (83.8%) |
| 25 to 34 Years | 45 (10.5%) | 239 (56.0%) |
| 35 to 44 Years | 63 (10.2%) | 438 (70.8%) |
| 45 to 54 Years | 40 (11.1%) | 329 (91.1%) |
| 55 to 64 Years | 153 (30.2%) | 294 (58.0%) |
| 65 to 74 Years | 187 (94.0%) | 127 (63.8%) |
| 75 Years and over | 127 (100.0%) | 86 (67.7%) |
| Total | 983 (28.7%) | 2,324 (67.8%) |
Disability Status by Sex by Age in Hubbard
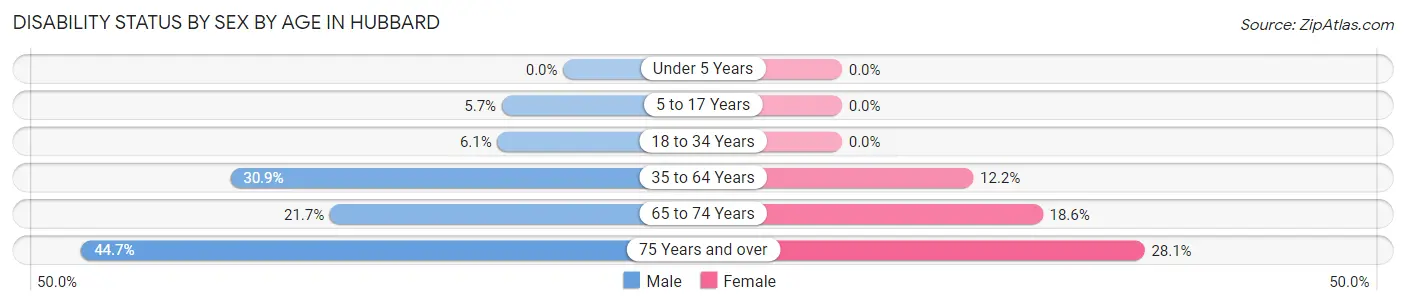
| Age Bracket | Male | Female |
| Under 5 Years | 0 (0.0%) | 0 (0.0%) |
| 5 to 17 Years | 22 (5.7%) | 0 (0.0%) |
| 18 to 34 Years | 19 (6.1%) | 0 (0.0%) |
| 35 to 64 Years | 234 (30.9%) | 89 (12.2%) |
| 65 to 74 Years | 21 (21.6%) | 19 (18.6%) |
| 75 Years and over | 17 (44.7%) | 25 (28.1%) |
Disability Class by Sex by Age in Hubbard
Disability Class: Hearing Difficulty
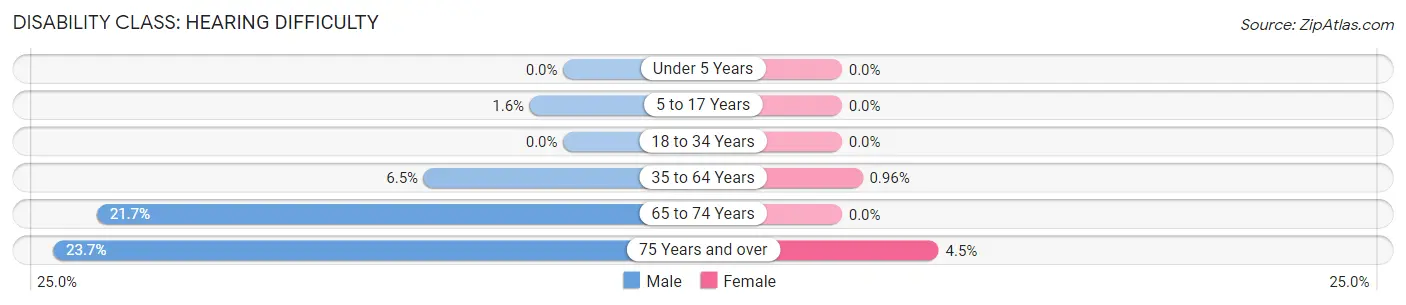
| Age Bracket | Male | Female |
| Under 5 Years | 0 (0.0%) | 0 (0.0%) |
| 5 to 17 Years | 6 (1.5%) | 0 (0.0%) |
| 18 to 34 Years | 0 (0.0%) | 0 (0.0%) |
| 35 to 64 Years | 49 (6.5%) | 7 (1.0%) |
| 65 to 74 Years | 21 (21.6%) | 0 (0.0%) |
| 75 Years and over | 9 (23.7%) | 4 (4.5%) |
Disability Class: Vision Difficulty
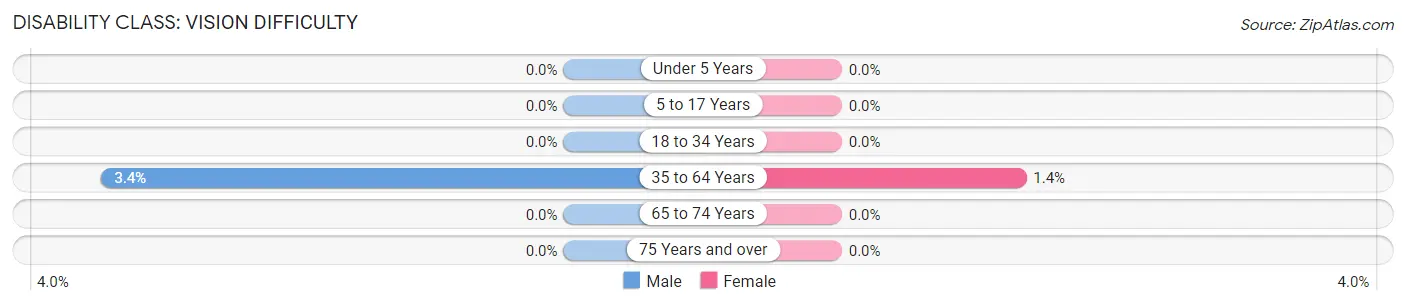
| Age Bracket | Male | Female |
| Under 5 Years | 0 (0.0%) | 0 (0.0%) |
| 5 to 17 Years | 0 (0.0%) | 0 (0.0%) |
| 18 to 34 Years | 0 (0.0%) | 0 (0.0%) |
| 35 to 64 Years | 26 (3.4%) | 10 (1.4%) |
| 65 to 74 Years | 0 (0.0%) | 0 (0.0%) |
| 75 Years and over | 0 (0.0%) | 0 (0.0%) |
Disability Class: Cognitive Difficulty
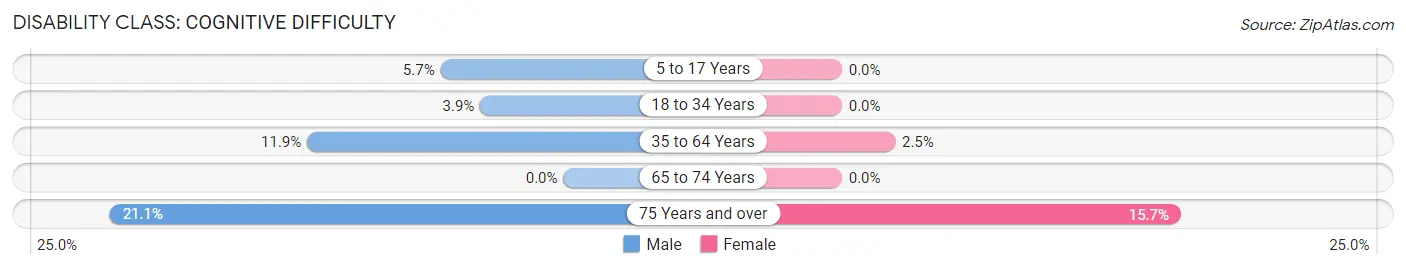
| Age Bracket | Male | Female |
| 5 to 17 Years | 22 (5.7%) | 0 (0.0%) |
| 18 to 34 Years | 12 (3.9%) | 0 (0.0%) |
| 35 to 64 Years | 90 (11.9%) | 18 (2.5%) |
| 65 to 74 Years | 0 (0.0%) | 0 (0.0%) |
| 75 Years and over | 8 (21.0%) | 14 (15.7%) |
Disability Class: Ambulatory Difficulty
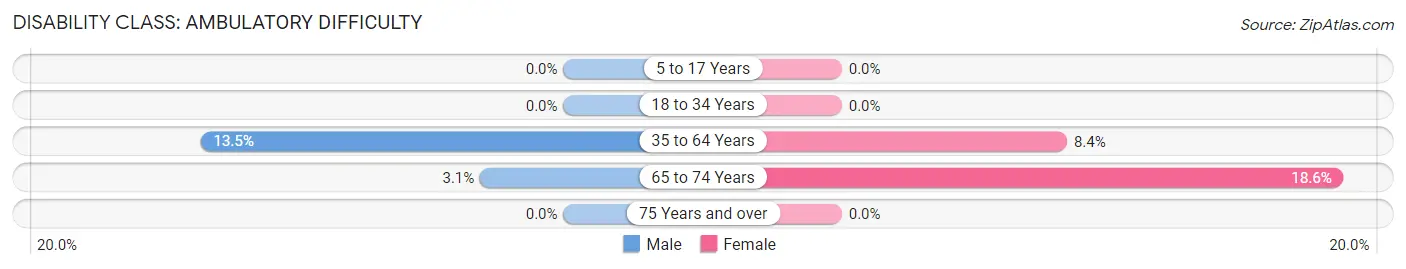
| Age Bracket | Male | Female |
| 5 to 17 Years | 0 (0.0%) | 0 (0.0%) |
| 18 to 34 Years | 0 (0.0%) | 0 (0.0%) |
| 35 to 64 Years | 102 (13.5%) | 61 (8.4%) |
| 65 to 74 Years | 3 (3.1%) | 19 (18.6%) |
| 75 Years and over | 0 (0.0%) | 0 (0.0%) |
Disability Class: Self-Care Difficulty
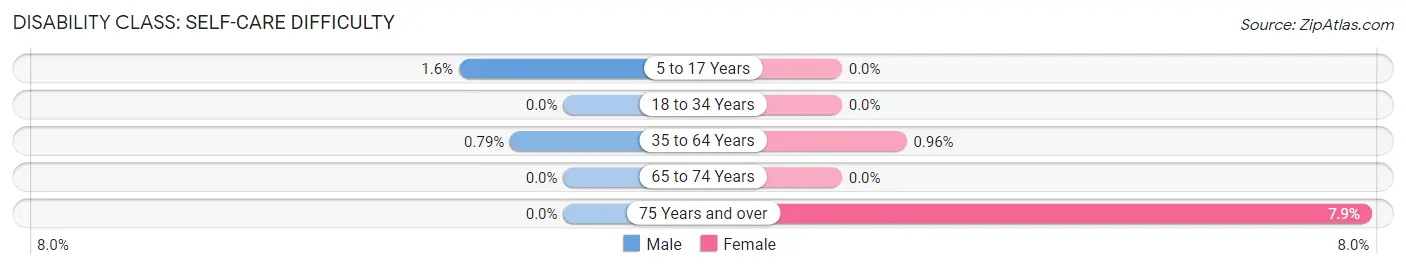
| Age Bracket | Male | Female |
| 5 to 17 Years | 6 (1.5%) | 0 (0.0%) |
| 18 to 34 Years | 0 (0.0%) | 0 (0.0%) |
| 35 to 64 Years | 6 (0.8%) | 7 (1.0%) |
| 65 to 74 Years | 0 (0.0%) | 0 (0.0%) |
| 75 Years and over | 0 (0.0%) | 7 (7.9%) |
Technology Access in Hubbard
Computing Device Access in Hubbard
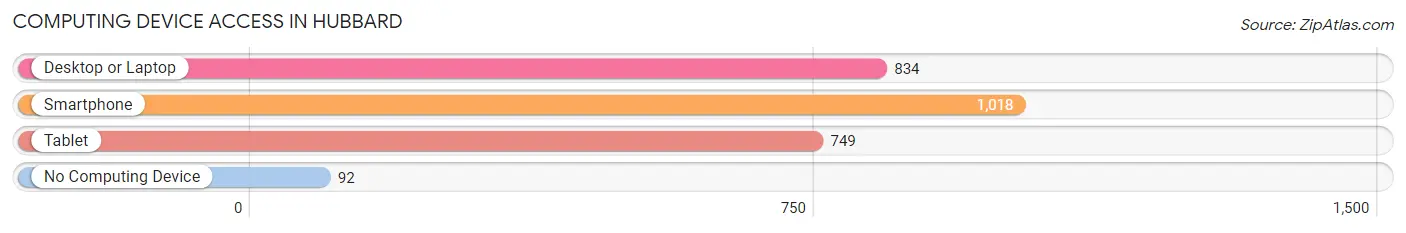
| Device Type | # Households | % Households |
| Desktop or Laptop | 834 | 73.0% |
| Smartphone | 1,018 | 89.1% |
| Tablet | 749 | 65.6% |
| No Computing Device | 92 | 8.1% |
| Total | 1,142 | 100.0% |
Internet Access in Hubbard
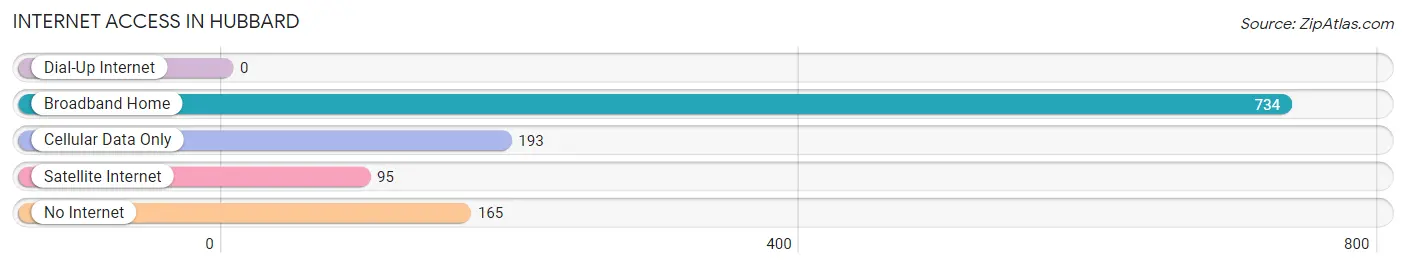
| Internet Type | # Households | % Households |
| Dial-Up Internet | 0 | 0.0% |
| Broadband Home | 734 | 64.3% |
| Cellular Data Only | 193 | 16.9% |
| Satellite Internet | 95 | 8.3% |
| No Internet | 165 | 14.4% |
| Total | 1,142 | 100.0% |
Hubbard Summary
Hubbard, Oregon is a small city located in Marion County, Oregon, United States. It is situated in the Willamette Valley, approximately 25 miles south of Portland. The city was founded in 1881 and incorporated in 1903. As of the 2010 census, the population of Hubbard was 2,927.
History
The area that is now Hubbard was originally inhabited by the Kalapuya Native American tribe. The first white settlers arrived in the area in the early 1840s. The first post office in the area was established in 1851 and was named Hubbard’s Post Office. The city was named after the postmaster, William Hubbard.
In 1881, the Oregon and California Railroad arrived in the area and the city of Hubbard was officially founded. The railroad brought with it a population boom and the city quickly grew. In 1903, the city was officially incorporated.
In the early 1900s, the city was a major hub for the timber industry. The city was home to several sawmills and lumber yards. The timber industry was the main source of employment for the city’s residents.
In the 1950s, the timber industry began to decline and the city’s economy shifted to agriculture. The city is now home to several farms and agricultural businesses.
Geography
Hubbard is located in the Willamette Valley, approximately 25 miles south of Portland. The city is situated on the banks of the Pudding River. The city has a total area of 1.3 square miles, all of which is land.
The city has a humid continental climate, with warm summers and cold winters. The average annual temperature is 52 degrees Fahrenheit. The average annual precipitation is 43 inches.
Economy
The economy of Hubbard is largely based on agriculture. The city is home to several farms and agricultural businesses. The city is also home to several manufacturing businesses, including a wood products plant and a metal fabrication plant.
The city is also home to several retail businesses, including a grocery store, a hardware store, and several restaurants.
Demographics
As of the 2010 census, the population of Hubbard was 2,927. The racial makeup of the city was 92.3% White, 0.7% African American, 0.7% Native American, 0.7% Asian, 0.2% Pacific Islander, and 4.2% from other races. Hispanic or Latino of any race were 5.2% of the population.
The median household income in Hubbard was $45,938, and the median family income was $51,938. The per capita income in Hubbard was $20,938. About 11.2% of the population was below the poverty line.
Conclusion
Hubbard, Oregon is a small city located in Marion County, Oregon, United States. It is situated in the Willamette Valley, approximately 25 miles south of Portland. The city was founded in 1881 and incorporated in 1903. As of the 2010 census, the population of Hubbard was 2,927. The economy of Hubbard is largely based on agriculture, with several farms and agricultural businesses located in the city. The racial makeup of the city was 92.3% White, 0.7% African American, 0.7% Native American, 0.7% Asian, 0.2% Pacific Islander, and 4.2% from other races. The median household income in Hubbard was $45,938, and the median family income was $51,938. The per capita income in Hubbard was $20,938. About 11.2% of the population was below the poverty line.
Common Questions
What is Per Capita Income in Hubbard?
Per Capita income in Hubbard is $31,747.
What is the Median Family Income in Hubbard?
Median Family Income in Hubbard is $83,500.
What is the Median Household income in Hubbard?
Median Household Income in Hubbard is $89,016.
What is Income or Wage Gap in Hubbard?
Income or Wage Gap in Hubbard is 2.8%.
Women in Hubbard earn 97.2 cents for every dollar earned by a man.
What is Inequality or Gini Index in Hubbard?
Inequality or Gini Index in Hubbard is 0.34.
What is the Total Population of Hubbard?
Total Population of Hubbard is 3,427.
What is the Total Male Population of Hubbard?
Total Male Population of Hubbard is 1,745.
What is the Total Female Population of Hubbard?
Total Female Population of Hubbard is 1,682.
What is the Ratio of Males per 100 Females in Hubbard?
There are 103.75 Males per 100 Females in Hubbard.
What is the Ratio of Females per 100 Males in Hubbard?
There are 96.39 Females per 100 Males in Hubbard.
What is the Median Population Age in Hubbard?
Median Population Age in Hubbard is 38.2 Years.
What is the Average Family Size in Hubbard
Average Family Size in Hubbard is 3.2 People.
What is the Average Household Size in Hubbard
Average Household Size in Hubbard is 3.0 People.
How Large is the Labor Force in Hubbard?
There are 1,925 People in the Labor Forcein in Hubbard.
What is the Percentage of People in the Labor Force in Hubbard?
74.4% of People are in the Labor Force in Hubbard.
What is the Unemployment Rate in Hubbard?
Unemployment Rate in Hubbard is 2.5%.