Basehor, KS Map & Demographics
Basehor Map
Basehor Overview
$43,144
PER CAPITA INCOME
$110,875
AVG FAMILY INCOME
$100,608
AVG HOUSEHOLD INCOME
42.6%
WAGE / INCOME GAP [ % ]
57.4¢/ $1
WAGE / INCOME GAP [ $ ]
0.39
INEQUALITY / GINI INDEX
7,004
TOTAL POPULATION
3,646
MALE POPULATION
3,358
FEMALE POPULATION
108.58
MALES / 100 FEMALES
92.10
FEMALES / 100 MALES
39.6
MEDIAN AGE
3.2
AVG FAMILY SIZE
2.7
AVG HOUSEHOLD SIZE
3,460
LABOR FORCE [ PEOPLE ]
63.8%
PERCENT IN LABOR FORCE
9.9%
UNEMPLOYMENT RATE
Basehor Zip Codes
Basehor Area Codes
Income in Basehor
Income Overview in Basehor
Per Capita Income in Basehor is $43,144, while median incomes of families and households are $110,875 and $100,608 respectively.
| Characteristic | Number | Measure |
| Per Capita Income | 7,004 | $43,144 |
| Median Family Income | 1,865 | $110,875 |
| Mean Family Income | 1,865 | $126,819 |
| Median Household Income | 2,621 | $100,608 |
| Mean Household Income | 2,621 | $109,803 |
| Income Deficit | 1,865 | $0 |
| Wage / Income Gap (%) | 7,004 | 42.60% |
| Wage / Income Gap ($) | 7,004 | 57.40¢ per $1 |
| Gini / Inequality Index | 7,004 | 0.39 |
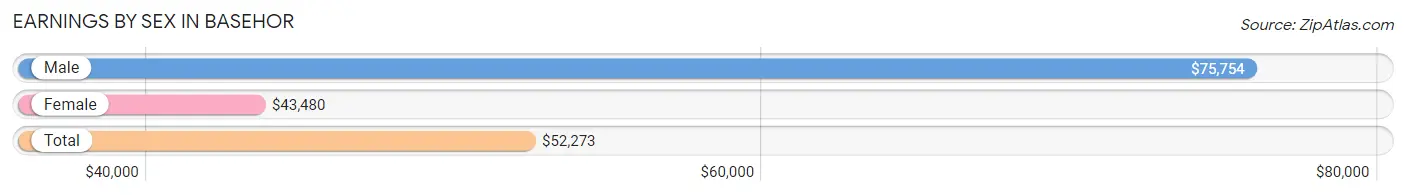
Earnings by Sex in Basehor
Average Earnings in Basehor are $52,273, $75,754 for men and $43,480 for women, a difference of 42.6%.
| Sex | Number | Average Earnings |
| Male | 1,765 (53.5%) | $75,754 |
| Female | 1,531 (46.5%) | $43,480 |
| Total | 3,296 (100.0%) | $52,273 |
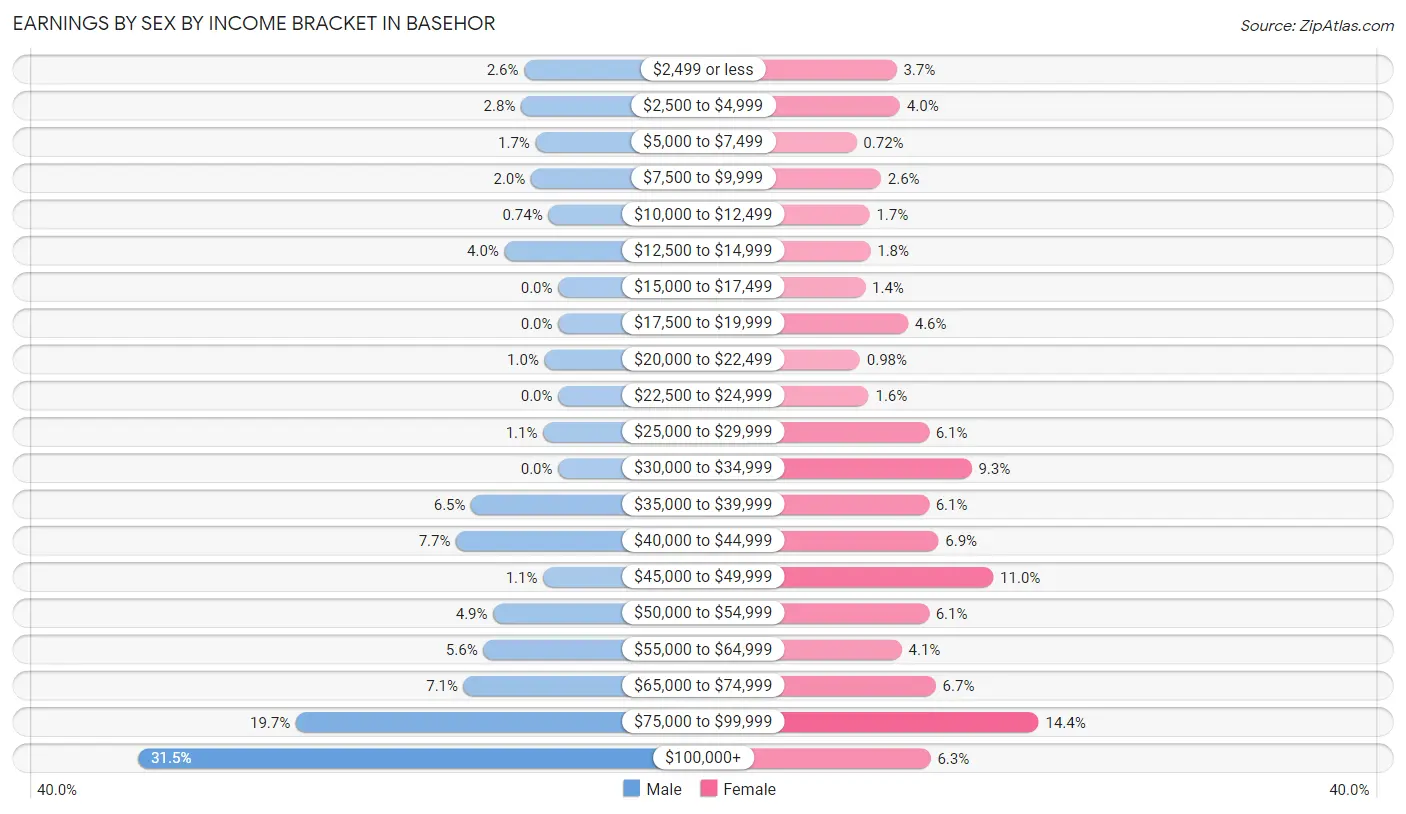
Earnings by Sex by Income Bracket in Basehor
The most common earnings brackets in Basehor are $100,000+ for men (556 | 31.5%) and $75,000 to $99,999 for women (220 | 14.4%).
| Income | Male | Female |
| $2,499 or less | 45 (2.5%) | 57 (3.7%) |
| $2,500 to $4,999 | 49 (2.8%) | 61 (4.0%) |
| $5,000 to $7,499 | 30 (1.7%) | 11 (0.7%) |
| $7,500 to $9,999 | 36 (2.0%) | 39 (2.5%) |
| $10,000 to $12,499 | 13 (0.7%) | 26 (1.7%) |
| $12,500 to $14,999 | 71 (4.0%) | 27 (1.8%) |
| $15,000 to $17,499 | 0 (0.0%) | 21 (1.4%) |
| $17,500 to $19,999 | 0 (0.0%) | 70 (4.6%) |
| $20,000 to $22,499 | 18 (1.0%) | 15 (1.0%) |
| $22,500 to $24,999 | 0 (0.0%) | 25 (1.6%) |
| $25,000 to $29,999 | 20 (1.1%) | 94 (6.1%) |
| $30,000 to $34,999 | 0 (0.0%) | 143 (9.3%) |
| $35,000 to $39,999 | 115 (6.5%) | 94 (6.1%) |
| $40,000 to $44,999 | 135 (7.6%) | 105 (6.9%) |
| $45,000 to $49,999 | 20 (1.1%) | 168 (11.0%) |
| $50,000 to $54,999 | 86 (4.9%) | 94 (6.1%) |
| $55,000 to $64,999 | 99 (5.6%) | 63 (4.1%) |
| $65,000 to $74,999 | 125 (7.1%) | 102 (6.7%) |
| $75,000 to $99,999 | 347 (19.7%) | 220 (14.4%) |
| $100,000+ | 556 (31.5%) | 96 (6.3%) |
| Total | 1,765 (100.0%) | 1,531 (100.0%) |
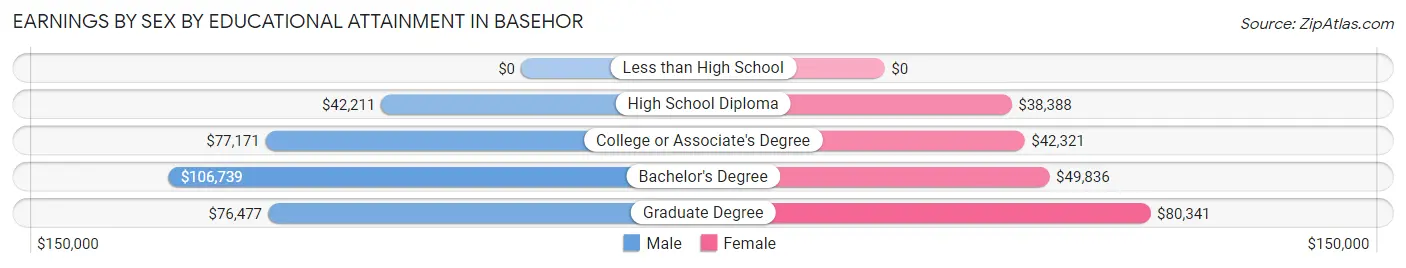
Earnings by Sex by Educational Attainment in Basehor
Average earnings in Basehor are $78,340 for men and $46,092 for women, a difference of 41.2%. Men with an educational attainment of bachelor's degree enjoy the highest average annual earnings of $106,739, while those with high school diploma education earn the least with $42,211. Women with an educational attainment of graduate degree earn the most with the average annual earnings of $80,341, while those with high school diploma education have the smallest earnings of $38,388.
| Educational Attainment | Male Income | Female Income |
| Less than High School | - | - |
| High School Diploma | $42,211 | $38,388 |
| College or Associate's Degree | $77,171 | $42,321 |
| Bachelor's Degree | $106,739 | $49,836 |
| Graduate Degree | $76,477 | $80,341 |
| Total | $78,340 | $46,092 |
Family Income in Basehor
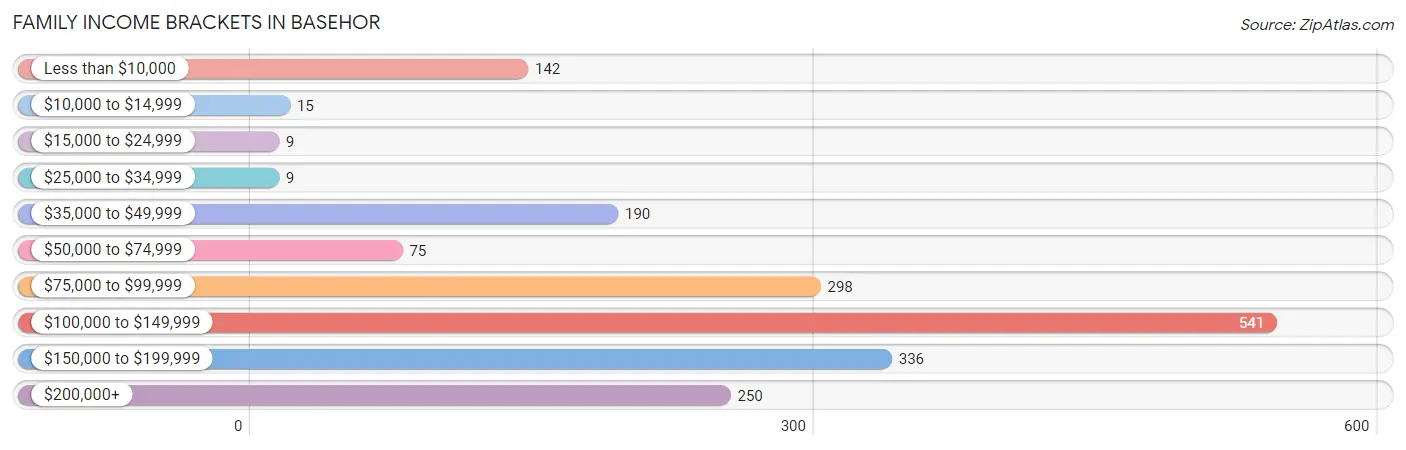
Family Income Brackets in Basehor
According to the Basehor family income data, there are 541 families falling into the $100,000 to $149,999 income range, which is the most common income bracket and makes up 29.0% of all families. Conversely, the $15,000 to $24,999 income bracket is the least frequent group with only 9 families (0.5%) belonging to this category.
| Income Bracket | # Families | % Families |
| Less than $10,000 | 142 | 7.6% |
| $10,000 to $14,999 | 15 | 0.8% |
| $15,000 to $24,999 | 9 | 0.5% |
| $25,000 to $34,999 | 9 | 0.5% |
| $35,000 to $49,999 | 190 | 10.2% |
| $50,000 to $74,999 | 75 | 4.0% |
| $75,000 to $99,999 | 298 | 16.0% |
| $100,000 to $149,999 | 541 | 29.0% |
| $150,000 to $199,999 | 336 | 18.0% |
| $200,000+ | 250 | 13.4% |
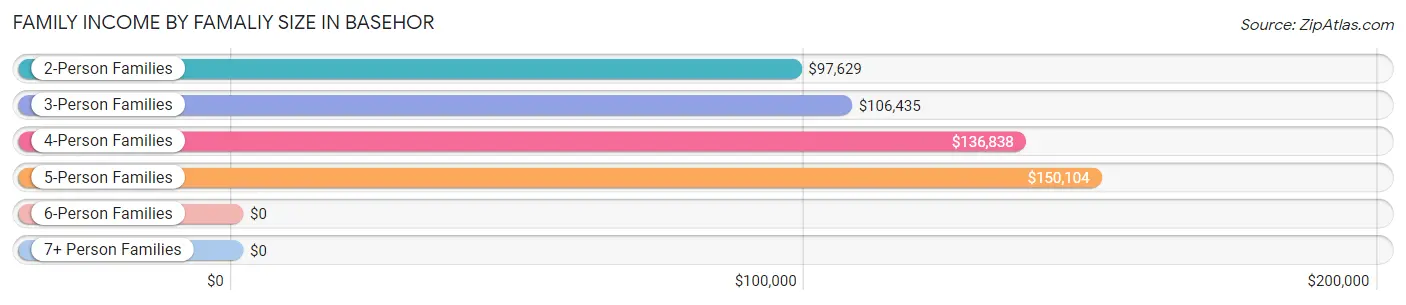
Family Income by Famaliy Size in Basehor
5-person families (179 | 9.6%) account for the highest median family income in Basehor with $150,104 per family, while 2-person families (811 | 43.5%) have the highest median income of $48,814 per family member.
| Income Bracket | # Families | Median Income |
| 2-Person Families | 811 (43.5%) | $97,629 |
| 3-Person Families | 524 (28.1%) | $106,435 |
| 4-Person Families | 280 (15.0%) | $136,838 |
| 5-Person Families | 179 (9.6%) | $150,104 |
| 6-Person Families | 50 (2.7%) | $0 |
| 7+ Person Families | 21 (1.1%) | $0 |
| Total | 1,865 (100.0%) | $110,875 |
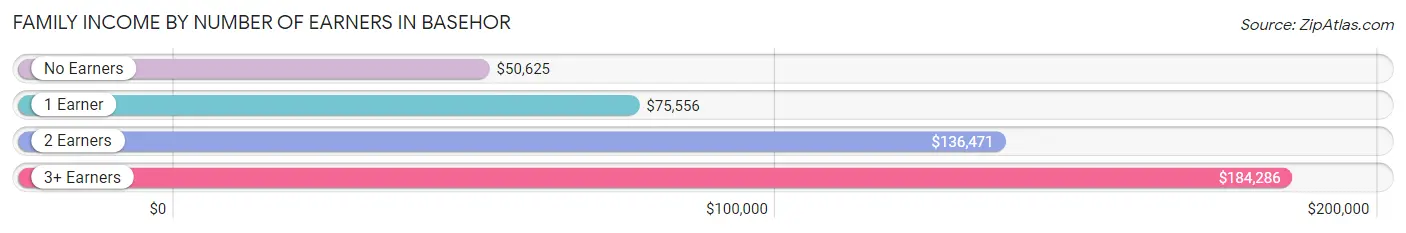
Family Income by Number of Earners in Basehor
The median family income in Basehor is $110,875, with families comprising 3+ earners (148) having the highest median family income of $184,286, while families with no earners (347) have the lowest median family income of $50,625, accounting for 7.9% and 18.6% of families, respectively.
| Number of Earners | # Families | Median Income |
| No Earners | 347 (18.6%) | $50,625 |
| 1 Earner | 432 (23.2%) | $75,556 |
| 2 Earners | 938 (50.3%) | $136,471 |
| 3+ Earners | 148 (7.9%) | $184,286 |
| Total | 1,865 (100.0%) | $110,875 |
Household Income in Basehor
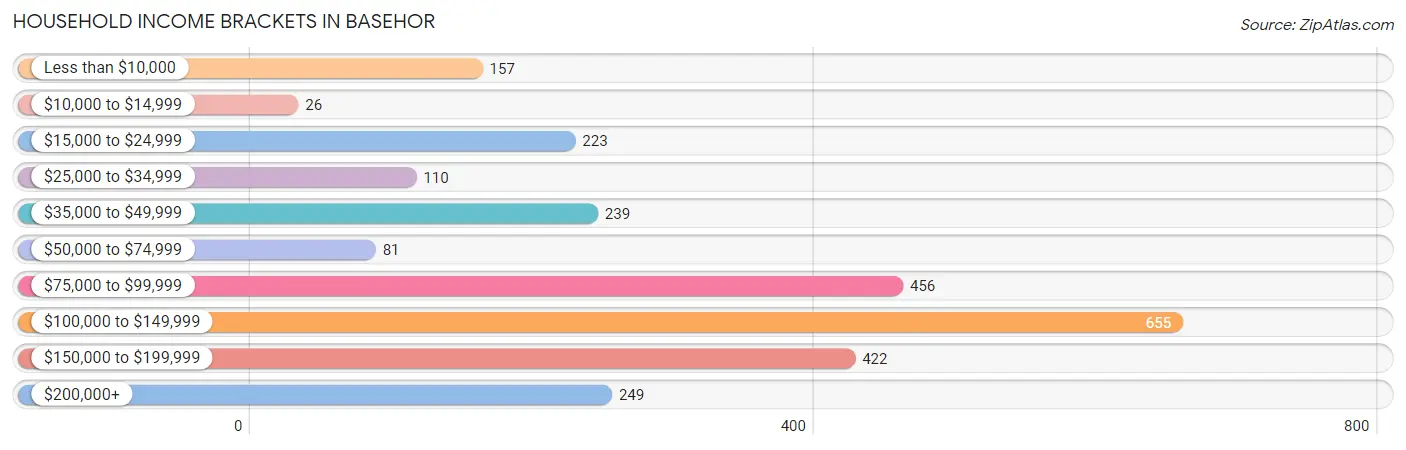
Household Income Brackets in Basehor
With 655 households falling in the category, the $100,000 to $149,999 income range is the most frequent in Basehor, accounting for 25.0% of all households. In contrast, only 26 households (1.0%) fall into the $10,000 to $14,999 income bracket, making it the least populous group.
| Income Bracket | # Households | % Households |
| Less than $10,000 | 157 | 6.0% |
| $10,000 to $14,999 | 26 | 1.0% |
| $15,000 to $24,999 | 223 | 8.5% |
| $25,000 to $34,999 | 110 | 4.2% |
| $35,000 to $49,999 | 239 | 9.1% |
| $50,000 to $74,999 | 81 | 3.1% |
| $75,000 to $99,999 | 456 | 17.4% |
| $100,000 to $149,999 | 655 | 25.0% |
| $150,000 to $199,999 | 422 | 16.1% |
| $200,000+ | 249 | 9.5% |
Household Income by Householder Age in Basehor
The median household income in Basehor is $100,608, with the highest median household income of $126,860 found in the 45 to 64 years age bracket for the primary householder. A total of 842 households (32.1%) fall into this category. Meanwhile, the 15 to 24 years age bracket for the primary householder has the lowest median household income of $0, with 29 households (1.1%) in this group.
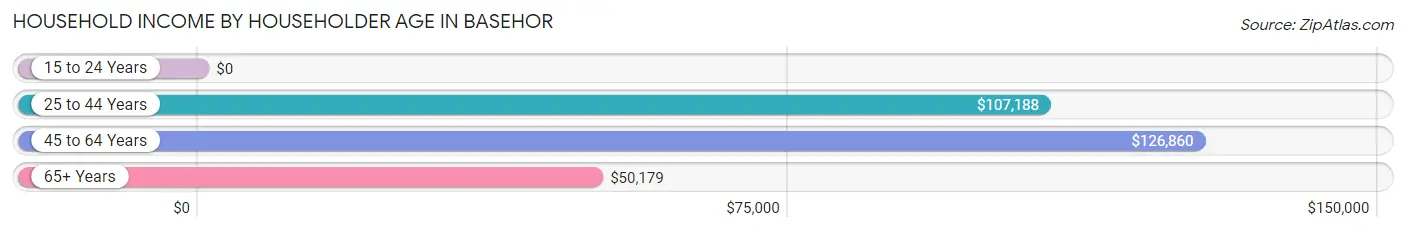
| Income Bracket | # Households | Median Income |
| 15 to 24 Years | 29 (1.1%) | $0 |
| 25 to 44 Years | 976 (37.2%) | $107,188 |
| 45 to 64 Years | 842 (32.1%) | $126,860 |
| 65+ Years | 774 (29.5%) | $50,179 |
| Total | 2,621 (100.0%) | $100,608 |
Poverty in Basehor
Income Below Poverty by Sex and Age in Basehor
With 5.1% poverty level for males and 10.6% for females among the residents of Basehor, 12 to 14 year old males and 18 to 24 year old females are the most vulnerable to poverty, with 44 males (27.2%) and 70 females (39.8%) in their respective age groups living below the poverty level.
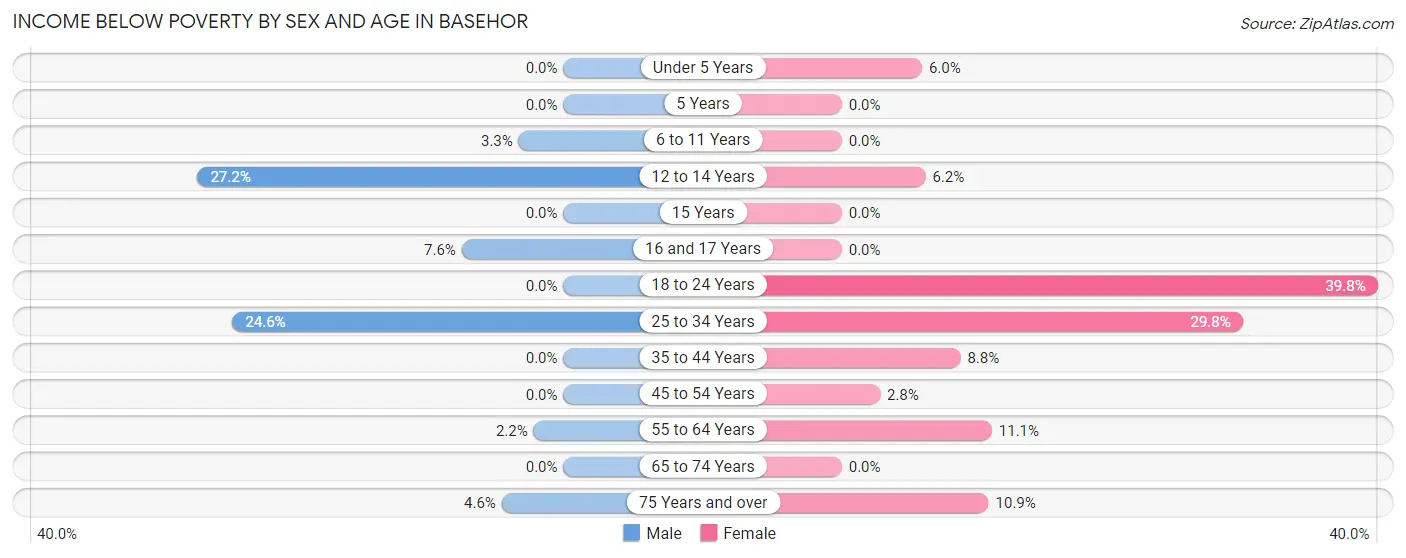
| Age Bracket | Male | Female |
| Under 5 Years | 0 (0.0%) | 10 (5.9%) |
| 5 Years | 0 (0.0%) | 0 (0.0%) |
| 6 to 11 Years | 12 (3.3%) | 0 (0.0%) |
| 12 to 14 Years | 44 (27.2%) | 10 (6.2%) |
| 15 Years | 0 (0.0%) | 0 (0.0%) |
| 16 and 17 Years | 8 (7.5%) | 0 (0.0%) |
| 18 to 24 Years | 0 (0.0%) | 70 (39.8%) |
| 25 to 34 Years | 99 (24.6%) | 130 (29.7%) |
| 35 to 44 Years | 0 (0.0%) | 42 (8.8%) |
| 45 to 54 Years | 0 (0.0%) | 12 (2.8%) |
| 55 to 64 Years | 9 (2.2%) | 46 (11.1%) |
| 65 to 74 Years | 0 (0.0%) | 0 (0.0%) |
| 75 Years and over | 14 (4.6%) | 35 (10.9%) |
| Total | 186 (5.1%) | 355 (10.6%) |
Income Above Poverty by Sex and Age in Basehor
According to the poverty statistics in Basehor, males aged under 5 years and females aged 5 years are the age groups that are most secure financially, with 100.0% of males and 100.0% of females in these age groups living above the poverty line.
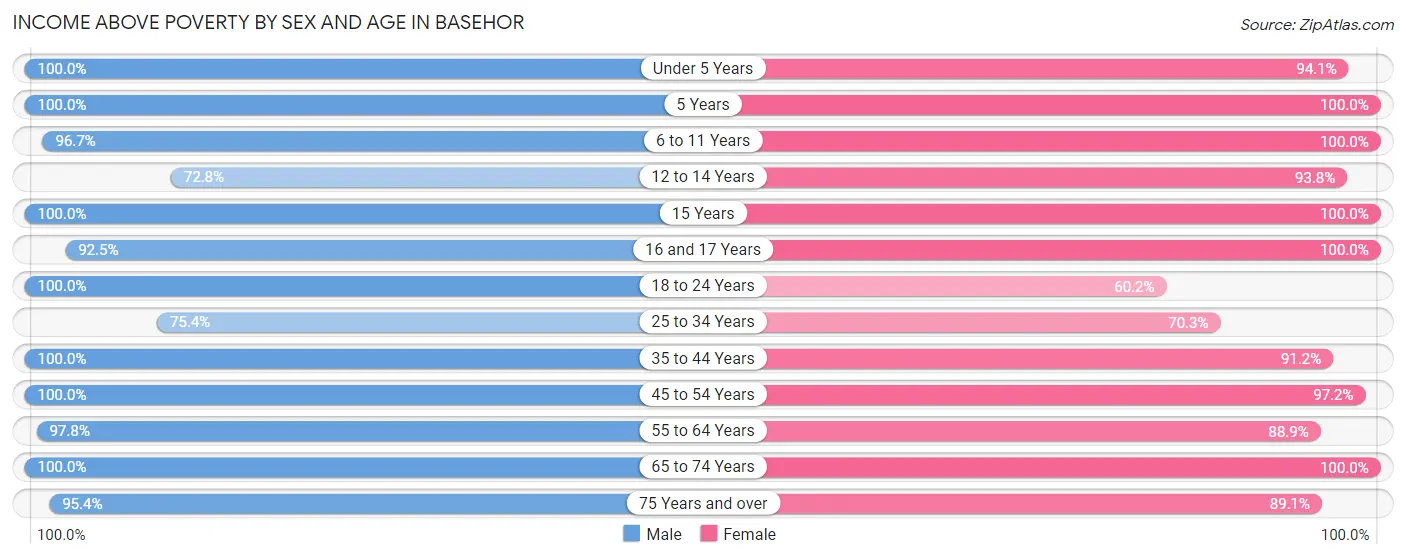
| Age Bracket | Male | Female |
| Under 5 Years | 189 (100.0%) | 158 (94.1%) |
| 5 Years | 21 (100.0%) | 84 (100.0%) |
| 6 to 11 Years | 349 (96.7%) | 250 (100.0%) |
| 12 to 14 Years | 118 (72.8%) | 151 (93.8%) |
| 15 Years | 95 (100.0%) | 52 (100.0%) |
| 16 and 17 Years | 98 (92.4%) | 40 (100.0%) |
| 18 to 24 Years | 362 (100.0%) | 106 (60.2%) |
| 25 to 34 Years | 304 (75.4%) | 307 (70.3%) |
| 35 to 44 Years | 569 (100.0%) | 435 (91.2%) |
| 45 to 54 Years | 421 (100.0%) | 411 (97.2%) |
| 55 to 64 Years | 398 (97.8%) | 367 (88.9%) |
| 65 to 74 Years | 207 (100.0%) | 333 (100.0%) |
| 75 Years and over | 292 (95.4%) | 286 (89.1%) |
| Total | 3,423 (94.9%) | 2,980 (89.4%) |
Income Below Poverty Among Married-Couple Families in Basehor
The poverty statistics for married-couple families in Basehor show that 7.3% or 113 of the total 1,544 families live below the poverty line. Families with no children have the highest poverty rate of 12.5%, comprising of 113 families. On the other hand, families with 1 or 2 children have the lowest poverty rate of 0.0%, which includes 0 families.
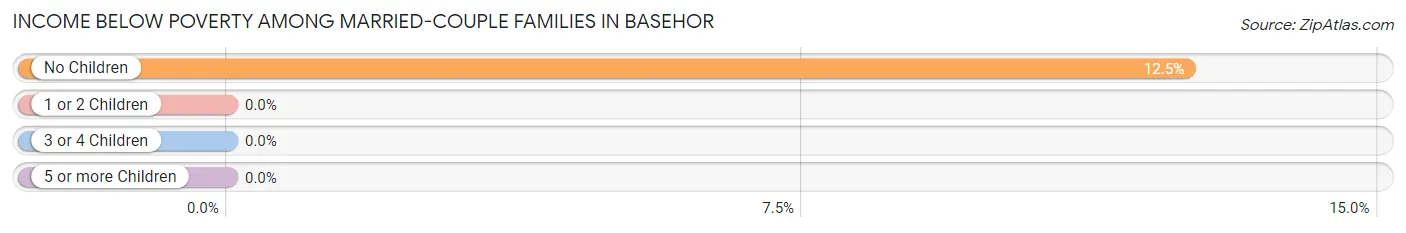
| Children | Above Poverty | Below Poverty |
| No Children | 790 (87.5%) | 113 (12.5%) |
| 1 or 2 Children | 484 (100.0%) | 0 (0.0%) |
| 3 or 4 Children | 157 (100.0%) | 0 (0.0%) |
| 5 or more Children | 0 (0.0%) | 0 (0.0%) |
| Total | 1,431 (92.7%) | 113 (7.3%) |
Income Below Poverty Among Single-Parent Households in Basehor
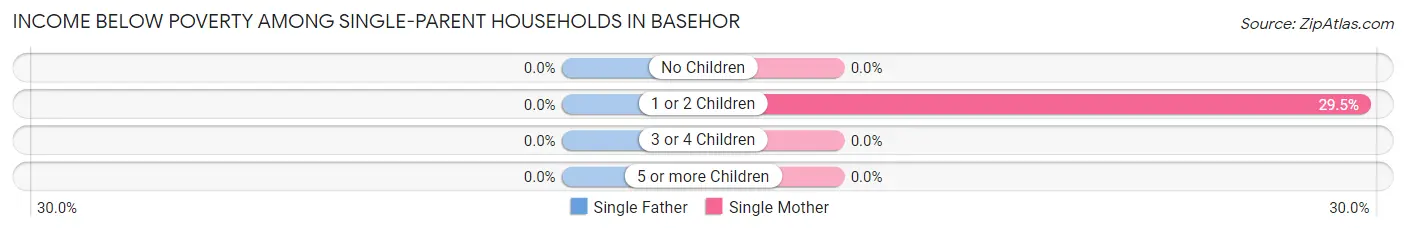
| Children | Single Father | Single Mother |
| No Children | 0 (0.0%) | 0 (0.0%) |
| 1 or 2 Children | 0 (0.0%) | 43 (29.4%) |
| 3 or 4 Children | 0 (0.0%) | 0 (0.0%) |
| 5 or more Children | 0 (0.0%) | 0 (0.0%) |
| Total | 0 (0.0%) | 43 (18.1%) |
Income Below Poverty Among Married-Couple vs Single-Parent Households in Basehor
The poverty data for Basehor shows that 113 of the married-couple family households (7.3%) and 43 of the single-parent households (13.4%) are living below the poverty level. Within the married-couple family households, those with no children have the highest poverty rate, with 113 households (12.5%) falling below the poverty line. Among the single-parent households, those with 1 or 2 children have the highest poverty rate, with 43 household (24.7%) living below poverty.
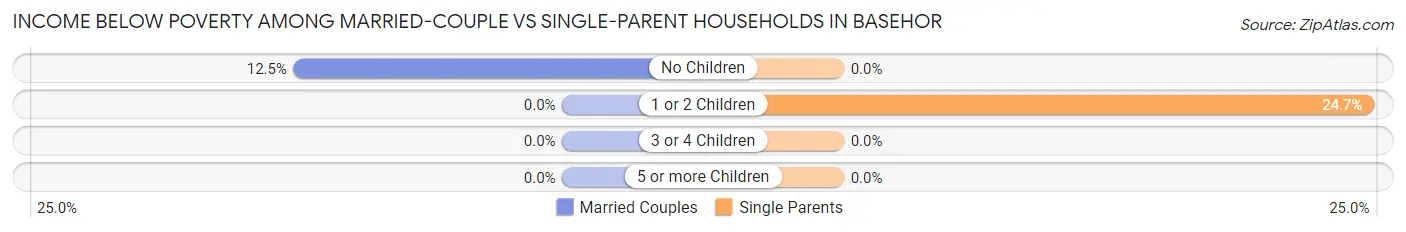
| Children | Married-Couple Families | Single-Parent Households |
| No Children | 113 (12.5%) | 0 (0.0%) |
| 1 or 2 Children | 0 (0.0%) | 43 (24.7%) |
| 3 or 4 Children | 0 (0.0%) | 0 (0.0%) |
| 5 or more Children | 0 (0.0%) | 0 (0.0%) |
| Total | 113 (7.3%) | 43 (13.4%) |
Race in Basehor
The most populous races in Basehor are White / Caucasian (6,352 | 90.7%), Hispanic or Latino (283 | 4.0%), and Two or more Races (255 | 3.6%).
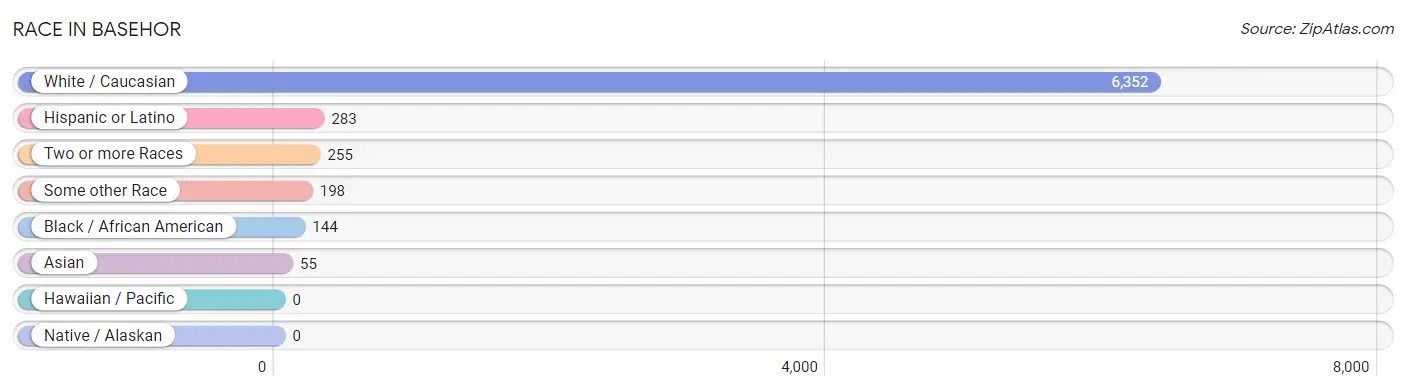
| Race | # Population | % Population |
| Asian | 55 | 0.8% |
| Black / African American | 144 | 2.1% |
| Hawaiian / Pacific | 0 | 0.0% |
| Hispanic or Latino | 283 | 4.0% |
| Native / Alaskan | 0 | 0.0% |
| White / Caucasian | 6,352 | 90.7% |
| Two or more Races | 255 | 3.6% |
| Some other Race | 198 | 2.8% |
| Total | 7,004 | 100.0% |
Ancestry in Basehor
The most populous ancestries reported in Basehor are German (1,680 | 24.0%), English (1,292 | 18.4%), Irish (728 | 10.4%), American (426 | 6.1%), and Czech (133 | 1.9%), together accounting for 60.8% of all Basehor residents.
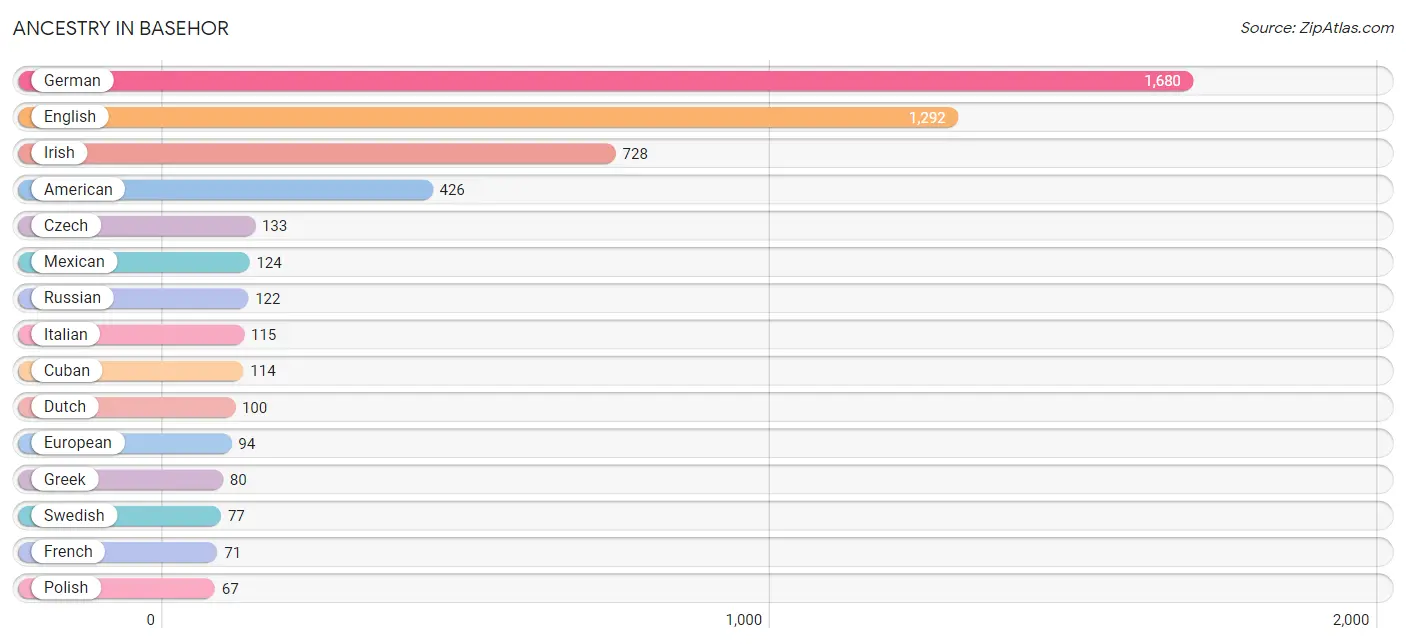
| Ancestry | # Population | % Population |
| American | 426 | 6.1% |
| Belgian | 15 | 0.2% |
| British | 26 | 0.4% |
| Central American | 14 | 0.2% |
| Cherokee | 15 | 0.2% |
| Costa Rican | 14 | 0.2% |
| Croatian | 33 | 0.5% |
| Cuban | 114 | 1.6% |
| Czech | 133 | 1.9% |
| Danish | 20 | 0.3% |
| Dutch | 100 | 1.4% |
| English | 1,292 | 18.4% |
| European | 94 | 1.3% |
| French | 71 | 1.0% |
| French Canadian | 32 | 0.5% |
| German | 1,680 | 24.0% |
| Greek | 80 | 1.1% |
| Irish | 728 | 10.4% |
| Italian | 115 | 1.6% |
| Korean | 35 | 0.5% |
| Lithuanian | 13 | 0.2% |
| Malaysian | 55 | 0.8% |
| Mexican | 124 | 1.8% |
| Norwegian | 7 | 0.1% |
| Pakistani | 36 | 0.5% |
| Polish | 67 | 1.0% |
| Puerto Rican | 31 | 0.4% |
| Russian | 122 | 1.7% |
| Scandinavian | 31 | 0.4% |
| Scotch-Irish | 57 | 0.8% |
| Scottish | 23 | 0.3% |
| Serbian | 28 | 0.4% |
| Slovak | 10 | 0.1% |
| Swedish | 77 | 1.1% |
| Tohono O'Odham | 15 | 0.2% |
| Ukrainian | 8 | 0.1% |
| Welsh | 12 | 0.2% | View All 37 Rows |
Immigrants in Basehor
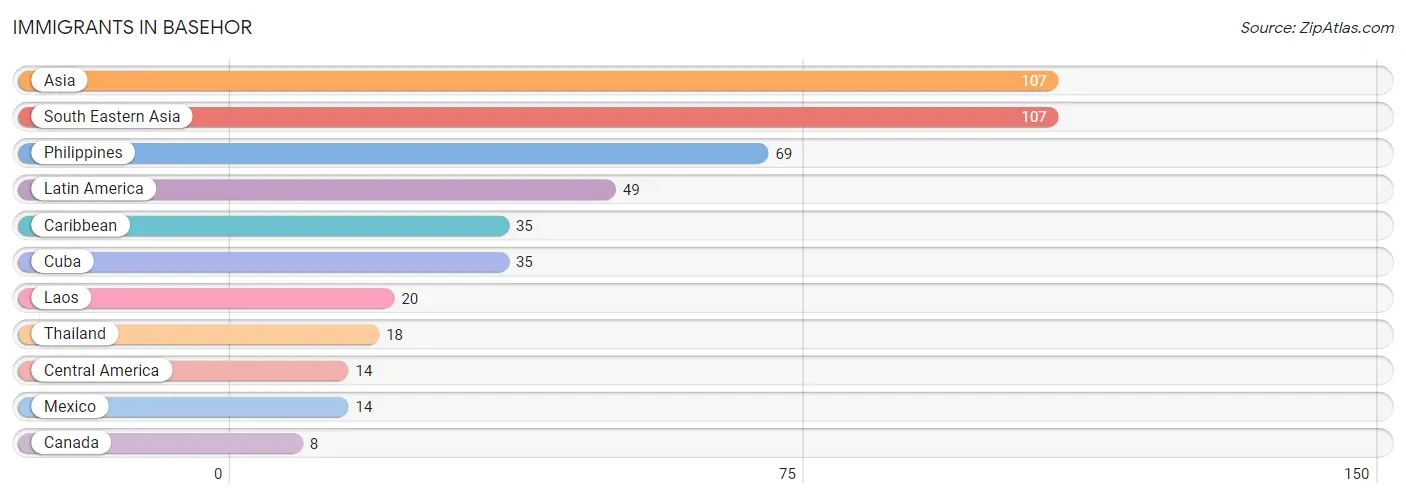
The most numerous immigrant groups reported in Basehor came from Asia (107 | 1.5%), South Eastern Asia (107 | 1.5%), Philippines (69 | 1.0%), Latin America (49 | 0.7%), and Caribbean (35 | 0.5%), together accounting for 5.2% of all Basehor residents.
| Immigration Origin | # Population | % Population |
| Asia | 107 | 1.5% |
| Canada | 8 | 0.1% |
| Caribbean | 35 | 0.5% |
| Central America | 14 | 0.2% |
| Cuba | 35 | 0.5% |
| Laos | 20 | 0.3% |
| Latin America | 49 | 0.7% |
| Mexico | 14 | 0.2% |
| Philippines | 69 | 1.0% |
| South Eastern Asia | 107 | 1.5% |
| Thailand | 18 | 0.3% | View All 11 Rows |
Sex and Age in Basehor
Sex and Age in Basehor
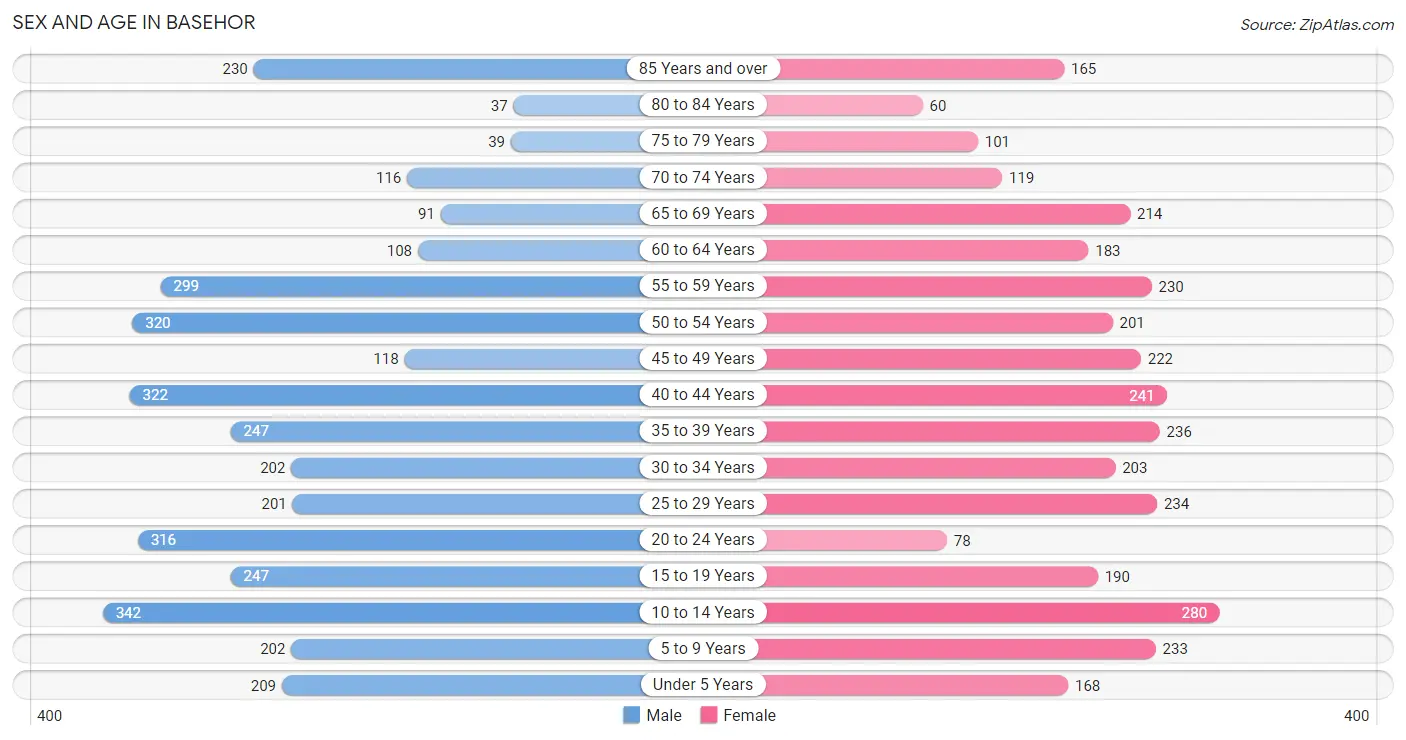
The most populous age groups in Basehor are 10 to 14 Years (342 | 9.4%) for men and 10 to 14 Years (280 | 8.3%) for women.
| Age Bracket | Male | Female |
| Under 5 Years | 209 (5.7%) | 168 (5.0%) |
| 5 to 9 Years | 202 (5.5%) | 233 (6.9%) |
| 10 to 14 Years | 342 (9.4%) | 280 (8.3%) |
| 15 to 19 Years | 247 (6.8%) | 190 (5.7%) |
| 20 to 24 Years | 316 (8.7%) | 78 (2.3%) |
| 25 to 29 Years | 201 (5.5%) | 234 (7.0%) |
| 30 to 34 Years | 202 (5.5%) | 203 (6.0%) |
| 35 to 39 Years | 247 (6.8%) | 236 (7.0%) |
| 40 to 44 Years | 322 (8.8%) | 241 (7.2%) |
| 45 to 49 Years | 118 (3.2%) | 222 (6.6%) |
| 50 to 54 Years | 320 (8.8%) | 201 (6.0%) |
| 55 to 59 Years | 299 (8.2%) | 230 (6.9%) |
| 60 to 64 Years | 108 (3.0%) | 183 (5.4%) |
| 65 to 69 Years | 91 (2.5%) | 214 (6.4%) |
| 70 to 74 Years | 116 (3.2%) | 119 (3.5%) |
| 75 to 79 Years | 39 (1.1%) | 101 (3.0%) |
| 80 to 84 Years | 37 (1.0%) | 60 (1.8%) |
| 85 Years and over | 230 (6.3%) | 165 (4.9%) |
| Total | 3,646 (100.0%) | 3,358 (100.0%) |
Families and Households in Basehor
Median Family Size in Basehor
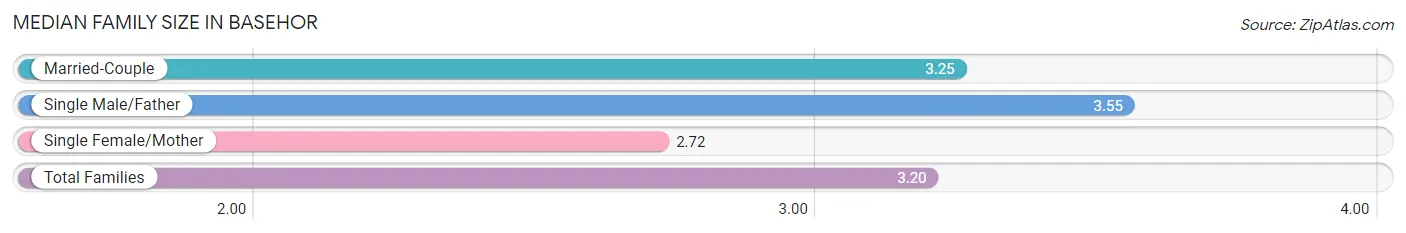
The median family size in Basehor is 3.20 persons per family, with single male/father families (84 | 4.5%) accounting for the largest median family size of 3.55 persons per family. On the other hand, single female/mother families (237 | 12.7%) represent the smallest median family size with 2.72 persons per family.
| Family Type | # Families | Family Size |
| Married-Couple | 1,544 (82.8%) | 3.25 |
| Single Male/Father | 84 (4.5%) | 3.55 |
| Single Female/Mother | 237 (12.7%) | 2.72 |
| Total Families | 1,865 (100.0%) | 3.20 |
Median Household Size in Basehor
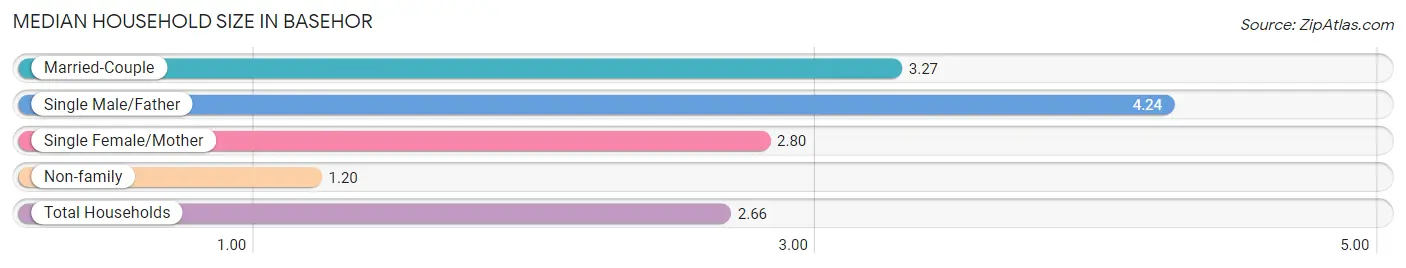
The median household size in Basehor is 2.66 persons per household, with single male/father households (84 | 3.2%) accounting for the largest median household size of 4.24 persons per household. non-family households (756 | 28.8%) represent the smallest median household size with 1.20 persons per household.
| Household Type | # Households | Household Size |
| Married-Couple | 1,544 (58.9%) | 3.27 |
| Single Male/Father | 84 (3.2%) | 4.24 |
| Single Female/Mother | 237 (9.0%) | 2.80 |
| Non-family | 756 (28.8%) | 1.20 |
| Total Households | 2,621 (100.0%) | 2.66 |
Household Size by Marriage Status in Basehor
Out of a total of 2,621 households in Basehor, 1,865 (71.2%) are family households, while 756 (28.8%) are nonfamily households. The most numerous type of family households are 2-person households, comprising 797, and the most common type of nonfamily households are 1-person households, comprising 650.
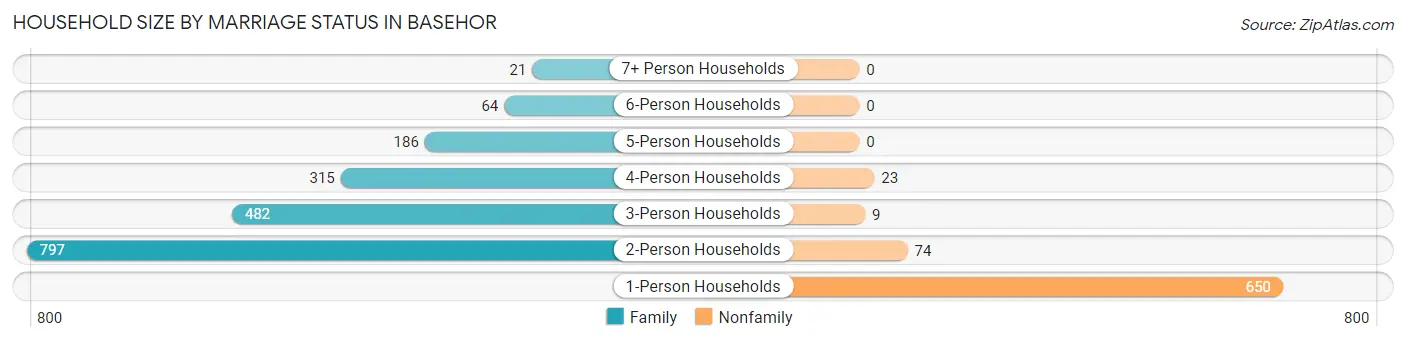
| Household Size | Family Households | Nonfamily Households |
| 1-Person Households | - | 650 (24.8%) |
| 2-Person Households | 797 (30.4%) | 74 (2.8%) |
| 3-Person Households | 482 (18.4%) | 9 (0.3%) |
| 4-Person Households | 315 (12.0%) | 23 (0.9%) |
| 5-Person Households | 186 (7.1%) | 0 (0.0%) |
| 6-Person Households | 64 (2.4%) | 0 (0.0%) |
| 7+ Person Households | 21 (0.8%) | 0 (0.0%) |
| Total | 1,865 (71.2%) | 756 (28.8%) |
Female Fertility in Basehor
Fertility by Age in Basehor
Average fertility rate in Basehor is 26.0 births per 1,000 women. Women in the age bracket of 20 to 34 years have the highest fertility rate with 72.0 births per 1,000 women. Women in the age bracket of 20 to 34 years acount for 100.0% of all women with births.
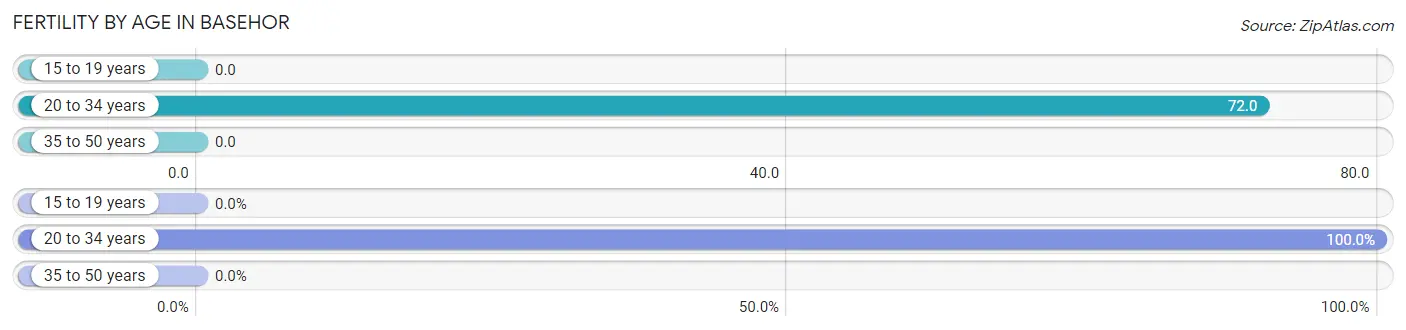
| Age Bracket | Women with Births | Births / 1,000 Women |
| 15 to 19 years | 0 (0.0%) | 0.0 |
| 20 to 34 years | 37 (100.0%) | 72.0 |
| 35 to 50 years | 0 (0.0%) | 0.0 |
| Total | 37 (100.0%) | 26.0 |
Fertility by Age by Marriage Status in Basehor
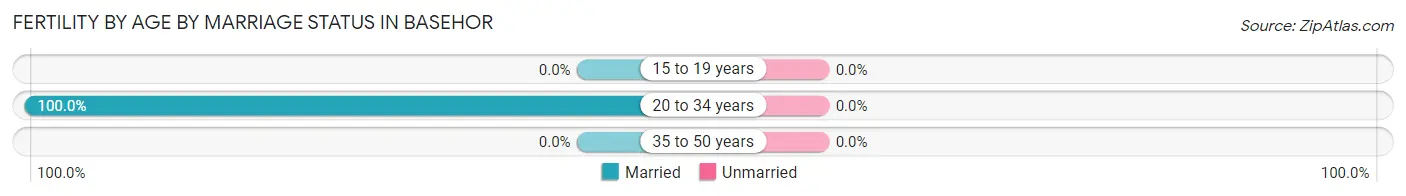
| Age Bracket | Married | Unmarried |
| 15 to 19 years | 0 (0.0%) | 0 (0.0%) |
| 20 to 34 years | 37 (100.0%) | 0 (0.0%) |
| 35 to 50 years | 0 (0.0%) | 0 (0.0%) |
| Total | 37 (100.0%) | 0 (0.0%) |
Fertility by Education in Basehor
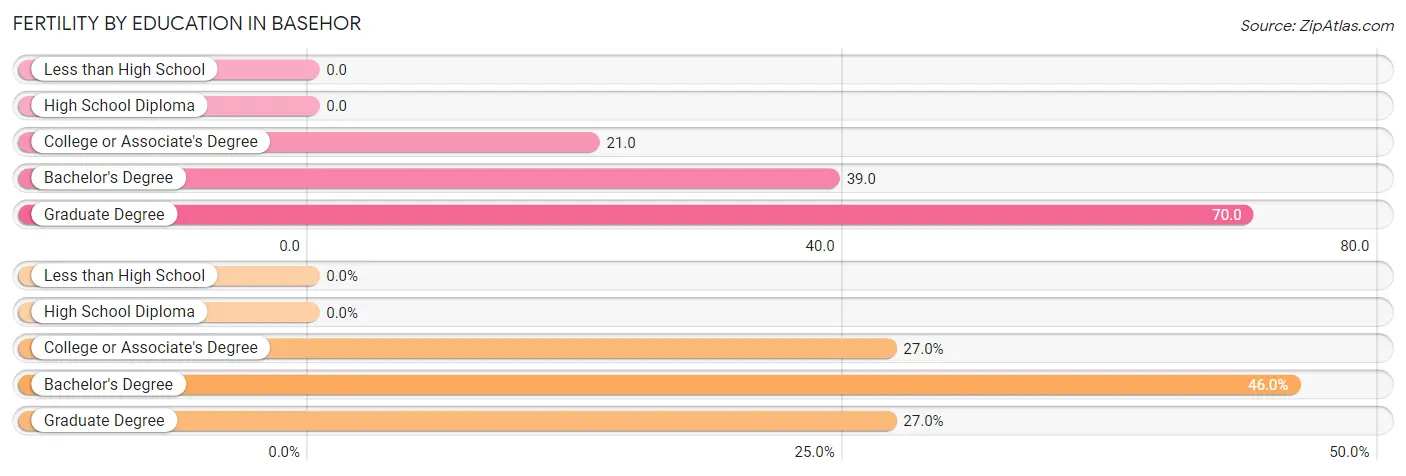
| Educational Attainment | Women with Births | Births / 1,000 Women |
| Less than High School | 0 (0.0%) | 0.0 |
| High School Diploma | 0 (0.0%) | 0.0 |
| College or Associate's Degree | 10 (27.0%) | 21.0 |
| Bachelor's Degree | 17 (46.0%) | 39.0 |
| Graduate Degree | 10 (27.0%) | 70.0 |
| Total | 37 (100.0%) | 26.0 |
Fertility by Education by Marriage Status in Basehor
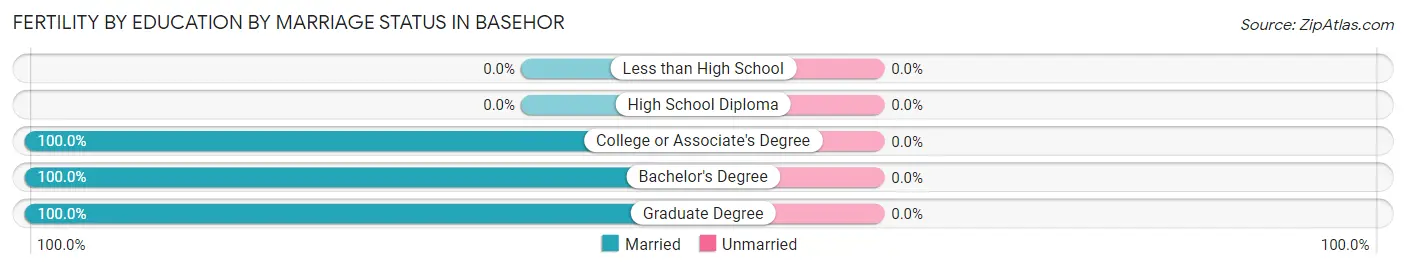
| Educational Attainment | Married | Unmarried |
| Less than High School | 0 (0.0%) | 0 (0.0%) |
| High School Diploma | 0 (0.0%) | 0 (0.0%) |
| College or Associate's Degree | 10 (100.0%) | 0 (0.0%) |
| Bachelor's Degree | 17 (100.0%) | 0 (0.0%) |
| Graduate Degree | 10 (100.0%) | 0 (0.0%) |
| Total | 37 (100.0%) | 0 (0.0%) |
Employment Characteristics in Basehor
Employment by Class of Employer in Basehor
Among the 3,033 employed individuals in Basehor, private company employees (2,285 | 75.3%), local government employees (236 | 7.8%), and not-for-profit organizations (183 | 6.0%) make up the most common classes of employment.
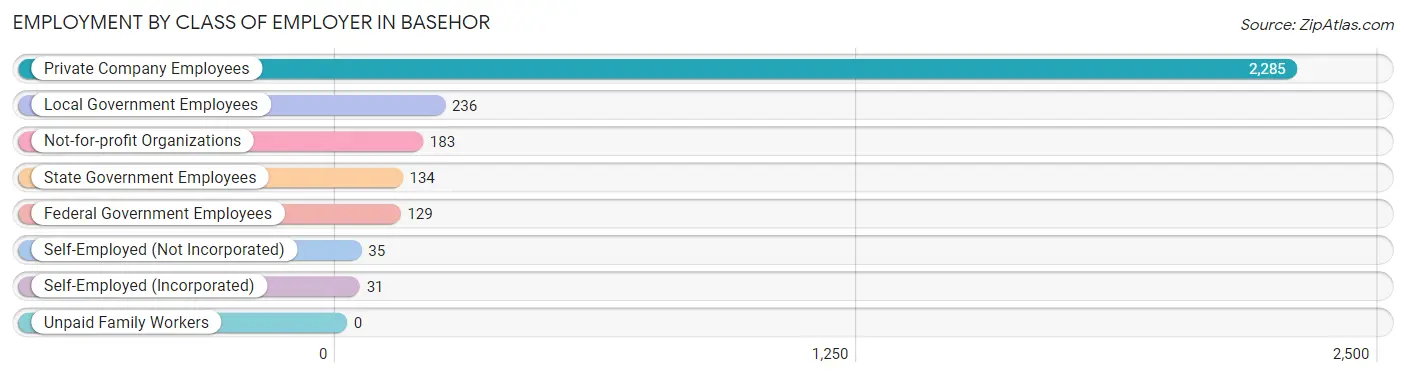
| Employer Class | # Employees | % Employees |
| Private Company Employees | 2,285 | 75.3% |
| Self-Employed (Incorporated) | 31 | 1.0% |
| Self-Employed (Not Incorporated) | 35 | 1.1% |
| Not-for-profit Organizations | 183 | 6.0% |
| Local Government Employees | 236 | 7.8% |
| State Government Employees | 134 | 4.4% |
| Federal Government Employees | 129 | 4.3% |
| Unpaid Family Workers | 0 | 0.0% |
| Total | 3,033 | 100.0% |
Employment Status by Age in Basehor
According to the labor force statistics for Basehor, out of the total population over 16 years of age (5,423), 63.8% or 3,460 individuals are in the labor force, with 9.9% or 343 of them unemployed. The age group with the highest labor force participation rate is 35 to 44 years, with 97.3% or 1,018 individuals in the labor force. Within the labor force, the 20 to 24 years age range has the highest percentage of unemployed individuals, with 73.4% or 256 of them being unemployed.
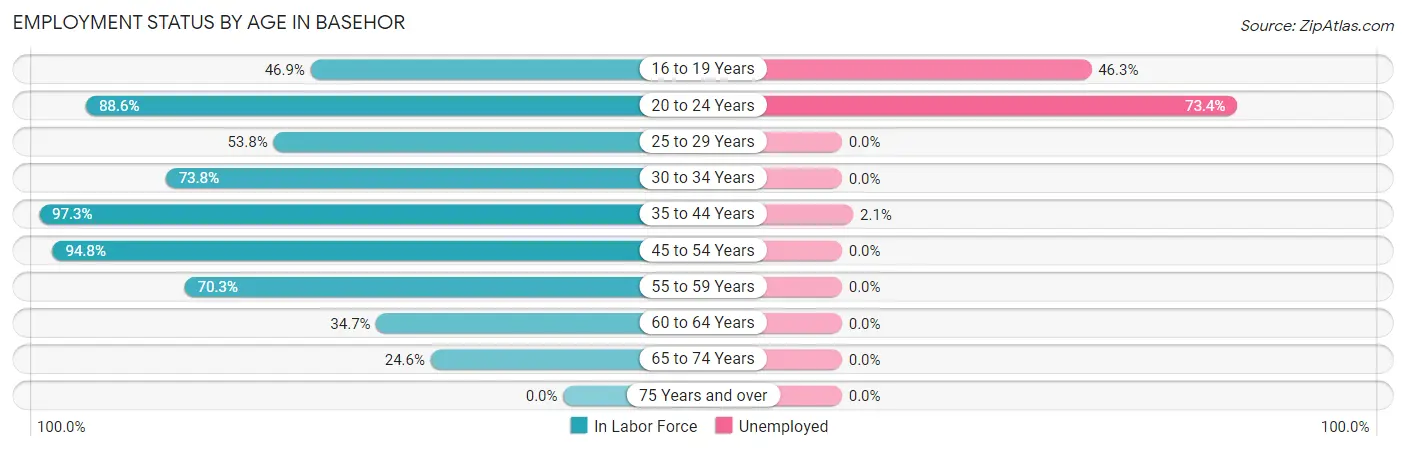
| Age Bracket | In Labor Force | Unemployed |
| 16 to 19 Years | 136 (46.9%) | 63 (46.3%) |
| 20 to 24 Years | 349 (88.6%) | 256 (73.4%) |
| 25 to 29 Years | 234 (53.8%) | 0 (0.0%) |
| 30 to 34 Years | 299 (73.8%) | 0 (0.0%) |
| 35 to 44 Years | 1,018 (97.3%) | 21 (2.1%) |
| 45 to 54 Years | 816 (94.8%) | 0 (0.0%) |
| 55 to 59 Years | 372 (70.3%) | 0 (0.0%) |
| 60 to 64 Years | 101 (34.7%) | 0 (0.0%) |
| 65 to 74 Years | 133 (24.6%) | 0 (0.0%) |
| 75 Years and over | 0 (0.0%) | 0 (0.0%) |
| Total | 3,460 (63.8%) | 343 (9.9%) |
Employment Status by Educational Attainment in Basehor
According to labor force statistics for Basehor, 79.6% of individuals (2,839) out of the total population between 25 and 64 years of age (3,567) are in the labor force, with 0.7% or 20 of them being unemployed. The group with the highest labor force participation rate are those with the educational attainment of bachelor's degree or higher, with 87.6% or 1,334 individuals in the labor force. Within the labor force, individuals with high school diploma education have the highest percentage of unemployment, with 3.1% or 21 of them being unemployed.
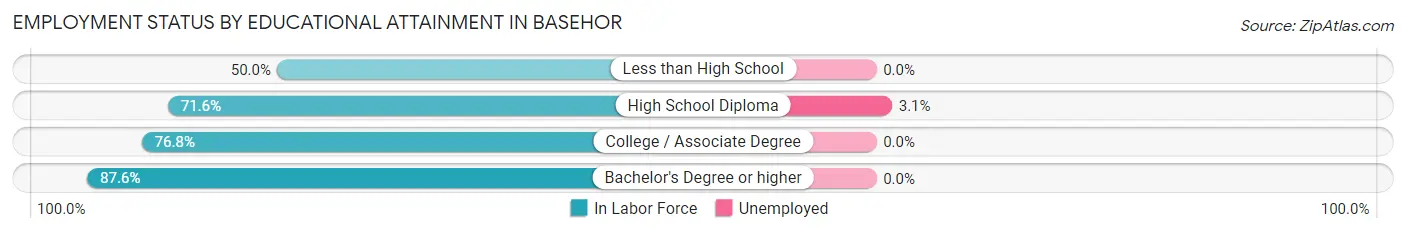
| Educational Attainment | In Labor Force | Unemployed |
| Less than High School | 28 (50.0%) | 0 (0.0%) |
| High School Diploma | 669 (71.6%) | 29 (3.1%) |
| College / Associate Degree | 809 (76.8%) | 0 (0.0%) |
| Bachelor's Degree or higher | 1,334 (87.6%) | 0 (0.0%) |
| Total | 2,839 (79.6%) | 25 (0.7%) |
Employment Occupations by Sex in Basehor
Management, Business, Science and Arts Occupations
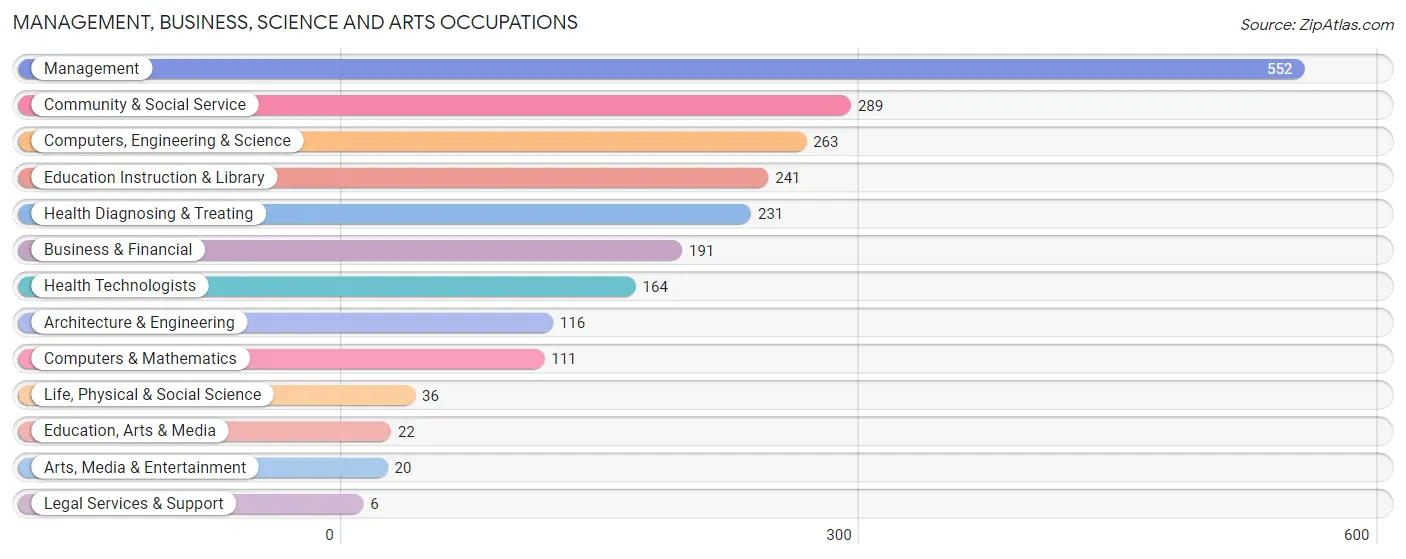
The most common Management, Business, Science and Arts occupations in Basehor are Management (552 | 17.8%), Community & Social Service (289 | 9.3%), Computers, Engineering & Science (263 | 8.5%), Education Instruction & Library (241 | 7.8%), and Health Diagnosing & Treating (231 | 7.4%).
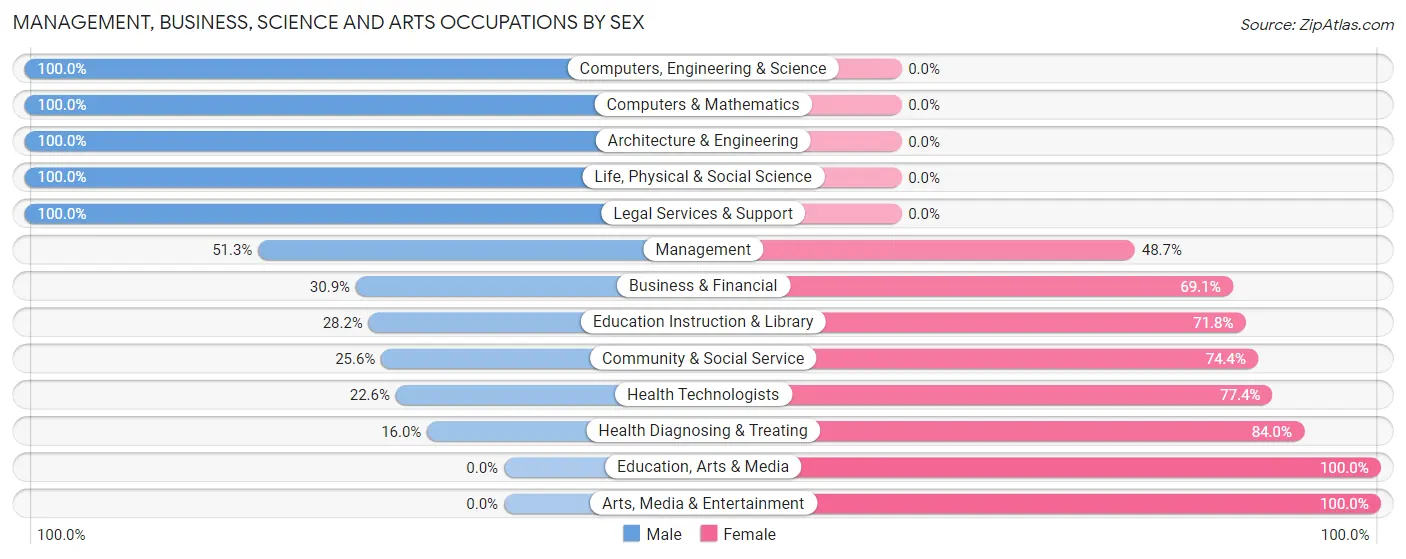
Management, Business, Science and Arts Occupations by Sex
Within the Management, Business, Science and Arts occupations in Basehor, the most male-oriented occupations are Computers, Engineering & Science (100.0%), Computers & Mathematics (100.0%), and Architecture & Engineering (100.0%), while the most female-oriented occupations are Education, Arts & Media (100.0%), Arts, Media & Entertainment (100.0%), and Health Diagnosing & Treating (84.0%).
| Occupation | Male | Female |
| Management | 283 (51.3%) | 269 (48.7%) |
| Business & Financial | 59 (30.9%) | 132 (69.1%) |
| Computers, Engineering & Science | 263 (100.0%) | 0 (0.0%) |
| Computers & Mathematics | 111 (100.0%) | 0 (0.0%) |
| Architecture & Engineering | 116 (100.0%) | 0 (0.0%) |
| Life, Physical & Social Science | 36 (100.0%) | 0 (0.0%) |
| Community & Social Service | 74 (25.6%) | 215 (74.4%) |
| Education, Arts & Media | 0 (0.0%) | 22 (100.0%) |
| Legal Services & Support | 6 (100.0%) | 0 (0.0%) |
| Education Instruction & Library | 68 (28.2%) | 173 (71.8%) |
| Arts, Media & Entertainment | 0 (0.0%) | 20 (100.0%) |
| Health Diagnosing & Treating | 37 (16.0%) | 194 (84.0%) |
| Health Technologists | 37 (22.6%) | 127 (77.4%) |
| Total (Category) | 716 (46.9%) | 810 (53.1%) |
| Total (Overall) | 1,677 (54.1%) | 1,424 (45.9%) |
Services Occupations
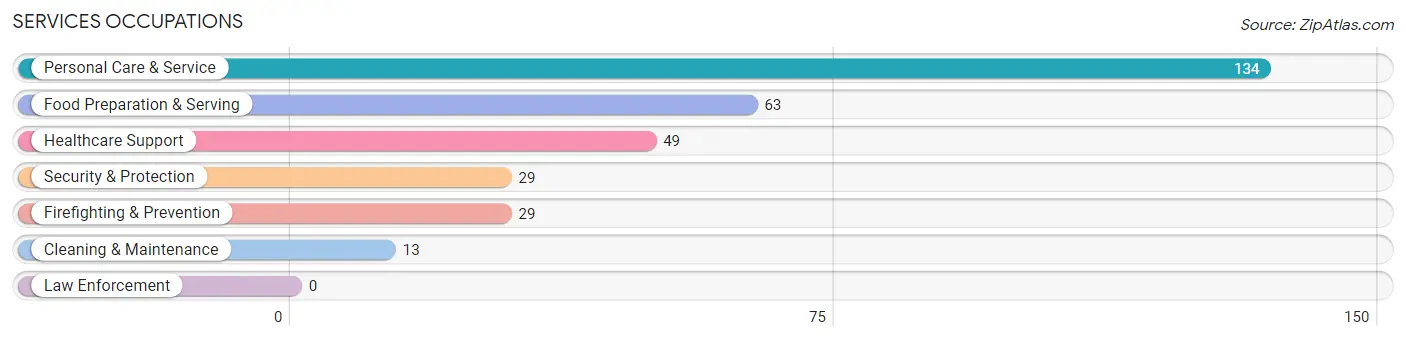
The most common Services occupations in Basehor are Personal Care & Service (134 | 4.3%), Food Preparation & Serving (63 | 2.0%), Healthcare Support (49 | 1.6%), Security & Protection (29 | 0.9%), and Firefighting & Prevention (29 | 0.9%).
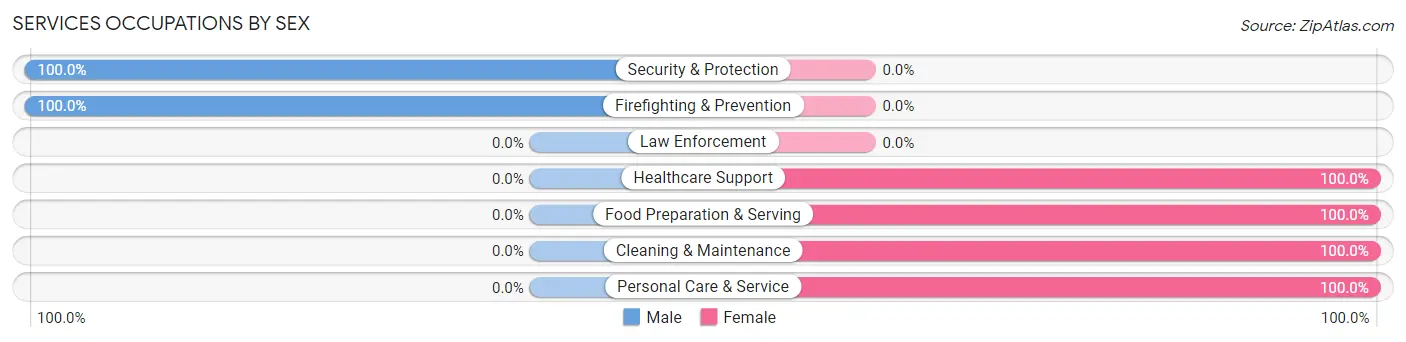
Services Occupations by Sex
Within the Services occupations in Basehor, the most male-oriented occupations are Security & Protection (100.0%), and Firefighting & Prevention (100.0%), while the most female-oriented occupations are Healthcare Support (100.0%), Food Preparation & Serving (100.0%), and Cleaning & Maintenance (100.0%).
| Occupation | Male | Female |
| Healthcare Support | 0 (0.0%) | 49 (100.0%) |
| Security & Protection | 29 (100.0%) | 0 (0.0%) |
| Firefighting & Prevention | 29 (100.0%) | 0 (0.0%) |
| Law Enforcement | 0 (0.0%) | 0 (0.0%) |
| Food Preparation & Serving | 0 (0.0%) | 63 (100.0%) |
| Cleaning & Maintenance | 0 (0.0%) | 13 (100.0%) |
| Personal Care & Service | 0 (0.0%) | 134 (100.0%) |
| Total (Category) | 29 (10.1%) | 259 (89.9%) |
| Total (Overall) | 1,677 (54.1%) | 1,424 (45.9%) |
Sales and Office Occupations
The most common Sales and Office occupations in Basehor are Sales & Related (275 | 8.9%), and Office & Administration (256 | 8.3%).
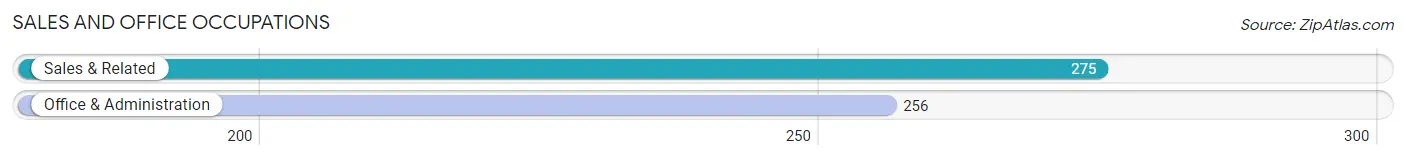
Sales and Office Occupations by Sex

| Occupation | Male | Female |
| Sales & Related | 163 (59.3%) | 112 (40.7%) |
| Office & Administration | 45 (17.6%) | 211 (82.4%) |
| Total (Category) | 208 (39.2%) | 323 (60.8%) |
| Total (Overall) | 1,677 (54.1%) | 1,424 (45.9%) |
Natural Resources, Construction and Maintenance Occupations
The most common Natural Resources, Construction and Maintenance occupations in Basehor are Construction & Extraction (211 | 6.8%), and Installation, Maintenance & Repair (178 | 5.7%).
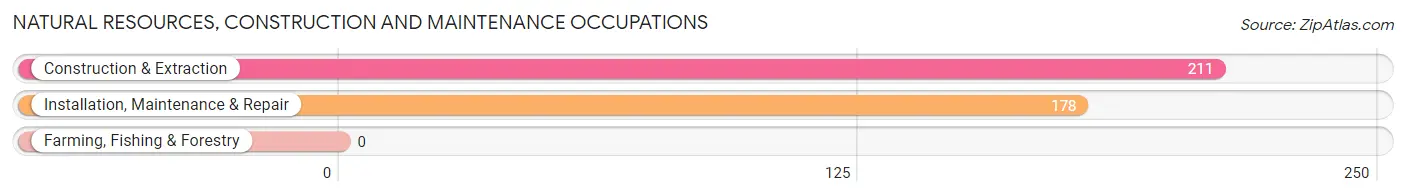
Natural Resources, Construction and Maintenance Occupations by Sex
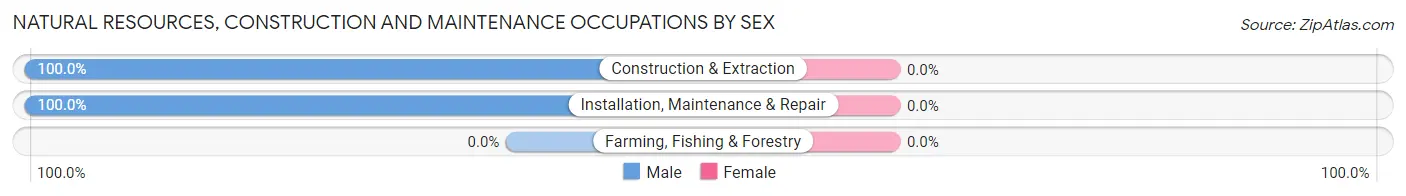
| Occupation | Male | Female |
| Farming, Fishing & Forestry | 0 (0.0%) | 0 (0.0%) |
| Construction & Extraction | 211 (100.0%) | 0 (0.0%) |
| Installation, Maintenance & Repair | 178 (100.0%) | 0 (0.0%) |
| Total (Category) | 389 (100.0%) | 0 (0.0%) |
| Total (Overall) | 1,677 (54.1%) | 1,424 (45.9%) |
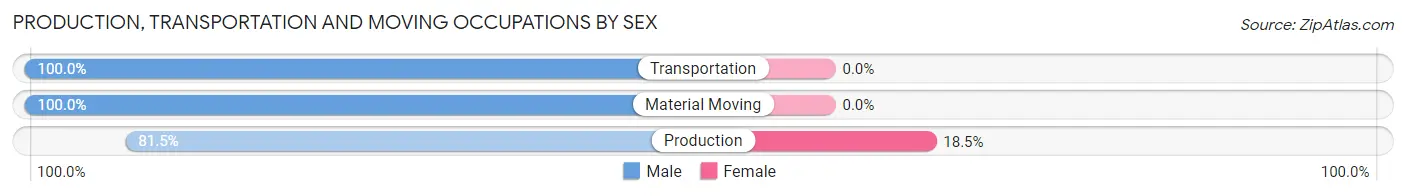
Production, Transportation and Moving Occupations
The most common Production, Transportation and Moving occupations in Basehor are Production (173 | 5.6%), Transportation (123 | 4.0%), and Material Moving (71 | 2.3%).
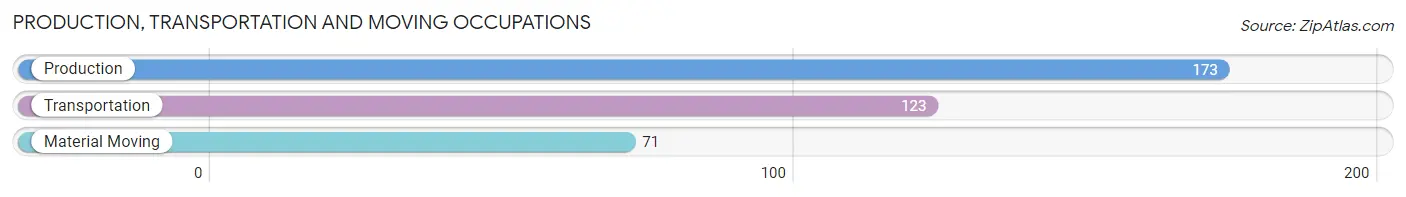
Production, Transportation and Moving Occupations by Sex
| Occupation | Male | Female |
| Production | 141 (81.5%) | 32 (18.5%) |
| Transportation | 123 (100.0%) | 0 (0.0%) |
| Material Moving | 71 (100.0%) | 0 (0.0%) |
| Total (Category) | 335 (91.3%) | 32 (8.7%) |
| Total (Overall) | 1,677 (54.1%) | 1,424 (45.9%) |
Employment Industries by Sex in Basehor
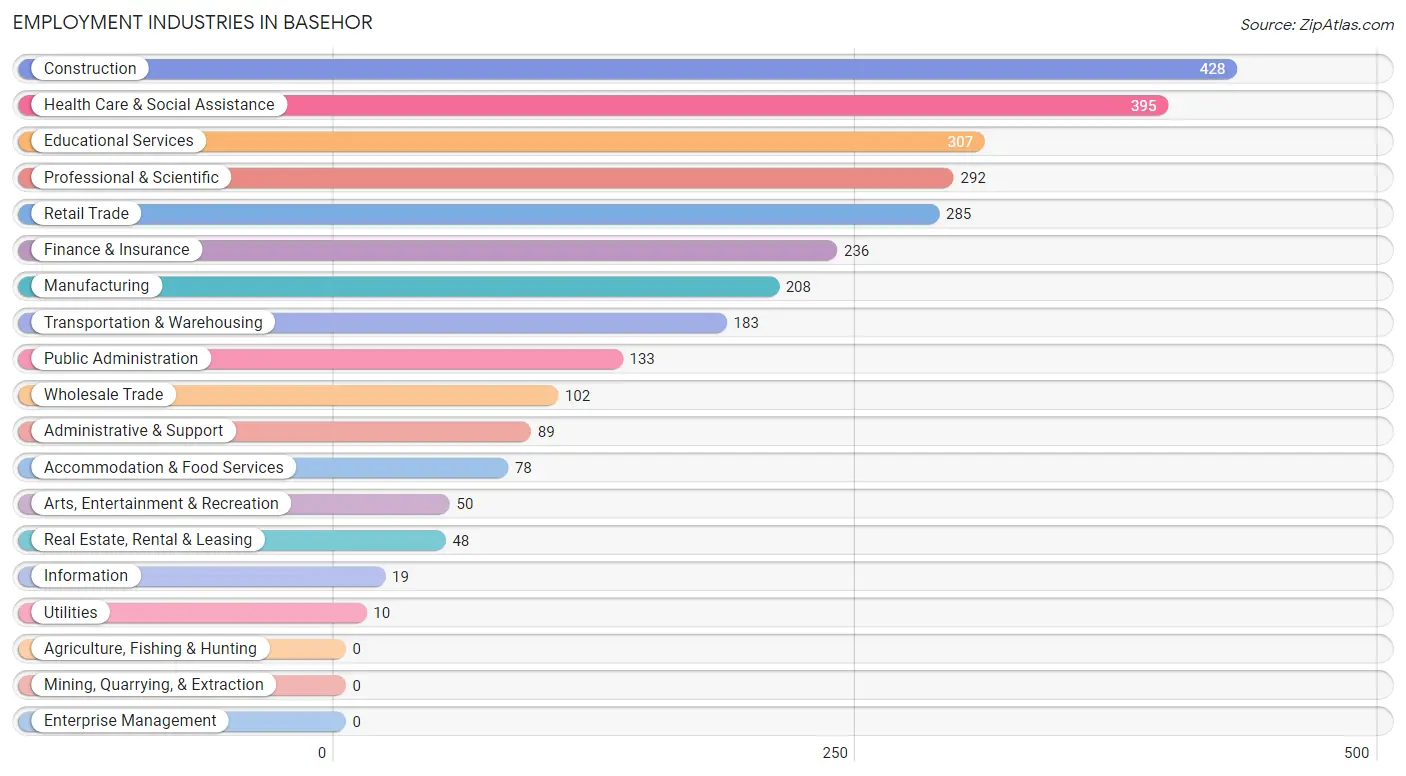
Employment Industries in Basehor
The major employment industries in Basehor include Construction (428 | 13.8%), Health Care & Social Assistance (395 | 12.7%), Educational Services (307 | 9.9%), Professional & Scientific (292 | 9.4%), and Retail Trade (285 | 9.2%).
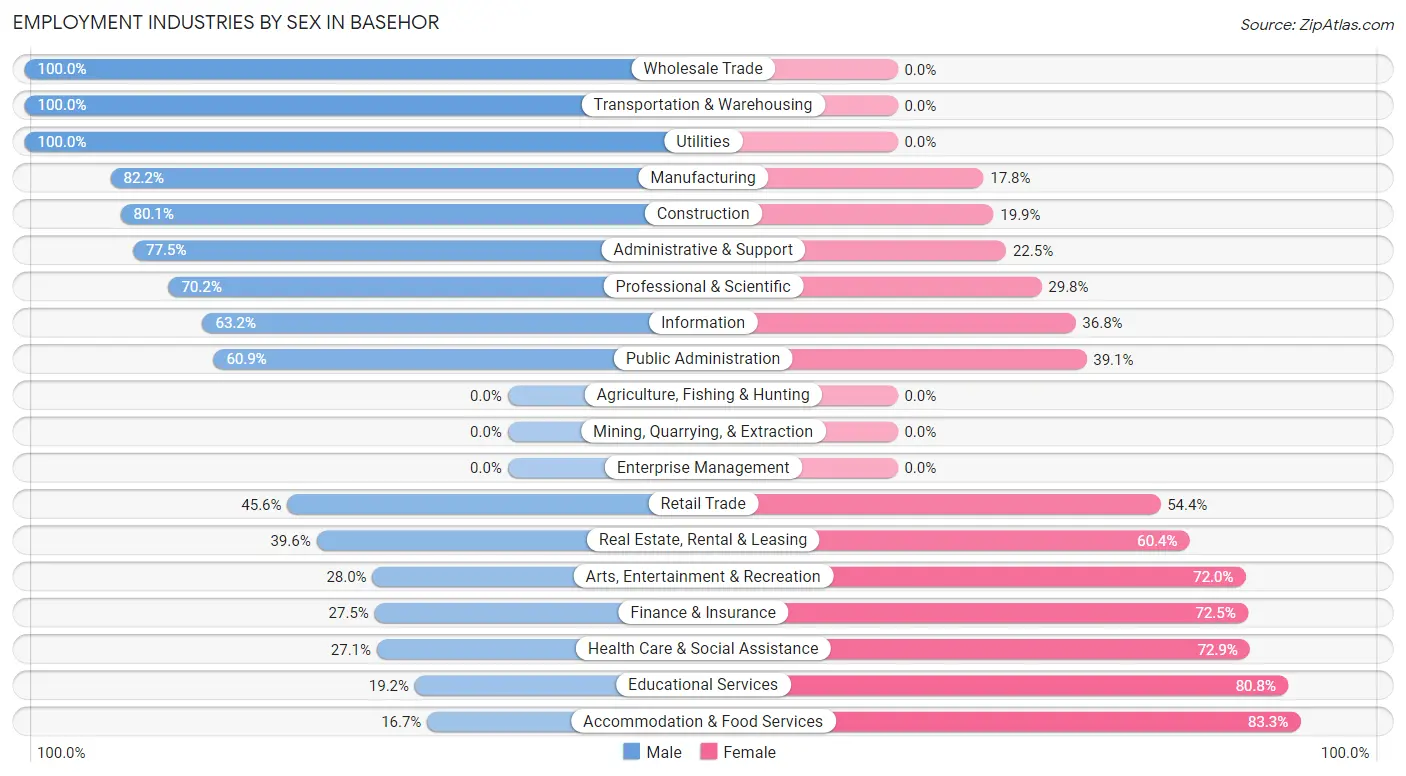
Employment Industries by Sex in Basehor
The Basehor industries that see more men than women are Wholesale Trade (100.0%), Transportation & Warehousing (100.0%), and Utilities (100.0%), whereas the industries that tend to have a higher number of women are Accommodation & Food Services (83.3%), Educational Services (80.8%), and Health Care & Social Assistance (72.9%).
| Industry | Male | Female |
| Agriculture, Fishing & Hunting | 0 (0.0%) | 0 (0.0%) |
| Mining, Quarrying, & Extraction | 0 (0.0%) | 0 (0.0%) |
| Construction | 343 (80.1%) | 85 (19.9%) |
| Manufacturing | 171 (82.2%) | 37 (17.8%) |
| Wholesale Trade | 102 (100.0%) | 0 (0.0%) |
| Retail Trade | 130 (45.6%) | 155 (54.4%) |
| Transportation & Warehousing | 183 (100.0%) | 0 (0.0%) |
| Utilities | 10 (100.0%) | 0 (0.0%) |
| Information | 12 (63.2%) | 7 (36.8%) |
| Finance & Insurance | 65 (27.5%) | 171 (72.5%) |
| Real Estate, Rental & Leasing | 19 (39.6%) | 29 (60.4%) |
| Professional & Scientific | 205 (70.2%) | 87 (29.8%) |
| Enterprise Management | 0 (0.0%) | 0 (0.0%) |
| Administrative & Support | 69 (77.5%) | 20 (22.5%) |
| Educational Services | 59 (19.2%) | 248 (80.8%) |
| Health Care & Social Assistance | 107 (27.1%) | 288 (72.9%) |
| Arts, Entertainment & Recreation | 14 (28.0%) | 36 (72.0%) |
| Accommodation & Food Services | 13 (16.7%) | 65 (83.3%) |
| Public Administration | 81 (60.9%) | 52 (39.1%) |
| Total | 1,677 (54.1%) | 1,424 (45.9%) |
Education in Basehor
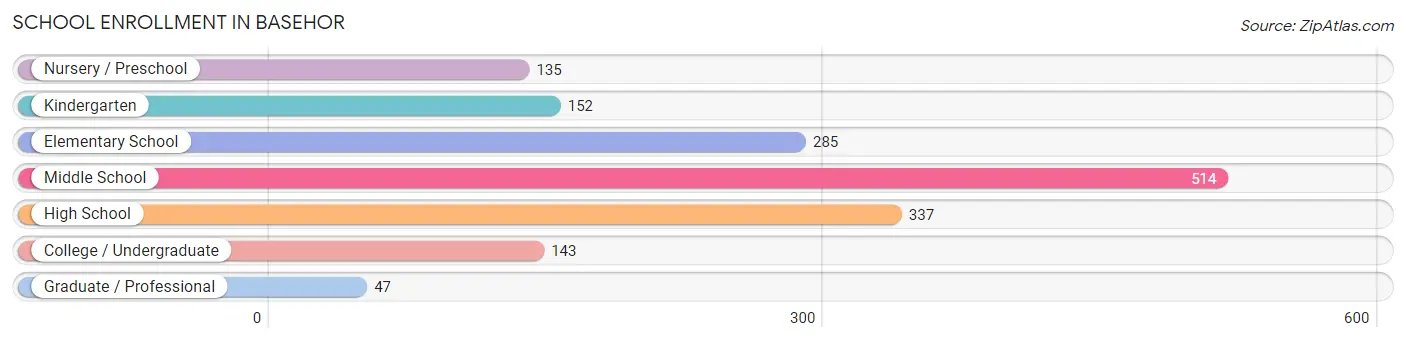
School Enrollment in Basehor
The most common levels of schooling among the 1,613 students in Basehor are middle school (514 | 31.9%), high school (337 | 20.9%), and elementary school (285 | 17.7%).
| School Level | # Students | % Students |
| Nursery / Preschool | 135 | 8.4% |
| Kindergarten | 152 | 9.4% |
| Elementary School | 285 | 17.7% |
| Middle School | 514 | 31.9% |
| High School | 337 | 20.9% |
| College / Undergraduate | 143 | 8.9% |
| Graduate / Professional | 47 | 2.9% |
| Total | 1,613 | 100.0% |
School Enrollment by Age by Funding Source in Basehor
Out of a total of 1,613 students who are enrolled in schools in Basehor, 139 (8.6%) attend a private institution, while the remaining 1,474 (91.4%) are enrolled in public schools. The age group of 20 to 24 year olds has the highest likelihood of being enrolled in private schools, with 14 (34.2% in the age bracket) enrolled. Conversely, the age group of 15 to 17 year olds has the lowest likelihood of being enrolled in a private school, with 268 (100.0% in the age bracket) attending a public institution.
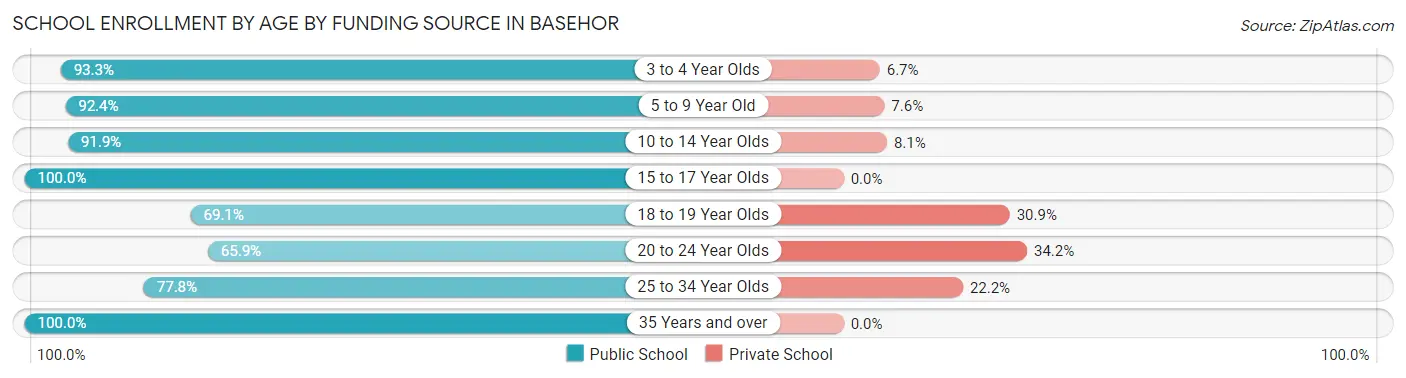
| Age Bracket | Public School | Private School |
| 3 to 4 Year Olds | 97 (93.3%) | 7 (6.7%) |
| 5 to 9 Year Old | 402 (92.4%) | 33 (7.6%) |
| 10 to 14 Year Olds | 524 (91.9%) | 46 (8.1%) |
| 15 to 17 Year Olds | 268 (100.0%) | 0 (0.0%) |
| 18 to 19 Year Olds | 67 (69.1%) | 30 (30.9%) |
| 20 to 24 Year Olds | 27 (65.8%) | 14 (34.2%) |
| 25 to 34 Year Olds | 28 (77.8%) | 8 (22.2%) |
| 35 Years and over | 62 (100.0%) | 0 (0.0%) |
| Total | 1,474 (91.4%) | 139 (8.6%) |
Educational Attainment by Field of Study in Basehor
Business (407 | 21.8%), science & technology (293 | 15.7%), education (280 | 15.0%), arts & humanities (191 | 10.2%), and computers & mathematics (154 | 8.3%) are the most common fields of study among 1,863 individuals in Basehor who have obtained a bachelor's degree or higher.
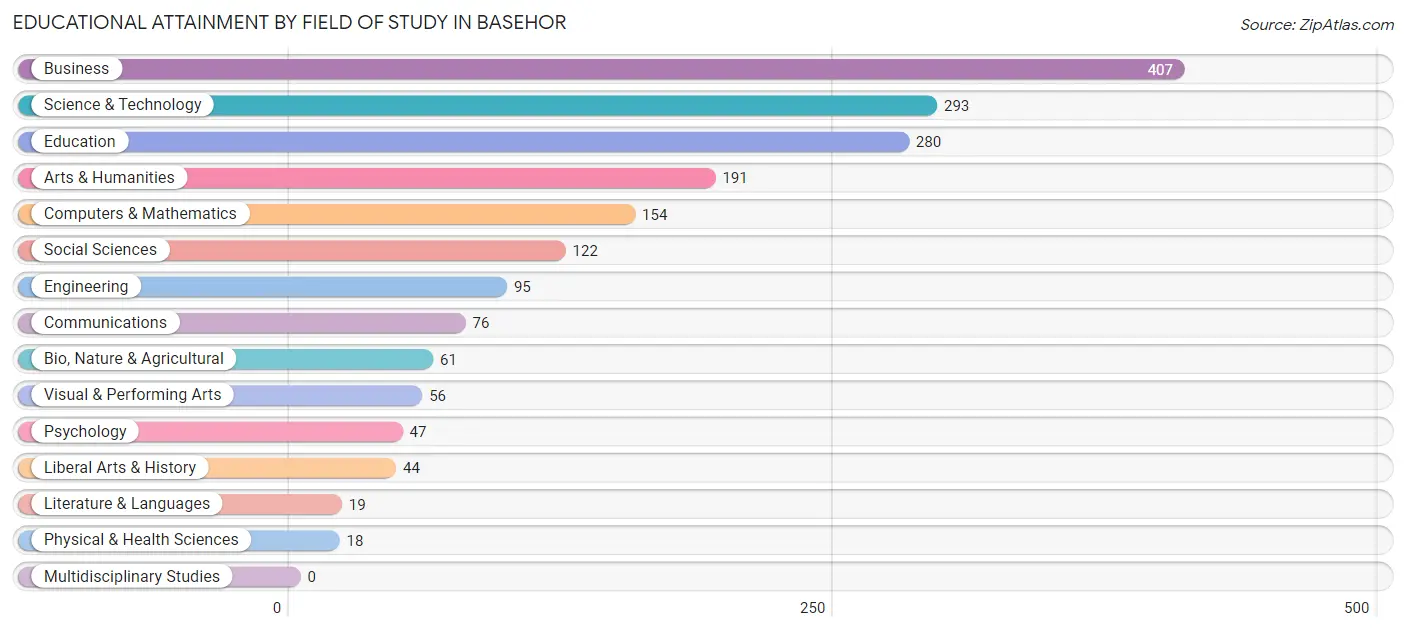
| Field of Study | # Graduates | % Graduates |
| Computers & Mathematics | 154 | 8.3% |
| Bio, Nature & Agricultural | 61 | 3.3% |
| Physical & Health Sciences | 18 | 1.0% |
| Psychology | 47 | 2.5% |
| Social Sciences | 122 | 6.6% |
| Engineering | 95 | 5.1% |
| Multidisciplinary Studies | 0 | 0.0% |
| Science & Technology | 293 | 15.7% |
| Business | 407 | 21.8% |
| Education | 280 | 15.0% |
| Literature & Languages | 19 | 1.0% |
| Liberal Arts & History | 44 | 2.4% |
| Visual & Performing Arts | 56 | 3.0% |
| Communications | 76 | 4.1% |
| Arts & Humanities | 191 | 10.2% |
| Total | 1,863 | 100.0% |
Transportation & Commute in Basehor
Vehicle Availability by Sex in Basehor
The most prevalent vehicle ownership categories in Basehor are males with 2 vehicles (903, accounting for 54.8%) and females with 2 vehicles (716, making up 65.2%).
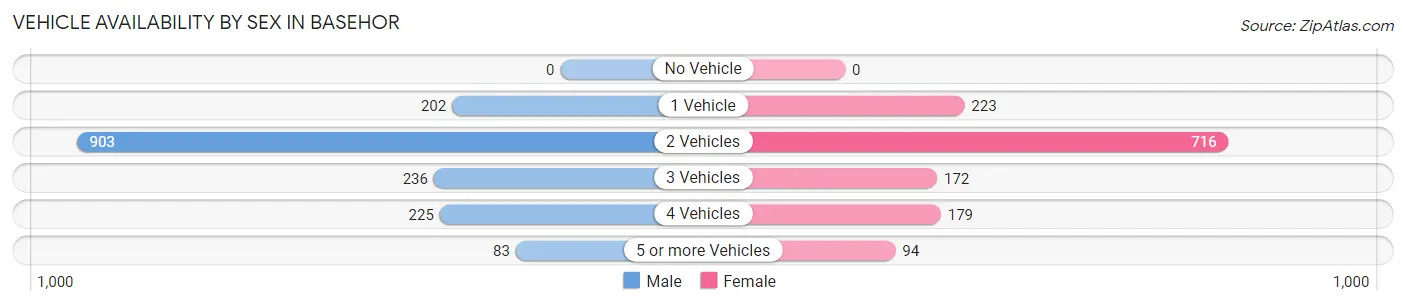
| Vehicles Available | Male | Female |
| No Vehicle | 0 (0.0%) | 0 (0.0%) |
| 1 Vehicle | 202 (12.2%) | 223 (16.1%) |
| 2 Vehicles | 903 (54.8%) | 716 (51.7%) |
| 3 Vehicles | 236 (14.3%) | 172 (12.4%) |
| 4 Vehicles | 225 (13.6%) | 179 (12.9%) |
| 5 or more Vehicles | 83 (5.0%) | 94 (6.8%) |
| Total | 1,649 (100.0%) | 1,384 (100.0%) |
Commute Time in Basehor
The most frequently occuring commute durations in Basehor are 30 to 34 minutes (663 commuters, 24.3%), 20 to 24 minutes (499 commuters, 18.3%), and 25 to 29 minutes (400 commuters, 14.7%).
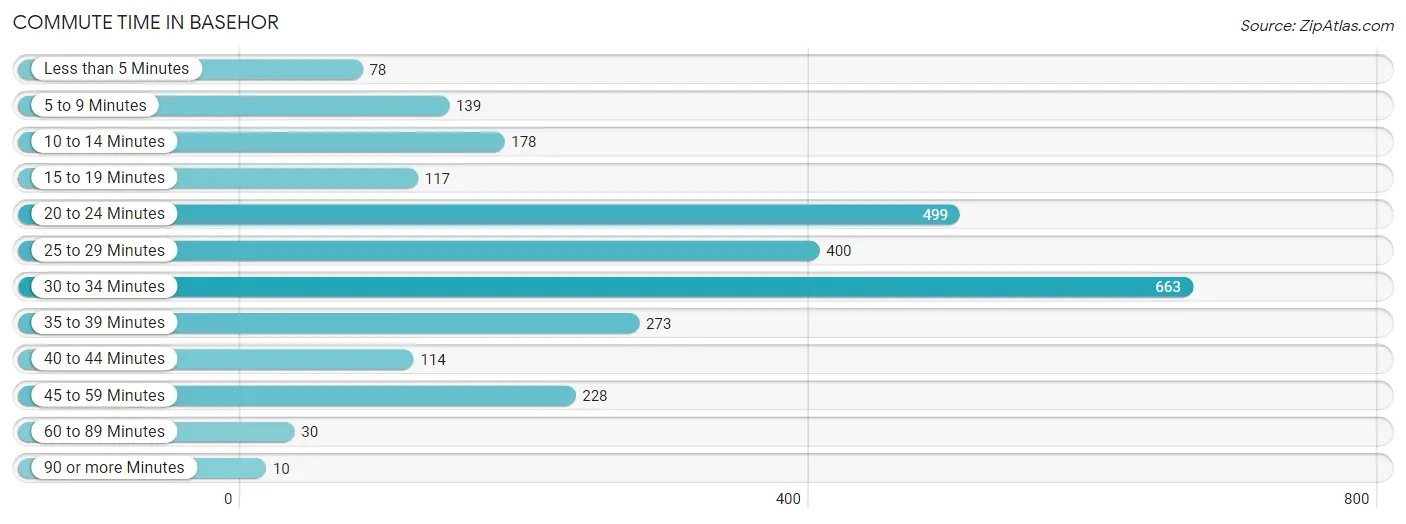
| Commute Time | # Commuters | % Commuters |
| Less than 5 Minutes | 78 | 2.9% |
| 5 to 9 Minutes | 139 | 5.1% |
| 10 to 14 Minutes | 178 | 6.5% |
| 15 to 19 Minutes | 117 | 4.3% |
| 20 to 24 Minutes | 499 | 18.3% |
| 25 to 29 Minutes | 400 | 14.7% |
| 30 to 34 Minutes | 663 | 24.3% |
| 35 to 39 Minutes | 273 | 10.0% |
| 40 to 44 Minutes | 114 | 4.2% |
| 45 to 59 Minutes | 228 | 8.4% |
| 60 to 89 Minutes | 30 | 1.1% |
| 90 or more Minutes | 10 | 0.4% |
Commute Time by Sex in Basehor
The most common commute times in Basehor are 30 to 34 minutes (294 commuters, 20.5%) for males and 30 to 34 minutes (369 commuters, 28.4%) for females.
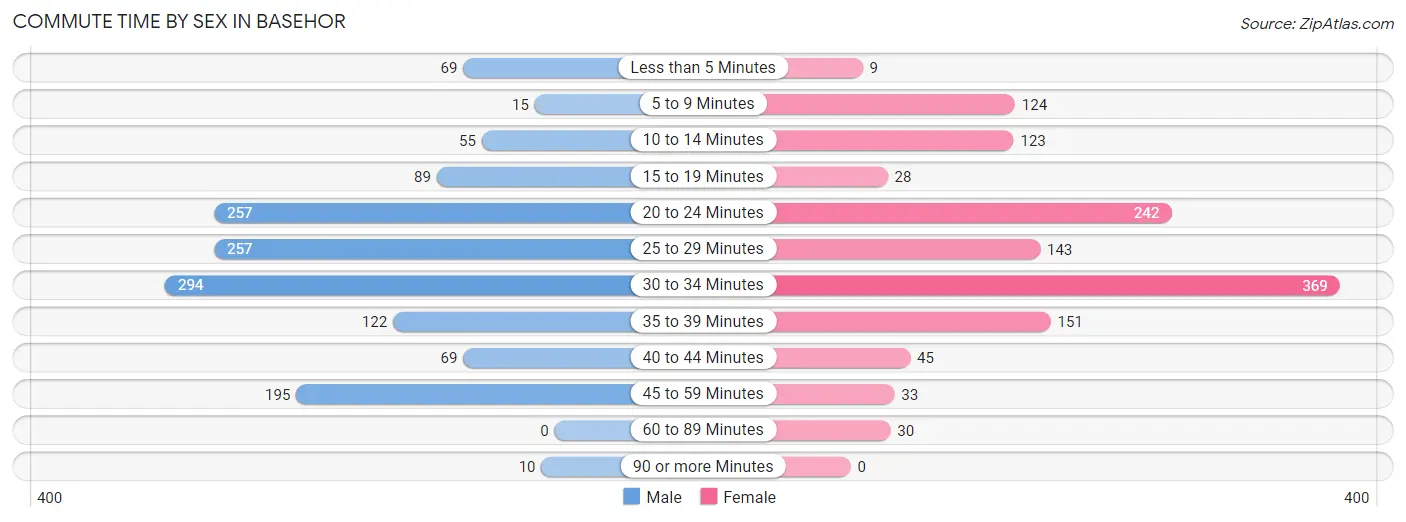
| Commute Time | Male | Female |
| Less than 5 Minutes | 69 (4.8%) | 9 (0.7%) |
| 5 to 9 Minutes | 15 (1.1%) | 124 (9.6%) |
| 10 to 14 Minutes | 55 (3.8%) | 123 (9.5%) |
| 15 to 19 Minutes | 89 (6.2%) | 28 (2.2%) |
| 20 to 24 Minutes | 257 (17.9%) | 242 (18.7%) |
| 25 to 29 Minutes | 257 (17.9%) | 143 (11.0%) |
| 30 to 34 Minutes | 294 (20.5%) | 369 (28.4%) |
| 35 to 39 Minutes | 122 (8.5%) | 151 (11.6%) |
| 40 to 44 Minutes | 69 (4.8%) | 45 (3.5%) |
| 45 to 59 Minutes | 195 (13.6%) | 33 (2.5%) |
| 60 to 89 Minutes | 0 (0.0%) | 30 (2.3%) |
| 90 or more Minutes | 10 (0.7%) | 0 (0.0%) |
Time of Departure to Work by Sex in Basehor
The most frequent times of departure to work in Basehor are 6:30 AM to 6:59 AM (290, 20.3%) for males and 7:00 AM to 7:29 AM (243, 18.7%) for females.
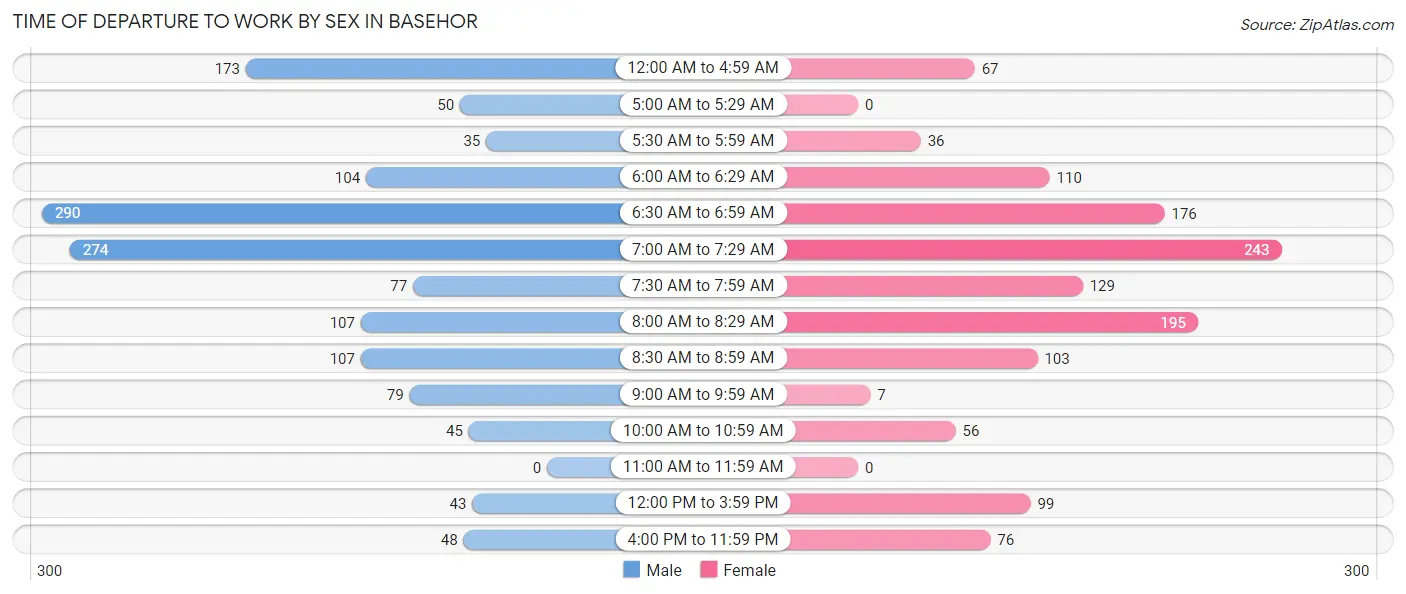
| Time of Departure | Male | Female |
| 12:00 AM to 4:59 AM | 173 (12.1%) | 67 (5.2%) |
| 5:00 AM to 5:29 AM | 50 (3.5%) | 0 (0.0%) |
| 5:30 AM to 5:59 AM | 35 (2.4%) | 36 (2.8%) |
| 6:00 AM to 6:29 AM | 104 (7.3%) | 110 (8.5%) |
| 6:30 AM to 6:59 AM | 290 (20.3%) | 176 (13.6%) |
| 7:00 AM to 7:29 AM | 274 (19.1%) | 243 (18.7%) |
| 7:30 AM to 7:59 AM | 77 (5.4%) | 129 (10.0%) |
| 8:00 AM to 8:29 AM | 107 (7.5%) | 195 (15.0%) |
| 8:30 AM to 8:59 AM | 107 (7.5%) | 103 (7.9%) |
| 9:00 AM to 9:59 AM | 79 (5.5%) | 7 (0.5%) |
| 10:00 AM to 10:59 AM | 45 (3.1%) | 56 (4.3%) |
| 11:00 AM to 11:59 AM | 0 (0.0%) | 0 (0.0%) |
| 12:00 PM to 3:59 PM | 43 (3.0%) | 99 (7.6%) |
| 4:00 PM to 11:59 PM | 48 (3.4%) | 76 (5.9%) |
| Total | 1,432 (100.0%) | 1,297 (100.0%) |
Housing Occupancy in Basehor
Occupancy by Ownership in Basehor
Of the total 2,621 dwellings in Basehor, owner-occupied units account for 1,968 (75.1%), while renter-occupied units make up 653 (24.9%).
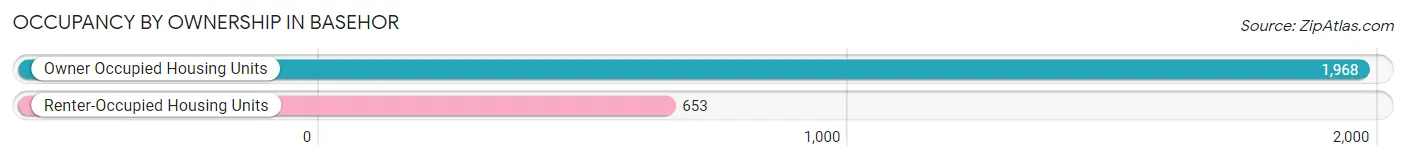
| Occupancy | # Housing Units | % Housing Units |
| Owner Occupied Housing Units | 1,968 | 75.1% |
| Renter-Occupied Housing Units | 653 | 24.9% |
| Total Occupied Housing Units | 2,621 | 100.0% |
Occupancy by Household Size in Basehor
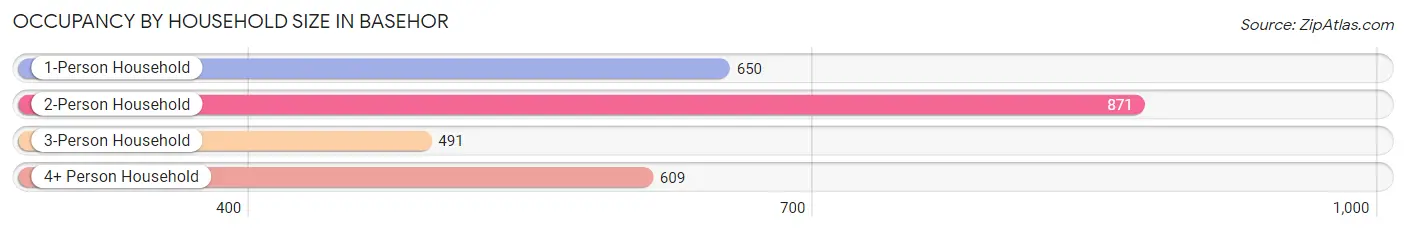
| Household Size | # Housing Units | % Housing Units |
| 1-Person Household | 650 | 24.8% |
| 2-Person Household | 871 | 33.2% |
| 3-Person Household | 491 | 18.7% |
| 4+ Person Household | 609 | 23.2% |
| Total Housing Units | 2,621 | 100.0% |
Occupancy by Ownership by Household Size in Basehor
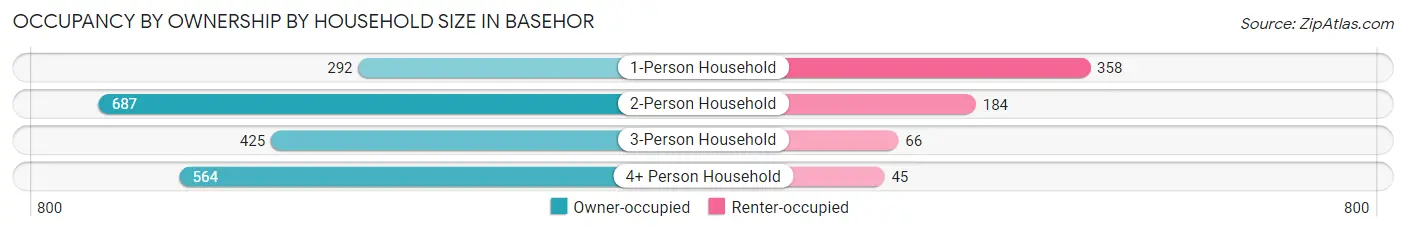
| Household Size | Owner-occupied | Renter-occupied |
| 1-Person Household | 292 (44.9%) | 358 (55.1%) |
| 2-Person Household | 687 (78.9%) | 184 (21.1%) |
| 3-Person Household | 425 (86.6%) | 66 (13.4%) |
| 4+ Person Household | 564 (92.6%) | 45 (7.4%) |
| Total Housing Units | 1,968 (75.1%) | 653 (24.9%) |
Occupancy by Educational Attainment in Basehor
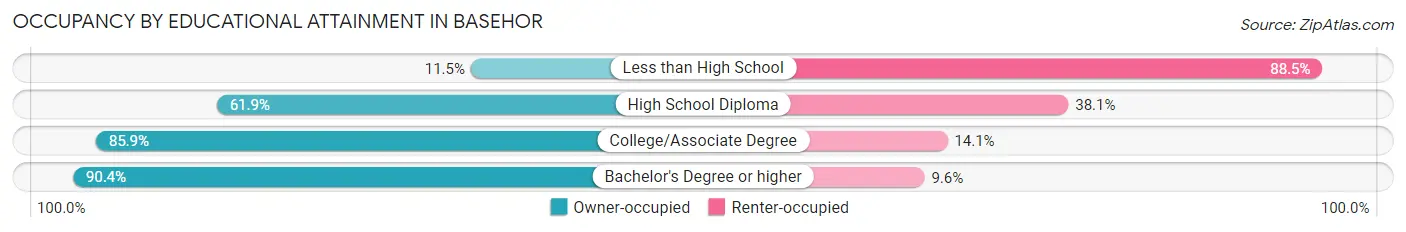
| Household Size | Owner-occupied | Renter-occupied |
| Less than High School | 15 (11.5%) | 115 (88.5%) |
| High School Diploma | 595 (61.9%) | 366 (38.1%) |
| College/Associate Degree | 480 (85.9%) | 79 (14.1%) |
| Bachelor's Degree or higher | 878 (90.4%) | 93 (9.6%) |
Occupancy by Age of Householder in Basehor
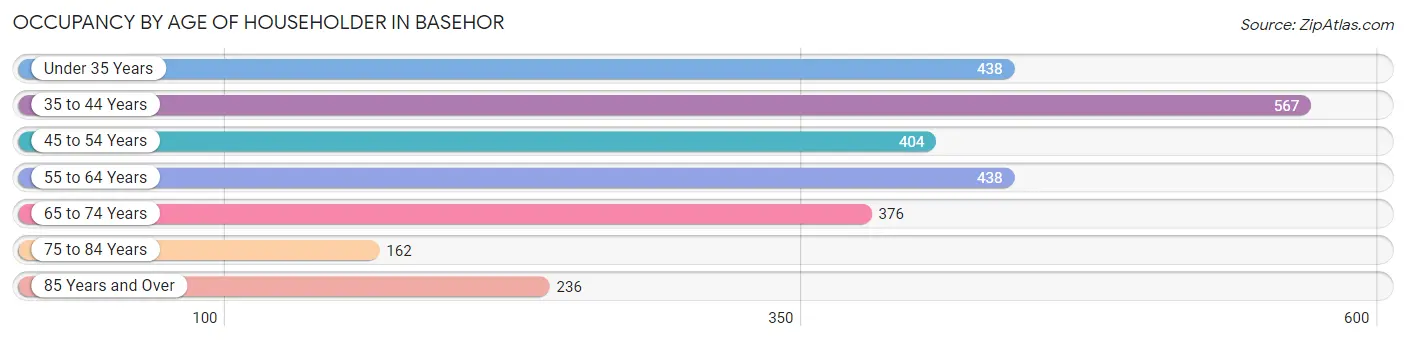
| Age Bracket | # Households | % Households |
| Under 35 Years | 438 | 16.7% |
| 35 to 44 Years | 567 | 21.6% |
| 45 to 54 Years | 404 | 15.4% |
| 55 to 64 Years | 438 | 16.7% |
| 65 to 74 Years | 376 | 14.3% |
| 75 to 84 Years | 162 | 6.2% |
| 85 Years and Over | 236 | 9.0% |
| Total | 2,621 | 100.0% |
Housing Finances in Basehor
Median Income by Occupancy in Basehor
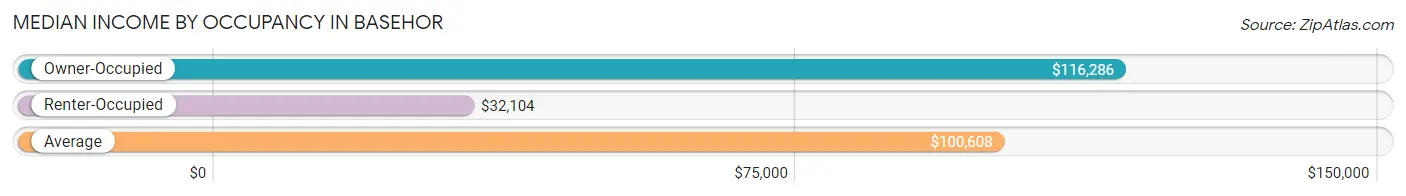
| Occupancy Type | # Households | Median Income |
| Owner-Occupied | 1,968 (75.1%) | $116,286 |
| Renter-Occupied | 653 (24.9%) | $32,104 |
| Average | 2,621 (100.0%) | $100,608 |
Occupancy by Householder Income Bracket in Basehor
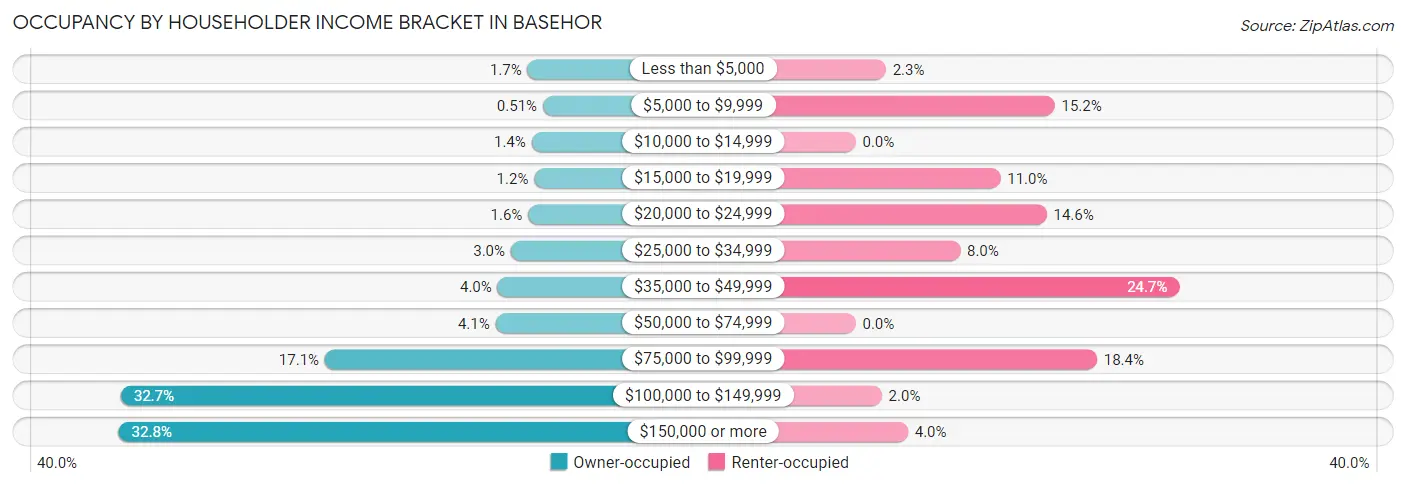
| Income Bracket | Owner-occupied | Renter-occupied |
| Less than $5,000 | 33 (1.7%) | 15 (2.3%) |
| $5,000 to $9,999 | 10 (0.5%) | 99 (15.2%) |
| $10,000 to $14,999 | 27 (1.4%) | 0 (0.0%) |
| $15,000 to $19,999 | 23 (1.2%) | 72 (11.0%) |
| $20,000 to $24,999 | 32 (1.6%) | 95 (14.5%) |
| $25,000 to $34,999 | 58 (2.9%) | 52 (8.0%) |
| $35,000 to $49,999 | 78 (4.0%) | 161 (24.7%) |
| $50,000 to $74,999 | 81 (4.1%) | 0 (0.0%) |
| $75,000 to $99,999 | 337 (17.1%) | 120 (18.4%) |
| $100,000 to $149,999 | 643 (32.7%) | 13 (2.0%) |
| $150,000 or more | 646 (32.8%) | 26 (4.0%) |
| Total | 1,968 (100.0%) | 653 (100.0%) |
Monthly Housing Cost Tiers in Basehor
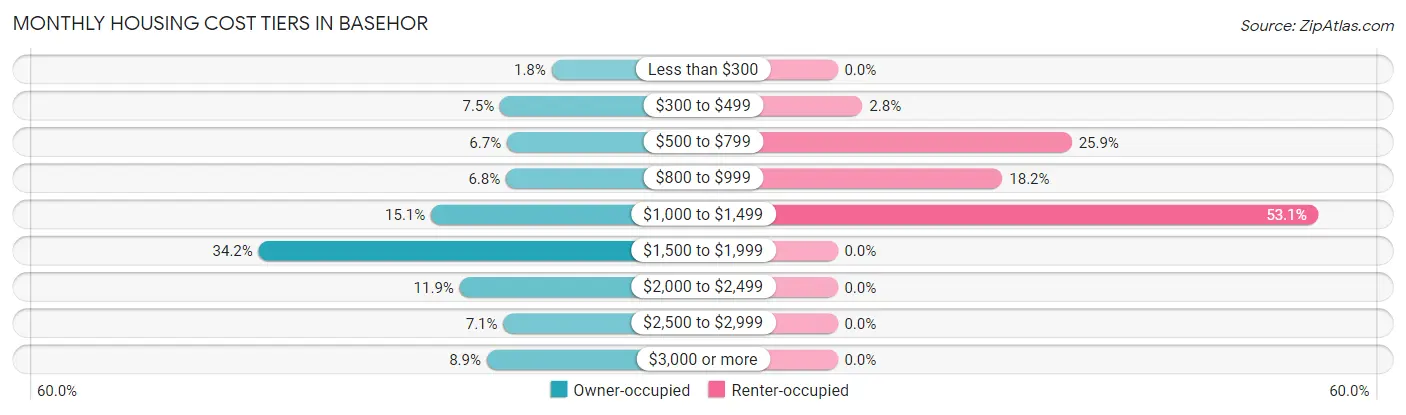
| Monthly Cost | Owner-occupied | Renter-occupied |
| Less than $300 | 35 (1.8%) | 0 (0.0%) |
| $300 to $499 | 147 (7.5%) | 18 (2.8%) |
| $500 to $799 | 132 (6.7%) | 169 (25.9%) |
| $800 to $999 | 134 (6.8%) | 119 (18.2%) |
| $1,000 to $1,499 | 297 (15.1%) | 347 (53.1%) |
| $1,500 to $1,999 | 672 (34.2%) | 0 (0.0%) |
| $2,000 to $2,499 | 235 (11.9%) | 0 (0.0%) |
| $2,500 to $2,999 | 140 (7.1%) | 0 (0.0%) |
| $3,000 or more | 176 (8.9%) | 0 (0.0%) |
| Total | 1,968 (100.0%) | 653 (100.0%) |
Physical Housing Characteristics in Basehor
Housing Structures in Basehor
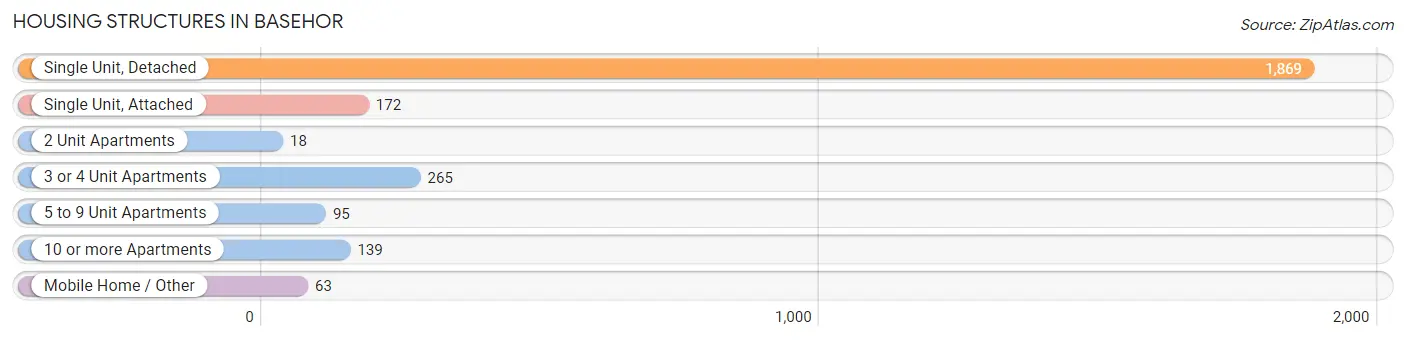
| Structure Type | # Housing Units | % Housing Units |
| Single Unit, Detached | 1,869 | 71.3% |
| Single Unit, Attached | 172 | 6.6% |
| 2 Unit Apartments | 18 | 0.7% |
| 3 or 4 Unit Apartments | 265 | 10.1% |
| 5 to 9 Unit Apartments | 95 | 3.6% |
| 10 or more Apartments | 139 | 5.3% |
| Mobile Home / Other | 63 | 2.4% |
| Total | 2,621 | 100.0% |
Housing Structures by Occupancy in Basehor
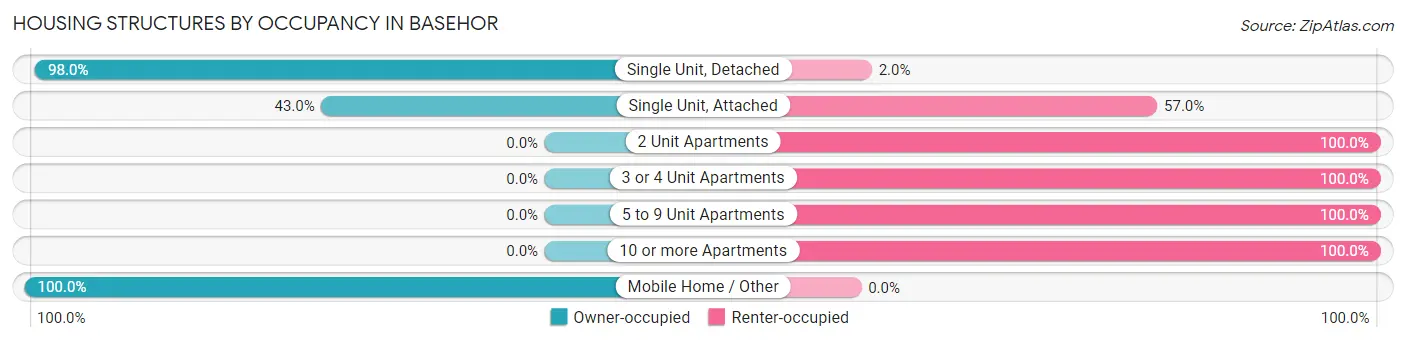
| Structure Type | Owner-occupied | Renter-occupied |
| Single Unit, Detached | 1,831 (98.0%) | 38 (2.0%) |
| Single Unit, Attached | 74 (43.0%) | 98 (57.0%) |
| 2 Unit Apartments | 0 (0.0%) | 18 (100.0%) |
| 3 or 4 Unit Apartments | 0 (0.0%) | 265 (100.0%) |
| 5 to 9 Unit Apartments | 0 (0.0%) | 95 (100.0%) |
| 10 or more Apartments | 0 (0.0%) | 139 (100.0%) |
| Mobile Home / Other | 63 (100.0%) | 0 (0.0%) |
| Total | 1,968 (75.1%) | 653 (24.9%) |
Housing Structures by Number of Rooms in Basehor
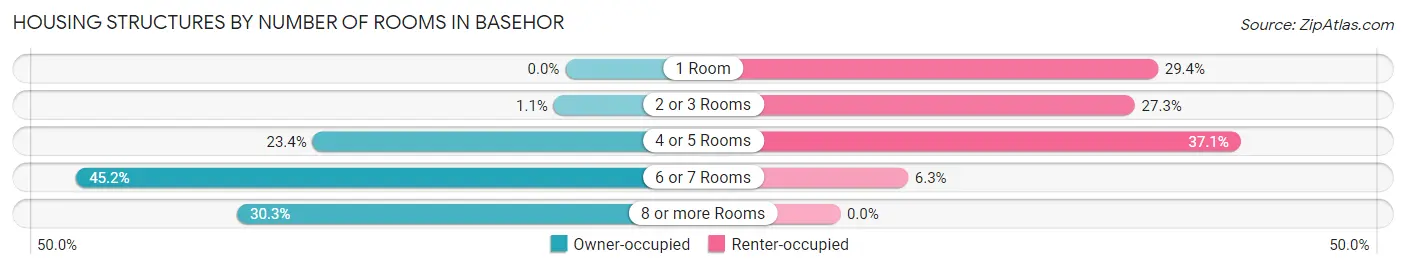
| Number of Rooms | Owner-occupied | Renter-occupied |
| 1 Room | 0 (0.0%) | 192 (29.4%) |
| 2 or 3 Rooms | 21 (1.1%) | 178 (27.3%) |
| 4 or 5 Rooms | 460 (23.4%) | 242 (37.1%) |
| 6 or 7 Rooms | 890 (45.2%) | 41 (6.3%) |
| 8 or more Rooms | 597 (30.3%) | 0 (0.0%) |
| Total | 1,968 (100.0%) | 653 (100.0%) |
Housing Structure by Heating Type in Basehor
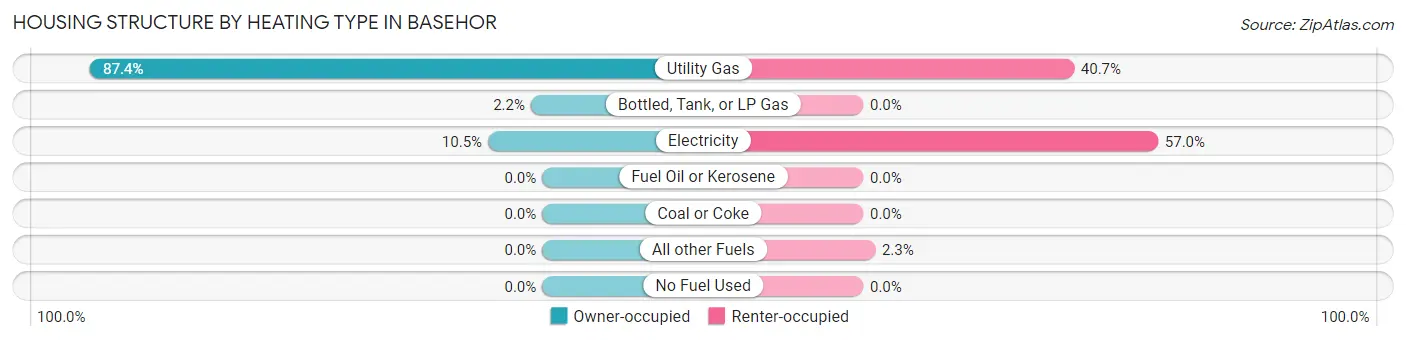
| Heating Type | Owner-occupied | Renter-occupied |
| Utility Gas | 1,719 (87.4%) | 266 (40.7%) |
| Bottled, Tank, or LP Gas | 43 (2.2%) | 0 (0.0%) |
| Electricity | 206 (10.5%) | 372 (57.0%) |
| Fuel Oil or Kerosene | 0 (0.0%) | 0 (0.0%) |
| Coal or Coke | 0 (0.0%) | 0 (0.0%) |
| All other Fuels | 0 (0.0%) | 15 (2.3%) |
| No Fuel Used | 0 (0.0%) | 0 (0.0%) |
| Total | 1,968 (100.0%) | 653 (100.0%) |
Household Vehicle Usage in Basehor
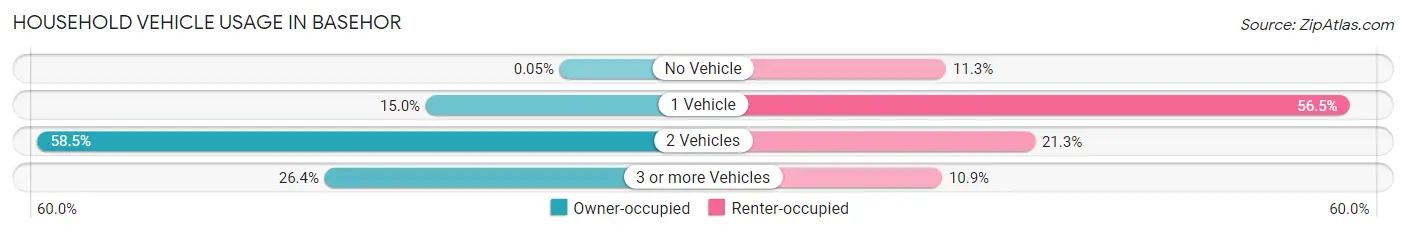
| Vehicles per Household | Owner-occupied | Renter-occupied |
| No Vehicle | 1 (0.1%) | 74 (11.3%) |
| 1 Vehicle | 296 (15.0%) | 369 (56.5%) |
| 2 Vehicles | 1,152 (58.5%) | 139 (21.3%) |
| 3 or more Vehicles | 519 (26.4%) | 71 (10.9%) |
| Total | 1,968 (100.0%) | 653 (100.0%) |
Real Estate & Mortgages in Basehor
Real Estate and Mortgage Overview in Basehor
| Characteristic | Without Mortgage | With Mortgage |
| Housing Units | 574 | 1,394 |
| Median Property Value | $278,700 | $287,600 |
| Median Household Income | $98,824 | $535 |
| Monthly Housing Costs | $759 | $176 |
| Real Estate Taxes | $3,989 | $0 |
Property Value by Mortgage Status in Basehor
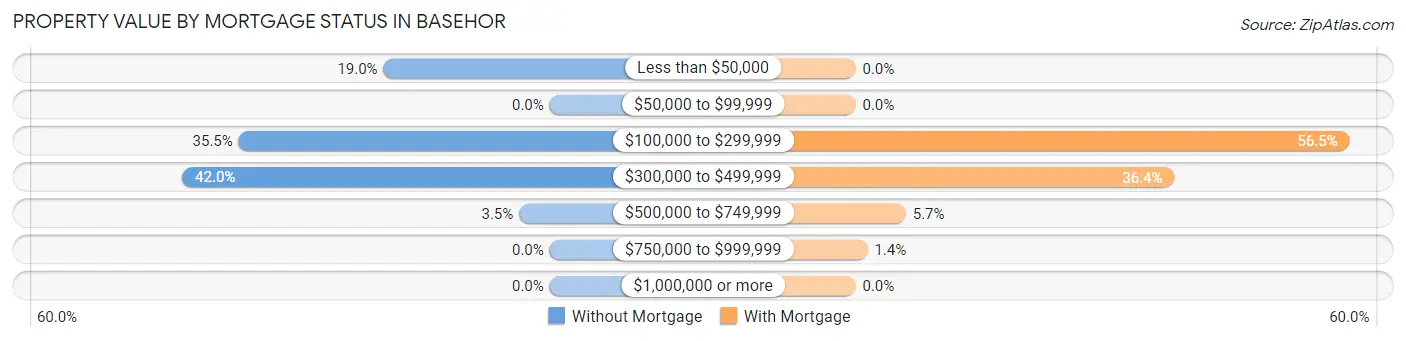
| Property Value | Without Mortgage | With Mortgage |
| Less than $50,000 | 109 (19.0%) | 0 (0.0%) |
| $50,000 to $99,999 | 0 (0.0%) | 0 (0.0%) |
| $100,000 to $299,999 | 204 (35.5%) | 787 (56.5%) |
| $300,000 to $499,999 | 241 (42.0%) | 508 (36.4%) |
| $500,000 to $749,999 | 20 (3.5%) | 80 (5.7%) |
| $750,000 to $999,999 | 0 (0.0%) | 19 (1.4%) |
| $1,000,000 or more | 0 (0.0%) | 0 (0.0%) |
| Total | 574 (100.0%) | 1,394 (100.0%) |
Household Income by Mortgage Status in Basehor
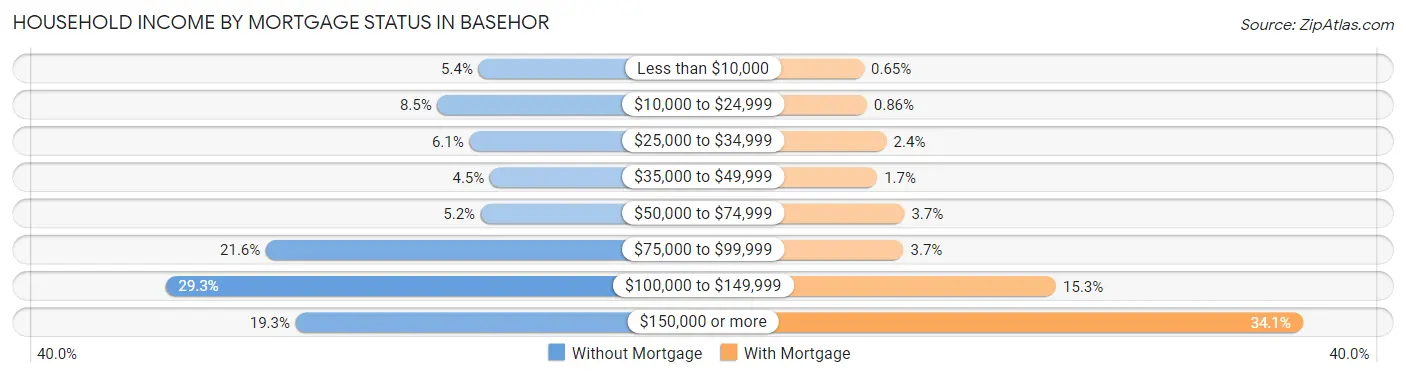
| Household Income | Without Mortgage | With Mortgage |
| Less than $10,000 | 31 (5.4%) | 9 (0.6%) |
| $10,000 to $24,999 | 49 (8.5%) | 12 (0.9%) |
| $25,000 to $34,999 | 35 (6.1%) | 33 (2.4%) |
| $35,000 to $49,999 | 26 (4.5%) | 23 (1.7%) |
| $50,000 to $74,999 | 30 (5.2%) | 52 (3.7%) |
| $75,000 to $99,999 | 124 (21.6%) | 51 (3.7%) |
| $100,000 to $149,999 | 168 (29.3%) | 213 (15.3%) |
| $150,000 or more | 111 (19.3%) | 475 (34.1%) |
| Total | 574 (100.0%) | 1,394 (100.0%) |
Property Value to Household Income Ratio in Basehor
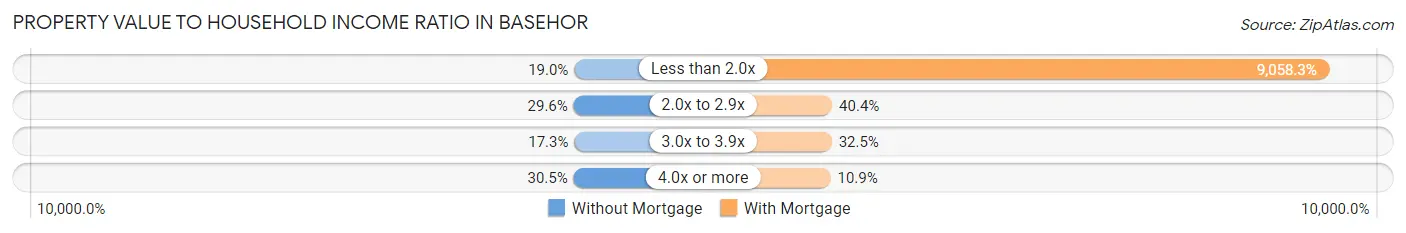
| Value-to-Income Ratio | Without Mortgage | With Mortgage |
| Less than 2.0x | 109 (19.0%) | 126,273 (9,058.3%) |
| 2.0x to 2.9x | 170 (29.6%) | 563 (40.4%) |
| 3.0x to 3.9x | 99 (17.2%) | 453 (32.5%) |
| 4.0x or more | 175 (30.5%) | 152 (10.9%) |
| Total | 574 (100.0%) | 1,394 (100.0%) |
Real Estate Taxes by Mortgage Status in Basehor
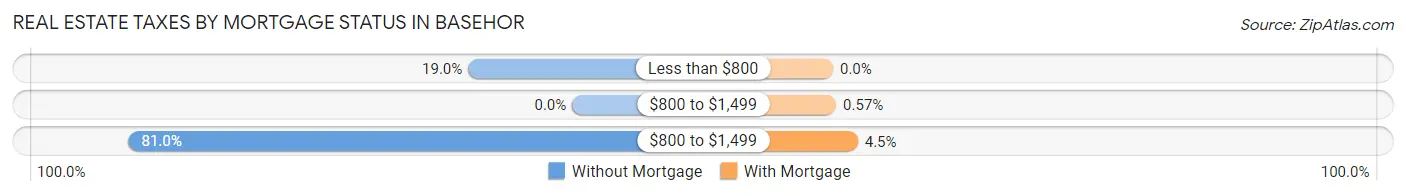
| Property Taxes | Without Mortgage | With Mortgage |
| Less than $800 | 109 (19.0%) | 0 (0.0%) |
| $800 to $1,499 | 0 (0.0%) | 8 (0.6%) |
| $800 to $1,499 | 465 (81.0%) | 63 (4.5%) |
| Total | 574 (100.0%) | 1,394 (100.0%) |
Health & Disability in Basehor
Health Insurance Coverage by Age in Basehor
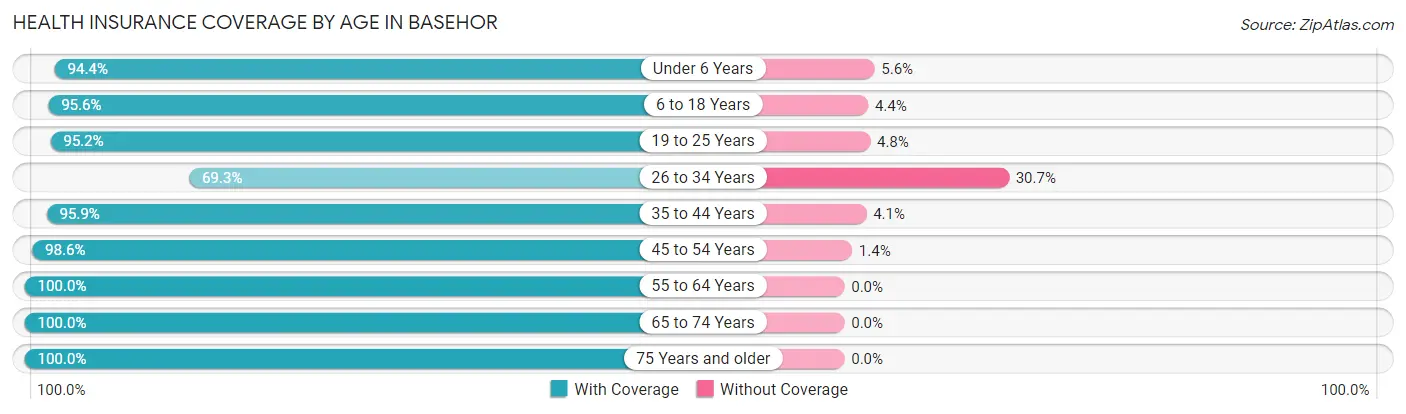
| Age Bracket | With Coverage | Without Coverage |
| Under 6 Years | 455 (94.4%) | 27 (5.6%) |
| 6 to 18 Years | 1,256 (95.6%) | 58 (4.4%) |
| 19 to 25 Years | 476 (95.2%) | 24 (4.8%) |
| 26 to 34 Years | 561 (69.3%) | 248 (30.7%) |
| 35 to 44 Years | 987 (95.9%) | 42 (4.1%) |
| 45 to 54 Years | 832 (98.6%) | 12 (1.4%) |
| 55 to 64 Years | 820 (100.0%) | 0 (0.0%) |
| 65 to 74 Years | 540 (100.0%) | 0 (0.0%) |
| 75 Years and older | 627 (100.0%) | 0 (0.0%) |
| Total | 6,554 (94.1%) | 411 (5.9%) |
Health Insurance Coverage by Citizenship Status in Basehor
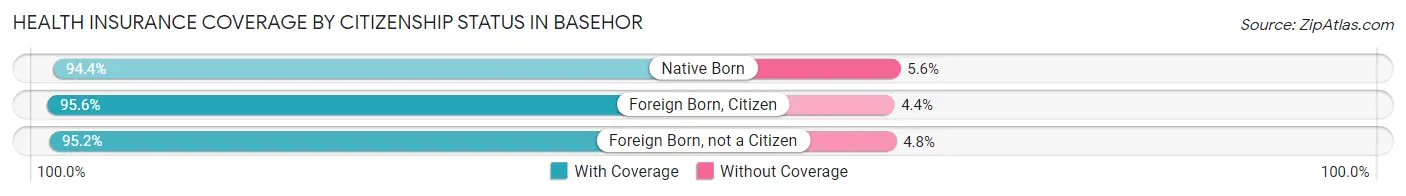
| Citizenship Status | With Coverage | Without Coverage |
| Native Born | 455 (94.4%) | 27 (5.6%) |
| Foreign Born, Citizen | 1,256 (95.6%) | 58 (4.4%) |
| Foreign Born, not a Citizen | 476 (95.2%) | 24 (4.8%) |
Health Insurance Coverage by Household Income in Basehor
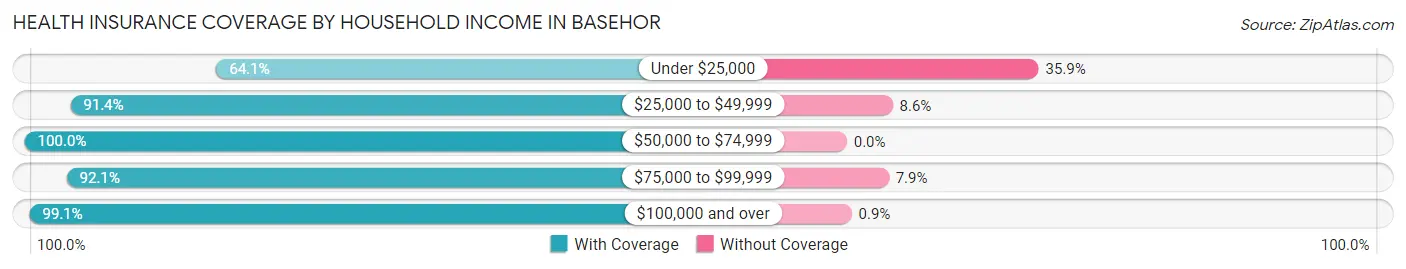
| Household Income | With Coverage | Without Coverage |
| Under $25,000 | 394 (64.1%) | 221 (35.9%) |
| $25,000 to $49,999 | 607 (91.4%) | 57 (8.6%) |
| $50,000 to $74,999 | 260 (100.0%) | 0 (0.0%) |
| $75,000 to $99,999 | 1,114 (92.1%) | 95 (7.9%) |
| $100,000 and over | 4,179 (99.1%) | 38 (0.9%) |
Public vs Private Health Insurance Coverage by Age in Basehor
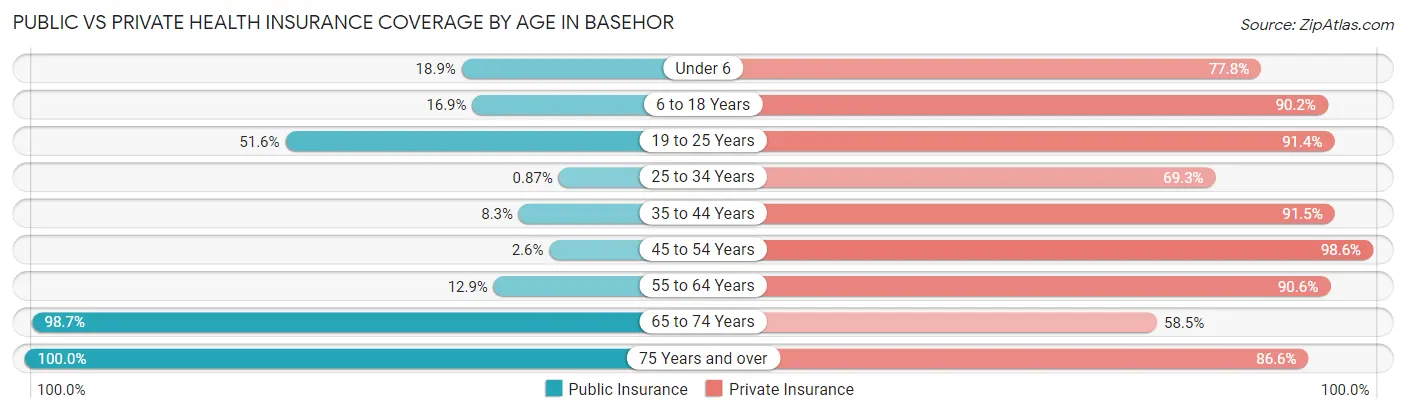
| Age Bracket | Public Insurance | Private Insurance |
| Under 6 | 91 (18.9%) | 375 (77.8%) |
| 6 to 18 Years | 222 (16.9%) | 1,185 (90.2%) |
| 19 to 25 Years | 258 (51.6%) | 457 (91.4%) |
| 25 to 34 Years | 7 (0.9%) | 561 (69.3%) |
| 35 to 44 Years | 85 (8.3%) | 941 (91.4%) |
| 45 to 54 Years | 22 (2.6%) | 832 (98.6%) |
| 55 to 64 Years | 106 (12.9%) | 743 (90.6%) |
| 65 to 74 Years | 533 (98.7%) | 316 (58.5%) |
| 75 Years and over | 627 (100.0%) | 543 (86.6%) |
| Total | 1,951 (28.0%) | 5,953 (85.5%) |
Disability Status by Sex by Age in Basehor
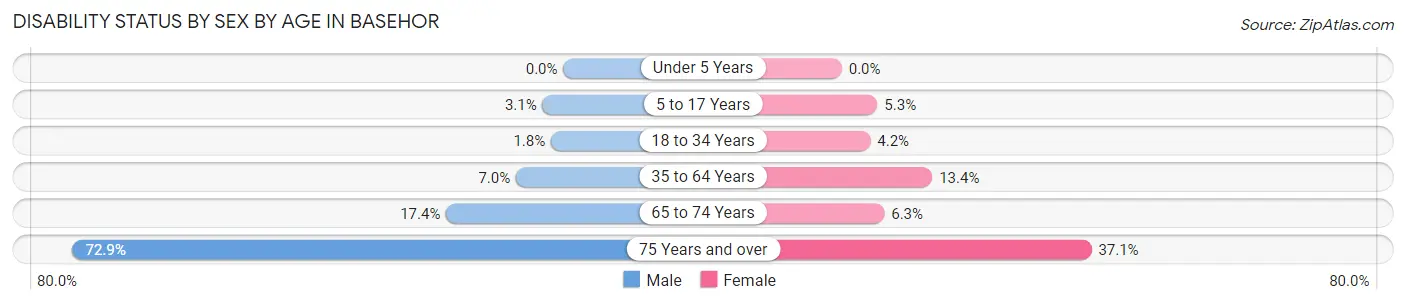
| Age Bracket | Male | Female |
| Under 5 Years | 0 (0.0%) | 0 (0.0%) |
| 5 to 17 Years | 23 (3.1%) | 32 (5.3%) |
| 18 to 34 Years | 14 (1.8%) | 26 (4.2%) |
| 35 to 64 Years | 98 (7.0%) | 174 (13.4%) |
| 65 to 74 Years | 36 (17.4%) | 21 (6.3%) |
| 75 Years and over | 223 (72.9%) | 119 (37.1%) |
Disability Class by Sex by Age in Basehor
Disability Class: Hearing Difficulty
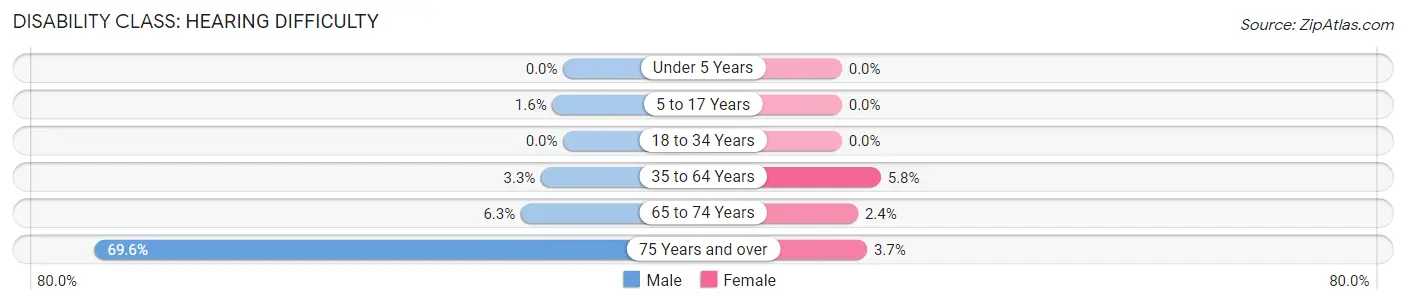
| Age Bracket | Male | Female |
| Under 5 Years | 0 (0.0%) | 0 (0.0%) |
| 5 to 17 Years | 12 (1.6%) | 0 (0.0%) |
| 18 to 34 Years | 0 (0.0%) | 0 (0.0%) |
| 35 to 64 Years | 46 (3.3%) | 75 (5.8%) |
| 65 to 74 Years | 13 (6.3%) | 8 (2.4%) |
| 75 Years and over | 213 (69.6%) | 12 (3.7%) |
Disability Class: Vision Difficulty
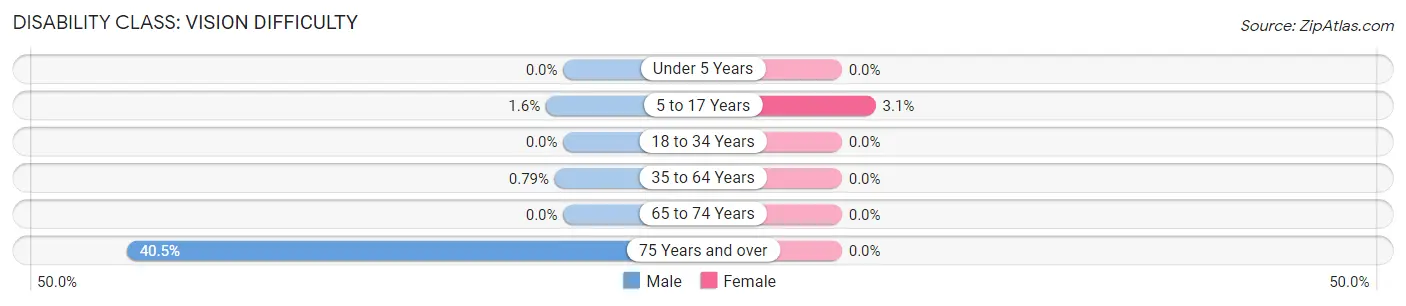
| Age Bracket | Male | Female |
| Under 5 Years | 0 (0.0%) | 0 (0.0%) |
| 5 to 17 Years | 12 (1.6%) | 19 (3.1%) |
| 18 to 34 Years | 0 (0.0%) | 0 (0.0%) |
| 35 to 64 Years | 11 (0.8%) | 0 (0.0%) |
| 65 to 74 Years | 0 (0.0%) | 0 (0.0%) |
| 75 Years and over | 124 (40.5%) | 0 (0.0%) |
Disability Class: Cognitive Difficulty
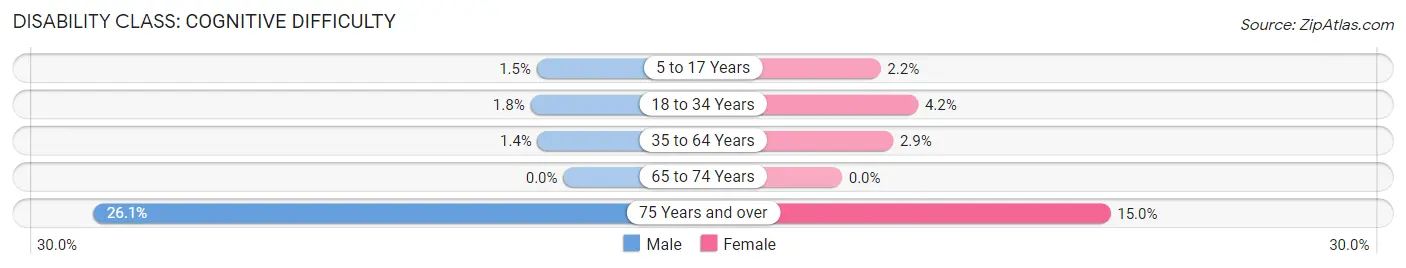
| Age Bracket | Male | Female |
| 5 to 17 Years | 11 (1.5%) | 13 (2.1%) |
| 18 to 34 Years | 14 (1.8%) | 26 (4.2%) |
| 35 to 64 Years | 20 (1.4%) | 37 (2.9%) |
| 65 to 74 Years | 0 (0.0%) | 0 (0.0%) |
| 75 Years and over | 80 (26.1%) | 48 (14.9%) |
Disability Class: Ambulatory Difficulty
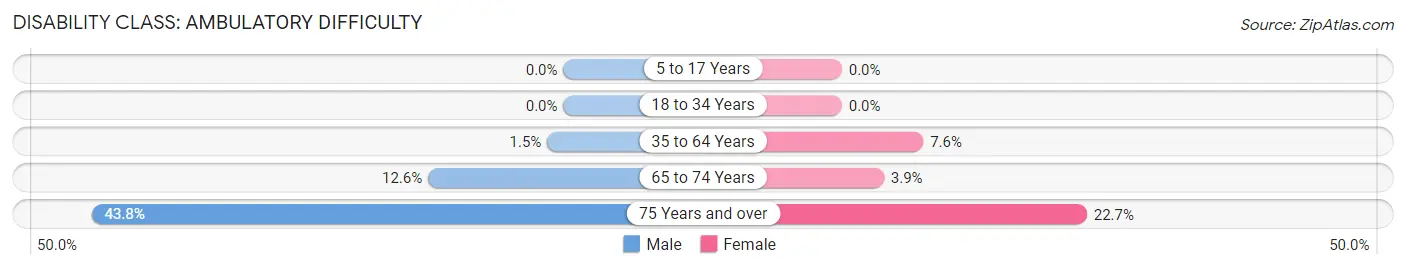
| Age Bracket | Male | Female |
| 5 to 17 Years | 0 (0.0%) | 0 (0.0%) |
| 18 to 34 Years | 0 (0.0%) | 0 (0.0%) |
| 35 to 64 Years | 21 (1.5%) | 98 (7.6%) |
| 65 to 74 Years | 26 (12.6%) | 13 (3.9%) |
| 75 Years and over | 134 (43.8%) | 73 (22.7%) |
Disability Class: Self-Care Difficulty
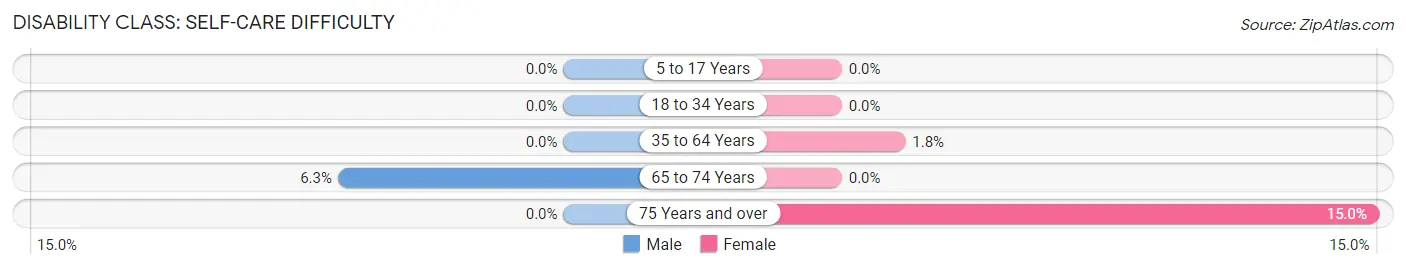
| Age Bracket | Male | Female |
| 5 to 17 Years | 0 (0.0%) | 0 (0.0%) |
| 18 to 34 Years | 0 (0.0%) | 0 (0.0%) |
| 35 to 64 Years | 0 (0.0%) | 23 (1.8%) |
| 65 to 74 Years | 13 (6.3%) | 0 (0.0%) |
| 75 Years and over | 0 (0.0%) | 48 (14.9%) |
Technology Access in Basehor
Computing Device Access in Basehor
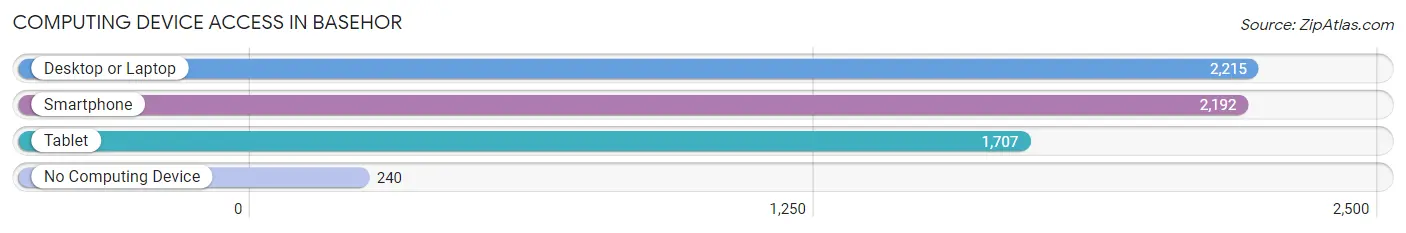
| Device Type | # Households | % Households |
| Desktop or Laptop | 2,215 | 84.5% |
| Smartphone | 2,192 | 83.6% |
| Tablet | 1,707 | 65.1% |
| No Computing Device | 240 | 9.2% |
| Total | 2,621 | 100.0% |
Internet Access in Basehor
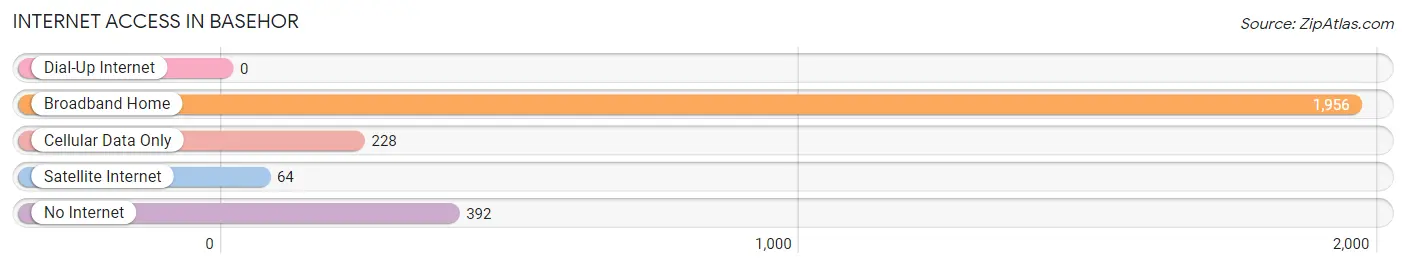
| Internet Type | # Households | % Households |
| Dial-Up Internet | 0 | 0.0% |
| Broadband Home | 1,956 | 74.6% |
| Cellular Data Only | 228 | 8.7% |
| Satellite Internet | 64 | 2.4% |
| No Internet | 392 | 15.0% |
| Total | 2,621 | 100.0% |
Basehor Summary
Basehor, Kansas is a small city located in Leavenworth County, Kansas. It is situated approximately 20 miles northwest of Kansas City, Missouri and is part of the Kansas City metropolitan area. The city has a population of 4,613 as of the 2010 census, making it the second-largest city in Leavenworth County.
History
Basehor was founded in 1858 by a group of settlers from Ohio. The city was named after the Basehor family, who were among the first settlers in the area. The Basehors were of German descent and had come to the area from Pennsylvania. The city was incorporated in 1867 and was the first city in Leavenworth County to be incorporated.
Geography
Basehor is located at 39°7'25" North, 94°55'45" West (39.123611, -94.929167). According to the United States Census Bureau, the city has a total area of 4.2 square miles, all of it land.
Economy
Basehor's economy is largely based on agriculture and manufacturing. The city is home to several large agricultural operations, including a large dairy farm and a large hog farm. The city also has several manufacturing plants, including a plastics plant and a metal fabrication plant.
Demographics
As of the 2010 census, there were 4,613 people, 1,717 households, and 1,269 families residing in the city. The population density was 1,097.3 people per square mile. The racial makeup of the city was 94.2% White, 1.2% African American, 0.3% Native American, 0.7% Asian, 0.1% Pacific Islander, 1.2% from other races, and 2.3% from two or more races. Hispanic or Latino of any race were 3.2% of the population.
The median income for a household in the city was $54,917, and the median income for a family was $63,917. Males had a median income of $45,000 versus $30,000 for females. The per capita income for the city was $24,917. About 4.2% of families and 5.3% of the population were below the poverty line, including 6.3% of those under age 18 and 4.2% of those age 65 or over.
Basehor is a small city with a rich history and a diverse economy. It is a great place to live and work, and its proximity to Kansas City makes it an ideal location for those looking to be close to the amenities of a larger city while still enjoying the benefits of living in a small town.
Common Questions
What is Per Capita Income in Basehor?
Per Capita income in Basehor is $43,144.
What is the Median Family Income in Basehor?
Median Family Income in Basehor is $110,875.
What is the Median Household income in Basehor?
Median Household Income in Basehor is $100,608.
What is Income or Wage Gap in Basehor?
Income or Wage Gap in Basehor is 42.6%.
Women in Basehor earn 57.4 cents for every dollar earned by a man.
What is Inequality or Gini Index in Basehor?
Inequality or Gini Index in Basehor is 0.39.
What is the Total Population of Basehor?
Total Population of Basehor is 7,004.
What is the Total Male Population of Basehor?
Total Male Population of Basehor is 3,646.
What is the Total Female Population of Basehor?
Total Female Population of Basehor is 3,358.
What is the Ratio of Males per 100 Females in Basehor?
There are 108.58 Males per 100 Females in Basehor.
What is the Ratio of Females per 100 Males in Basehor?
There are 92.10 Females per 100 Males in Basehor.
What is the Median Population Age in Basehor?
Median Population Age in Basehor is 39.6 Years.
What is the Average Family Size in Basehor
Average Family Size in Basehor is 3.2 People.
What is the Average Household Size in Basehor
Average Household Size in Basehor is 2.7 People.
How Large is the Labor Force in Basehor?
There are 3,460 People in the Labor Forcein in Basehor.
What is the Percentage of People in the Labor Force in Basehor?
63.8% of People are in the Labor Force in Basehor.
What is the Unemployment Rate in Basehor?
Unemployment Rate in Basehor is 9.9%.