Wellman, TX Map & Demographics
Wellman Map
Wellman Overview
$31,556
PER CAPITA INCOME
$113,382
AVG FAMILY INCOME
$112,941
AVG HOUSEHOLD INCOME
0.24
INEQUALITY / GINI INDEX
234
TOTAL POPULATION
83
MALE POPULATION
151
FEMALE POPULATION
54.97
MALES / 100 FEMALES
181.93
FEMALES / 100 MALES
37.4
MEDIAN AGE
3.5
AVG FAMILY SIZE
3.3
AVG HOUSEHOLD SIZE
111
LABOR FORCE [ PEOPLE ]
73.5%
PERCENT IN LABOR FORCE
Wellman Zip Codes
Wellman Area Codes
Income in Wellman
Income Overview in Wellman
Per Capita Income in Wellman is $31,556, while median incomes of families and households are $113,382 and $112,941 respectively.
| Characteristic | Number | Measure |
| Per Capita Income | 234 | $31,556 |
| Median Family Income | 64 | $113,382 |
| Mean Family Income | 64 | $102,361 |
| Median Household Income | 70 | $112,941 |
| Mean Household Income | 70 | $97,263 |
| Income Deficit | 64 | $0 |
| Wage / Income Gap (%) | 234 | 0.00% |
| Wage / Income Gap ($) | 234 | 100.00¢ per $1 |
| Gini / Inequality Index | 234 | 0.24 |
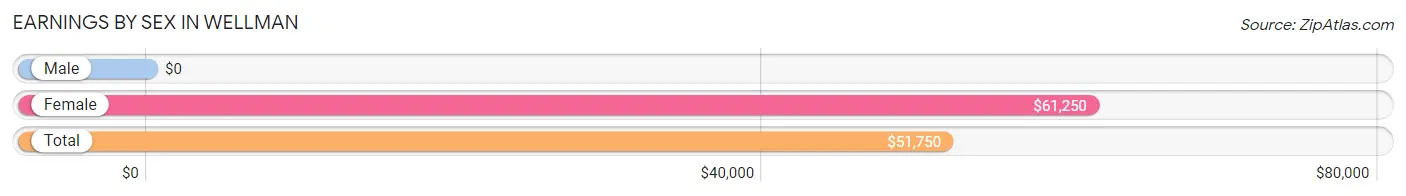
Earnings by Sex in Wellman
| Sex | Number | Average Earnings |
| Male | 56 (50.0%) | $0 |
| Female | 56 (50.0%) | $61,250 |
| Total | 112 (100.0%) | $51,750 |
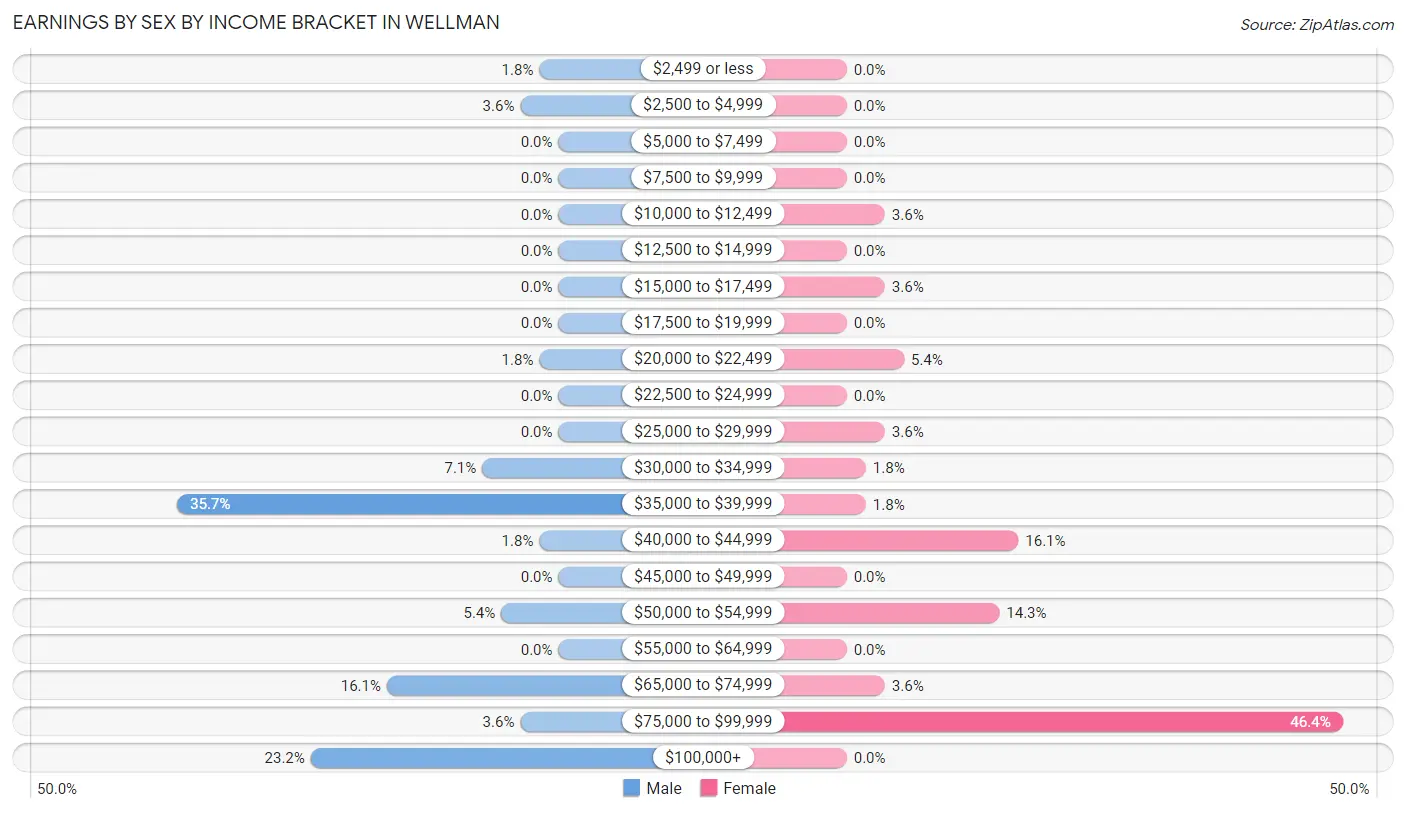
Earnings by Sex by Income Bracket in Wellman
The most common earnings brackets in Wellman are $35,000 to $39,999 for men (20 | 35.7%) and $75,000 to $99,999 for women (26 | 46.4%).
| Income | Male | Female |
| $2,499 or less | 1 (1.8%) | 0 (0.0%) |
| $2,500 to $4,999 | 2 (3.6%) | 0 (0.0%) |
| $5,000 to $7,499 | 0 (0.0%) | 0 (0.0%) |
| $7,500 to $9,999 | 0 (0.0%) | 0 (0.0%) |
| $10,000 to $12,499 | 0 (0.0%) | 2 (3.6%) |
| $12,500 to $14,999 | 0 (0.0%) | 0 (0.0%) |
| $15,000 to $17,499 | 0 (0.0%) | 2 (3.6%) |
| $17,500 to $19,999 | 0 (0.0%) | 0 (0.0%) |
| $20,000 to $22,499 | 1 (1.8%) | 3 (5.4%) |
| $22,500 to $24,999 | 0 (0.0%) | 0 (0.0%) |
| $25,000 to $29,999 | 0 (0.0%) | 2 (3.6%) |
| $30,000 to $34,999 | 4 (7.1%) | 1 (1.8%) |
| $35,000 to $39,999 | 20 (35.7%) | 1 (1.8%) |
| $40,000 to $44,999 | 1 (1.8%) | 9 (16.1%) |
| $45,000 to $49,999 | 0 (0.0%) | 0 (0.0%) |
| $50,000 to $54,999 | 3 (5.4%) | 8 (14.3%) |
| $55,000 to $64,999 | 0 (0.0%) | 0 (0.0%) |
| $65,000 to $74,999 | 9 (16.1%) | 2 (3.6%) |
| $75,000 to $99,999 | 2 (3.6%) | 26 (46.4%) |
| $100,000+ | 13 (23.2%) | 0 (0.0%) |
| Total | 56 (100.0%) | 56 (100.0%) |
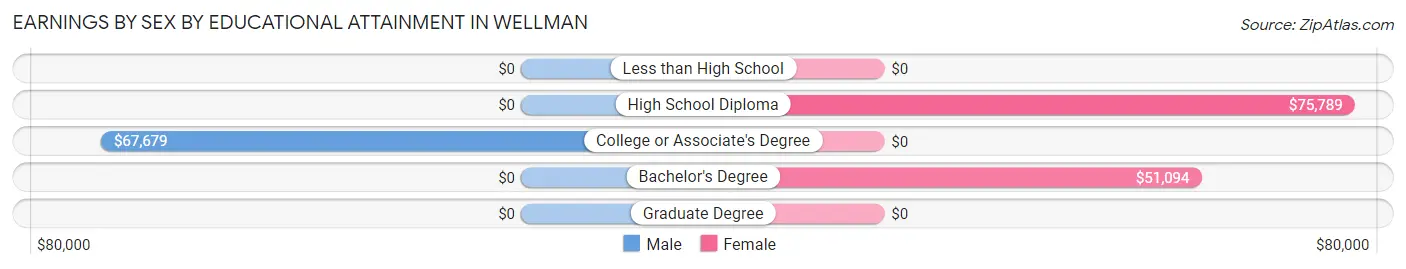
Earnings by Sex by Educational Attainment in Wellman
| Educational Attainment | Male Income | Female Income |
| Less than High School | - | - |
| High School Diploma | - | - |
| College or Associate's Degree | $67,679 | $0 |
| Bachelor's Degree | - | - |
| Graduate Degree | - | - |
| Total | - | - |
Family Income in Wellman
Family Income Brackets in Wellman
According to the Wellman family income data, there are 36 families falling into the $100,000 to $149,999 income range, which is the most common income bracket and makes up 56.2% of all families.
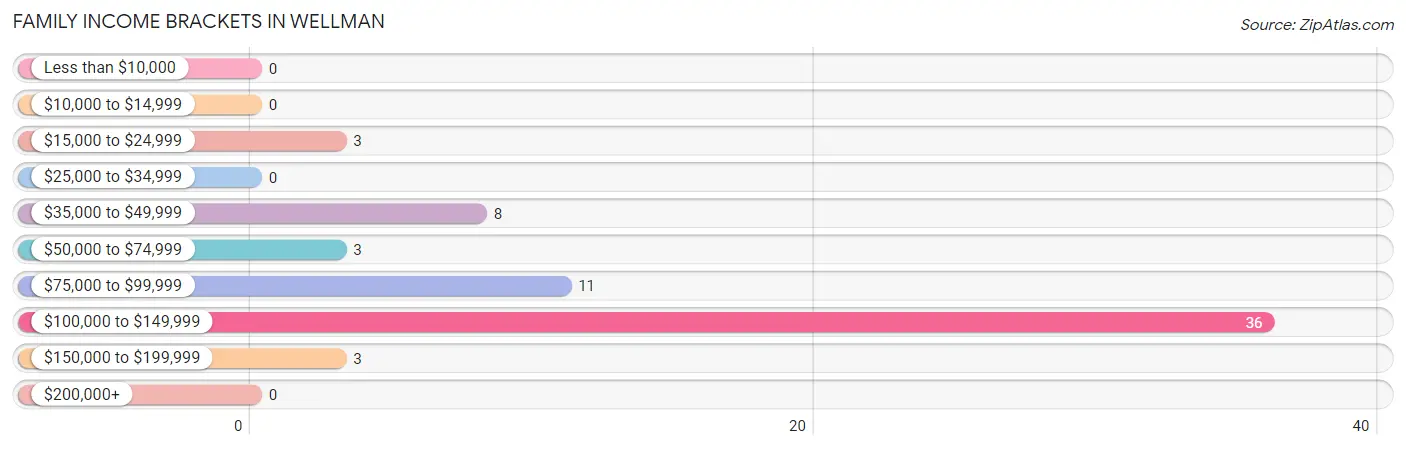
| Income Bracket | # Families | % Families |
| Less than $10,000 | 0 | 0.0% |
| $10,000 to $14,999 | 0 | 0.0% |
| $15,000 to $24,999 | 3 | 4.7% |
| $25,000 to $34,999 | 0 | 0.0% |
| $35,000 to $49,999 | 8 | 12.5% |
| $50,000 to $74,999 | 3 | 4.7% |
| $75,000 to $99,999 | 11 | 17.2% |
| $100,000 to $149,999 | 36 | 56.3% |
| $150,000 to $199,999 | 3 | 4.7% |
| $200,000+ | 0 | 0.0% |
Family Income by Famaliy Size in Wellman
2-person families (33 | 51.6%) account for the highest median family income in Wellman with $114,044 per family, while 2-person families (33 | 51.6%) have the highest median income of $57,022 per family member.
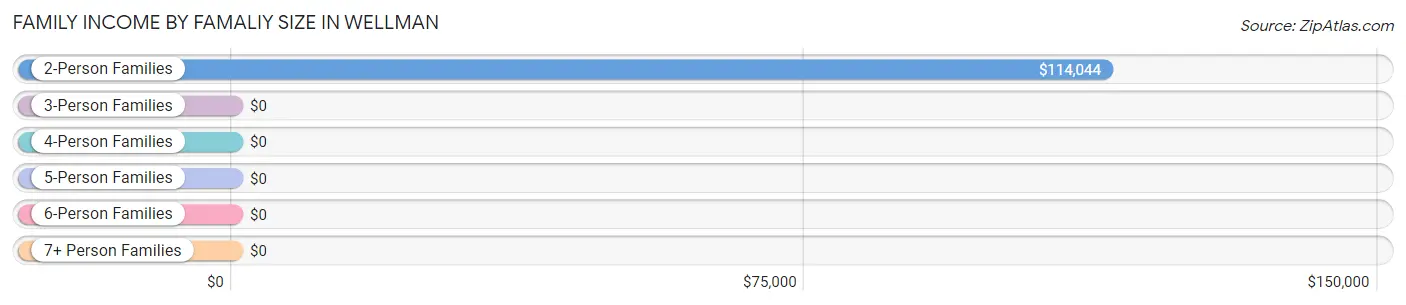
| Income Bracket | # Families | Median Income |
| 2-Person Families | 33 (51.6%) | $114,044 |
| 3-Person Families | 16 (25.0%) | $0 |
| 4-Person Families | 8 (12.5%) | $0 |
| 5-Person Families | 0 (0.0%) | $0 |
| 6-Person Families | 0 (0.0%) | $0 |
| 7+ Person Families | 7 (10.9%) | $0 |
| Total | 64 (100.0%) | $113,382 |
Family Income by Number of Earners in Wellman
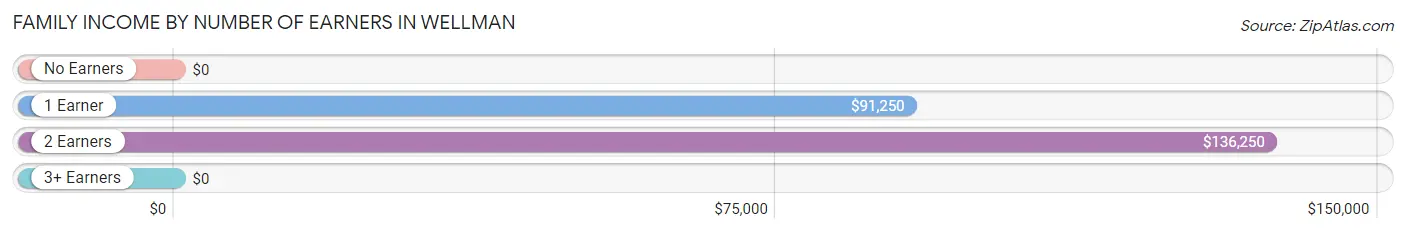
| Number of Earners | # Families | Median Income |
| No Earners | 1 (1.6%) | $0 |
| 1 Earner | 36 (56.2%) | $91,250 |
| 2 Earners | 27 (42.2%) | $136,250 |
| 3+ Earners | 0 (0.0%) | $0 |
| Total | 64 (100.0%) | $113,382 |
Household Income in Wellman
Household Income Brackets in Wellman
With 36 households falling in the category, the $100,000 to $149,999 income range is the most frequent in Wellman, accounting for 51.4% of all households.
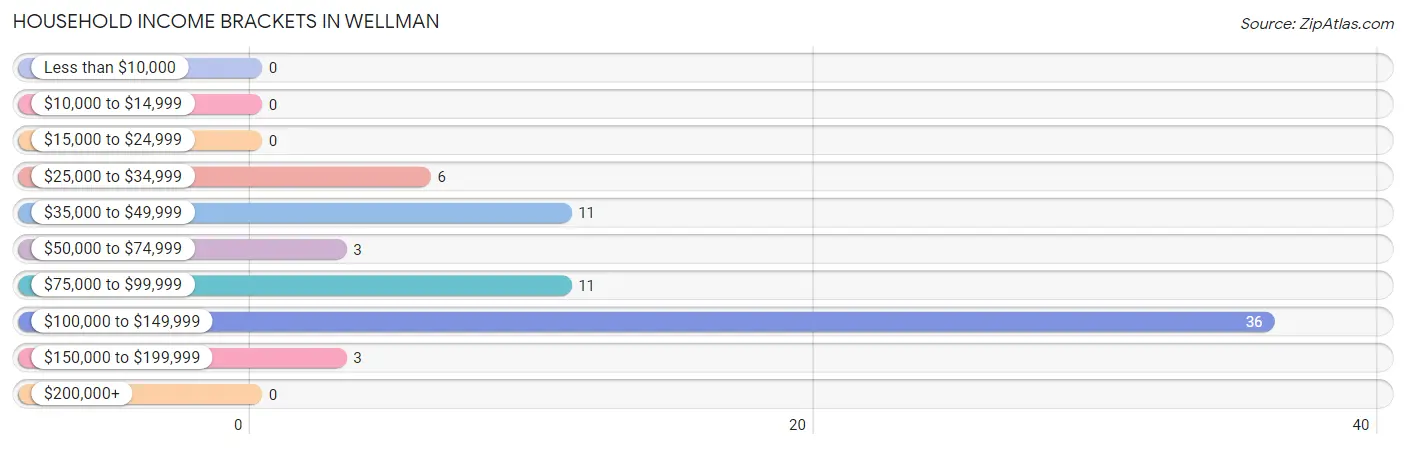
| Income Bracket | # Households | % Households |
| Less than $10,000 | 0 | 0.0% |
| $10,000 to $14,999 | 0 | 0.0% |
| $15,000 to $24,999 | 0 | 0.0% |
| $25,000 to $34,999 | 6 | 8.6% |
| $35,000 to $49,999 | 11 | 15.7% |
| $50,000 to $74,999 | 3 | 4.3% |
| $75,000 to $99,999 | 11 | 15.7% |
| $100,000 to $149,999 | 36 | 51.4% |
| $150,000 to $199,999 | 3 | 4.3% |
| $200,000+ | 0 | 0.0% |
Household Income by Householder Age in Wellman
The median household income in Wellman is $112,941, with the highest median household income of $118,571 found in the 25 to 44 years age bracket for the primary householder. A total of 28 households (40.0%) fall into this category. Meanwhile, the 15 to 24 years age bracket for the primary householder has the lowest median household income of $0, with 2 households (2.9%) in this group.
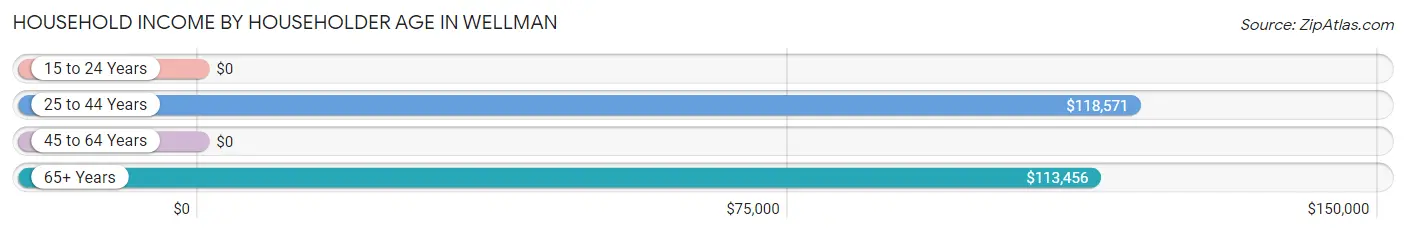
| Income Bracket | # Households | Median Income |
| 15 to 24 Years | 2 (2.9%) | $0 |
| 25 to 44 Years | 28 (40.0%) | $118,571 |
| 45 to 64 Years | 19 (27.1%) | $0 |
| 65+ Years | 21 (30.0%) | $113,456 |
| Total | 70 (100.0%) | $112,941 |
Poverty in Wellman
Income Below Poverty by Sex and Age in Wellman
With 2.4% poverty level for males and 2.0% for females among the residents of Wellman, 12 to 14 year old males and 55 to 64 year old females are the most vulnerable to poverty, with 2 males (50.0%) and 3 females (37.5%) in their respective age groups living below the poverty level.
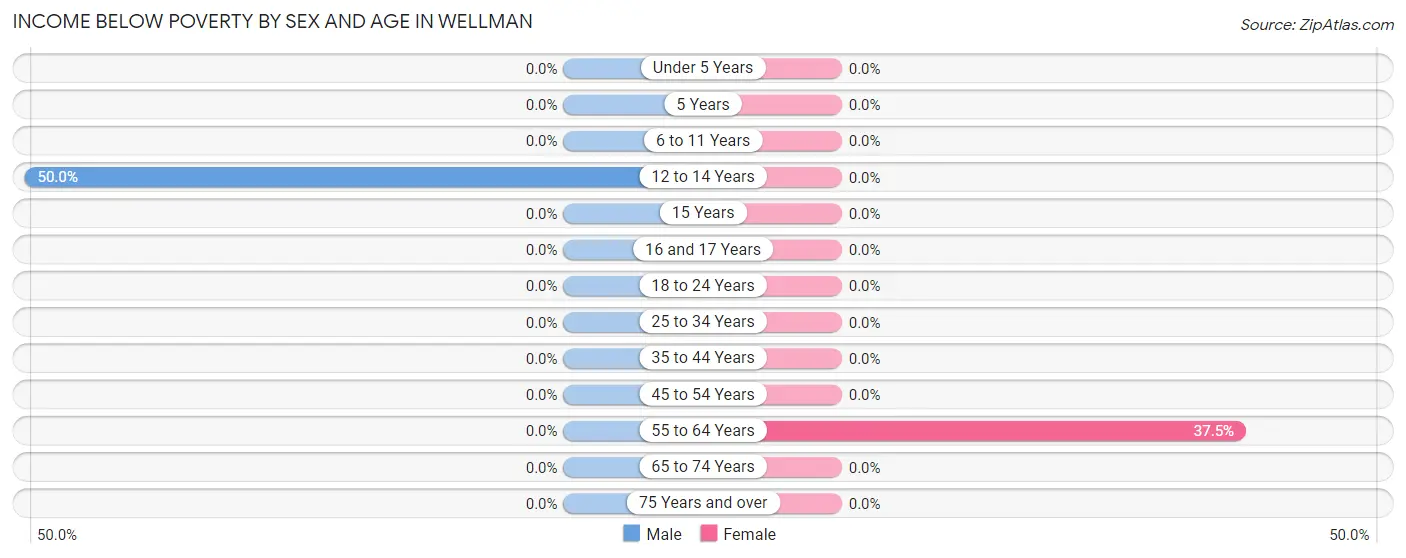
| Age Bracket | Male | Female |
| Under 5 Years | 0 (0.0%) | 0 (0.0%) |
| 5 Years | 0 (0.0%) | 0 (0.0%) |
| 6 to 11 Years | 0 (0.0%) | 0 (0.0%) |
| 12 to 14 Years | 2 (50.0%) | 0 (0.0%) |
| 15 Years | 0 (0.0%) | 0 (0.0%) |
| 16 and 17 Years | 0 (0.0%) | 0 (0.0%) |
| 18 to 24 Years | 0 (0.0%) | 0 (0.0%) |
| 25 to 34 Years | 0 (0.0%) | 0 (0.0%) |
| 35 to 44 Years | 0 (0.0%) | 0 (0.0%) |
| 45 to 54 Years | 0 (0.0%) | 0 (0.0%) |
| 55 to 64 Years | 0 (0.0%) | 3 (37.5%) |
| 65 to 74 Years | 0 (0.0%) | 0 (0.0%) |
| 75 Years and over | 0 (0.0%) | 0 (0.0%) |
| Total | 2 (2.4%) | 3 (2.0%) |
Income Above Poverty by Sex and Age in Wellman
According to the poverty statistics in Wellman, males aged under 5 years and females aged under 5 years are the age groups that are most secure financially, with 100.0% of males and 100.0% of females in these age groups living above the poverty line.
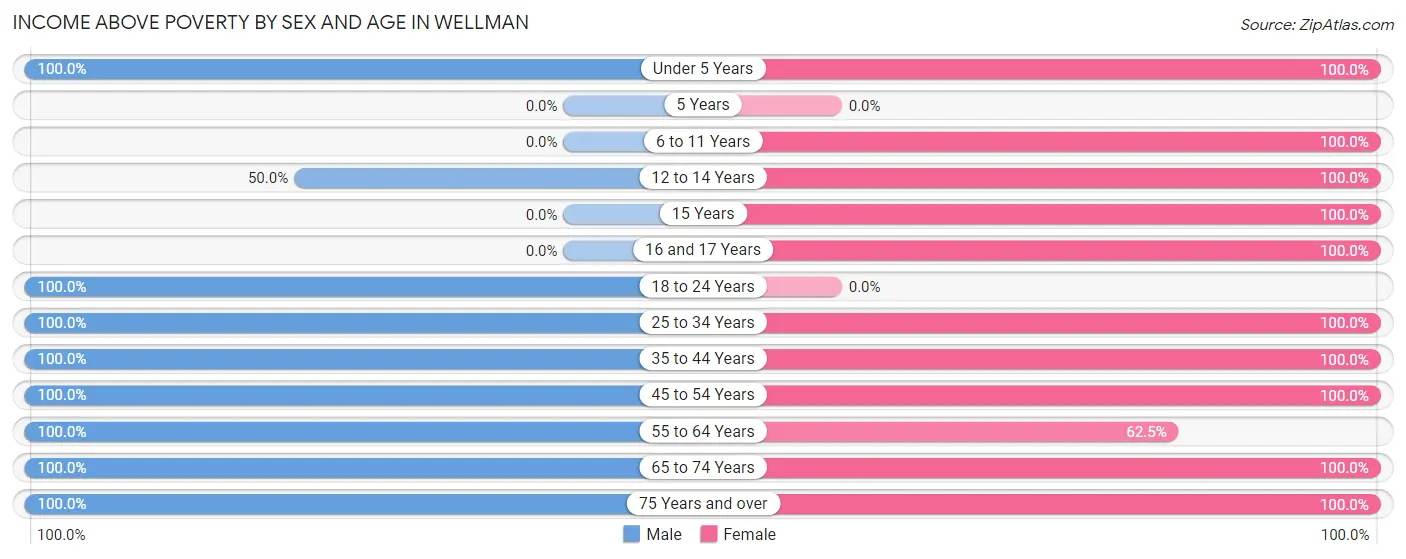
| Age Bracket | Male | Female |
| Under 5 Years | 3 (100.0%) | 7 (100.0%) |
| 5 Years | 0 (0.0%) | 0 (0.0%) |
| 6 to 11 Years | 0 (0.0%) | 47 (100.0%) |
| 12 to 14 Years | 2 (50.0%) | 14 (100.0%) |
| 15 Years | 0 (0.0%) | 8 (100.0%) |
| 16 and 17 Years | 0 (0.0%) | 8 (100.0%) |
| 18 to 24 Years | 4 (100.0%) | 0 (0.0%) |
| 25 to 34 Years | 2 (100.0%) | 2 (100.0%) |
| 35 to 44 Years | 22 (100.0%) | 22 (100.0%) |
| 45 to 54 Years | 21 (100.0%) | 11 (100.0%) |
| 55 to 64 Years | 8 (100.0%) | 5 (62.5%) |
| 65 to 74 Years | 18 (100.0%) | 21 (100.0%) |
| 75 Years and over | 1 (100.0%) | 3 (100.0%) |
| Total | 81 (97.6%) | 148 (98.0%) |
Income Below Poverty Among Married-Couple Families in Wellman
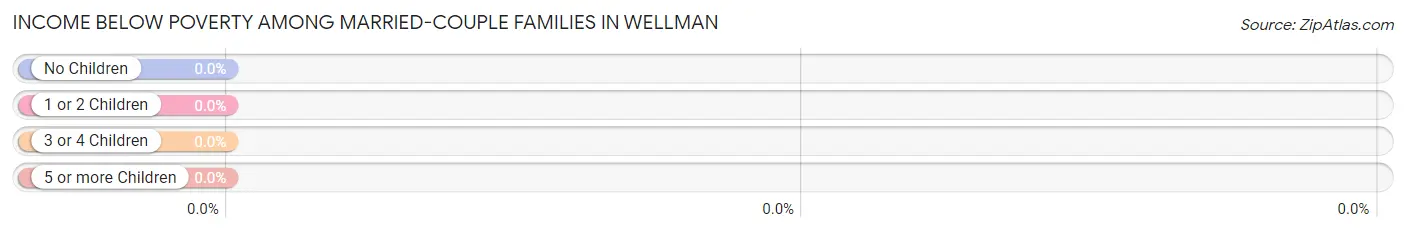
| Children | Above Poverty | Below Poverty |
| No Children | 32 (100.0%) | 0 (0.0%) |
| 1 or 2 Children | 19 (100.0%) | 0 (0.0%) |
| 3 or 4 Children | 0 (0.0%) | 0 (0.0%) |
| 5 or more Children | 0 (0.0%) | 0 (0.0%) |
| Total | 51 (100.0%) | 0 (0.0%) |
Income Below Poverty Among Single-Parent Households in Wellman
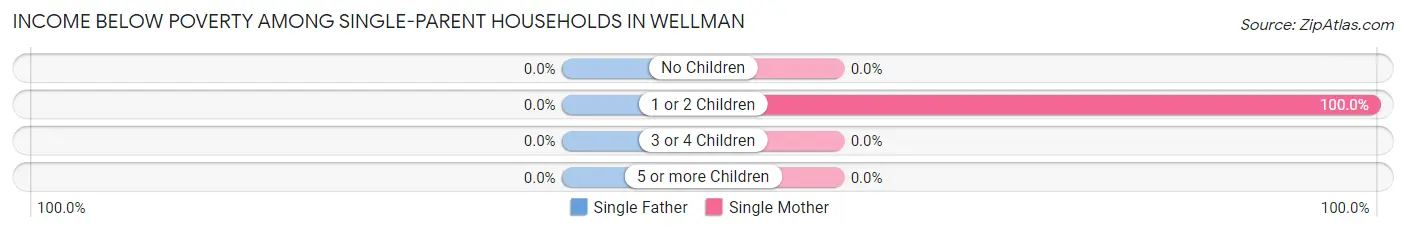
| Children | Single Father | Single Mother |
| No Children | 0 (0.0%) | 0 (0.0%) |
| 1 or 2 Children | 0 (0.0%) | 3 (100.0%) |
| 3 or 4 Children | 0 (0.0%) | 0 (0.0%) |
| 5 or more Children | 0 (0.0%) | 0 (0.0%) |
| Total | 0 (0.0%) | 3 (23.1%) |
Income Below Poverty Among Married-Couple vs Single-Parent Households in Wellman
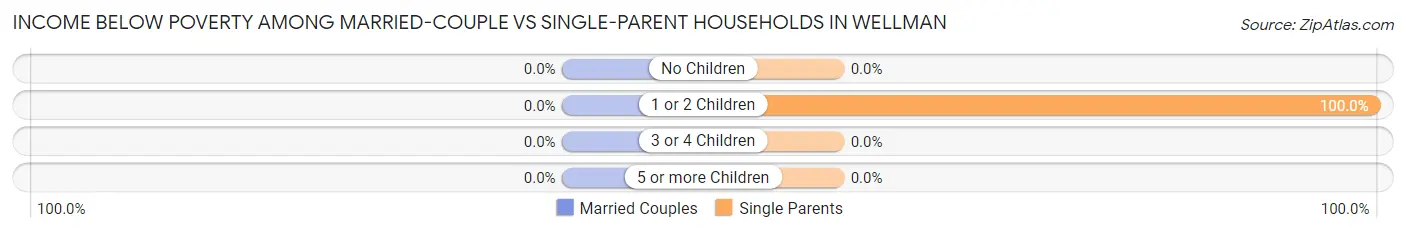
| Children | Married-Couple Families | Single-Parent Households |
| No Children | 0 (0.0%) | 0 (0.0%) |
| 1 or 2 Children | 0 (0.0%) | 3 (100.0%) |
| 3 or 4 Children | 0 (0.0%) | 0 (0.0%) |
| 5 or more Children | 0 (0.0%) | 0 (0.0%) |
| Total | 0 (0.0%) | 3 (23.1%) |
Race in Wellman
The most populous races in Wellman are White / Caucasian (129 | 55.1%), Hispanic or Latino (99 | 42.3%), and Some other Race (53 | 22.7%).
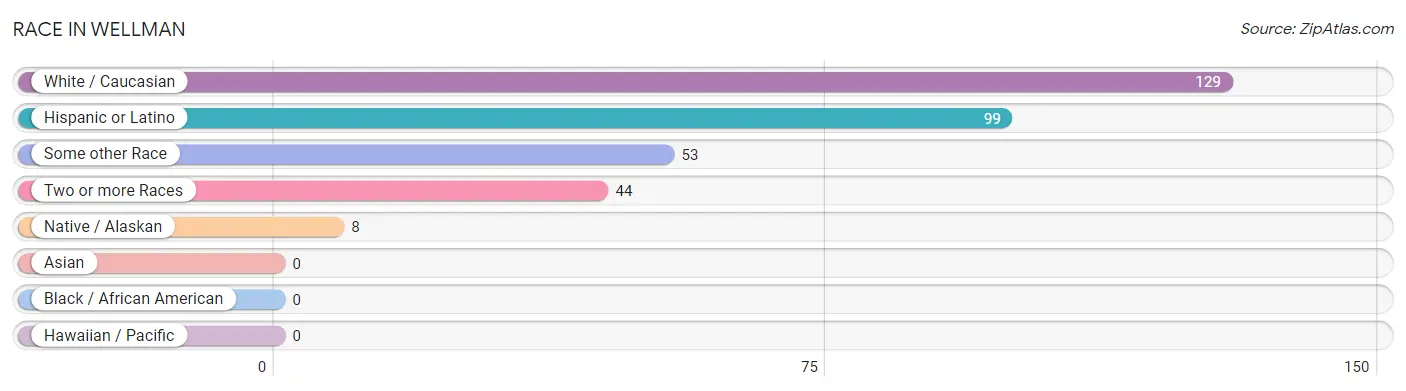
| Race | # Population | % Population |
| Asian | 0 | 0.0% |
| Black / African American | 0 | 0.0% |
| Hawaiian / Pacific | 0 | 0.0% |
| Hispanic or Latino | 99 | 42.3% |
| Native / Alaskan | 8 | 3.4% |
| White / Caucasian | 129 | 55.1% |
| Two or more Races | 44 | 18.8% |
| Some other Race | 53 | 22.7% |
| Total | 234 | 100.0% |
Ancestry in Wellman
The most populous ancestries reported in Wellman are Mexican (89 | 38.0%), Irish (22 | 9.4%), German (21 | 9.0%), American (18 | 7.7%), and Scotch-Irish (17 | 7.3%), together accounting for 71.4% of all Wellman residents.
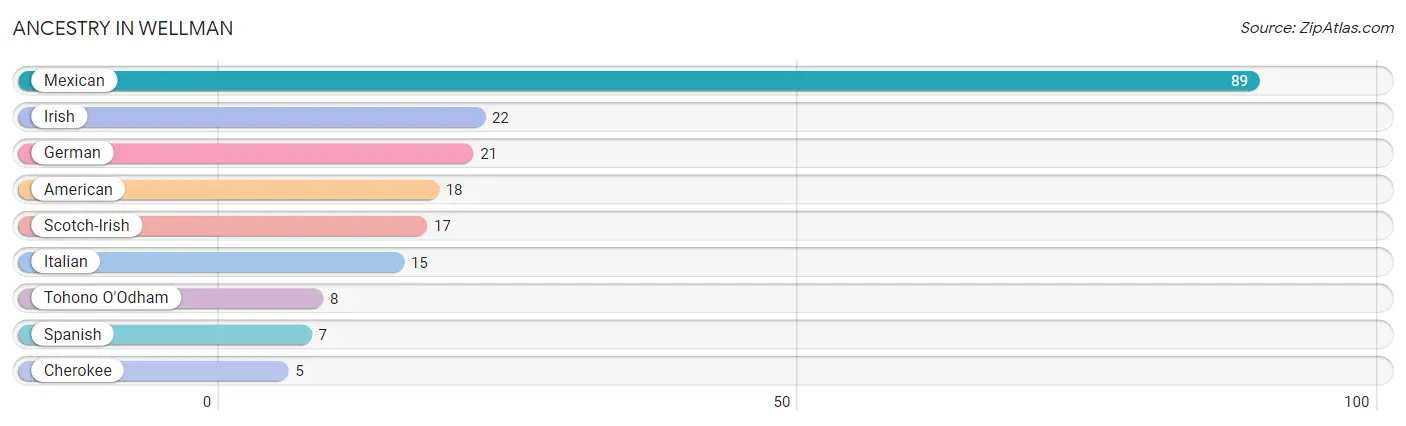
| Ancestry | # Population | % Population |
| American | 18 | 7.7% |
| Cherokee | 5 | 2.1% |
| German | 21 | 9.0% |
| Irish | 22 | 9.4% |
| Italian | 15 | 6.4% |
| Mexican | 89 | 38.0% |
| Scotch-Irish | 17 | 7.3% |
| Spanish | 7 | 3.0% |
| Tohono O'Odham | 8 | 3.4% | View All 9 Rows |
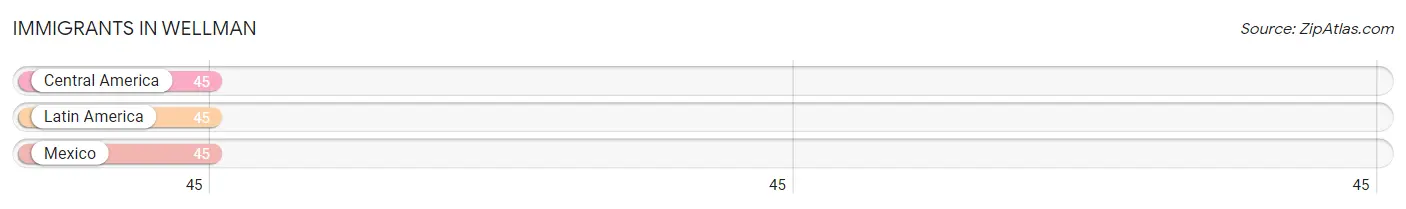
Immigrants in Wellman
The most numerous immigrant groups reported in Wellman came from Central America (45 | 19.2%), Latin America (45 | 19.2%), and Mexico (45 | 19.2%), together accounting for 57.7% of all Wellman residents.
| Immigration Origin | # Population | % Population |
| Central America | 45 | 19.2% |
| Latin America | 45 | 19.2% |
| Mexico | 45 | 19.2% | View All 3 Rows |
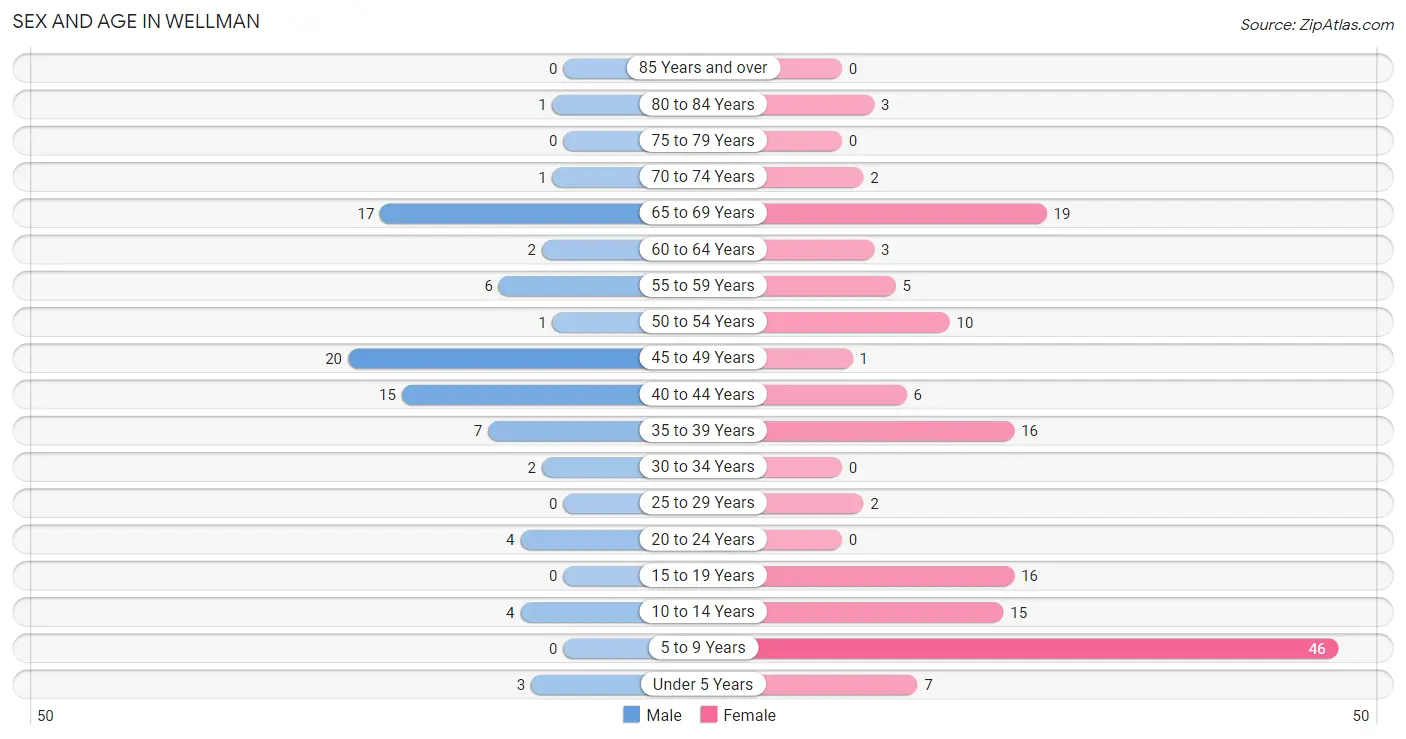
Sex and Age in Wellman
Sex and Age in Wellman
The most populous age groups in Wellman are 45 to 49 Years (20 | 24.1%) for men and 5 to 9 Years (46 | 30.5%) for women.
| Age Bracket | Male | Female |
| Under 5 Years | 3 (3.6%) | 7 (4.6%) |
| 5 to 9 Years | 0 (0.0%) | 46 (30.5%) |
| 10 to 14 Years | 4 (4.8%) | 15 (9.9%) |
| 15 to 19 Years | 0 (0.0%) | 16 (10.6%) |
| 20 to 24 Years | 4 (4.8%) | 0 (0.0%) |
| 25 to 29 Years | 0 (0.0%) | 2 (1.3%) |
| 30 to 34 Years | 2 (2.4%) | 0 (0.0%) |
| 35 to 39 Years | 7 (8.4%) | 16 (10.6%) |
| 40 to 44 Years | 15 (18.1%) | 6 (4.0%) |
| 45 to 49 Years | 20 (24.1%) | 1 (0.7%) |
| 50 to 54 Years | 1 (1.2%) | 10 (6.6%) |
| 55 to 59 Years | 6 (7.2%) | 5 (3.3%) |
| 60 to 64 Years | 2 (2.4%) | 3 (2.0%) |
| 65 to 69 Years | 17 (20.5%) | 19 (12.6%) |
| 70 to 74 Years | 1 (1.2%) | 2 (1.3%) |
| 75 to 79 Years | 0 (0.0%) | 0 (0.0%) |
| 80 to 84 Years | 1 (1.2%) | 3 (2.0%) |
| 85 Years and over | 0 (0.0%) | 0 (0.0%) |
| Total | 83 (100.0%) | 151 (100.0%) |
Families and Households in Wellman
Median Family Size in Wellman
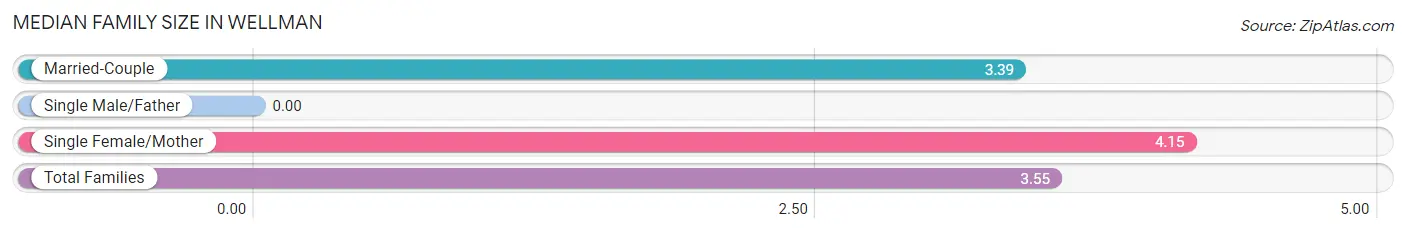
| Family Type | # Families | Family Size |
| Married-Couple | 51 (79.7%) | 3.39 |
| Single Male/Father | 0 (0.0%) | - |
| Single Female/Mother | 13 (20.3%) | 4.15 |
| Total Families | 64 (100.0%) | 3.55 |
Median Household Size in Wellman
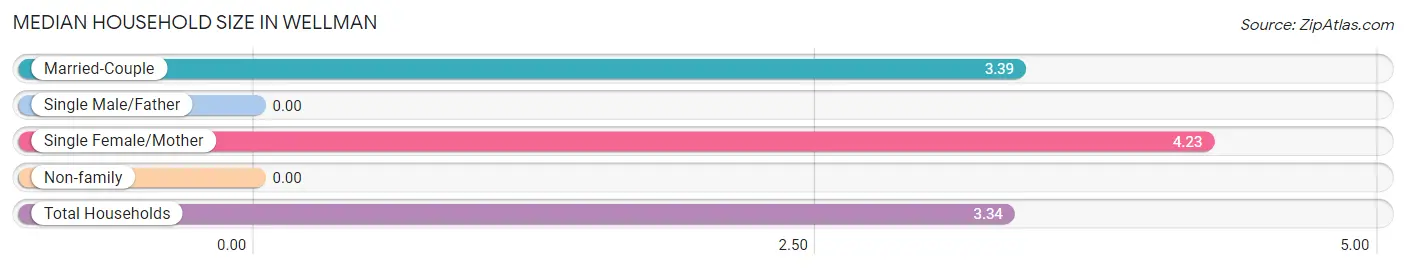
| Household Type | # Households | Household Size |
| Married-Couple | 51 (72.9%) | 3.39 |
| Single Male/Father | 0 (0.0%) | - |
| Single Female/Mother | 13 (18.6%) | 4.23 |
| Non-family | 6 (8.6%) | - |
| Total Households | 70 (100.0%) | 3.34 |
Household Size by Marriage Status in Wellman
Out of a total of 70 households in Wellman, 64 (91.4%) are family households, while 6 (8.6%) are nonfamily households. The most numerous type of family households are 2-person households, comprising 33, and the most common type of nonfamily households are 1-person households, comprising 6.
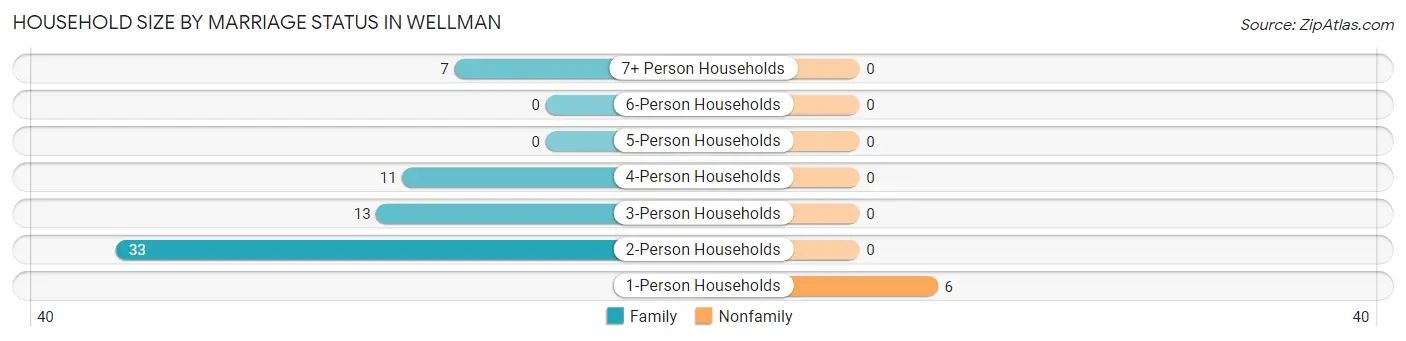
| Household Size | Family Households | Nonfamily Households |
| 1-Person Households | - | 6 (8.6%) |
| 2-Person Households | 33 (47.1%) | 0 (0.0%) |
| 3-Person Households | 13 (18.6%) | 0 (0.0%) |
| 4-Person Households | 11 (15.7%) | 0 (0.0%) |
| 5-Person Households | 0 (0.0%) | 0 (0.0%) |
| 6-Person Households | 0 (0.0%) | 0 (0.0%) |
| 7+ Person Households | 7 (10.0%) | 0 (0.0%) |
| Total | 64 (91.4%) | 6 (8.6%) |
Female Fertility in Wellman
Fertility by Age in Wellman
| Age Bracket | Women with Births | Births / 1,000 Women |
| 15 to 19 years | 0 (0.0%) | 0.0 |
| 20 to 34 years | 0 (0.0%) | 0.0 |
| 35 to 50 years | 0 (0.0%) | 0.0 |
| Total | 0 (0.0%) | 0.0 |
Fertility by Age by Marriage Status in Wellman
| Age Bracket | Married | Unmarried |
| 15 to 19 years | 0 (0.0%) | 0 (0.0%) |
| 20 to 34 years | 0 (0.0%) | 0 (0.0%) |
| 35 to 50 years | 0 (0.0%) | 0 (0.0%) |
| Total | 0 (0.0%) | 0 (0.0%) |
Fertility by Education in Wellman
| Educational Attainment | Women with Births | Births / 1,000 Women |
| Less than High School | 0 (0.0%) | 0.0 |
| High School Diploma | 0 (0.0%) | 0.0 |
| College or Associate's Degree | 0 (0.0%) | 0.0 |
| Bachelor's Degree | 0 (0.0%) | 0.0 |
| Graduate Degree | 0 (0.0%) | 0.0 |
| Total | 0 (0.0%) | 0.0 |
Fertility by Education by Marriage Status in Wellman
| Educational Attainment | Married | Unmarried |
| Less than High School | 0 (0.0%) | 0 (0.0%) |
| High School Diploma | 0 (0.0%) | 0 (0.0%) |
| College or Associate's Degree | 0 (0.0%) | 0 (0.0%) |
| Bachelor's Degree | 0 (0.0%) | 0 (0.0%) |
| Graduate Degree | 0 (0.0%) | 0 (0.0%) |
| Total | 0 (0.0%) | 0 (0.0%) |
Employment Characteristics in Wellman
Employment by Class of Employer in Wellman
Among the 111 employed individuals in Wellman, private company employees (35 | 31.5%), local government employees (34 | 30.6%), and self-employed (not incorporated) (24 | 21.6%) make up the most common classes of employment.
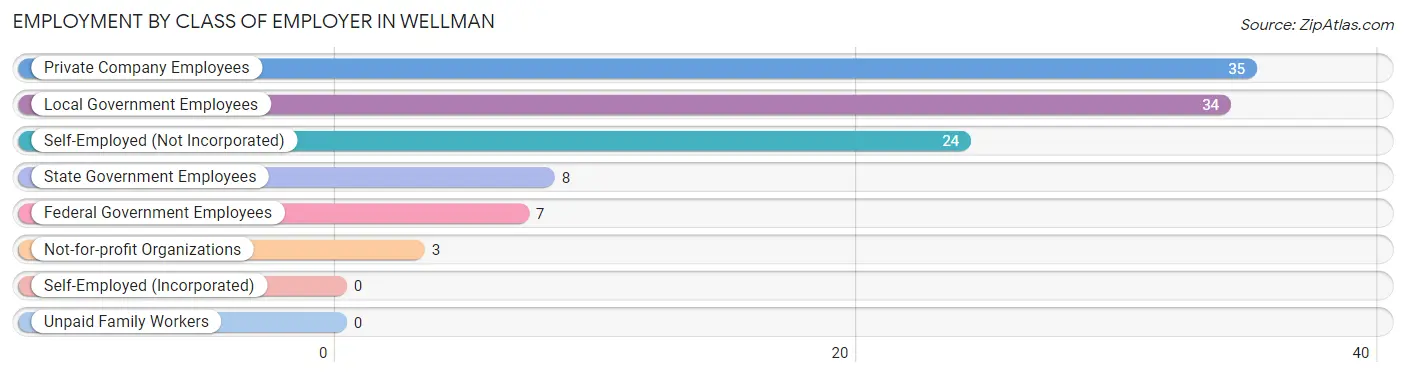
| Employer Class | # Employees | % Employees |
| Private Company Employees | 35 | 31.5% |
| Self-Employed (Incorporated) | 0 | 0.0% |
| Self-Employed (Not Incorporated) | 24 | 21.6% |
| Not-for-profit Organizations | 3 | 2.7% |
| Local Government Employees | 34 | 30.6% |
| State Government Employees | 8 | 7.2% |
| Federal Government Employees | 7 | 6.3% |
| Unpaid Family Workers | 0 | 0.0% |
| Total | 111 | 100.0% |
Employment Status by Age in Wellman
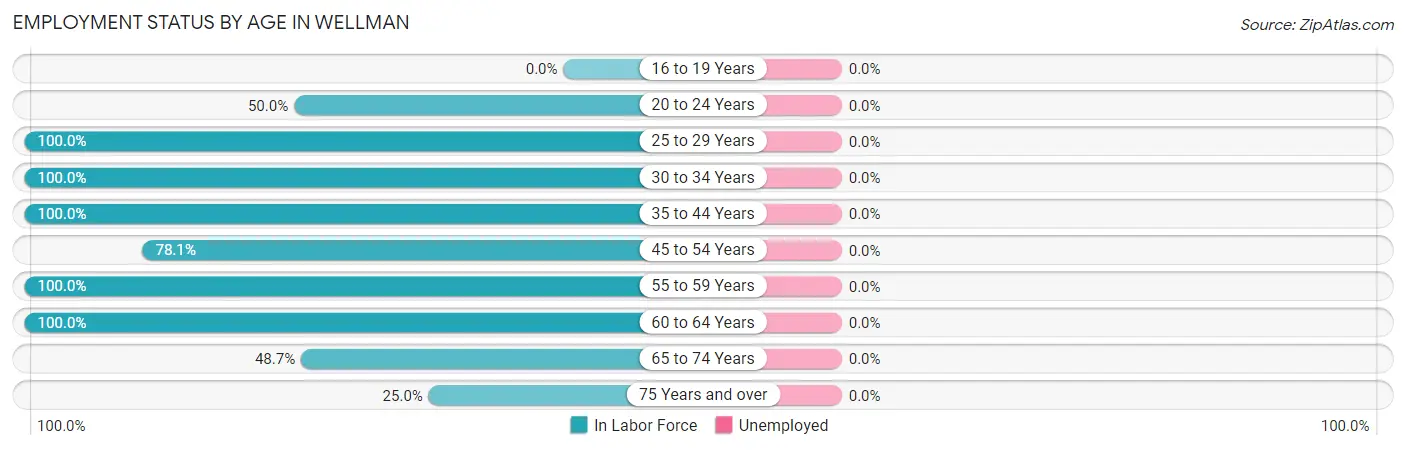
| Age Bracket | In Labor Force | Unemployed |
| 16 to 19 Years | 0 (0.0%) | 0 (0.0%) |
| 20 to 24 Years | 2 (50.0%) | 0 (0.0%) |
| 25 to 29 Years | 2 (100.0%) | 0 (0.0%) |
| 30 to 34 Years | 2 (100.0%) | 0 (0.0%) |
| 35 to 44 Years | 44 (100.0%) | 0 (0.0%) |
| 45 to 54 Years | 25 (78.1%) | 0 (0.0%) |
| 55 to 59 Years | 11 (100.0%) | 0 (0.0%) |
| 60 to 64 Years | 5 (100.0%) | 0 (0.0%) |
| 65 to 74 Years | 19 (48.7%) | 0 (0.0%) |
| 75 Years and over | 1 (25.0%) | 0 (0.0%) |
| Total | 111 (73.5%) | 0 (0.0%) |
Employment Status by Educational Attainment in Wellman
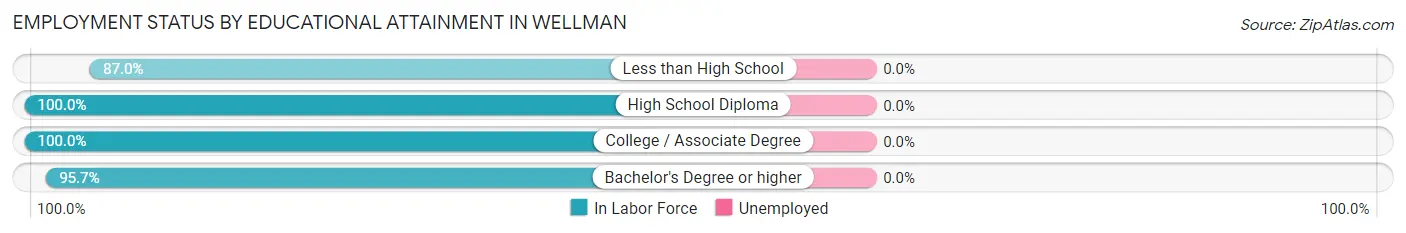
| Educational Attainment | In Labor Force | Unemployed |
| Less than High School | 40 (87.0%) | 0 (0.0%) |
| High School Diploma | 14 (100.0%) | 0 (0.0%) |
| College / Associate Degree | 13 (100.0%) | 0 (0.0%) |
| Bachelor's Degree or higher | 22 (95.7%) | 0 (0.0%) |
| Total | 89 (92.7%) | 0 (0.0%) |
Employment Occupations by Sex in Wellman
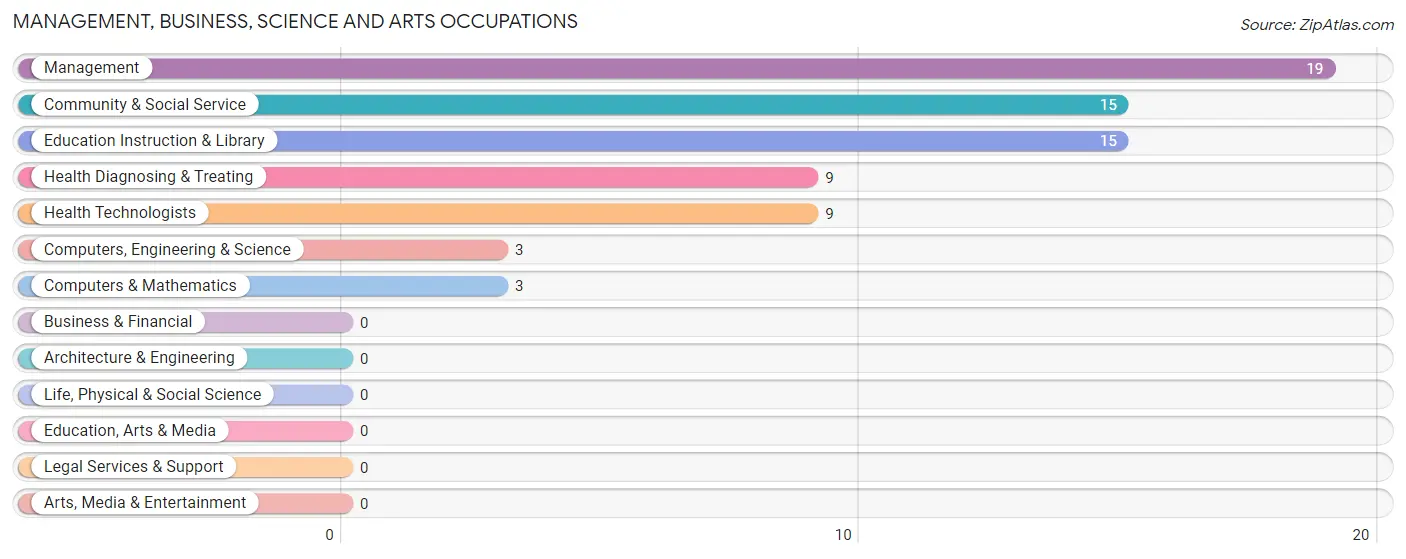
Management, Business, Science and Arts Occupations
The most common Management, Business, Science and Arts occupations in Wellman are Management (19 | 17.1%), Community & Social Service (15 | 13.5%), Education Instruction & Library (15 | 13.5%), Health Diagnosing & Treating (9 | 8.1%), and Health Technologists (9 | 8.1%).
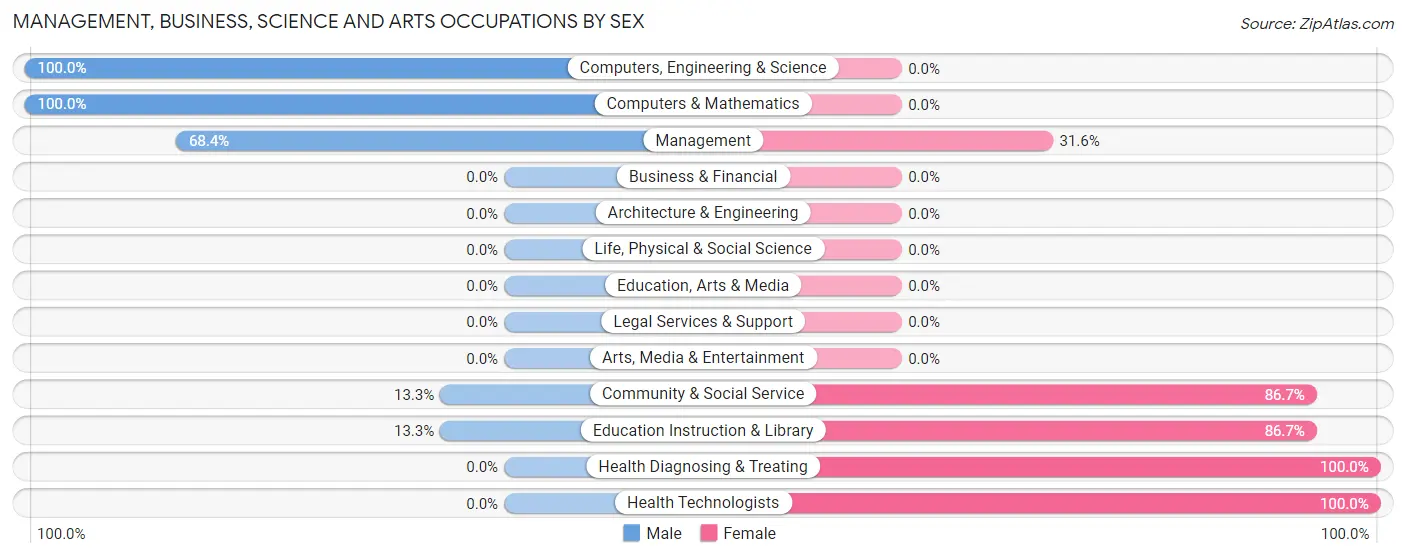
Management, Business, Science and Arts Occupations by Sex
Within the Management, Business, Science and Arts occupations in Wellman, the most male-oriented occupations are Computers, Engineering & Science (100.0%), Computers & Mathematics (100.0%), and Management (68.4%), while the most female-oriented occupations are Health Diagnosing & Treating (100.0%), Health Technologists (100.0%), and Community & Social Service (86.7%).
| Occupation | Male | Female |
| Management | 13 (68.4%) | 6 (31.6%) |
| Business & Financial | 0 (0.0%) | 0 (0.0%) |
| Computers, Engineering & Science | 3 (100.0%) | 0 (0.0%) |
| Computers & Mathematics | 3 (100.0%) | 0 (0.0%) |
| Architecture & Engineering | 0 (0.0%) | 0 (0.0%) |
| Life, Physical & Social Science | 0 (0.0%) | 0 (0.0%) |
| Community & Social Service | 2 (13.3%) | 13 (86.7%) |
| Education, Arts & Media | 0 (0.0%) | 0 (0.0%) |
| Legal Services & Support | 0 (0.0%) | 0 (0.0%) |
| Education Instruction & Library | 2 (13.3%) | 13 (86.7%) |
| Arts, Media & Entertainment | 0 (0.0%) | 0 (0.0%) |
| Health Diagnosing & Treating | 0 (0.0%) | 9 (100.0%) |
| Health Technologists | 0 (0.0%) | 9 (100.0%) |
| Total (Category) | 18 (39.1%) | 28 (60.9%) |
| Total (Overall) | 56 (50.4%) | 55 (49.5%) |
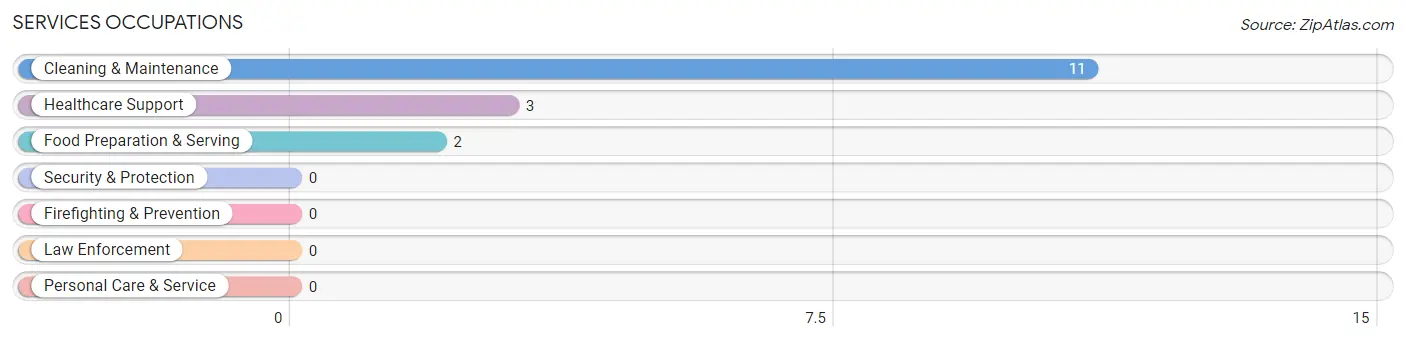
Services Occupations
The most common Services occupations in Wellman are Cleaning & Maintenance (11 | 9.9%), Healthcare Support (3 | 2.7%), and Food Preparation & Serving (2 | 1.8%).
Services Occupations by Sex
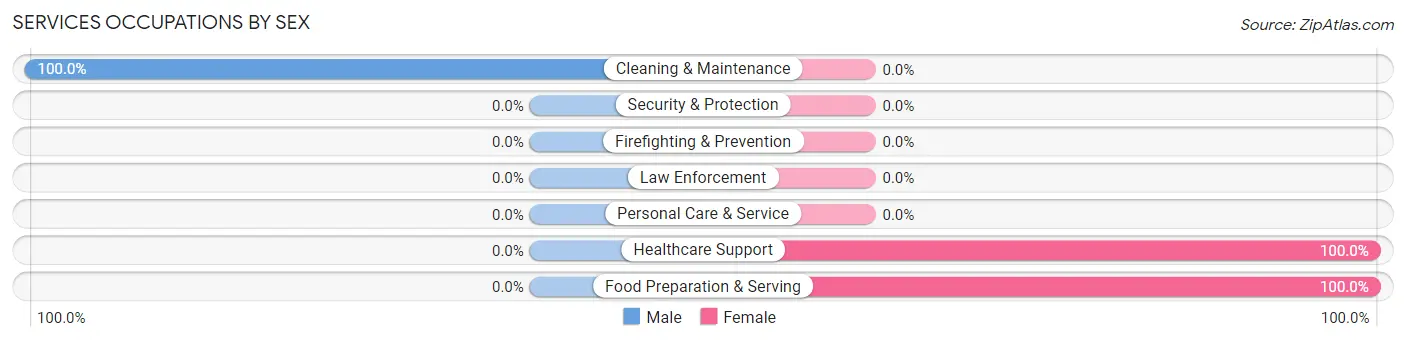
| Occupation | Male | Female |
| Healthcare Support | 0 (0.0%) | 3 (100.0%) |
| Security & Protection | 0 (0.0%) | 0 (0.0%) |
| Firefighting & Prevention | 0 (0.0%) | 0 (0.0%) |
| Law Enforcement | 0 (0.0%) | 0 (0.0%) |
| Food Preparation & Serving | 0 (0.0%) | 2 (100.0%) |
| Cleaning & Maintenance | 11 (100.0%) | 0 (0.0%) |
| Personal Care & Service | 0 (0.0%) | 0 (0.0%) |
| Total (Category) | 11 (68.8%) | 5 (31.2%) |
| Total (Overall) | 56 (50.4%) | 55 (49.5%) |
Sales and Office Occupations
The most common Sales and Office occupations in Wellman are Office & Administration (22 | 19.8%), and Sales & Related (4 | 3.6%).
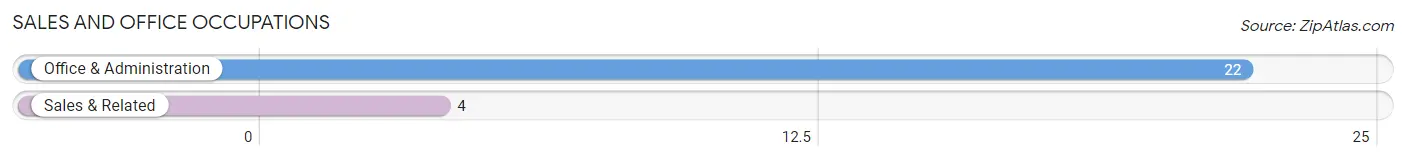
Sales and Office Occupations by Sex

| Occupation | Male | Female |
| Sales & Related | 4 (100.0%) | 0 (0.0%) |
| Office & Administration | 0 (0.0%) | 22 (100.0%) |
| Total (Category) | 4 (15.4%) | 22 (84.6%) |
| Total (Overall) | 56 (50.4%) | 55 (49.5%) |
Natural Resources, Construction and Maintenance Occupations
The most common Natural Resources, Construction and Maintenance occupations in Wellman are Farming, Fishing & Forestry (21 | 18.9%), and Installation, Maintenance & Repair (2 | 1.8%).
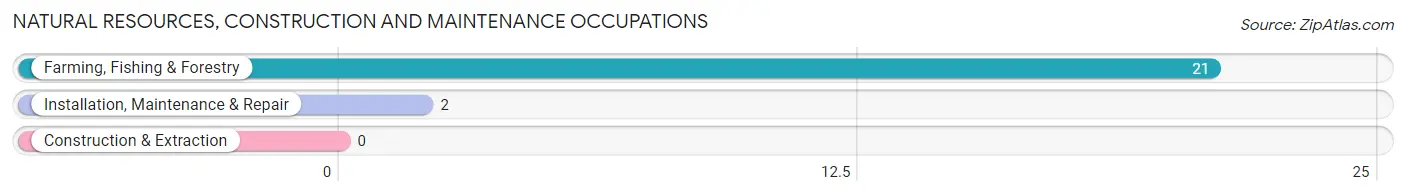
Natural Resources, Construction and Maintenance Occupations by Sex
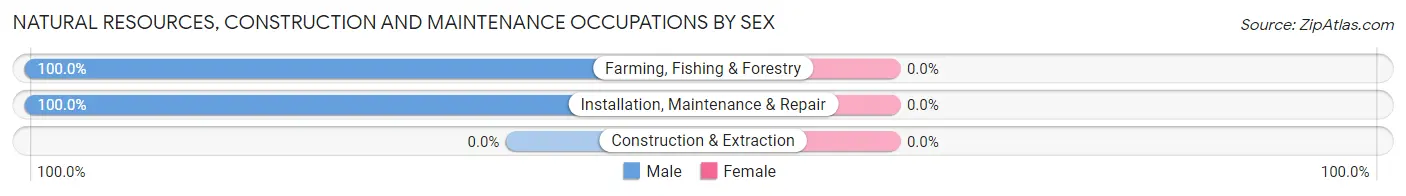
| Occupation | Male | Female |
| Farming, Fishing & Forestry | 21 (100.0%) | 0 (0.0%) |
| Construction & Extraction | 0 (0.0%) | 0 (0.0%) |
| Installation, Maintenance & Repair | 2 (100.0%) | 0 (0.0%) |
| Total (Category) | 23 (100.0%) | 0 (0.0%) |
| Total (Overall) | 56 (50.4%) | 55 (49.5%) |
Production, Transportation and Moving Occupations
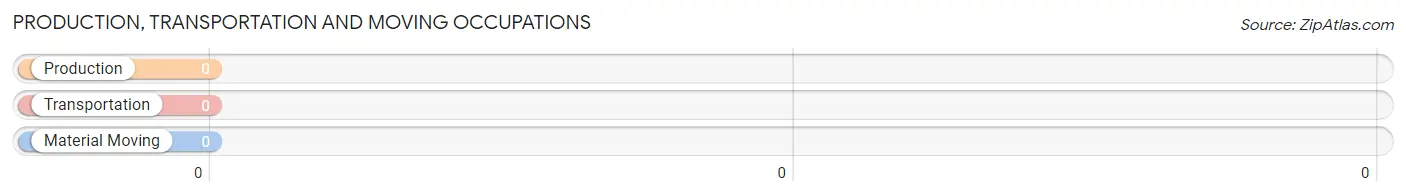
Production, Transportation and Moving Occupations by Sex
| Occupation | Male | Female |
| Production | 0 (0.0%) | 0 (0.0%) |
| Transportation | 0 (0.0%) | 0 (0.0%) |
| Material Moving | 0 (0.0%) | 0 (0.0%) |
| Total (Category) | 0 (0.0%) | 0 (0.0%) |
| Total (Overall) | 56 (50.4%) | 55 (49.5%) |
Employment Industries by Sex in Wellman
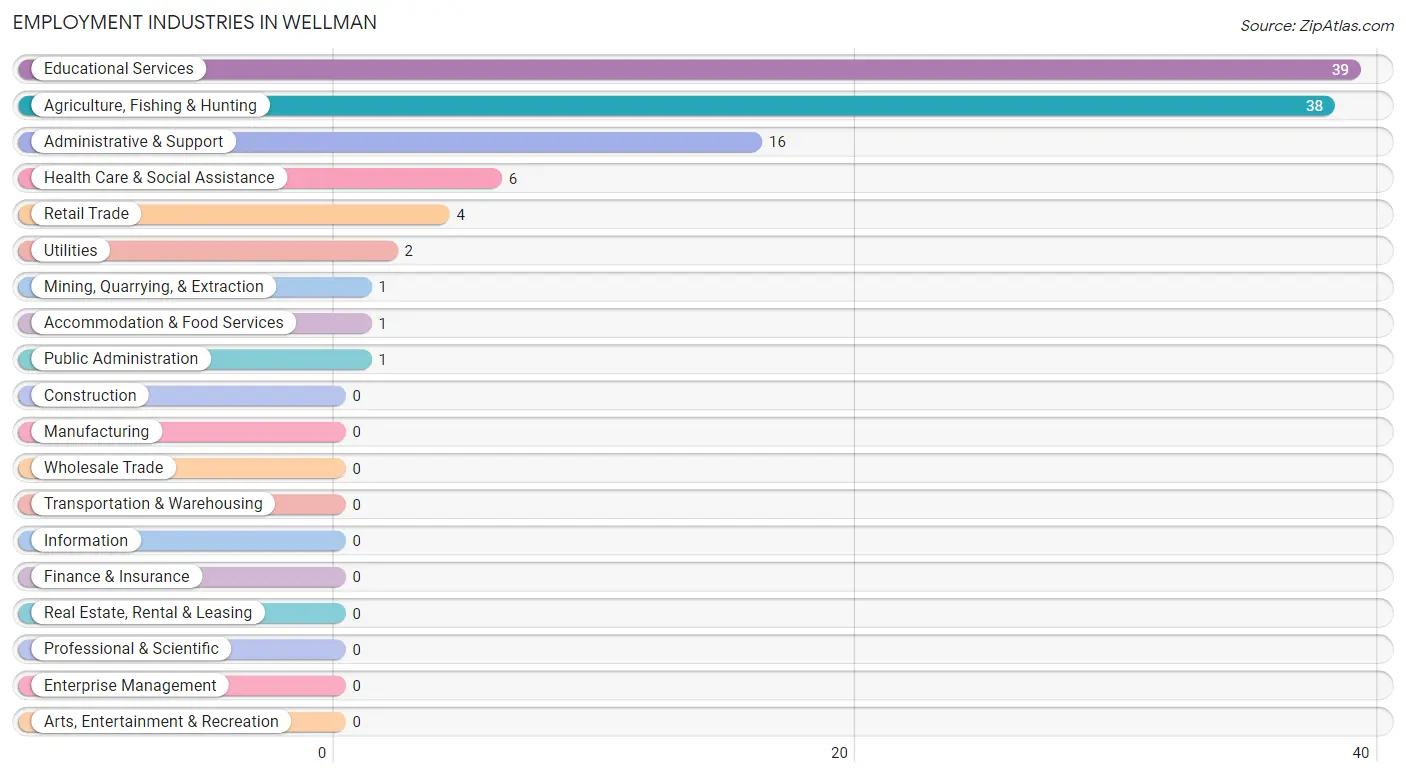
Employment Industries in Wellman
The major employment industries in Wellman include Educational Services (39 | 35.1%), Agriculture, Fishing & Hunting (38 | 34.2%), Administrative & Support (16 | 14.4%), Health Care & Social Assistance (6 | 5.4%), and Retail Trade (4 | 3.6%).
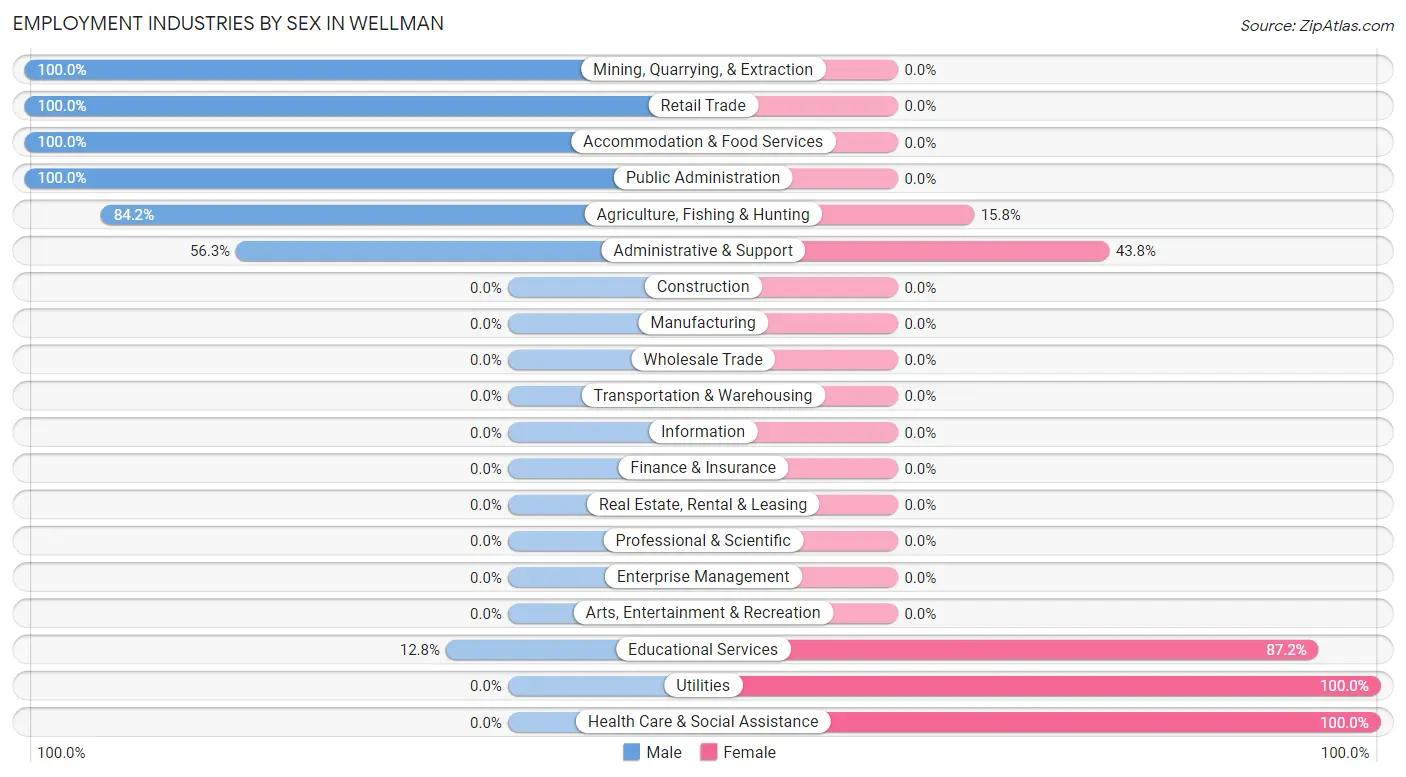
Employment Industries by Sex in Wellman
The Wellman industries that see more men than women are Mining, Quarrying, & Extraction (100.0%), Retail Trade (100.0%), and Accommodation & Food Services (100.0%), whereas the industries that tend to have a higher number of women are Utilities (100.0%), Health Care & Social Assistance (100.0%), and Educational Services (87.2%).
| Industry | Male | Female |
| Agriculture, Fishing & Hunting | 32 (84.2%) | 6 (15.8%) |
| Mining, Quarrying, & Extraction | 1 (100.0%) | 0 (0.0%) |
| Construction | 0 (0.0%) | 0 (0.0%) |
| Manufacturing | 0 (0.0%) | 0 (0.0%) |
| Wholesale Trade | 0 (0.0%) | 0 (0.0%) |
| Retail Trade | 4 (100.0%) | 0 (0.0%) |
| Transportation & Warehousing | 0 (0.0%) | 0 (0.0%) |
| Utilities | 0 (0.0%) | 2 (100.0%) |
| Information | 0 (0.0%) | 0 (0.0%) |
| Finance & Insurance | 0 (0.0%) | 0 (0.0%) |
| Real Estate, Rental & Leasing | 0 (0.0%) | 0 (0.0%) |
| Professional & Scientific | 0 (0.0%) | 0 (0.0%) |
| Enterprise Management | 0 (0.0%) | 0 (0.0%) |
| Administrative & Support | 9 (56.2%) | 7 (43.8%) |
| Educational Services | 5 (12.8%) | 34 (87.2%) |
| Health Care & Social Assistance | 0 (0.0%) | 6 (100.0%) |
| Arts, Entertainment & Recreation | 0 (0.0%) | 0 (0.0%) |
| Accommodation & Food Services | 1 (100.0%) | 0 (0.0%) |
| Public Administration | 1 (100.0%) | 0 (0.0%) |
| Total | 56 (50.4%) | 55 (49.5%) |
Education in Wellman
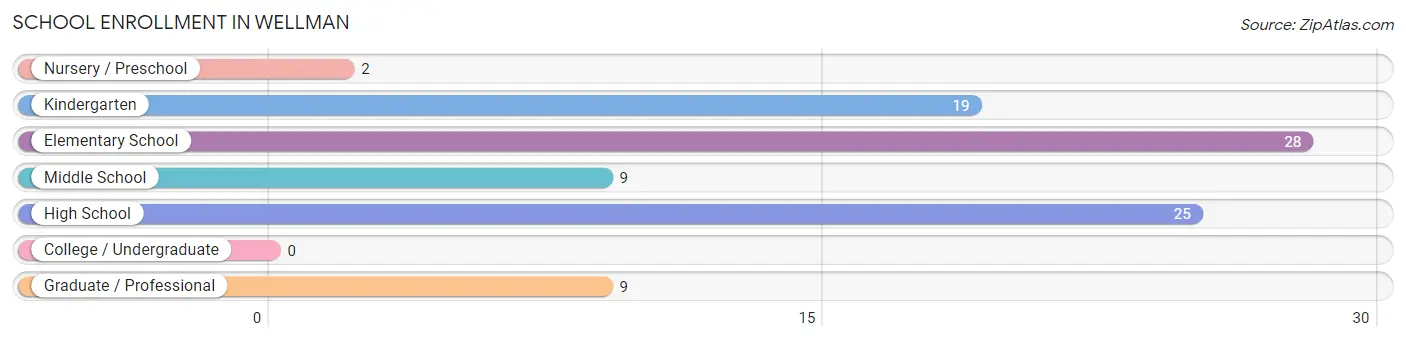
School Enrollment in Wellman
The most common levels of schooling among the 92 students in Wellman are elementary school (28 | 30.4%), high school (25 | 27.2%), and kindergarten (19 | 20.6%).
| School Level | # Students | % Students |
| Nursery / Preschool | 2 | 2.2% |
| Kindergarten | 19 | 20.6% |
| Elementary School | 28 | 30.4% |
| Middle School | 9 | 9.8% |
| High School | 25 | 27.2% |
| College / Undergraduate | 0 | 0.0% |
| Graduate / Professional | 9 | 9.8% |
| Total | 92 | 100.0% |
School Enrollment by Age by Funding Source in Wellman
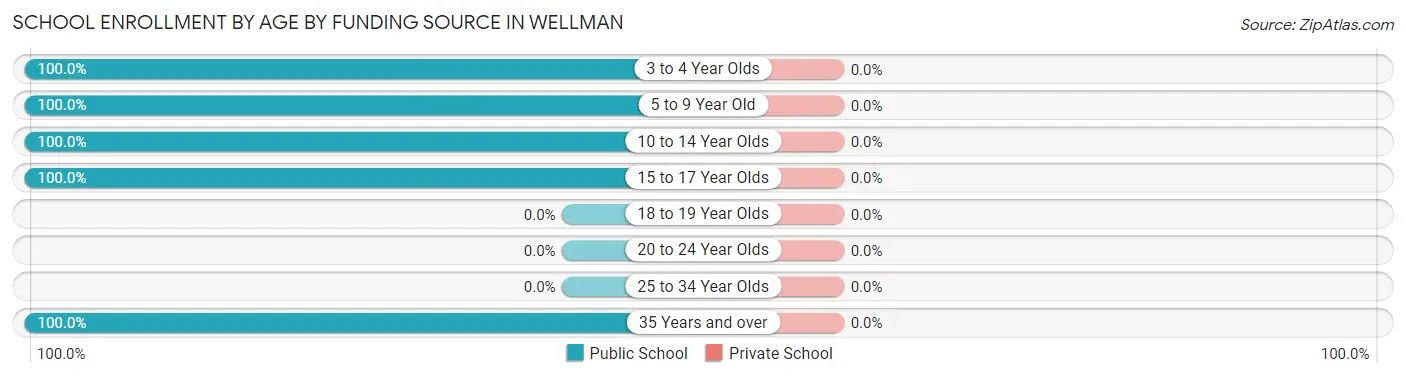
| Age Bracket | Public School | Private School |
| 3 to 4 Year Olds | 2 (100.0%) | 0 (0.0%) |
| 5 to 9 Year Old | 46 (100.0%) | 0 (0.0%) |
| 10 to 14 Year Olds | 19 (100.0%) | 0 (0.0%) |
| 15 to 17 Year Olds | 16 (100.0%) | 0 (0.0%) |
| 18 to 19 Year Olds | 0 (0.0%) | 0 (0.0%) |
| 20 to 24 Year Olds | 0 (0.0%) | 0 (0.0%) |
| 25 to 34 Year Olds | 0 (0.0%) | 0 (0.0%) |
| 35 Years and over | 9 (100.0%) | 0 (0.0%) |
| Total | 92 (100.0%) | 0 (0.0%) |
Educational Attainment by Field of Study in Wellman
Education (12 | 50.0%), science & technology (9 | 37.5%), psychology (2 | 8.3%), and bio, nature & agricultural (1 | 4.2%) are the most common fields of study among 24 individuals in Wellman who have obtained a bachelor's degree or higher.
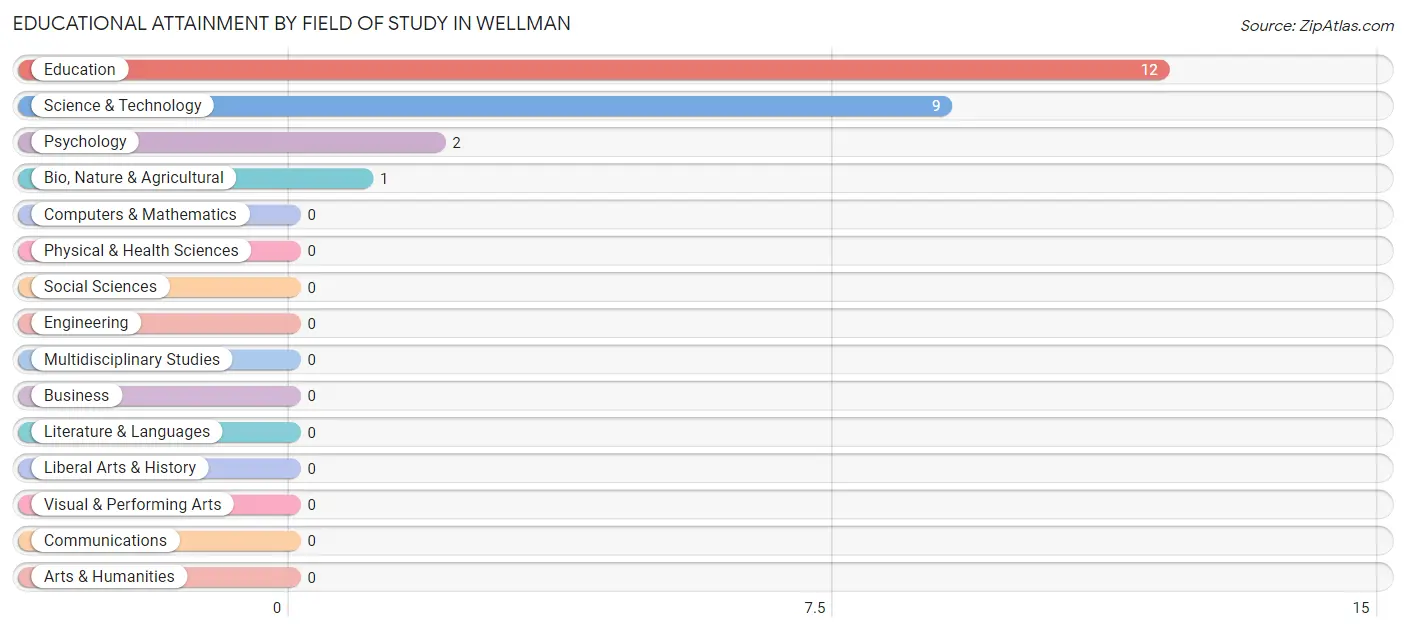
| Field of Study | # Graduates | % Graduates |
| Computers & Mathematics | 0 | 0.0% |
| Bio, Nature & Agricultural | 1 | 4.2% |
| Physical & Health Sciences | 0 | 0.0% |
| Psychology | 2 | 8.3% |
| Social Sciences | 0 | 0.0% |
| Engineering | 0 | 0.0% |
| Multidisciplinary Studies | 0 | 0.0% |
| Science & Technology | 9 | 37.5% |
| Business | 0 | 0.0% |
| Education | 12 | 50.0% |
| Literature & Languages | 0 | 0.0% |
| Liberal Arts & History | 0 | 0.0% |
| Visual & Performing Arts | 0 | 0.0% |
| Communications | 0 | 0.0% |
| Arts & Humanities | 0 | 0.0% |
| Total | 24 | 100.0% |
Transportation & Commute in Wellman
Vehicle Availability by Sex in Wellman
The most prevalent vehicle ownership categories in Wellman are males with 2 vehicles (33, accounting for 58.9%) and females with 2 vehicles (36, making up 60.0%).
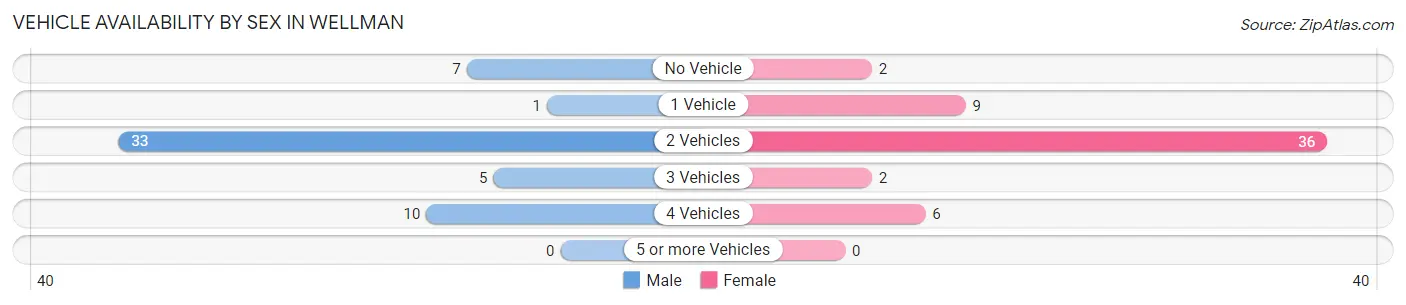
| Vehicles Available | Male | Female |
| No Vehicle | 7 (12.5%) | 2 (3.6%) |
| 1 Vehicle | 1 (1.8%) | 9 (16.4%) |
| 2 Vehicles | 33 (58.9%) | 36 (65.4%) |
| 3 Vehicles | 5 (8.9%) | 2 (3.6%) |
| 4 Vehicles | 10 (17.9%) | 6 (10.9%) |
| 5 or more Vehicles | 0 (0.0%) | 0 (0.0%) |
| Total | 56 (100.0%) | 55 (100.0%) |
Commute Time in Wellman
The most frequently occuring commute durations in Wellman are 5 to 9 minutes (34 commuters, 30.6%), 15 to 19 minutes (26 commuters, 23.4%), and 10 to 14 minutes (18 commuters, 16.2%).
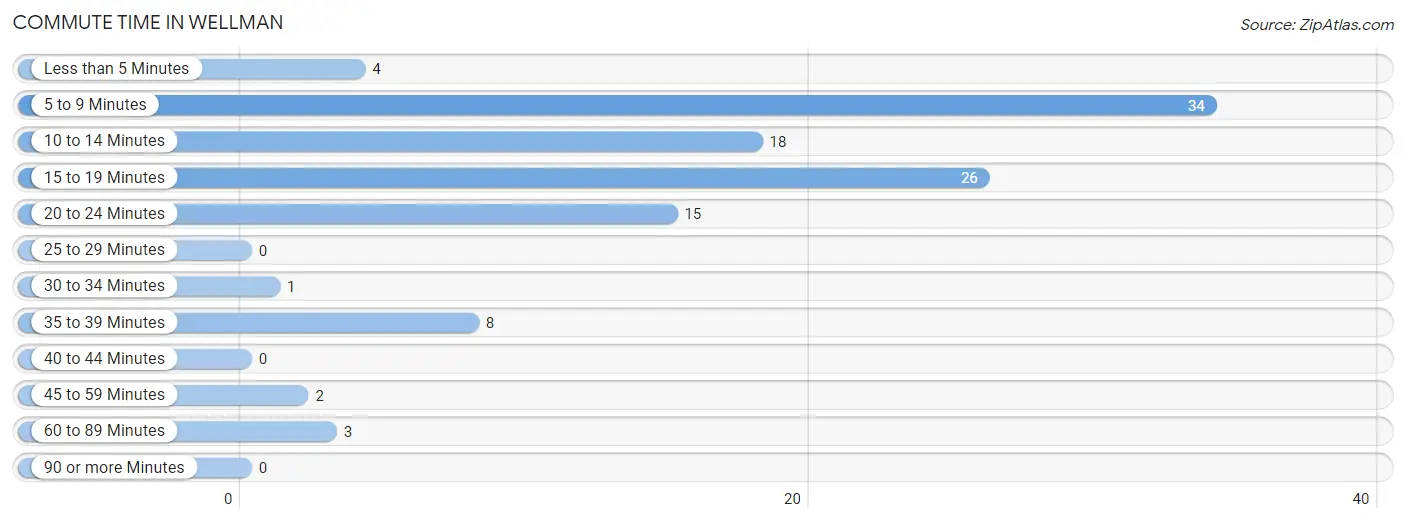
| Commute Time | # Commuters | % Commuters |
| Less than 5 Minutes | 4 | 3.6% |
| 5 to 9 Minutes | 34 | 30.6% |
| 10 to 14 Minutes | 18 | 16.2% |
| 15 to 19 Minutes | 26 | 23.4% |
| 20 to 24 Minutes | 15 | 13.5% |
| 25 to 29 Minutes | 0 | 0.0% |
| 30 to 34 Minutes | 1 | 0.9% |
| 35 to 39 Minutes | 8 | 7.2% |
| 40 to 44 Minutes | 0 | 0.0% |
| 45 to 59 Minutes | 2 | 1.8% |
| 60 to 89 Minutes | 3 | 2.7% |
| 90 or more Minutes | 0 | 0.0% |
Commute Time by Sex in Wellman
The most common commute times in Wellman are 15 to 19 minutes (26 commuters, 46.4%) for males and 5 to 9 minutes (29 commuters, 52.7%) for females.
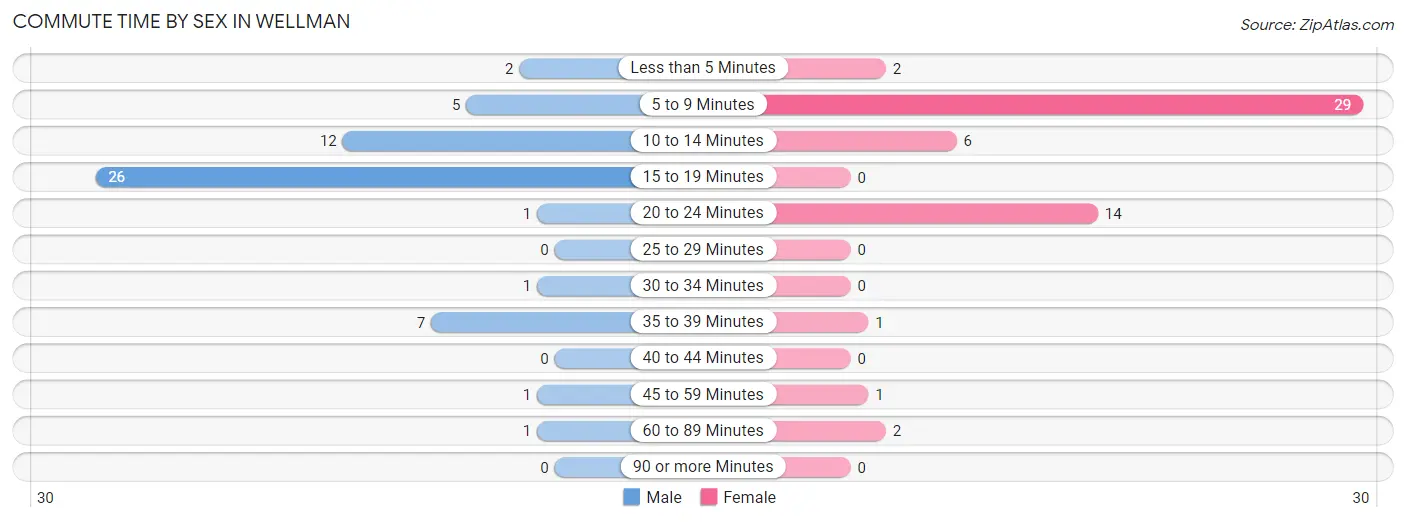
| Commute Time | Male | Female |
| Less than 5 Minutes | 2 (3.6%) | 2 (3.6%) |
| 5 to 9 Minutes | 5 (8.9%) | 29 (52.7%) |
| 10 to 14 Minutes | 12 (21.4%) | 6 (10.9%) |
| 15 to 19 Minutes | 26 (46.4%) | 0 (0.0%) |
| 20 to 24 Minutes | 1 (1.8%) | 14 (25.5%) |
| 25 to 29 Minutes | 0 (0.0%) | 0 (0.0%) |
| 30 to 34 Minutes | 1 (1.8%) | 0 (0.0%) |
| 35 to 39 Minutes | 7 (12.5%) | 1 (1.8%) |
| 40 to 44 Minutes | 0 (0.0%) | 0 (0.0%) |
| 45 to 59 Minutes | 1 (1.8%) | 1 (1.8%) |
| 60 to 89 Minutes | 1 (1.8%) | 2 (3.6%) |
| 90 or more Minutes | 0 (0.0%) | 0 (0.0%) |
Time of Departure to Work by Sex in Wellman
The most frequent times of departure to work in Wellman are 6:30 AM to 6:59 AM (24, 42.9%) for males and 7:00 AM to 7:29 AM (27, 49.1%) for females.
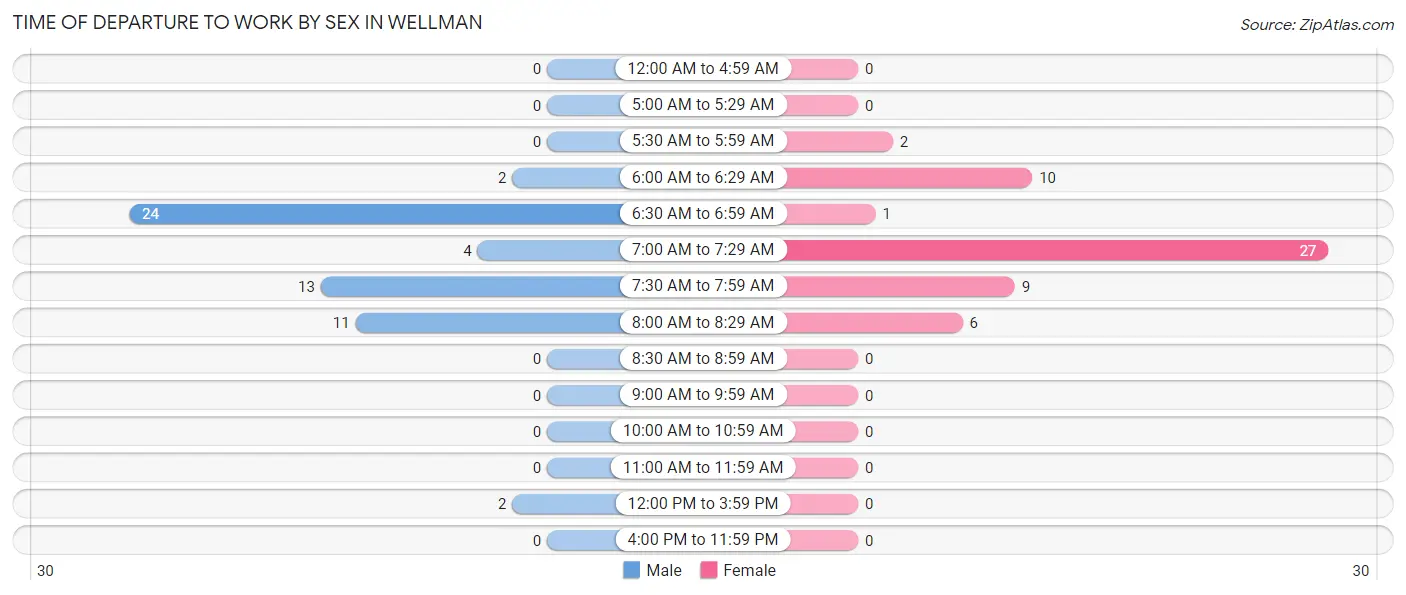
| Time of Departure | Male | Female |
| 12:00 AM to 4:59 AM | 0 (0.0%) | 0 (0.0%) |
| 5:00 AM to 5:29 AM | 0 (0.0%) | 0 (0.0%) |
| 5:30 AM to 5:59 AM | 0 (0.0%) | 2 (3.6%) |
| 6:00 AM to 6:29 AM | 2 (3.6%) | 10 (18.2%) |
| 6:30 AM to 6:59 AM | 24 (42.9%) | 1 (1.8%) |
| 7:00 AM to 7:29 AM | 4 (7.1%) | 27 (49.1%) |
| 7:30 AM to 7:59 AM | 13 (23.2%) | 9 (16.4%) |
| 8:00 AM to 8:29 AM | 11 (19.6%) | 6 (10.9%) |
| 8:30 AM to 8:59 AM | 0 (0.0%) | 0 (0.0%) |
| 9:00 AM to 9:59 AM | 0 (0.0%) | 0 (0.0%) |
| 10:00 AM to 10:59 AM | 0 (0.0%) | 0 (0.0%) |
| 11:00 AM to 11:59 AM | 0 (0.0%) | 0 (0.0%) |
| 12:00 PM to 3:59 PM | 2 (3.6%) | 0 (0.0%) |
| 4:00 PM to 11:59 PM | 0 (0.0%) | 0 (0.0%) |
| Total | 56 (100.0%) | 55 (100.0%) |
Housing Occupancy in Wellman
Occupancy by Ownership in Wellman
Of the total 70 dwellings in Wellman, owner-occupied units account for 54 (77.1%), while renter-occupied units make up 16 (22.9%).
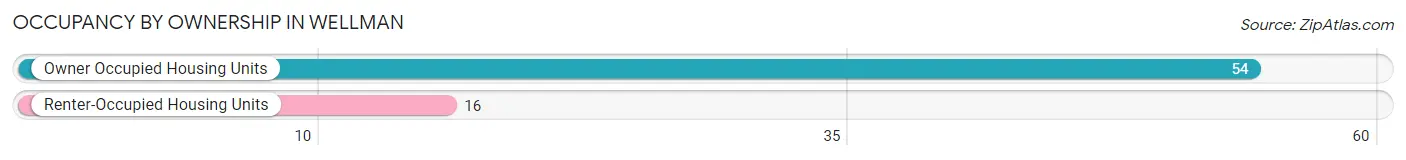
| Occupancy | # Housing Units | % Housing Units |
| Owner Occupied Housing Units | 54 | 77.1% |
| Renter-Occupied Housing Units | 16 | 22.9% |
| Total Occupied Housing Units | 70 | 100.0% |
Occupancy by Household Size in Wellman
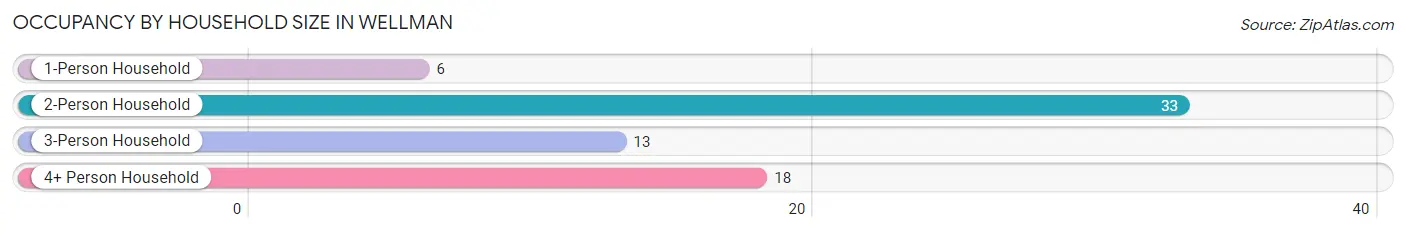
| Household Size | # Housing Units | % Housing Units |
| 1-Person Household | 6 | 8.6% |
| 2-Person Household | 33 | 47.1% |
| 3-Person Household | 13 | 18.6% |
| 4+ Person Household | 18 | 25.7% |
| Total Housing Units | 70 | 100.0% |
Occupancy by Ownership by Household Size in Wellman
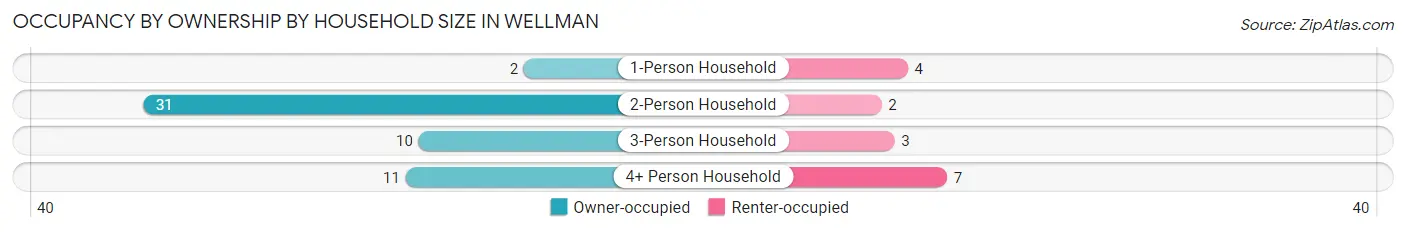
| Household Size | Owner-occupied | Renter-occupied |
| 1-Person Household | 2 (33.3%) | 4 (66.7%) |
| 2-Person Household | 31 (93.9%) | 2 (6.1%) |
| 3-Person Household | 10 (76.9%) | 3 (23.1%) |
| 4+ Person Household | 11 (61.1%) | 7 (38.9%) |
| Total Housing Units | 54 (77.1%) | 16 (22.9%) |
Occupancy by Educational Attainment in Wellman
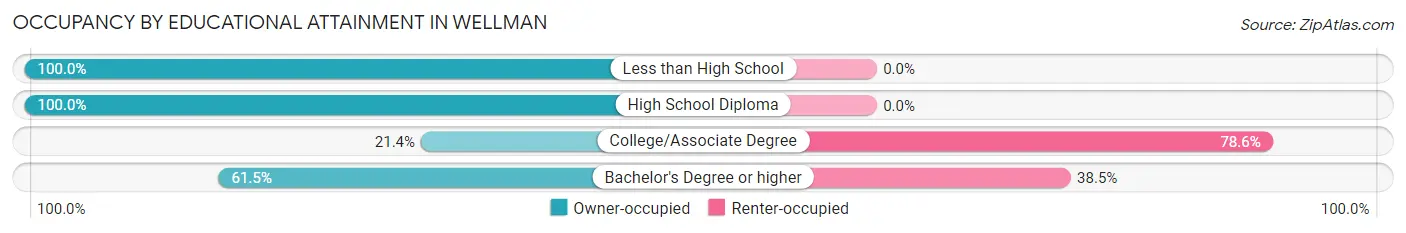
| Household Size | Owner-occupied | Renter-occupied |
| Less than High School | 21 (100.0%) | 0 (0.0%) |
| High School Diploma | 22 (100.0%) | 0 (0.0%) |
| College/Associate Degree | 3 (21.4%) | 11 (78.6%) |
| Bachelor's Degree or higher | 8 (61.5%) | 5 (38.5%) |
Occupancy by Age of Householder in Wellman
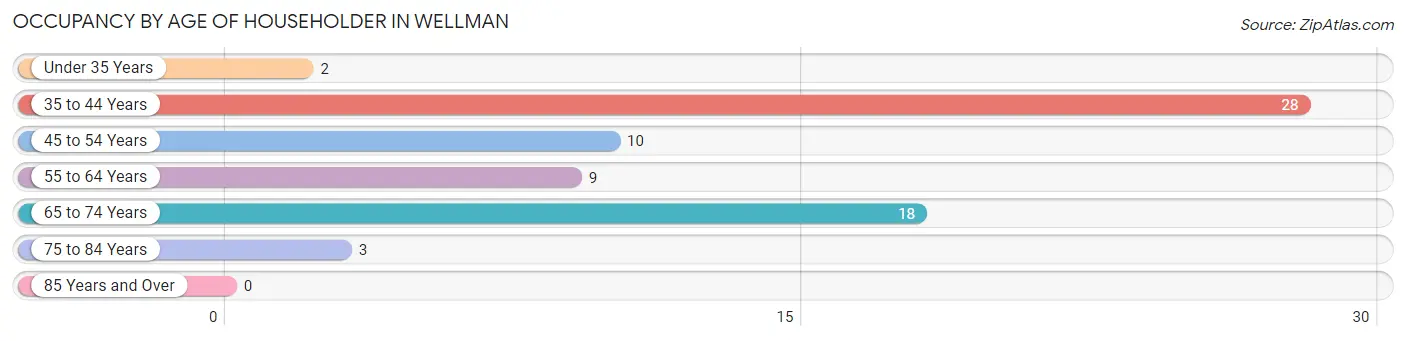
| Age Bracket | # Households | % Households |
| Under 35 Years | 2 | 2.9% |
| 35 to 44 Years | 28 | 40.0% |
| 45 to 54 Years | 10 | 14.3% |
| 55 to 64 Years | 9 | 12.9% |
| 65 to 74 Years | 18 | 25.7% |
| 75 to 84 Years | 3 | 4.3% |
| 85 Years and Over | 0 | 0.0% |
| Total | 70 | 100.0% |
Housing Finances in Wellman
Median Income by Occupancy in Wellman
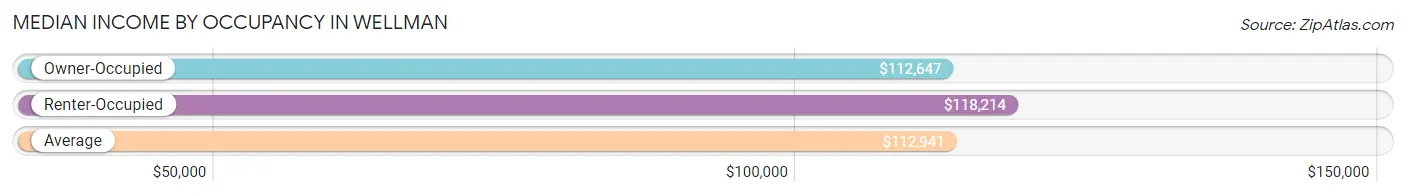
| Occupancy Type | # Households | Median Income |
| Owner-Occupied | 54 (77.1%) | $112,647 |
| Renter-Occupied | 16 (22.9%) | $118,214 |
| Average | 70 (100.0%) | $112,941 |
Occupancy by Householder Income Bracket in Wellman
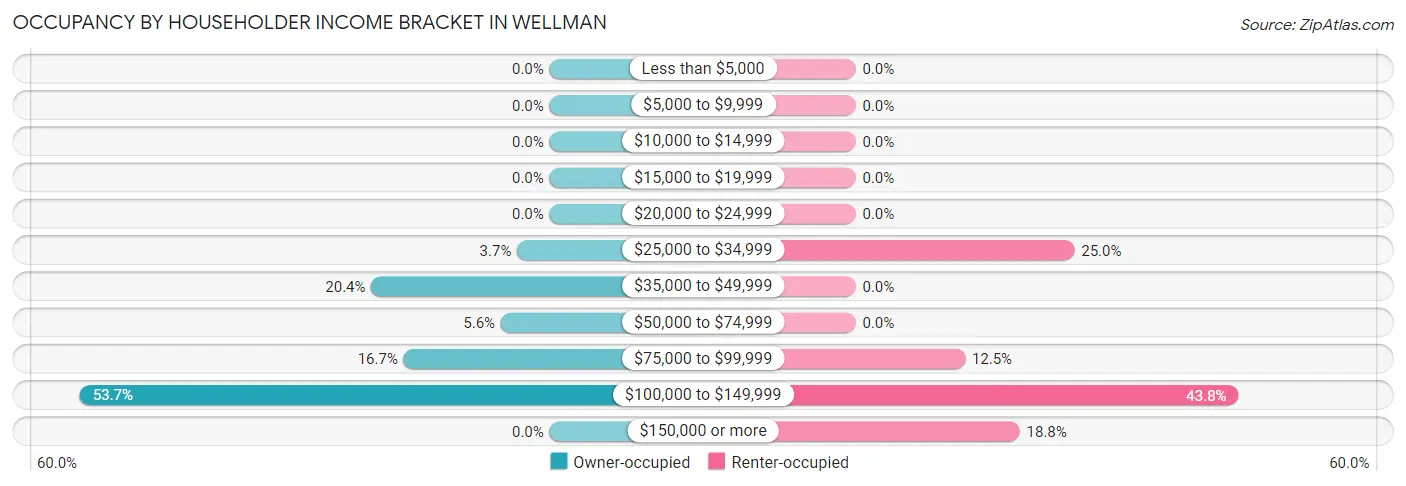
| Income Bracket | Owner-occupied | Renter-occupied |
| Less than $5,000 | 0 (0.0%) | 0 (0.0%) |
| $5,000 to $9,999 | 0 (0.0%) | 0 (0.0%) |
| $10,000 to $14,999 | 0 (0.0%) | 0 (0.0%) |
| $15,000 to $19,999 | 0 (0.0%) | 0 (0.0%) |
| $20,000 to $24,999 | 0 (0.0%) | 0 (0.0%) |
| $25,000 to $34,999 | 2 (3.7%) | 4 (25.0%) |
| $35,000 to $49,999 | 11 (20.4%) | 0 (0.0%) |
| $50,000 to $74,999 | 3 (5.6%) | 0 (0.0%) |
| $75,000 to $99,999 | 9 (16.7%) | 2 (12.5%) |
| $100,000 to $149,999 | 29 (53.7%) | 7 (43.8%) |
| $150,000 or more | 0 (0.0%) | 3 (18.8%) |
| Total | 54 (100.0%) | 16 (100.0%) |
Monthly Housing Cost Tiers in Wellman
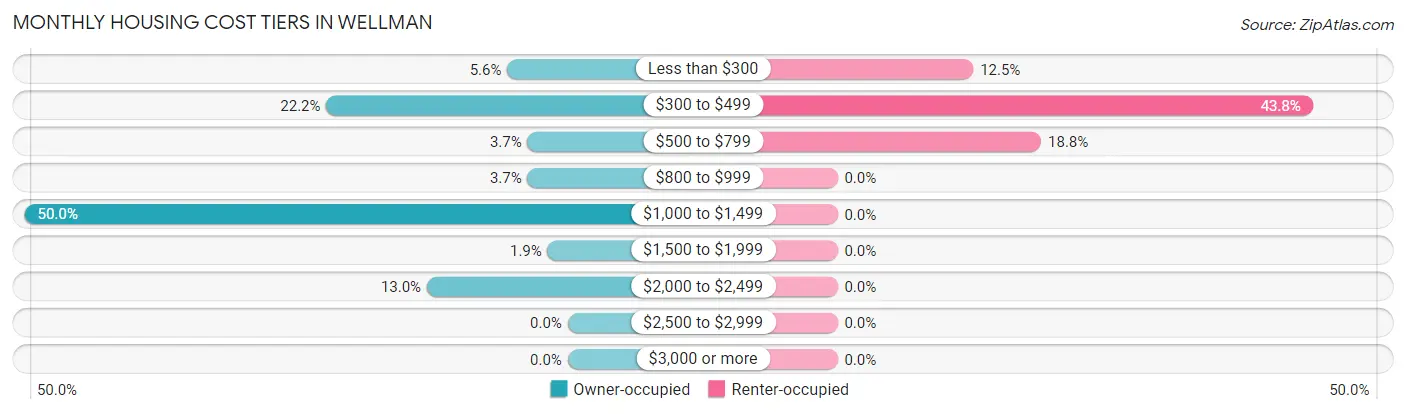
| Monthly Cost | Owner-occupied | Renter-occupied |
| Less than $300 | 3 (5.6%) | 2 (12.5%) |
| $300 to $499 | 12 (22.2%) | 7 (43.8%) |
| $500 to $799 | 2 (3.7%) | 3 (18.8%) |
| $800 to $999 | 2 (3.7%) | 0 (0.0%) |
| $1,000 to $1,499 | 27 (50.0%) | 0 (0.0%) |
| $1,500 to $1,999 | 1 (1.8%) | 0 (0.0%) |
| $2,000 to $2,499 | 7 (13.0%) | 0 (0.0%) |
| $2,500 to $2,999 | 0 (0.0%) | 0 (0.0%) |
| $3,000 or more | 0 (0.0%) | 0 (0.0%) |
| Total | 54 (100.0%) | 16 (100.0%) |
Physical Housing Characteristics in Wellman
Housing Structures in Wellman

| Structure Type | # Housing Units | % Housing Units |
| Single Unit, Detached | 68 | 97.1% |
| Single Unit, Attached | 0 | 0.0% |
| 2 Unit Apartments | 0 | 0.0% |
| 3 or 4 Unit Apartments | 0 | 0.0% |
| 5 to 9 Unit Apartments | 0 | 0.0% |
| 10 or more Apartments | 0 | 0.0% |
| Mobile Home / Other | 2 | 2.9% |
| Total | 70 | 100.0% |
Housing Structures by Occupancy in Wellman
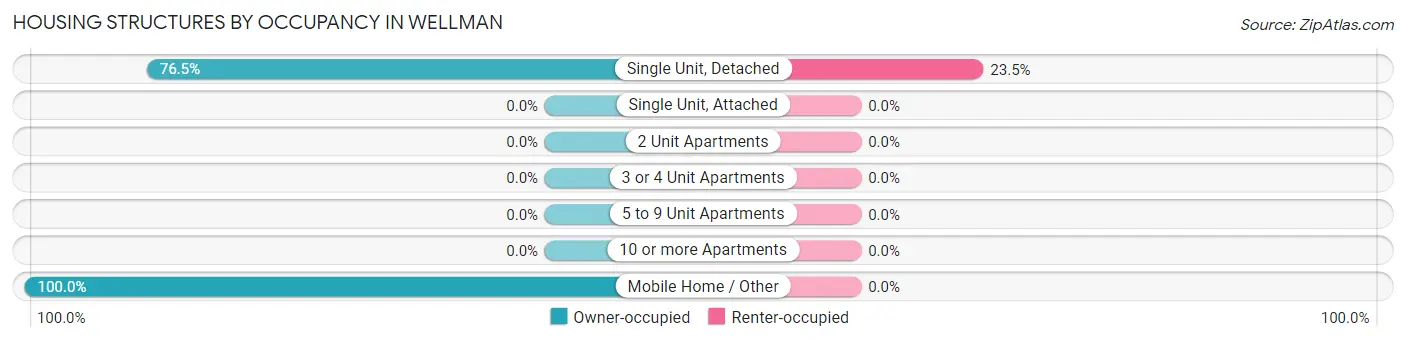
| Structure Type | Owner-occupied | Renter-occupied |
| Single Unit, Detached | 52 (76.5%) | 16 (23.5%) |
| Single Unit, Attached | 0 (0.0%) | 0 (0.0%) |
| 2 Unit Apartments | 0 (0.0%) | 0 (0.0%) |
| 3 or 4 Unit Apartments | 0 (0.0%) | 0 (0.0%) |
| 5 to 9 Unit Apartments | 0 (0.0%) | 0 (0.0%) |
| 10 or more Apartments | 0 (0.0%) | 0 (0.0%) |
| Mobile Home / Other | 2 (100.0%) | 0 (0.0%) |
| Total | 54 (77.1%) | 16 (22.9%) |
Housing Structures by Number of Rooms in Wellman
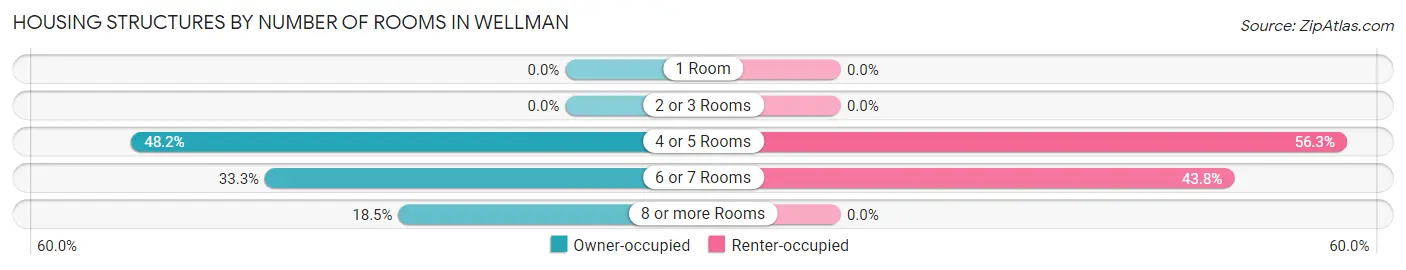
| Number of Rooms | Owner-occupied | Renter-occupied |
| 1 Room | 0 (0.0%) | 0 (0.0%) |
| 2 or 3 Rooms | 0 (0.0%) | 0 (0.0%) |
| 4 or 5 Rooms | 26 (48.1%) | 9 (56.2%) |
| 6 or 7 Rooms | 18 (33.3%) | 7 (43.8%) |
| 8 or more Rooms | 10 (18.5%) | 0 (0.0%) |
| Total | 54 (100.0%) | 16 (100.0%) |
Housing Structure by Heating Type in Wellman
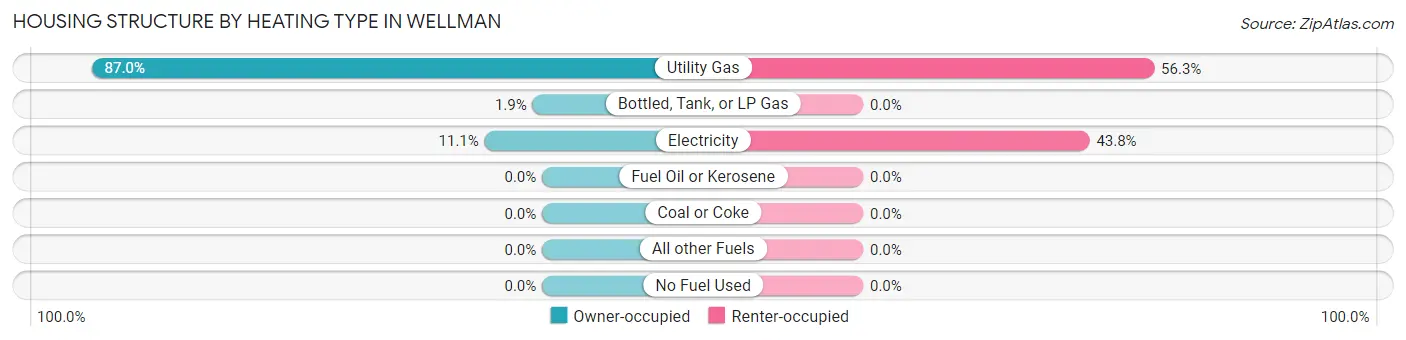
| Heating Type | Owner-occupied | Renter-occupied |
| Utility Gas | 47 (87.0%) | 9 (56.2%) |
| Bottled, Tank, or LP Gas | 1 (1.8%) | 0 (0.0%) |
| Electricity | 6 (11.1%) | 7 (43.8%) |
| Fuel Oil or Kerosene | 0 (0.0%) | 0 (0.0%) |
| Coal or Coke | 0 (0.0%) | 0 (0.0%) |
| All other Fuels | 0 (0.0%) | 0 (0.0%) |
| No Fuel Used | 0 (0.0%) | 0 (0.0%) |
| Total | 54 (100.0%) | 16 (100.0%) |
Household Vehicle Usage in Wellman
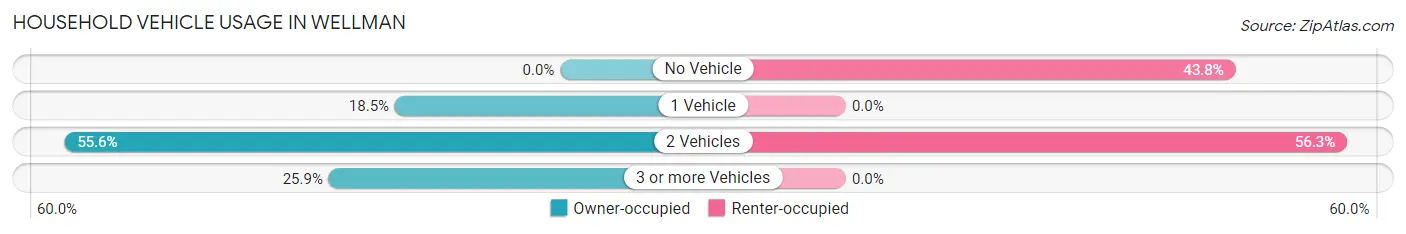
| Vehicles per Household | Owner-occupied | Renter-occupied |
| No Vehicle | 0 (0.0%) | 7 (43.8%) |
| 1 Vehicle | 10 (18.5%) | 0 (0.0%) |
| 2 Vehicles | 30 (55.6%) | 9 (56.2%) |
| 3 or more Vehicles | 14 (25.9%) | 0 (0.0%) |
| Total | 54 (100.0%) | 16 (100.0%) |
Real Estate & Mortgages in Wellman
Real Estate and Mortgage Overview in Wellman
| Characteristic | Without Mortgage | With Mortgage |
| Housing Units | 27 | 27 |
| Median Property Value | - | - |
| Median Household Income | - | - |
| Monthly Housing Costs | - | - |
| Real Estate Taxes | - | - |
Property Value by Mortgage Status in Wellman
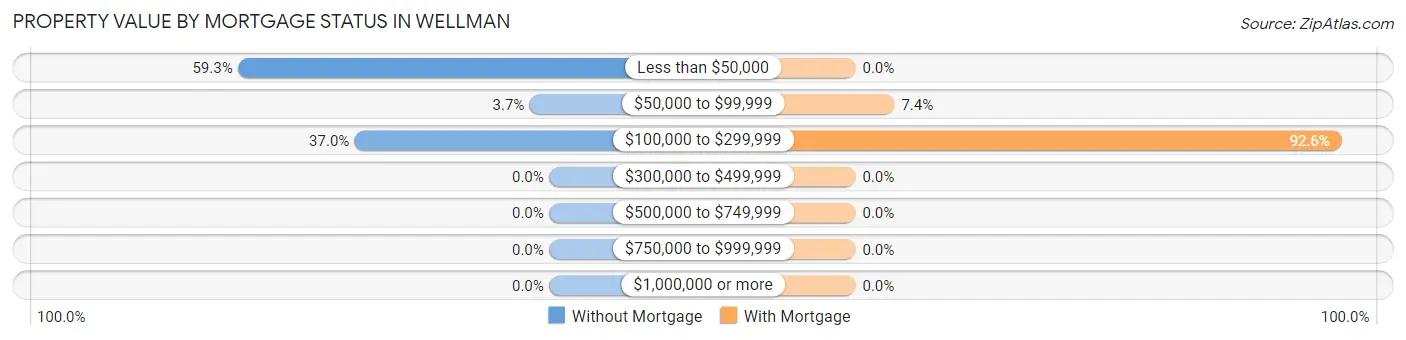
| Property Value | Without Mortgage | With Mortgage |
| Less than $50,000 | 16 (59.3%) | 0 (0.0%) |
| $50,000 to $99,999 | 1 (3.7%) | 2 (7.4%) |
| $100,000 to $299,999 | 10 (37.0%) | 25 (92.6%) |
| $300,000 to $499,999 | 0 (0.0%) | 0 (0.0%) |
| $500,000 to $749,999 | 0 (0.0%) | 0 (0.0%) |
| $750,000 to $999,999 | 0 (0.0%) | 0 (0.0%) |
| $1,000,000 or more | 0 (0.0%) | 0 (0.0%) |
| Total | 27 (100.0%) | 27 (100.0%) |
Household Income by Mortgage Status in Wellman
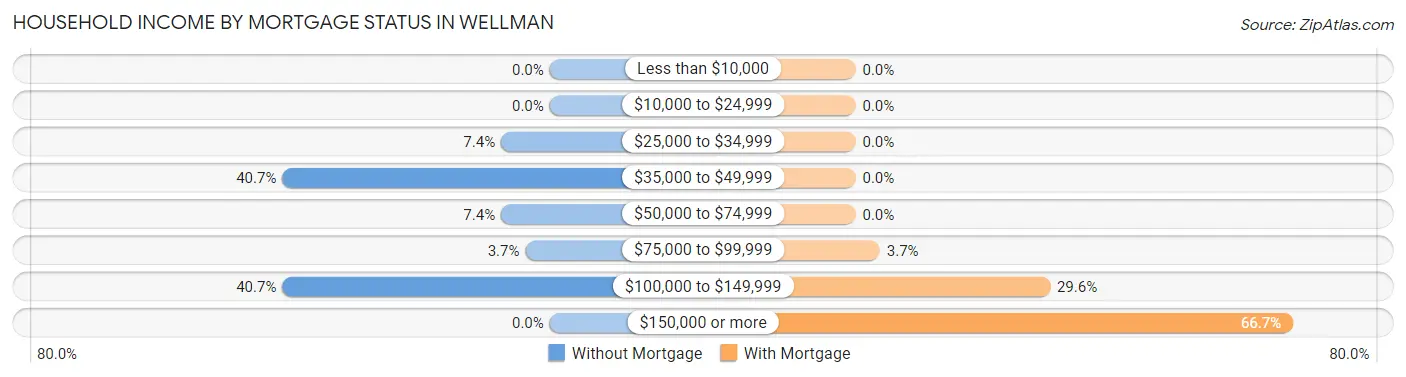
| Household Income | Without Mortgage | With Mortgage |
| Less than $10,000 | 0 (0.0%) | 0 (0.0%) |
| $10,000 to $24,999 | 0 (0.0%) | 0 (0.0%) |
| $25,000 to $34,999 | 2 (7.4%) | 0 (0.0%) |
| $35,000 to $49,999 | 11 (40.7%) | 0 (0.0%) |
| $50,000 to $74,999 | 2 (7.4%) | 0 (0.0%) |
| $75,000 to $99,999 | 1 (3.7%) | 1 (3.7%) |
| $100,000 to $149,999 | 11 (40.7%) | 8 (29.6%) |
| $150,000 or more | 0 (0.0%) | 18 (66.7%) |
| Total | 27 (100.0%) | 27 (100.0%) |
Property Value to Household Income Ratio in Wellman
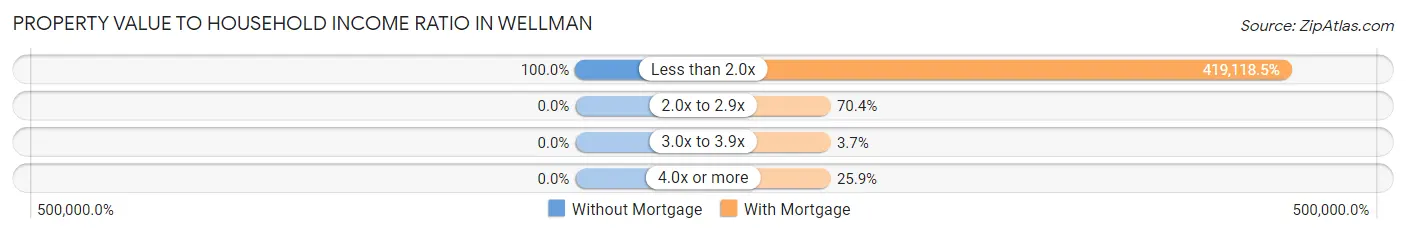
| Value-to-Income Ratio | Without Mortgage | With Mortgage |
| Less than 2.0x | 27 (100.0%) | 113,162 (419,118.5%) |
| 2.0x to 2.9x | 0 (0.0%) | 19 (70.4%) |
| 3.0x to 3.9x | 0 (0.0%) | 1 (3.7%) |
| 4.0x or more | 0 (0.0%) | 7 (25.9%) |
| Total | 27 (100.0%) | 27 (100.0%) |
Real Estate Taxes by Mortgage Status in Wellman
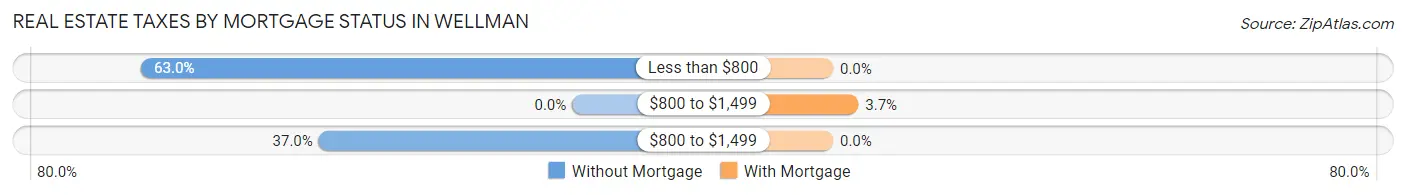
| Property Taxes | Without Mortgage | With Mortgage |
| Less than $800 | 17 (63.0%) | 0 (0.0%) |
| $800 to $1,499 | 0 (0.0%) | 1 (3.7%) |
| $800 to $1,499 | 10 (37.0%) | 0 (0.0%) |
| Total | 27 (100.0%) | 27 (100.0%) |
Health & Disability in Wellman
Health Insurance Coverage by Age in Wellman
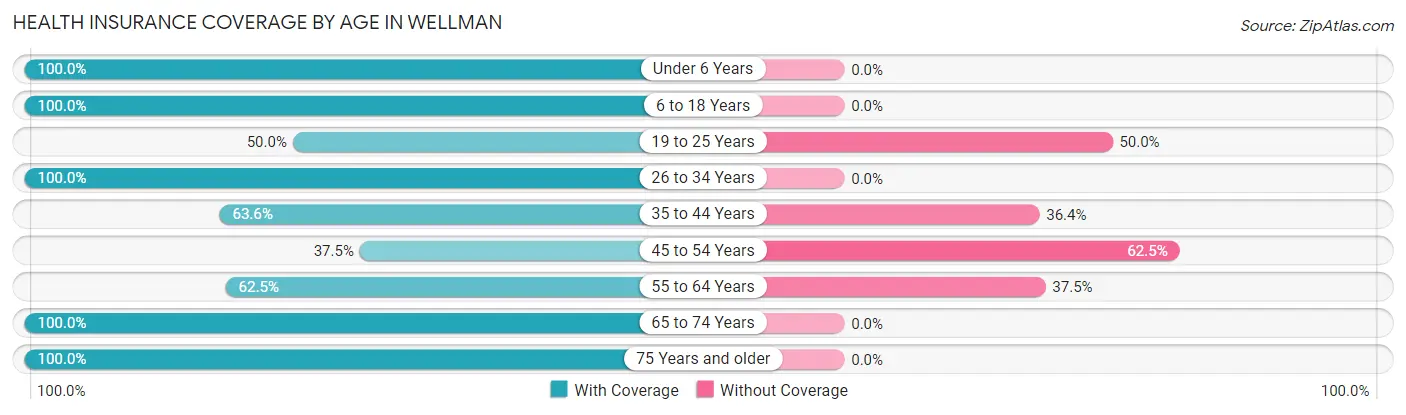
| Age Bracket | With Coverage | Without Coverage |
| Under 6 Years | 10 (100.0%) | 0 (0.0%) |
| 6 to 18 Years | 81 (100.0%) | 0 (0.0%) |
| 19 to 25 Years | 2 (50.0%) | 2 (50.0%) |
| 26 to 34 Years | 4 (100.0%) | 0 (0.0%) |
| 35 to 44 Years | 28 (63.6%) | 16 (36.4%) |
| 45 to 54 Years | 12 (37.5%) | 20 (62.5%) |
| 55 to 64 Years | 10 (62.5%) | 6 (37.5%) |
| 65 to 74 Years | 39 (100.0%) | 0 (0.0%) |
| 75 Years and older | 4 (100.0%) | 0 (0.0%) |
| Total | 190 (81.2%) | 44 (18.8%) |
Health Insurance Coverage by Citizenship Status in Wellman
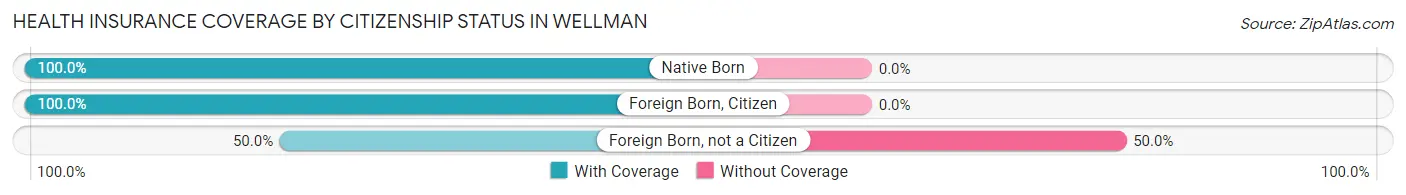
| Citizenship Status | With Coverage | Without Coverage |
| Native Born | 10 (100.0%) | 0 (0.0%) |
| Foreign Born, Citizen | 81 (100.0%) | 0 (0.0%) |
| Foreign Born, not a Citizen | 2 (50.0%) | 2 (50.0%) |
Health Insurance Coverage by Household Income in Wellman
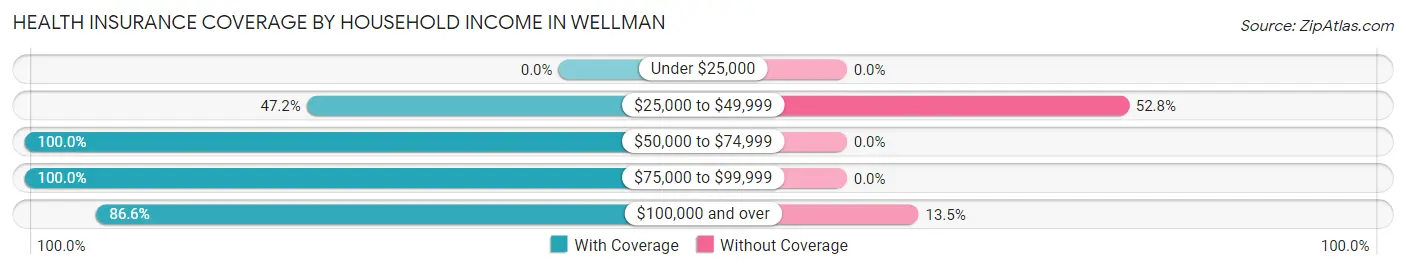
| Household Income | With Coverage | Without Coverage |
| Under $25,000 | 0 (0.0%) | 0 (0.0%) |
| $25,000 to $49,999 | 25 (47.2%) | 28 (52.8%) |
| $50,000 to $74,999 | 8 (100.0%) | 0 (0.0%) |
| $75,000 to $99,999 | 54 (100.0%) | 0 (0.0%) |
| $100,000 and over | 103 (86.6%) | 16 (13.5%) |
Public vs Private Health Insurance Coverage by Age in Wellman
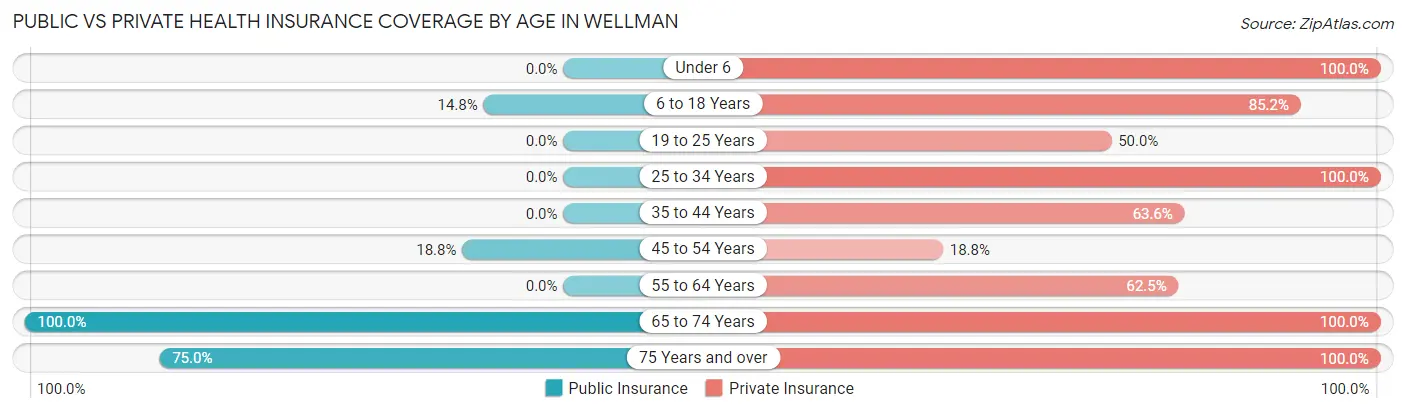
| Age Bracket | Public Insurance | Private Insurance |
| Under 6 | 0 (0.0%) | 10 (100.0%) |
| 6 to 18 Years | 12 (14.8%) | 69 (85.2%) |
| 19 to 25 Years | 0 (0.0%) | 2 (50.0%) |
| 25 to 34 Years | 0 (0.0%) | 4 (100.0%) |
| 35 to 44 Years | 0 (0.0%) | 28 (63.6%) |
| 45 to 54 Years | 6 (18.8%) | 6 (18.8%) |
| 55 to 64 Years | 0 (0.0%) | 10 (62.5%) |
| 65 to 74 Years | 39 (100.0%) | 39 (100.0%) |
| 75 Years and over | 3 (75.0%) | 4 (100.0%) |
| Total | 60 (25.6%) | 172 (73.5%) |
Disability Status by Sex by Age in Wellman
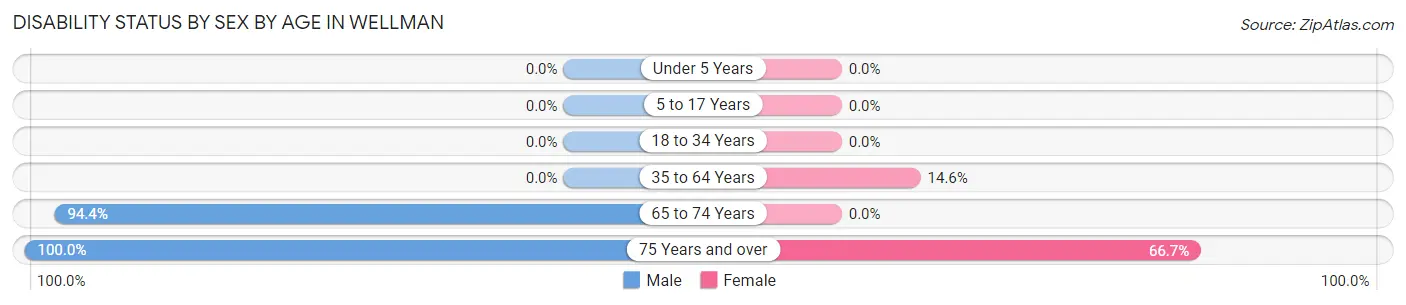
| Age Bracket | Male | Female |
| Under 5 Years | 0 (0.0%) | 0 (0.0%) |
| 5 to 17 Years | 0 (0.0%) | 0 (0.0%) |
| 18 to 34 Years | 0 (0.0%) | 0 (0.0%) |
| 35 to 64 Years | 0 (0.0%) | 6 (14.6%) |
| 65 to 74 Years | 17 (94.4%) | 0 (0.0%) |
| 75 Years and over | 1 (100.0%) | 2 (66.7%) |
Disability Class by Sex by Age in Wellman
Disability Class: Hearing Difficulty
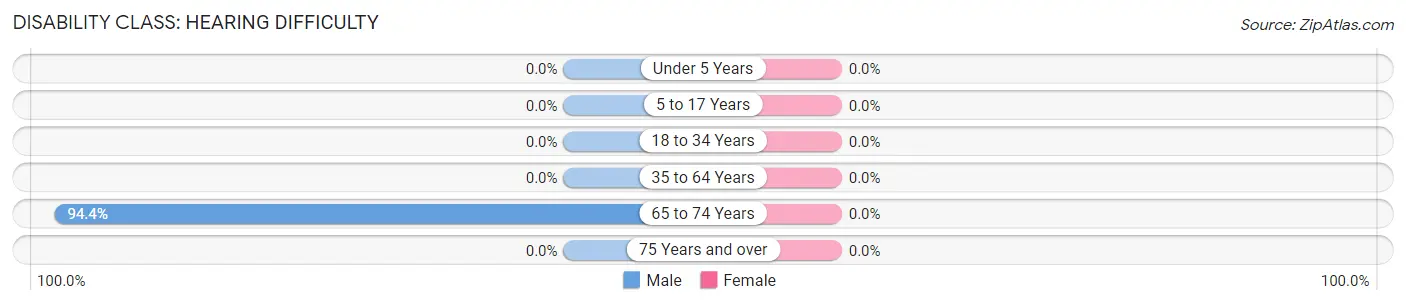
| Age Bracket | Male | Female |
| Under 5 Years | 0 (0.0%) | 0 (0.0%) |
| 5 to 17 Years | 0 (0.0%) | 0 (0.0%) |
| 18 to 34 Years | 0 (0.0%) | 0 (0.0%) |
| 35 to 64 Years | 0 (0.0%) | 0 (0.0%) |
| 65 to 74 Years | 17 (94.4%) | 0 (0.0%) |
| 75 Years and over | 0 (0.0%) | 0 (0.0%) |
Disability Class: Vision Difficulty
| Age Bracket | Male | Female |
| Under 5 Years | 0 (0.0%) | 0 (0.0%) |
| 5 to 17 Years | 0 (0.0%) | 0 (0.0%) |
| 18 to 34 Years | 0 (0.0%) | 0 (0.0%) |
| 35 to 64 Years | 0 (0.0%) | 0 (0.0%) |
| 65 to 74 Years | 0 (0.0%) | 0 (0.0%) |
| 75 Years and over | 0 (0.0%) | 0 (0.0%) |
Disability Class: Cognitive Difficulty
| Age Bracket | Male | Female |
| 5 to 17 Years | 0 (0.0%) | 0 (0.0%) |
| 18 to 34 Years | 0 (0.0%) | 0 (0.0%) |
| 35 to 64 Years | 0 (0.0%) | 0 (0.0%) |
| 65 to 74 Years | 0 (0.0%) | 0 (0.0%) |
| 75 Years and over | 0 (0.0%) | 0 (0.0%) |
Disability Class: Ambulatory Difficulty
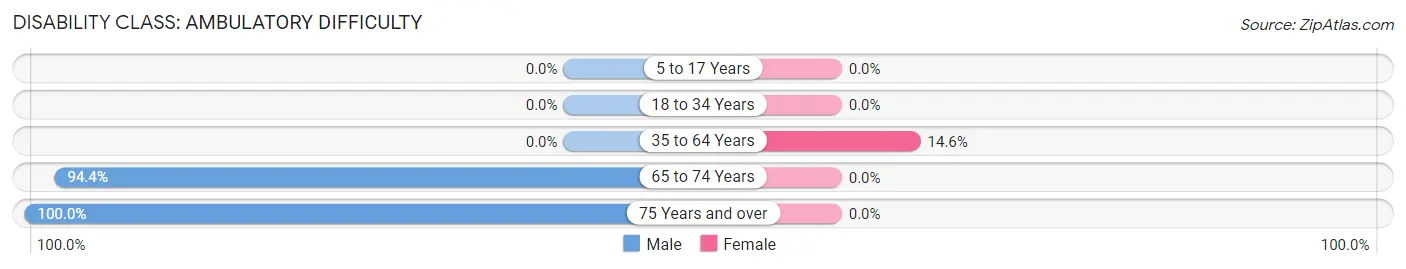
| Age Bracket | Male | Female |
| 5 to 17 Years | 0 (0.0%) | 0 (0.0%) |
| 18 to 34 Years | 0 (0.0%) | 0 (0.0%) |
| 35 to 64 Years | 0 (0.0%) | 6 (14.6%) |
| 65 to 74 Years | 17 (94.4%) | 0 (0.0%) |
| 75 Years and over | 1 (100.0%) | 0 (0.0%) |
Disability Class: Self-Care Difficulty
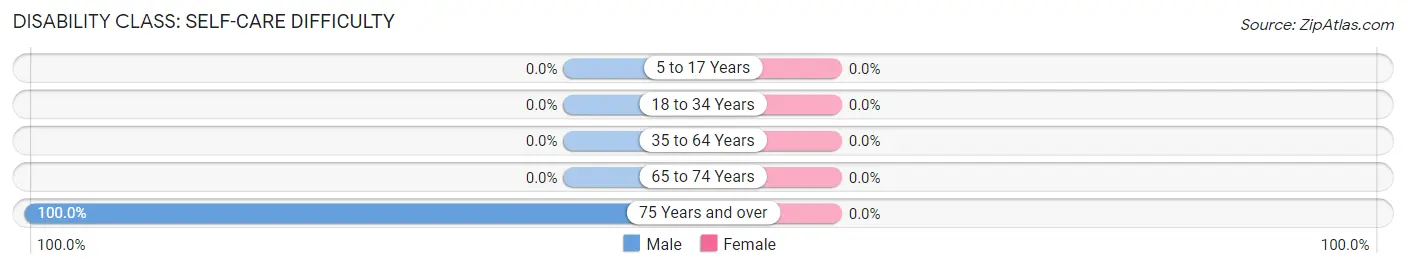
| Age Bracket | Male | Female |
| 5 to 17 Years | 0 (0.0%) | 0 (0.0%) |
| 18 to 34 Years | 0 (0.0%) | 0 (0.0%) |
| 35 to 64 Years | 0 (0.0%) | 0 (0.0%) |
| 65 to 74 Years | 0 (0.0%) | 0 (0.0%) |
| 75 Years and over | 1 (100.0%) | 0 (0.0%) |
Technology Access in Wellman
Computing Device Access in Wellman
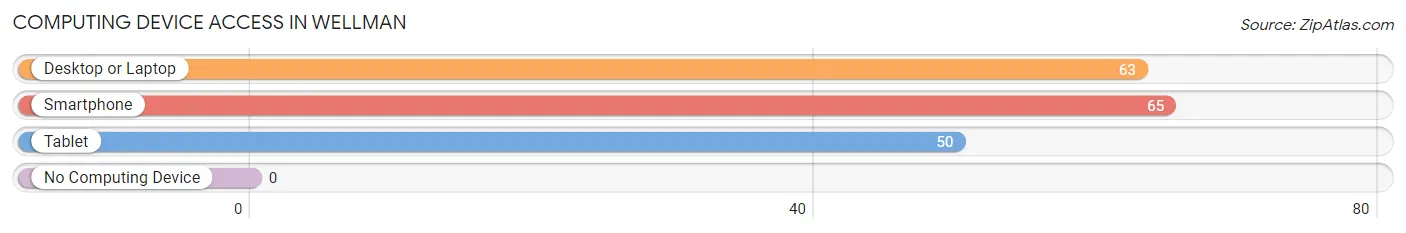
| Device Type | # Households | % Households |
| Desktop or Laptop | 63 | 90.0% |
| Smartphone | 65 | 92.9% |
| Tablet | 50 | 71.4% |
| No Computing Device | 0 | 0.0% |
| Total | 70 | 100.0% |
Internet Access in Wellman
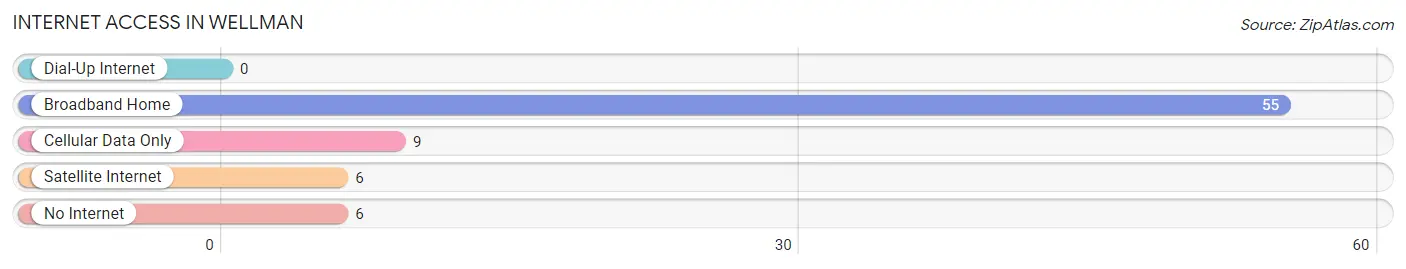
| Internet Type | # Households | % Households |
| Dial-Up Internet | 0 | 0.0% |
| Broadband Home | 55 | 78.6% |
| Cellular Data Only | 9 | 12.9% |
| Satellite Internet | 6 | 8.6% |
| No Internet | 6 | 8.6% |
| Total | 70 | 100.0% |
Wellman Summary
Wellman is a small town located in the state of Texas, in the United States. It is situated in the county of Wilbarger, and is part of the Wichita Falls Metropolitan Statistical Area. The town has a population of just over 500 people, and is located in the northern part of the state, near the Oklahoma border.
History
The town of Wellman was founded in 1887, when the first settlers arrived in the area. The town was named after the Wellman family, who were among the first settlers. The town was originally a farming community, and the main crops grown were cotton, corn, and wheat. The town also had a small sawmill, which provided lumber for the local area.
In the early 1900s, the town began to grow, and the population increased to over 500 people. The town had a post office, a school, a bank, and several stores. The town also had a cotton gin, which was used to process the cotton grown in the area.
In the 1920s, the town began to decline, as the cotton industry began to decline. The population decreased, and the town began to become a ghost town. In the 1950s, the town was revived, and the population began to increase again.
Geography
Wellman is located in the northern part of Texas, near the Oklahoma border. The town is situated in Wilbarger County, and is part of the Wichita Falls Metropolitan Statistical Area. The town is located at an elevation of 1,068 feet above sea level.
The town is located in a semi-arid climate, with hot summers and mild winters. The average annual temperature is around 68 degrees Fahrenheit, and the average annual precipitation is around 24 inches.
Economy
The economy of Wellman is largely based on agriculture. The main crops grown in the area are cotton, corn, and wheat. The town also has a small sawmill, which provides lumber for the local area.
The town also has a few small businesses, such as a grocery store, a hardware store, and a few restaurants. The town also has a post office, a bank, and a school.
Demographics
As of the 2010 census, the population of Wellman was 514 people. The racial makeup of the town was 97.3% White, 0.6% African American, 0.2% Native American, 0.2% Asian, 0.2% from other races, and 1.6% from two or more races. Hispanic or Latino of any race were 1.2% of the population.
The median household income in Wellman was $37,500, and the median family income was $41,250. The per capita income in the town was $17,857. About 11.2% of the population was below the poverty line.
Conclusion
Wellman is a small town located in the northern part of Texas, near the Oklahoma border. The town has a population of just over 500 people, and is part of the Wichita Falls Metropolitan Statistical Area. The town has a long history, and was originally a farming community. The economy of the town is largely based on agriculture, and the main crops grown in the area are cotton, corn, and wheat. The town also has a few small businesses, such as a grocery store, a hardware store, and a few restaurants. The population of Wellman is mostly White, with a small percentage of African American, Native American, and Asian residents. The median household income in Wellman is $37,500, and the median family income is $41,250.
Common Questions
What is Per Capita Income in Wellman?
Per Capita income in Wellman is $31,556.
What is the Median Family Income in Wellman?
Median Family Income in Wellman is $113,382.
What is the Median Household income in Wellman?
Median Household Income in Wellman is $112,941.
What is Inequality or Gini Index in Wellman?
Inequality or Gini Index in Wellman is 0.24.
What is the Total Population of Wellman?
Total Population of Wellman is 234.
What is the Total Male Population of Wellman?
Total Male Population of Wellman is 83.
What is the Total Female Population of Wellman?
Total Female Population of Wellman is 151.
What is the Ratio of Males per 100 Females in Wellman?
There are 54.97 Males per 100 Females in Wellman.
What is the Ratio of Females per 100 Males in Wellman?
There are 181.93 Females per 100 Males in Wellman.
What is the Median Population Age in Wellman?
Median Population Age in Wellman is 37.4 Years.
What is the Average Family Size in Wellman
Average Family Size in Wellman is 3.5 People.
What is the Average Household Size in Wellman
Average Household Size in Wellman is 3.3 People.
How Large is the Labor Force in Wellman?
There are 111 People in the Labor Forcein in Wellman.
What is the Percentage of People in the Labor Force in Wellman?
73.5% of People are in the Labor Force in Wellman.