Exira, IA Map & Demographics
Exira Map
Exira Overview
$29,125
PER CAPITA INCOME
$51,875
AVG FAMILY INCOME
$43,229
AVG HOUSEHOLD INCOME
39.7%
WAGE / INCOME GAP [ % ]
60.3¢/ $1
WAGE / INCOME GAP [ $ ]
0.44
INEQUALITY / GINI INDEX
847
TOTAL POPULATION
384
MALE POPULATION
463
FEMALE POPULATION
82.94
MALES / 100 FEMALES
120.57
FEMALES / 100 MALES
54.7
MEDIAN AGE
2.8
AVG FAMILY SIZE
2.1
AVG HOUSEHOLD SIZE
388
LABOR FORCE [ PEOPLE ]
56.2%
PERCENT IN LABOR FORCE
2.1%
UNEMPLOYMENT RATE
Exira Zip Codes
Exira Area Codes
Income in Exira
Income Overview in Exira
Per Capita Income in Exira is $29,125, while median incomes of families and households are $51,875 and $43,229 respectively.
| Characteristic | Number | Measure |
| Per Capita Income | 847 | $29,125 |
| Median Family Income | 211 | $51,875 |
| Mean Family Income | 211 | $74,891 |
| Median Household Income | 384 | $43,229 |
| Mean Household Income | 384 | $58,943 |
| Income Deficit | 211 | $0 |
| Wage / Income Gap (%) | 847 | 39.73% |
| Wage / Income Gap ($) | 847 | 60.27¢ per $1 |
| Gini / Inequality Index | 847 | 0.44 |
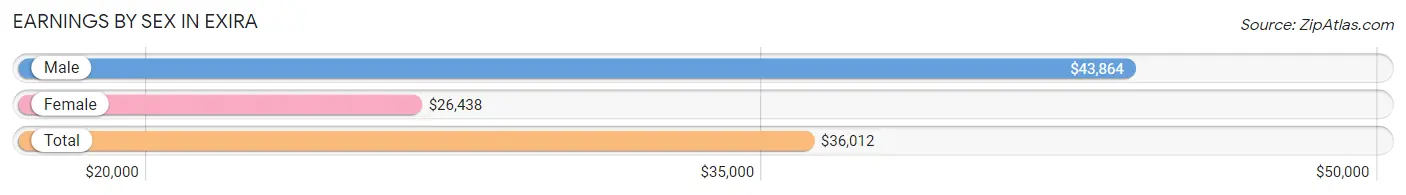
Earnings by Sex in Exira
Average Earnings in Exira are $36,012, $43,864 for men and $26,438 for women, a difference of 39.7%.
| Sex | Number | Average Earnings |
| Male | 206 (50.4%) | $43,864 |
| Female | 203 (49.6%) | $26,438 |
| Total | 409 (100.0%) | $36,012 |
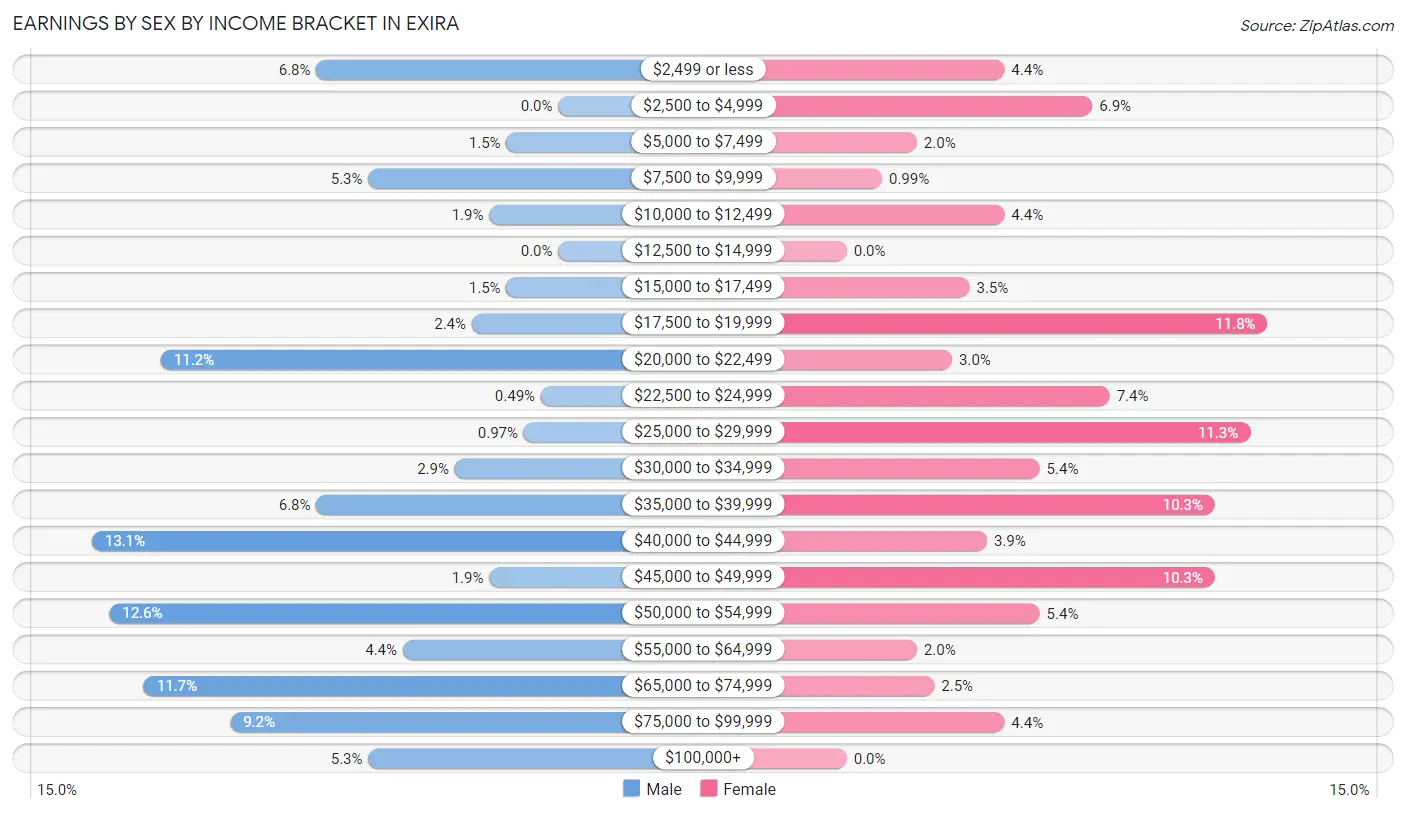
Earnings by Sex by Income Bracket in Exira
The most common earnings brackets in Exira are $40,000 to $44,999 for men (27 | 13.1%) and $17,500 to $19,999 for women (24 | 11.8%).
| Income | Male | Female |
| $2,499 or less | 14 (6.8%) | 9 (4.4%) |
| $2,500 to $4,999 | 0 (0.0%) | 14 (6.9%) |
| $5,000 to $7,499 | 3 (1.5%) | 4 (2.0%) |
| $7,500 to $9,999 | 11 (5.3%) | 2 (1.0%) |
| $10,000 to $12,499 | 4 (1.9%) | 9 (4.4%) |
| $12,500 to $14,999 | 0 (0.0%) | 0 (0.0%) |
| $15,000 to $17,499 | 3 (1.5%) | 7 (3.5%) |
| $17,500 to $19,999 | 5 (2.4%) | 24 (11.8%) |
| $20,000 to $22,499 | 23 (11.2%) | 6 (3.0%) |
| $22,500 to $24,999 | 1 (0.5%) | 15 (7.4%) |
| $25,000 to $29,999 | 2 (1.0%) | 23 (11.3%) |
| $30,000 to $34,999 | 6 (2.9%) | 11 (5.4%) |
| $35,000 to $39,999 | 14 (6.8%) | 21 (10.3%) |
| $40,000 to $44,999 | 27 (13.1%) | 8 (3.9%) |
| $45,000 to $49,999 | 4 (1.9%) | 21 (10.3%) |
| $50,000 to $54,999 | 26 (12.6%) | 11 (5.4%) |
| $55,000 to $64,999 | 9 (4.4%) | 4 (2.0%) |
| $65,000 to $74,999 | 24 (11.7%) | 5 (2.5%) |
| $75,000 to $99,999 | 19 (9.2%) | 9 (4.4%) |
| $100,000+ | 11 (5.3%) | 0 (0.0%) |
| Total | 206 (100.0%) | 203 (100.0%) |
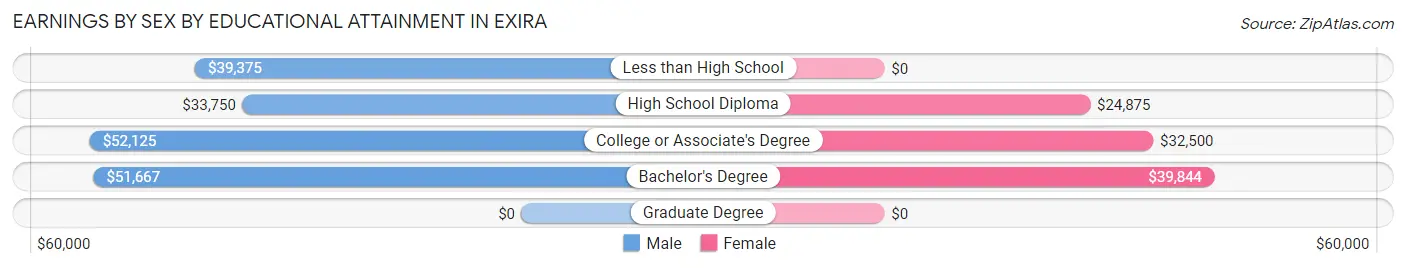
Earnings by Sex by Educational Attainment in Exira
Average earnings in Exira are $44,375 for men and $27,125 for women, a difference of 38.9%. Men with an educational attainment of college or associate's degree enjoy the highest average annual earnings of $52,125, while those with high school diploma education earn the least with $33,750. Women with an educational attainment of bachelor's degree earn the most with the average annual earnings of $39,844, while those with high school diploma education have the smallest earnings of $24,875.
| Educational Attainment | Male Income | Female Income |
| Less than High School | $39,375 | $0 |
| High School Diploma | $33,750 | $24,875 |
| College or Associate's Degree | $52,125 | $32,500 |
| Bachelor's Degree | $51,667 | $39,844 |
| Graduate Degree | - | - |
| Total | $44,375 | $27,125 |
Family Income in Exira
Family Income Brackets in Exira
According to the Exira family income data, there are 62 families falling into the $35,000 to $49,999 income range, which is the most common income bracket and makes up 29.4% of all families. Conversely, the $15,000 to $24,999 income bracket is the least frequent group with only 1 families (0.5%) belonging to this category.
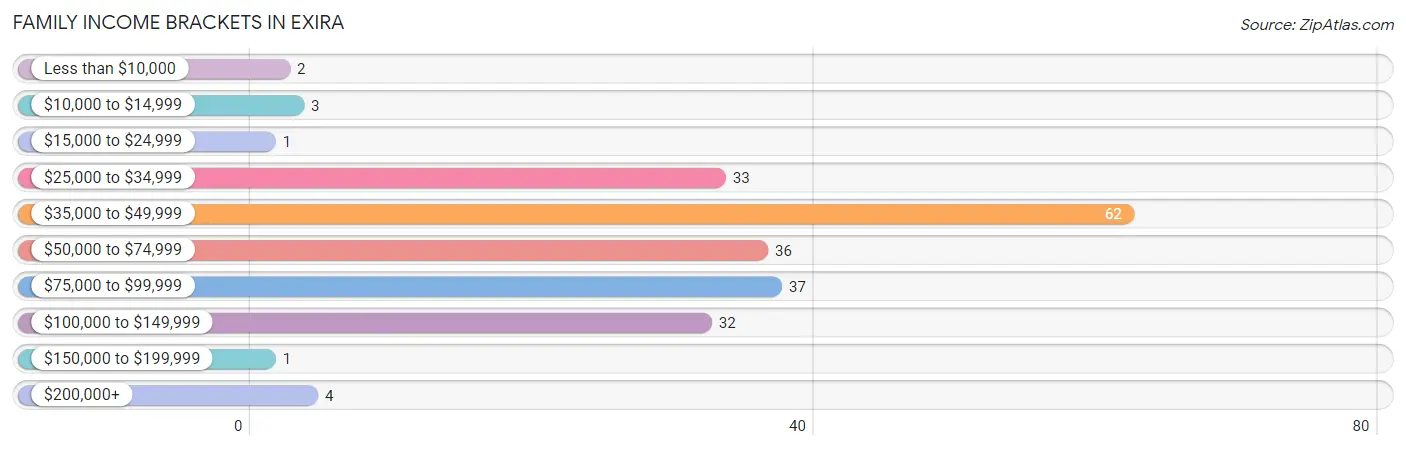
| Income Bracket | # Families | % Families |
| Less than $10,000 | 2 | 0.9% |
| $10,000 to $14,999 | 3 | 1.4% |
| $15,000 to $24,999 | 1 | 0.5% |
| $25,000 to $34,999 | 33 | 15.6% |
| $35,000 to $49,999 | 62 | 29.4% |
| $50,000 to $74,999 | 36 | 17.1% |
| $75,000 to $99,999 | 37 | 17.5% |
| $100,000 to $149,999 | 32 | 15.2% |
| $150,000 to $199,999 | 1 | 0.5% |
| $200,000+ | 4 | 1.9% |
Family Income by Famaliy Size in Exira
6-person families (8 | 3.8%) account for the highest median family income in Exira with $89,167 per family, while 2-person families (133 | 63.0%) have the highest median income of $25,782 per family member.
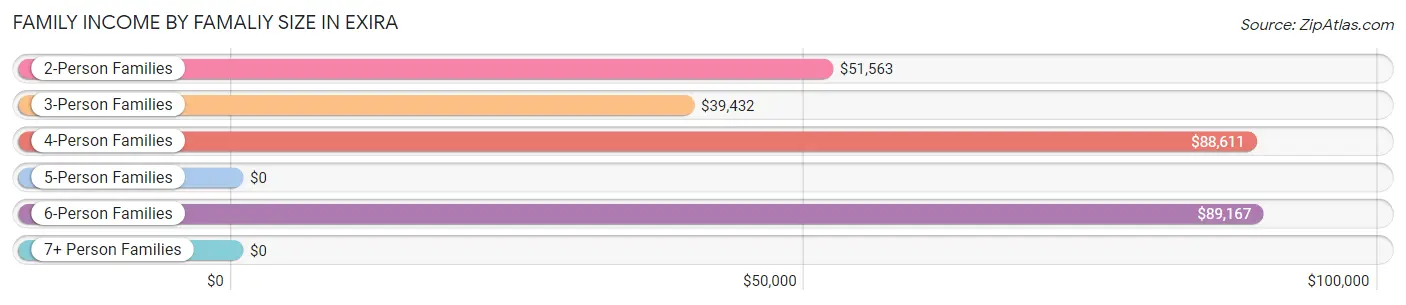
| Income Bracket | # Families | Median Income |
| 2-Person Families | 133 (63.0%) | $51,563 |
| 3-Person Families | 38 (18.0%) | $39,432 |
| 4-Person Families | 14 (6.6%) | $88,611 |
| 5-Person Families | 18 (8.5%) | $0 |
| 6-Person Families | 8 (3.8%) | $89,167 |
| 7+ Person Families | 0 (0.0%) | $0 |
| Total | 211 (100.0%) | $51,875 |
Family Income by Number of Earners in Exira
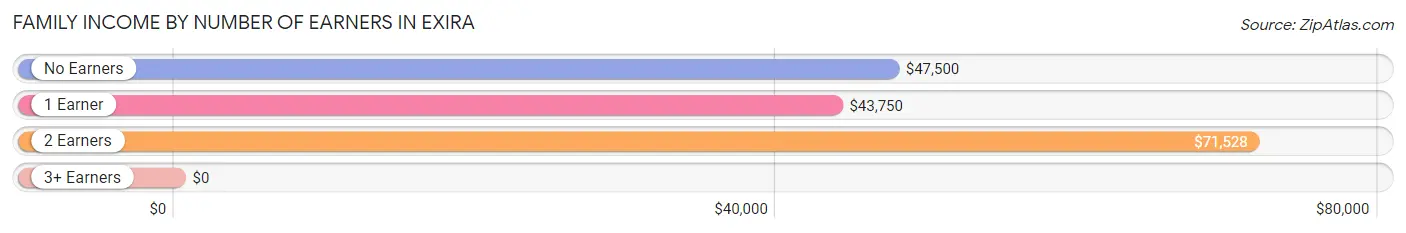
| Number of Earners | # Families | Median Income |
| No Earners | 30 (14.2%) | $47,500 |
| 1 Earner | 69 (32.7%) | $43,750 |
| 2 Earners | 109 (51.7%) | $71,528 |
| 3+ Earners | 3 (1.4%) | $0 |
| Total | 211 (100.0%) | $51,875 |
Household Income in Exira
Household Income Brackets in Exira
With 104 households falling in the category, the $35,000 to $49,999 income range is the most frequent in Exira, accounting for 27.1% of all households. In contrast, only 1 households (0.3%) fall into the $150,000 to $199,999 income bracket, making it the least populous group.
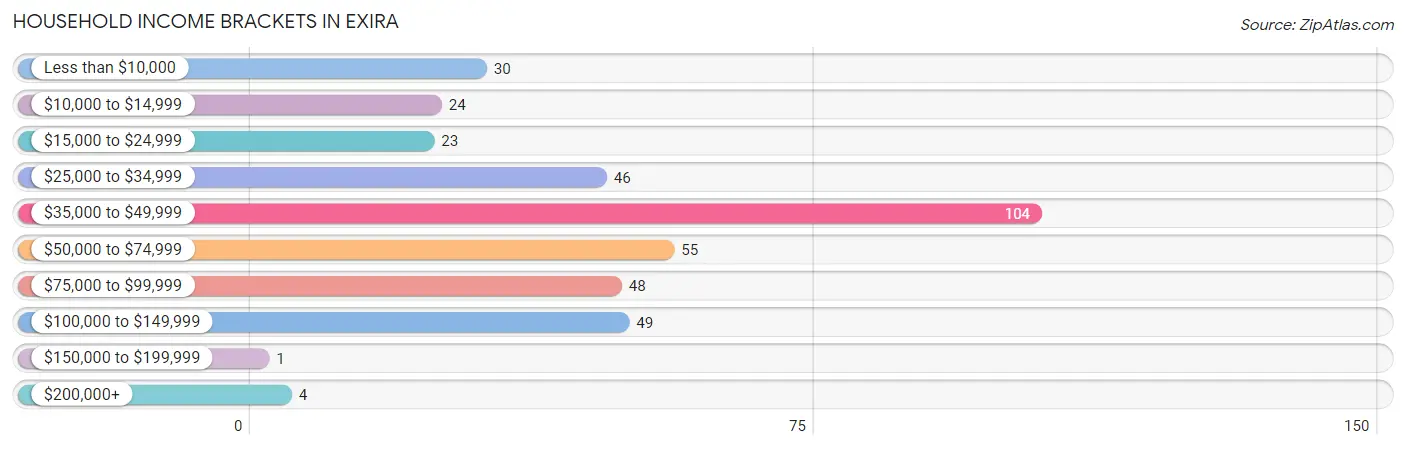
| Income Bracket | # Households | % Households |
| Less than $10,000 | 30 | 7.8% |
| $10,000 to $14,999 | 24 | 6.3% |
| $15,000 to $24,999 | 23 | 6.0% |
| $25,000 to $34,999 | 46 | 12.0% |
| $35,000 to $49,999 | 104 | 27.1% |
| $50,000 to $74,999 | 55 | 14.3% |
| $75,000 to $99,999 | 48 | 12.5% |
| $100,000 to $149,999 | 49 | 12.8% |
| $150,000 to $199,999 | 1 | 0.3% |
| $200,000+ | 4 | 1.0% |
Household Income by Householder Age in Exira
The median household income in Exira is $43,229, with the highest median household income of $54,792 found in the 25 to 44 years age bracket for the primary householder. A total of 61 households (15.9%) fall into this category. Meanwhile, the 15 to 24 years age bracket for the primary householder has the lowest median household income of $0, with 28 households (7.3%) in this group.
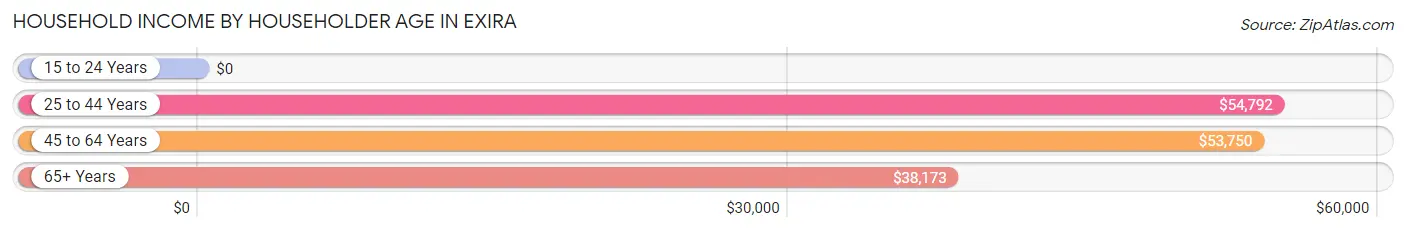
| Income Bracket | # Households | Median Income |
| 15 to 24 Years | 28 (7.3%) | $0 |
| 25 to 44 Years | 61 (15.9%) | $54,792 |
| 45 to 64 Years | 166 (43.2%) | $53,750 |
| 65+ Years | 129 (33.6%) | $38,173 |
| Total | 384 (100.0%) | $43,229 |
Poverty in Exira
Income Below Poverty by Sex and Age in Exira
With 11.1% poverty level for males and 20.3% for females among the residents of Exira, 15 year old males and 16 and 17 year old females are the most vulnerable to poverty, with 3 males (100.0%) and 10 females (100.0%) in their respective age groups living below the poverty level.
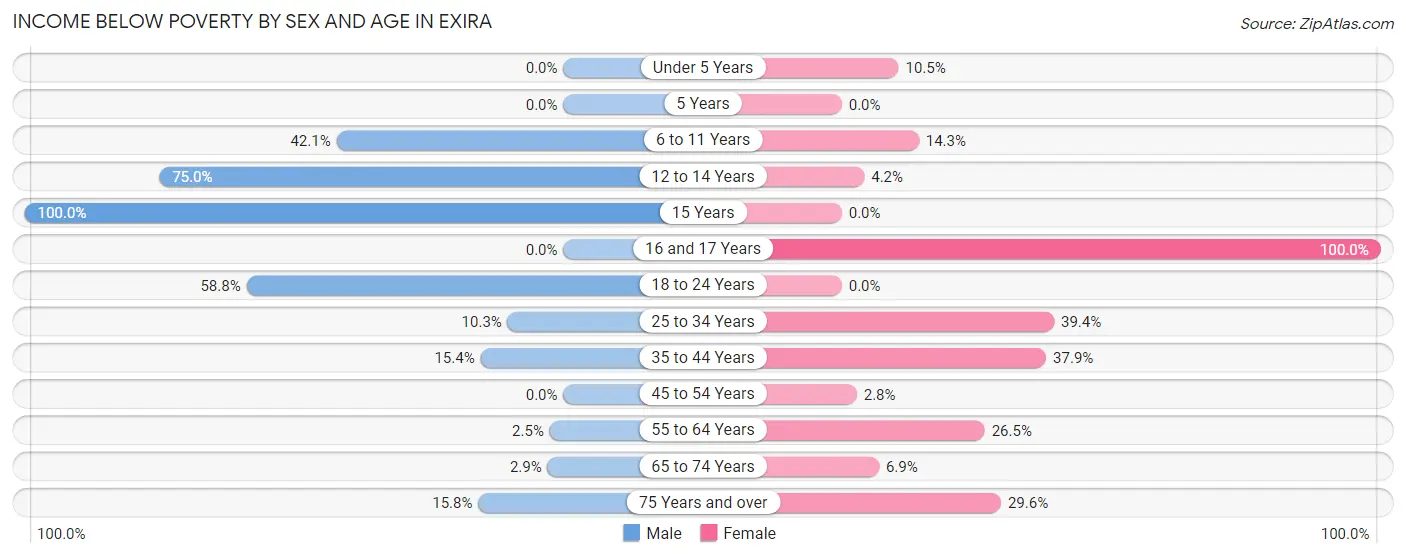
| Age Bracket | Male | Female |
| Under 5 Years | 0 (0.0%) | 2 (10.5%) |
| 5 Years | 0 (0.0%) | 0 (0.0%) |
| 6 to 11 Years | 8 (42.1%) | 4 (14.3%) |
| 12 to 14 Years | 6 (75.0%) | 1 (4.2%) |
| 15 Years | 3 (100.0%) | 0 (0.0%) |
| 16 and 17 Years | 0 (0.0%) | 10 (100.0%) |
| 18 to 24 Years | 10 (58.8%) | 0 (0.0%) |
| 25 to 34 Years | 3 (10.3%) | 13 (39.4%) |
| 35 to 44 Years | 4 (15.4%) | 11 (37.9%) |
| 45 to 54 Years | 0 (0.0%) | 1 (2.8%) |
| 55 to 64 Years | 2 (2.5%) | 26 (26.5%) |
| 65 to 74 Years | 2 (2.9%) | 4 (6.9%) |
| 75 Years and over | 3 (15.8%) | 13 (29.5%) |
| Total | 41 (11.1%) | 85 (20.3%) |
Income Above Poverty by Sex and Age in Exira
According to the poverty statistics in Exira, males aged under 5 years and females aged 18 to 24 years are the age groups that are most secure financially, with 100.0% of males and 100.0% of females in these age groups living above the poverty line.
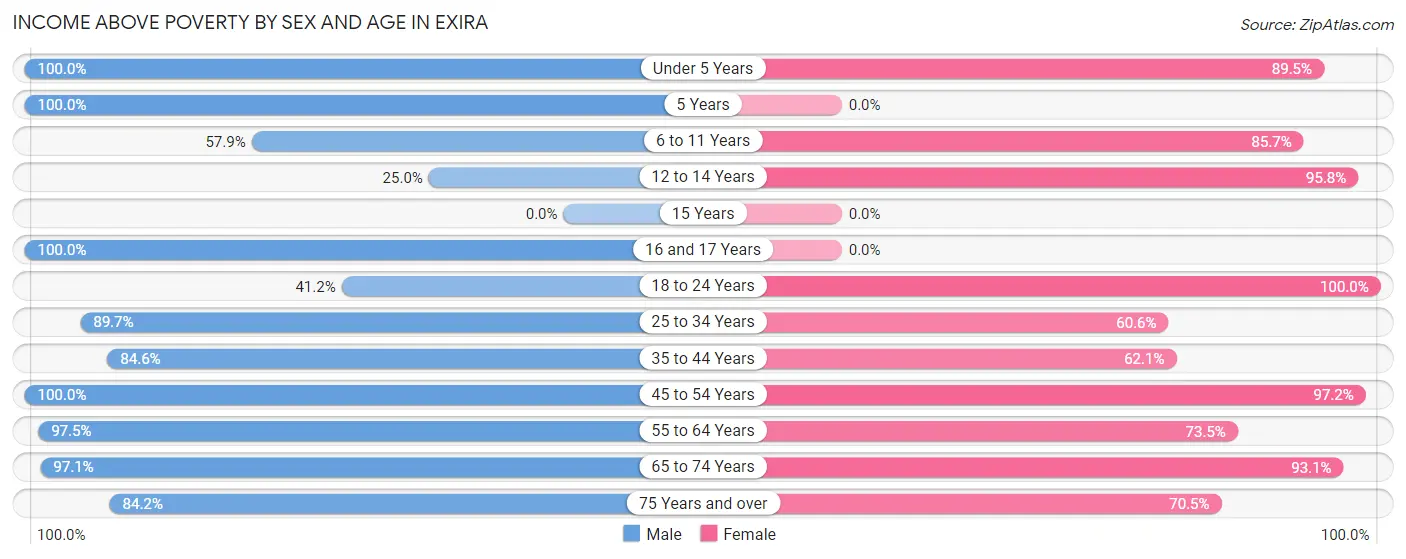
| Age Bracket | Male | Female |
| Under 5 Years | 44 (100.0%) | 17 (89.5%) |
| 5 Years | 9 (100.0%) | 0 (0.0%) |
| 6 to 11 Years | 11 (57.9%) | 24 (85.7%) |
| 12 to 14 Years | 2 (25.0%) | 23 (95.8%) |
| 15 Years | 0 (0.0%) | 0 (0.0%) |
| 16 and 17 Years | 2 (100.0%) | 0 (0.0%) |
| 18 to 24 Years | 7 (41.2%) | 40 (100.0%) |
| 25 to 34 Years | 26 (89.7%) | 20 (60.6%) |
| 35 to 44 Years | 22 (84.6%) | 18 (62.1%) |
| 45 to 54 Years | 48 (100.0%) | 35 (97.2%) |
| 55 to 64 Years | 77 (97.5%) | 72 (73.5%) |
| 65 to 74 Years | 66 (97.1%) | 54 (93.1%) |
| 75 Years and over | 16 (84.2%) | 31 (70.5%) |
| Total | 330 (88.9%) | 334 (79.7%) |
Income Below Poverty Among Married-Couple Families in Exira
The poverty statistics for married-couple families in Exira show that 1.7% or 3 of the total 177 families live below the poverty line. Families with 3 or 4 children have the highest poverty rate of 11.1%, comprising of 1 families. On the other hand, families with 1 or 2 children have the lowest poverty rate of 0.0%, which includes 0 families.
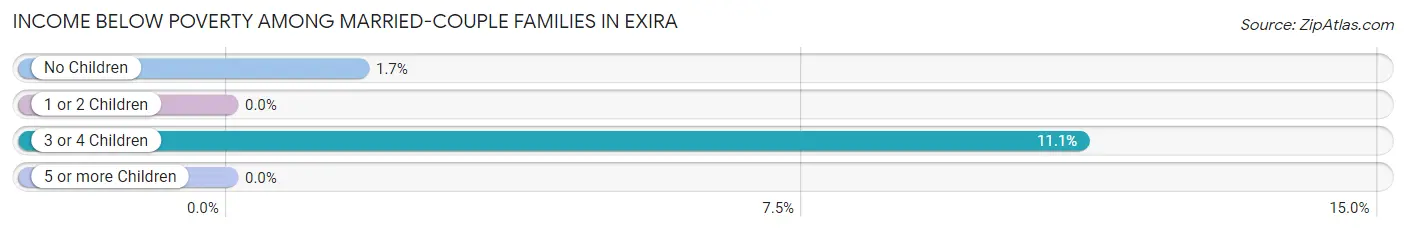
| Children | Above Poverty | Below Poverty |
| No Children | 115 (98.3%) | 2 (1.7%) |
| 1 or 2 Children | 51 (100.0%) | 0 (0.0%) |
| 3 or 4 Children | 8 (88.9%) | 1 (11.1%) |
| 5 or more Children | 0 (0.0%) | 0 (0.0%) |
| Total | 174 (98.3%) | 3 (1.7%) |
Income Below Poverty Among Single-Parent Households in Exira
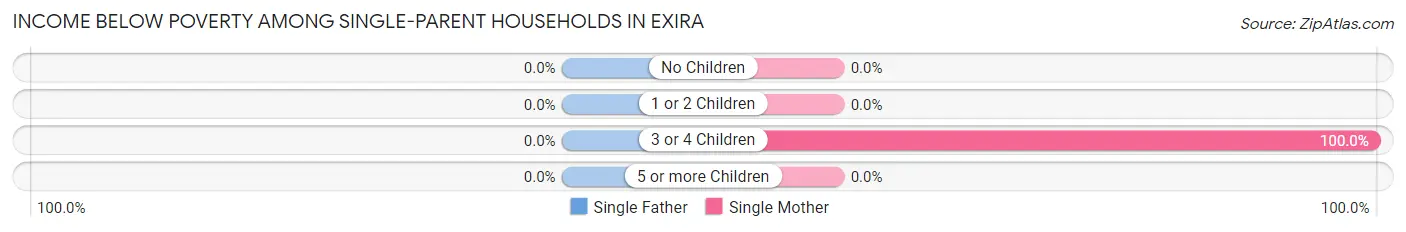
| Children | Single Father | Single Mother |
| No Children | 0 (0.0%) | 0 (0.0%) |
| 1 or 2 Children | 0 (0.0%) | 0 (0.0%) |
| 3 or 4 Children | 0 (0.0%) | 10 (100.0%) |
| 5 or more Children | 0 (0.0%) | 0 (0.0%) |
| Total | 0 (0.0%) | 10 (47.6%) |
Income Below Poverty Among Married-Couple vs Single-Parent Households in Exira
The poverty data for Exira shows that 3 of the married-couple family households (1.7%) and 10 of the single-parent households (29.4%) are living below the poverty level. Within the married-couple family households, those with 3 or 4 children have the highest poverty rate, with 1 households (11.1%) falling below the poverty line. Among the single-parent households, those with 3 or 4 children have the highest poverty rate, with 10 household (58.8%) living below poverty.
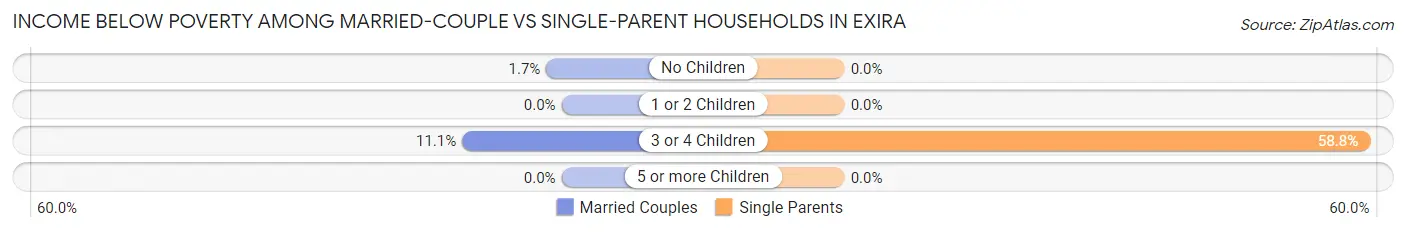
| Children | Married-Couple Families | Single-Parent Households |
| No Children | 2 (1.7%) | 0 (0.0%) |
| 1 or 2 Children | 0 (0.0%) | 0 (0.0%) |
| 3 or 4 Children | 1 (11.1%) | 10 (58.8%) |
| 5 or more Children | 0 (0.0%) | 0 (0.0%) |
| Total | 3 (1.7%) | 10 (29.4%) |
Race in Exira
The most populous races in Exira are White / Caucasian (812 | 95.9%), Two or more Races (31 | 3.7%), and Hispanic or Latino (30 | 3.5%).
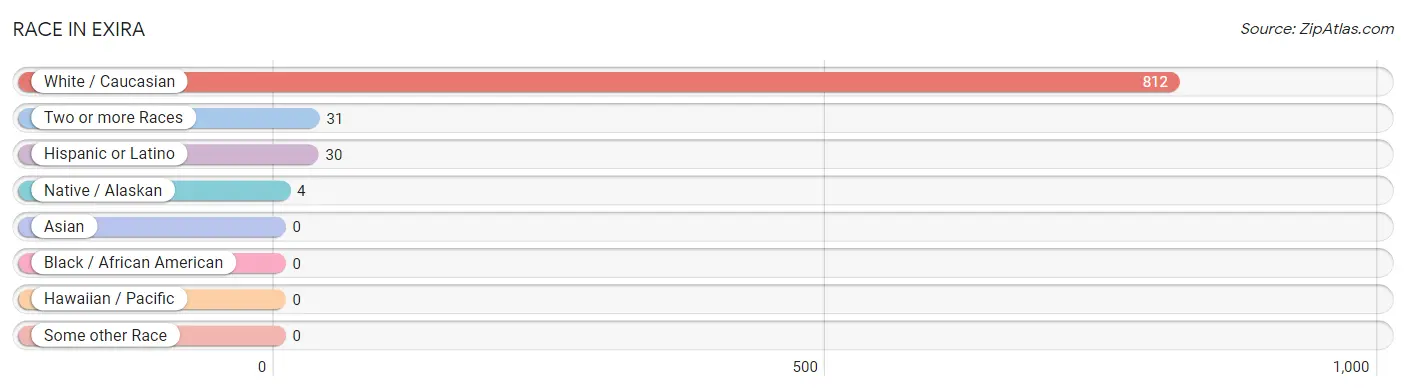
| Race | # Population | % Population |
| Asian | 0 | 0.0% |
| Black / African American | 0 | 0.0% |
| Hawaiian / Pacific | 0 | 0.0% |
| Hispanic or Latino | 30 | 3.5% |
| Native / Alaskan | 4 | 0.5% |
| White / Caucasian | 812 | 95.9% |
| Two or more Races | 31 | 3.7% |
| Some other Race | 0 | 0.0% |
| Total | 847 | 100.0% |
Ancestry in Exira
The most populous ancestries reported in Exira are German (177 | 20.9%), Danish (170 | 20.1%), Irish (58 | 6.9%), English (55 | 6.5%), and American (30 | 3.5%), together accounting for 57.8% of all Exira residents.
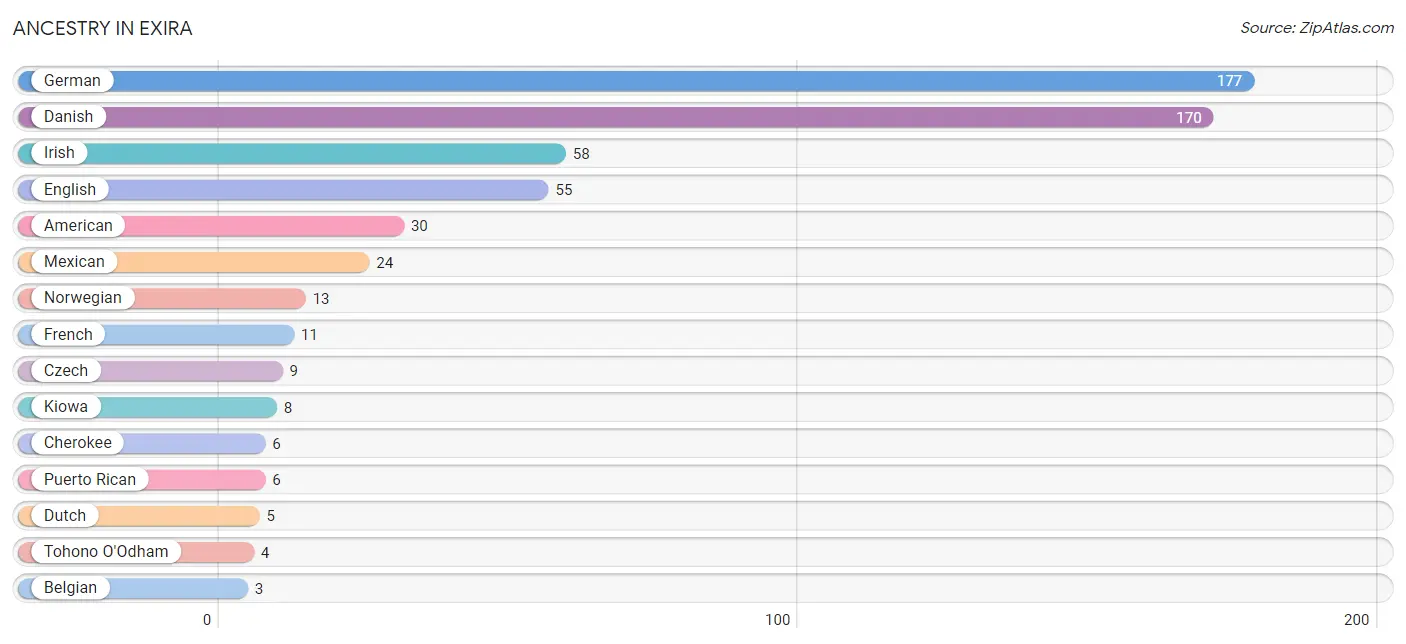
| Ancestry | # Population | % Population |
| American | 30 | 3.5% |
| Belgian | 3 | 0.4% |
| Cherokee | 6 | 0.7% |
| Czech | 9 | 1.1% |
| Danish | 170 | 20.1% |
| Dutch | 5 | 0.6% |
| Eastern European | 2 | 0.2% |
| English | 55 | 6.5% |
| European | 2 | 0.2% |
| French | 11 | 1.3% |
| German | 177 | 20.9% |
| Irish | 58 | 6.9% |
| Italian | 1 | 0.1% |
| Kiowa | 8 | 0.9% |
| Mexican | 24 | 2.8% |
| Norwegian | 13 | 1.5% |
| Pennsylvania German | 2 | 0.2% |
| Puerto Rican | 6 | 0.7% |
| Scotch-Irish | 1 | 0.1% |
| Scottish | 1 | 0.1% |
| Sioux | 2 | 0.2% |
| Swedish | 2 | 0.2% |
| Tohono O'Odham | 4 | 0.5% | View All 23 Rows |
Immigrants in Exira
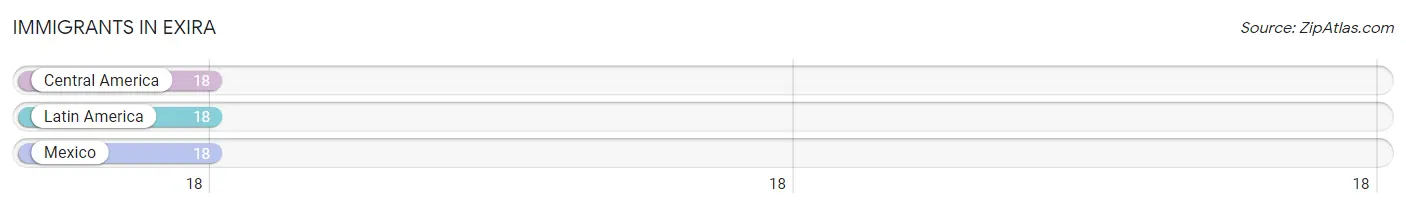
The most numerous immigrant groups reported in Exira came from Central America (18 | 2.1%), Latin America (18 | 2.1%), and Mexico (18 | 2.1%), together accounting for 6.4% of all Exira residents.
| Immigration Origin | # Population | % Population |
| Central America | 18 | 2.1% |
| Latin America | 18 | 2.1% |
| Mexico | 18 | 2.1% | View All 3 Rows |
Sex and Age in Exira
Sex and Age in Exira
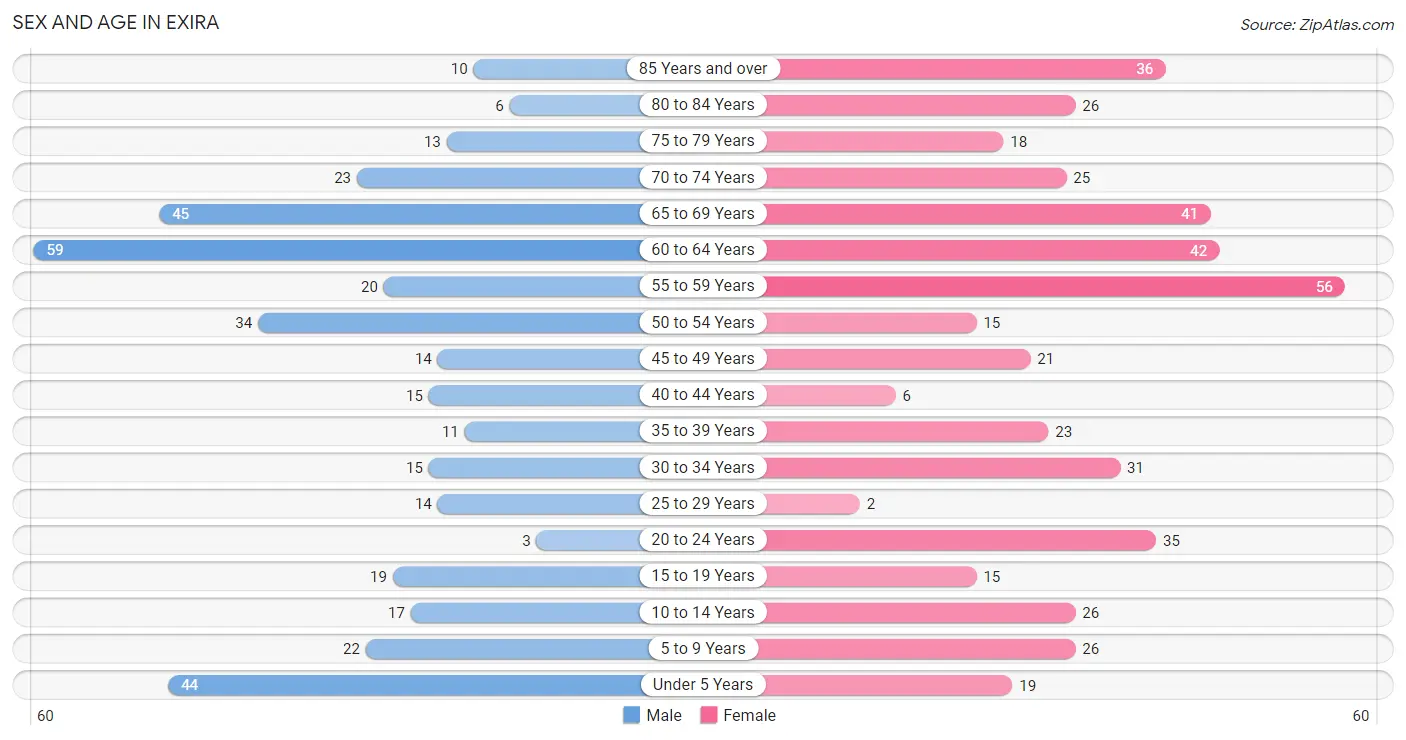
The most populous age groups in Exira are 60 to 64 Years (59 | 15.4%) for men and 55 to 59 Years (56 | 12.1%) for women.
| Age Bracket | Male | Female |
| Under 5 Years | 44 (11.5%) | 19 (4.1%) |
| 5 to 9 Years | 22 (5.7%) | 26 (5.6%) |
| 10 to 14 Years | 17 (4.4%) | 26 (5.6%) |
| 15 to 19 Years | 19 (5.0%) | 15 (3.2%) |
| 20 to 24 Years | 3 (0.8%) | 35 (7.6%) |
| 25 to 29 Years | 14 (3.6%) | 2 (0.4%) |
| 30 to 34 Years | 15 (3.9%) | 31 (6.7%) |
| 35 to 39 Years | 11 (2.9%) | 23 (5.0%) |
| 40 to 44 Years | 15 (3.9%) | 6 (1.3%) |
| 45 to 49 Years | 14 (3.6%) | 21 (4.5%) |
| 50 to 54 Years | 34 (8.8%) | 15 (3.2%) |
| 55 to 59 Years | 20 (5.2%) | 56 (12.1%) |
| 60 to 64 Years | 59 (15.4%) | 42 (9.1%) |
| 65 to 69 Years | 45 (11.7%) | 41 (8.9%) |
| 70 to 74 Years | 23 (6.0%) | 25 (5.4%) |
| 75 to 79 Years | 13 (3.4%) | 18 (3.9%) |
| 80 to 84 Years | 6 (1.6%) | 26 (5.6%) |
| 85 Years and over | 10 (2.6%) | 36 (7.8%) |
| Total | 384 (100.0%) | 463 (100.0%) |
Families and Households in Exira
Median Family Size in Exira
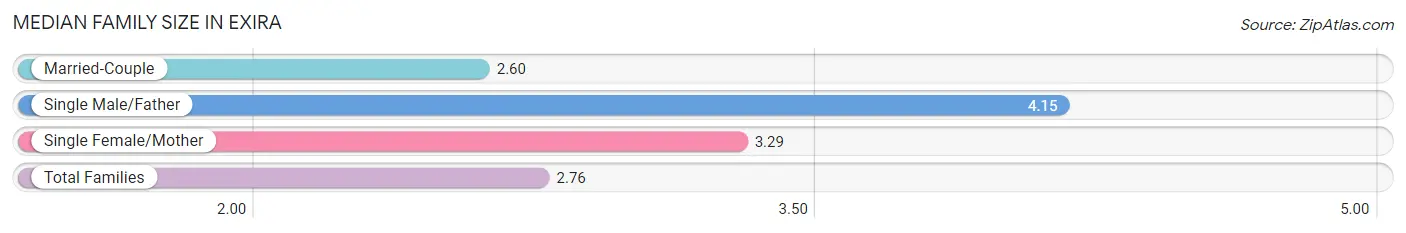
The median family size in Exira is 2.76 persons per family, with single male/father families (13 | 6.2%) accounting for the largest median family size of 4.15 persons per family. On the other hand, married-couple families (177 | 83.9%) represent the smallest median family size with 2.60 persons per family.
| Family Type | # Families | Family Size |
| Married-Couple | 177 (83.9%) | 2.60 |
| Single Male/Father | 13 (6.2%) | 4.15 |
| Single Female/Mother | 21 (10.0%) | 3.29 |
| Total Families | 211 (100.0%) | 2.76 |
Median Household Size in Exira
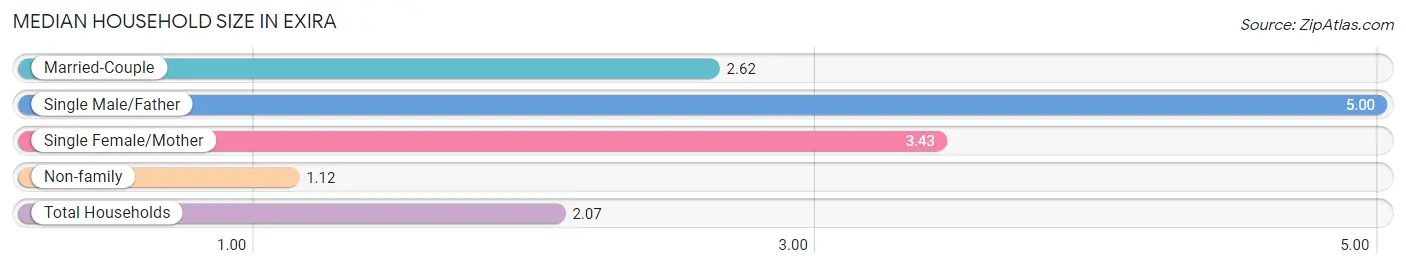
The median household size in Exira is 2.07 persons per household, with single male/father households (13 | 3.4%) accounting for the largest median household size of 5 persons per household. non-family households (173 | 45.1%) represent the smallest median household size with 1.12 persons per household.
| Household Type | # Households | Household Size |
| Married-Couple | 177 (46.1%) | 2.62 |
| Single Male/Father | 13 (3.4%) | 5.00 |
| Single Female/Mother | 21 (5.5%) | 3.43 |
| Non-family | 173 (45.1%) | 1.12 |
| Total Households | 384 (100.0%) | 2.07 |
Household Size by Marriage Status in Exira
Out of a total of 384 households in Exira, 211 (54.9%) are family households, while 173 (45.1%) are nonfamily households. The most numerous type of family households are 2-person households, comprising 129, and the most common type of nonfamily households are 1-person households, comprising 157.
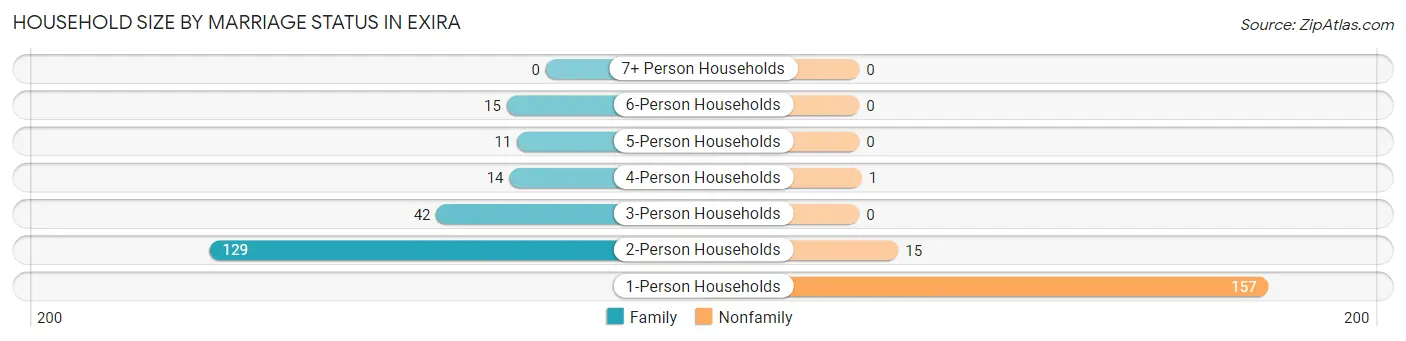
| Household Size | Family Households | Nonfamily Households |
| 1-Person Households | - | 157 (40.9%) |
| 2-Person Households | 129 (33.6%) | 15 (3.9%) |
| 3-Person Households | 42 (10.9%) | 0 (0.0%) |
| 4-Person Households | 14 (3.6%) | 1 (0.3%) |
| 5-Person Households | 11 (2.9%) | 0 (0.0%) |
| 6-Person Households | 15 (3.9%) | 0 (0.0%) |
| 7+ Person Households | 0 (0.0%) | 0 (0.0%) |
| Total | 211 (54.9%) | 173 (45.1%) |
Female Fertility in Exira
Fertility by Age in Exira
Average fertility rate in Exira is 66.0 births per 1,000 women. Women in the age bracket of 20 to 34 years have the highest fertility rate with 132.0 births per 1,000 women. Women in the age bracket of 20 to 34 years acount for 100.0% of all women with births.
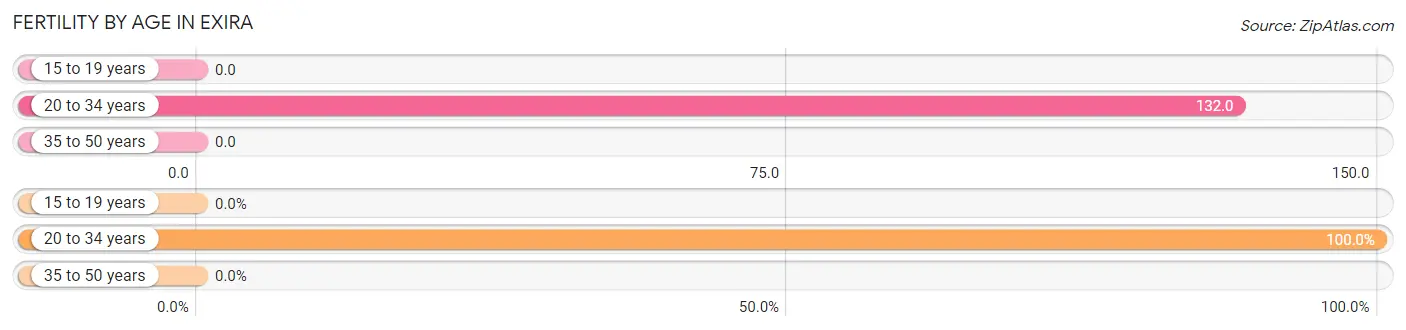
| Age Bracket | Women with Births | Births / 1,000 Women |
| 15 to 19 years | 0 (0.0%) | 0.0 |
| 20 to 34 years | 9 (100.0%) | 132.0 |
| 35 to 50 years | 0 (0.0%) | 0.0 |
| Total | 9 (100.0%) | 66.0 |
Fertility by Age by Marriage Status in Exira
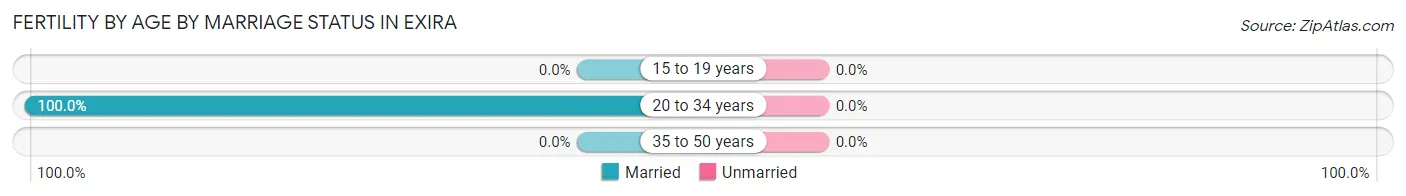
| Age Bracket | Married | Unmarried |
| 15 to 19 years | 0 (0.0%) | 0 (0.0%) |
| 20 to 34 years | 9 (100.0%) | 0 (0.0%) |
| 35 to 50 years | 0 (0.0%) | 0 (0.0%) |
| Total | 9 (100.0%) | 0 (0.0%) |
Fertility by Education in Exira
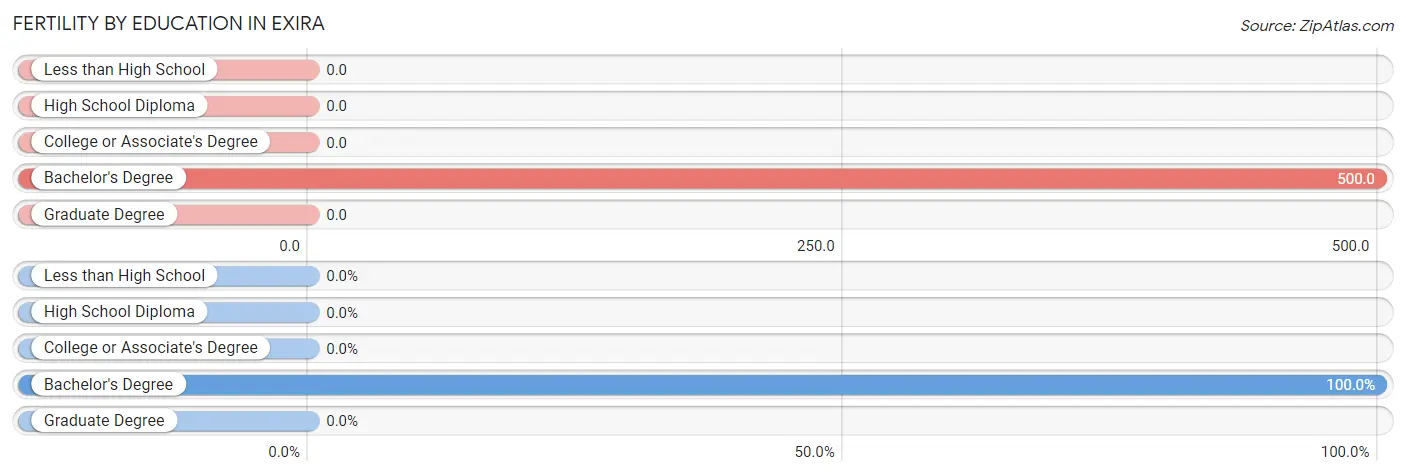
| Educational Attainment | Women with Births | Births / 1,000 Women |
| Less than High School | 0 (0.0%) | 0.0 |
| High School Diploma | 0 (0.0%) | 0.0 |
| College or Associate's Degree | 0 (0.0%) | 0.0 |
| Bachelor's Degree | 9 (100.0%) | 500.0 |
| Graduate Degree | 0 (0.0%) | 0.0 |
| Total | 9 (100.0%) | 66.0 |
Fertility by Education by Marriage Status in Exira
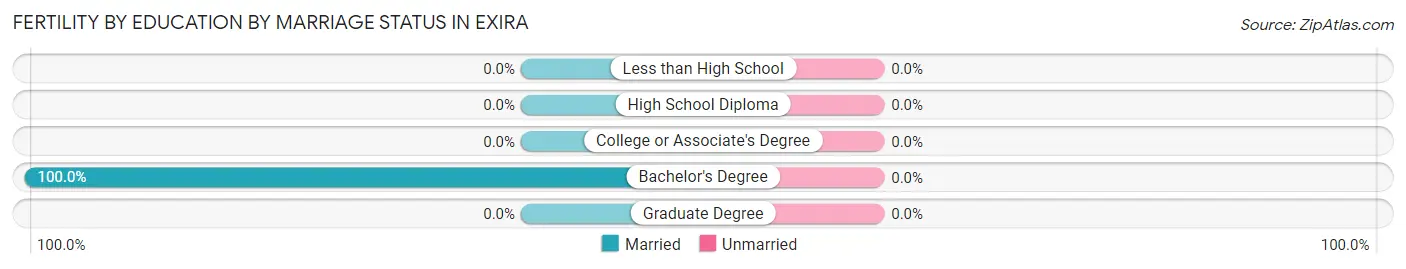
| Educational Attainment | Married | Unmarried |
| Less than High School | 0 (0.0%) | 0 (0.0%) |
| High School Diploma | 0 (0.0%) | 0 (0.0%) |
| College or Associate's Degree | 0 (0.0%) | 0 (0.0%) |
| Bachelor's Degree | 9 (100.0%) | 0 (0.0%) |
| Graduate Degree | 0 (0.0%) | 0 (0.0%) |
| Total | 9 (100.0%) | 0 (0.0%) |
Employment Characteristics in Exira
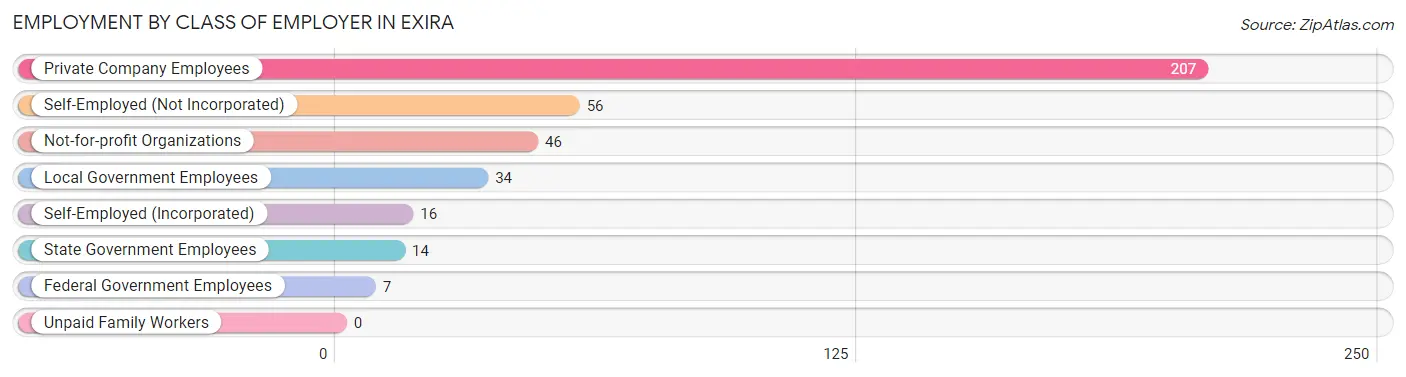
Employment by Class of Employer in Exira
Among the 380 employed individuals in Exira, private company employees (207 | 54.5%), self-employed (not incorporated) (56 | 14.7%), and not-for-profit organizations (46 | 12.1%) make up the most common classes of employment.
| Employer Class | # Employees | % Employees |
| Private Company Employees | 207 | 54.5% |
| Self-Employed (Incorporated) | 16 | 4.2% |
| Self-Employed (Not Incorporated) | 56 | 14.7% |
| Not-for-profit Organizations | 46 | 12.1% |
| Local Government Employees | 34 | 8.9% |
| State Government Employees | 14 | 3.7% |
| Federal Government Employees | 7 | 1.8% |
| Unpaid Family Workers | 0 | 0.0% |
| Total | 380 | 100.0% |
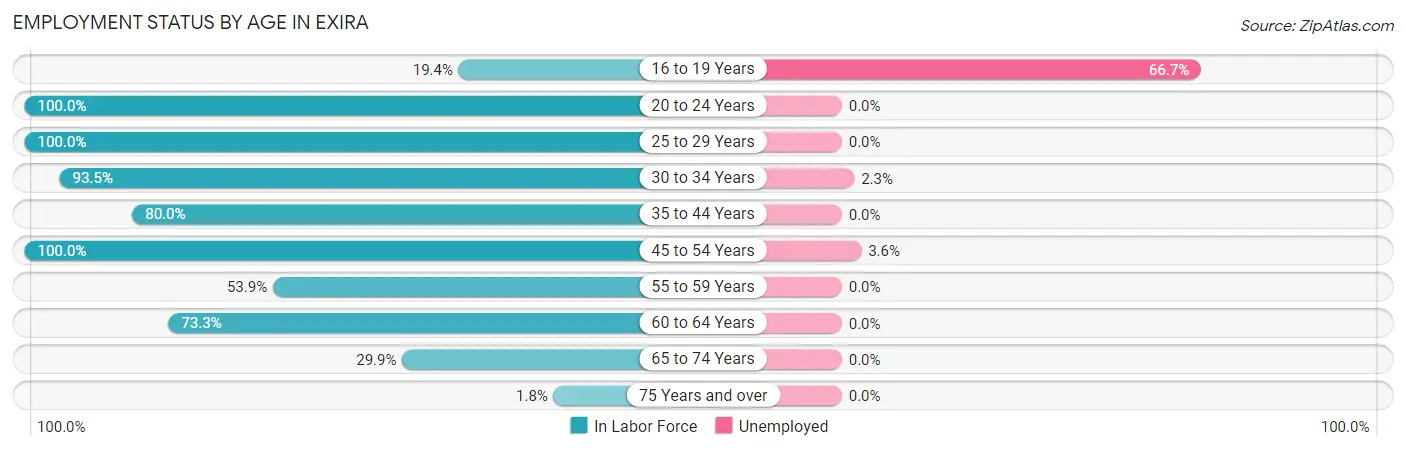
Employment Status by Age in Exira
According to the labor force statistics for Exira, out of the total population over 16 years of age (690), 56.2% or 388 individuals are in the labor force, with 2.1% or 8 of them unemployed. The age group with the highest labor force participation rate is 20 to 24 years, with 100.0% or 38 individuals in the labor force. Within the labor force, the 16 to 19 years age range has the highest percentage of unemployed individuals, with 66.7% or 4 of them being unemployed.
| Age Bracket | In Labor Force | Unemployed |
| 16 to 19 Years | 6 (19.4%) | 4 (66.7%) |
| 20 to 24 Years | 38 (100.0%) | 0 (0.0%) |
| 25 to 29 Years | 16 (100.0%) | 0 (0.0%) |
| 30 to 34 Years | 43 (93.5%) | 1 (2.3%) |
| 35 to 44 Years | 44 (80.0%) | 0 (0.0%) |
| 45 to 54 Years | 84 (100.0%) | 3 (3.6%) |
| 55 to 59 Years | 41 (53.9%) | 0 (0.0%) |
| 60 to 64 Years | 74 (73.3%) | 0 (0.0%) |
| 65 to 74 Years | 40 (29.9%) | 0 (0.0%) |
| 75 Years and over | 2 (1.8%) | 0 (0.0%) |
| Total | 388 (56.2%) | 8 (2.1%) |
Employment Status by Educational Attainment in Exira
According to labor force statistics for Exira, 79.9% of individuals (302) out of the total population between 25 and 64 years of age (378) are in the labor force, with 1.3% or 4 of them being unemployed. The group with the highest labor force participation rate are those with the educational attainment of college / associate degree, with 91.0% or 131 individuals in the labor force. Within the labor force, individuals with less than high school education have the highest percentage of unemployment, with 2.9% or 1 of them being unemployed.
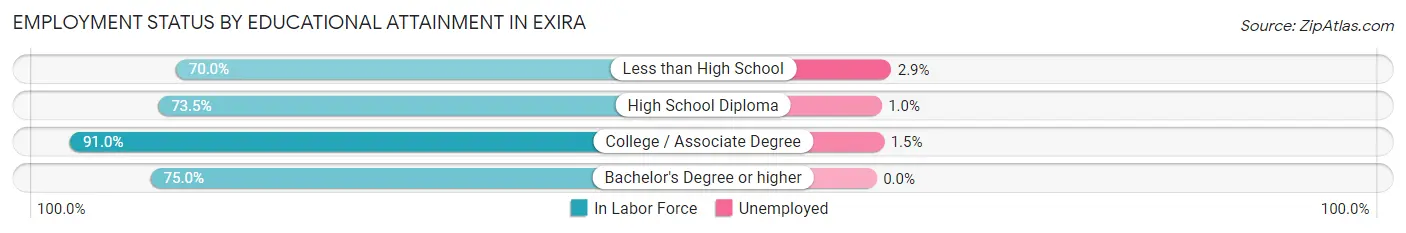
| Educational Attainment | In Labor Force | Unemployed |
| Less than High School | 35 (70.0%) | 1 (2.9%) |
| High School Diploma | 97 (73.5%) | 1 (1.0%) |
| College / Associate Degree | 131 (91.0%) | 2 (1.5%) |
| Bachelor's Degree or higher | 39 (75.0%) | 0 (0.0%) |
| Total | 302 (79.9%) | 5 (1.3%) |
Employment Occupations by Sex in Exira
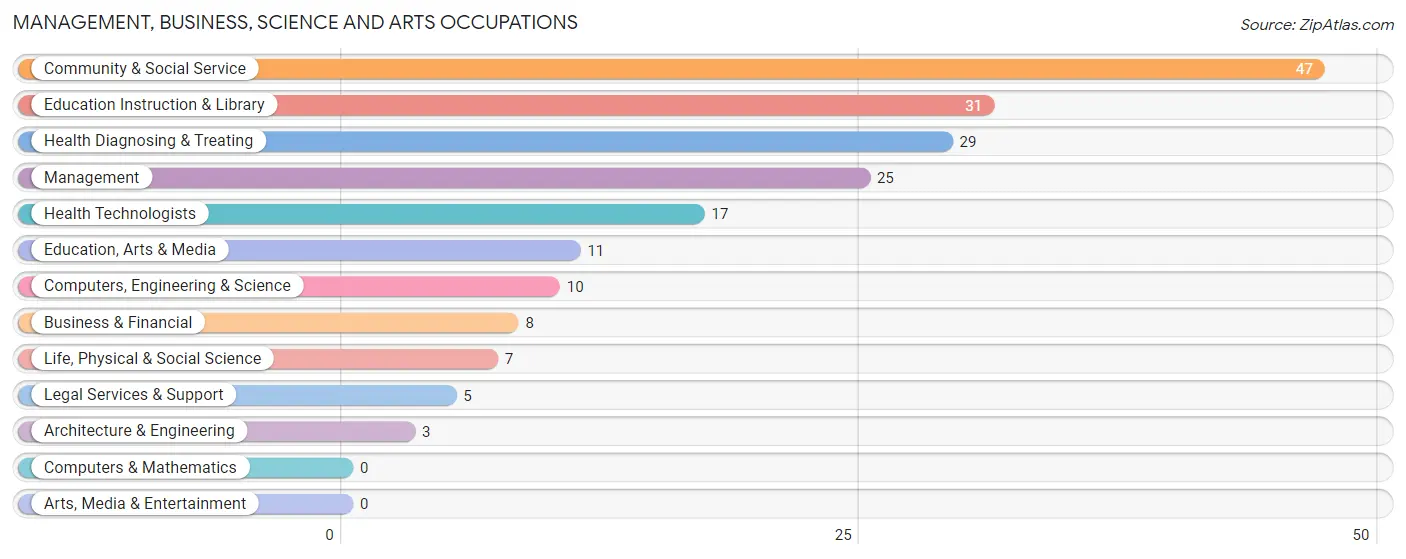
Management, Business, Science and Arts Occupations
The most common Management, Business, Science and Arts occupations in Exira are Community & Social Service (47 | 12.4%), Education Instruction & Library (31 | 8.2%), Health Diagnosing & Treating (29 | 7.6%), Management (25 | 6.6%), and Health Technologists (17 | 4.5%).
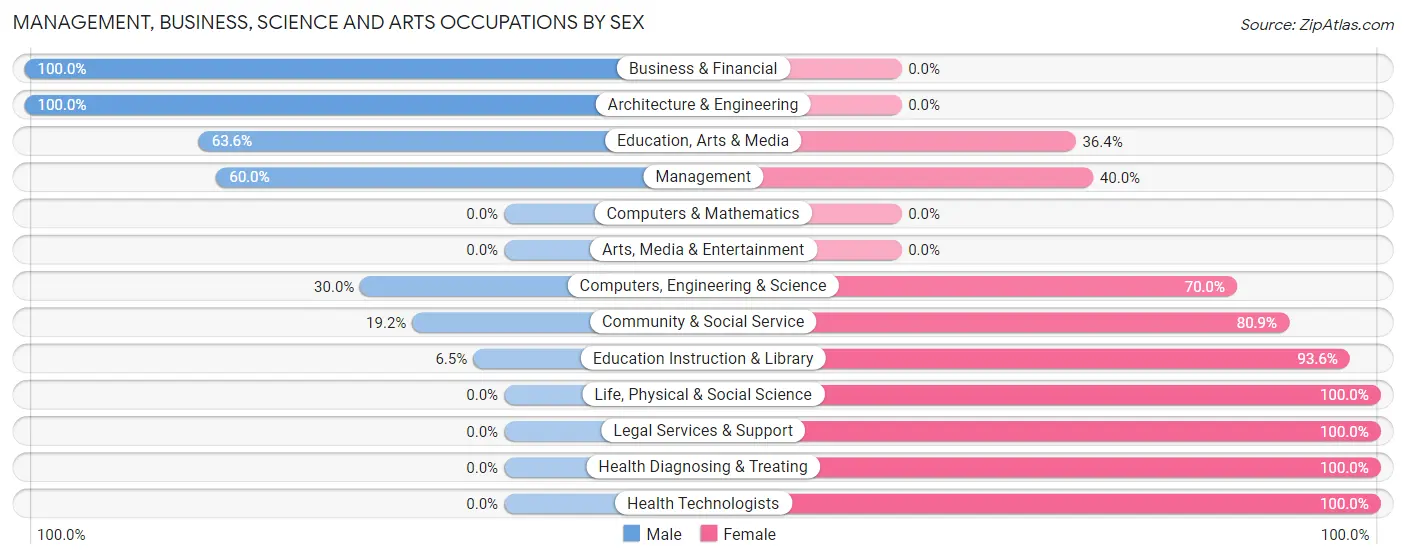
Management, Business, Science and Arts Occupations by Sex
Within the Management, Business, Science and Arts occupations in Exira, the most male-oriented occupations are Business & Financial (100.0%), Architecture & Engineering (100.0%), and Education, Arts & Media (63.6%), while the most female-oriented occupations are Life, Physical & Social Science (100.0%), Legal Services & Support (100.0%), and Health Diagnosing & Treating (100.0%).
| Occupation | Male | Female |
| Management | 15 (60.0%) | 10 (40.0%) |
| Business & Financial | 8 (100.0%) | 0 (0.0%) |
| Computers, Engineering & Science | 3 (30.0%) | 7 (70.0%) |
| Computers & Mathematics | 0 (0.0%) | 0 (0.0%) |
| Architecture & Engineering | 3 (100.0%) | 0 (0.0%) |
| Life, Physical & Social Science | 0 (0.0%) | 7 (100.0%) |
| Community & Social Service | 9 (19.2%) | 38 (80.8%) |
| Education, Arts & Media | 7 (63.6%) | 4 (36.4%) |
| Legal Services & Support | 0 (0.0%) | 5 (100.0%) |
| Education Instruction & Library | 2 (6.5%) | 29 (93.5%) |
| Arts, Media & Entertainment | 0 (0.0%) | 0 (0.0%) |
| Health Diagnosing & Treating | 0 (0.0%) | 29 (100.0%) |
| Health Technologists | 0 (0.0%) | 17 (100.0%) |
| Total (Category) | 35 (29.4%) | 84 (70.6%) |
| Total (Overall) | 190 (50.0%) | 190 (50.0%) |
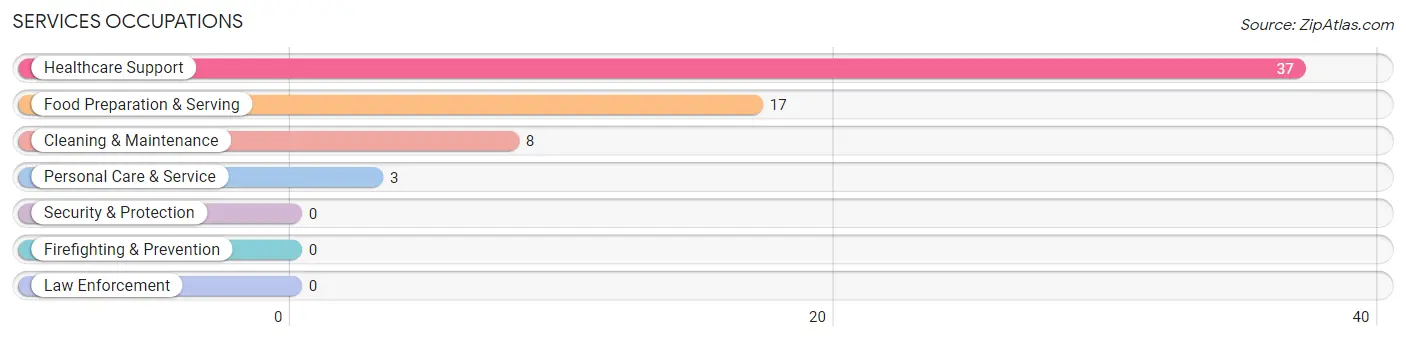
Services Occupations
The most common Services occupations in Exira are Healthcare Support (37 | 9.7%), Food Preparation & Serving (17 | 4.5%), Cleaning & Maintenance (8 | 2.1%), and Personal Care & Service (3 | 0.8%).
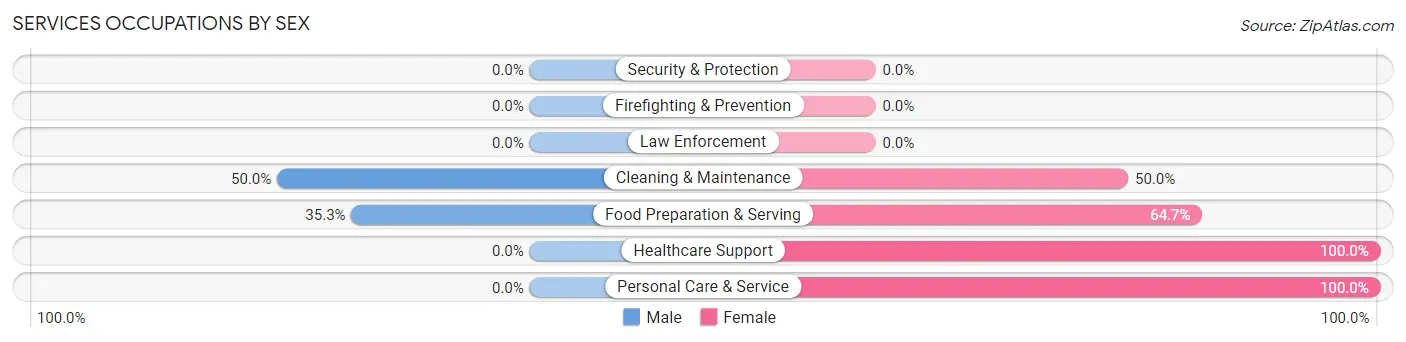
Services Occupations by Sex
Within the Services occupations in Exira, the most male-oriented occupations are Cleaning & Maintenance (50.0%), and Food Preparation & Serving (35.3%), while the most female-oriented occupations are Healthcare Support (100.0%), Personal Care & Service (100.0%), and Food Preparation & Serving (64.7%).
| Occupation | Male | Female |
| Healthcare Support | 0 (0.0%) | 37 (100.0%) |
| Security & Protection | 0 (0.0%) | 0 (0.0%) |
| Firefighting & Prevention | 0 (0.0%) | 0 (0.0%) |
| Law Enforcement | 0 (0.0%) | 0 (0.0%) |
| Food Preparation & Serving | 6 (35.3%) | 11 (64.7%) |
| Cleaning & Maintenance | 4 (50.0%) | 4 (50.0%) |
| Personal Care & Service | 0 (0.0%) | 3 (100.0%) |
| Total (Category) | 10 (15.4%) | 55 (84.6%) |
| Total (Overall) | 190 (50.0%) | 190 (50.0%) |
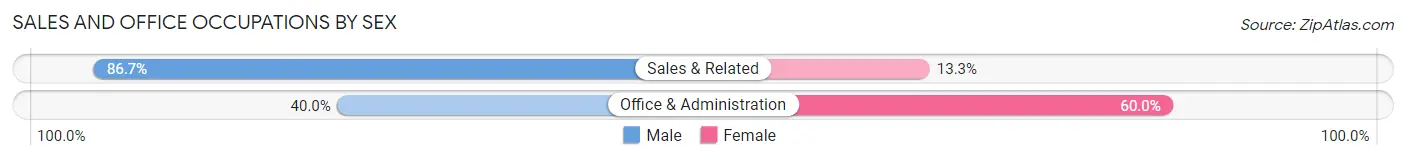
Sales and Office Occupations
The most common Sales and Office occupations in Exira are Office & Administration (25 | 6.6%), and Sales & Related (15 | 4.0%).
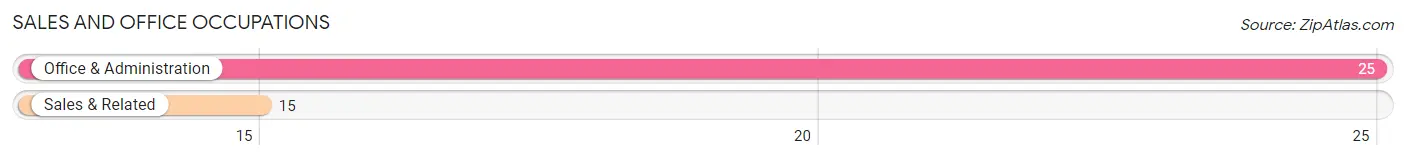
Sales and Office Occupations by Sex
| Occupation | Male | Female |
| Sales & Related | 13 (86.7%) | 2 (13.3%) |
| Office & Administration | 10 (40.0%) | 15 (60.0%) |
| Total (Category) | 23 (57.5%) | 17 (42.5%) |
| Total (Overall) | 190 (50.0%) | 190 (50.0%) |
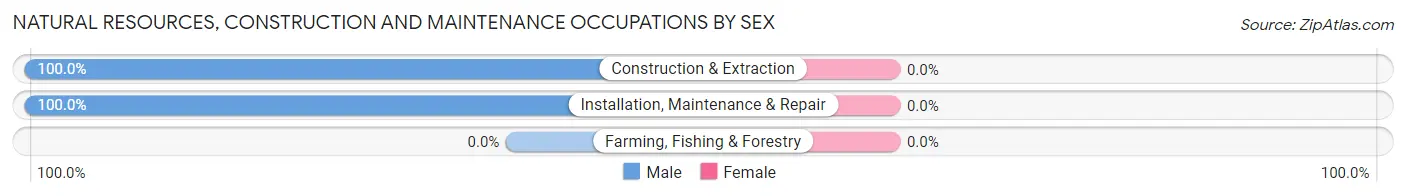
Natural Resources, Construction and Maintenance Occupations
The most common Natural Resources, Construction and Maintenance occupations in Exira are Construction & Extraction (29 | 7.6%), and Installation, Maintenance & Repair (25 | 6.6%).
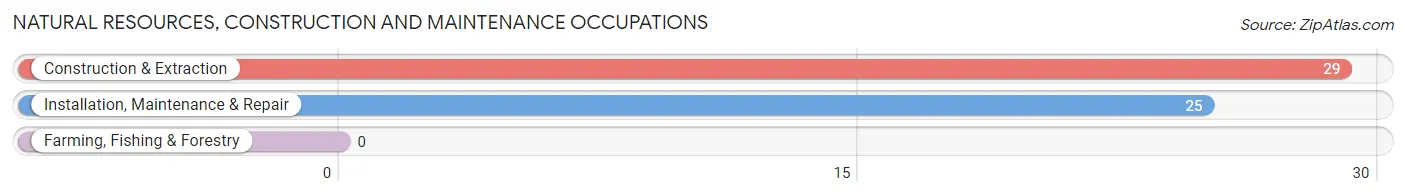
Natural Resources, Construction and Maintenance Occupations by Sex
| Occupation | Male | Female |
| Farming, Fishing & Forestry | 0 (0.0%) | 0 (0.0%) |
| Construction & Extraction | 29 (100.0%) | 0 (0.0%) |
| Installation, Maintenance & Repair | 25 (100.0%) | 0 (0.0%) |
| Total (Category) | 54 (100.0%) | 0 (0.0%) |
| Total (Overall) | 190 (50.0%) | 190 (50.0%) |
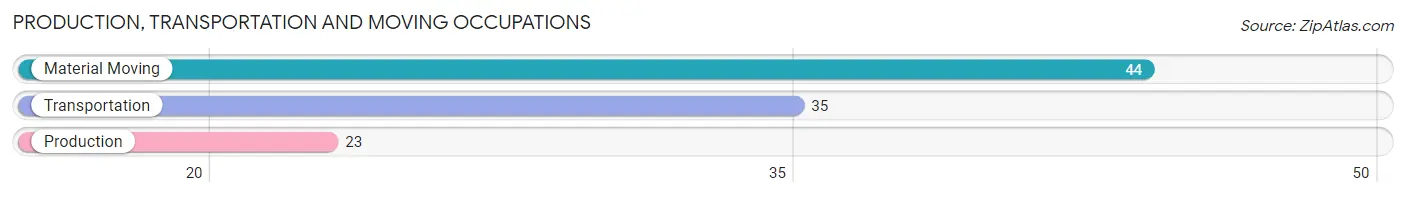
Production, Transportation and Moving Occupations
The most common Production, Transportation and Moving occupations in Exira are Material Moving (44 | 11.6%), Transportation (35 | 9.2%), and Production (23 | 6.0%).
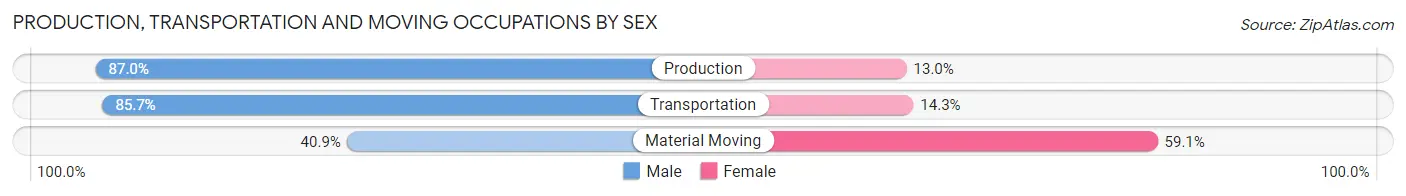
Production, Transportation and Moving Occupations by Sex
| Occupation | Male | Female |
| Production | 20 (87.0%) | 3 (13.0%) |
| Transportation | 30 (85.7%) | 5 (14.3%) |
| Material Moving | 18 (40.9%) | 26 (59.1%) |
| Total (Category) | 68 (66.7%) | 34 (33.3%) |
| Total (Overall) | 190 (50.0%) | 190 (50.0%) |
Employment Industries by Sex in Exira
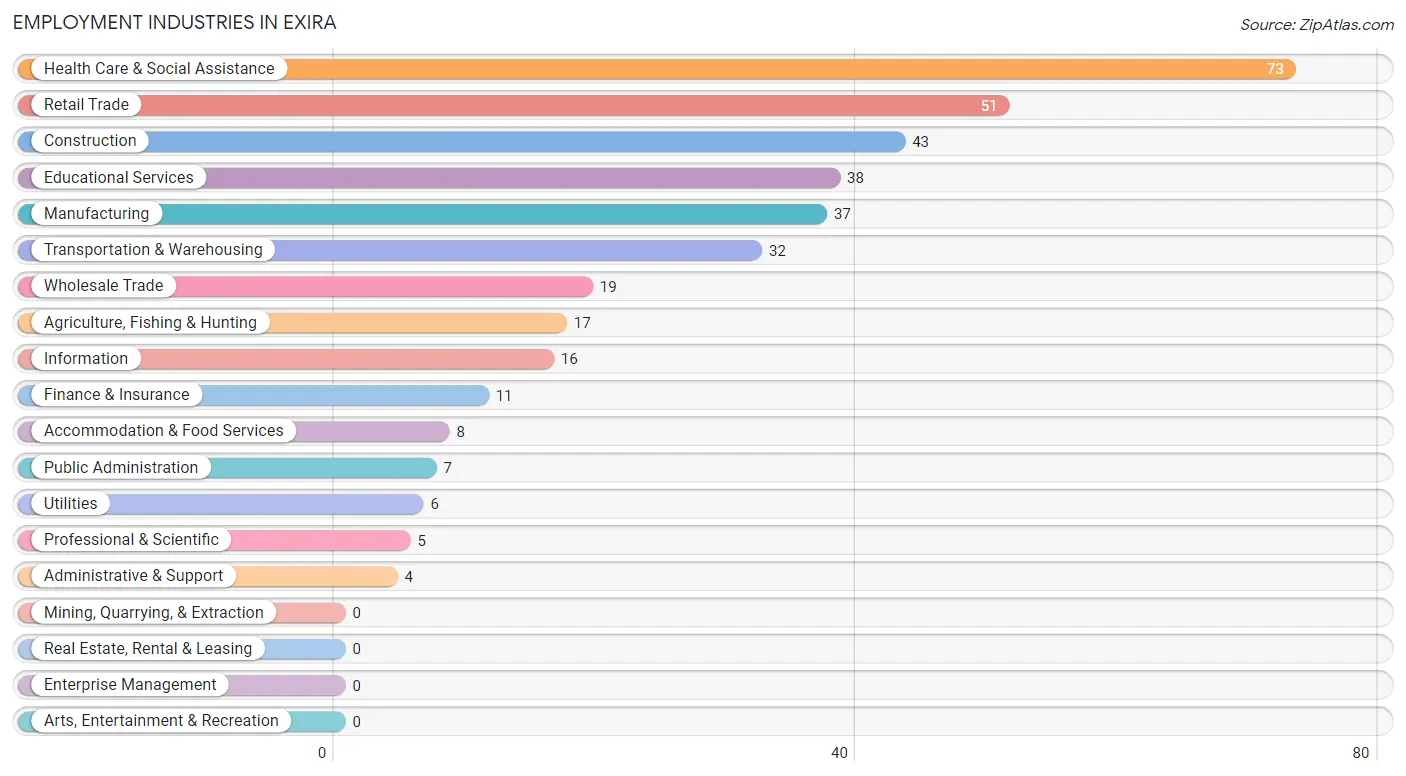
Employment Industries in Exira
The major employment industries in Exira include Health Care & Social Assistance (73 | 19.2%), Retail Trade (51 | 13.4%), Construction (43 | 11.3%), Educational Services (38 | 10.0%), and Manufacturing (37 | 9.7%).
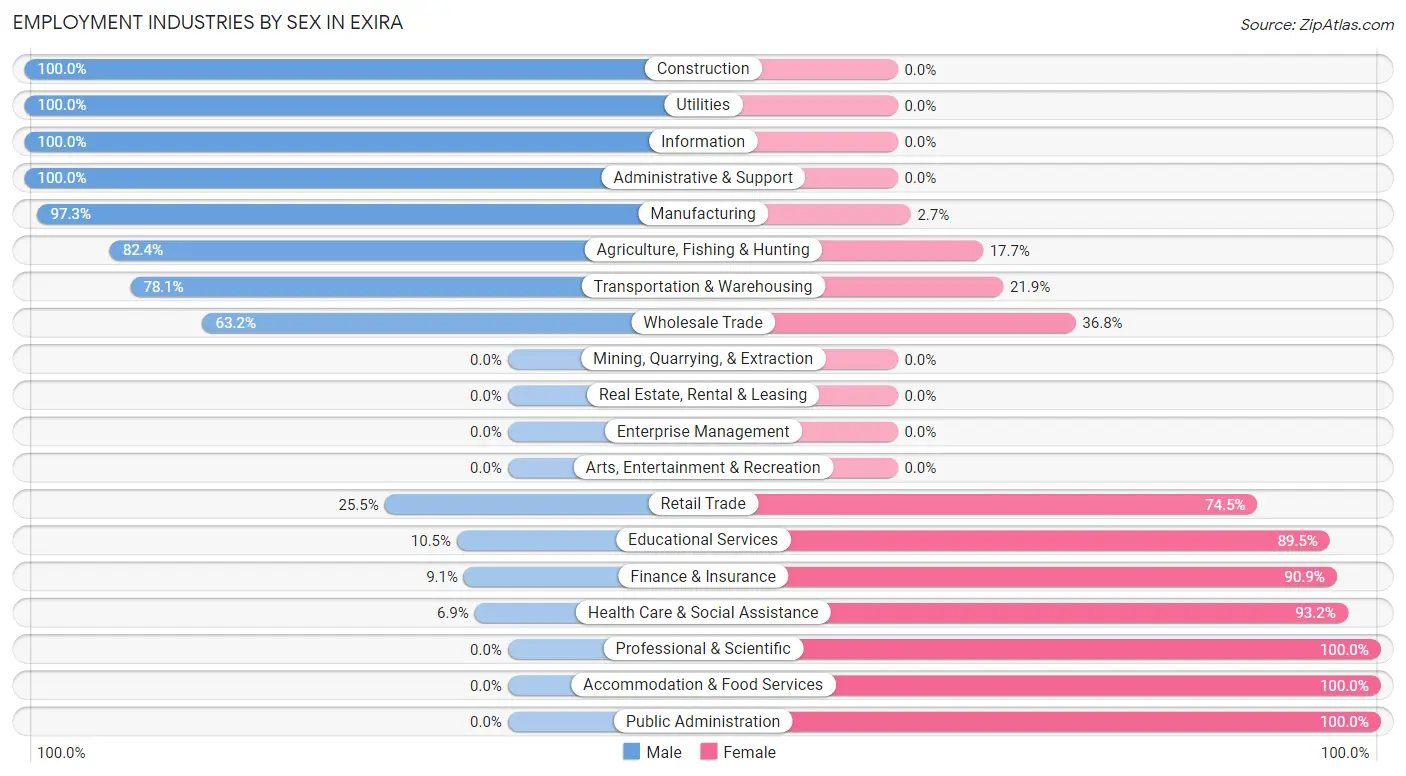
Employment Industries by Sex in Exira
The Exira industries that see more men than women are Construction (100.0%), Utilities (100.0%), and Information (100.0%), whereas the industries that tend to have a higher number of women are Professional & Scientific (100.0%), Accommodation & Food Services (100.0%), and Public Administration (100.0%).
| Industry | Male | Female |
| Agriculture, Fishing & Hunting | 14 (82.4%) | 3 (17.6%) |
| Mining, Quarrying, & Extraction | 0 (0.0%) | 0 (0.0%) |
| Construction | 43 (100.0%) | 0 (0.0%) |
| Manufacturing | 36 (97.3%) | 1 (2.7%) |
| Wholesale Trade | 12 (63.2%) | 7 (36.8%) |
| Retail Trade | 13 (25.5%) | 38 (74.5%) |
| Transportation & Warehousing | 25 (78.1%) | 7 (21.9%) |
| Utilities | 6 (100.0%) | 0 (0.0%) |
| Information | 16 (100.0%) | 0 (0.0%) |
| Finance & Insurance | 1 (9.1%) | 10 (90.9%) |
| Real Estate, Rental & Leasing | 0 (0.0%) | 0 (0.0%) |
| Professional & Scientific | 0 (0.0%) | 5 (100.0%) |
| Enterprise Management | 0 (0.0%) | 0 (0.0%) |
| Administrative & Support | 4 (100.0%) | 0 (0.0%) |
| Educational Services | 4 (10.5%) | 34 (89.5%) |
| Health Care & Social Assistance | 5 (6.9%) | 68 (93.1%) |
| Arts, Entertainment & Recreation | 0 (0.0%) | 0 (0.0%) |
| Accommodation & Food Services | 0 (0.0%) | 8 (100.0%) |
| Public Administration | 0 (0.0%) | 7 (100.0%) |
| Total | 190 (50.0%) | 190 (50.0%) |
Education in Exira
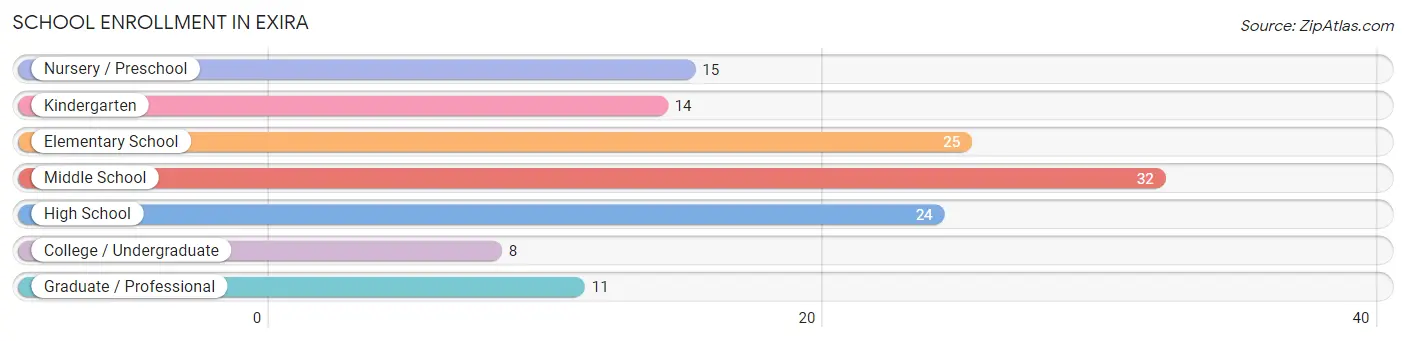
School Enrollment in Exira
The most common levels of schooling among the 129 students in Exira are middle school (32 | 24.8%), elementary school (25 | 19.4%), and high school (24 | 18.6%).
| School Level | # Students | % Students |
| Nursery / Preschool | 15 | 11.6% |
| Kindergarten | 14 | 10.8% |
| Elementary School | 25 | 19.4% |
| Middle School | 32 | 24.8% |
| High School | 24 | 18.6% |
| College / Undergraduate | 8 | 6.2% |
| Graduate / Professional | 11 | 8.5% |
| Total | 129 | 100.0% |
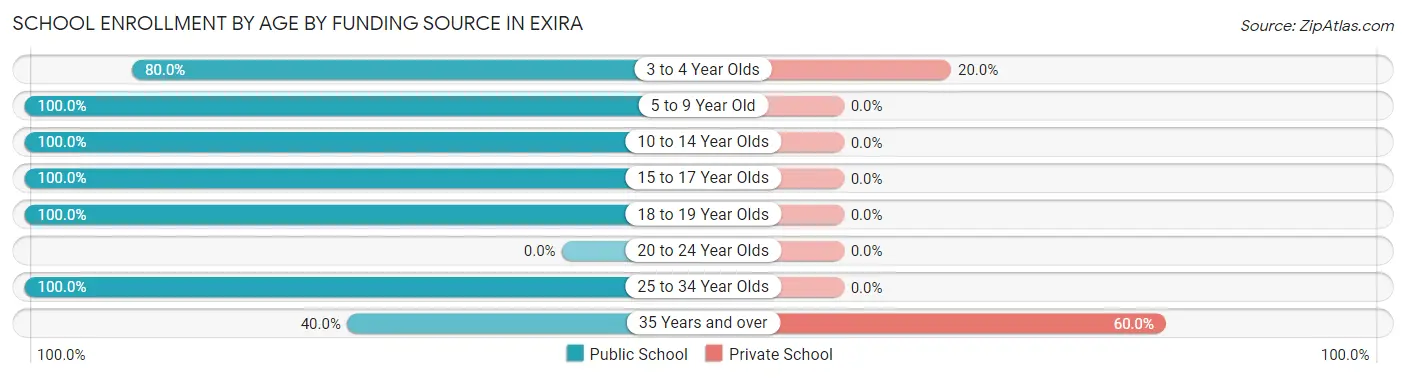
School Enrollment by Age by Funding Source in Exira
Out of a total of 129 students who are enrolled in schools in Exira, 5 (3.9%) attend a private institution, while the remaining 124 (96.1%) are enrolled in public schools. The age group of 35 years and over has the highest likelihood of being enrolled in private schools, with 3 (60.0% in the age bracket) enrolled. Conversely, the age group of 5 to 9 year old has the lowest likelihood of being enrolled in a private school, with 42 (100.0% in the age bracket) attending a public institution.
| Age Bracket | Public School | Private School |
| 3 to 4 Year Olds | 8 (80.0%) | 2 (20.0%) |
| 5 to 9 Year Old | 42 (100.0%) | 0 (0.0%) |
| 10 to 14 Year Olds | 43 (100.0%) | 0 (0.0%) |
| 15 to 17 Year Olds | 15 (100.0%) | 0 (0.0%) |
| 18 to 19 Year Olds | 5 (100.0%) | 0 (0.0%) |
| 20 to 24 Year Olds | 0 (0.0%) | 0 (0.0%) |
| 25 to 34 Year Olds | 9 (100.0%) | 0 (0.0%) |
| 35 Years and over | 2 (40.0%) | 3 (60.0%) |
| Total | 124 (96.1%) | 5 (3.9%) |
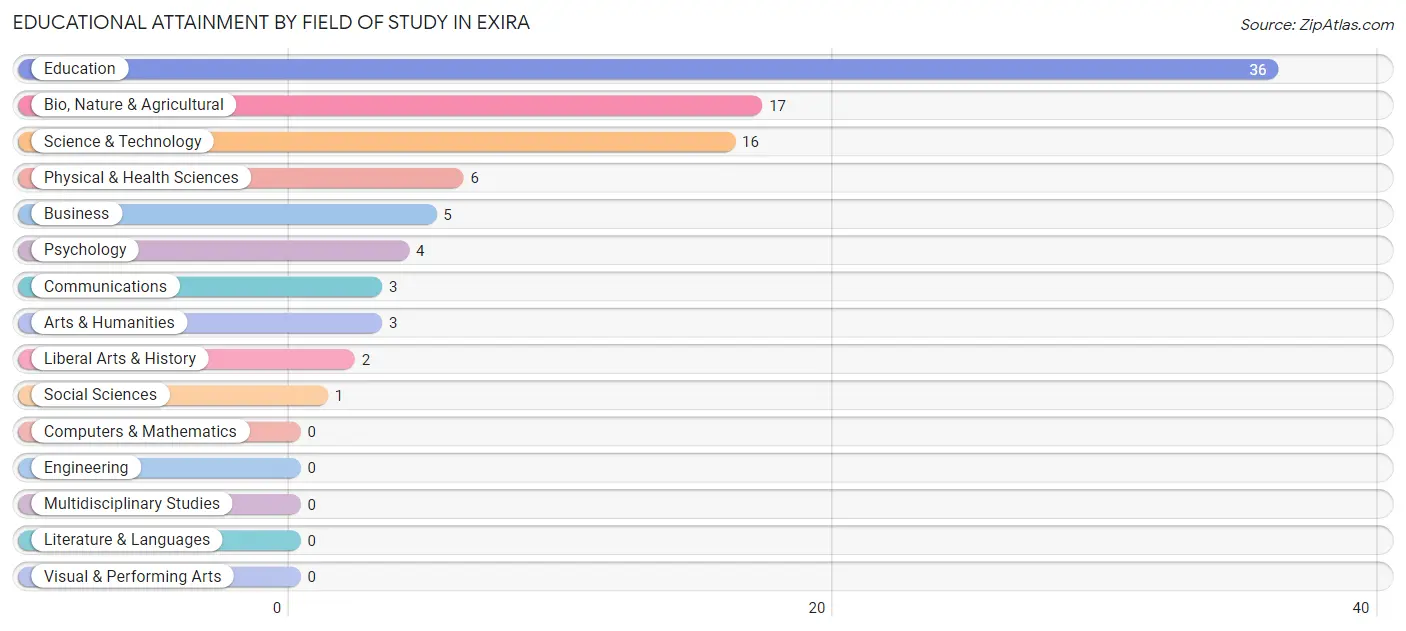
Educational Attainment by Field of Study in Exira
Education (36 | 38.7%), bio, nature & agricultural (17 | 18.3%), science & technology (16 | 17.2%), physical & health sciences (6 | 6.5%), and business (5 | 5.4%) are the most common fields of study among 93 individuals in Exira who have obtained a bachelor's degree or higher.
| Field of Study | # Graduates | % Graduates |
| Computers & Mathematics | 0 | 0.0% |
| Bio, Nature & Agricultural | 17 | 18.3% |
| Physical & Health Sciences | 6 | 6.5% |
| Psychology | 4 | 4.3% |
| Social Sciences | 1 | 1.1% |
| Engineering | 0 | 0.0% |
| Multidisciplinary Studies | 0 | 0.0% |
| Science & Technology | 16 | 17.2% |
| Business | 5 | 5.4% |
| Education | 36 | 38.7% |
| Literature & Languages | 0 | 0.0% |
| Liberal Arts & History | 2 | 2.1% |
| Visual & Performing Arts | 0 | 0.0% |
| Communications | 3 | 3.2% |
| Arts & Humanities | 3 | 3.2% |
| Total | 93 | 100.0% |
Transportation & Commute in Exira
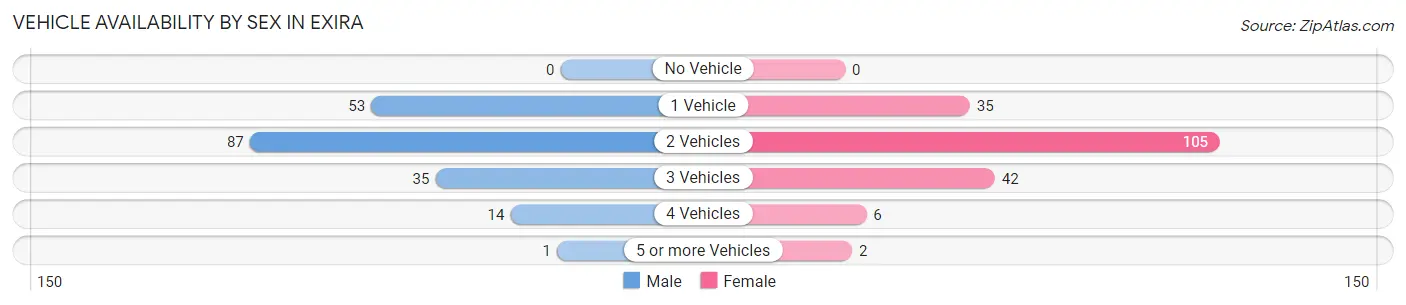
Vehicle Availability by Sex in Exira
The most prevalent vehicle ownership categories in Exira are males with 2 vehicles (87, accounting for 45.8%) and females with 2 vehicles (105, making up 45.8%).
| Vehicles Available | Male | Female |
| No Vehicle | 0 (0.0%) | 0 (0.0%) |
| 1 Vehicle | 53 (27.9%) | 35 (18.4%) |
| 2 Vehicles | 87 (45.8%) | 105 (55.3%) |
| 3 Vehicles | 35 (18.4%) | 42 (22.1%) |
| 4 Vehicles | 14 (7.4%) | 6 (3.2%) |
| 5 or more Vehicles | 1 (0.5%) | 2 (1.1%) |
| Total | 190 (100.0%) | 190 (100.0%) |
Commute Time in Exira
The most frequently occuring commute durations in Exira are 20 to 24 minutes (82 commuters, 22.3%), less than 5 minutes (72 commuters, 19.6%), and 5 to 9 minutes (66 commuters, 18.0%).
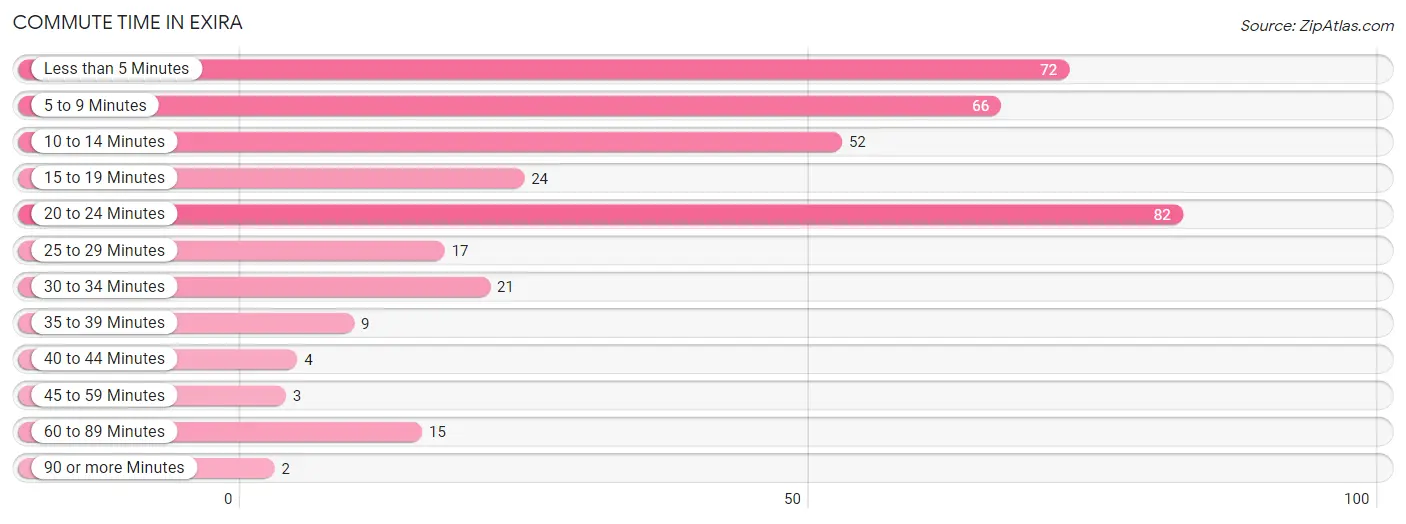
| Commute Time | # Commuters | % Commuters |
| Less than 5 Minutes | 72 | 19.6% |
| 5 to 9 Minutes | 66 | 18.0% |
| 10 to 14 Minutes | 52 | 14.2% |
| 15 to 19 Minutes | 24 | 6.5% |
| 20 to 24 Minutes | 82 | 22.3% |
| 25 to 29 Minutes | 17 | 4.6% |
| 30 to 34 Minutes | 21 | 5.7% |
| 35 to 39 Minutes | 9 | 2.5% |
| 40 to 44 Minutes | 4 | 1.1% |
| 45 to 59 Minutes | 3 | 0.8% |
| 60 to 89 Minutes | 15 | 4.1% |
| 90 or more Minutes | 2 | 0.5% |
Commute Time by Sex in Exira
The most common commute times in Exira are 20 to 24 minutes (56 commuters, 29.5%) for males and less than 5 minutes (42 commuters, 23.7%) for females.
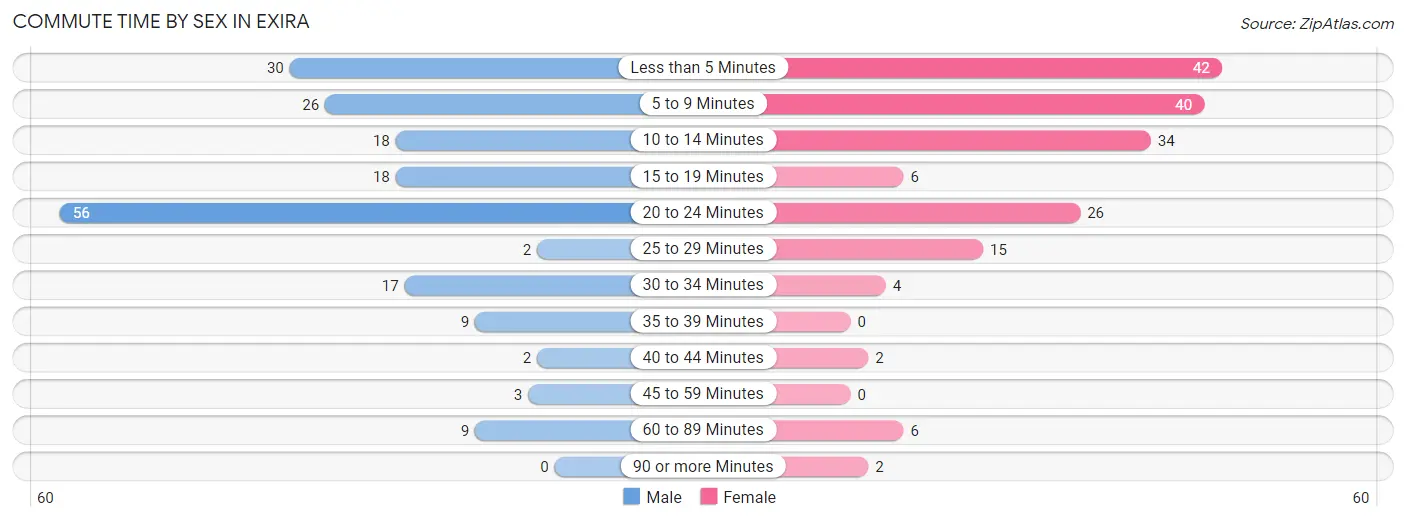
| Commute Time | Male | Female |
| Less than 5 Minutes | 30 (15.8%) | 42 (23.7%) |
| 5 to 9 Minutes | 26 (13.7%) | 40 (22.6%) |
| 10 to 14 Minutes | 18 (9.5%) | 34 (19.2%) |
| 15 to 19 Minutes | 18 (9.5%) | 6 (3.4%) |
| 20 to 24 Minutes | 56 (29.5%) | 26 (14.7%) |
| 25 to 29 Minutes | 2 (1.1%) | 15 (8.5%) |
| 30 to 34 Minutes | 17 (8.9%) | 4 (2.3%) |
| 35 to 39 Minutes | 9 (4.7%) | 0 (0.0%) |
| 40 to 44 Minutes | 2 (1.1%) | 2 (1.1%) |
| 45 to 59 Minutes | 3 (1.6%) | 0 (0.0%) |
| 60 to 89 Minutes | 9 (4.7%) | 6 (3.4%) |
| 90 or more Minutes | 0 (0.0%) | 2 (1.1%) |
Time of Departure to Work by Sex in Exira
The most frequent times of departure to work in Exira are 7:00 AM to 7:29 AM (44, 23.2%) for males and 7:30 AM to 7:59 AM (62, 35.0%) for females.
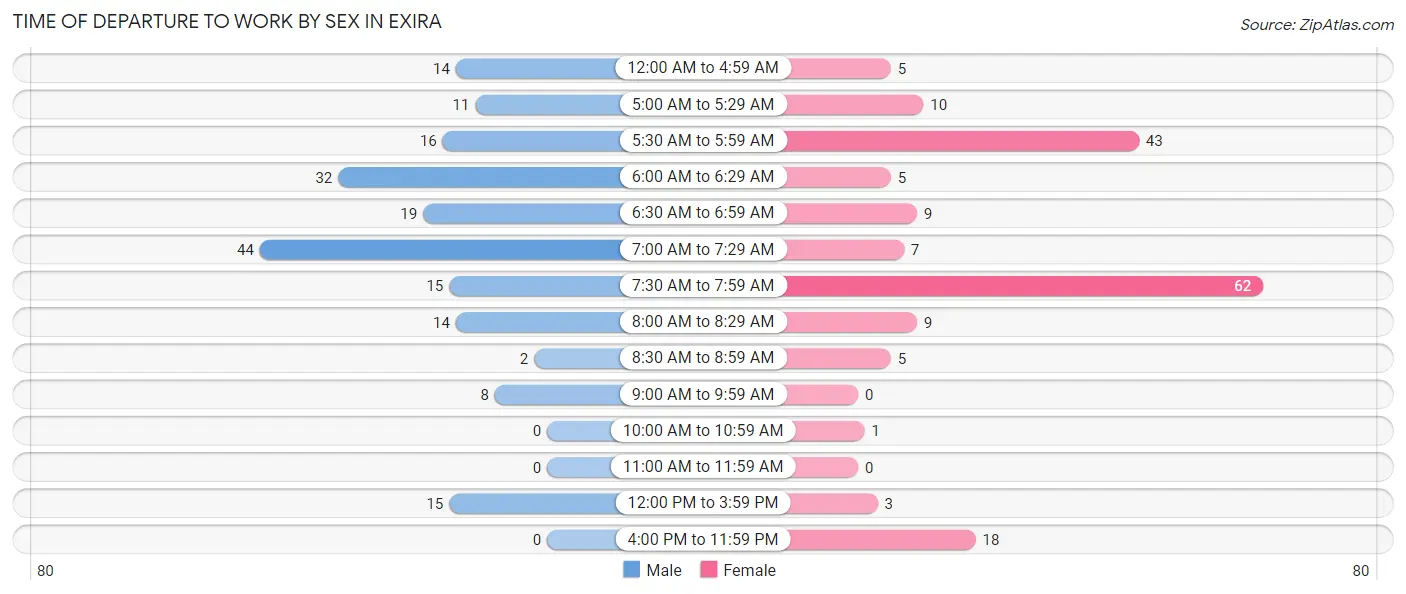
| Time of Departure | Male | Female |
| 12:00 AM to 4:59 AM | 14 (7.4%) | 5 (2.8%) |
| 5:00 AM to 5:29 AM | 11 (5.8%) | 10 (5.7%) |
| 5:30 AM to 5:59 AM | 16 (8.4%) | 43 (24.3%) |
| 6:00 AM to 6:29 AM | 32 (16.8%) | 5 (2.8%) |
| 6:30 AM to 6:59 AM | 19 (10.0%) | 9 (5.1%) |
| 7:00 AM to 7:29 AM | 44 (23.2%) | 7 (4.0%) |
| 7:30 AM to 7:59 AM | 15 (7.9%) | 62 (35.0%) |
| 8:00 AM to 8:29 AM | 14 (7.4%) | 9 (5.1%) |
| 8:30 AM to 8:59 AM | 2 (1.1%) | 5 (2.8%) |
| 9:00 AM to 9:59 AM | 8 (4.2%) | 0 (0.0%) |
| 10:00 AM to 10:59 AM | 0 (0.0%) | 1 (0.6%) |
| 11:00 AM to 11:59 AM | 0 (0.0%) | 0 (0.0%) |
| 12:00 PM to 3:59 PM | 15 (7.9%) | 3 (1.7%) |
| 4:00 PM to 11:59 PM | 0 (0.0%) | 18 (10.2%) |
| Total | 190 (100.0%) | 177 (100.0%) |
Housing Occupancy in Exira
Occupancy by Ownership in Exira
Of the total 384 dwellings in Exira, owner-occupied units account for 319 (83.1%), while renter-occupied units make up 65 (16.9%).
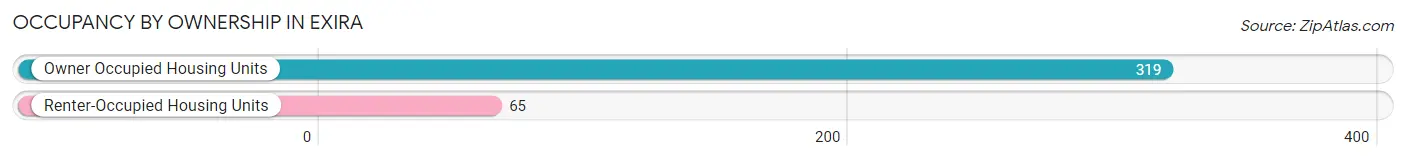
| Occupancy | # Housing Units | % Housing Units |
| Owner Occupied Housing Units | 319 | 83.1% |
| Renter-Occupied Housing Units | 65 | 16.9% |
| Total Occupied Housing Units | 384 | 100.0% |
Occupancy by Household Size in Exira
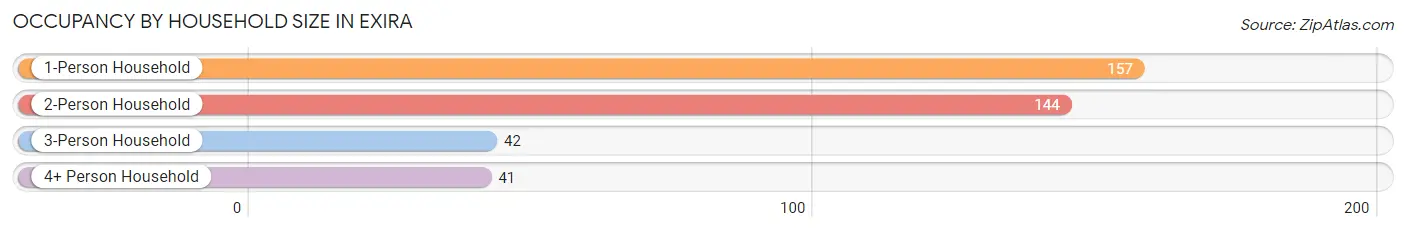
| Household Size | # Housing Units | % Housing Units |
| 1-Person Household | 157 | 40.9% |
| 2-Person Household | 144 | 37.5% |
| 3-Person Household | 42 | 10.9% |
| 4+ Person Household | 41 | 10.7% |
| Total Housing Units | 384 | 100.0% |
Occupancy by Ownership by Household Size in Exira
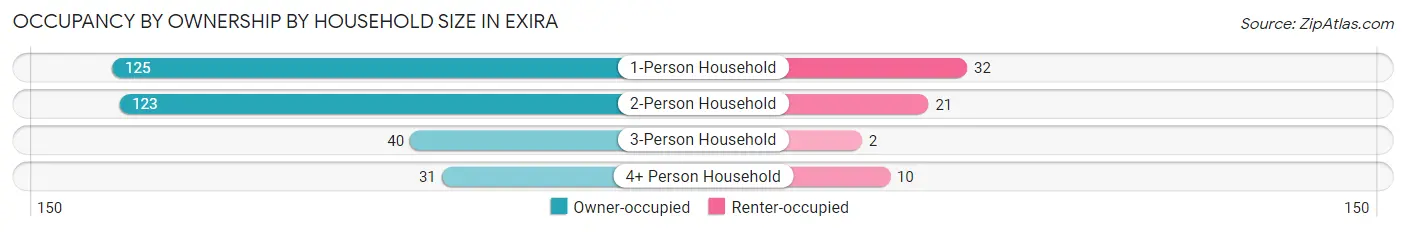
| Household Size | Owner-occupied | Renter-occupied |
| 1-Person Household | 125 (79.6%) | 32 (20.4%) |
| 2-Person Household | 123 (85.4%) | 21 (14.6%) |
| 3-Person Household | 40 (95.2%) | 2 (4.8%) |
| 4+ Person Household | 31 (75.6%) | 10 (24.4%) |
| Total Housing Units | 319 (83.1%) | 65 (16.9%) |
Occupancy by Educational Attainment in Exira
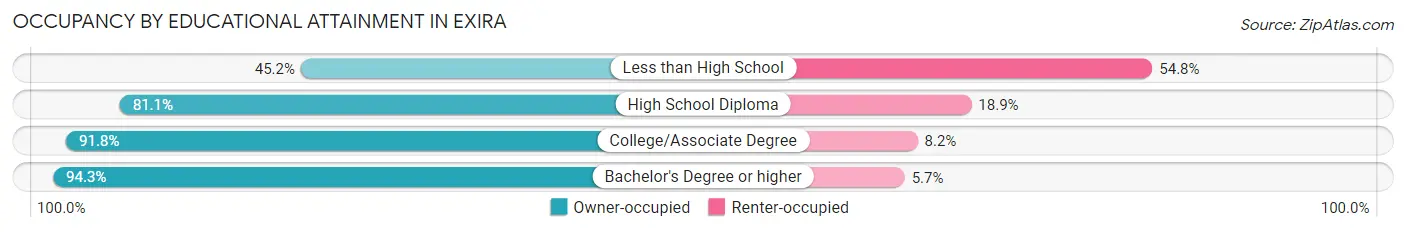
| Household Size | Owner-occupied | Renter-occupied |
| Less than High School | 19 (45.2%) | 23 (54.8%) |
| High School Diploma | 116 (81.1%) | 27 (18.9%) |
| College/Associate Degree | 134 (91.8%) | 12 (8.2%) |
| Bachelor's Degree or higher | 50 (94.3%) | 3 (5.7%) |
Occupancy by Age of Householder in Exira
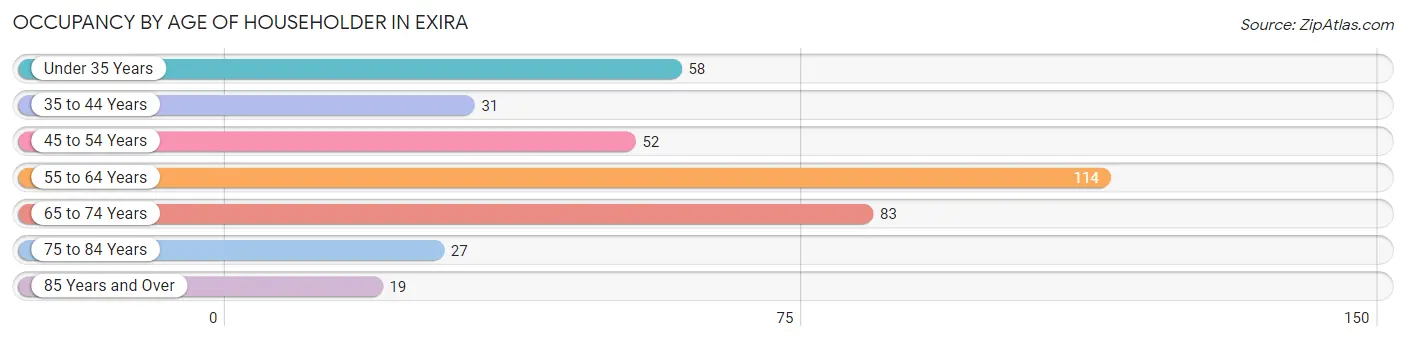
| Age Bracket | # Households | % Households |
| Under 35 Years | 58 | 15.1% |
| 35 to 44 Years | 31 | 8.1% |
| 45 to 54 Years | 52 | 13.5% |
| 55 to 64 Years | 114 | 29.7% |
| 65 to 74 Years | 83 | 21.6% |
| 75 to 84 Years | 27 | 7.0% |
| 85 Years and Over | 19 | 5.0% |
| Total | 384 | 100.0% |
Housing Finances in Exira
Median Income by Occupancy in Exira
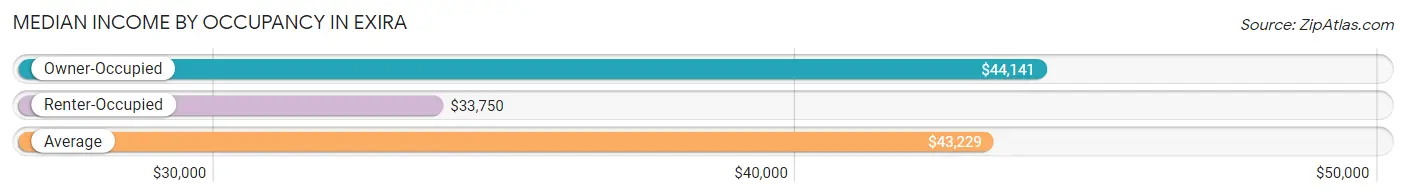
| Occupancy Type | # Households | Median Income |
| Owner-Occupied | 319 (83.1%) | $44,141 |
| Renter-Occupied | 65 (16.9%) | $33,750 |
| Average | 384 (100.0%) | $43,229 |
Occupancy by Householder Income Bracket in Exira
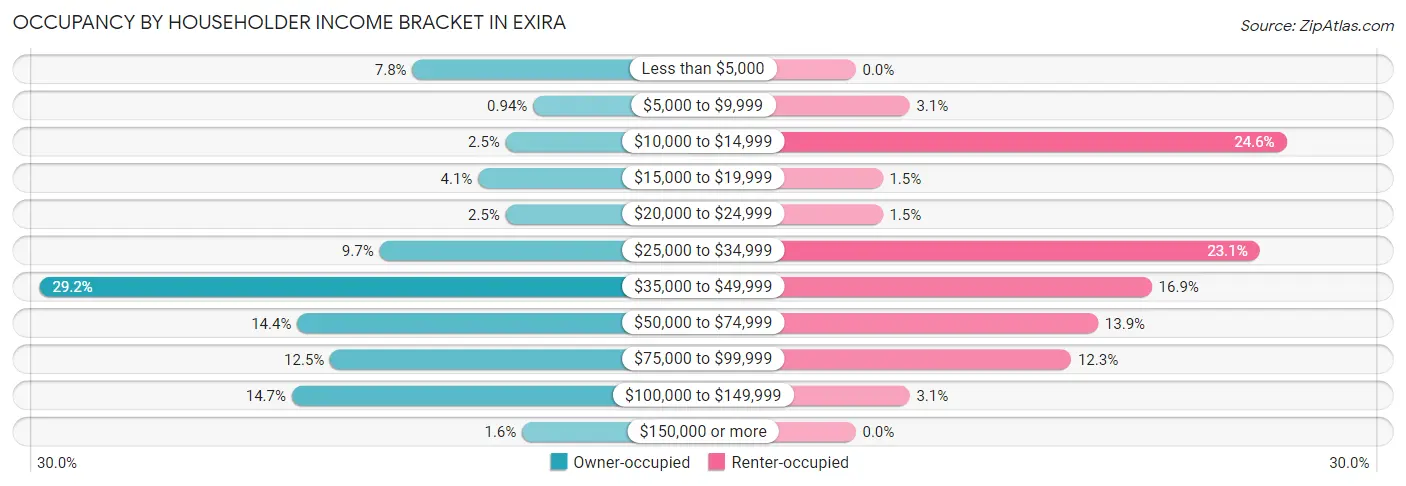
| Income Bracket | Owner-occupied | Renter-occupied |
| Less than $5,000 | 25 (7.8%) | 0 (0.0%) |
| $5,000 to $9,999 | 3 (0.9%) | 2 (3.1%) |
| $10,000 to $14,999 | 8 (2.5%) | 16 (24.6%) |
| $15,000 to $19,999 | 13 (4.1%) | 1 (1.5%) |
| $20,000 to $24,999 | 8 (2.5%) | 1 (1.5%) |
| $25,000 to $34,999 | 31 (9.7%) | 15 (23.1%) |
| $35,000 to $49,999 | 93 (29.1%) | 11 (16.9%) |
| $50,000 to $74,999 | 46 (14.4%) | 9 (13.9%) |
| $75,000 to $99,999 | 40 (12.5%) | 8 (12.3%) |
| $100,000 to $149,999 | 47 (14.7%) | 2 (3.1%) |
| $150,000 or more | 5 (1.6%) | 0 (0.0%) |
| Total | 319 (100.0%) | 65 (100.0%) |
Monthly Housing Cost Tiers in Exira
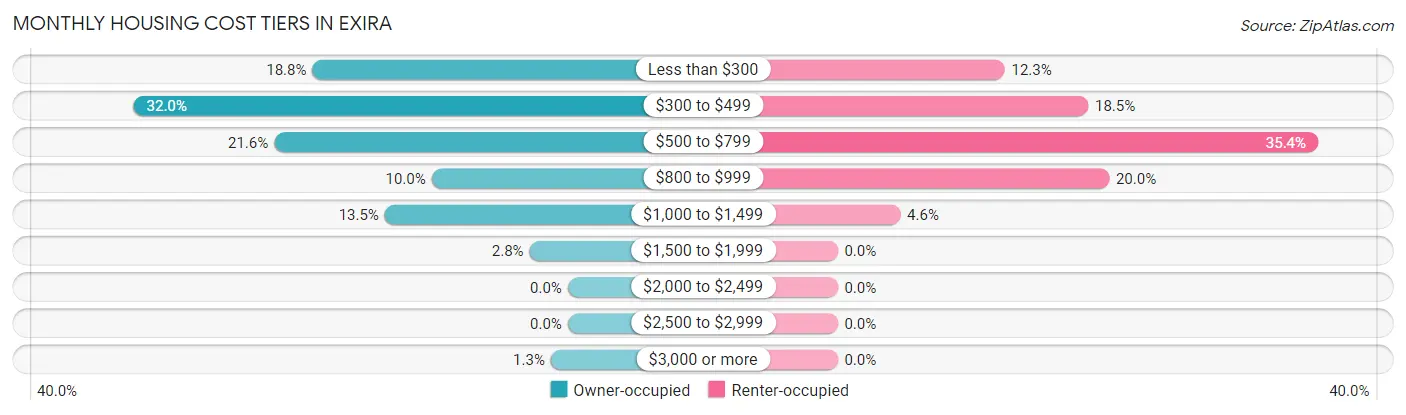
| Monthly Cost | Owner-occupied | Renter-occupied |
| Less than $300 | 60 (18.8%) | 8 (12.3%) |
| $300 to $499 | 102 (32.0%) | 12 (18.5%) |
| $500 to $799 | 69 (21.6%) | 23 (35.4%) |
| $800 to $999 | 32 (10.0%) | 13 (20.0%) |
| $1,000 to $1,499 | 43 (13.5%) | 3 (4.6%) |
| $1,500 to $1,999 | 9 (2.8%) | 0 (0.0%) |
| $2,000 to $2,499 | 0 (0.0%) | 0 (0.0%) |
| $2,500 to $2,999 | 0 (0.0%) | 0 (0.0%) |
| $3,000 or more | 4 (1.3%) | 0 (0.0%) |
| Total | 319 (100.0%) | 65 (100.0%) |
Physical Housing Characteristics in Exira
Housing Structures in Exira
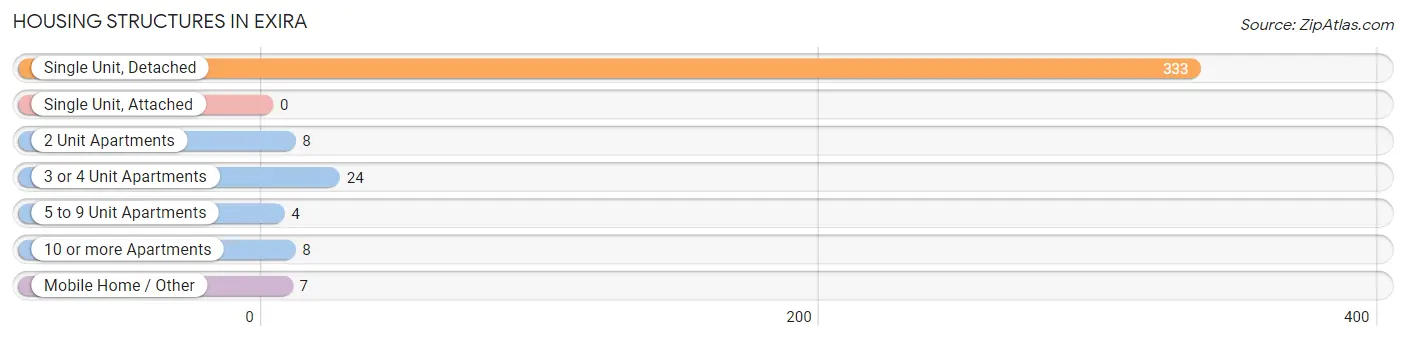
| Structure Type | # Housing Units | % Housing Units |
| Single Unit, Detached | 333 | 86.7% |
| Single Unit, Attached | 0 | 0.0% |
| 2 Unit Apartments | 8 | 2.1% |
| 3 or 4 Unit Apartments | 24 | 6.2% |
| 5 to 9 Unit Apartments | 4 | 1.0% |
| 10 or more Apartments | 8 | 2.1% |
| Mobile Home / Other | 7 | 1.8% |
| Total | 384 | 100.0% |
Housing Structures by Occupancy in Exira
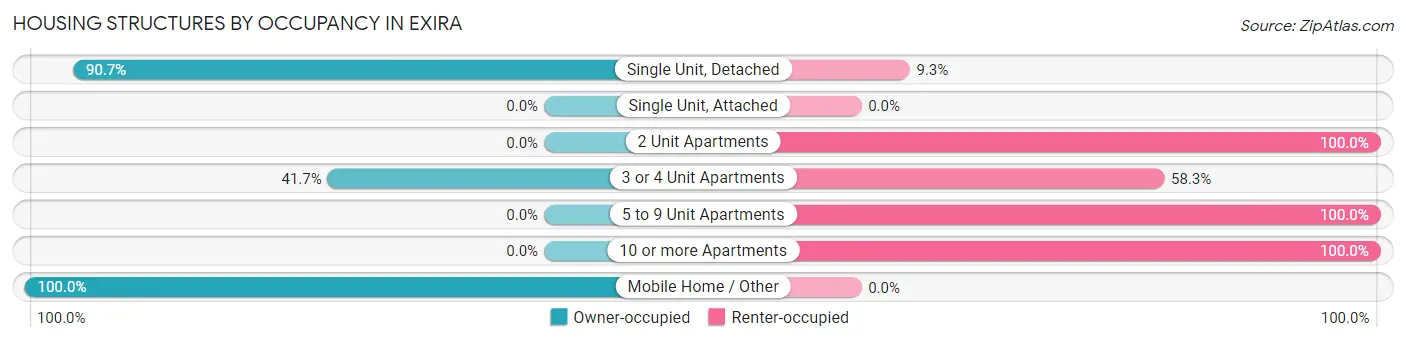
| Structure Type | Owner-occupied | Renter-occupied |
| Single Unit, Detached | 302 (90.7%) | 31 (9.3%) |
| Single Unit, Attached | 0 (0.0%) | 0 (0.0%) |
| 2 Unit Apartments | 0 (0.0%) | 8 (100.0%) |
| 3 or 4 Unit Apartments | 10 (41.7%) | 14 (58.3%) |
| 5 to 9 Unit Apartments | 0 (0.0%) | 4 (100.0%) |
| 10 or more Apartments | 0 (0.0%) | 8 (100.0%) |
| Mobile Home / Other | 7 (100.0%) | 0 (0.0%) |
| Total | 319 (83.1%) | 65 (16.9%) |
Housing Structures by Number of Rooms in Exira
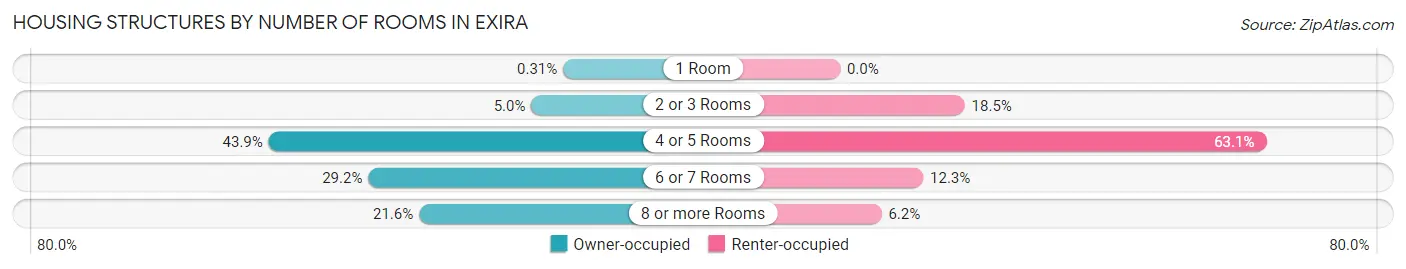
| Number of Rooms | Owner-occupied | Renter-occupied |
| 1 Room | 1 (0.3%) | 0 (0.0%) |
| 2 or 3 Rooms | 16 (5.0%) | 12 (18.5%) |
| 4 or 5 Rooms | 140 (43.9%) | 41 (63.1%) |
| 6 or 7 Rooms | 93 (29.1%) | 8 (12.3%) |
| 8 or more Rooms | 69 (21.6%) | 4 (6.1%) |
| Total | 319 (100.0%) | 65 (100.0%) |
Housing Structure by Heating Type in Exira
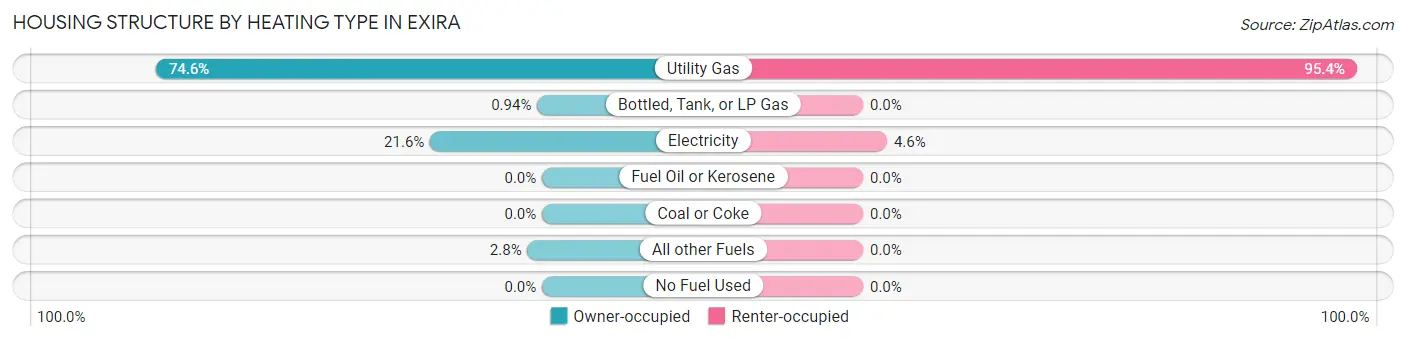
| Heating Type | Owner-occupied | Renter-occupied |
| Utility Gas | 238 (74.6%) | 62 (95.4%) |
| Bottled, Tank, or LP Gas | 3 (0.9%) | 0 (0.0%) |
| Electricity | 69 (21.6%) | 3 (4.6%) |
| Fuel Oil or Kerosene | 0 (0.0%) | 0 (0.0%) |
| Coal or Coke | 0 (0.0%) | 0 (0.0%) |
| All other Fuels | 9 (2.8%) | 0 (0.0%) |
| No Fuel Used | 0 (0.0%) | 0 (0.0%) |
| Total | 319 (100.0%) | 65 (100.0%) |
Household Vehicle Usage in Exira
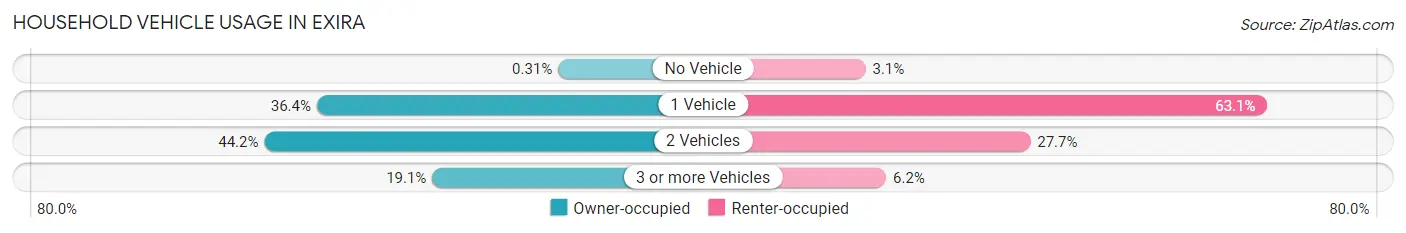
| Vehicles per Household | Owner-occupied | Renter-occupied |
| No Vehicle | 1 (0.3%) | 2 (3.1%) |
| 1 Vehicle | 116 (36.4%) | 41 (63.1%) |
| 2 Vehicles | 141 (44.2%) | 18 (27.7%) |
| 3 or more Vehicles | 61 (19.1%) | 4 (6.1%) |
| Total | 319 (100.0%) | 65 (100.0%) |
Real Estate & Mortgages in Exira
Real Estate and Mortgage Overview in Exira
| Characteristic | Without Mortgage | With Mortgage |
| Housing Units | 191 | 128 |
| Median Property Value | $58,900 | $78,100 |
| Median Household Income | $42,768 | $5 |
| Monthly Housing Costs | $346 | $4 |
| Real Estate Taxes | $744 | $3 |
Property Value by Mortgage Status in Exira
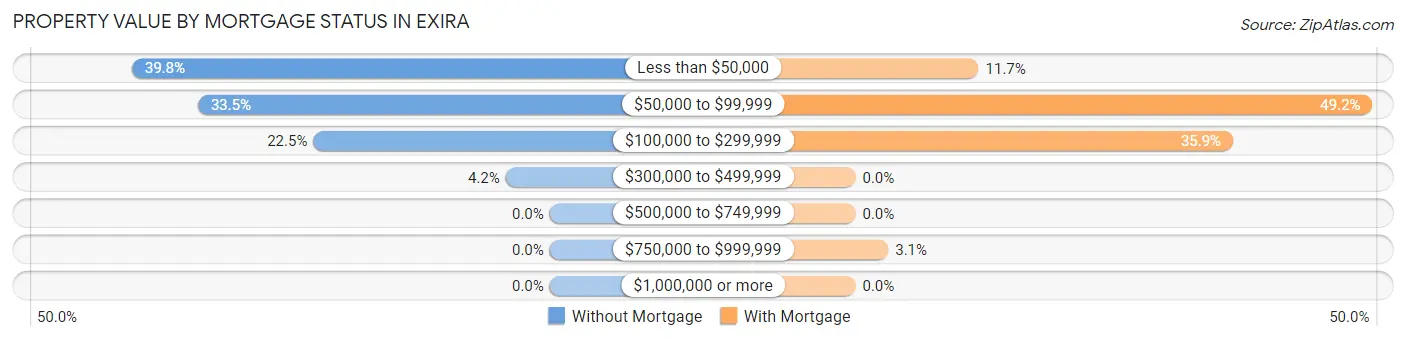
| Property Value | Without Mortgage | With Mortgage |
| Less than $50,000 | 76 (39.8%) | 15 (11.7%) |
| $50,000 to $99,999 | 64 (33.5%) | 63 (49.2%) |
| $100,000 to $299,999 | 43 (22.5%) | 46 (35.9%) |
| $300,000 to $499,999 | 8 (4.2%) | 0 (0.0%) |
| $500,000 to $749,999 | 0 (0.0%) | 0 (0.0%) |
| $750,000 to $999,999 | 0 (0.0%) | 4 (3.1%) |
| $1,000,000 or more | 0 (0.0%) | 0 (0.0%) |
| Total | 191 (100.0%) | 128 (100.0%) |
Household Income by Mortgage Status in Exira
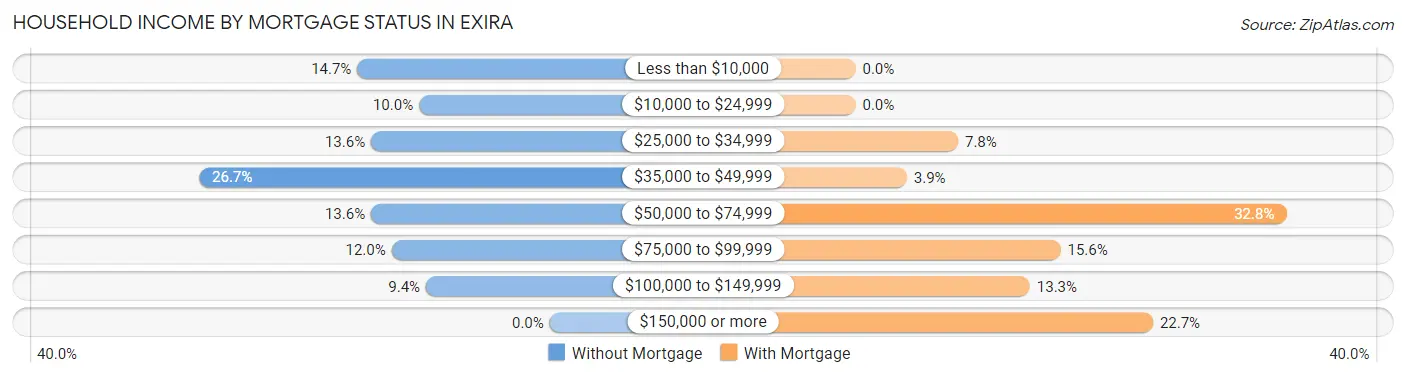
| Household Income | Without Mortgage | With Mortgage |
| Less than $10,000 | 28 (14.7%) | 0 (0.0%) |
| $10,000 to $24,999 | 19 (10.0%) | 0 (0.0%) |
| $25,000 to $34,999 | 26 (13.6%) | 10 (7.8%) |
| $35,000 to $49,999 | 51 (26.7%) | 5 (3.9%) |
| $50,000 to $74,999 | 26 (13.6%) | 42 (32.8%) |
| $75,000 to $99,999 | 23 (12.0%) | 20 (15.6%) |
| $100,000 to $149,999 | 18 (9.4%) | 17 (13.3%) |
| $150,000 or more | 0 (0.0%) | 29 (22.7%) |
| Total | 191 (100.0%) | 128 (100.0%) |
Property Value to Household Income Ratio in Exira
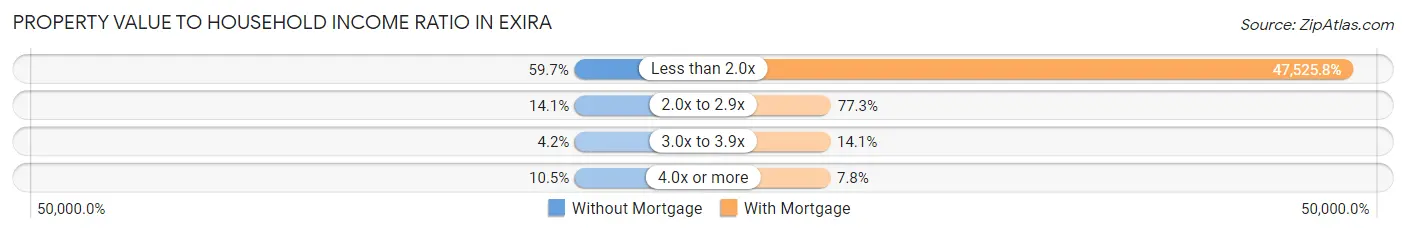
| Value-to-Income Ratio | Without Mortgage | With Mortgage |
| Less than 2.0x | 114 (59.7%) | 60,833 (47,525.8%) |
| 2.0x to 2.9x | 27 (14.1%) | 99 (77.3%) |
| 3.0x to 3.9x | 8 (4.2%) | 18 (14.1%) |
| 4.0x or more | 20 (10.5%) | 10 (7.8%) |
| Total | 191 (100.0%) | 128 (100.0%) |
Real Estate Taxes by Mortgage Status in Exira
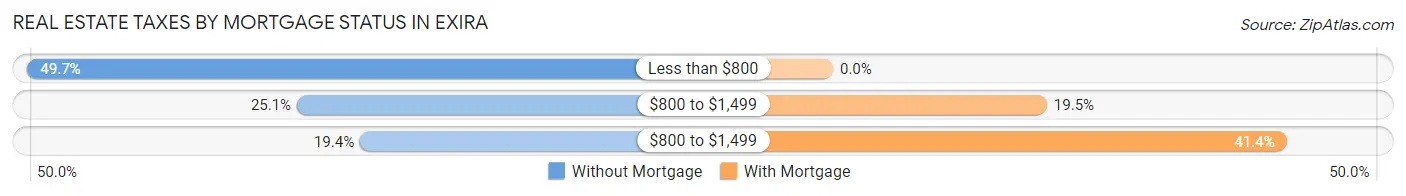
| Property Taxes | Without Mortgage | With Mortgage |
| Less than $800 | 95 (49.7%) | 0 (0.0%) |
| $800 to $1,499 | 48 (25.1%) | 25 (19.5%) |
| $800 to $1,499 | 37 (19.4%) | 53 (41.4%) |
| Total | 191 (100.0%) | 128 (100.0%) |
Health & Disability in Exira
Health Insurance Coverage by Age in Exira
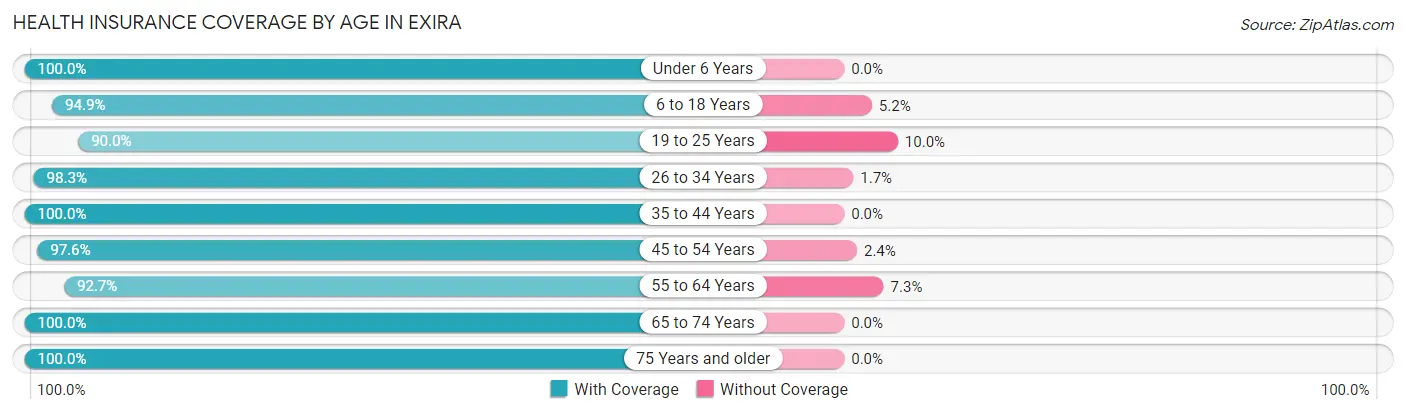
| Age Bracket | With Coverage | Without Coverage |
| Under 6 Years | 72 (100.0%) | 0 (0.0%) |
| 6 to 18 Years | 92 (94.9%) | 5 (5.1%) |
| 19 to 25 Years | 54 (90.0%) | 6 (10.0%) |
| 26 to 34 Years | 58 (98.3%) | 1 (1.7%) |
| 35 to 44 Years | 55 (100.0%) | 0 (0.0%) |
| 45 to 54 Years | 82 (97.6%) | 2 (2.4%) |
| 55 to 64 Years | 164 (92.7%) | 13 (7.3%) |
| 65 to 74 Years | 126 (100.0%) | 0 (0.0%) |
| 75 Years and older | 63 (100.0%) | 0 (0.0%) |
| Total | 766 (96.6%) | 27 (3.4%) |
Health Insurance Coverage by Citizenship Status in Exira
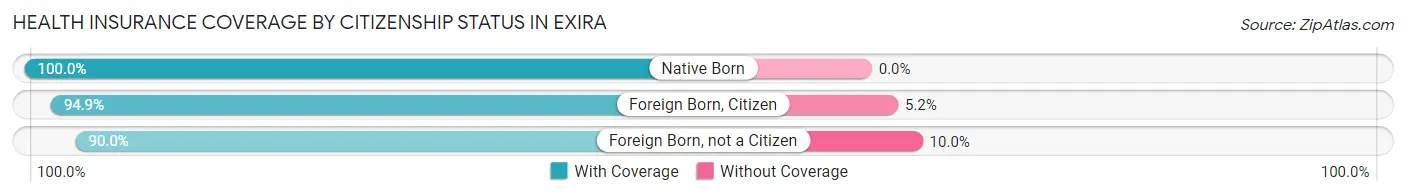
| Citizenship Status | With Coverage | Without Coverage |
| Native Born | 72 (100.0%) | 0 (0.0%) |
| Foreign Born, Citizen | 92 (94.9%) | 5 (5.1%) |
| Foreign Born, not a Citizen | 54 (90.0%) | 6 (10.0%) |
Health Insurance Coverage by Household Income in Exira
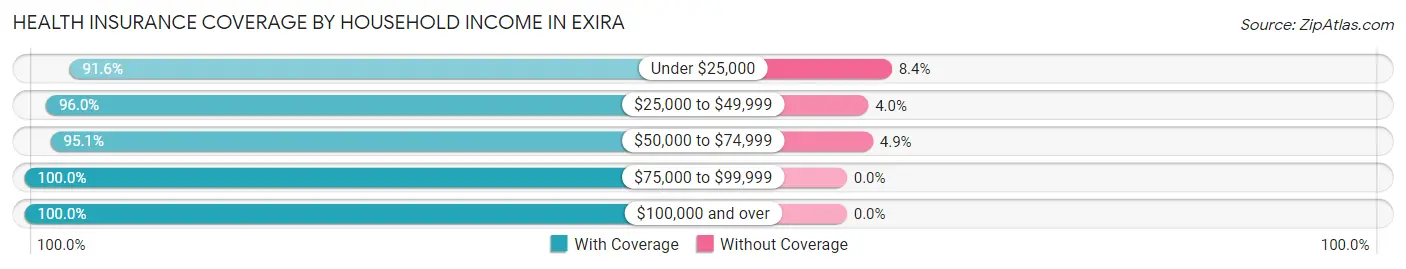
| Household Income | With Coverage | Without Coverage |
| Under $25,000 | 87 (91.6%) | 8 (8.4%) |
| $25,000 to $49,999 | 263 (96.0%) | 11 (4.0%) |
| $50,000 to $74,999 | 156 (95.1%) | 8 (4.9%) |
| $75,000 to $99,999 | 134 (100.0%) | 0 (0.0%) |
| $100,000 and over | 126 (100.0%) | 0 (0.0%) |
Public vs Private Health Insurance Coverage by Age in Exira
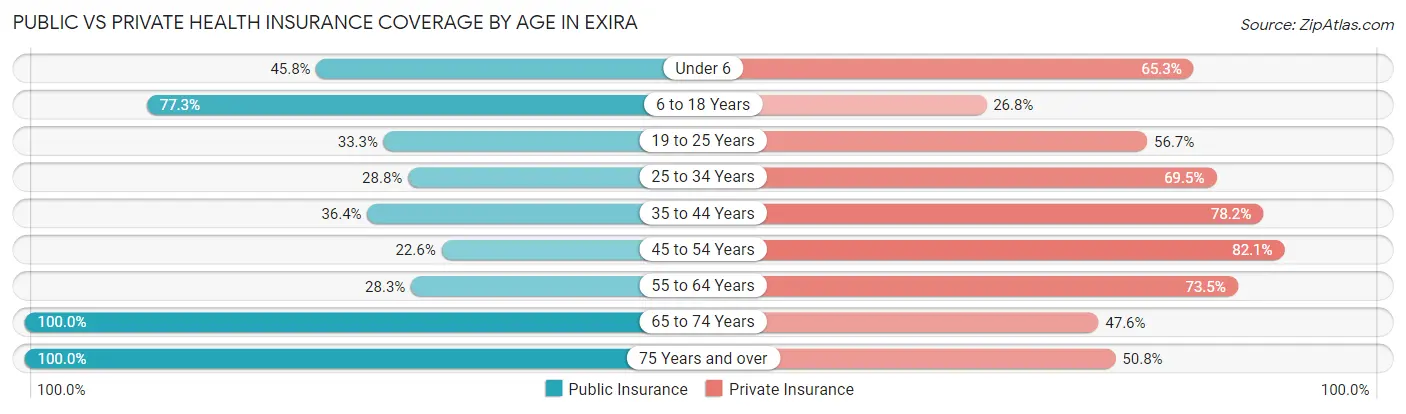
| Age Bracket | Public Insurance | Private Insurance |
| Under 6 | 33 (45.8%) | 47 (65.3%) |
| 6 to 18 Years | 75 (77.3%) | 26 (26.8%) |
| 19 to 25 Years | 20 (33.3%) | 34 (56.7%) |
| 25 to 34 Years | 17 (28.8%) | 41 (69.5%) |
| 35 to 44 Years | 20 (36.4%) | 43 (78.2%) |
| 45 to 54 Years | 19 (22.6%) | 69 (82.1%) |
| 55 to 64 Years | 50 (28.2%) | 130 (73.5%) |
| 65 to 74 Years | 126 (100.0%) | 60 (47.6%) |
| 75 Years and over | 63 (100.0%) | 32 (50.8%) |
| Total | 423 (53.3%) | 482 (60.8%) |
Disability Status by Sex by Age in Exira
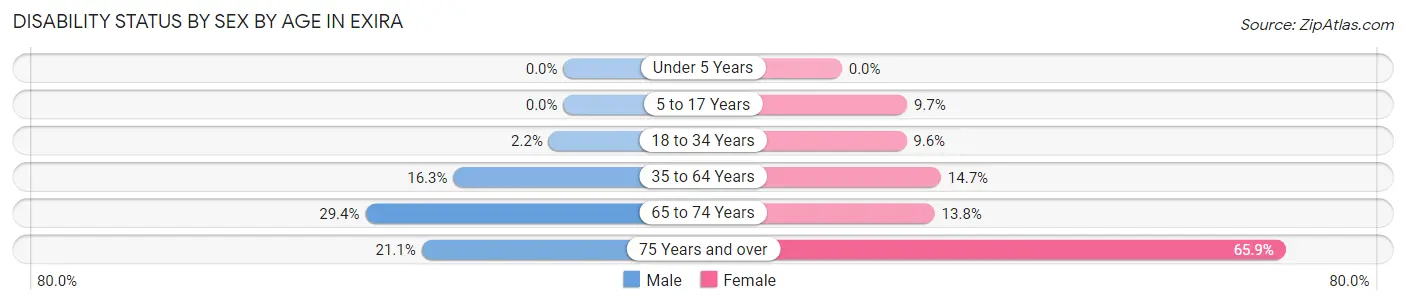
| Age Bracket | Male | Female |
| Under 5 Years | 0 (0.0%) | 0 (0.0%) |
| 5 to 17 Years | 0 (0.0%) | 6 (9.7%) |
| 18 to 34 Years | 1 (2.2%) | 7 (9.6%) |
| 35 to 64 Years | 25 (16.3%) | 24 (14.7%) |
| 65 to 74 Years | 20 (29.4%) | 8 (13.8%) |
| 75 Years and over | 4 (21.0%) | 29 (65.9%) |
Disability Class by Sex by Age in Exira
Disability Class: Hearing Difficulty
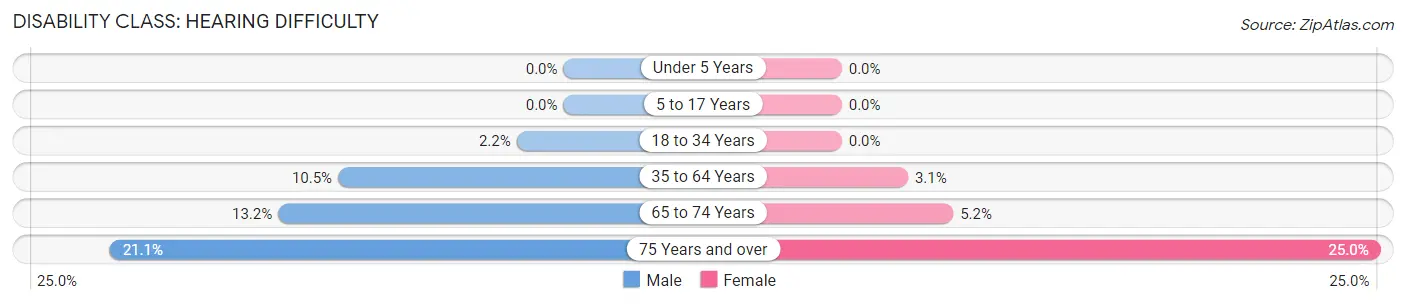
| Age Bracket | Male | Female |
| Under 5 Years | 0 (0.0%) | 0 (0.0%) |
| 5 to 17 Years | 0 (0.0%) | 0 (0.0%) |
| 18 to 34 Years | 1 (2.2%) | 0 (0.0%) |
| 35 to 64 Years | 16 (10.5%) | 5 (3.1%) |
| 65 to 74 Years | 9 (13.2%) | 3 (5.2%) |
| 75 Years and over | 4 (21.0%) | 11 (25.0%) |
Disability Class: Vision Difficulty
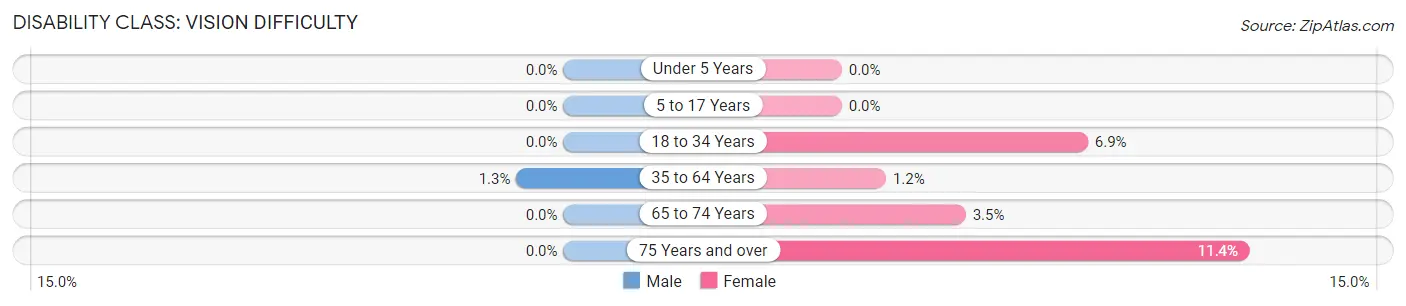
| Age Bracket | Male | Female |
| Under 5 Years | 0 (0.0%) | 0 (0.0%) |
| 5 to 17 Years | 0 (0.0%) | 0 (0.0%) |
| 18 to 34 Years | 0 (0.0%) | 5 (6.9%) |
| 35 to 64 Years | 2 (1.3%) | 2 (1.2%) |
| 65 to 74 Years | 0 (0.0%) | 2 (3.5%) |
| 75 Years and over | 0 (0.0%) | 5 (11.4%) |
Disability Class: Cognitive Difficulty
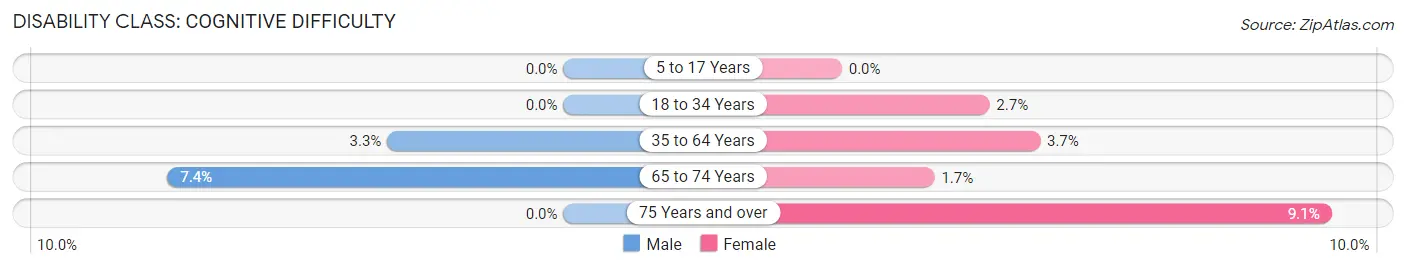
| Age Bracket | Male | Female |
| 5 to 17 Years | 0 (0.0%) | 0 (0.0%) |
| 18 to 34 Years | 0 (0.0%) | 2 (2.7%) |
| 35 to 64 Years | 5 (3.3%) | 6 (3.7%) |
| 65 to 74 Years | 5 (7.3%) | 1 (1.7%) |
| 75 Years and over | 0 (0.0%) | 4 (9.1%) |
Disability Class: Ambulatory Difficulty
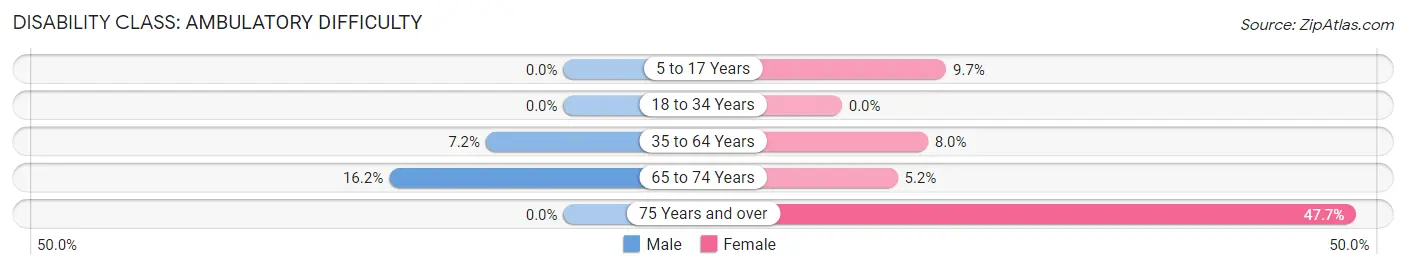
| Age Bracket | Male | Female |
| 5 to 17 Years | 0 (0.0%) | 6 (9.7%) |
| 18 to 34 Years | 0 (0.0%) | 0 (0.0%) |
| 35 to 64 Years | 11 (7.2%) | 13 (8.0%) |
| 65 to 74 Years | 11 (16.2%) | 3 (5.2%) |
| 75 Years and over | 0 (0.0%) | 21 (47.7%) |
Disability Class: Self-Care Difficulty
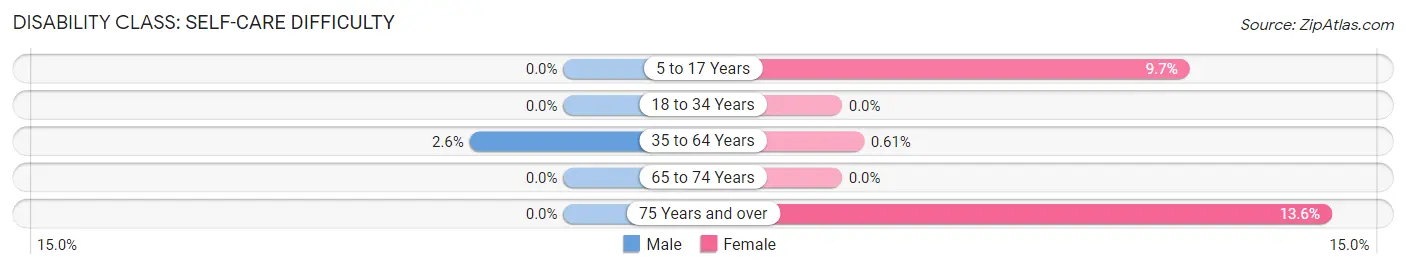
| Age Bracket | Male | Female |
| 5 to 17 Years | 0 (0.0%) | 6 (9.7%) |
| 18 to 34 Years | 0 (0.0%) | 0 (0.0%) |
| 35 to 64 Years | 4 (2.6%) | 1 (0.6%) |
| 65 to 74 Years | 0 (0.0%) | 0 (0.0%) |
| 75 Years and over | 0 (0.0%) | 6 (13.6%) |
Technology Access in Exira
Computing Device Access in Exira
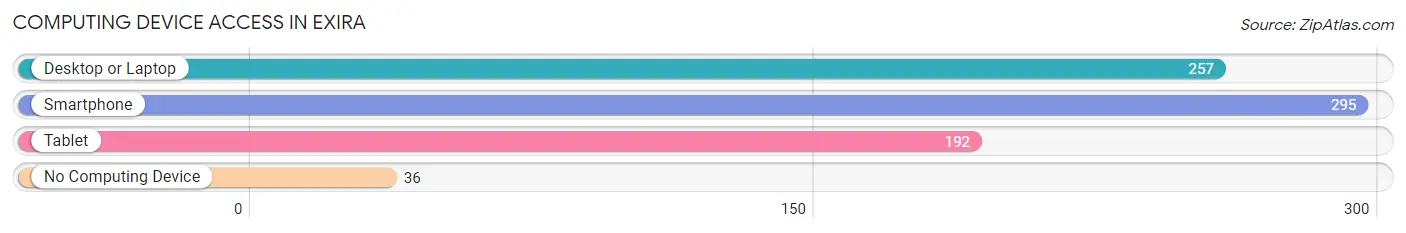
| Device Type | # Households | % Households |
| Desktop or Laptop | 257 | 66.9% |
| Smartphone | 295 | 76.8% |
| Tablet | 192 | 50.0% |
| No Computing Device | 36 | 9.4% |
| Total | 384 | 100.0% |
Internet Access in Exira
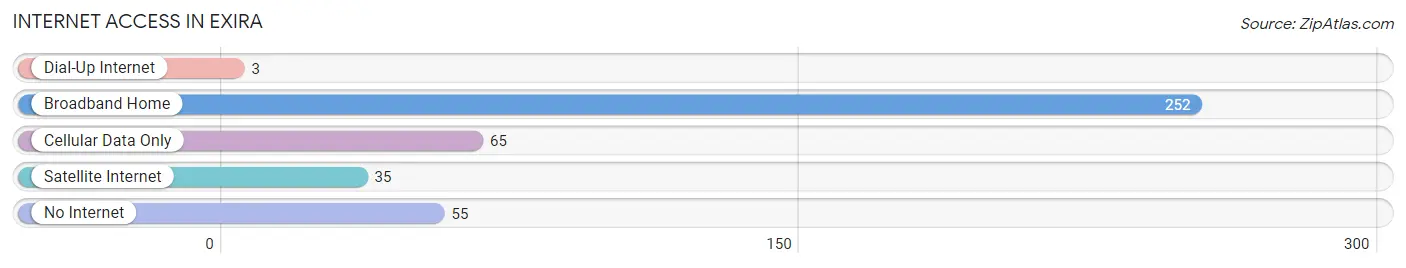
| Internet Type | # Households | % Households |
| Dial-Up Internet | 3 | 0.8% |
| Broadband Home | 252 | 65.6% |
| Cellular Data Only | 65 | 16.9% |
| Satellite Internet | 35 | 9.1% |
| No Internet | 55 | 14.3% |
| Total | 384 | 100.0% |
Exira Summary
Exira, Iowa is a small town located in Audubon County in the western part of the state. It is situated along the Middle Raccoon River, about 25 miles northwest of the state capital of Des Moines. The town has a population of approximately 1,000 people and is part of the Exira-Elk Horn-Kimballton Community School District.
History
Exira was founded in 1856 by a group of settlers from Denmark. The town was named after the Danish city of Exira, which is located in the Jutland region of the country. The settlers were attracted to the area due to its fertile soil and abundant natural resources. The first settlers built a log cabin and a sawmill, and the town quickly grew. By the late 1800s, Exira had become a thriving agricultural community, with a population of over 1,000 people.
In the early 1900s, the town experienced a period of growth and prosperity. The railroad arrived in 1906, bringing with it new businesses and industries. The town also had a thriving brick-making industry, which provided employment for many of the town’s residents.
In the 1950s, the town began to decline as many of its residents moved away in search of better opportunities. The population dropped to just over 500 by the 1970s. However, in recent years, the town has experienced a resurgence, with new businesses and industries moving into the area.
Geography
Exira is located in western Iowa, about 25 miles northwest of Des Moines. The town is situated along the Middle Raccoon River, which flows through the area. The town is surrounded by rolling hills and farmland, and is located in the Loess Hills region of the state.
The climate in Exira is typical of the Midwest, with hot summers and cold winters. The average temperature in the summer is around 75 degrees Fahrenheit, while the average temperature in the winter is around 25 degrees Fahrenheit.
Economy
Exira’s economy is largely based on agriculture. The town is home to several farms, which produce a variety of crops, including corn, soybeans, and hay. The town also has a thriving livestock industry, with many of the local farms raising cattle, hogs, and sheep.
In addition to agriculture, Exira also has a number of small businesses, including restaurants, retail stores, and service providers. The town also has a few manufacturing companies, which produce a variety of products, including furniture, clothing, and automotive parts.
Demographics
As of the 2010 census, Exira had a population of 1,000 people. The racial makeup of the town was 97.2% White, 0.7% African American, 0.2% Native American, 0.2% Asian, 0.2% from other races, and 1.7% from two or more races. Hispanic or Latino of any race were 1.2% of the population.
The median household income in Exira was $41,250, and the median family income was $48,750. The per capita income for the town was $19,945. About 11.2% of families and 14.2% of the population were below the poverty line, including 18.2% of those under age 18 and 8.2% of those age 65 or over.
Common Questions
What is Per Capita Income in Exira?
Per Capita income in Exira is $29,125.
What is the Median Family Income in Exira?
Median Family Income in Exira is $51,875.
What is the Median Household income in Exira?
Median Household Income in Exira is $43,229.
What is Income or Wage Gap in Exira?
Income or Wage Gap in Exira is 39.7%.
Women in Exira earn 60.3 cents for every dollar earned by a man.
What is Inequality or Gini Index in Exira?
Inequality or Gini Index in Exira is 0.44.
What is the Total Population of Exira?
Total Population of Exira is 847.
What is the Total Male Population of Exira?
Total Male Population of Exira is 384.
What is the Total Female Population of Exira?
Total Female Population of Exira is 463.
What is the Ratio of Males per 100 Females in Exira?
There are 82.94 Males per 100 Females in Exira.
What is the Ratio of Females per 100 Males in Exira?
There are 120.57 Females per 100 Males in Exira.
What is the Median Population Age in Exira?
Median Population Age in Exira is 54.7 Years.
What is the Average Family Size in Exira
Average Family Size in Exira is 2.8 People.
What is the Average Household Size in Exira
Average Household Size in Exira is 2.1 People.
How Large is the Labor Force in Exira?
There are 388 People in the Labor Forcein in Exira.
What is the Percentage of People in the Labor Force in Exira?
56.2% of People are in the Labor Force in Exira.
What is the Unemployment Rate in Exira?
Unemployment Rate in Exira is 2.1%.