Houck, AZ Map & Demographics
Houck Map
Houck Overview
$14,929
PER CAPITA INCOME
$32,105
AVG FAMILY INCOME
$25,156
AVG HOUSEHOLD INCOME
8.9%
WAGE / INCOME GAP [ % ]
91.1¢/ $1
WAGE / INCOME GAP [ $ ]
$12,479
FAMILY INCOME DEFICIT
0.48
INEQUALITY / GINI INDEX
777
TOTAL POPULATION
358
MALE POPULATION
419
FEMALE POPULATION
85.44
MALES / 100 FEMALES
117.04
FEMALES / 100 MALES
36.9
MEDIAN AGE
4.2
AVG FAMILY SIZE
2.9
AVG HOUSEHOLD SIZE
252
LABOR FORCE [ PEOPLE ]
41.7%
PERCENT IN LABOR FORCE
4.0%
UNEMPLOYMENT RATE
Houck Zip Codes
Houck Area Codes
Income in Houck
Income Overview in Houck
Per Capita Income in Houck is $14,929, while median incomes of families and households are $32,105 and $25,156 respectively.
| Characteristic | Number | Measure |
| Per Capita Income | 777 | $14,929 |
| Median Family Income | 150 | $32,105 |
| Mean Family Income | 150 | $47,813 |
| Median Household Income | 264 | $25,156 |
| Mean Household Income | 264 | $38,888 |
| Income Deficit | 150 | $12,479 |
| Wage / Income Gap (%) | 777 | 8.92% |
| Wage / Income Gap ($) | 777 | 91.08¢ per $1 |
| Gini / Inequality Index | 777 | 0.48 |
Earnings by Sex in Houck
Average Earnings in Houck are $31,810, $31,023 for men and $34,063 for women, a difference of 8.9%.
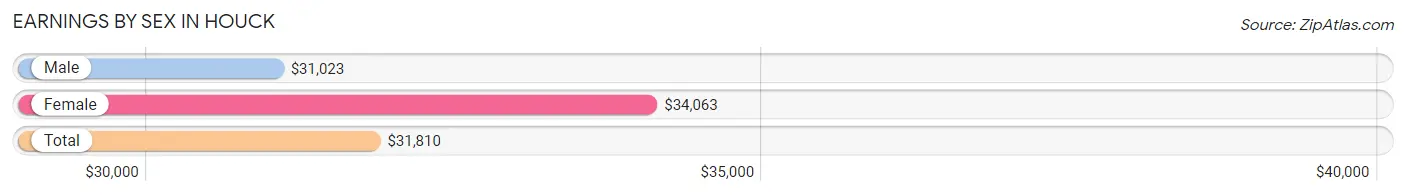
| Sex | Number | Average Earnings |
| Male | 128 (48.5%) | $31,023 |
| Female | 136 (51.5%) | $34,063 |
| Total | 264 (100.0%) | $31,810 |
Earnings by Sex by Income Bracket in Houck
The most common earnings brackets in Houck are $30,000 to $34,999 for men (22 | 17.2%) and $35,000 to $39,999 for women (29 | 21.3%).
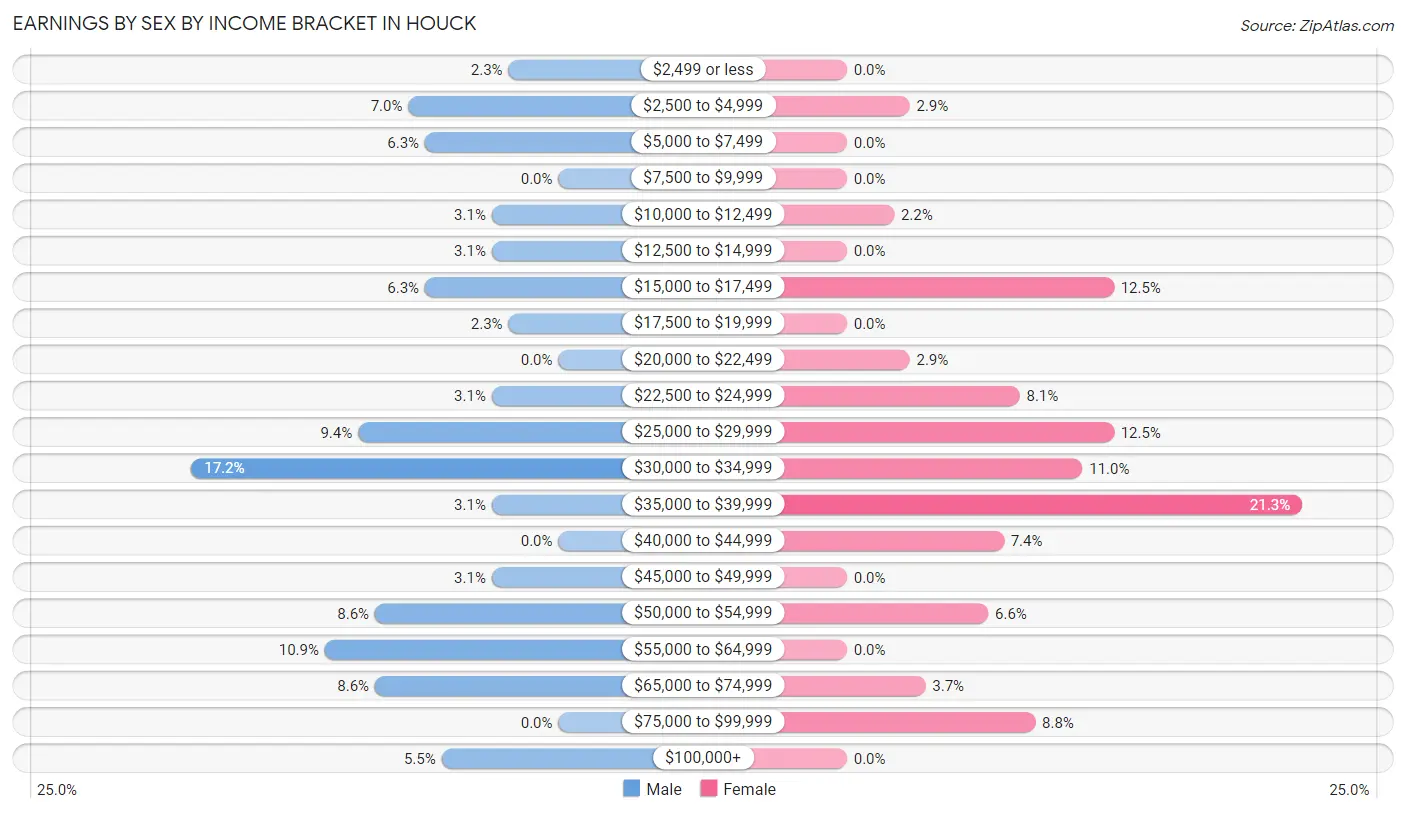
| Income | Male | Female |
| $2,499 or less | 3 (2.3%) | 0 (0.0%) |
| $2,500 to $4,999 | 9 (7.0%) | 4 (2.9%) |
| $5,000 to $7,499 | 8 (6.2%) | 0 (0.0%) |
| $7,500 to $9,999 | 0 (0.0%) | 0 (0.0%) |
| $10,000 to $12,499 | 4 (3.1%) | 3 (2.2%) |
| $12,500 to $14,999 | 4 (3.1%) | 0 (0.0%) |
| $15,000 to $17,499 | 8 (6.2%) | 17 (12.5%) |
| $17,500 to $19,999 | 3 (2.3%) | 0 (0.0%) |
| $20,000 to $22,499 | 0 (0.0%) | 4 (2.9%) |
| $22,500 to $24,999 | 4 (3.1%) | 11 (8.1%) |
| $25,000 to $29,999 | 12 (9.4%) | 17 (12.5%) |
| $30,000 to $34,999 | 22 (17.2%) | 15 (11.0%) |
| $35,000 to $39,999 | 4 (3.1%) | 29 (21.3%) |
| $40,000 to $44,999 | 0 (0.0%) | 10 (7.3%) |
| $45,000 to $49,999 | 4 (3.1%) | 0 (0.0%) |
| $50,000 to $54,999 | 11 (8.6%) | 9 (6.6%) |
| $55,000 to $64,999 | 14 (10.9%) | 0 (0.0%) |
| $65,000 to $74,999 | 11 (8.6%) | 5 (3.7%) |
| $75,000 to $99,999 | 0 (0.0%) | 12 (8.8%) |
| $100,000+ | 7 (5.5%) | 0 (0.0%) |
| Total | 128 (100.0%) | 136 (100.0%) |
Earnings by Sex by Educational Attainment in Houck
Average earnings in Houck are $30,966 for men and $37,650 for women, a difference of 17.7%. Men with an educational attainment of college or associate's degree enjoy the highest average annual earnings of $49,688, while those with high school diploma education earn the least with $30,057. Women with an educational attainment of college or associate's degree earn the most with the average annual earnings of $38,542, while those with less than high school education have the smallest earnings of $35,938.
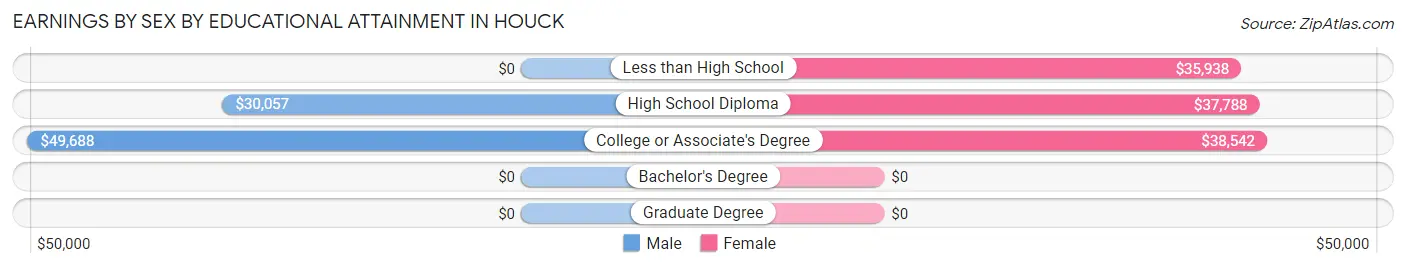
| Educational Attainment | Male Income | Female Income |
| Less than High School | - | - |
| High School Diploma | $30,057 | $37,788 |
| College or Associate's Degree | $49,688 | $38,542 |
| Bachelor's Degree | - | - |
| Graduate Degree | - | - |
| Total | $30,966 | $37,650 |
Family Income in Houck
Family Income Brackets in Houck
According to the Houck family income data, there are 31 families falling into the $25,000 to $34,999 income range, which is the most common income bracket and makes up 20.7% of all families.
| Income Bracket | # Families | % Families |
| Less than $10,000 | 21 | 14.0% |
| $10,000 to $14,999 | 9 | 6.0% |
| $15,000 to $24,999 | 25 | 16.7% |
| $25,000 to $34,999 | 31 | 20.7% |
| $35,000 to $49,999 | 4 | 2.7% |
| $50,000 to $74,999 | 28 | 18.7% |
| $75,000 to $99,999 | 10 | 6.7% |
| $100,000 to $149,999 | 22 | 14.7% |
| $150,000 to $199,999 | 0 | 0.0% |
| $200,000+ | 0 | 0.0% |
Family Income by Famaliy Size in Houck
7+ person families (20 | 13.3%) account for the highest median family income in Houck with $117,917 per family, while 7+ person families (20 | 13.3%) have the highest median income of $16,845 per family member.
| Income Bracket | # Families | Median Income |
| 2-Person Families | 75 (50.0%) | $27,813 |
| 3-Person Families | 21 (14.0%) | $0 |
| 4-Person Families | 16 (10.7%) | $0 |
| 5-Person Families | 18 (12.0%) | $34,375 |
| 6-Person Families | 0 (0.0%) | $0 |
| 7+ Person Families | 20 (13.3%) | $117,917 |
| Total | 150 (100.0%) | $32,105 |
Family Income by Number of Earners in Houck
| Number of Earners | # Families | Median Income |
| No Earners | 27 (18.0%) | $11,042 |
| 1 Earner | 81 (54.0%) | $31,118 |
| 2 Earners | 30 (20.0%) | $71,250 |
| 3+ Earners | 12 (8.0%) | $0 |
| Total | 150 (100.0%) | $32,105 |
Household Income in Houck
Household Income Brackets in Houck
With 64 households falling in the category, the $15,000 to $24,999 income range is the most frequent in Houck, accounting for 24.2% of all households.
| Income Bracket | # Households | % Households |
| Less than $10,000 | 54 | 20.5% |
| $10,000 to $14,999 | 13 | 4.9% |
| $15,000 to $24,999 | 64 | 24.2% |
| $25,000 to $34,999 | 32 | 12.1% |
| $35,000 to $49,999 | 16 | 6.1% |
| $50,000 to $74,999 | 53 | 20.1% |
| $75,000 to $99,999 | 10 | 3.8% |
| $100,000 to $149,999 | 22 | 8.3% |
| $150,000 to $199,999 | 0 | 0.0% |
| $200,000+ | 0 | 0.0% |
Household Income by Householder Age in Houck
The median household income in Houck is $25,156, with the highest median household income of $34,531 found in the 25 to 44 years age bracket for the primary householder. A total of 51 households (19.3%) fall into this category. Meanwhile, the 15 to 24 years age bracket for the primary householder has the lowest median household income of $0, with 7 households (2.6%) in this group.
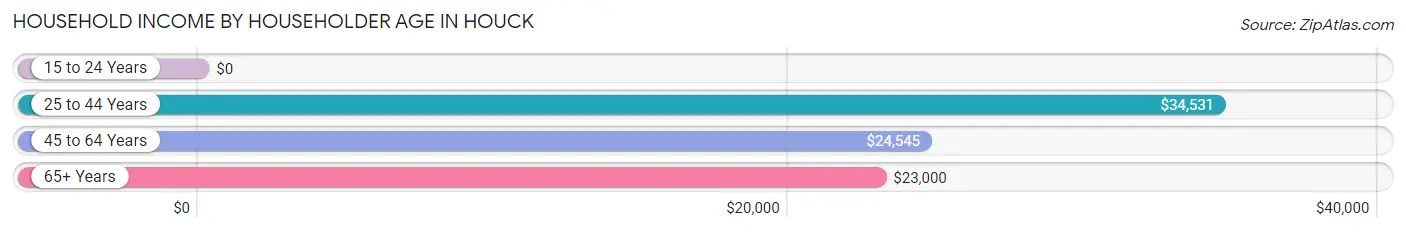
| Income Bracket | # Households | Median Income |
| 15 to 24 Years | 7 (2.6%) | $0 |
| 25 to 44 Years | 51 (19.3%) | $34,531 |
| 45 to 64 Years | 142 (53.8%) | $24,545 |
| 65+ Years | 64 (24.2%) | $23,000 |
| Total | 264 (100.0%) | $25,156 |
Poverty in Houck
Income Below Poverty by Sex and Age in Houck
With 35.7% poverty level for males and 34.8% for females among the residents of Houck, 6 to 11 year old males and 6 to 11 year old females are the most vulnerable to poverty, with 36 males (85.7%) and 18 females (75.0%) in their respective age groups living below the poverty level.
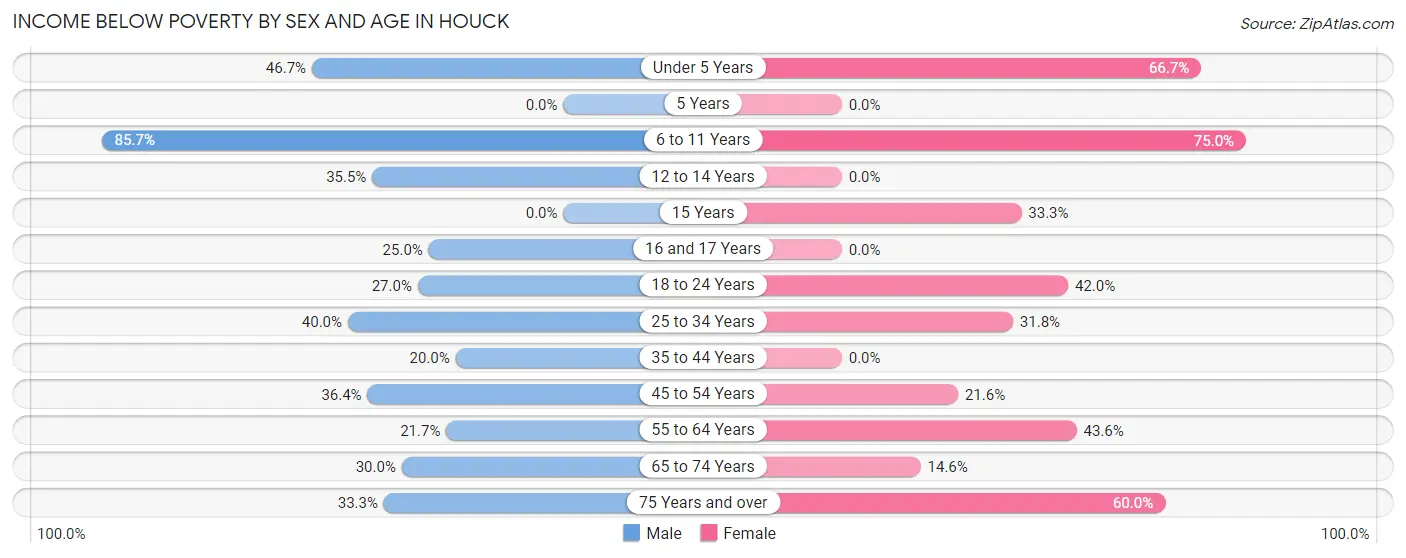
| Age Bracket | Male | Female |
| Under 5 Years | 7 (46.7%) | 20 (66.7%) |
| 5 Years | 0 (0.0%) | 0 (0.0%) |
| 6 to 11 Years | 36 (85.7%) | 18 (75.0%) |
| 12 to 14 Years | 11 (35.5%) | 0 (0.0%) |
| 15 Years | 0 (0.0%) | 3 (33.3%) |
| 16 and 17 Years | 3 (25.0%) | 0 (0.0%) |
| 18 to 24 Years | 10 (27.0%) | 21 (42.0%) |
| 25 to 34 Years | 6 (40.0%) | 27 (31.8%) |
| 35 to 44 Years | 10 (20.0%) | 0 (0.0%) |
| 45 to 54 Years | 20 (36.4%) | 11 (21.6%) |
| 55 to 64 Years | 15 (21.7%) | 34 (43.6%) |
| 65 to 74 Years | 6 (30.0%) | 6 (14.6%) |
| 75 Years and over | 4 (33.3%) | 6 (60.0%) |
| Total | 128 (35.7%) | 146 (34.8%) |
Income Above Poverty by Sex and Age in Houck
According to the poverty statistics in Houck, males aged 35 to 44 years and females aged 5 years are the age groups that are most secure financially, with 80.0% of males and 100.0% of females in these age groups living above the poverty line.
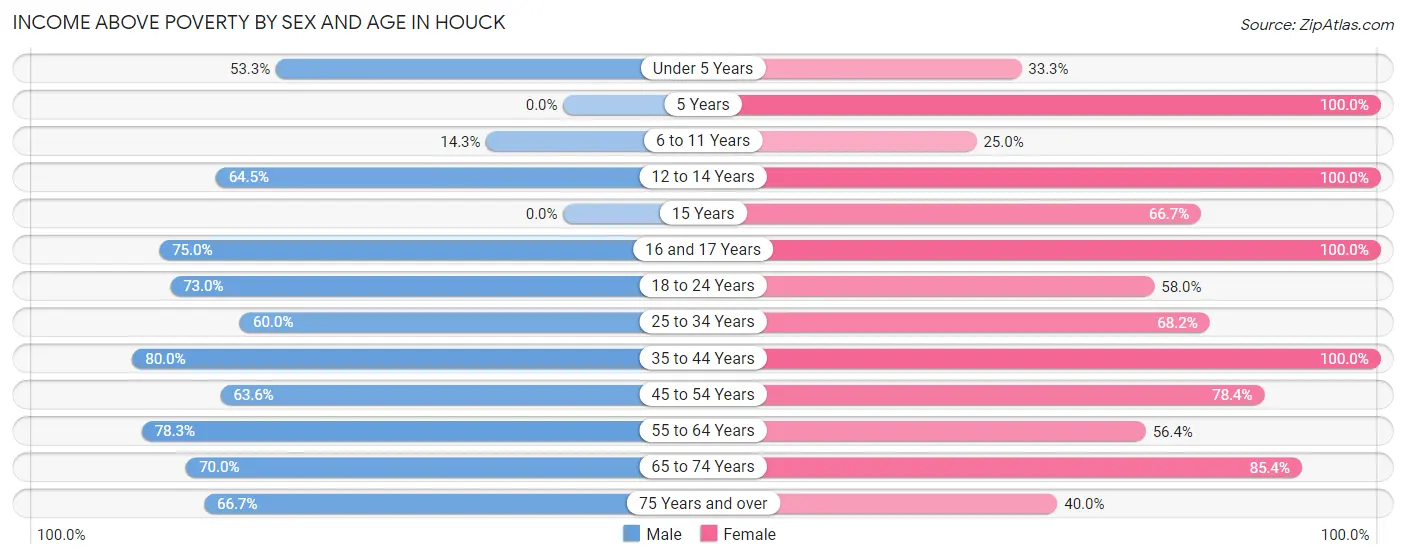
| Age Bracket | Male | Female |
| Under 5 Years | 8 (53.3%) | 10 (33.3%) |
| 5 Years | 0 (0.0%) | 6 (100.0%) |
| 6 to 11 Years | 6 (14.3%) | 6 (25.0%) |
| 12 to 14 Years | 20 (64.5%) | 16 (100.0%) |
| 15 Years | 0 (0.0%) | 6 (66.7%) |
| 16 and 17 Years | 9 (75.0%) | 5 (100.0%) |
| 18 to 24 Years | 27 (73.0%) | 29 (58.0%) |
| 25 to 34 Years | 9 (60.0%) | 58 (68.2%) |
| 35 to 44 Years | 40 (80.0%) | 14 (100.0%) |
| 45 to 54 Years | 35 (63.6%) | 40 (78.4%) |
| 55 to 64 Years | 54 (78.3%) | 44 (56.4%) |
| 65 to 74 Years | 14 (70.0%) | 35 (85.4%) |
| 75 Years and over | 8 (66.7%) | 4 (40.0%) |
| Total | 230 (64.2%) | 273 (65.2%) |
Income Below Poverty Among Married-Couple Families in Houck
The poverty statistics for married-couple families in Houck show that 18.8% or 15 of the total 80 families live below the poverty line. Families with 3 or 4 children have the highest poverty rate of 72.7%, comprising of 8 families. On the other hand, families with 1 or 2 children have the lowest poverty rate of 0.0%, which includes 0 families.
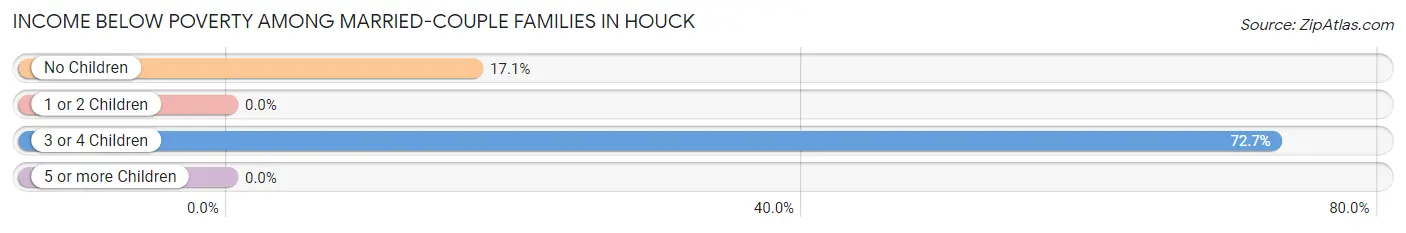
| Children | Above Poverty | Below Poverty |
| No Children | 34 (82.9%) | 7 (17.1%) |
| 1 or 2 Children | 24 (100.0%) | 0 (0.0%) |
| 3 or 4 Children | 3 (27.3%) | 8 (72.7%) |
| 5 or more Children | 4 (100.0%) | 0 (0.0%) |
| Total | 65 (81.2%) | 15 (18.8%) |
Income Below Poverty Among Single-Parent Households in Houck
According to the poverty data in Houck, 40.0% or 10 single-father households and 48.9% or 22 single-mother households are living below the poverty line. Among single-father households, those with 1 or 2 children have the highest poverty rate, with 3 households (100.0%) experiencing poverty. Likewise, among single-mother households, those with 3 or 4 children have the highest poverty rate, with 4 households (100.0%) falling below the poverty line.
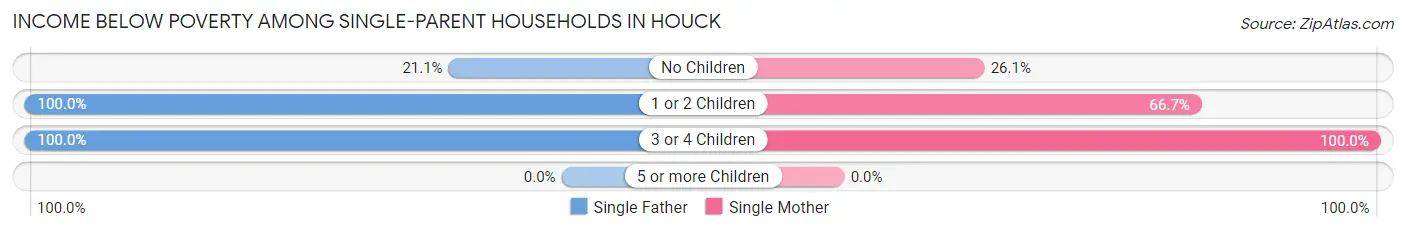
| Children | Single Father | Single Mother |
| No Children | 4 (21.0%) | 6 (26.1%) |
| 1 or 2 Children | 3 (100.0%) | 12 (66.7%) |
| 3 or 4 Children | 3 (100.0%) | 4 (100.0%) |
| 5 or more Children | 0 (0.0%) | 0 (0.0%) |
| Total | 10 (40.0%) | 22 (48.9%) |
Income Below Poverty Among Married-Couple vs Single-Parent Households in Houck
The poverty data for Houck shows that 15 of the married-couple family households (18.8%) and 32 of the single-parent households (45.7%) are living below the poverty level. Within the married-couple family households, those with 3 or 4 children have the highest poverty rate, with 8 households (72.7%) falling below the poverty line. Among the single-parent households, those with 3 or 4 children have the highest poverty rate, with 7 household (100.0%) living below poverty.
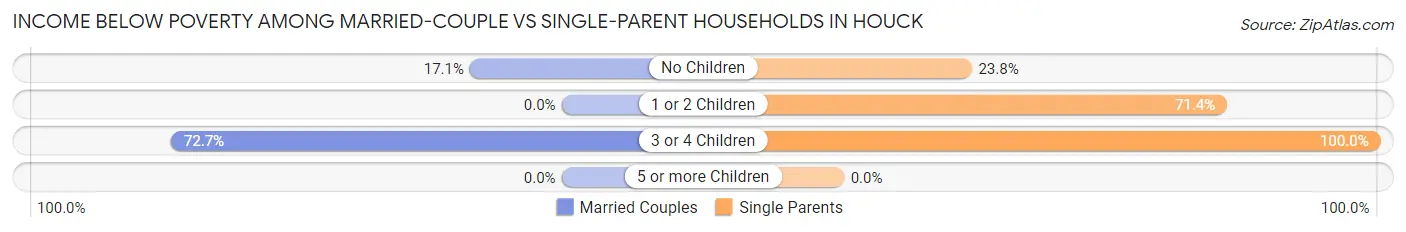
| Children | Married-Couple Families | Single-Parent Households |
| No Children | 7 (17.1%) | 10 (23.8%) |
| 1 or 2 Children | 0 (0.0%) | 15 (71.4%) |
| 3 or 4 Children | 8 (72.7%) | 7 (100.0%) |
| 5 or more Children | 0 (0.0%) | 0 (0.0%) |
| Total | 15 (18.8%) | 32 (45.7%) |
Race in Houck
The most populous races in Houck are Native / Alaskan (710 | 91.4%), Two or more Races (41 | 5.3%), and Hispanic or Latino (26 | 3.4%).
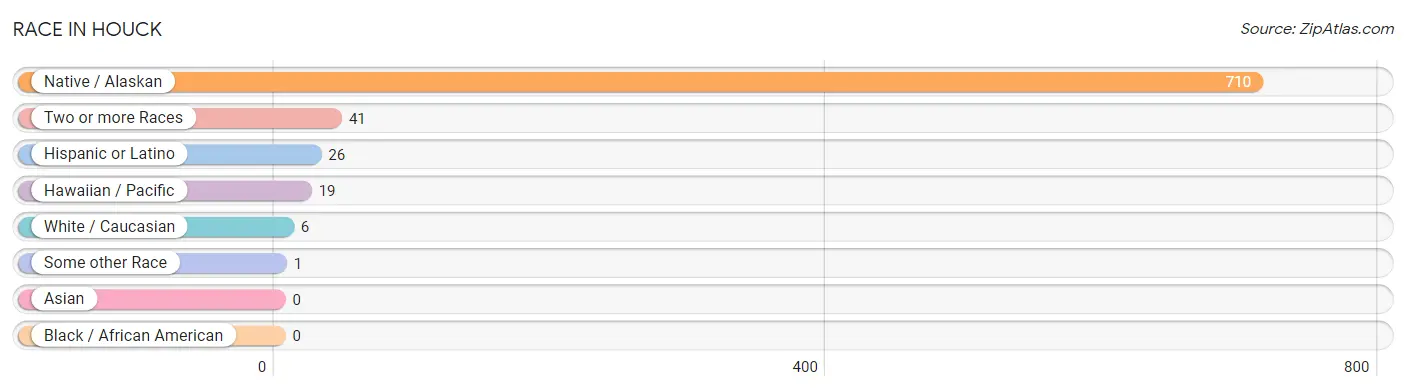
| Race | # Population | % Population |
| Asian | 0 | 0.0% |
| Black / African American | 0 | 0.0% |
| Hawaiian / Pacific | 19 | 2.5% |
| Hispanic or Latino | 26 | 3.4% |
| Native / Alaskan | 710 | 91.4% |
| White / Caucasian | 6 | 0.8% |
| Two or more Races | 41 | 5.3% |
| Some other Race | 1 | 0.1% |
| Total | 777 | 100.0% |
Ancestry in Houck
The most populous ancestries reported in Houck are Navajo (744 | 95.8%), Mexican (19 | 2.5%), Irish (8 | 1.0%), Puerto Rican (7 | 0.9%), and Tohono O'Odham (7 | 0.9%), together accounting for 101.0% of all Houck residents.
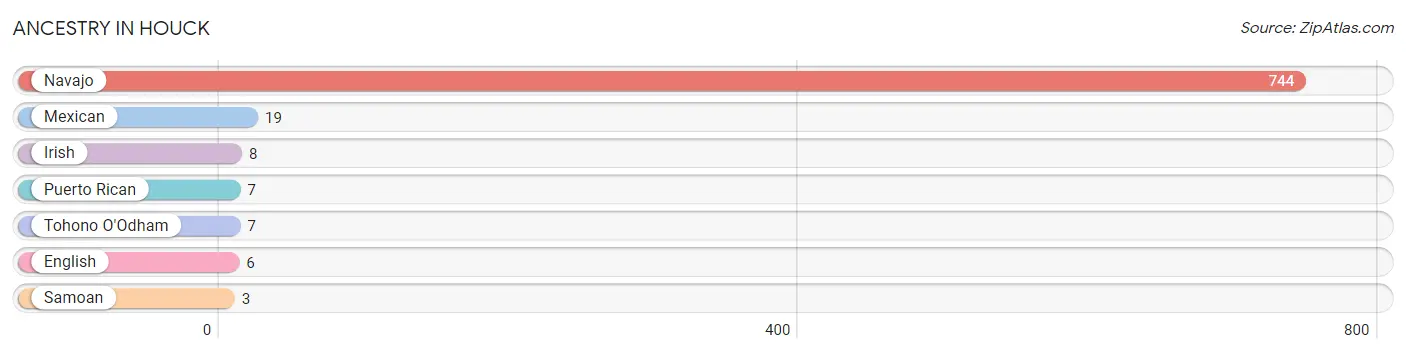
| Ancestry | # Population | % Population |
| English | 6 | 0.8% |
| Irish | 8 | 1.0% |
| Mexican | 19 | 2.5% |
| Navajo | 744 | 95.8% |
| Puerto Rican | 7 | 0.9% |
| Samoan | 3 | 0.4% |
| Tohono O'Odham | 7 | 0.9% | View All 7 Rows |
Immigrants in Houck
The most numerous immigrant groups reported in Houck came from Central America (5 | 0.6%), Latin America (5 | 0.6%), and Mexico (5 | 0.6%), together accounting for 1.9% of all Houck residents.
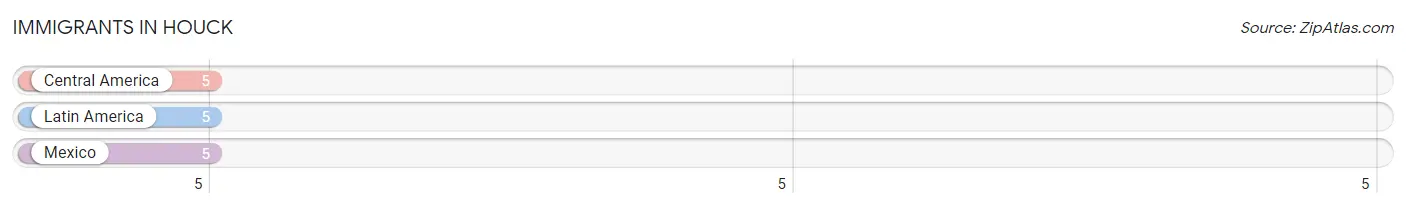
| Immigration Origin | # Population | % Population |
| Central America | 5 | 0.6% |
| Latin America | 5 | 0.6% |
| Mexico | 5 | 0.6% | View All 3 Rows |
Sex and Age in Houck
Sex and Age in Houck
The most populous age groups in Houck are 10 to 14 Years (47 | 13.1%) for men and 25 to 29 Years (64 | 15.3%) for women.
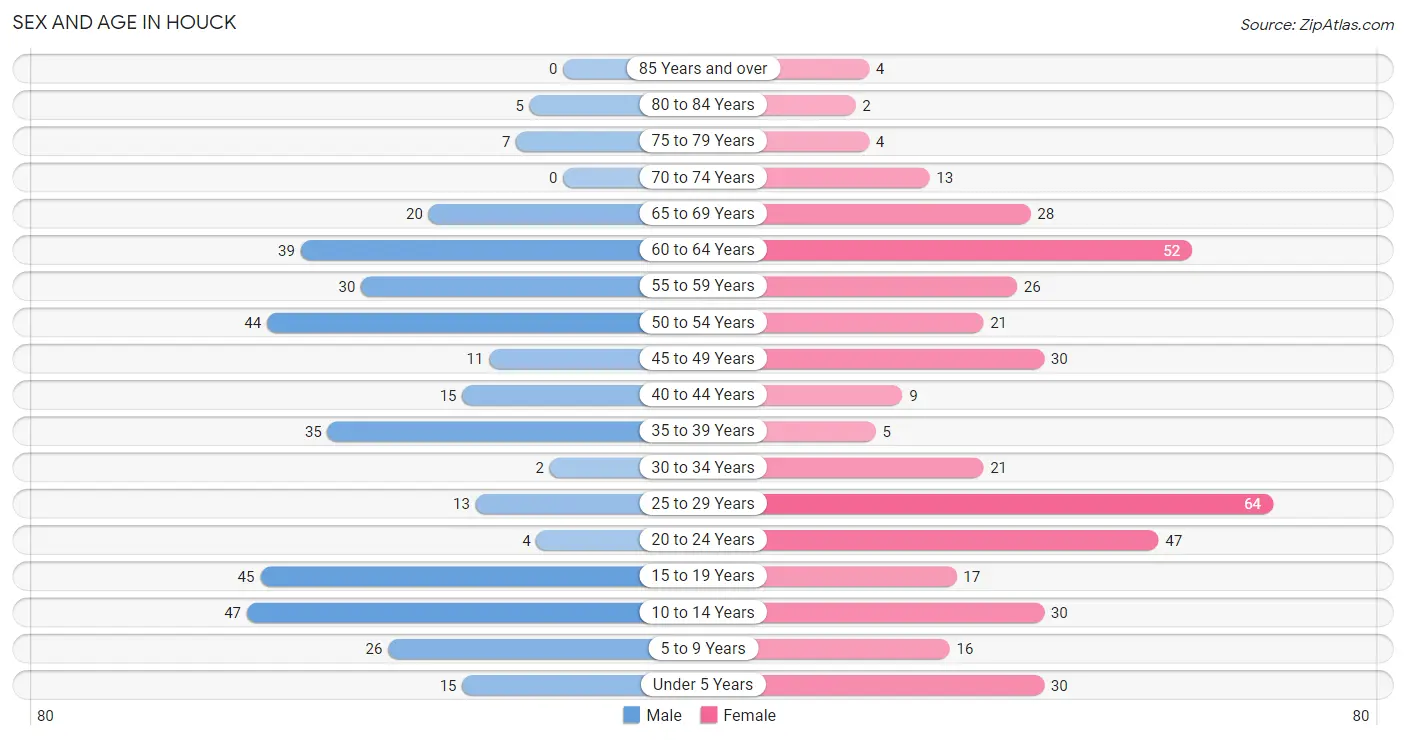
| Age Bracket | Male | Female |
| Under 5 Years | 15 (4.2%) | 30 (7.2%) |
| 5 to 9 Years | 26 (7.3%) | 16 (3.8%) |
| 10 to 14 Years | 47 (13.1%) | 30 (7.2%) |
| 15 to 19 Years | 45 (12.6%) | 17 (4.1%) |
| 20 to 24 Years | 4 (1.1%) | 47 (11.2%) |
| 25 to 29 Years | 13 (3.6%) | 64 (15.3%) |
| 30 to 34 Years | 2 (0.6%) | 21 (5.0%) |
| 35 to 39 Years | 35 (9.8%) | 5 (1.2%) |
| 40 to 44 Years | 15 (4.2%) | 9 (2.1%) |
| 45 to 49 Years | 11 (3.1%) | 30 (7.2%) |
| 50 to 54 Years | 44 (12.3%) | 21 (5.0%) |
| 55 to 59 Years | 30 (8.4%) | 26 (6.2%) |
| 60 to 64 Years | 39 (10.9%) | 52 (12.4%) |
| 65 to 69 Years | 20 (5.6%) | 28 (6.7%) |
| 70 to 74 Years | 0 (0.0%) | 13 (3.1%) |
| 75 to 79 Years | 7 (2.0%) | 4 (0.9%) |
| 80 to 84 Years | 5 (1.4%) | 2 (0.5%) |
| 85 Years and over | 0 (0.0%) | 4 (0.9%) |
| Total | 358 (100.0%) | 419 (100.0%) |
Families and Households in Houck
Median Family Size in Houck
The median family size in Houck is 4.23 persons per family, with single female/mother families (45 | 30.0%) accounting for the largest median family size of 5.44 persons per family. On the other hand, single male/father families (25 | 16.7%) represent the smallest median family size with 2.12 persons per family.
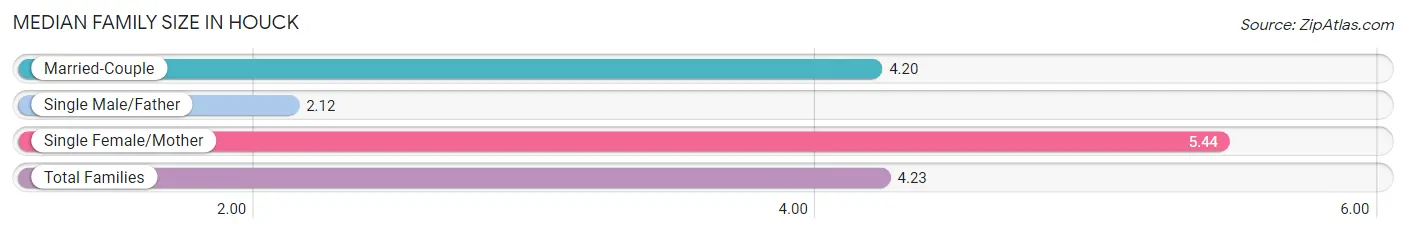
| Family Type | # Families | Family Size |
| Married-Couple | 80 (53.3%) | 4.20 |
| Single Male/Father | 25 (16.7%) | 2.12 |
| Single Female/Mother | 45 (30.0%) | 5.44 |
| Total Families | 150 (100.0%) | 4.23 |
Median Household Size in Houck
The median household size in Houck is 2.94 persons per household, with single female/mother households (45 | 17.1%) accounting for the largest median household size of 5.6 persons per household. non-family households (114 | 43.2%) represent the smallest median household size with 1.09 persons per household.
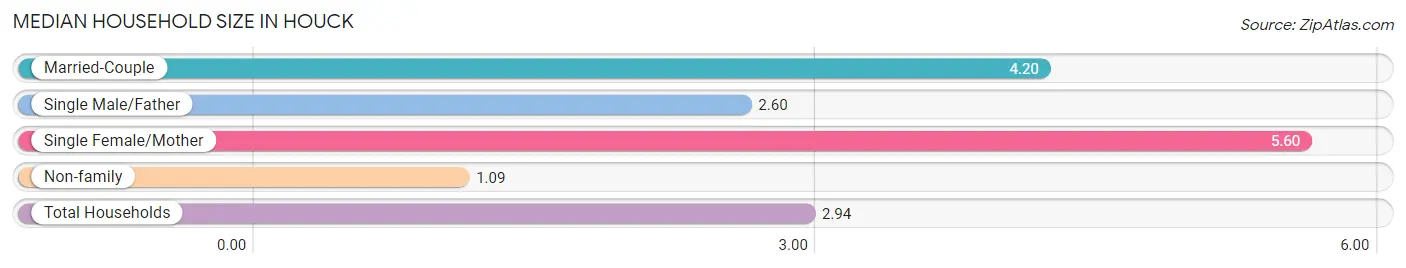
| Household Type | # Households | Household Size |
| Married-Couple | 80 (30.3%) | 4.20 |
| Single Male/Father | 25 (9.5%) | 2.60 |
| Single Female/Mother | 45 (17.1%) | 5.60 |
| Non-family | 114 (43.2%) | 1.09 |
| Total Households | 264 (100.0%) | 2.94 |
Household Size by Marriage Status in Houck
Out of a total of 264 households in Houck, 150 (56.8%) are family households, while 114 (43.2%) are nonfamily households. The most numerous type of family households are 2-person households, comprising 56, and the most common type of nonfamily households are 1-person households, comprising 107.
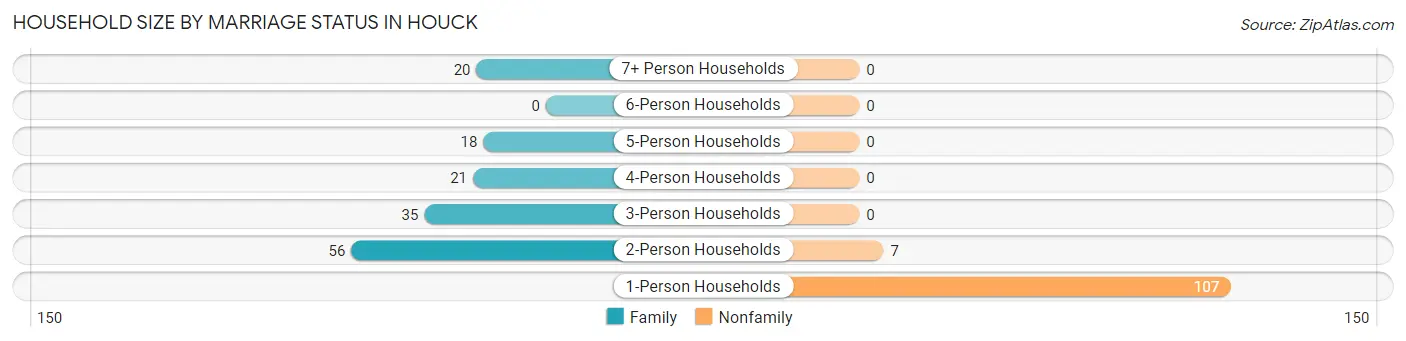
| Household Size | Family Households | Nonfamily Households |
| 1-Person Households | - | 107 (40.5%) |
| 2-Person Households | 56 (21.2%) | 7 (2.6%) |
| 3-Person Households | 35 (13.3%) | 0 (0.0%) |
| 4-Person Households | 21 (8.0%) | 0 (0.0%) |
| 5-Person Households | 18 (6.8%) | 0 (0.0%) |
| 6-Person Households | 0 (0.0%) | 0 (0.0%) |
| 7+ Person Households | 20 (7.6%) | 0 (0.0%) |
| Total | 150 (56.8%) | 114 (43.2%) |
Female Fertility in Houck
Fertility by Age in Houck
| Age Bracket | Women with Births | Births / 1,000 Women |
| 15 to 19 years | 0 (0.0%) | 0.0 |
| 20 to 34 years | 0 (0.0%) | 0.0 |
| 35 to 50 years | 0 (0.0%) | 0.0 |
| Total | 0 (0.0%) | 0.0 |
Fertility by Age by Marriage Status in Houck
| Age Bracket | Married | Unmarried |
| 15 to 19 years | 0 (0.0%) | 0 (0.0%) |
| 20 to 34 years | 0 (0.0%) | 0 (0.0%) |
| 35 to 50 years | 0 (0.0%) | 0 (0.0%) |
| Total | 0 (0.0%) | 0 (0.0%) |
Fertility by Education in Houck
| Educational Attainment | Women with Births | Births / 1,000 Women |
| Less than High School | 0 (0.0%) | 0.0 |
| High School Diploma | 0 (0.0%) | 0.0 |
| College or Associate's Degree | 0 (0.0%) | 0.0 |
| Bachelor's Degree | 0 (0.0%) | 0.0 |
| Graduate Degree | 0 (0.0%) | 0.0 |
| Total | 0 (0.0%) | 0.0 |
Fertility by Education by Marriage Status in Houck
| Educational Attainment | Married | Unmarried |
| Less than High School | 0 (0.0%) | 0 (0.0%) |
| High School Diploma | 0 (0.0%) | 0 (0.0%) |
| College or Associate's Degree | 0 (0.0%) | 0 (0.0%) |
| Bachelor's Degree | 0 (0.0%) | 0 (0.0%) |
| Graduate Degree | 0 (0.0%) | 0 (0.0%) |
| Total | 0 (0.0%) | 0 (0.0%) |
Employment Characteristics in Houck
Employment by Class of Employer in Houck
Among the 242 employed individuals in Houck, private company employees (123 | 50.8%), local government employees (57 | 23.5%), and state government employees (32 | 13.2%) make up the most common classes of employment.
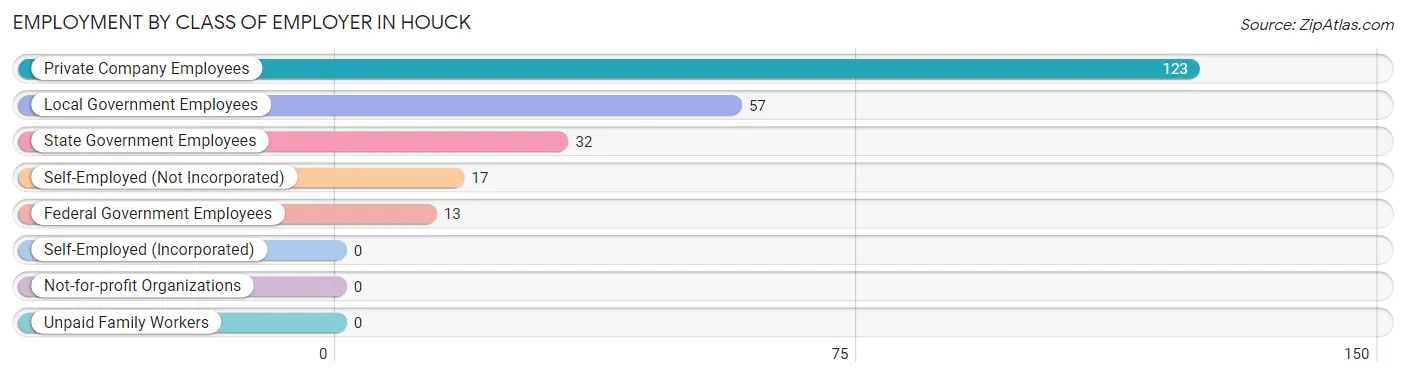
| Employer Class | # Employees | % Employees |
| Private Company Employees | 123 | 50.8% |
| Self-Employed (Incorporated) | 0 | 0.0% |
| Self-Employed (Not Incorporated) | 17 | 7.0% |
| Not-for-profit Organizations | 0 | 0.0% |
| Local Government Employees | 57 | 23.5% |
| State Government Employees | 32 | 13.2% |
| Federal Government Employees | 13 | 5.4% |
| Unpaid Family Workers | 0 | 0.0% |
| Total | 242 | 100.0% |
Employment Status by Age in Houck
According to the labor force statistics for Houck, out of the total population over 16 years of age (604), 41.7% or 252 individuals are in the labor force, with 4.0% or 10 of them unemployed. The age group with the highest labor force participation rate is 30 to 34 years, with 73.9% or 17 individuals in the labor force. Within the labor force, the 25 to 29 years age range has the highest percentage of unemployed individuals, with 23.1% or 6 of them being unemployed.
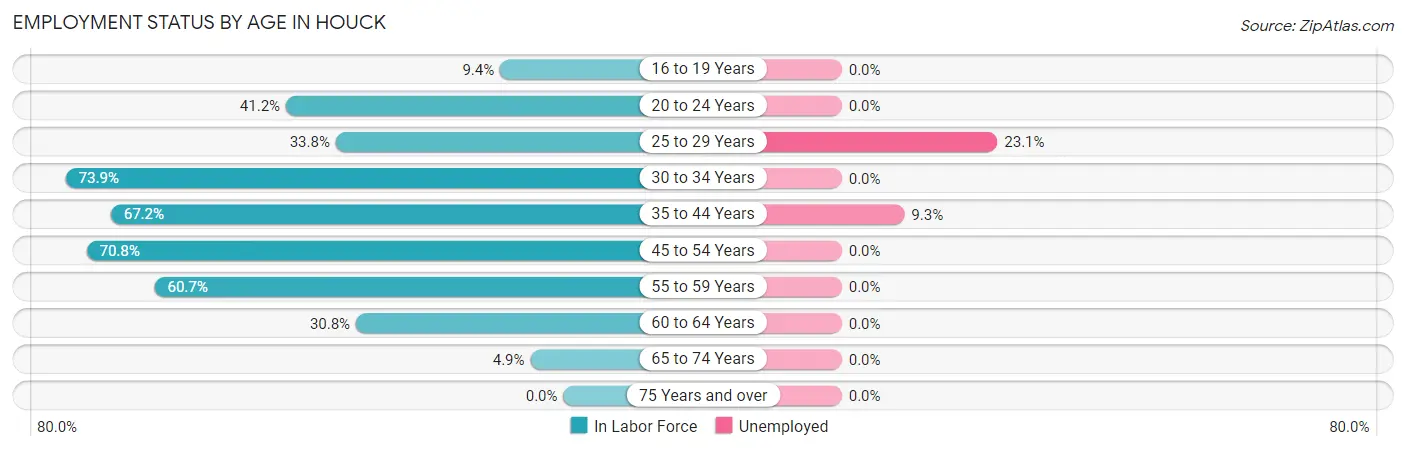
| Age Bracket | In Labor Force | Unemployed |
| 16 to 19 Years | 5 (9.4%) | 0 (0.0%) |
| 20 to 24 Years | 21 (41.2%) | 0 (0.0%) |
| 25 to 29 Years | 26 (33.8%) | 6 (23.1%) |
| 30 to 34 Years | 17 (73.9%) | 0 (0.0%) |
| 35 to 44 Years | 43 (67.2%) | 4 (9.3%) |
| 45 to 54 Years | 75 (70.8%) | 0 (0.0%) |
| 55 to 59 Years | 34 (60.7%) | 0 (0.0%) |
| 60 to 64 Years | 28 (30.8%) | 0 (0.0%) |
| 65 to 74 Years | 3 (4.9%) | 0 (0.0%) |
| 75 Years and over | 0 (0.0%) | 0 (0.0%) |
| Total | 252 (41.7%) | 10 (4.0%) |
Employment Status by Educational Attainment in Houck
According to labor force statistics for Houck, 53.5% of individuals (223) out of the total population between 25 and 64 years of age (417) are in the labor force, with 4.5% or 10 of them being unemployed. The group with the highest labor force participation rate are those with the educational attainment of bachelor's degree or higher, with 82.4% or 14 individuals in the labor force. Within the labor force, individuals with less than high school education have the highest percentage of unemployment, with 35.3% or 6 of them being unemployed.
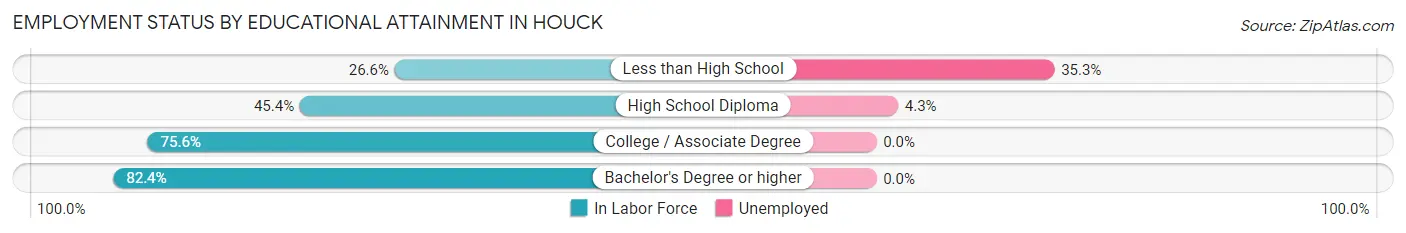
| Educational Attainment | In Labor Force | Unemployed |
| Less than High School | 17 (26.6%) | 23 (35.3%) |
| High School Diploma | 93 (45.4%) | 9 (4.3%) |
| College / Associate Degree | 99 (75.6%) | 0 (0.0%) |
| Bachelor's Degree or higher | 14 (82.4%) | 0 (0.0%) |
| Total | 223 (53.5%) | 19 (4.5%) |
Employment Occupations by Sex in Houck
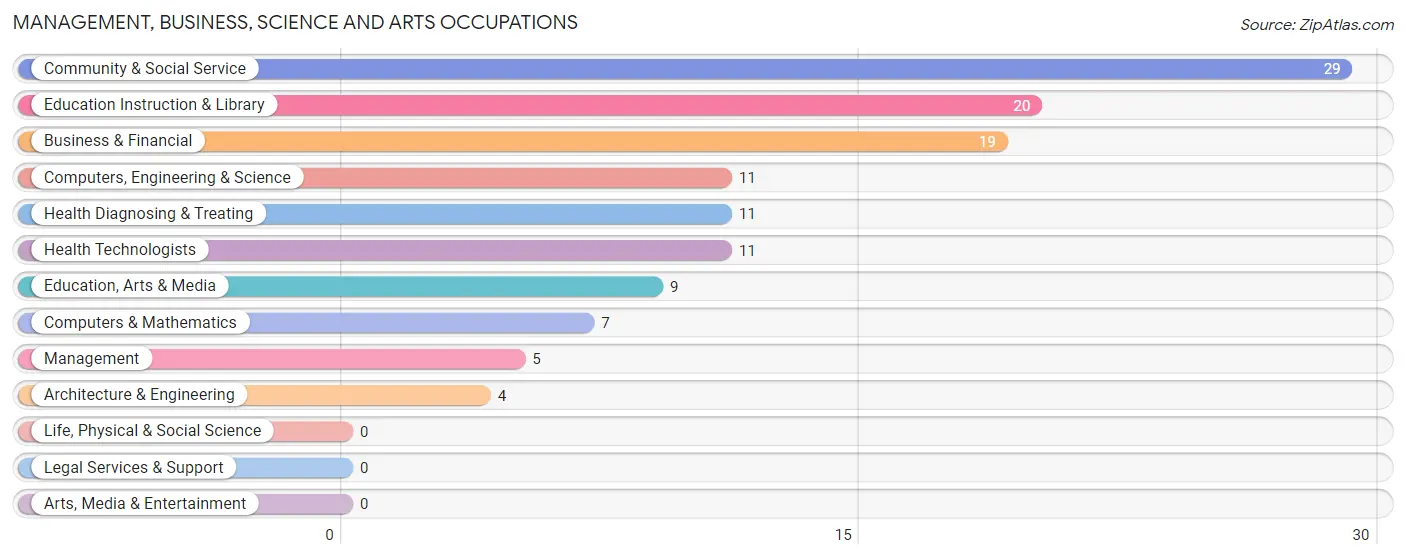
Management, Business, Science and Arts Occupations
The most common Management, Business, Science and Arts occupations in Houck are Community & Social Service (29 | 12.0%), Education Instruction & Library (20 | 8.3%), Business & Financial (19 | 7.9%), Computers, Engineering & Science (11 | 4.5%), and Health Diagnosing & Treating (11 | 4.5%).
Management, Business, Science and Arts Occupations by Sex
Within the Management, Business, Science and Arts occupations in Houck, the most male-oriented occupations are Business & Financial (100.0%), Computers, Engineering & Science (100.0%), and Computers & Mathematics (100.0%), while the most female-oriented occupations are Management (100.0%), Education, Arts & Media (100.0%), and Health Diagnosing & Treating (72.7%).
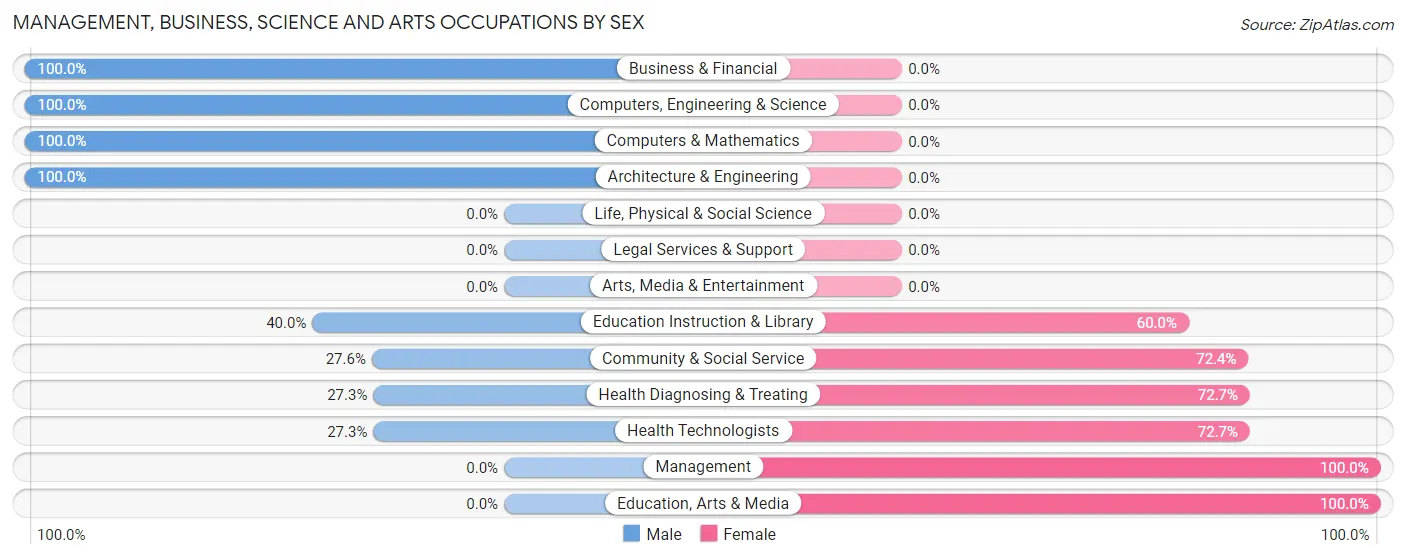
| Occupation | Male | Female |
| Management | 0 (0.0%) | 5 (100.0%) |
| Business & Financial | 19 (100.0%) | 0 (0.0%) |
| Computers, Engineering & Science | 11 (100.0%) | 0 (0.0%) |
| Computers & Mathematics | 7 (100.0%) | 0 (0.0%) |
| Architecture & Engineering | 4 (100.0%) | 0 (0.0%) |
| Life, Physical & Social Science | 0 (0.0%) | 0 (0.0%) |
| Community & Social Service | 8 (27.6%) | 21 (72.4%) |
| Education, Arts & Media | 0 (0.0%) | 9 (100.0%) |
| Legal Services & Support | 0 (0.0%) | 0 (0.0%) |
| Education Instruction & Library | 8 (40.0%) | 12 (60.0%) |
| Arts, Media & Entertainment | 0 (0.0%) | 0 (0.0%) |
| Health Diagnosing & Treating | 3 (27.3%) | 8 (72.7%) |
| Health Technologists | 3 (27.3%) | 8 (72.7%) |
| Total (Category) | 41 (54.7%) | 34 (45.3%) |
| Total (Overall) | 106 (43.8%) | 136 (56.2%) |
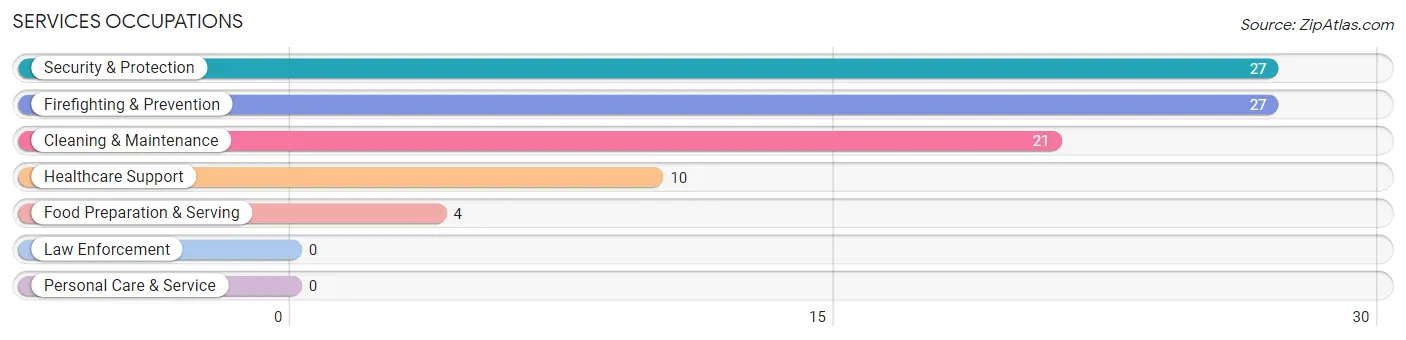
Services Occupations
The most common Services occupations in Houck are Security & Protection (27 | 11.2%), Firefighting & Prevention (27 | 11.2%), Cleaning & Maintenance (21 | 8.7%), Healthcare Support (10 | 4.1%), and Food Preparation & Serving (4 | 1.7%).
Services Occupations by Sex
Within the Services occupations in Houck, the most male-oriented occupations are Security & Protection (55.6%), Firefighting & Prevention (55.6%), and Cleaning & Maintenance (19.1%), while the most female-oriented occupations are Healthcare Support (100.0%), Food Preparation & Serving (100.0%), and Cleaning & Maintenance (80.9%).
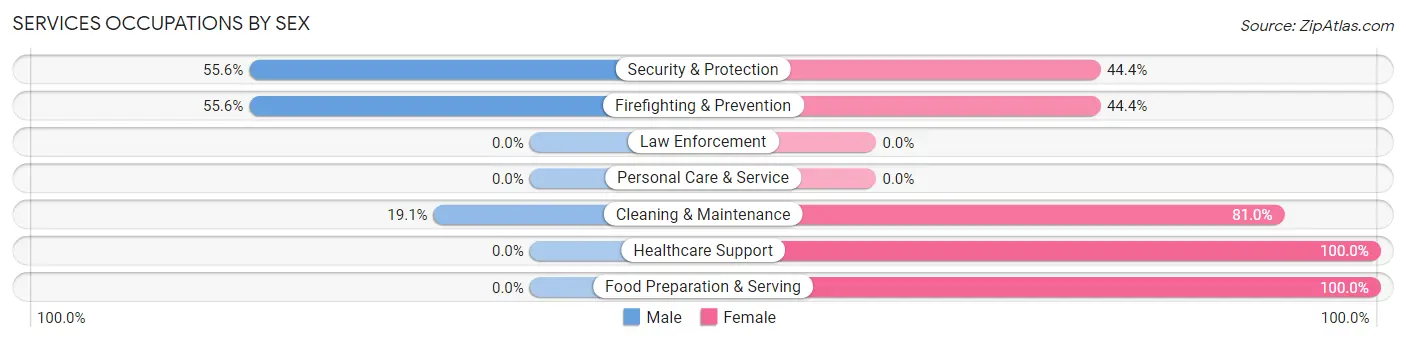
| Occupation | Male | Female |
| Healthcare Support | 0 (0.0%) | 10 (100.0%) |
| Security & Protection | 15 (55.6%) | 12 (44.4%) |
| Firefighting & Prevention | 15 (55.6%) | 12 (44.4%) |
| Law Enforcement | 0 (0.0%) | 0 (0.0%) |
| Food Preparation & Serving | 0 (0.0%) | 4 (100.0%) |
| Cleaning & Maintenance | 4 (19.1%) | 17 (80.9%) |
| Personal Care & Service | 0 (0.0%) | 0 (0.0%) |
| Total (Category) | 19 (30.6%) | 43 (69.4%) |
| Total (Overall) | 106 (43.8%) | 136 (56.2%) |
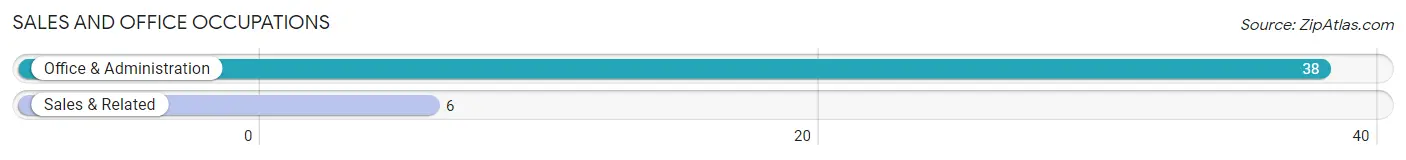
Sales and Office Occupations
The most common Sales and Office occupations in Houck are Office & Administration (38 | 15.7%), and Sales & Related (6 | 2.5%).
Sales and Office Occupations by Sex
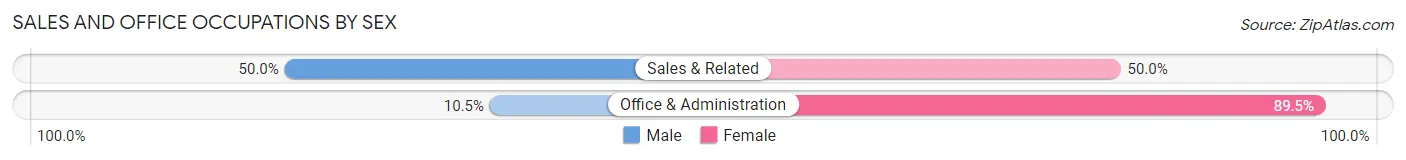
| Occupation | Male | Female |
| Sales & Related | 3 (50.0%) | 3 (50.0%) |
| Office & Administration | 4 (10.5%) | 34 (89.5%) |
| Total (Category) | 7 (15.9%) | 37 (84.1%) |
| Total (Overall) | 106 (43.8%) | 136 (56.2%) |
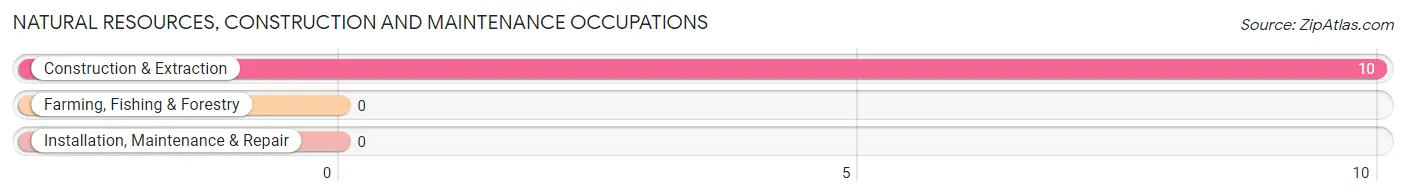
Natural Resources, Construction and Maintenance Occupations
The most common Natural Resources, Construction and Maintenance occupations in Houck are , and Construction & Extraction (10 | 4.1%).
Natural Resources, Construction and Maintenance Occupations by Sex
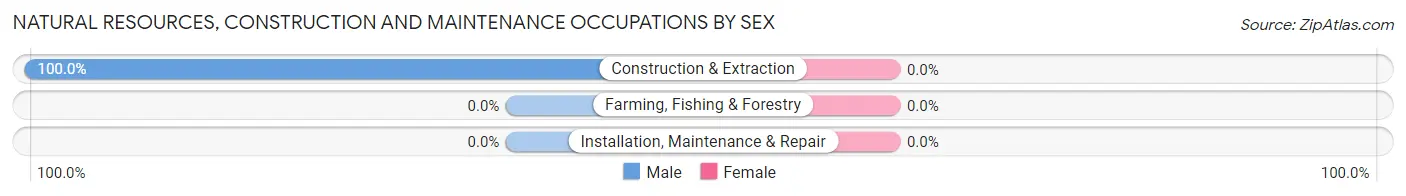
| Occupation | Male | Female |
| Farming, Fishing & Forestry | 0 (0.0%) | 0 (0.0%) |
| Construction & Extraction | 10 (100.0%) | 0 (0.0%) |
| Installation, Maintenance & Repair | 0 (0.0%) | 0 (0.0%) |
| Total (Category) | 10 (100.0%) | 0 (0.0%) |
| Total (Overall) | 106 (43.8%) | 136 (56.2%) |
Production, Transportation and Moving Occupations
The most common Production, Transportation and Moving occupations in Houck are Production (27 | 11.2%), and Transportation (24 | 9.9%).
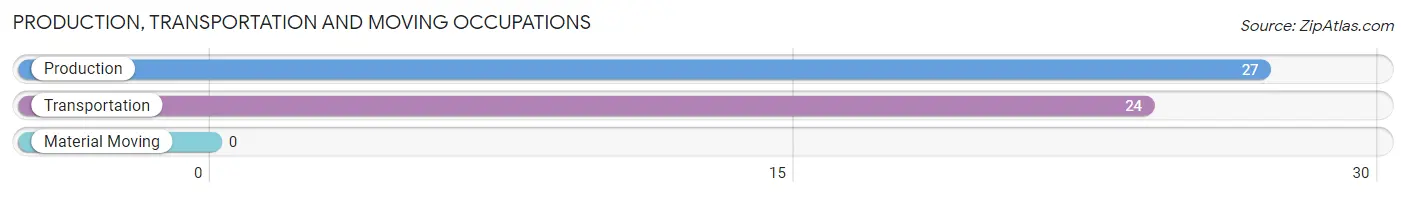
Production, Transportation and Moving Occupations by Sex
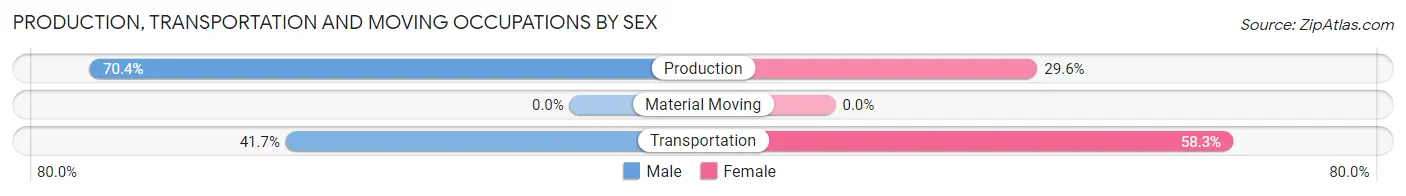
| Occupation | Male | Female |
| Production | 19 (70.4%) | 8 (29.6%) |
| Transportation | 10 (41.7%) | 14 (58.3%) |
| Material Moving | 0 (0.0%) | 0 (0.0%) |
| Total (Category) | 29 (56.9%) | 22 (43.1%) |
| Total (Overall) | 106 (43.8%) | 136 (56.2%) |
Employment Industries by Sex in Houck
Employment Industries in Houck
The major employment industries in Houck include Health Care & Social Assistance (70 | 28.9%), Public Administration (39 | 16.1%), Educational Services (37 | 15.3%), Manufacturing (22 | 9.1%), and Administrative & Support (17 | 7.0%).
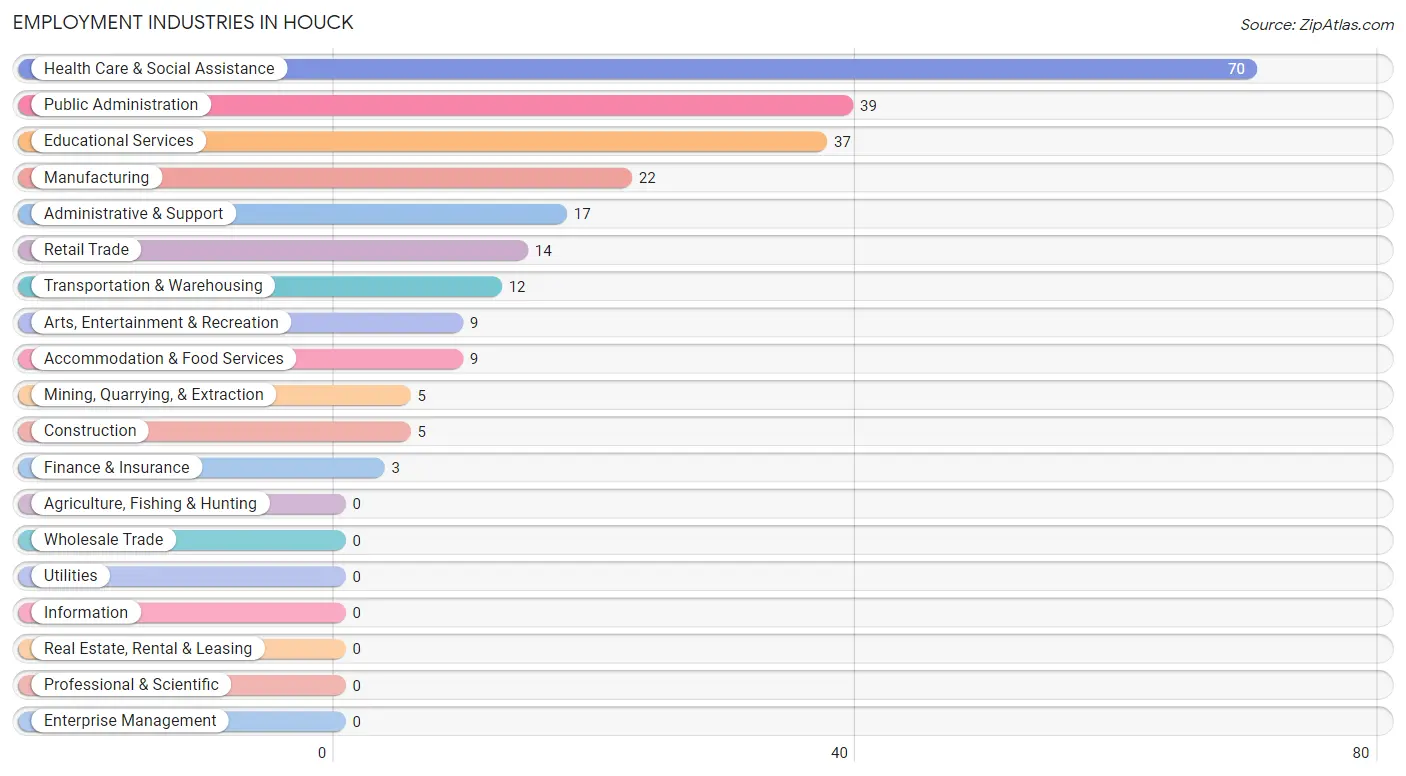
Employment Industries by Sex in Houck
The Houck industries that see more men than women are Mining, Quarrying, & Extraction (100.0%), Construction (100.0%), and Manufacturing (86.4%), whereas the industries that tend to have a higher number of women are Finance & Insurance (100.0%), Arts, Entertainment & Recreation (100.0%), and Accommodation & Food Services (100.0%).
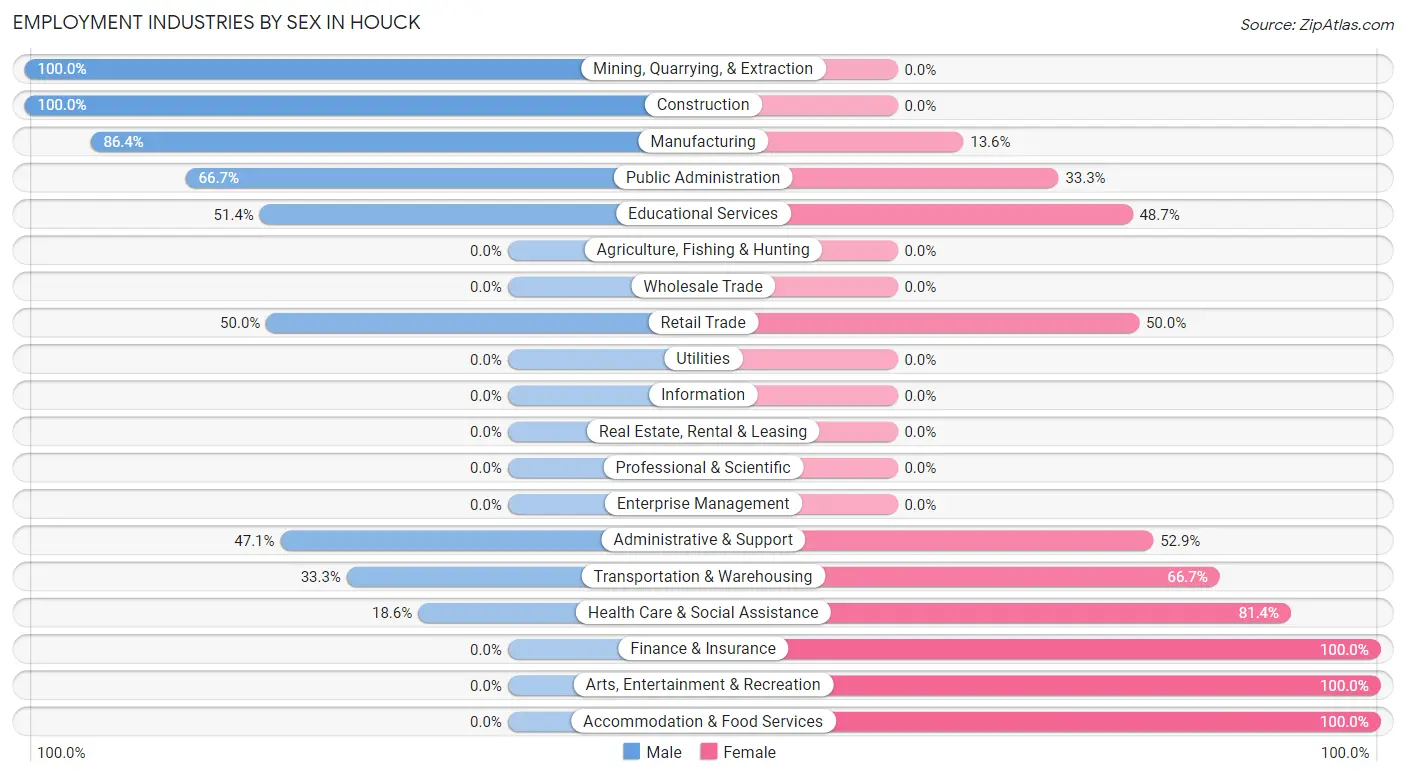
| Industry | Male | Female |
| Agriculture, Fishing & Hunting | 0 (0.0%) | 0 (0.0%) |
| Mining, Quarrying, & Extraction | 5 (100.0%) | 0 (0.0%) |
| Construction | 5 (100.0%) | 0 (0.0%) |
| Manufacturing | 19 (86.4%) | 3 (13.6%) |
| Wholesale Trade | 0 (0.0%) | 0 (0.0%) |
| Retail Trade | 7 (50.0%) | 7 (50.0%) |
| Transportation & Warehousing | 4 (33.3%) | 8 (66.7%) |
| Utilities | 0 (0.0%) | 0 (0.0%) |
| Information | 0 (0.0%) | 0 (0.0%) |
| Finance & Insurance | 0 (0.0%) | 3 (100.0%) |
| Real Estate, Rental & Leasing | 0 (0.0%) | 0 (0.0%) |
| Professional & Scientific | 0 (0.0%) | 0 (0.0%) |
| Enterprise Management | 0 (0.0%) | 0 (0.0%) |
| Administrative & Support | 8 (47.1%) | 9 (52.9%) |
| Educational Services | 19 (51.3%) | 18 (48.6%) |
| Health Care & Social Assistance | 13 (18.6%) | 57 (81.4%) |
| Arts, Entertainment & Recreation | 0 (0.0%) | 9 (100.0%) |
| Accommodation & Food Services | 0 (0.0%) | 9 (100.0%) |
| Public Administration | 26 (66.7%) | 13 (33.3%) |
| Total | 106 (43.8%) | 136 (56.2%) |
Education in Houck
School Enrollment in Houck
The most common levels of schooling among the 196 students in Houck are middle school (72 | 36.7%), college / undergraduate (45 | 23.0%), and elementary school (36 | 18.4%).
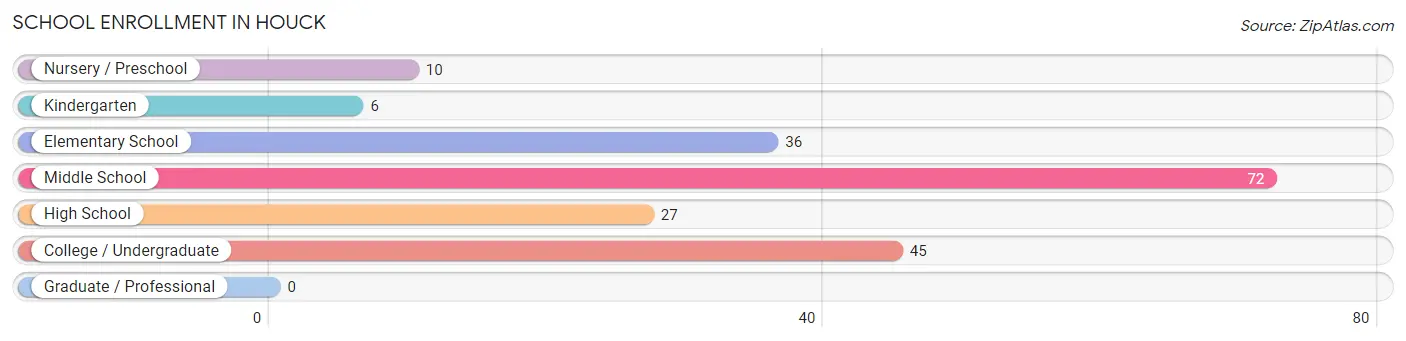
| School Level | # Students | % Students |
| Nursery / Preschool | 10 | 5.1% |
| Kindergarten | 6 | 3.1% |
| Elementary School | 36 | 18.4% |
| Middle School | 72 | 36.7% |
| High School | 27 | 13.8% |
| College / Undergraduate | 45 | 23.0% |
| Graduate / Professional | 0 | 0.0% |
| Total | 196 | 100.0% |
School Enrollment by Age by Funding Source in Houck
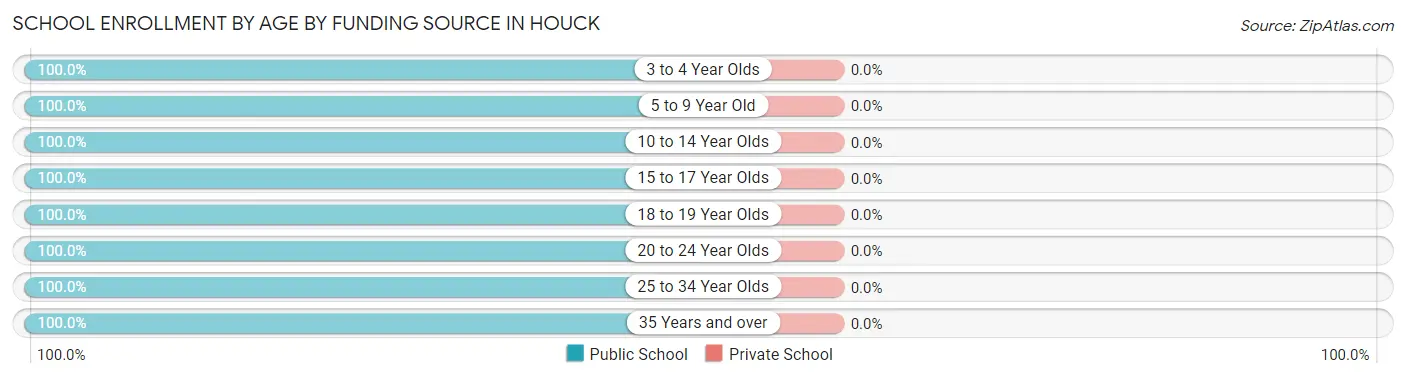
| Age Bracket | Public School | Private School |
| 3 to 4 Year Olds | 10 (100.0%) | 0 (0.0%) |
| 5 to 9 Year Old | 42 (100.0%) | 0 (0.0%) |
| 10 to 14 Year Olds | 77 (100.0%) | 0 (0.0%) |
| 15 to 17 Year Olds | 22 (100.0%) | 0 (0.0%) |
| 18 to 19 Year Olds | 3 (100.0%) | 0 (0.0%) |
| 20 to 24 Year Olds | 13 (100.0%) | 0 (0.0%) |
| 25 to 34 Year Olds | 9 (100.0%) | 0 (0.0%) |
| 35 Years and over | 20 (100.0%) | 0 (0.0%) |
| Total | 196 (100.0%) | 0 (0.0%) |
Educational Attainment by Field of Study in Houck
Science & technology (14 | 48.3%), education (6 | 20.7%), physical & health sciences (3 | 10.3%), business (3 | 10.3%), and liberal arts & history (3 | 10.3%) are the most common fields of study among 29 individuals in Houck who have obtained a bachelor's degree or higher.
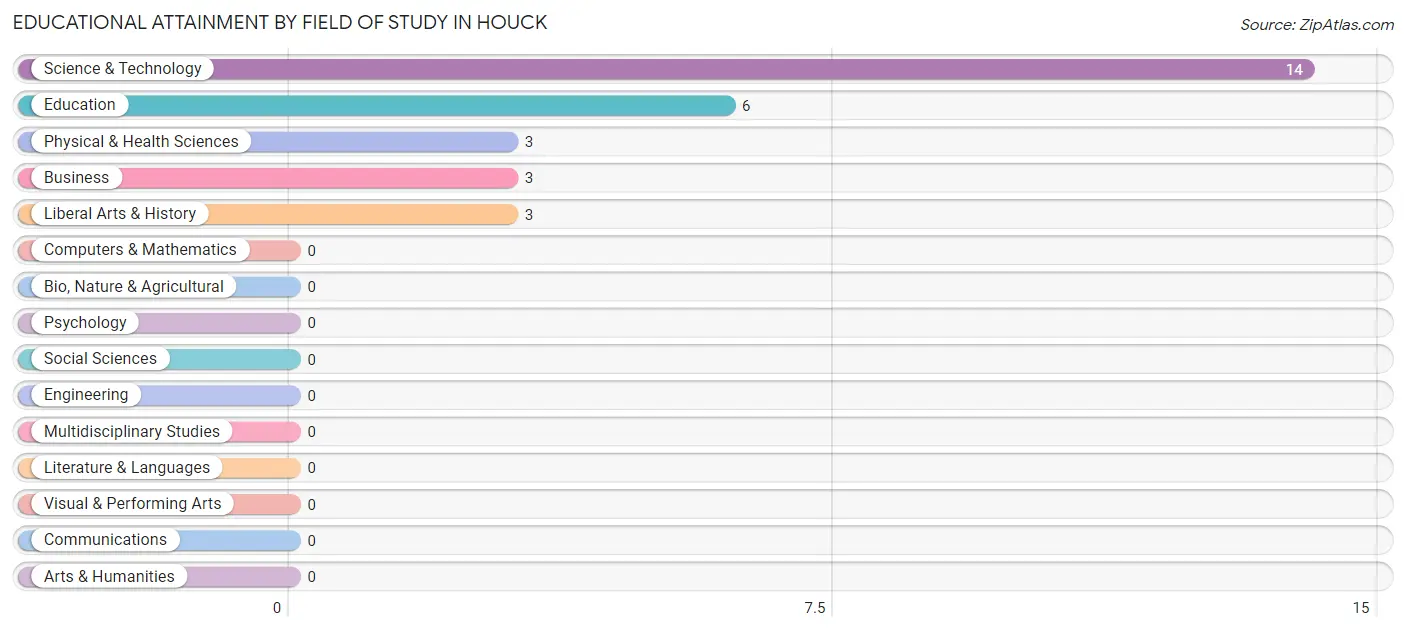
| Field of Study | # Graduates | % Graduates |
| Computers & Mathematics | 0 | 0.0% |
| Bio, Nature & Agricultural | 0 | 0.0% |
| Physical & Health Sciences | 3 | 10.3% |
| Psychology | 0 | 0.0% |
| Social Sciences | 0 | 0.0% |
| Engineering | 0 | 0.0% |
| Multidisciplinary Studies | 0 | 0.0% |
| Science & Technology | 14 | 48.3% |
| Business | 3 | 10.3% |
| Education | 6 | 20.7% |
| Literature & Languages | 0 | 0.0% |
| Liberal Arts & History | 3 | 10.3% |
| Visual & Performing Arts | 0 | 0.0% |
| Communications | 0 | 0.0% |
| Arts & Humanities | 0 | 0.0% |
| Total | 29 | 100.0% |
Transportation & Commute in Houck
Vehicle Availability by Sex in Houck
The most prevalent vehicle ownership categories in Houck are males with 2 vehicles (53, accounting for 50.0%) and females with 2 vehicles (67, making up 39.0%).
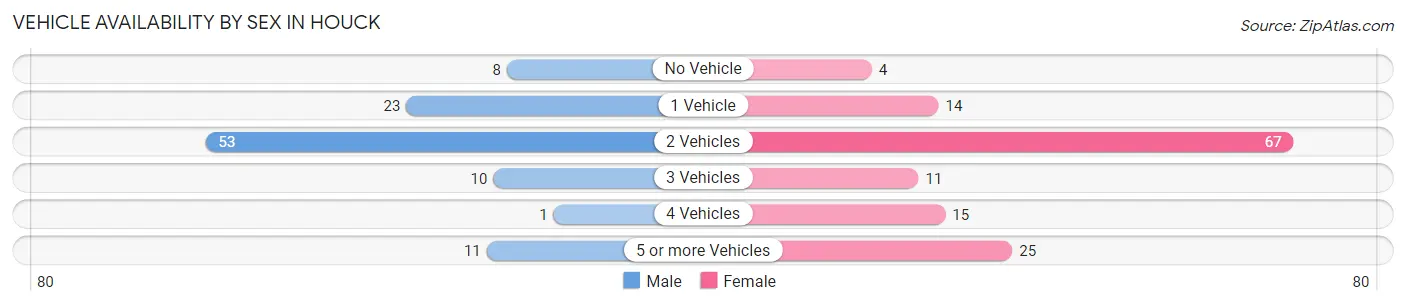
| Vehicles Available | Male | Female |
| No Vehicle | 8 (7.5%) | 4 (2.9%) |
| 1 Vehicle | 23 (21.7%) | 14 (10.3%) |
| 2 Vehicles | 53 (50.0%) | 67 (49.3%) |
| 3 Vehicles | 10 (9.4%) | 11 (8.1%) |
| 4 Vehicles | 1 (0.9%) | 15 (11.0%) |
| 5 or more Vehicles | 11 (10.4%) | 25 (18.4%) |
| Total | 106 (100.0%) | 136 (100.0%) |
Commute Time in Houck
The most frequently occuring commute durations in Houck are 30 to 34 minutes (50 commuters, 22.2%), 15 to 19 minutes (42 commuters, 18.7%), and 60 to 89 minutes (36 commuters, 16.0%).
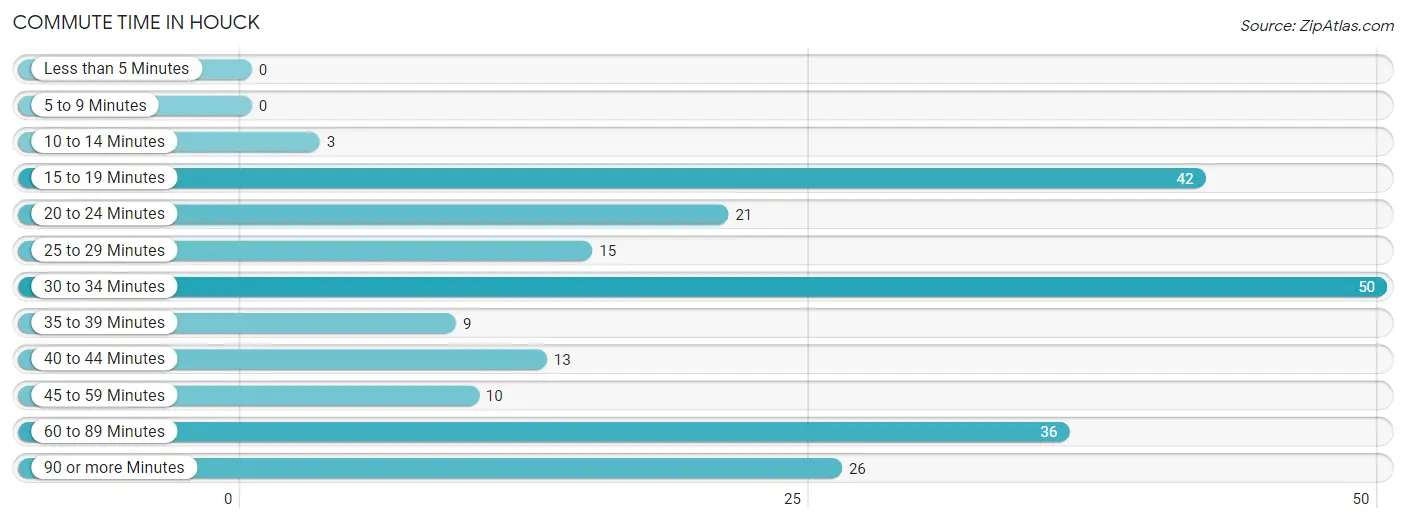
| Commute Time | # Commuters | % Commuters |
| Less than 5 Minutes | 0 | 0.0% |
| 5 to 9 Minutes | 0 | 0.0% |
| 10 to 14 Minutes | 3 | 1.3% |
| 15 to 19 Minutes | 42 | 18.7% |
| 20 to 24 Minutes | 21 | 9.3% |
| 25 to 29 Minutes | 15 | 6.7% |
| 30 to 34 Minutes | 50 | 22.2% |
| 35 to 39 Minutes | 9 | 4.0% |
| 40 to 44 Minutes | 13 | 5.8% |
| 45 to 59 Minutes | 10 | 4.4% |
| 60 to 89 Minutes | 36 | 16.0% |
| 90 or more Minutes | 26 | 11.6% |
Commute Time by Sex in Houck
The most common commute times in Houck are 30 to 34 minutes (20 commuters, 20.8%) for males and 15 to 19 minutes (34 commuters, 26.4%) for females.
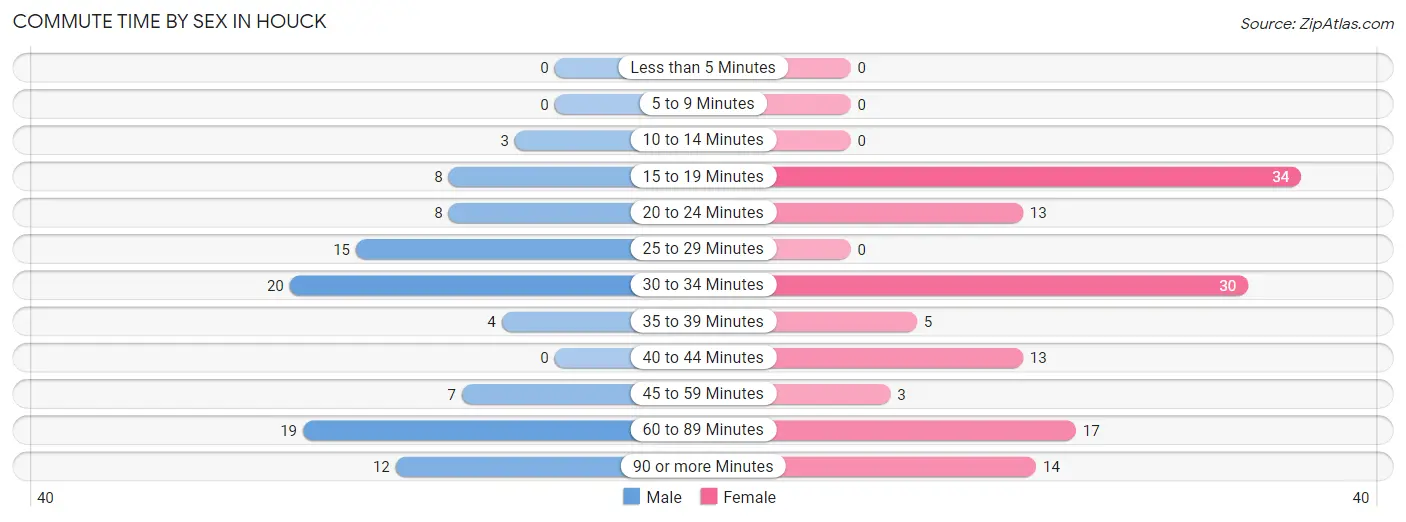
| Commute Time | Male | Female |
| Less than 5 Minutes | 0 (0.0%) | 0 (0.0%) |
| 5 to 9 Minutes | 0 (0.0%) | 0 (0.0%) |
| 10 to 14 Minutes | 3 (3.1%) | 0 (0.0%) |
| 15 to 19 Minutes | 8 (8.3%) | 34 (26.4%) |
| 20 to 24 Minutes | 8 (8.3%) | 13 (10.1%) |
| 25 to 29 Minutes | 15 (15.6%) | 0 (0.0%) |
| 30 to 34 Minutes | 20 (20.8%) | 30 (23.3%) |
| 35 to 39 Minutes | 4 (4.2%) | 5 (3.9%) |
| 40 to 44 Minutes | 0 (0.0%) | 13 (10.1%) |
| 45 to 59 Minutes | 7 (7.3%) | 3 (2.3%) |
| 60 to 89 Minutes | 19 (19.8%) | 17 (13.2%) |
| 90 or more Minutes | 12 (12.5%) | 14 (10.8%) |
Time of Departure to Work by Sex in Houck
The most frequent times of departure to work in Houck are 7:30 AM to 7:59 AM (37, 38.5%) for males and 7:30 AM to 7:59 AM (58, 45.0%) for females.
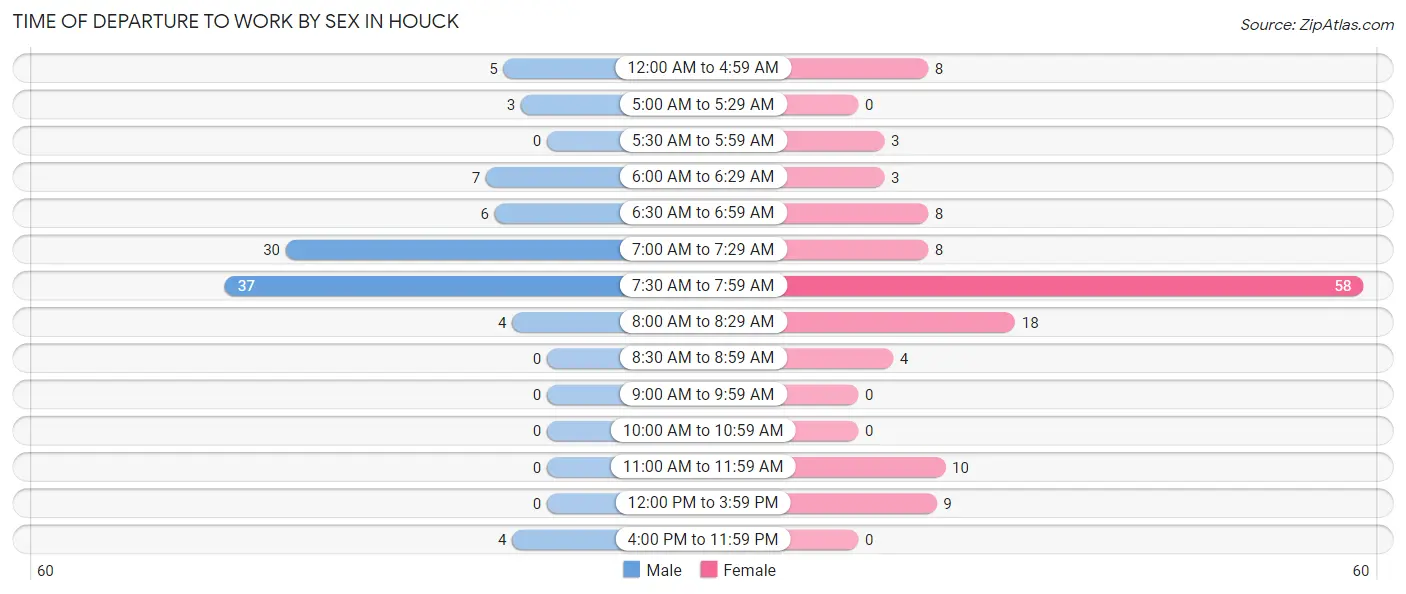
| Time of Departure | Male | Female |
| 12:00 AM to 4:59 AM | 5 (5.2%) | 8 (6.2%) |
| 5:00 AM to 5:29 AM | 3 (3.1%) | 0 (0.0%) |
| 5:30 AM to 5:59 AM | 0 (0.0%) | 3 (2.3%) |
| 6:00 AM to 6:29 AM | 7 (7.3%) | 3 (2.3%) |
| 6:30 AM to 6:59 AM | 6 (6.2%) | 8 (6.2%) |
| 7:00 AM to 7:29 AM | 30 (31.2%) | 8 (6.2%) |
| 7:30 AM to 7:59 AM | 37 (38.5%) | 58 (45.0%) |
| 8:00 AM to 8:29 AM | 4 (4.2%) | 18 (14.0%) |
| 8:30 AM to 8:59 AM | 0 (0.0%) | 4 (3.1%) |
| 9:00 AM to 9:59 AM | 0 (0.0%) | 0 (0.0%) |
| 10:00 AM to 10:59 AM | 0 (0.0%) | 0 (0.0%) |
| 11:00 AM to 11:59 AM | 0 (0.0%) | 10 (7.7%) |
| 12:00 PM to 3:59 PM | 0 (0.0%) | 9 (7.0%) |
| 4:00 PM to 11:59 PM | 4 (4.2%) | 0 (0.0%) |
| Total | 96 (100.0%) | 129 (100.0%) |
Housing Occupancy in Houck
Occupancy by Ownership in Houck
Of the total 264 dwellings in Houck, owner-occupied units account for 255 (96.6%), while renter-occupied units make up 9 (3.4%).
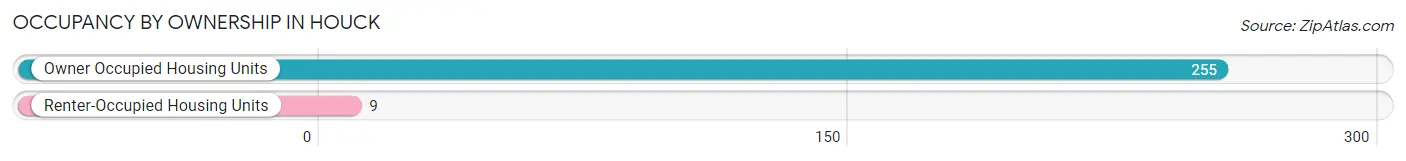
| Occupancy | # Housing Units | % Housing Units |
| Owner Occupied Housing Units | 255 | 96.6% |
| Renter-Occupied Housing Units | 9 | 3.4% |
| Total Occupied Housing Units | 264 | 100.0% |
Occupancy by Household Size in Houck
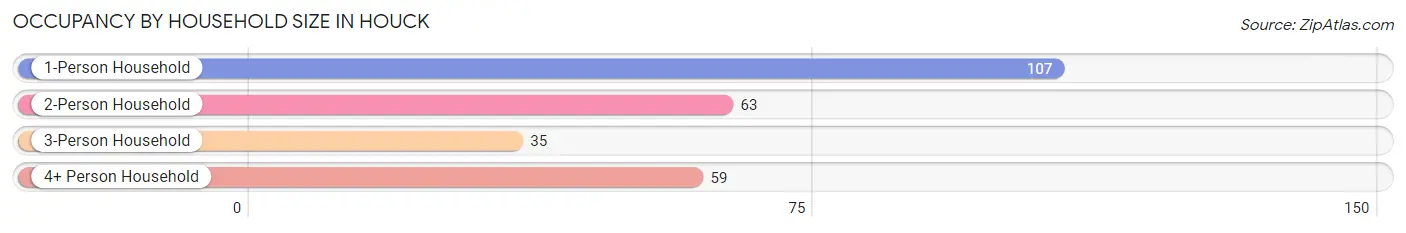
| Household Size | # Housing Units | % Housing Units |
| 1-Person Household | 107 | 40.5% |
| 2-Person Household | 63 | 23.9% |
| 3-Person Household | 35 | 13.3% |
| 4+ Person Household | 59 | 22.4% |
| Total Housing Units | 264 | 100.0% |
Occupancy by Ownership by Household Size in Houck
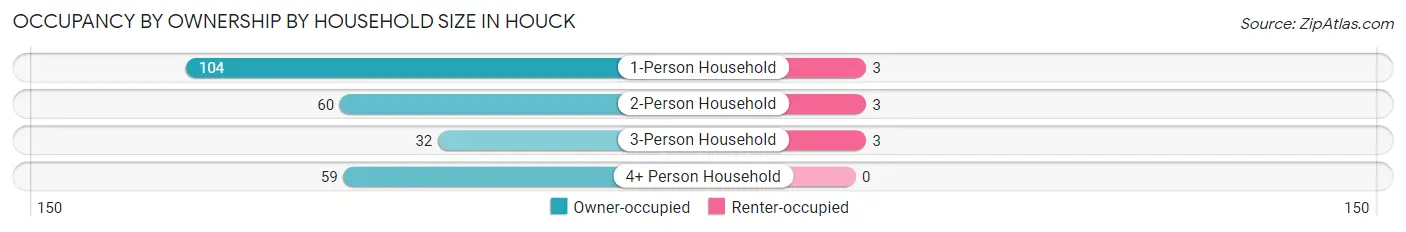
| Household Size | Owner-occupied | Renter-occupied |
| 1-Person Household | 104 (97.2%) | 3 (2.8%) |
| 2-Person Household | 60 (95.2%) | 3 (4.8%) |
| 3-Person Household | 32 (91.4%) | 3 (8.6%) |
| 4+ Person Household | 59 (100.0%) | 0 (0.0%) |
| Total Housing Units | 255 (96.6%) | 9 (3.4%) |
Occupancy by Educational Attainment in Houck
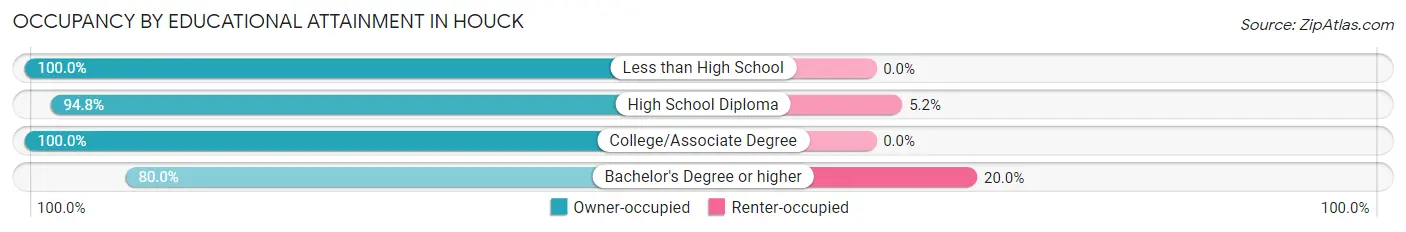
| Household Size | Owner-occupied | Renter-occupied |
| Less than High School | 41 (100.0%) | 0 (0.0%) |
| High School Diploma | 110 (94.8%) | 6 (5.2%) |
| College/Associate Degree | 92 (100.0%) | 0 (0.0%) |
| Bachelor's Degree or higher | 12 (80.0%) | 3 (20.0%) |
Occupancy by Age of Householder in Houck
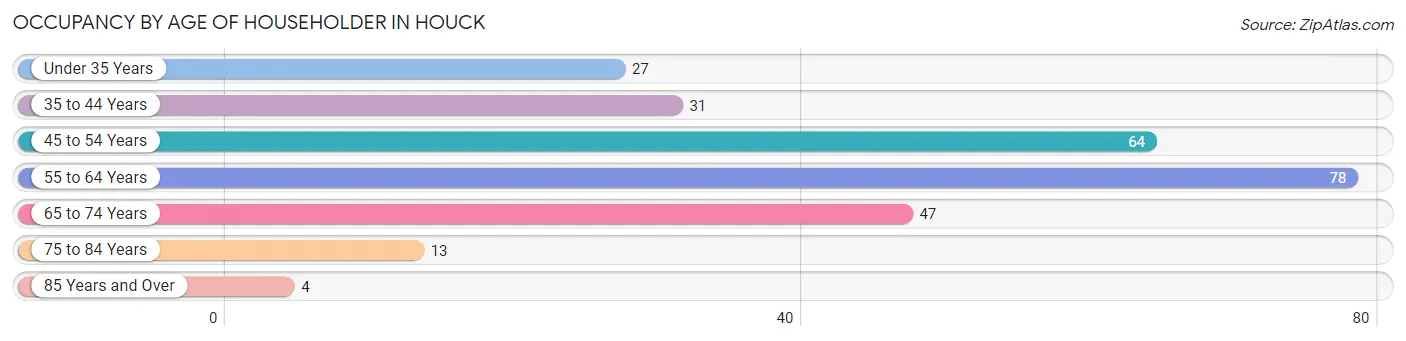
| Age Bracket | # Households | % Households |
| Under 35 Years | 27 | 10.2% |
| 35 to 44 Years | 31 | 11.7% |
| 45 to 54 Years | 64 | 24.2% |
| 55 to 64 Years | 78 | 29.5% |
| 65 to 74 Years | 47 | 17.8% |
| 75 to 84 Years | 13 | 4.9% |
| 85 Years and Over | 4 | 1.5% |
| Total | 264 | 100.0% |
Housing Finances in Houck
Median Income by Occupancy in Houck
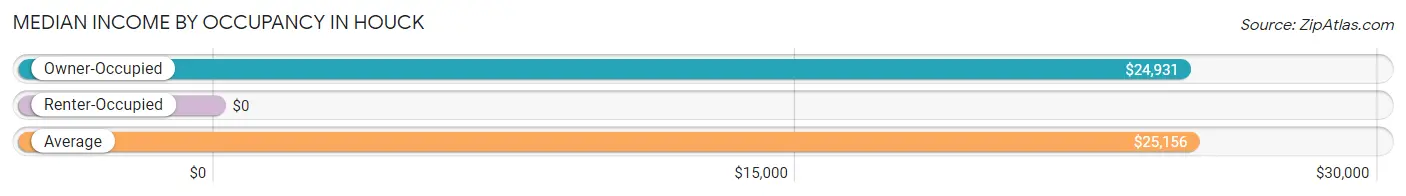
| Occupancy Type | # Households | Median Income |
| Owner-Occupied | 255 (96.6%) | $24,931 |
| Renter-Occupied | 9 (3.4%) | $0 |
| Average | 264 (100.0%) | $25,156 |
Occupancy by Householder Income Bracket in Houck
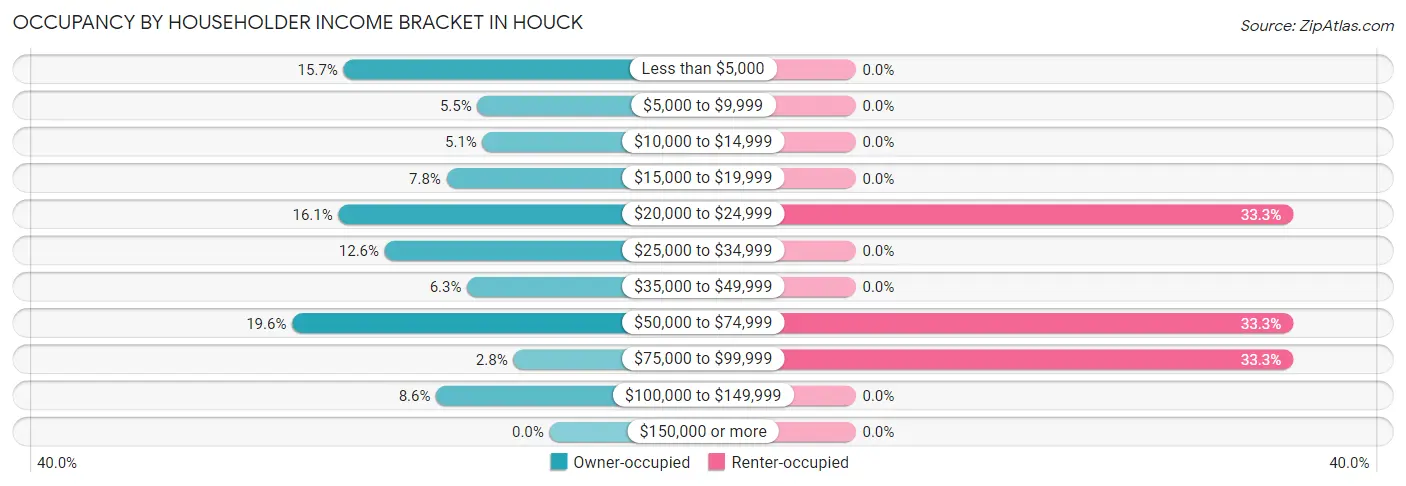
| Income Bracket | Owner-occupied | Renter-occupied |
| Less than $5,000 | 40 (15.7%) | 0 (0.0%) |
| $5,000 to $9,999 | 14 (5.5%) | 0 (0.0%) |
| $10,000 to $14,999 | 13 (5.1%) | 0 (0.0%) |
| $15,000 to $19,999 | 20 (7.8%) | 0 (0.0%) |
| $20,000 to $24,999 | 41 (16.1%) | 3 (33.3%) |
| $25,000 to $34,999 | 32 (12.6%) | 0 (0.0%) |
| $35,000 to $49,999 | 16 (6.3%) | 0 (0.0%) |
| $50,000 to $74,999 | 50 (19.6%) | 3 (33.3%) |
| $75,000 to $99,999 | 7 (2.8%) | 3 (33.3%) |
| $100,000 to $149,999 | 22 (8.6%) | 0 (0.0%) |
| $150,000 or more | 0 (0.0%) | 0 (0.0%) |
| Total | 255 (100.0%) | 9 (100.0%) |
Monthly Housing Cost Tiers in Houck
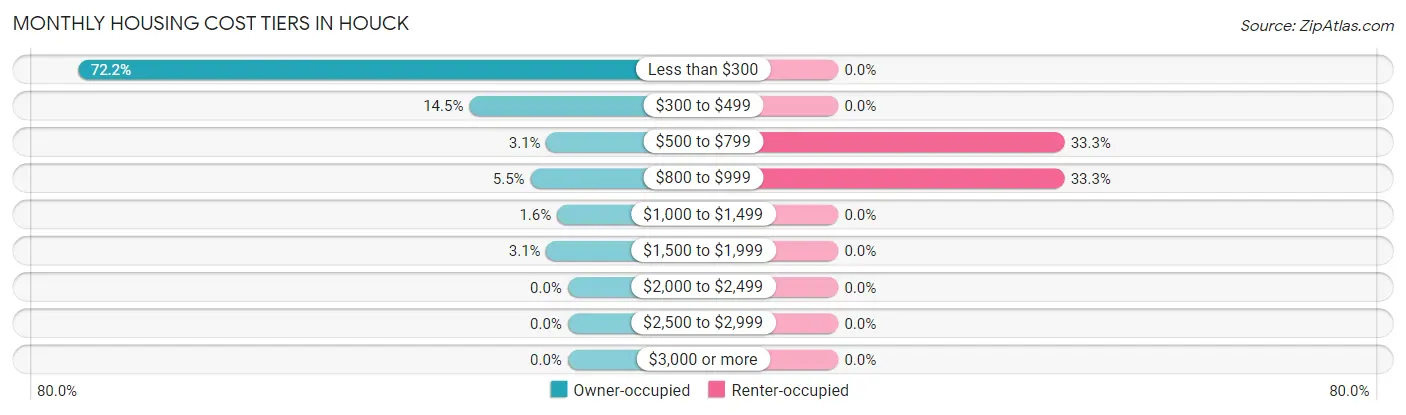
| Monthly Cost | Owner-occupied | Renter-occupied |
| Less than $300 | 184 (72.2%) | 0 (0.0%) |
| $300 to $499 | 37 (14.5%) | 0 (0.0%) |
| $500 to $799 | 8 (3.1%) | 3 (33.3%) |
| $800 to $999 | 14 (5.5%) | 3 (33.3%) |
| $1,000 to $1,499 | 4 (1.6%) | 0 (0.0%) |
| $1,500 to $1,999 | 8 (3.1%) | 0 (0.0%) |
| $2,000 to $2,499 | 0 (0.0%) | 0 (0.0%) |
| $2,500 to $2,999 | 0 (0.0%) | 0 (0.0%) |
| $3,000 or more | 0 (0.0%) | 0 (0.0%) |
| Total | 255 (100.0%) | 9 (100.0%) |
Physical Housing Characteristics in Houck
Housing Structures in Houck
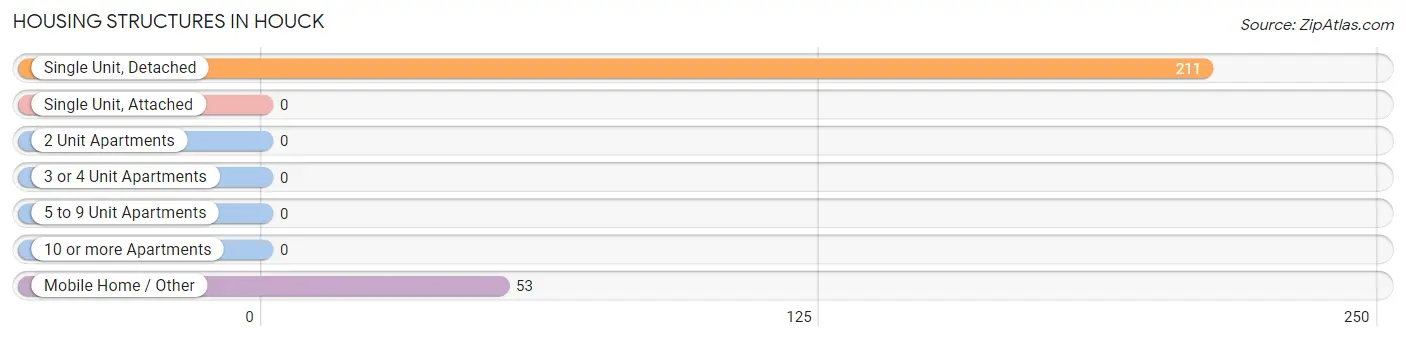
| Structure Type | # Housing Units | % Housing Units |
| Single Unit, Detached | 211 | 79.9% |
| Single Unit, Attached | 0 | 0.0% |
| 2 Unit Apartments | 0 | 0.0% |
| 3 or 4 Unit Apartments | 0 | 0.0% |
| 5 to 9 Unit Apartments | 0 | 0.0% |
| 10 or more Apartments | 0 | 0.0% |
| Mobile Home / Other | 53 | 20.1% |
| Total | 264 | 100.0% |
Housing Structures by Occupancy in Houck
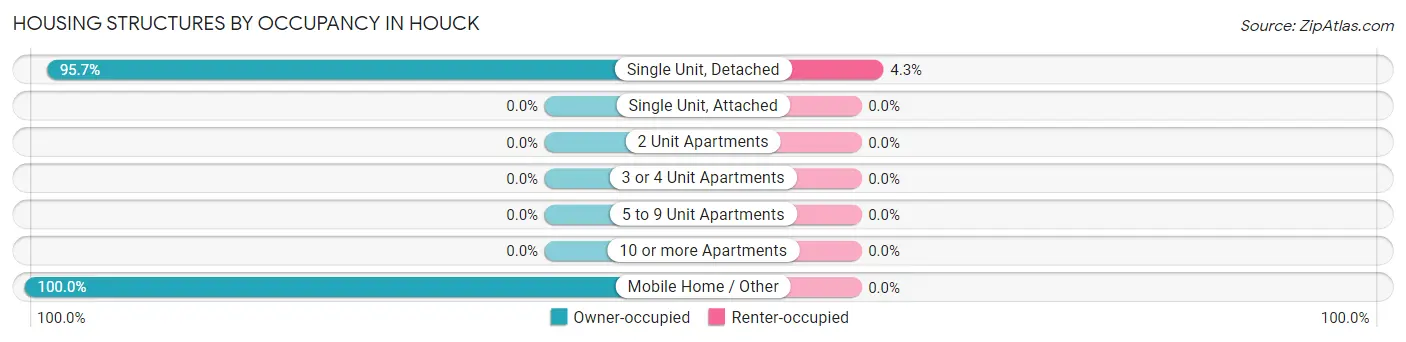
| Structure Type | Owner-occupied | Renter-occupied |
| Single Unit, Detached | 202 (95.7%) | 9 (4.3%) |
| Single Unit, Attached | 0 (0.0%) | 0 (0.0%) |
| 2 Unit Apartments | 0 (0.0%) | 0 (0.0%) |
| 3 or 4 Unit Apartments | 0 (0.0%) | 0 (0.0%) |
| 5 to 9 Unit Apartments | 0 (0.0%) | 0 (0.0%) |
| 10 or more Apartments | 0 (0.0%) | 0 (0.0%) |
| Mobile Home / Other | 53 (100.0%) | 0 (0.0%) |
| Total | 255 (96.6%) | 9 (3.4%) |
Housing Structures by Number of Rooms in Houck
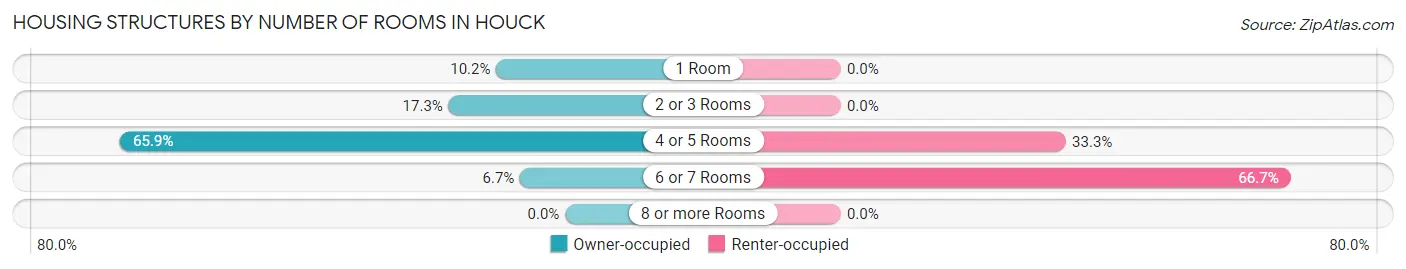
| Number of Rooms | Owner-occupied | Renter-occupied |
| 1 Room | 26 (10.2%) | 0 (0.0%) |
| 2 or 3 Rooms | 44 (17.2%) | 0 (0.0%) |
| 4 or 5 Rooms | 168 (65.9%) | 3 (33.3%) |
| 6 or 7 Rooms | 17 (6.7%) | 6 (66.7%) |
| 8 or more Rooms | 0 (0.0%) | 0 (0.0%) |
| Total | 255 (100.0%) | 9 (100.0%) |
Housing Structure by Heating Type in Houck
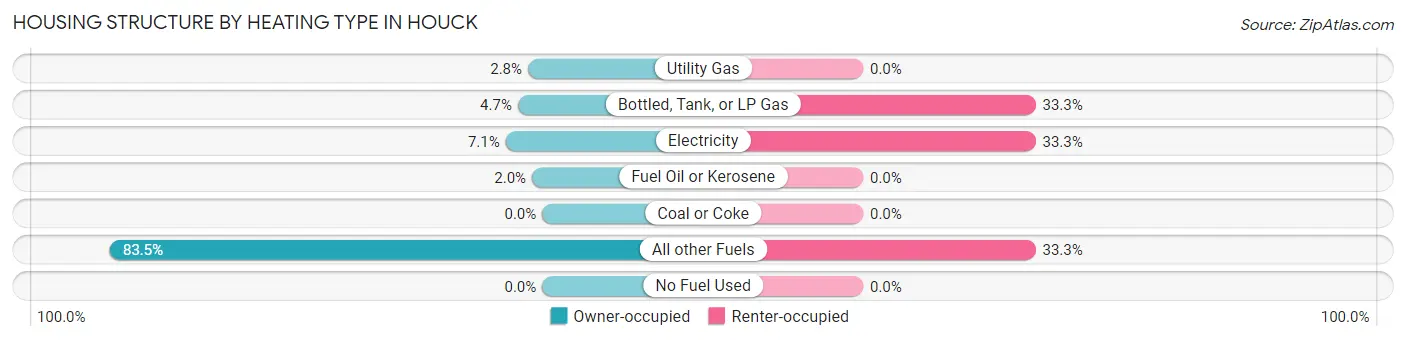
| Heating Type | Owner-occupied | Renter-occupied |
| Utility Gas | 7 (2.8%) | 0 (0.0%) |
| Bottled, Tank, or LP Gas | 12 (4.7%) | 3 (33.3%) |
| Electricity | 18 (7.1%) | 3 (33.3%) |
| Fuel Oil or Kerosene | 5 (2.0%) | 0 (0.0%) |
| Coal or Coke | 0 (0.0%) | 0 (0.0%) |
| All other Fuels | 213 (83.5%) | 3 (33.3%) |
| No Fuel Used | 0 (0.0%) | 0 (0.0%) |
| Total | 255 (100.0%) | 9 (100.0%) |
Household Vehicle Usage in Houck
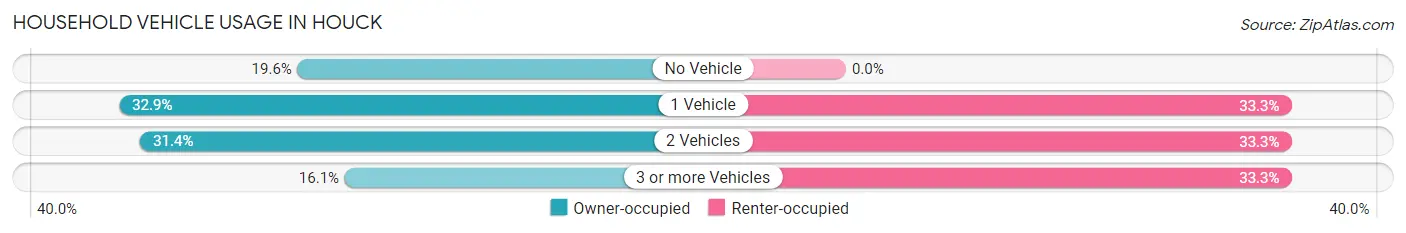
| Vehicles per Household | Owner-occupied | Renter-occupied |
| No Vehicle | 50 (19.6%) | 0 (0.0%) |
| 1 Vehicle | 84 (32.9%) | 3 (33.3%) |
| 2 Vehicles | 80 (31.4%) | 3 (33.3%) |
| 3 or more Vehicles | 41 (16.1%) | 3 (33.3%) |
| Total | 255 (100.0%) | 9 (100.0%) |
Real Estate & Mortgages in Houck
Real Estate and Mortgage Overview in Houck
| Characteristic | Without Mortgage | With Mortgage |
| Housing Units | 237 | 18 |
| Median Property Value | $44,100 | $63,800 |
| Median Household Income | $25,391 | $0 |
| Monthly Housing Costs | $142 | $0 |
| Real Estate Taxes | - | - |
Property Value by Mortgage Status in Houck
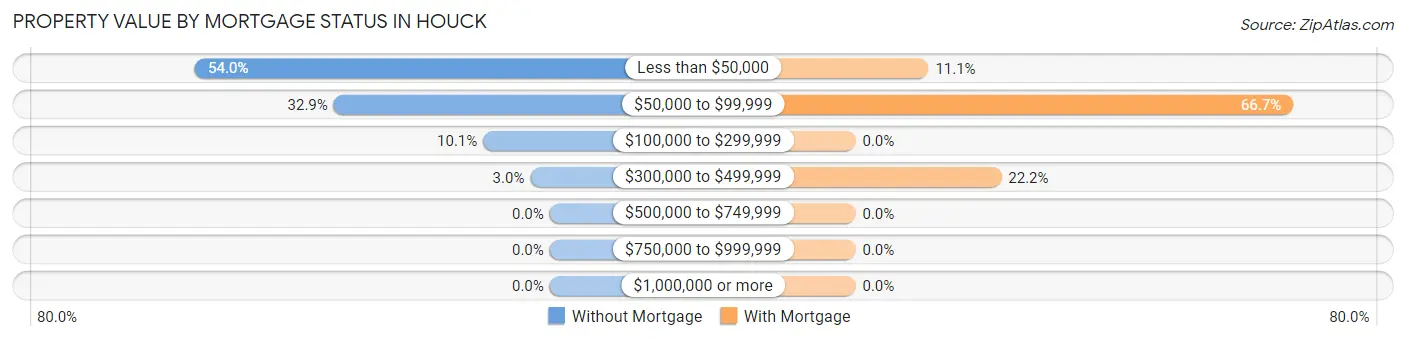
| Property Value | Without Mortgage | With Mortgage |
| Less than $50,000 | 128 (54.0%) | 2 (11.1%) |
| $50,000 to $99,999 | 78 (32.9%) | 12 (66.7%) |
| $100,000 to $299,999 | 24 (10.1%) | 0 (0.0%) |
| $300,000 to $499,999 | 7 (2.9%) | 4 (22.2%) |
| $500,000 to $749,999 | 0 (0.0%) | 0 (0.0%) |
| $750,000 to $999,999 | 0 (0.0%) | 0 (0.0%) |
| $1,000,000 or more | 0 (0.0%) | 0 (0.0%) |
| Total | 237 (100.0%) | 18 (100.0%) |
Household Income by Mortgage Status in Houck
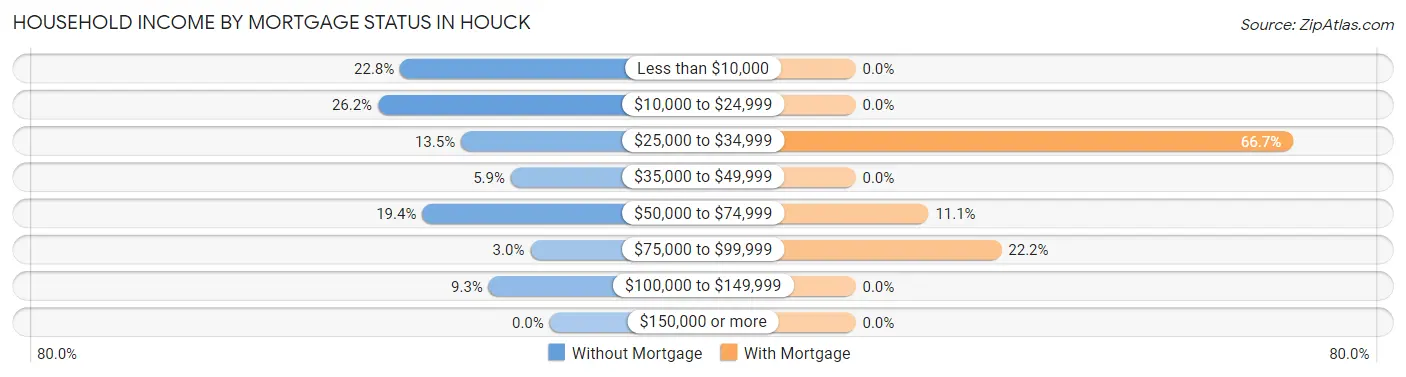
| Household Income | Without Mortgage | With Mortgage |
| Less than $10,000 | 54 (22.8%) | 0 (0.0%) |
| $10,000 to $24,999 | 62 (26.2%) | 0 (0.0%) |
| $25,000 to $34,999 | 32 (13.5%) | 12 (66.7%) |
| $35,000 to $49,999 | 14 (5.9%) | 0 (0.0%) |
| $50,000 to $74,999 | 46 (19.4%) | 2 (11.1%) |
| $75,000 to $99,999 | 7 (2.9%) | 4 (22.2%) |
| $100,000 to $149,999 | 22 (9.3%) | 0 (0.0%) |
| $150,000 or more | 0 (0.0%) | 0 (0.0%) |
| Total | 237 (100.0%) | 18 (100.0%) |
Property Value to Household Income Ratio in Houck
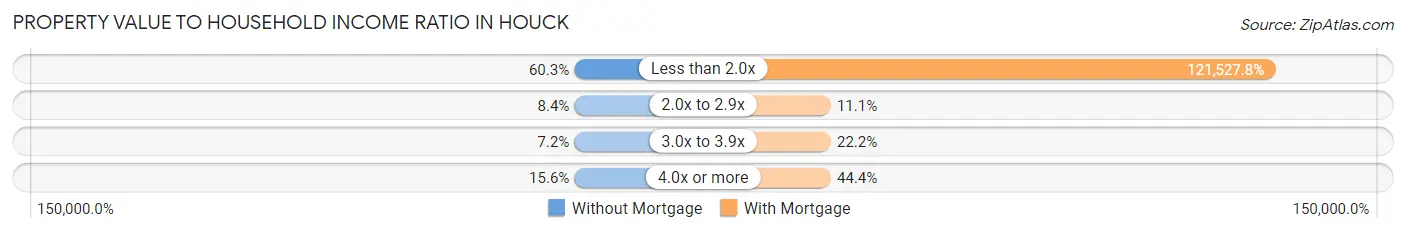
| Value-to-Income Ratio | Without Mortgage | With Mortgage |
| Less than 2.0x | 143 (60.3%) | 21,875 (121,527.8%) |
| 2.0x to 2.9x | 20 (8.4%) | 2 (11.1%) |
| 3.0x to 3.9x | 17 (7.2%) | 4 (22.2%) |
| 4.0x or more | 37 (15.6%) | 8 (44.4%) |
| Total | 237 (100.0%) | 18 (100.0%) |
Real Estate Taxes by Mortgage Status in Houck
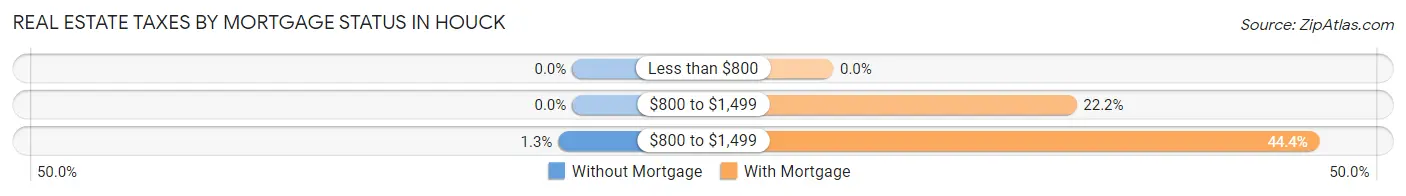
| Property Taxes | Without Mortgage | With Mortgage |
| Less than $800 | 0 (0.0%) | 0 (0.0%) |
| $800 to $1,499 | 0 (0.0%) | 4 (22.2%) |
| $800 to $1,499 | 3 (1.3%) | 8 (44.4%) |
| Total | 237 (100.0%) | 18 (100.0%) |
Health & Disability in Houck
Health Insurance Coverage by Age in Houck
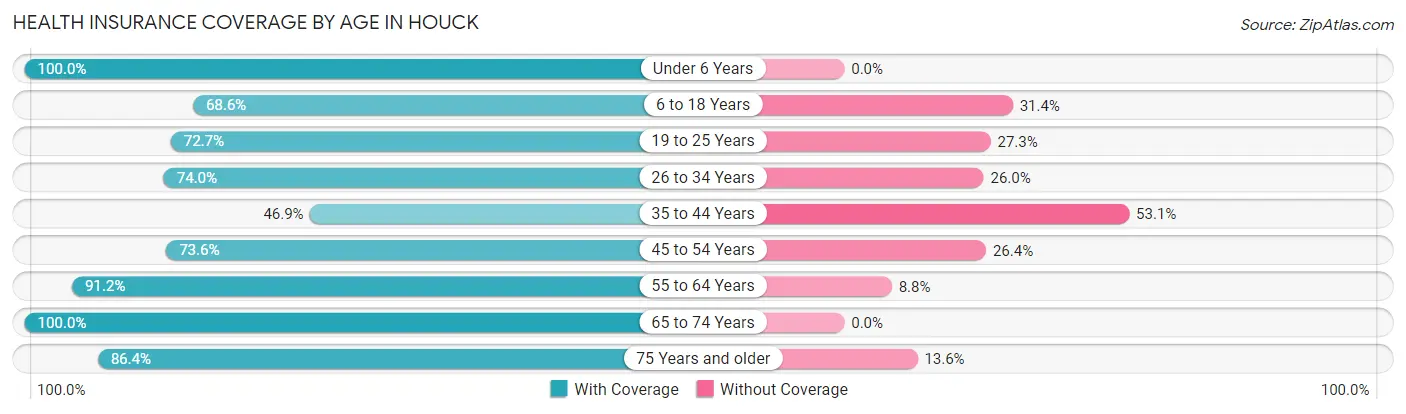
| Age Bracket | With Coverage | Without Coverage |
| Under 6 Years | 51 (100.0%) | 0 (0.0%) |
| 6 to 18 Years | 118 (68.6%) | 54 (31.4%) |
| 19 to 25 Years | 56 (72.7%) | 21 (27.3%) |
| 26 to 34 Years | 57 (74.0%) | 20 (26.0%) |
| 35 to 44 Years | 30 (46.9%) | 34 (53.1%) |
| 45 to 54 Years | 78 (73.6%) | 28 (26.4%) |
| 55 to 64 Years | 134 (91.2%) | 13 (8.8%) |
| 65 to 74 Years | 61 (100.0%) | 0 (0.0%) |
| 75 Years and older | 19 (86.4%) | 3 (13.6%) |
| Total | 604 (77.7%) | 173 (22.3%) |
Health Insurance Coverage by Citizenship Status in Houck
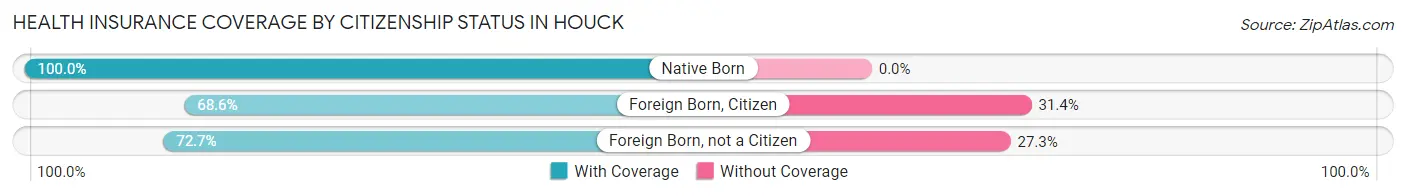
| Citizenship Status | With Coverage | Without Coverage |
| Native Born | 51 (100.0%) | 0 (0.0%) |
| Foreign Born, Citizen | 118 (68.6%) | 54 (31.4%) |
| Foreign Born, not a Citizen | 56 (72.7%) | 21 (27.3%) |
Health Insurance Coverage by Household Income in Houck
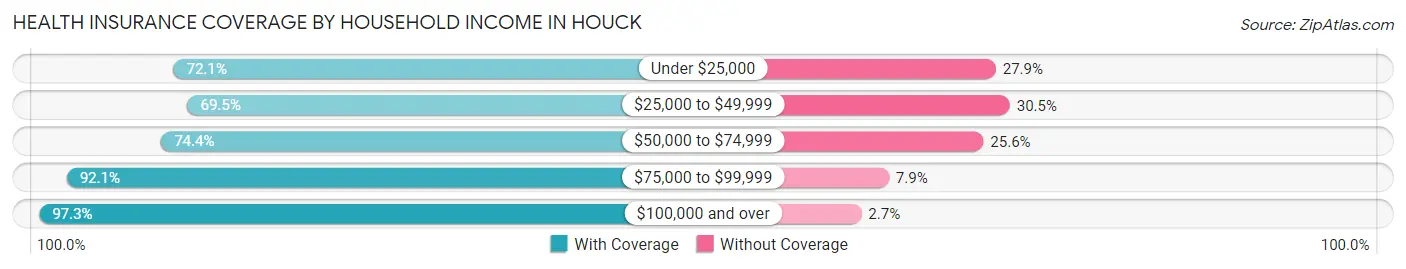
| Household Income | With Coverage | Without Coverage |
| Under $25,000 | 186 (72.1%) | 72 (27.9%) |
| $25,000 to $49,999 | 116 (69.5%) | 51 (30.5%) |
| $50,000 to $74,999 | 125 (74.4%) | 43 (25.6%) |
| $75,000 to $99,999 | 35 (92.1%) | 3 (7.9%) |
| $100,000 and over | 142 (97.3%) | 4 (2.7%) |
Public vs Private Health Insurance Coverage by Age in Houck
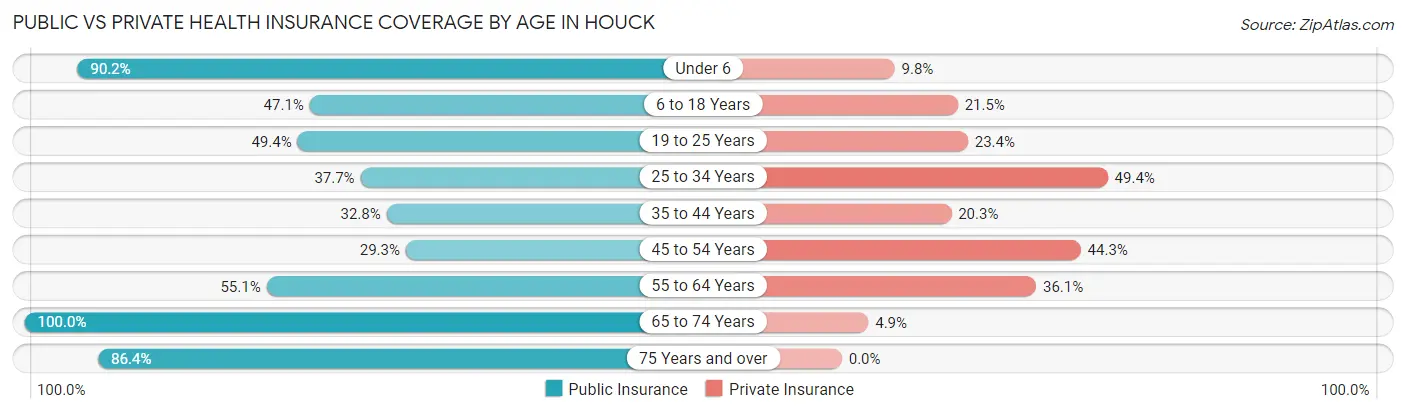
| Age Bracket | Public Insurance | Private Insurance |
| Under 6 | 46 (90.2%) | 5 (9.8%) |
| 6 to 18 Years | 81 (47.1%) | 37 (21.5%) |
| 19 to 25 Years | 38 (49.3%) | 18 (23.4%) |
| 25 to 34 Years | 29 (37.7%) | 38 (49.3%) |
| 35 to 44 Years | 21 (32.8%) | 13 (20.3%) |
| 45 to 54 Years | 31 (29.2%) | 47 (44.3%) |
| 55 to 64 Years | 81 (55.1%) | 53 (36.0%) |
| 65 to 74 Years | 61 (100.0%) | 3 (4.9%) |
| 75 Years and over | 19 (86.4%) | 0 (0.0%) |
| Total | 407 (52.4%) | 214 (27.5%) |
Disability Status by Sex by Age in Houck
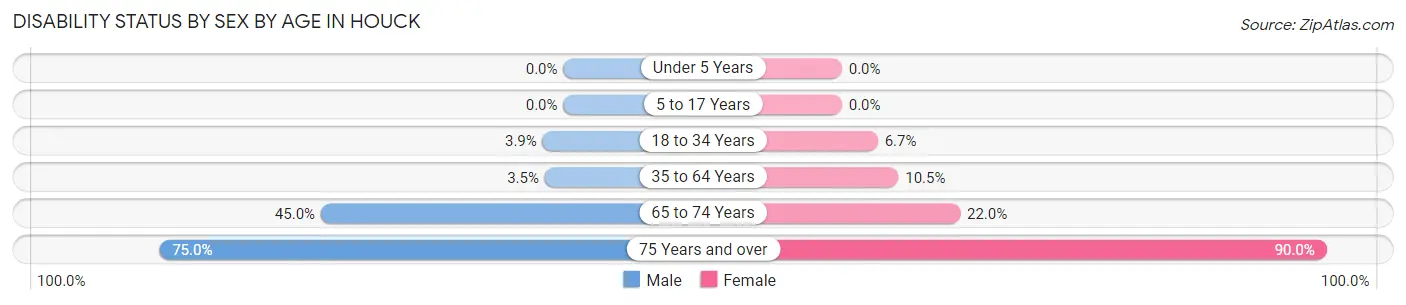
| Age Bracket | Male | Female |
| Under 5 Years | 0 (0.0%) | 0 (0.0%) |
| 5 to 17 Years | 0 (0.0%) | 0 (0.0%) |
| 18 to 34 Years | 2 (3.8%) | 9 (6.7%) |
| 35 to 64 Years | 6 (3.5%) | 15 (10.5%) |
| 65 to 74 Years | 9 (45.0%) | 9 (22.0%) |
| 75 Years and over | 9 (75.0%) | 9 (90.0%) |
Disability Class by Sex by Age in Houck
Disability Class: Hearing Difficulty
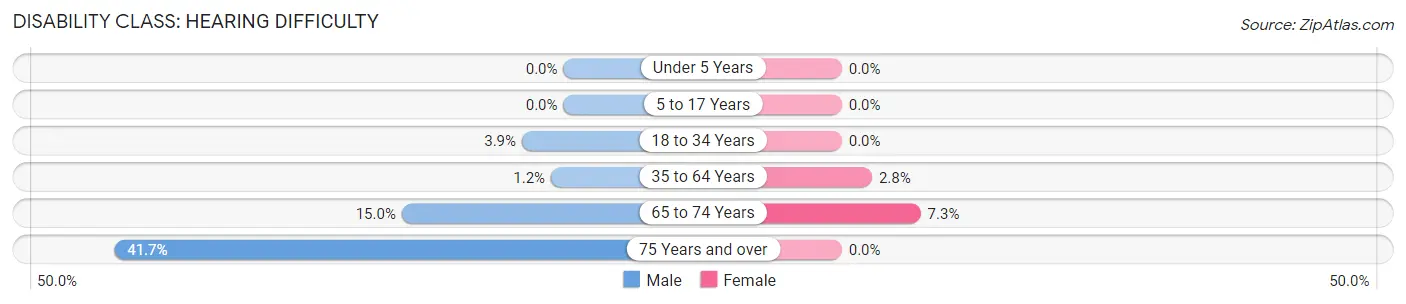
| Age Bracket | Male | Female |
| Under 5 Years | 0 (0.0%) | 0 (0.0%) |
| 5 to 17 Years | 0 (0.0%) | 0 (0.0%) |
| 18 to 34 Years | 2 (3.8%) | 0 (0.0%) |
| 35 to 64 Years | 2 (1.1%) | 4 (2.8%) |
| 65 to 74 Years | 3 (15.0%) | 3 (7.3%) |
| 75 Years and over | 5 (41.7%) | 0 (0.0%) |
Disability Class: Vision Difficulty
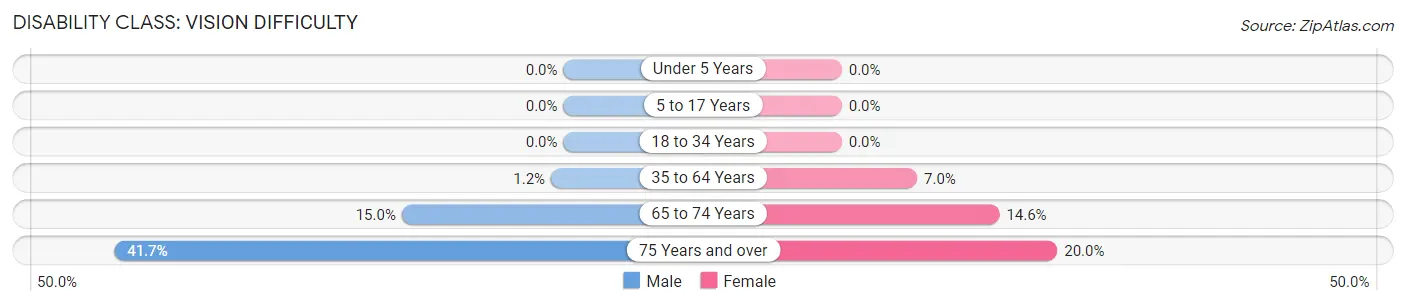
| Age Bracket | Male | Female |
| Under 5 Years | 0 (0.0%) | 0 (0.0%) |
| 5 to 17 Years | 0 (0.0%) | 0 (0.0%) |
| 18 to 34 Years | 0 (0.0%) | 0 (0.0%) |
| 35 to 64 Years | 2 (1.1%) | 10 (7.0%) |
| 65 to 74 Years | 3 (15.0%) | 6 (14.6%) |
| 75 Years and over | 5 (41.7%) | 2 (20.0%) |
Disability Class: Cognitive Difficulty
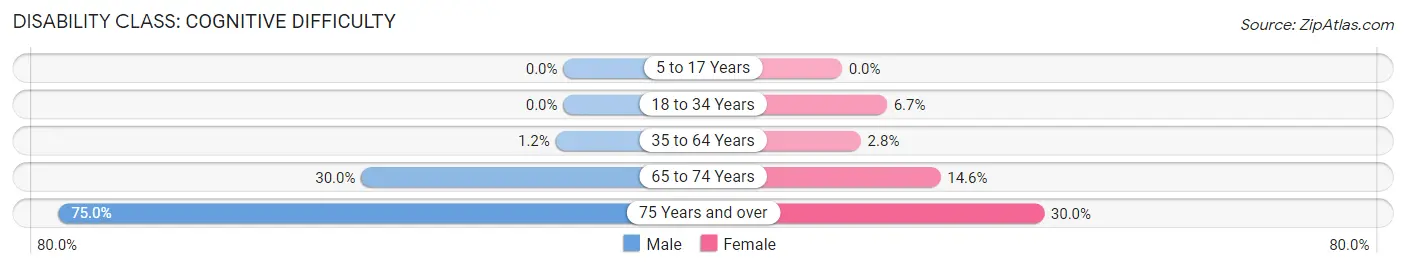
| Age Bracket | Male | Female |
| 5 to 17 Years | 0 (0.0%) | 0 (0.0%) |
| 18 to 34 Years | 0 (0.0%) | 9 (6.7%) |
| 35 to 64 Years | 2 (1.1%) | 4 (2.8%) |
| 65 to 74 Years | 6 (30.0%) | 6 (14.6%) |
| 75 Years and over | 9 (75.0%) | 3 (30.0%) |
Disability Class: Ambulatory Difficulty
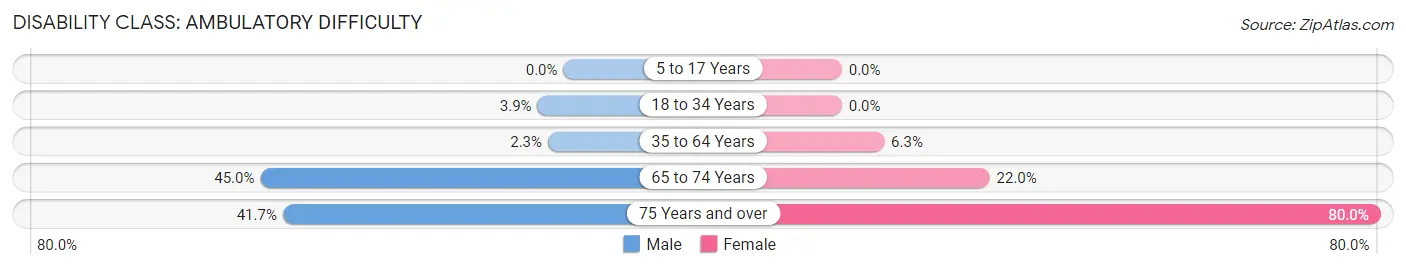
| Age Bracket | Male | Female |
| 5 to 17 Years | 0 (0.0%) | 0 (0.0%) |
| 18 to 34 Years | 2 (3.8%) | 0 (0.0%) |
| 35 to 64 Years | 4 (2.3%) | 9 (6.3%) |
| 65 to 74 Years | 9 (45.0%) | 9 (22.0%) |
| 75 Years and over | 5 (41.7%) | 8 (80.0%) |
Disability Class: Self-Care Difficulty
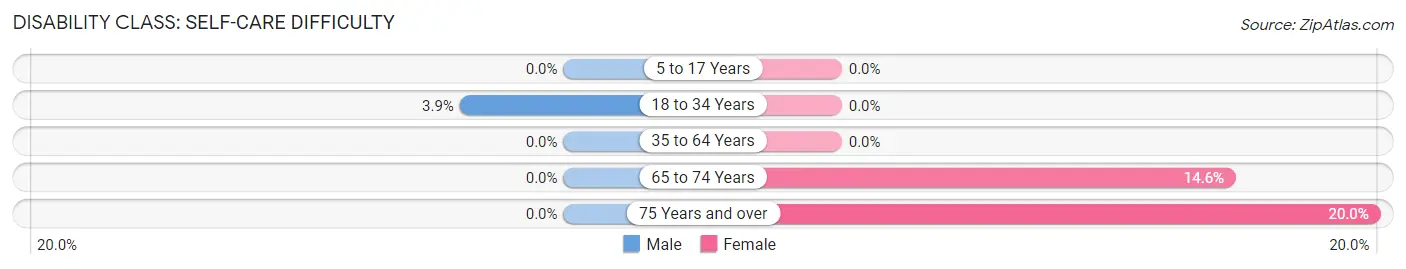
| Age Bracket | Male | Female |
| 5 to 17 Years | 0 (0.0%) | 0 (0.0%) |
| 18 to 34 Years | 2 (3.8%) | 0 (0.0%) |
| 35 to 64 Years | 0 (0.0%) | 0 (0.0%) |
| 65 to 74 Years | 0 (0.0%) | 6 (14.6%) |
| 75 Years and over | 0 (0.0%) | 2 (20.0%) |
Technology Access in Houck
Computing Device Access in Houck
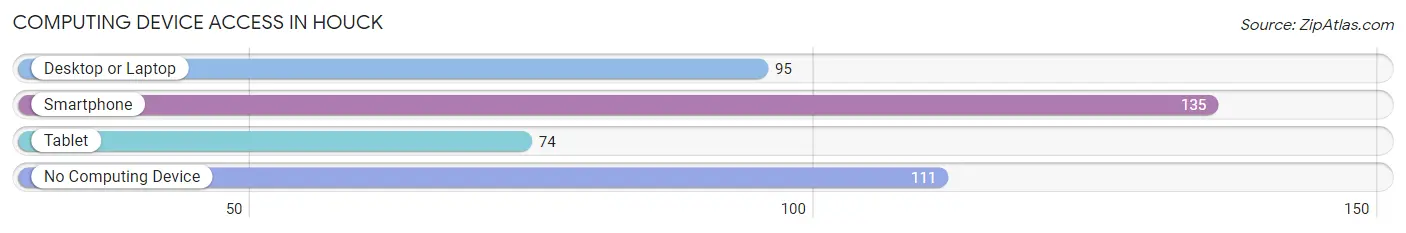
| Device Type | # Households | % Households |
| Desktop or Laptop | 95 | 36.0% |
| Smartphone | 135 | 51.1% |
| Tablet | 74 | 28.0% |
| No Computing Device | 111 | 42.0% |
| Total | 264 | 100.0% |
Internet Access in Houck
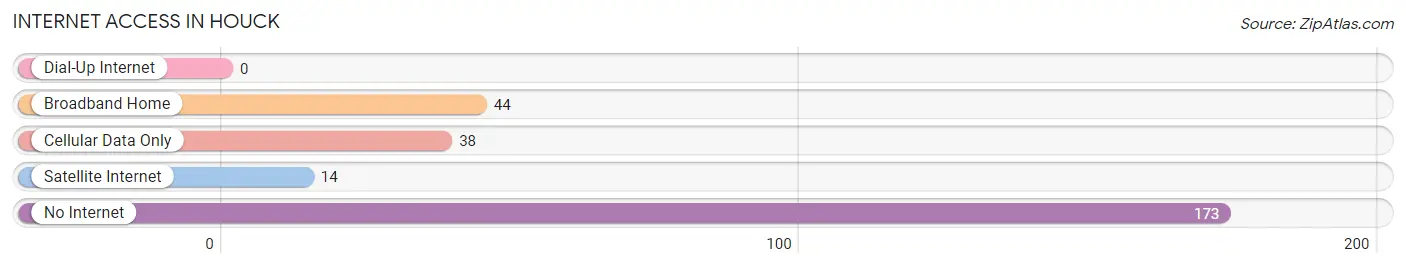
| Internet Type | # Households | % Households |
| Dial-Up Internet | 0 | 0.0% |
| Broadband Home | 44 | 16.7% |
| Cellular Data Only | 38 | 14.4% |
| Satellite Internet | 14 | 5.3% |
| No Internet | 173 | 65.5% |
| Total | 264 | 100.0% |
Houck Summary
Houck is a small unincorporated community located in Apache County, Arizona. It is situated in the Chuska Mountains, approximately 20 miles east of the Arizona-New Mexico border. The town is located on the Navajo Nation Reservation and is home to a population of approximately 1,000 people.
History
Houck was established in the late 1800s as a trading post for the Navajo people. The town was named after the Houck family, who were among the first settlers in the area. The Houcks were originally from Missouri and had moved to Arizona in search of a better life. The family opened a trading post in Houck, which quickly became a popular destination for the Navajo people.
In the early 1900s, Houck began to grow as a small community. The town was home to a post office, a school, a church, and several stores. The town also had a railroad station, which allowed for the transportation of goods and people to and from the area.
Geography
Houck is located in the Chuska Mountains, which are part of the Colorado Plateau. The town is situated at an elevation of 6,000 feet and is surrounded by rolling hills and mesas. The area is known for its stunning views of the surrounding landscape, which includes the Chuska Mountains, the San Juan Mountains, and the Grand Canyon.
The climate in Houck is semi-arid, with hot summers and cold winters. The average annual temperature is around 60 degrees Fahrenheit, with temperatures ranging from the low 30s in the winter to the high 90s in the summer. The area receives an average of 12 inches of precipitation per year, with most of it falling in the summer months.
Economy
The economy of Houck is largely based on agriculture and tourism. The town is home to several farms, which produce a variety of crops, including corn, wheat, and hay. The area is also known for its cattle ranching, which is a major source of income for many of the town’s residents.
Tourism is also an important part of the local economy. The town is home to several attractions, including the Chuska Mountains, the Grand Canyon, and the Navajo Nation Reservation. The area is also known for its outdoor activities, such as hiking, camping, and fishing.
Demographics
As of the 2010 census, the population of Houck was 1,000. The town is predominantly Native American, with the majority of the population being Navajo. The median age of the population is 33, and the median household income is $25,000. The town has a poverty rate of 28%, which is higher than the national average.
Houck is a small, rural community that is home to a diverse population. The town is known for its stunning views of the surrounding landscape and its rich cultural heritage. The town is also home to a variety of businesses and attractions, which make it an attractive destination for tourists and locals alike.
Common Questions
What is Per Capita Income in Houck?
Per Capita income in Houck is $14,929.
What is the Median Family Income in Houck?
Median Family Income in Houck is $32,105.
What is the Median Household income in Houck?
Median Household Income in Houck is $25,156.
What is Income or Wage Gap in Houck?
Income or Wage Gap in Houck is 8.9%.
Women in Houck earn 91.1 cents for every dollar earned by a man.
What is Family Income Deficit in Houck?
Family Income Deficit in Houck is $12,479.
Families that are below poverty line in Houck earn $12,479 less on average than the poverty threshold level.
What is Inequality or Gini Index in Houck?
Inequality or Gini Index in Houck is 0.48.
What is the Total Population of Houck?
Total Population of Houck is 777.
What is the Total Male Population of Houck?
Total Male Population of Houck is 358.
What is the Total Female Population of Houck?
Total Female Population of Houck is 419.
What is the Ratio of Males per 100 Females in Houck?
There are 85.44 Males per 100 Females in Houck.
What is the Ratio of Females per 100 Males in Houck?
There are 117.04 Females per 100 Males in Houck.
What is the Median Population Age in Houck?
Median Population Age in Houck is 36.9 Years.
What is the Average Family Size in Houck
Average Family Size in Houck is 4.2 People.
What is the Average Household Size in Houck
Average Household Size in Houck is 2.9 People.
How Large is the Labor Force in Houck?
There are 252 People in the Labor Forcein in Houck.
What is the Percentage of People in the Labor Force in Houck?
41.7% of People are in the Labor Force in Houck.
What is the Unemployment Rate in Houck?
Unemployment Rate in Houck is 4.0%.