Cottonwood, AZ Map & Demographics
Cottonwood Map
Cottonwood Overview
$29,166
PER CAPITA INCOME
$64,744
AVG FAMILY INCOME
$43,273
AVG HOUSEHOLD INCOME
25.0%
WAGE / INCOME GAP [ % ]
75.0¢/ $1
WAGE / INCOME GAP [ $ ]
0.45
INEQUALITY / GINI INDEX
12,314
TOTAL POPULATION
5,762
MALE POPULATION
6,552
FEMALE POPULATION
87.94
MALES / 100 FEMALES
113.71
FEMALES / 100 MALES
54.9
MEDIAN AGE
2.9
AVG FAMILY SIZE
1.9
AVG HOUSEHOLD SIZE
5,221
LABOR FORCE [ PEOPLE ]
48.6%
PERCENT IN LABOR FORCE
2.8%
UNEMPLOYMENT RATE
Cottonwood Zip Codes
Income in Cottonwood
Income Overview in Cottonwood
Per Capita Income in Cottonwood is $29,166, while median incomes of families and households are $64,744 and $43,273 respectively.
| Characteristic | Number | Measure |
| Per Capita Income | 12,314 | $29,166 |
| Median Family Income | 2,556 | $64,744 |
| Mean Family Income | 2,556 | $76,751 |
| Median Household Income | 6,217 | $43,273 |
| Mean Household Income | 6,217 | $57,530 |
| Income Deficit | 2,556 | $0 |
| Wage / Income Gap (%) | 12,314 | 25.02% |
| Wage / Income Gap ($) | 12,314 | 74.98¢ per $1 |
| Gini / Inequality Index | 12,314 | 0.45 |
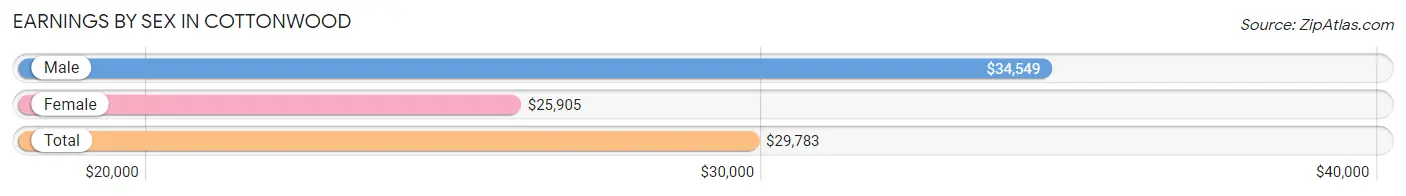
Earnings by Sex in Cottonwood
Average Earnings in Cottonwood are $29,783, $34,549 for men and $25,905 for women, a difference of 25.0%.
| Sex | Number | Average Earnings |
| Male | 2,849 (50.8%) | $34,549 |
| Female | 2,764 (49.2%) | $25,905 |
| Total | 5,613 (100.0%) | $29,783 |
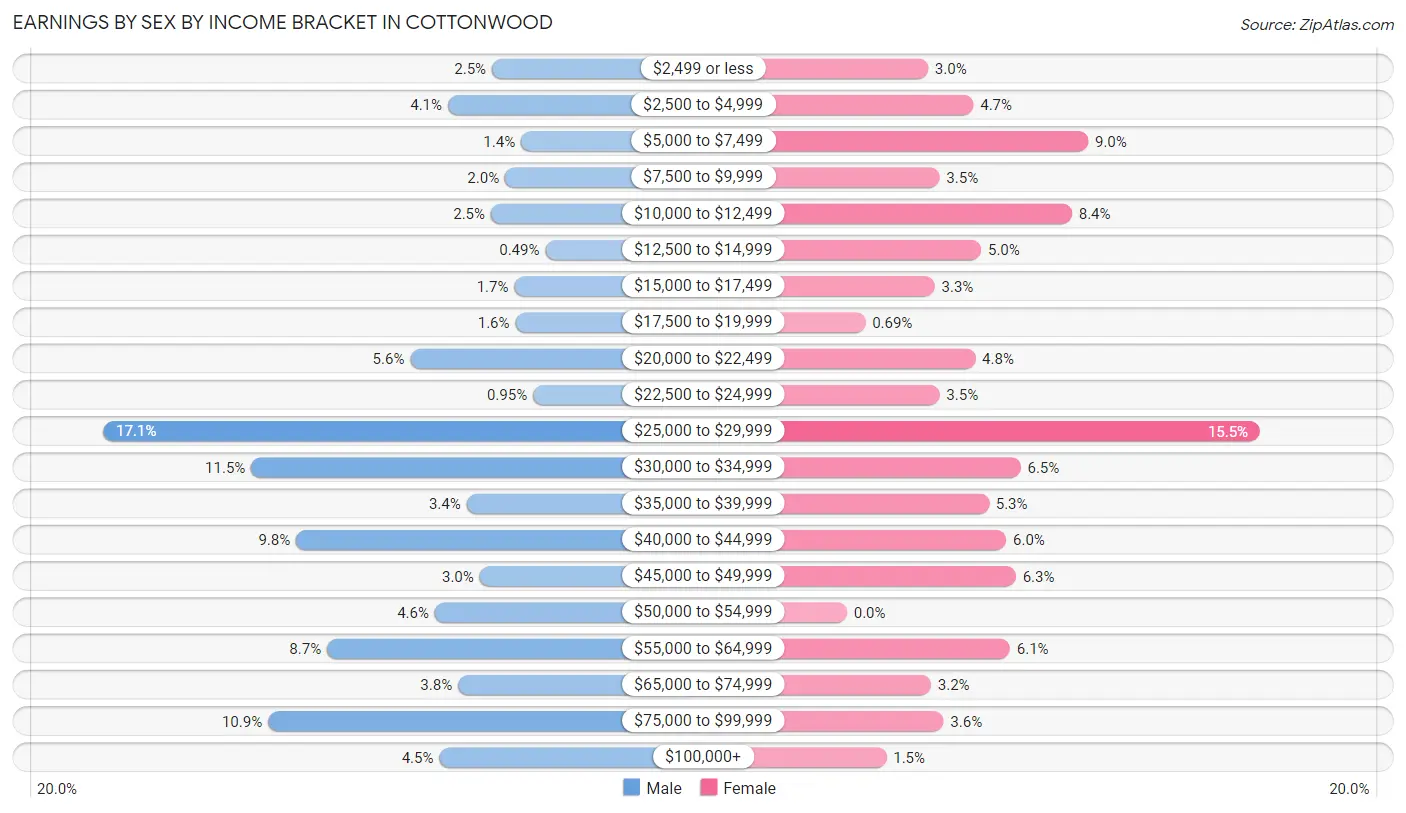
Earnings by Sex by Income Bracket in Cottonwood
The most common earnings brackets in Cottonwood are $25,000 to $29,999 for men (486 | 17.1%) and $25,000 to $29,999 for women (428 | 15.5%).
| Income | Male | Female |
| $2,499 or less | 71 (2.5%) | 84 (3.0%) |
| $2,500 to $4,999 | 118 (4.1%) | 131 (4.7%) |
| $5,000 to $7,499 | 40 (1.4%) | 250 (9.0%) |
| $7,500 to $9,999 | 57 (2.0%) | 96 (3.5%) |
| $10,000 to $12,499 | 72 (2.5%) | 233 (8.4%) |
| $12,500 to $14,999 | 14 (0.5%) | 139 (5.0%) |
| $15,000 to $17,499 | 47 (1.7%) | 91 (3.3%) |
| $17,500 to $19,999 | 46 (1.6%) | 19 (0.7%) |
| $20,000 to $22,499 | 158 (5.6%) | 133 (4.8%) |
| $22,500 to $24,999 | 27 (0.9%) | 96 (3.5%) |
| $25,000 to $29,999 | 486 (17.1%) | 428 (15.5%) |
| $30,000 to $34,999 | 328 (11.5%) | 180 (6.5%) |
| $35,000 to $39,999 | 98 (3.4%) | 147 (5.3%) |
| $40,000 to $44,999 | 280 (9.8%) | 165 (6.0%) |
| $45,000 to $49,999 | 84 (2.9%) | 175 (6.3%) |
| $50,000 to $54,999 | 132 (4.6%) | 0 (0.0%) |
| $55,000 to $64,999 | 247 (8.7%) | 169 (6.1%) |
| $65,000 to $74,999 | 107 (3.8%) | 87 (3.2%) |
| $75,000 to $99,999 | 310 (10.9%) | 100 (3.6%) |
| $100,000+ | 127 (4.5%) | 41 (1.5%) |
| Total | 2,849 (100.0%) | 2,764 (100.0%) |
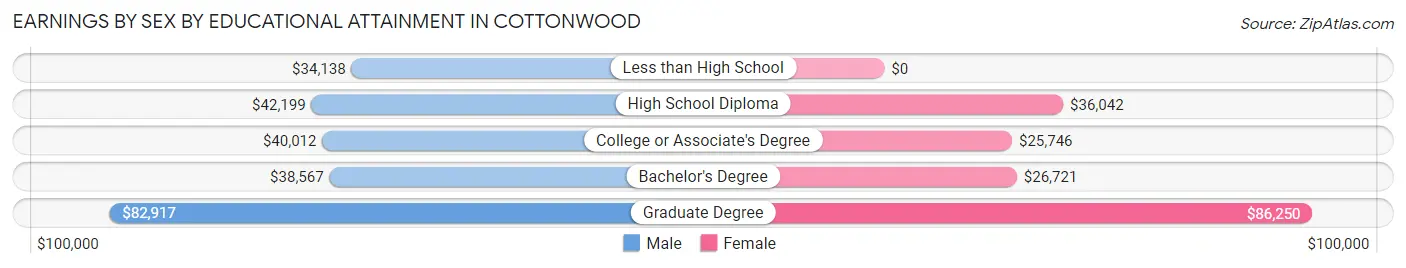
Earnings by Sex by Educational Attainment in Cottonwood
Average earnings in Cottonwood are $40,193 for men and $27,302 for women, a difference of 32.1%. Men with an educational attainment of graduate degree enjoy the highest average annual earnings of $82,917, while those with less than high school education earn the least with $34,138. Women with an educational attainment of graduate degree earn the most with the average annual earnings of $86,250, while those with college or associate's degree education have the smallest earnings of $25,746.
| Educational Attainment | Male Income | Female Income |
| Less than High School | $34,138 | $0 |
| High School Diploma | $42,199 | $36,042 |
| College or Associate's Degree | $40,012 | $25,746 |
| Bachelor's Degree | $38,567 | $26,721 |
| Graduate Degree | $82,917 | $86,250 |
| Total | $40,193 | $27,302 |
Family Income in Cottonwood
Family Income Brackets in Cottonwood
According to the Cottonwood family income data, there are 544 families falling into the $75,000 to $99,999 income range, which is the most common income bracket and makes up 21.3% of all families. Conversely, the $10,000 to $14,999 income bracket is the least frequent group with only 33 families (1.3%) belonging to this category.
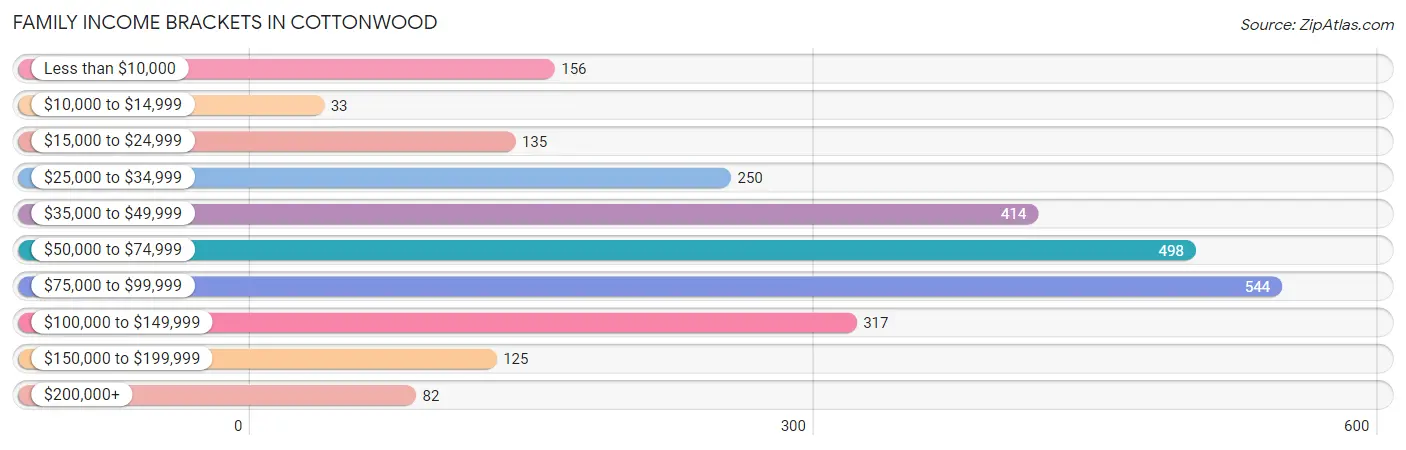
| Income Bracket | # Families | % Families |
| Less than $10,000 | 156 | 6.1% |
| $10,000 to $14,999 | 33 | 1.3% |
| $15,000 to $24,999 | 135 | 5.3% |
| $25,000 to $34,999 | 250 | 9.8% |
| $35,000 to $49,999 | 414 | 16.2% |
| $50,000 to $74,999 | 498 | 19.5% |
| $75,000 to $99,999 | 544 | 21.3% |
| $100,000 to $149,999 | 317 | 12.4% |
| $150,000 to $199,999 | 125 | 4.9% |
| $200,000+ | 82 | 3.2% |
Family Income by Famaliy Size in Cottonwood
4-person families (288 | 11.3%) account for the highest median family income in Cottonwood with $131,929 per family, while 4-person families (288 | 11.3%) have the highest median income of $32,982 per family member.
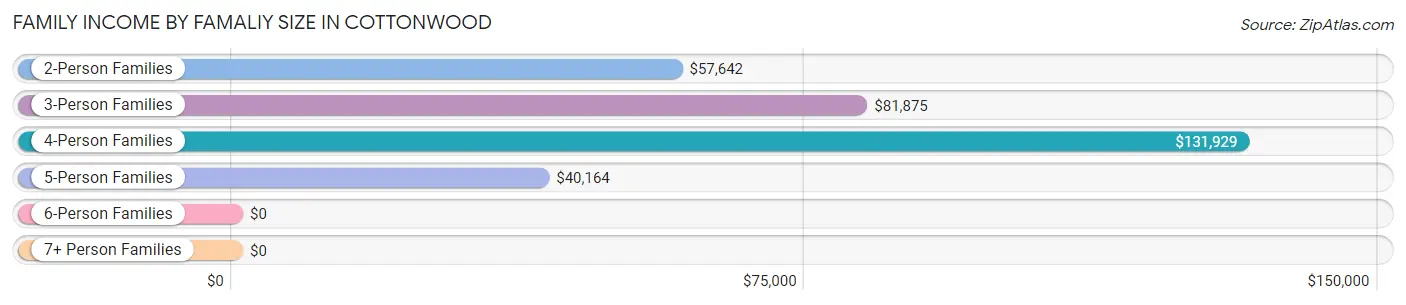
| Income Bracket | # Families | Median Income |
| 2-Person Families | 1,463 (57.2%) | $57,642 |
| 3-Person Families | 455 (17.8%) | $81,875 |
| 4-Person Families | 288 (11.3%) | $131,929 |
| 5-Person Families | 261 (10.2%) | $40,164 |
| 6-Person Families | 61 (2.4%) | $0 |
| 7+ Person Families | 28 (1.1%) | $0 |
| Total | 2,556 (100.0%) | $64,744 |
Family Income by Number of Earners in Cottonwood
The median family income in Cottonwood is $64,744, with families comprising 3+ earners (392) having the highest median family income of $90,985, while families with 1 earner (872) have the lowest median family income of $45,921, accounting for 15.3% and 34.1% of families, respectively.
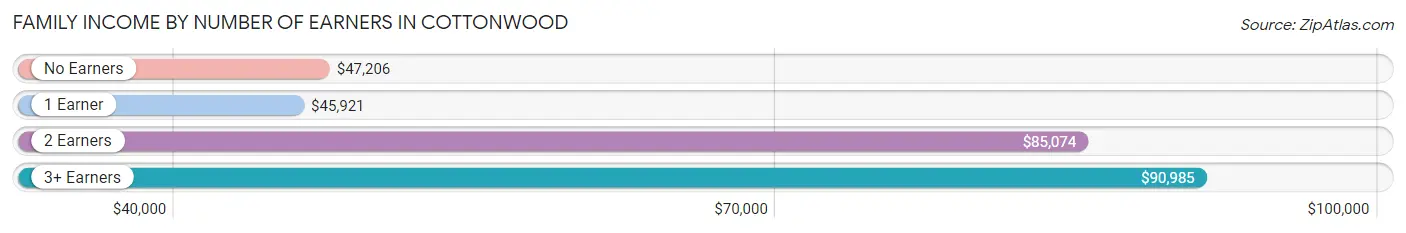
| Number of Earners | # Families | Median Income |
| No Earners | 662 (25.9%) | $47,206 |
| 1 Earner | 872 (34.1%) | $45,921 |
| 2 Earners | 630 (24.6%) | $85,074 |
| 3+ Earners | 392 (15.3%) | $90,985 |
| Total | 2,556 (100.0%) | $64,744 |
Household Income in Cottonwood
Household Income Brackets in Cottonwood
With 1,138 households falling in the category, the $50,000 to $74,999 income range is the most frequent in Cottonwood, accounting for 18.3% of all households. In contrast, only 99 households (1.6%) fall into the $200,000+ income bracket, making it the least populous group.
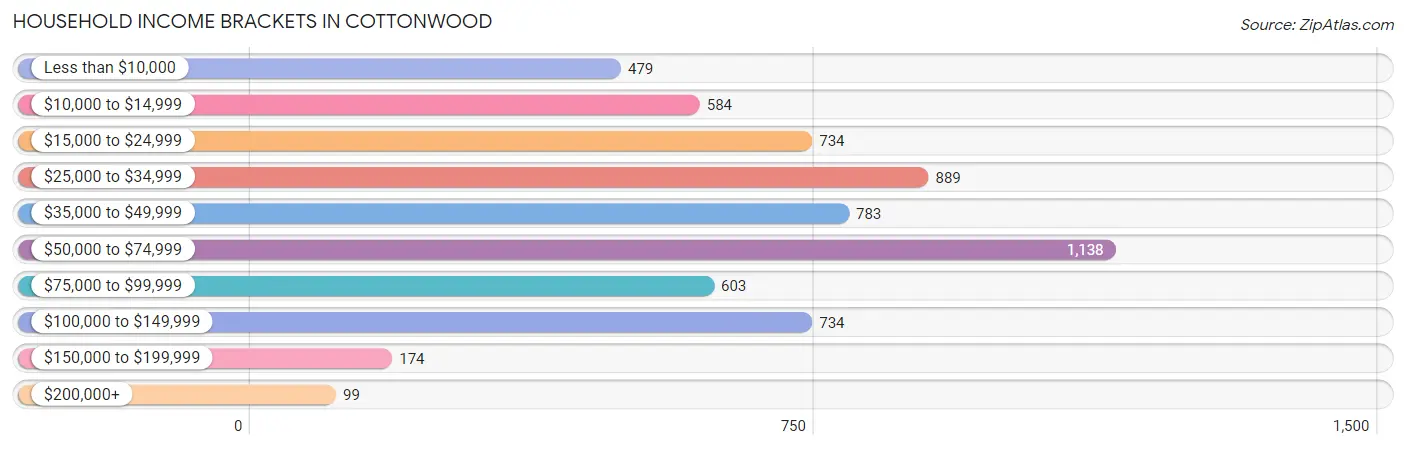
| Income Bracket | # Households | % Households |
| Less than $10,000 | 479 | 7.7% |
| $10,000 to $14,999 | 584 | 9.4% |
| $15,000 to $24,999 | 734 | 11.8% |
| $25,000 to $34,999 | 889 | 14.3% |
| $35,000 to $49,999 | 783 | 12.6% |
| $50,000 to $74,999 | 1,138 | 18.3% |
| $75,000 to $99,999 | 603 | 9.7% |
| $100,000 to $149,999 | 734 | 11.8% |
| $150,000 to $199,999 | 174 | 2.8% |
| $200,000+ | 99 | 1.6% |
Household Income by Householder Age in Cottonwood
The median household income in Cottonwood is $43,273, with the highest median household income of $74,643 found in the 25 to 44 years age bracket for the primary householder. A total of 1,272 households (20.5%) fall into this category. Meanwhile, the 15 to 24 years age bracket for the primary householder has the lowest median household income of $0, with 222 households (3.6%) in this group.
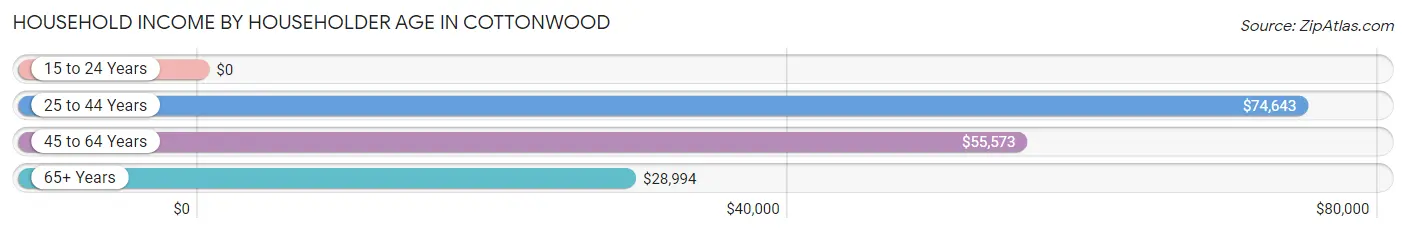
| Income Bracket | # Households | Median Income |
| 15 to 24 Years | 222 (3.6%) | $0 |
| 25 to 44 Years | 1,272 (20.5%) | $74,643 |
| 45 to 64 Years | 1,477 (23.8%) | $55,573 |
| 65+ Years | 3,246 (52.2%) | $28,994 |
| Total | 6,217 (100.0%) | $43,273 |
Poverty in Cottonwood
Income Below Poverty by Sex and Age in Cottonwood
With 18.1% poverty level for males and 22.6% for females among the residents of Cottonwood, under 5 year old males and under 5 year old females are the most vulnerable to poverty, with 173 males (40.1%) and 105 females (67.3%) in their respective age groups living below the poverty level.
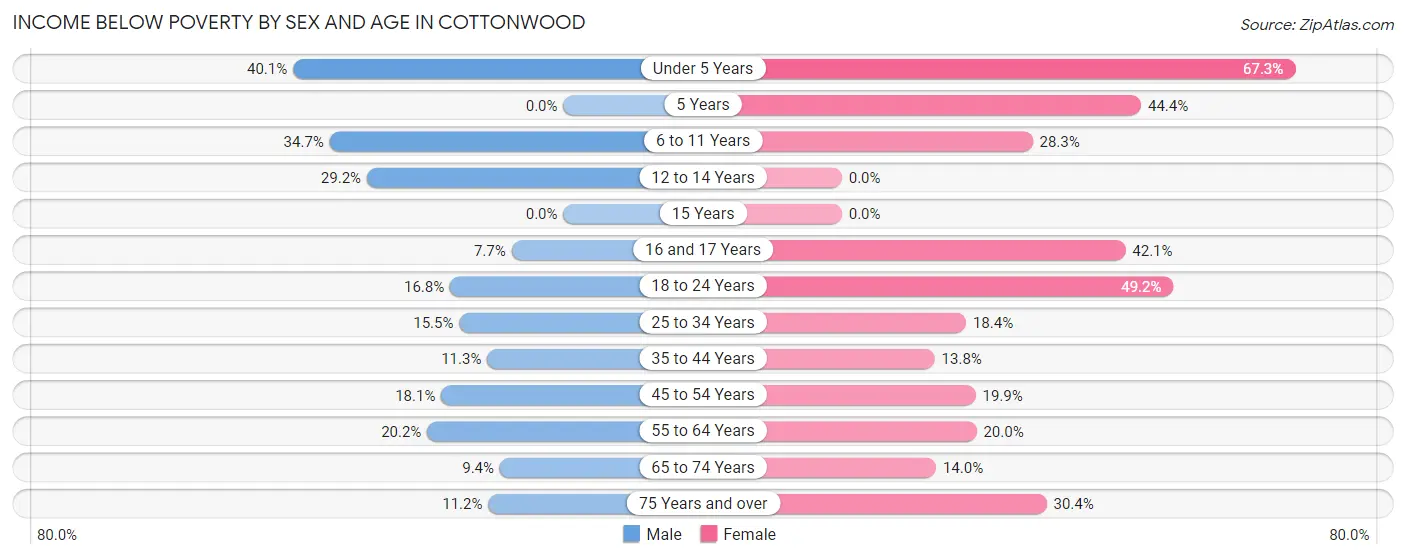
| Age Bracket | Male | Female |
| Under 5 Years | 173 (40.1%) | 105 (67.3%) |
| 5 Years | 0 (0.0%) | 16 (44.4%) |
| 6 to 11 Years | 110 (34.7%) | 64 (28.3%) |
| 12 to 14 Years | 56 (29.2%) | 0 (0.0%) |
| 15 Years | 0 (0.0%) | 0 (0.0%) |
| 16 and 17 Years | 10 (7.7%) | 64 (42.1%) |
| 18 to 24 Years | 71 (16.8%) | 157 (49.2%) |
| 25 to 34 Years | 53 (15.4%) | 125 (18.4%) |
| 35 to 44 Years | 93 (11.3%) | 103 (13.8%) |
| 45 to 54 Years | 103 (18.1%) | 85 (19.9%) |
| 55 to 64 Years | 225 (20.2%) | 174 (20.0%) |
| 65 to 74 Years | 70 (9.4%) | 208 (14.0%) |
| 75 Years and over | 69 (11.2%) | 376 (30.4%) |
| Total | 1,033 (18.1%) | 1,477 (22.6%) |
Income Above Poverty by Sex and Age in Cottonwood
According to the poverty statistics in Cottonwood, males aged 16 and 17 years and females aged 12 to 14 years are the age groups that are most secure financially, with 92.3% of males and 100.0% of females in these age groups living above the poverty line.
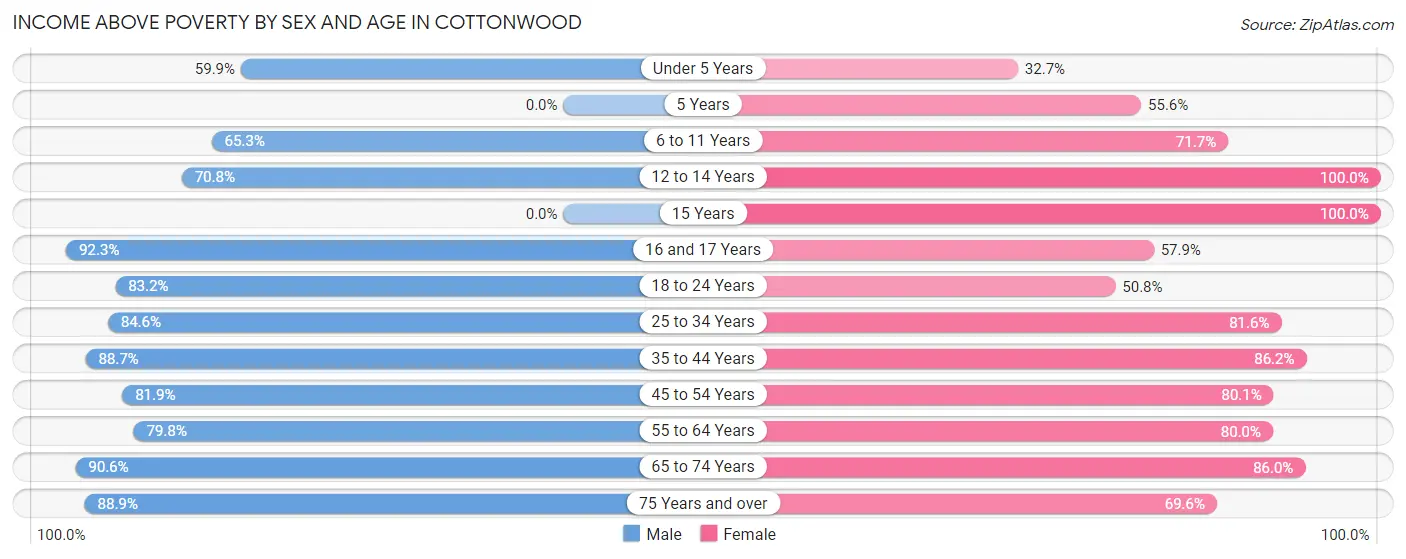
| Age Bracket | Male | Female |
| Under 5 Years | 258 (59.9%) | 51 (32.7%) |
| 5 Years | 0 (0.0%) | 20 (55.6%) |
| 6 to 11 Years | 207 (65.3%) | 162 (71.7%) |
| 12 to 14 Years | 136 (70.8%) | 104 (100.0%) |
| 15 Years | 0 (0.0%) | 110 (100.0%) |
| 16 and 17 Years | 120 (92.3%) | 88 (57.9%) |
| 18 to 24 Years | 351 (83.2%) | 162 (50.8%) |
| 25 to 34 Years | 290 (84.6%) | 553 (81.6%) |
| 35 to 44 Years | 730 (88.7%) | 644 (86.2%) |
| 45 to 54 Years | 465 (81.9%) | 343 (80.1%) |
| 55 to 64 Years | 888 (79.8%) | 696 (80.0%) |
| 65 to 74 Years | 672 (90.6%) | 1,279 (86.0%) |
| 75 Years and over | 550 (88.8%) | 861 (69.6%) |
| Total | 4,667 (81.9%) | 5,073 (77.4%) |
Income Below Poverty Among Married-Couple Families in Cottonwood
The poverty statistics for married-couple families in Cottonwood show that 8.0% or 151 of the total 1,885 families live below the poverty line. Families with 3 or 4 children have the highest poverty rate of 34.1%, comprising of 47 families. On the other hand, families with 1 or 2 children have the lowest poverty rate of 5.2%, which includes 19 families.
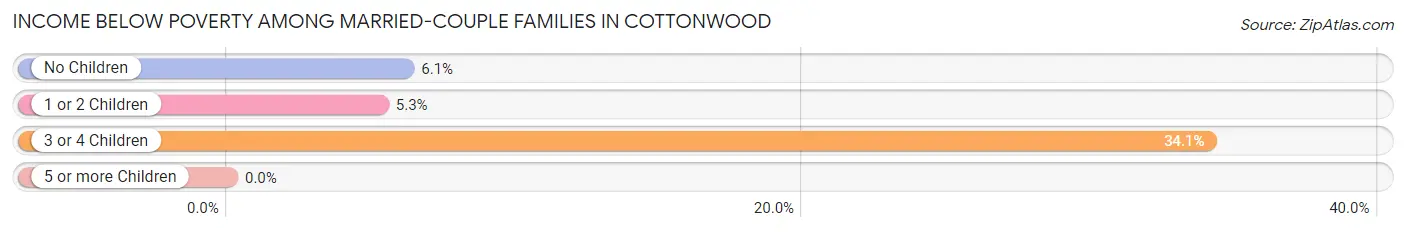
| Children | Above Poverty | Below Poverty |
| No Children | 1,300 (93.9%) | 85 (6.1%) |
| 1 or 2 Children | 343 (94.8%) | 19 (5.2%) |
| 3 or 4 Children | 91 (65.9%) | 47 (34.1%) |
| 5 or more Children | 0 (0.0%) | 0 (0.0%) |
| Total | 1,734 (92.0%) | 151 (8.0%) |
Income Below Poverty Among Single-Parent Households in Cottonwood
According to the poverty data in Cottonwood, 35.8% or 62 single-father households and 31.9% or 159 single-mother households are living below the poverty line. Among single-father households, those with 3 or 4 children have the highest poverty rate, with 62 households (100.0%) experiencing poverty. Likewise, among single-mother households, those with 1 or 2 children have the highest poverty rate, with 107 households (44.0%) falling below the poverty line.
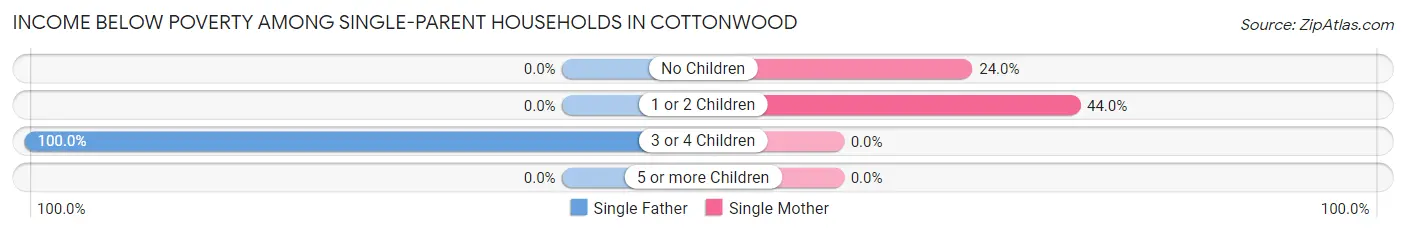
| Children | Single Father | Single Mother |
| No Children | 0 (0.0%) | 52 (24.0%) |
| 1 or 2 Children | 0 (0.0%) | 107 (44.0%) |
| 3 or 4 Children | 62 (100.0%) | 0 (0.0%) |
| 5 or more Children | 0 (0.0%) | 0 (0.0%) |
| Total | 62 (35.8%) | 159 (31.9%) |
Income Below Poverty Among Married-Couple vs Single-Parent Households in Cottonwood
The poverty data for Cottonwood shows that 151 of the married-couple family households (8.0%) and 221 of the single-parent households (32.9%) are living below the poverty level. Within the married-couple family households, those with 3 or 4 children have the highest poverty rate, with 47 households (34.1%) falling below the poverty line. Among the single-parent households, those with 3 or 4 children have the highest poverty rate, with 62 household (62.0%) living below poverty.
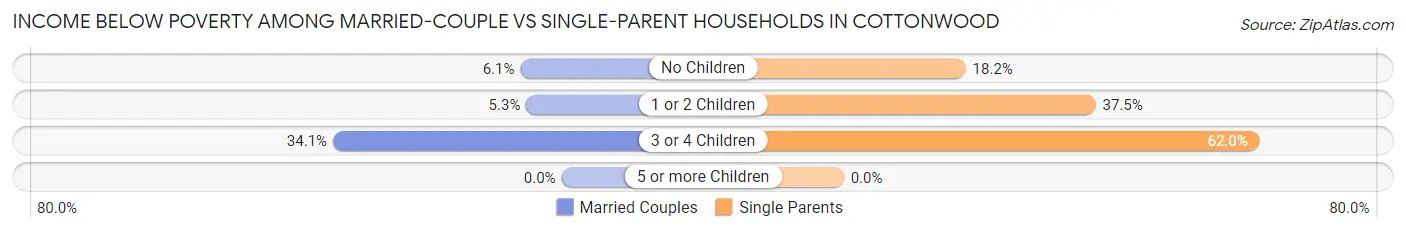
| Children | Married-Couple Families | Single-Parent Households |
| No Children | 85 (6.1%) | 52 (18.2%) |
| 1 or 2 Children | 19 (5.2%) | 107 (37.5%) |
| 3 or 4 Children | 47 (34.1%) | 62 (62.0%) |
| 5 or more Children | 0 (0.0%) | 0 (0.0%) |
| Total | 151 (8.0%) | 221 (32.9%) |
Race in Cottonwood
The most populous races in Cottonwood are White / Caucasian (10,400 | 84.5%), Hispanic or Latino (2,275 | 18.5%), and Two or more Races (1,158 | 9.4%).
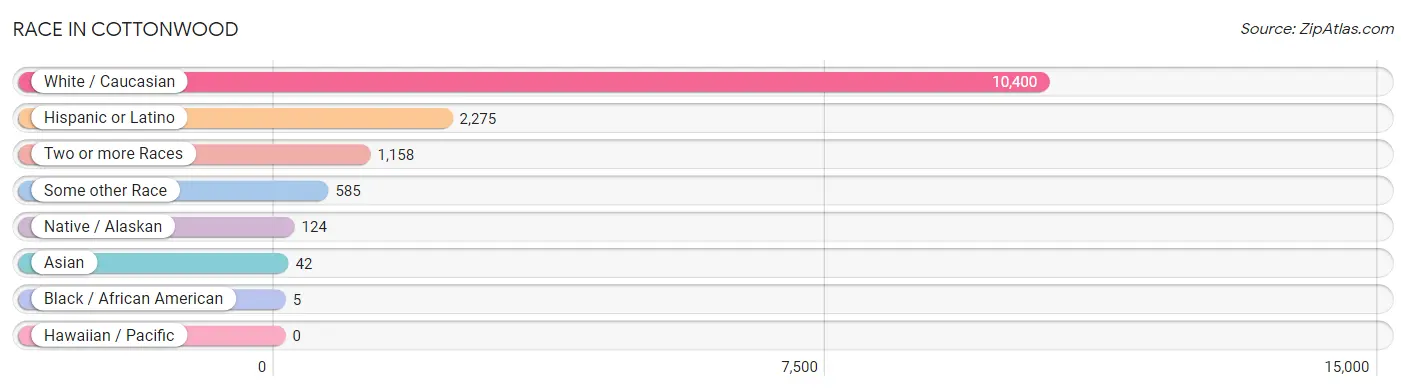
| Race | # Population | % Population |
| Asian | 42 | 0.3% |
| Black / African American | 5 | 0.0% |
| Hawaiian / Pacific | 0 | 0.0% |
| Hispanic or Latino | 2,275 | 18.5% |
| Native / Alaskan | 124 | 1.0% |
| White / Caucasian | 10,400 | 84.5% |
| Two or more Races | 1,158 | 9.4% |
| Some other Race | 585 | 4.8% |
| Total | 12,314 | 100.0% |
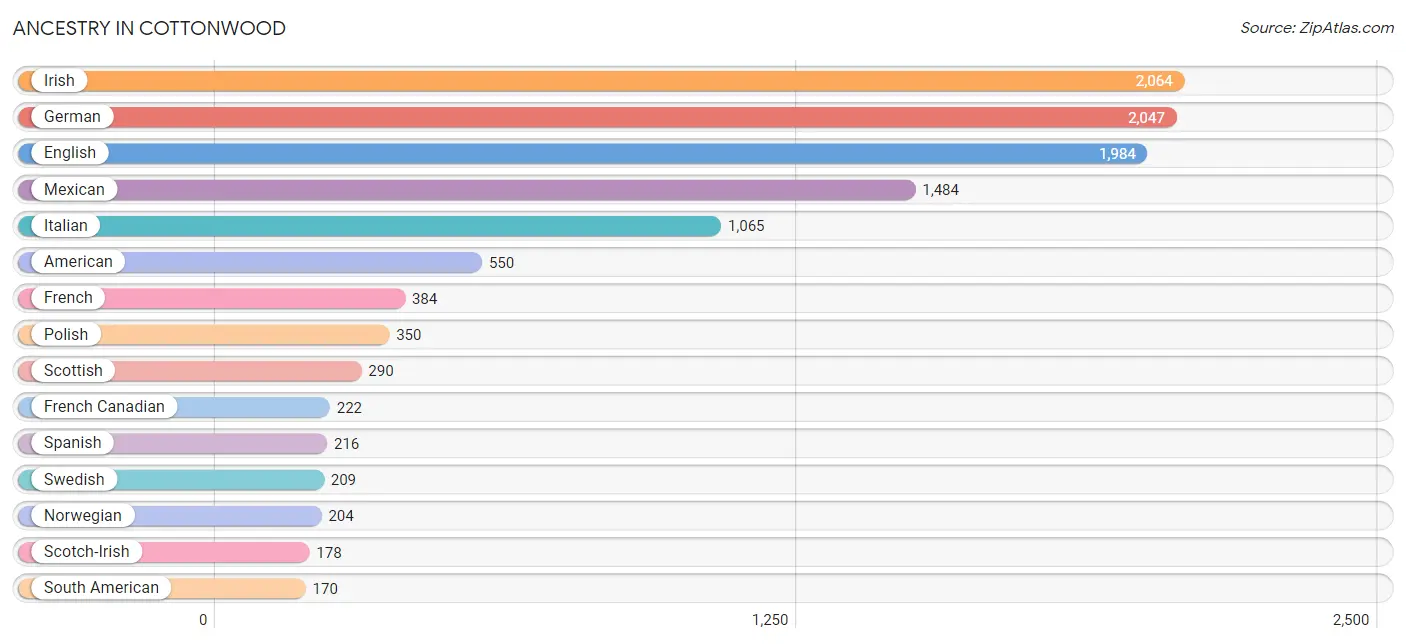
Ancestry in Cottonwood
The most populous ancestries reported in Cottonwood are Irish (2,064 | 16.8%), German (2,047 | 16.6%), English (1,984 | 16.1%), Mexican (1,484 | 12.0%), and Italian (1,065 | 8.6%), together accounting for 70.2% of all Cottonwood residents.
| Ancestry | # Population | % Population |
| American | 550 | 4.5% |
| Apache | 40 | 0.3% |
| Arab | 26 | 0.2% |
| Belgian | 83 | 0.7% |
| Bhutanese | 61 | 0.5% |
| Blackfeet | 4 | 0.0% |
| British | 25 | 0.2% |
| Cambodian | 23 | 0.2% |
| Canadian | 59 | 0.5% |
| Central American | 50 | 0.4% |
| Cheyenne | 39 | 0.3% |
| Chilean | 56 | 0.4% |
| Choctaw | 74 | 0.6% |
| Comanche | 19 | 0.2% |
| Cuban | 115 | 0.9% |
| Czech | 79 | 0.6% |
| Danish | 124 | 1.0% |
| Dutch | 91 | 0.7% |
| English | 1,984 | 16.1% |
| European | 109 | 0.9% |
| Finnish | 54 | 0.4% |
| French | 384 | 3.1% |
| French American Indian | 26 | 0.2% |
| French Canadian | 222 | 1.8% |
| German | 2,047 | 16.6% |
| Greek | 26 | 0.2% |
| Guamanian / Chamorro | 25 | 0.2% |
| Honduran | 50 | 0.4% |
| Hungarian | 38 | 0.3% |
| Irish | 2,064 | 16.8% |
| Iroquois | 111 | 0.9% |
| Italian | 1,065 | 8.6% |
| Jordanian | 26 | 0.2% |
| Lithuanian | 27 | 0.2% |
| Mexican | 1,484 | 12.0% |
| Native Hawaiian | 50 | 0.4% |
| Navajo | 59 | 0.5% |
| Northern European | 17 | 0.1% |
| Norwegian | 204 | 1.7% |
| Pakistani | 31 | 0.3% |
| Peruvian | 114 | 0.9% |
| Polish | 350 | 2.8% |
| Portuguese | 84 | 0.7% |
| Puerto Rican | 49 | 0.4% |
| Russian | 51 | 0.4% |
| Samoan | 19 | 0.2% |
| Scandinavian | 8 | 0.1% |
| Scotch-Irish | 178 | 1.5% |
| Scottish | 290 | 2.4% |
| Slavic | 21 | 0.2% |
| Slovak | 10 | 0.1% |
| South African | 19 | 0.2% |
| South American | 170 | 1.4% |
| Spaniard | 16 | 0.1% |
| Spanish | 216 | 1.8% |
| Subsaharan African | 19 | 0.2% |
| Swedish | 209 | 1.7% |
| Swiss | 107 | 0.9% |
| Tohono O'Odham | 111 | 0.9% |
| Ukrainian | 51 | 0.4% |
| Welsh | 84 | 0.7% |
| Yugoslavian | 72 | 0.6% | View All 62 Rows |
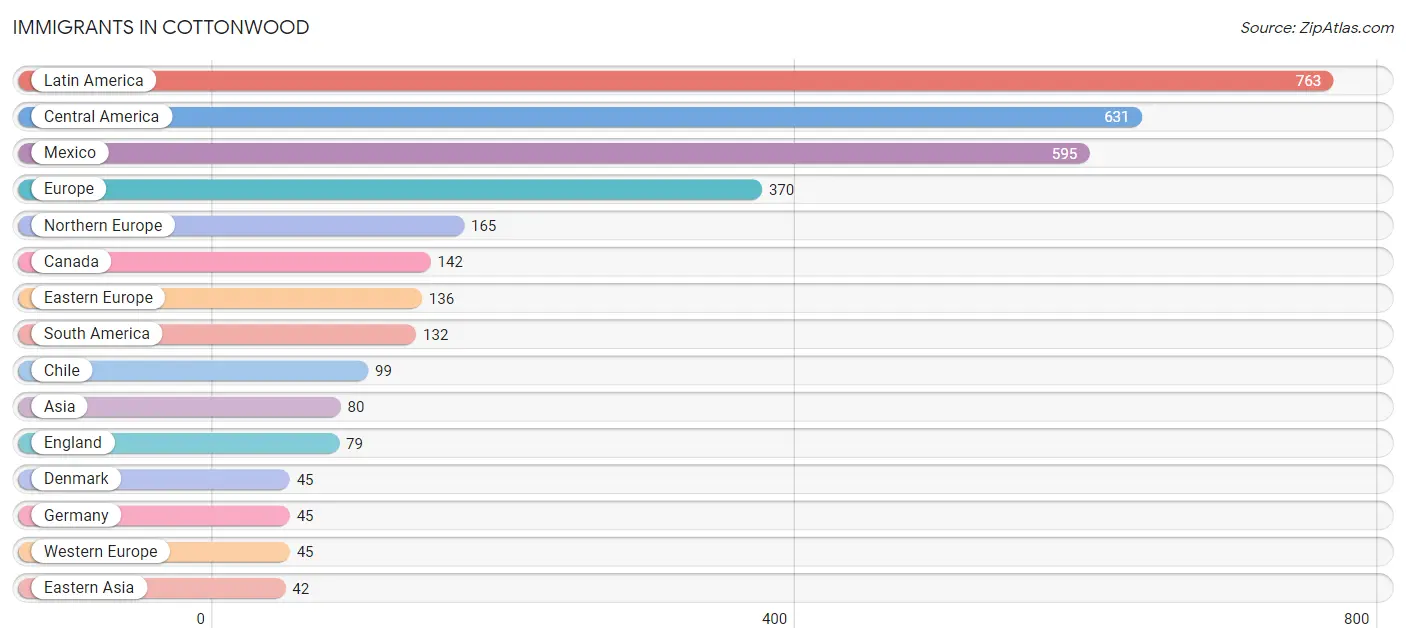
Immigrants in Cottonwood
The most numerous immigrant groups reported in Cottonwood came from Latin America (763 | 6.2%), Central America (631 | 5.1%), Mexico (595 | 4.8%), Europe (370 | 3.0%), and Northern Europe (165 | 1.3%), together accounting for 20.5% of all Cottonwood residents.
| Immigration Origin | # Population | % Population |
| Africa | 39 | 0.3% |
| Asia | 80 | 0.6% |
| Australia | 25 | 0.2% |
| Canada | 142 | 1.1% |
| Central America | 631 | 5.1% |
| Chile | 99 | 0.8% |
| Czechoslovakia | 19 | 0.2% |
| Denmark | 45 | 0.4% |
| Eastern Asia | 42 | 0.3% |
| Eastern Europe | 136 | 1.1% |
| England | 79 | 0.6% |
| Europe | 370 | 3.0% |
| Germany | 45 | 0.4% |
| Honduras | 36 | 0.3% |
| Italy | 24 | 0.2% |
| Japan | 42 | 0.3% |
| Latin America | 763 | 6.2% |
| Mexico | 595 | 4.8% |
| Northern Europe | 165 | 1.3% |
| Oceania | 25 | 0.2% |
| Peru | 33 | 0.3% |
| Russia | 23 | 0.2% |
| Scotland | 41 | 0.3% |
| South Africa | 39 | 0.3% |
| South America | 132 | 1.1% |
| Southern Europe | 24 | 0.2% |
| Syria | 38 | 0.3% |
| Ukraine | 22 | 0.2% |
| Western Asia | 38 | 0.3% |
| Western Europe | 45 | 0.4% | View All 30 Rows |
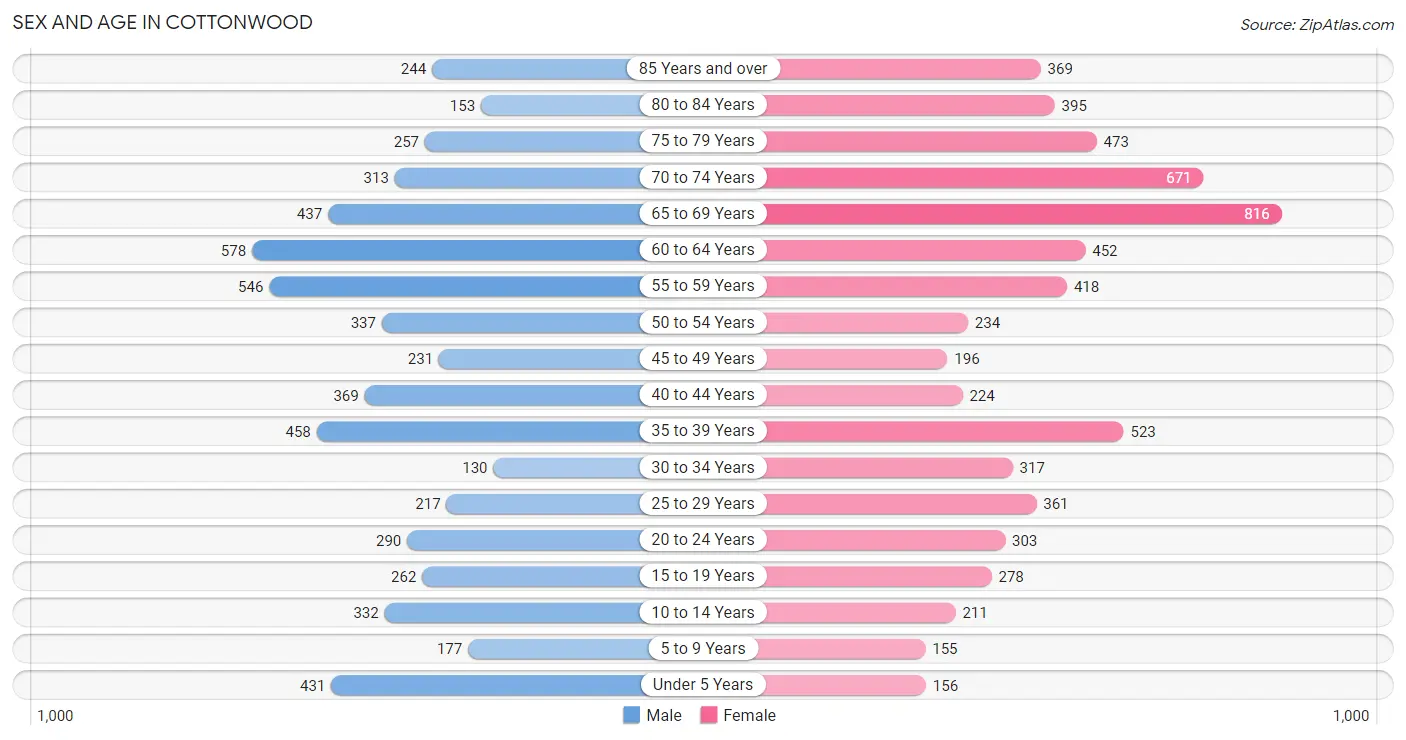
Sex and Age in Cottonwood
Sex and Age in Cottonwood
The most populous age groups in Cottonwood are 60 to 64 Years (578 | 10.0%) for men and 65 to 69 Years (816 | 12.4%) for women.
| Age Bracket | Male | Female |
| Under 5 Years | 431 (7.5%) | 156 (2.4%) |
| 5 to 9 Years | 177 (3.1%) | 155 (2.4%) |
| 10 to 14 Years | 332 (5.8%) | 211 (3.2%) |
| 15 to 19 Years | 262 (4.5%) | 278 (4.2%) |
| 20 to 24 Years | 290 (5.0%) | 303 (4.6%) |
| 25 to 29 Years | 217 (3.8%) | 361 (5.5%) |
| 30 to 34 Years | 130 (2.3%) | 317 (4.8%) |
| 35 to 39 Years | 458 (8.0%) | 523 (8.0%) |
| 40 to 44 Years | 369 (6.4%) | 224 (3.4%) |
| 45 to 49 Years | 231 (4.0%) | 196 (3.0%) |
| 50 to 54 Years | 337 (5.9%) | 234 (3.6%) |
| 55 to 59 Years | 546 (9.5%) | 418 (6.4%) |
| 60 to 64 Years | 578 (10.0%) | 452 (6.9%) |
| 65 to 69 Years | 437 (7.6%) | 816 (12.4%) |
| 70 to 74 Years | 313 (5.4%) | 671 (10.2%) |
| 75 to 79 Years | 257 (4.5%) | 473 (7.2%) |
| 80 to 84 Years | 153 (2.7%) | 395 (6.0%) |
| 85 Years and over | 244 (4.2%) | 369 (5.6%) |
| Total | 5,762 (100.0%) | 6,552 (100.0%) |
Families and Households in Cottonwood
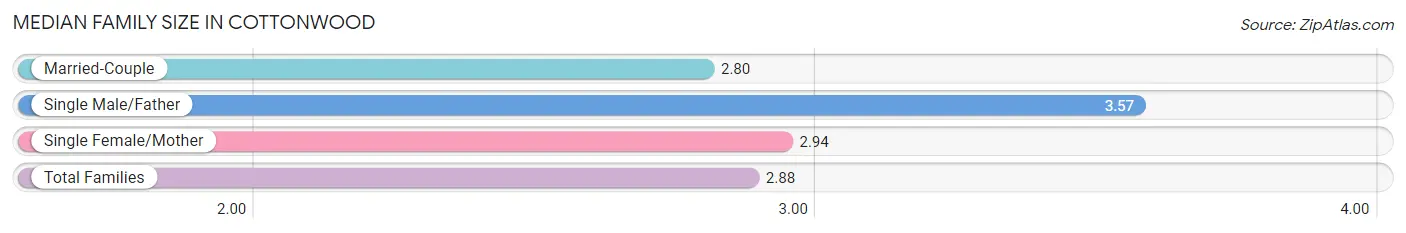
Median Family Size in Cottonwood
The median family size in Cottonwood is 2.88 persons per family, with single male/father families (173 | 6.8%) accounting for the largest median family size of 3.57 persons per family. On the other hand, married-couple families (1,885 | 73.8%) represent the smallest median family size with 2.80 persons per family.
| Family Type | # Families | Family Size |
| Married-Couple | 1,885 (73.8%) | 2.80 |
| Single Male/Father | 173 (6.8%) | 3.57 |
| Single Female/Mother | 498 (19.5%) | 2.94 |
| Total Families | 2,556 (100.0%) | 2.88 |
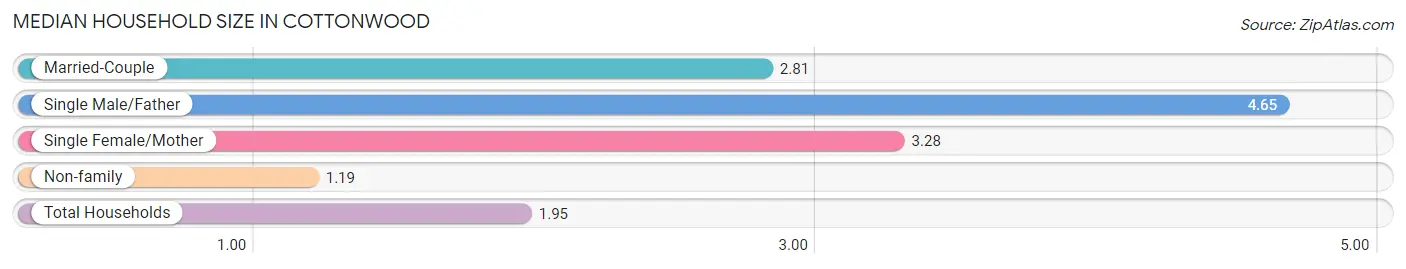
Median Household Size in Cottonwood
The median household size in Cottonwood is 1.95 persons per household, with single male/father households (173 | 2.8%) accounting for the largest median household size of 4.65 persons per household. non-family households (3,661 | 58.9%) represent the smallest median household size with 1.19 persons per household.
| Household Type | # Households | Household Size |
| Married-Couple | 1,885 (30.3%) | 2.81 |
| Single Male/Father | 173 (2.8%) | 4.65 |
| Single Female/Mother | 498 (8.0%) | 3.28 |
| Non-family | 3,661 (58.9%) | 1.19 |
| Total Households | 6,217 (100.0%) | 1.95 |
Household Size by Marriage Status in Cottonwood
Out of a total of 6,217 households in Cottonwood, 2,556 (41.1%) are family households, while 3,661 (58.9%) are nonfamily households. The most numerous type of family households are 2-person households, comprising 1,338, and the most common type of nonfamily households are 1-person households, comprising 3,049.
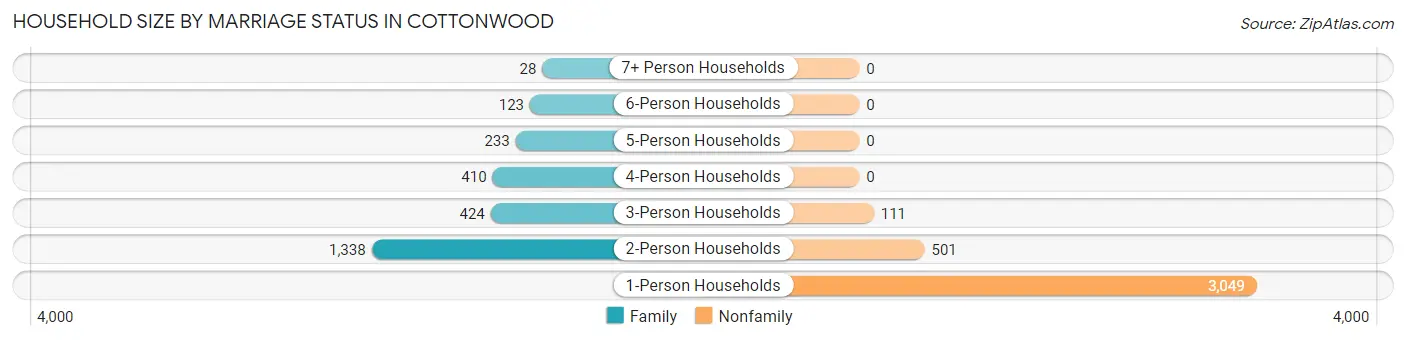
| Household Size | Family Households | Nonfamily Households |
| 1-Person Households | - | 3,049 (49.0%) |
| 2-Person Households | 1,338 (21.5%) | 501 (8.1%) |
| 3-Person Households | 424 (6.8%) | 111 (1.8%) |
| 4-Person Households | 410 (6.6%) | 0 (0.0%) |
| 5-Person Households | 233 (3.7%) | 0 (0.0%) |
| 6-Person Households | 123 (2.0%) | 0 (0.0%) |
| 7+ Person Households | 28 (0.4%) | 0 (0.0%) |
| Total | 2,556 (41.1%) | 3,661 (58.9%) |
Female Fertility in Cottonwood
Fertility by Age in Cottonwood
Average fertility rate in Cottonwood is 77.0 births per 1,000 women. Women in the age bracket of 20 to 34 years have the highest fertility rate with 154.0 births per 1,000 women. Women in the age bracket of 20 to 34 years acount for 88.3% of all women with births.
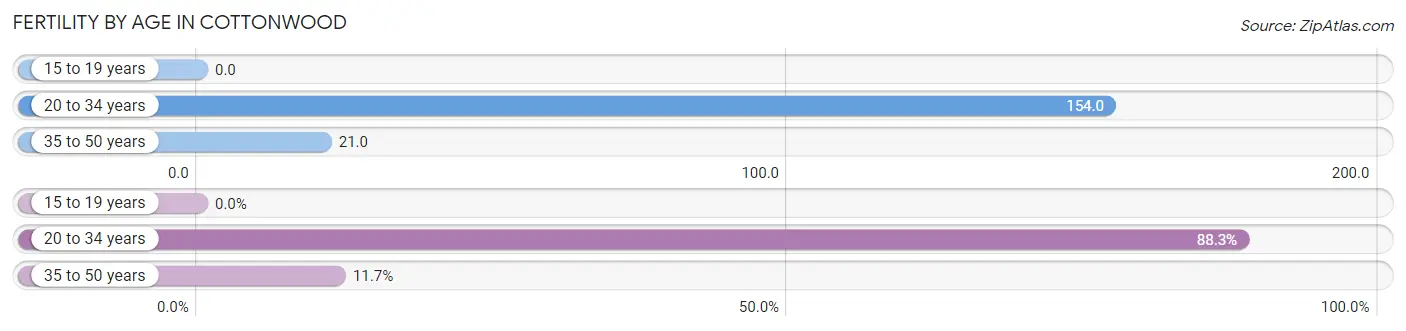
| Age Bracket | Women with Births | Births / 1,000 Women |
| 15 to 19 years | 0 (0.0%) | 0.0 |
| 20 to 34 years | 151 (88.3%) | 154.0 |
| 35 to 50 years | 20 (11.7%) | 21.0 |
| Total | 171 (100.0%) | 77.0 |
Fertility by Age by Marriage Status in Cottonwood
42.7% of women with births (171) in Cottonwood are married. The highest percentage of unmarried women with births falls into 35 to 50 years age bracket with 100.0% of them unmarried at the time of birth, while the lowest percentage of unmarried women with births belong to 20 to 34 years age bracket with 51.7% of them unmarried.
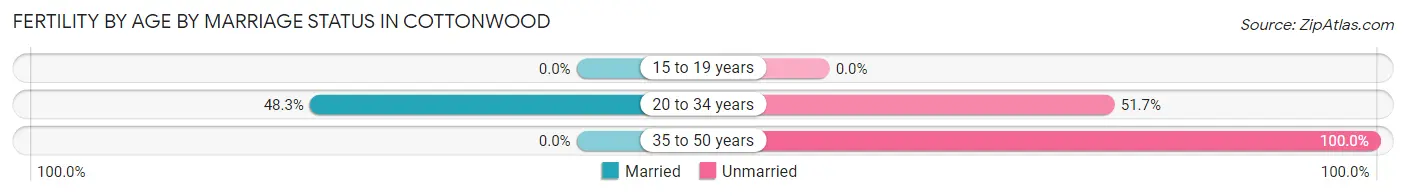
| Age Bracket | Married | Unmarried |
| 15 to 19 years | 0 (0.0%) | 0 (0.0%) |
| 20 to 34 years | 73 (48.3%) | 78 (51.7%) |
| 35 to 50 years | 0 (0.0%) | 20 (100.0%) |
| Total | 73 (42.7%) | 98 (57.3%) |
Fertility by Education in Cottonwood
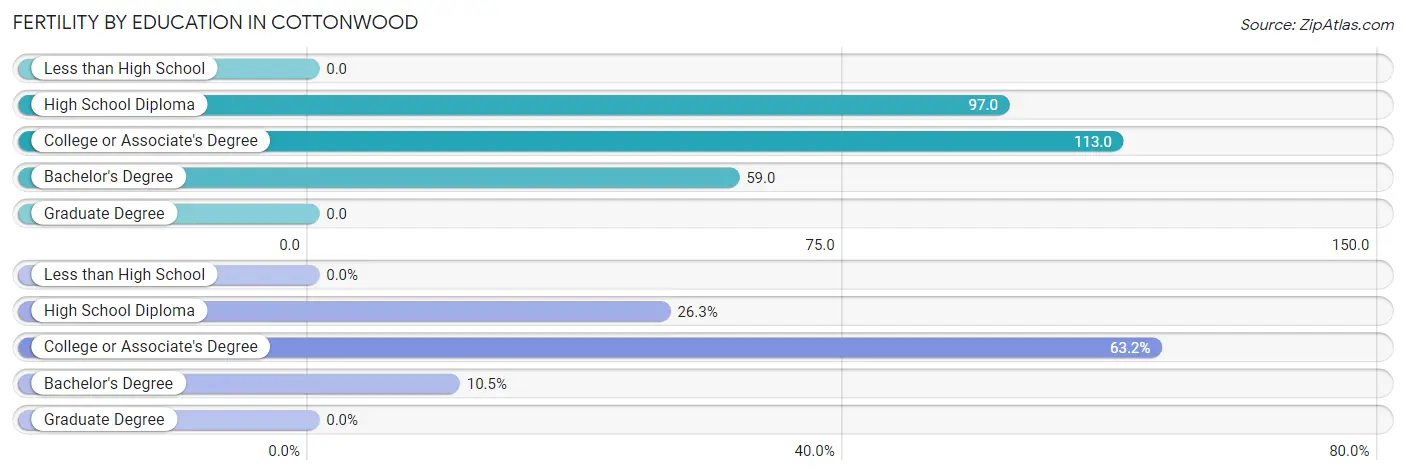
| Educational Attainment | Women with Births | Births / 1,000 Women |
| Less than High School | 0 (0.0%) | 0.0 |
| High School Diploma | 45 (26.3%) | 97.0 |
| College or Associate's Degree | 108 (63.2%) | 113.0 |
| Bachelor's Degree | 18 (10.5%) | 59.0 |
| Graduate Degree | 0 (0.0%) | 0.0 |
| Total | 171 (100.0%) | 77.0 |
Fertility by Education by Marriage Status in Cottonwood
57.3% of women with births in Cottonwood are unmarried. Women with the educational attainment of bachelor's degree are most likely to be married with 100.0% of them married at childbirth, while women with the educational attainment of high school diploma are least likely to be married with 68.9% of them unmarried at childbirth.
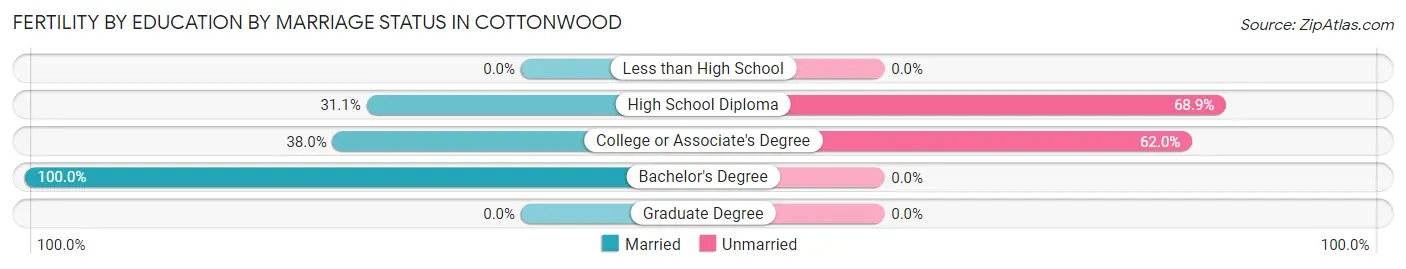
| Educational Attainment | Married | Unmarried |
| Less than High School | 0 (0.0%) | 0 (0.0%) |
| High School Diploma | 14 (31.1%) | 31 (68.9%) |
| College or Associate's Degree | 41 (38.0%) | 67 (62.0%) |
| Bachelor's Degree | 18 (100.0%) | 0 (0.0%) |
| Graduate Degree | 0 (0.0%) | 0 (0.0%) |
| Total | 73 (42.7%) | 98 (57.3%) |
Employment Characteristics in Cottonwood
Employment by Class of Employer in Cottonwood
Among the 4,969 employed individuals in Cottonwood, private company employees (2,784 | 56.0%), self-employed (not incorporated) (822 | 16.5%), and not-for-profit organizations (453 | 9.1%) make up the most common classes of employment.
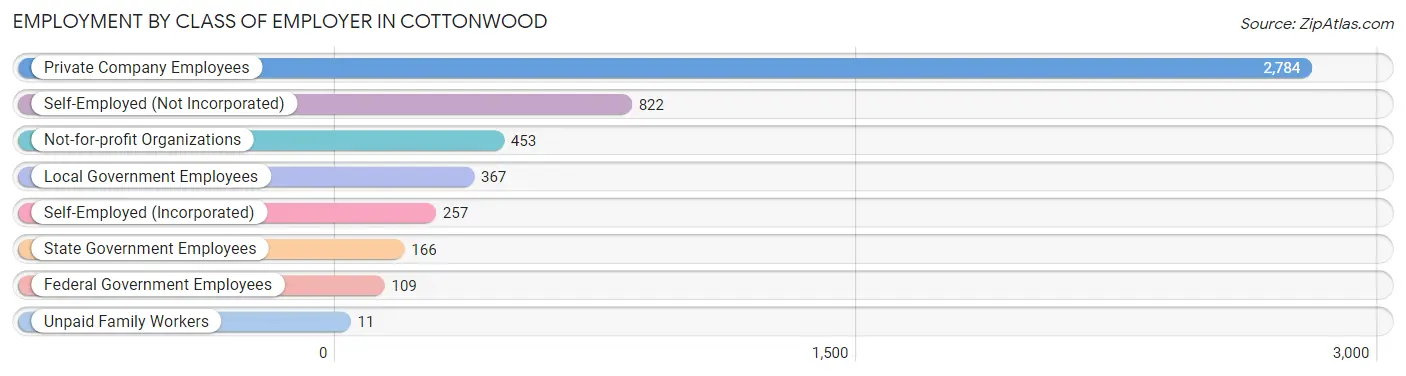
| Employer Class | # Employees | % Employees |
| Private Company Employees | 2,784 | 56.0% |
| Self-Employed (Incorporated) | 257 | 5.2% |
| Self-Employed (Not Incorporated) | 822 | 16.5% |
| Not-for-profit Organizations | 453 | 9.1% |
| Local Government Employees | 367 | 7.4% |
| State Government Employees | 166 | 3.3% |
| Federal Government Employees | 109 | 2.2% |
| Unpaid Family Workers | 11 | 0.2% |
| Total | 4,969 | 100.0% |
Employment Status by Age in Cottonwood
According to the labor force statistics for Cottonwood, out of the total population over 16 years of age (10,742), 48.6% or 5,221 individuals are in the labor force, with 2.8% or 146 of them unemployed. The age group with the highest labor force participation rate is 30 to 34 years, with 89.9% or 402 individuals in the labor force. Within the labor force, the 16 to 19 years age range has the highest percentage of unemployed individuals, with 14.9% or 25 of them being unemployed.
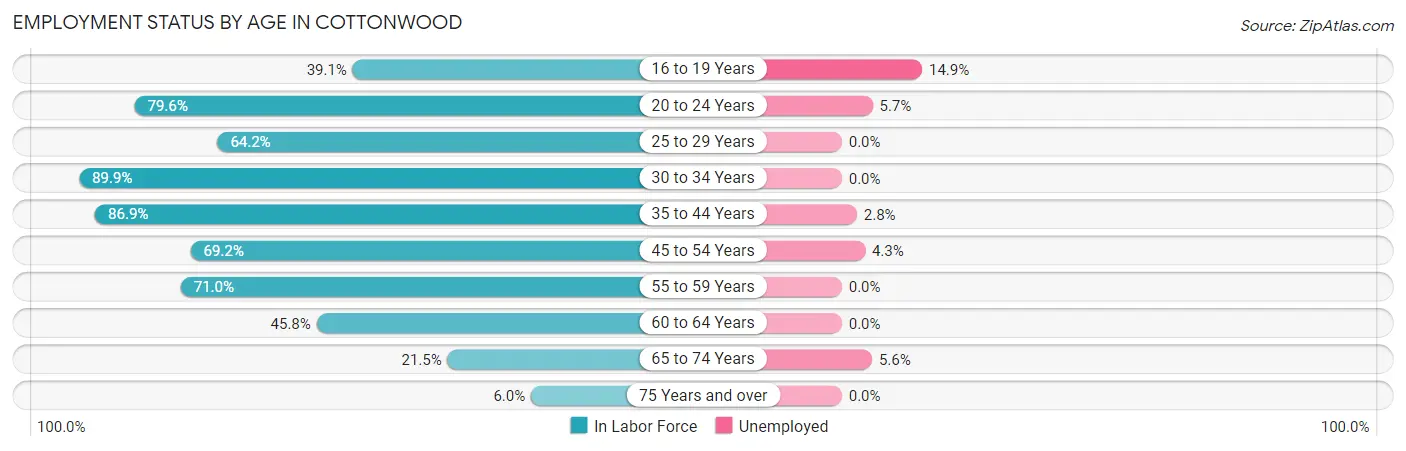
| Age Bracket | In Labor Force | Unemployed |
| 16 to 19 Years | 168 (39.1%) | 25 (14.9%) |
| 20 to 24 Years | 472 (79.6%) | 27 (5.7%) |
| 25 to 29 Years | 371 (64.2%) | 0 (0.0%) |
| 30 to 34 Years | 402 (89.9%) | 0 (0.0%) |
| 35 to 44 Years | 1,368 (86.9%) | 38 (2.8%) |
| 45 to 54 Years | 691 (69.2%) | 30 (4.3%) |
| 55 to 59 Years | 684 (71.0%) | 0 (0.0%) |
| 60 to 64 Years | 472 (45.8%) | 0 (0.0%) |
| 65 to 74 Years | 481 (21.5%) | 27 (5.6%) |
| 75 Years and over | 113 (6.0%) | 0 (0.0%) |
| Total | 5,221 (48.6%) | 146 (2.8%) |
Employment Status by Educational Attainment in Cottonwood
According to labor force statistics for Cottonwood, 71.3% of individuals (3,986) out of the total population between 25 and 64 years of age (5,591) are in the labor force, with 1.7% or 68 of them being unemployed. The group with the highest labor force participation rate are those with the educational attainment of college / associate degree, with 77.3% or 1,537 individuals in the labor force. Within the labor force, individuals with less than high school education have the highest percentage of unemployment, with 9.8% or 38 of them being unemployed.
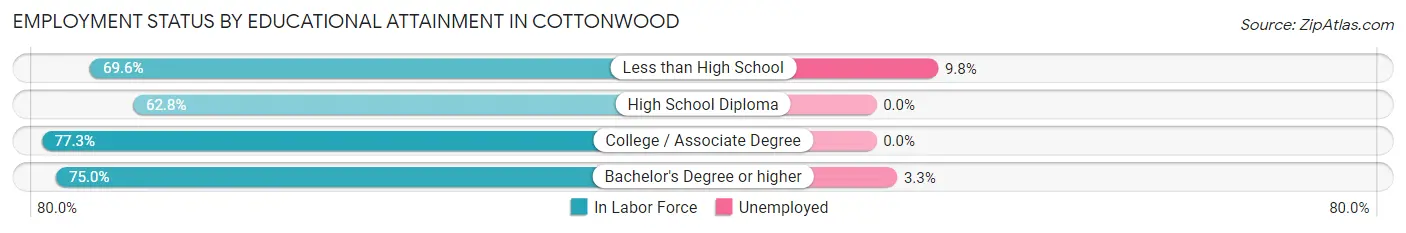
| Educational Attainment | In Labor Force | Unemployed |
| Less than High School | 387 (69.6%) | 54 (9.8%) |
| High School Diploma | 1,144 (62.8%) | 0 (0.0%) |
| College / Associate Degree | 1,537 (77.3%) | 0 (0.0%) |
| Bachelor's Degree or higher | 918 (75.0%) | 40 (3.3%) |
| Total | 3,986 (71.3%) | 95 (1.7%) |
Employment Occupations by Sex in Cottonwood
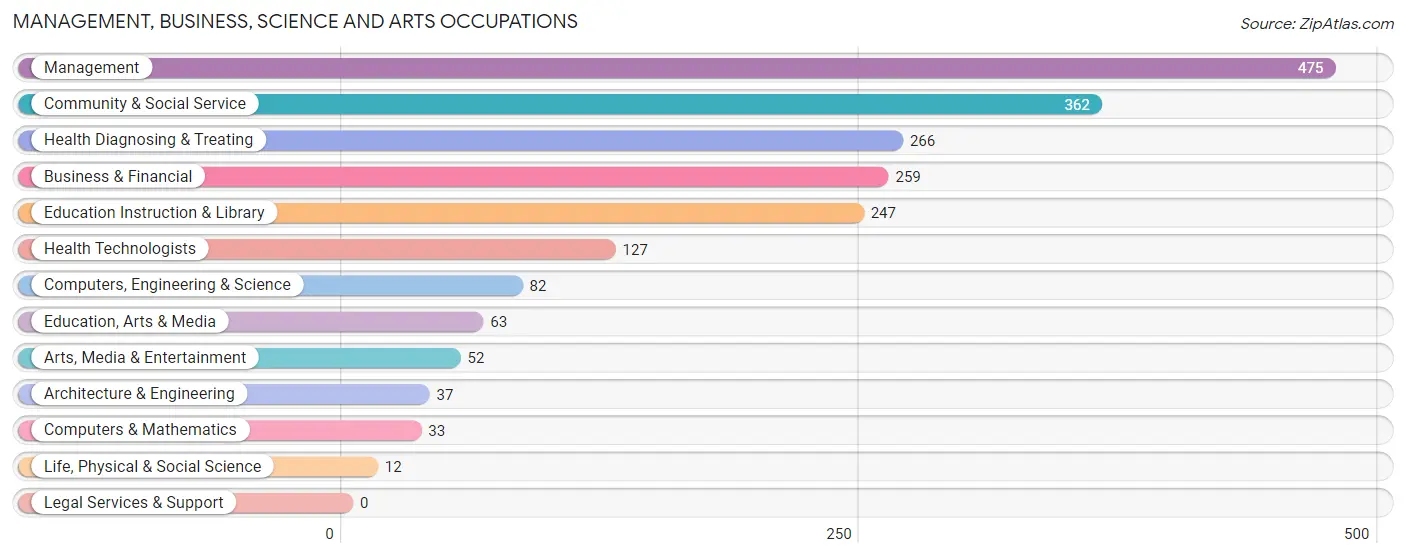
Management, Business, Science and Arts Occupations
The most common Management, Business, Science and Arts occupations in Cottonwood are Management (475 | 9.4%), Community & Social Service (362 | 7.1%), Health Diagnosing & Treating (266 | 5.2%), Business & Financial (259 | 5.1%), and Education Instruction & Library (247 | 4.9%).
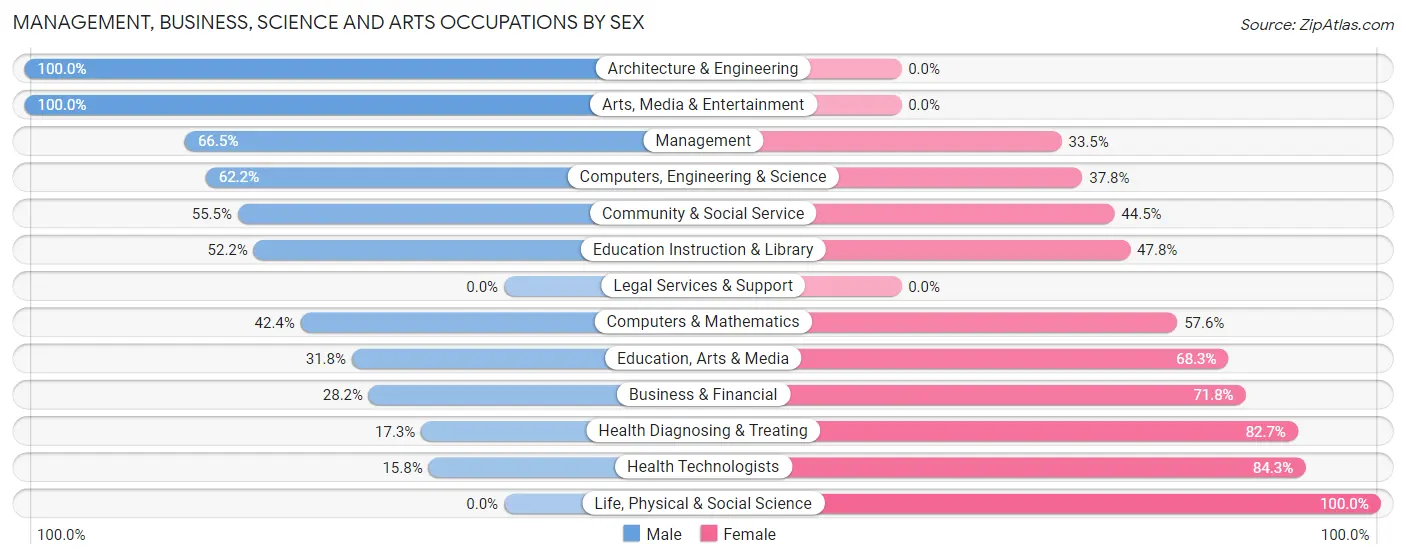
Management, Business, Science and Arts Occupations by Sex
Within the Management, Business, Science and Arts occupations in Cottonwood, the most male-oriented occupations are Architecture & Engineering (100.0%), Arts, Media & Entertainment (100.0%), and Management (66.5%), while the most female-oriented occupations are Life, Physical & Social Science (100.0%), Health Technologists (84.3%), and Health Diagnosing & Treating (82.7%).
| Occupation | Male | Female |
| Management | 316 (66.5%) | 159 (33.5%) |
| Business & Financial | 73 (28.2%) | 186 (71.8%) |
| Computers, Engineering & Science | 51 (62.2%) | 31 (37.8%) |
| Computers & Mathematics | 14 (42.4%) | 19 (57.6%) |
| Architecture & Engineering | 37 (100.0%) | 0 (0.0%) |
| Life, Physical & Social Science | 0 (0.0%) | 12 (100.0%) |
| Community & Social Service | 201 (55.5%) | 161 (44.5%) |
| Education, Arts & Media | 20 (31.8%) | 43 (68.2%) |
| Legal Services & Support | 0 (0.0%) | 0 (0.0%) |
| Education Instruction & Library | 129 (52.2%) | 118 (47.8%) |
| Arts, Media & Entertainment | 52 (100.0%) | 0 (0.0%) |
| Health Diagnosing & Treating | 46 (17.3%) | 220 (82.7%) |
| Health Technologists | 20 (15.8%) | 107 (84.3%) |
| Total (Category) | 687 (47.6%) | 757 (52.4%) |
| Total (Overall) | 2,486 (49.0%) | 2,588 (51.0%) |
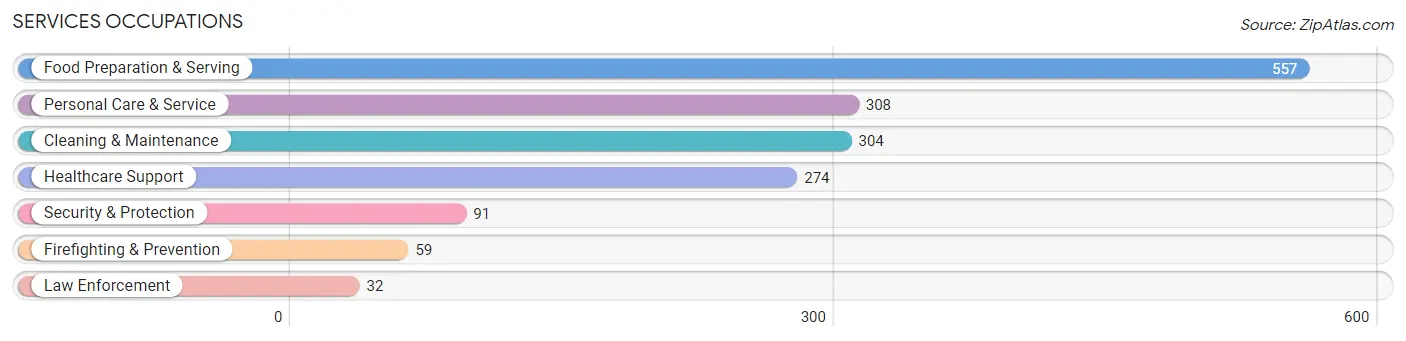
Services Occupations
The most common Services occupations in Cottonwood are Food Preparation & Serving (557 | 11.0%), Personal Care & Service (308 | 6.1%), Cleaning & Maintenance (304 | 6.0%), Healthcare Support (274 | 5.4%), and Security & Protection (91 | 1.8%).
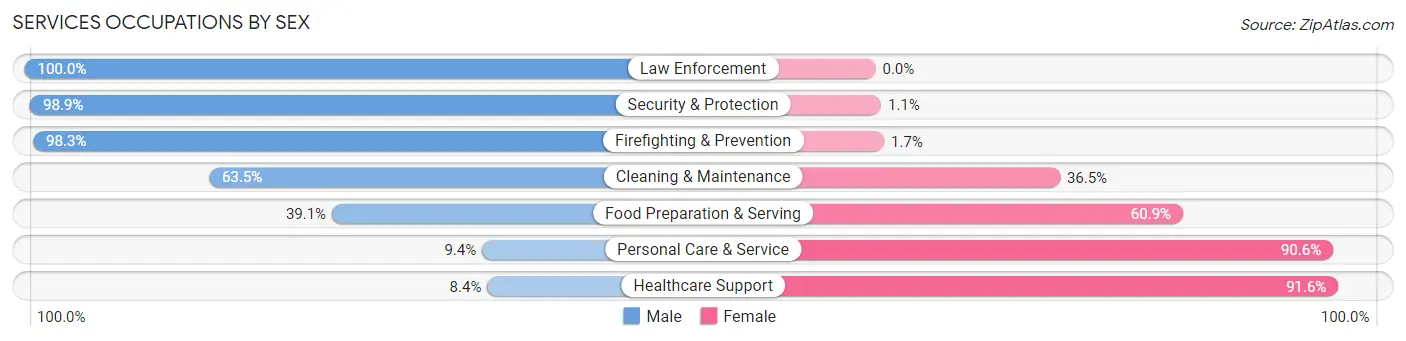
Services Occupations by Sex
Within the Services occupations in Cottonwood, the most male-oriented occupations are Law Enforcement (100.0%), Security & Protection (98.9%), and Firefighting & Prevention (98.3%), while the most female-oriented occupations are Healthcare Support (91.6%), Personal Care & Service (90.6%), and Food Preparation & Serving (60.9%).
| Occupation | Male | Female |
| Healthcare Support | 23 (8.4%) | 251 (91.6%) |
| Security & Protection | 90 (98.9%) | 1 (1.1%) |
| Firefighting & Prevention | 58 (98.3%) | 1 (1.7%) |
| Law Enforcement | 32 (100.0%) | 0 (0.0%) |
| Food Preparation & Serving | 218 (39.1%) | 339 (60.9%) |
| Cleaning & Maintenance | 193 (63.5%) | 111 (36.5%) |
| Personal Care & Service | 29 (9.4%) | 279 (90.6%) |
| Total (Category) | 553 (36.0%) | 981 (63.9%) |
| Total (Overall) | 2,486 (49.0%) | 2,588 (51.0%) |
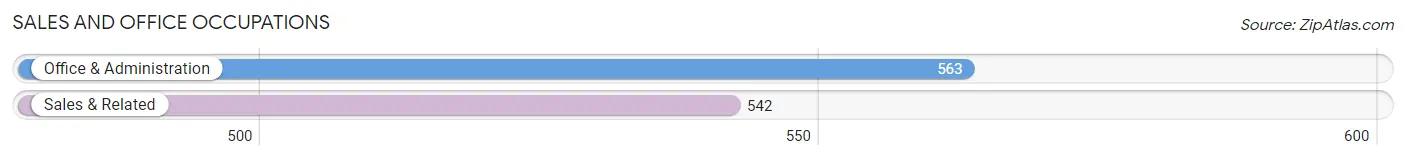
Sales and Office Occupations
The most common Sales and Office occupations in Cottonwood are Office & Administration (563 | 11.1%), and Sales & Related (542 | 10.7%).
Sales and Office Occupations by Sex
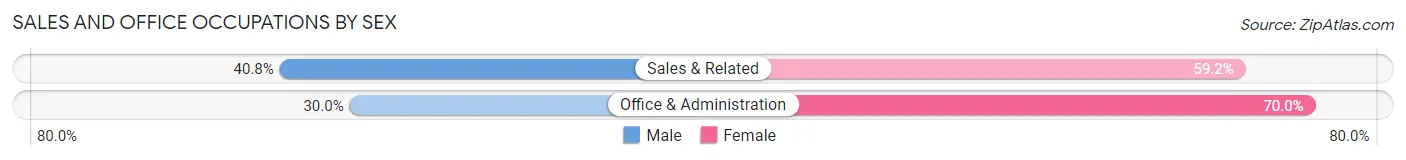
| Occupation | Male | Female |
| Sales & Related | 221 (40.8%) | 321 (59.2%) |
| Office & Administration | 169 (30.0%) | 394 (70.0%) |
| Total (Category) | 390 (35.3%) | 715 (64.7%) |
| Total (Overall) | 2,486 (49.0%) | 2,588 (51.0%) |
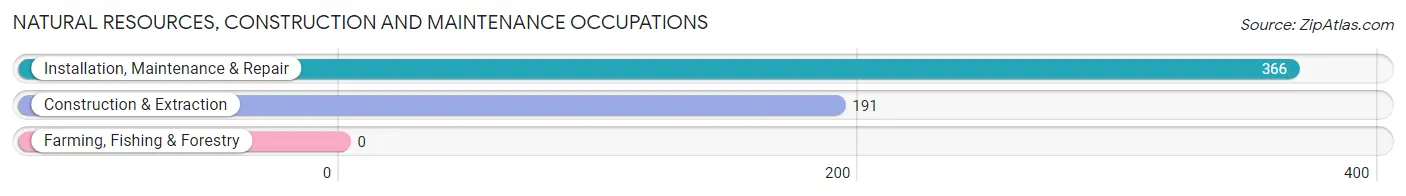
Natural Resources, Construction and Maintenance Occupations
The most common Natural Resources, Construction and Maintenance occupations in Cottonwood are Installation, Maintenance & Repair (366 | 7.2%), and Construction & Extraction (191 | 3.8%).
Natural Resources, Construction and Maintenance Occupations by Sex
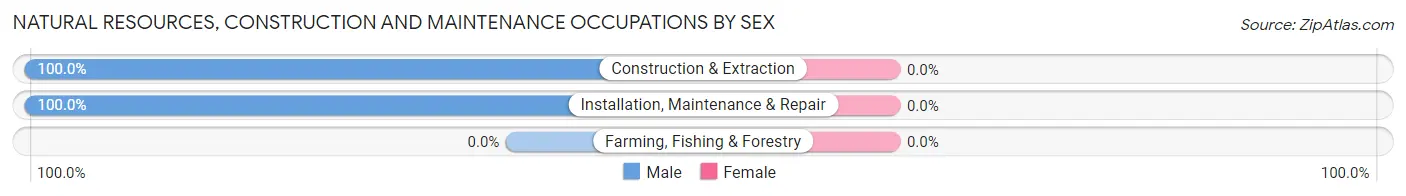
| Occupation | Male | Female |
| Farming, Fishing & Forestry | 0 (0.0%) | 0 (0.0%) |
| Construction & Extraction | 191 (100.0%) | 0 (0.0%) |
| Installation, Maintenance & Repair | 366 (100.0%) | 0 (0.0%) |
| Total (Category) | 557 (100.0%) | 0 (0.0%) |
| Total (Overall) | 2,486 (49.0%) | 2,588 (51.0%) |
Production, Transportation and Moving Occupations
The most common Production, Transportation and Moving occupations in Cottonwood are Material Moving (177 | 3.5%), Transportation (167 | 3.3%), and Production (90 | 1.8%).
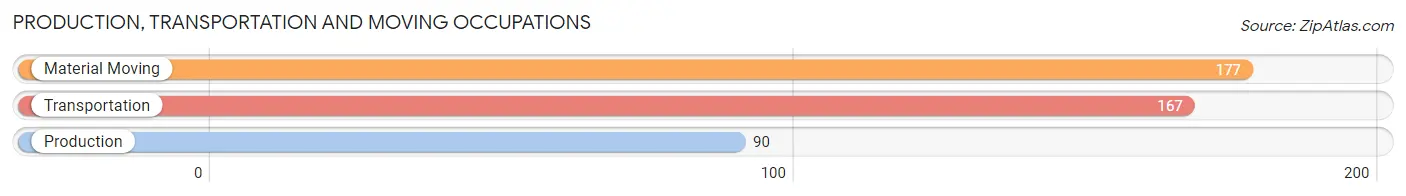
Production, Transportation and Moving Occupations by Sex
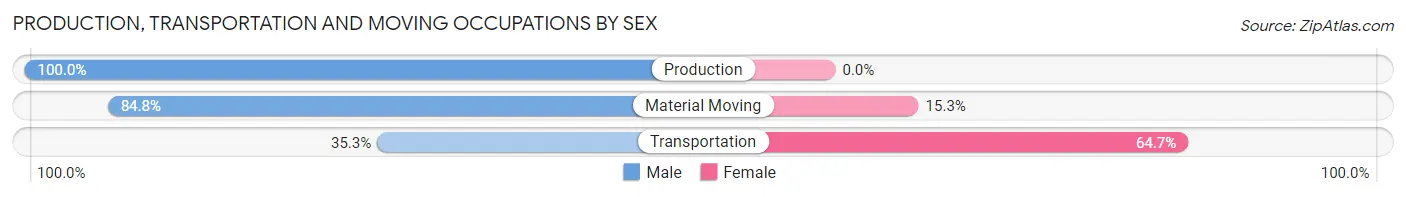
| Occupation | Male | Female |
| Production | 90 (100.0%) | 0 (0.0%) |
| Transportation | 59 (35.3%) | 108 (64.7%) |
| Material Moving | 150 (84.8%) | 27 (15.2%) |
| Total (Category) | 299 (68.9%) | 135 (31.1%) |
| Total (Overall) | 2,486 (49.0%) | 2,588 (51.0%) |
Employment Industries by Sex in Cottonwood
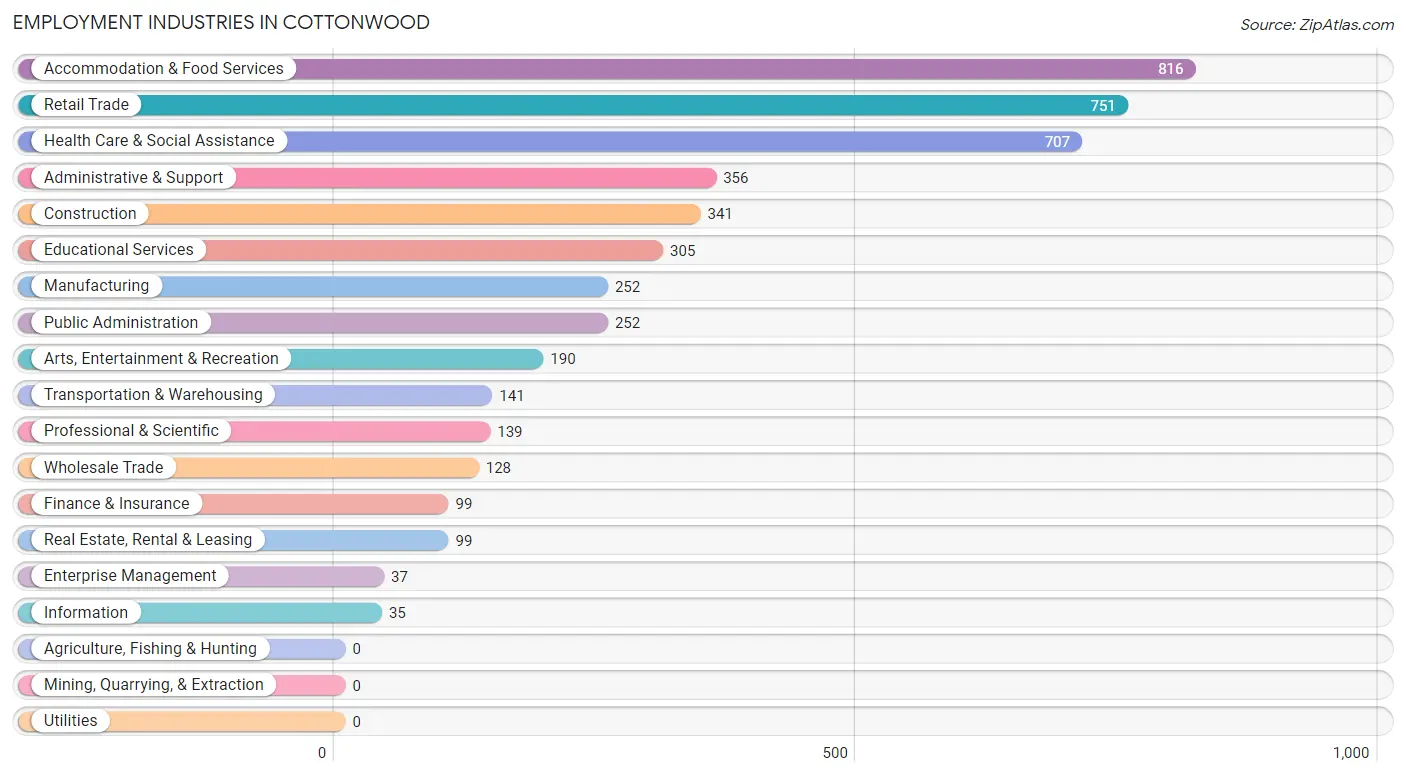
Employment Industries in Cottonwood
The major employment industries in Cottonwood include Accommodation & Food Services (816 | 16.1%), Retail Trade (751 | 14.8%), Health Care & Social Assistance (707 | 13.9%), Administrative & Support (356 | 7.0%), and Construction (341 | 6.7%).
Employment Industries by Sex in Cottonwood
The Cottonwood industries that see more men than women are Information (100.0%), Finance & Insurance (100.0%), and Construction (96.8%), whereas the industries that tend to have a higher number of women are Enterprise Management (100.0%), Transportation & Warehousing (95.7%), and Health Care & Social Assistance (87.4%).
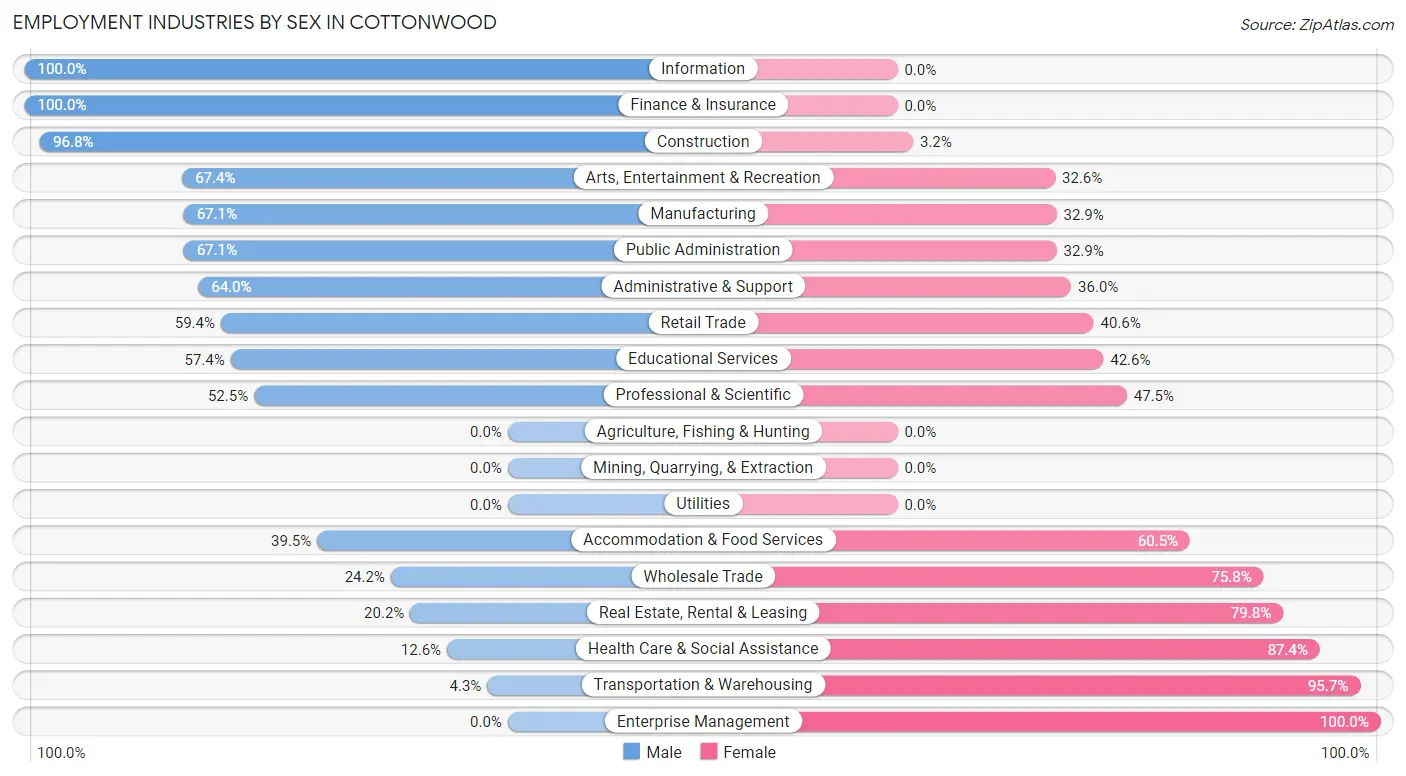
| Industry | Male | Female |
| Agriculture, Fishing & Hunting | 0 (0.0%) | 0 (0.0%) |
| Mining, Quarrying, & Extraction | 0 (0.0%) | 0 (0.0%) |
| Construction | 330 (96.8%) | 11 (3.2%) |
| Manufacturing | 169 (67.1%) | 83 (32.9%) |
| Wholesale Trade | 31 (24.2%) | 97 (75.8%) |
| Retail Trade | 446 (59.4%) | 305 (40.6%) |
| Transportation & Warehousing | 6 (4.3%) | 135 (95.7%) |
| Utilities | 0 (0.0%) | 0 (0.0%) |
| Information | 35 (100.0%) | 0 (0.0%) |
| Finance & Insurance | 99 (100.0%) | 0 (0.0%) |
| Real Estate, Rental & Leasing | 20 (20.2%) | 79 (79.8%) |
| Professional & Scientific | 73 (52.5%) | 66 (47.5%) |
| Enterprise Management | 0 (0.0%) | 37 (100.0%) |
| Administrative & Support | 228 (64.0%) | 128 (36.0%) |
| Educational Services | 175 (57.4%) | 130 (42.6%) |
| Health Care & Social Assistance | 89 (12.6%) | 618 (87.4%) |
| Arts, Entertainment & Recreation | 128 (67.4%) | 62 (32.6%) |
| Accommodation & Food Services | 322 (39.5%) | 494 (60.5%) |
| Public Administration | 169 (67.1%) | 83 (32.9%) |
| Total | 2,486 (49.0%) | 2,588 (51.0%) |
Education in Cottonwood
School Enrollment in Cottonwood
The most common levels of schooling among the 1,864 students in Cottonwood are high school (548 | 29.4%), middle school (485 | 26.0%), and college / undergraduate (387 | 20.8%).
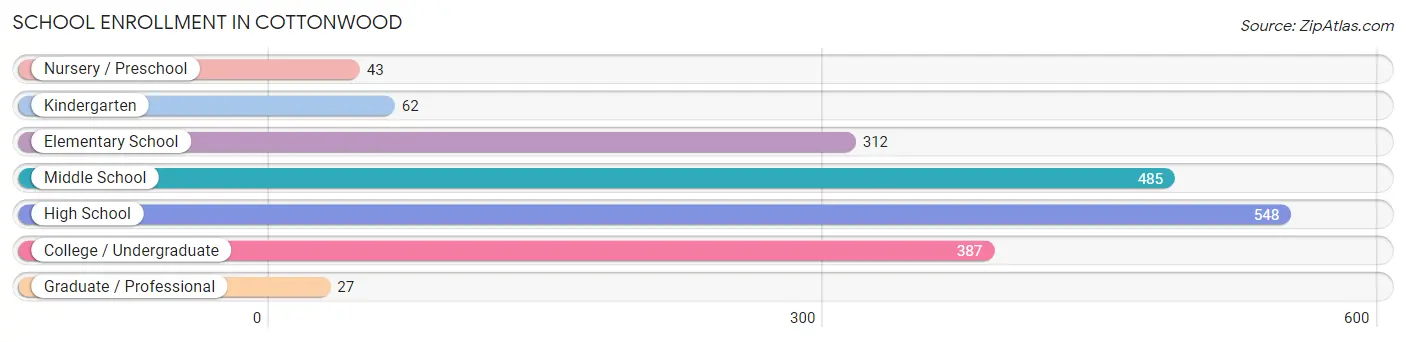
| School Level | # Students | % Students |
| Nursery / Preschool | 43 | 2.3% |
| Kindergarten | 62 | 3.3% |
| Elementary School | 312 | 16.7% |
| Middle School | 485 | 26.0% |
| High School | 548 | 29.4% |
| College / Undergraduate | 387 | 20.8% |
| Graduate / Professional | 27 | 1.5% |
| Total | 1,864 | 100.0% |
School Enrollment by Age by Funding Source in Cottonwood
Out of a total of 1,864 students who are enrolled in schools in Cottonwood, 287 (15.4%) attend a private institution, while the remaining 1,577 (84.6%) are enrolled in public schools. The age group of 10 to 14 year olds has the highest likelihood of being enrolled in private schools, with 153 (28.2% in the age bracket) enrolled. Conversely, the age group of 3 to 4 year olds has the lowest likelihood of being enrolled in a private school, with 43 (100.0% in the age bracket) attending a public institution.
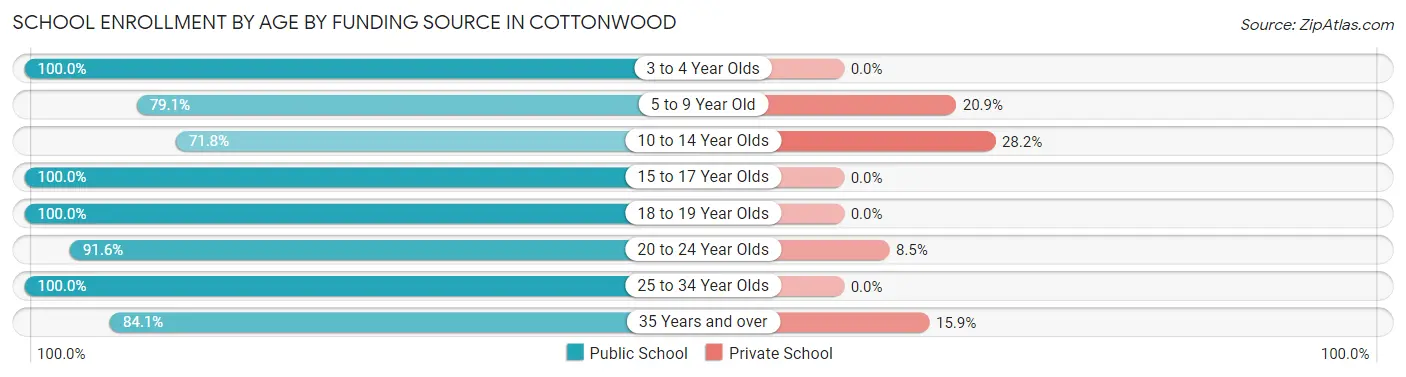
| Age Bracket | Public School | Private School |
| 3 to 4 Year Olds | 43 (100.0%) | 0 (0.0%) |
| 5 to 9 Year Old | 250 (79.1%) | 66 (20.9%) |
| 10 to 14 Year Olds | 390 (71.8%) | 153 (28.2%) |
| 15 to 17 Year Olds | 391 (100.0%) | 0 (0.0%) |
| 18 to 19 Year Olds | 78 (100.0%) | 0 (0.0%) |
| 20 to 24 Year Olds | 65 (91.5%) | 6 (8.5%) |
| 25 to 34 Year Olds | 32 (100.0%) | 0 (0.0%) |
| 35 Years and over | 328 (84.1%) | 62 (15.9%) |
| Total | 1,577 (84.6%) | 287 (15.4%) |
Educational Attainment by Field of Study in Cottonwood
Business (528 | 20.5%), visual & performing arts (410 | 15.9%), education (283 | 11.0%), social sciences (190 | 7.4%), and bio, nature & agricultural (187 | 7.3%) are the most common fields of study among 2,575 individuals in Cottonwood who have obtained a bachelor's degree or higher.
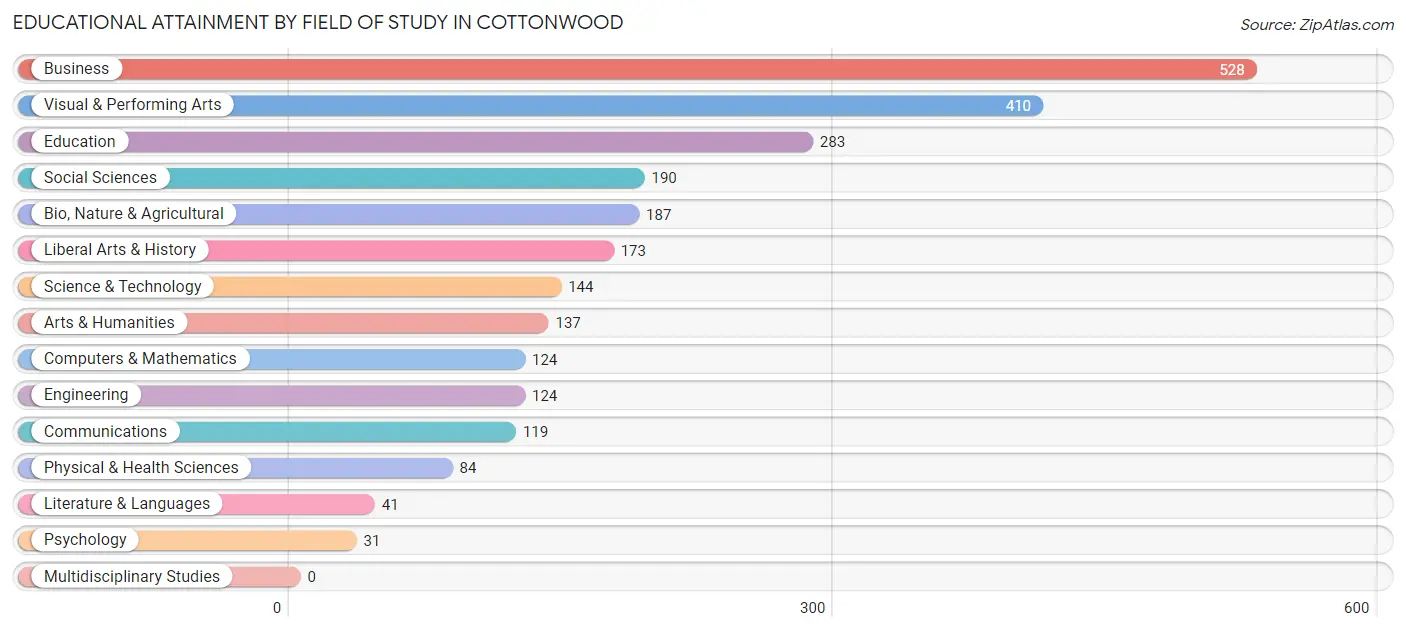
| Field of Study | # Graduates | % Graduates |
| Computers & Mathematics | 124 | 4.8% |
| Bio, Nature & Agricultural | 187 | 7.3% |
| Physical & Health Sciences | 84 | 3.3% |
| Psychology | 31 | 1.2% |
| Social Sciences | 190 | 7.4% |
| Engineering | 124 | 4.8% |
| Multidisciplinary Studies | 0 | 0.0% |
| Science & Technology | 144 | 5.6% |
| Business | 528 | 20.5% |
| Education | 283 | 11.0% |
| Literature & Languages | 41 | 1.6% |
| Liberal Arts & History | 173 | 6.7% |
| Visual & Performing Arts | 410 | 15.9% |
| Communications | 119 | 4.6% |
| Arts & Humanities | 137 | 5.3% |
| Total | 2,575 | 100.0% |
Transportation & Commute in Cottonwood
Vehicle Availability by Sex in Cottonwood
The most prevalent vehicle ownership categories in Cottonwood are males with 3 vehicles (822, accounting for 33.6%) and females with 3 vehicles (852, making up 32.8%).
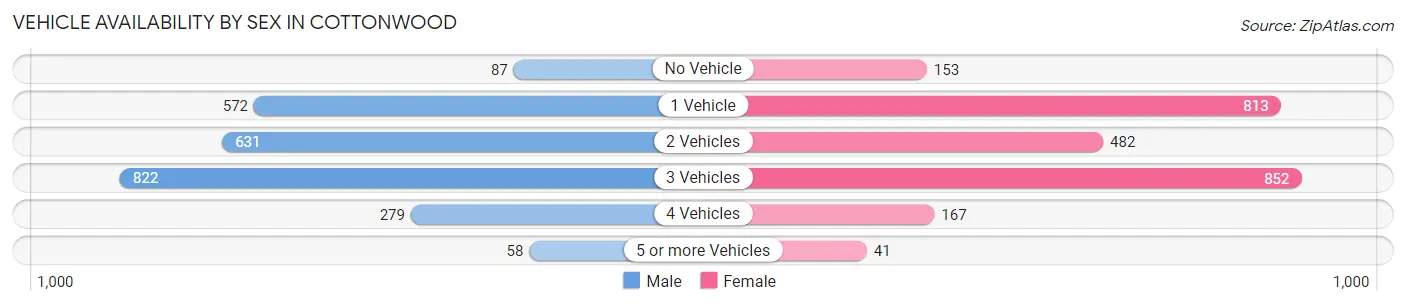
| Vehicles Available | Male | Female |
| No Vehicle | 87 (3.5%) | 153 (6.1%) |
| 1 Vehicle | 572 (23.4%) | 813 (32.4%) |
| 2 Vehicles | 631 (25.8%) | 482 (19.2%) |
| 3 Vehicles | 822 (33.6%) | 852 (34.0%) |
| 4 Vehicles | 279 (11.4%) | 167 (6.7%) |
| 5 or more Vehicles | 58 (2.4%) | 41 (1.6%) |
| Total | 2,449 (100.0%) | 2,508 (100.0%) |
Commute Time in Cottonwood
The most frequently occuring commute durations in Cottonwood are 5 to 9 minutes (998 commuters, 21.3%), 10 to 14 minutes (831 commuters, 17.8%), and 30 to 34 minutes (822 commuters, 17.6%).
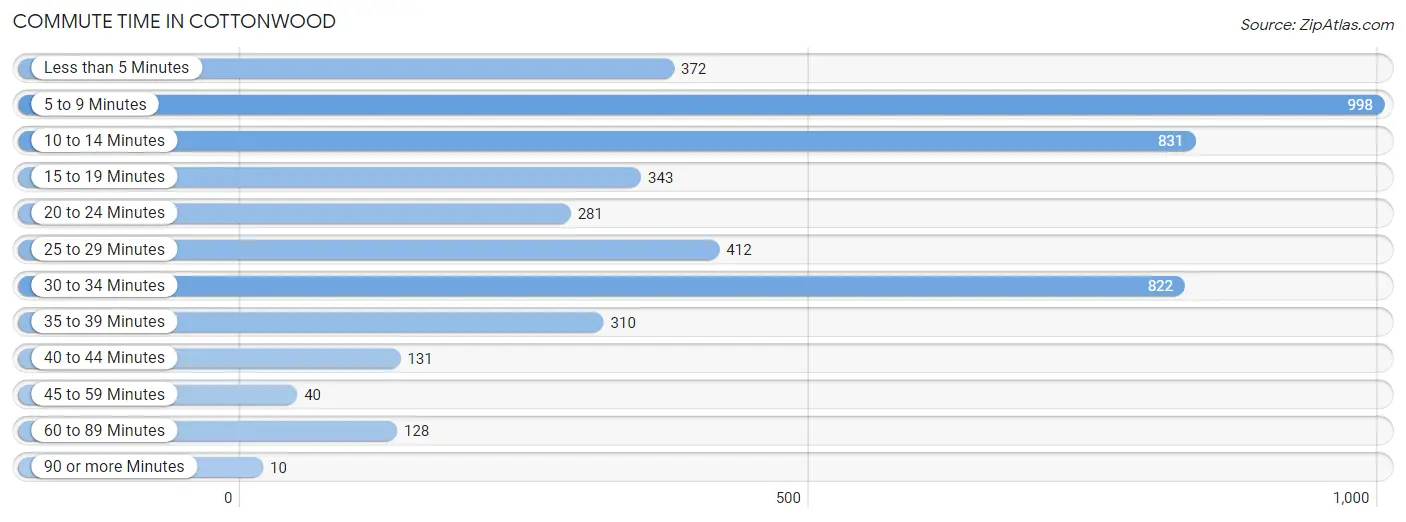
| Commute Time | # Commuters | % Commuters |
| Less than 5 Minutes | 372 | 8.0% |
| 5 to 9 Minutes | 998 | 21.3% |
| 10 to 14 Minutes | 831 | 17.8% |
| 15 to 19 Minutes | 343 | 7.3% |
| 20 to 24 Minutes | 281 | 6.0% |
| 25 to 29 Minutes | 412 | 8.8% |
| 30 to 34 Minutes | 822 | 17.6% |
| 35 to 39 Minutes | 310 | 6.6% |
| 40 to 44 Minutes | 131 | 2.8% |
| 45 to 59 Minutes | 40 | 0.9% |
| 60 to 89 Minutes | 128 | 2.7% |
| 90 or more Minutes | 10 | 0.2% |
Commute Time by Sex in Cottonwood
The most common commute times in Cottonwood are 5 to 9 minutes (602 commuters, 26.1%) for males and 10 to 14 minutes (440 commuters, 18.6%) for females.
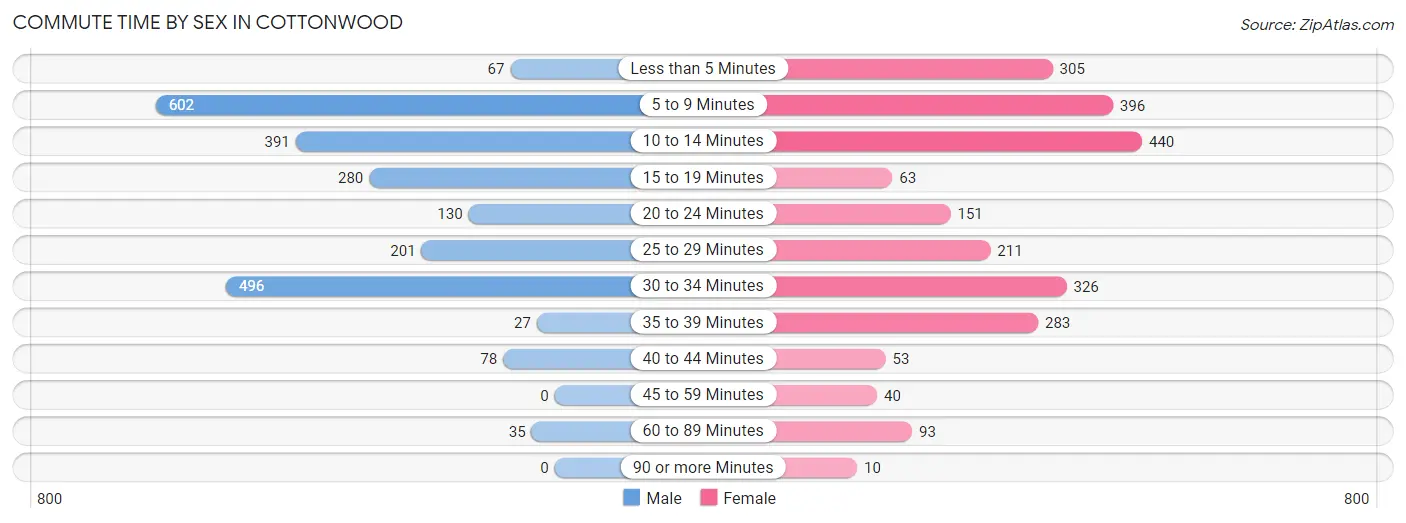
| Commute Time | Male | Female |
| Less than 5 Minutes | 67 (2.9%) | 305 (12.9%) |
| 5 to 9 Minutes | 602 (26.1%) | 396 (16.7%) |
| 10 to 14 Minutes | 391 (17.0%) | 440 (18.6%) |
| 15 to 19 Minutes | 280 (12.1%) | 63 (2.7%) |
| 20 to 24 Minutes | 130 (5.6%) | 151 (6.4%) |
| 25 to 29 Minutes | 201 (8.7%) | 211 (8.9%) |
| 30 to 34 Minutes | 496 (21.5%) | 326 (13.8%) |
| 35 to 39 Minutes | 27 (1.2%) | 283 (11.9%) |
| 40 to 44 Minutes | 78 (3.4%) | 53 (2.2%) |
| 45 to 59 Minutes | 0 (0.0%) | 40 (1.7%) |
| 60 to 89 Minutes | 35 (1.5%) | 93 (3.9%) |
| 90 or more Minutes | 0 (0.0%) | 10 (0.4%) |
Time of Departure to Work by Sex in Cottonwood
The most frequent times of departure to work in Cottonwood are 7:30 AM to 7:59 AM (383, 16.6%) for males and 6:30 AM to 6:59 AM (297, 12.5%) for females.
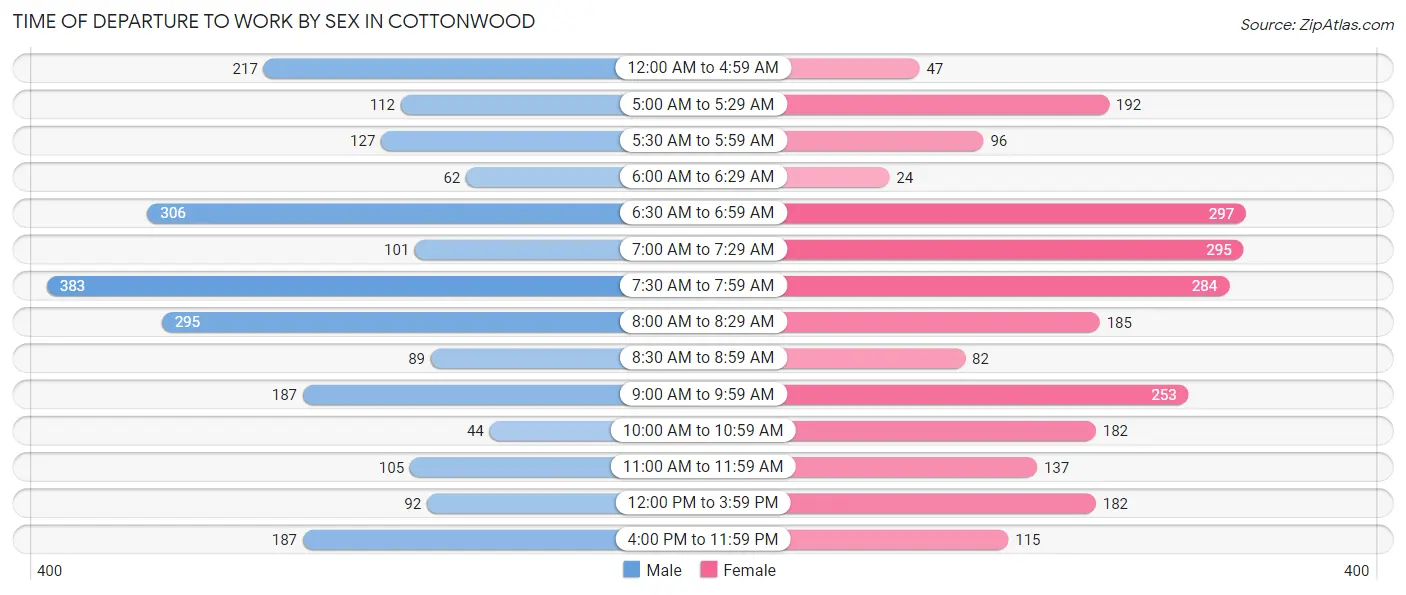
| Time of Departure | Male | Female |
| 12:00 AM to 4:59 AM | 217 (9.4%) | 47 (2.0%) |
| 5:00 AM to 5:29 AM | 112 (4.9%) | 192 (8.1%) |
| 5:30 AM to 5:59 AM | 127 (5.5%) | 96 (4.1%) |
| 6:00 AM to 6:29 AM | 62 (2.7%) | 24 (1.0%) |
| 6:30 AM to 6:59 AM | 306 (13.3%) | 297 (12.5%) |
| 7:00 AM to 7:29 AM | 101 (4.4%) | 295 (12.4%) |
| 7:30 AM to 7:59 AM | 383 (16.6%) | 284 (12.0%) |
| 8:00 AM to 8:29 AM | 295 (12.8%) | 185 (7.8%) |
| 8:30 AM to 8:59 AM | 89 (3.9%) | 82 (3.5%) |
| 9:00 AM to 9:59 AM | 187 (8.1%) | 253 (10.7%) |
| 10:00 AM to 10:59 AM | 44 (1.9%) | 182 (7.7%) |
| 11:00 AM to 11:59 AM | 105 (4.5%) | 137 (5.8%) |
| 12:00 PM to 3:59 PM | 92 (4.0%) | 182 (7.7%) |
| 4:00 PM to 11:59 PM | 187 (8.1%) | 115 (4.9%) |
| Total | 2,307 (100.0%) | 2,371 (100.0%) |
Housing Occupancy in Cottonwood
Occupancy by Ownership in Cottonwood
Of the total 88 dwellings in Cottonwood, owner-occupied units account for 35 (39.8%), while renter-occupied units make up 53 (60.2%).
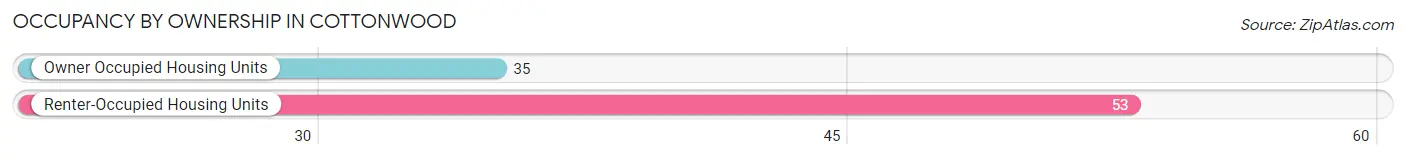
| Occupancy | # Housing Units | % Housing Units |
| Owner Occupied Housing Units | 35 | 39.8% |
| Renter-Occupied Housing Units | 53 | 60.2% |
| Total Occupied Housing Units | 88 | 100.0% |
Occupancy by Household Size in Cottonwood
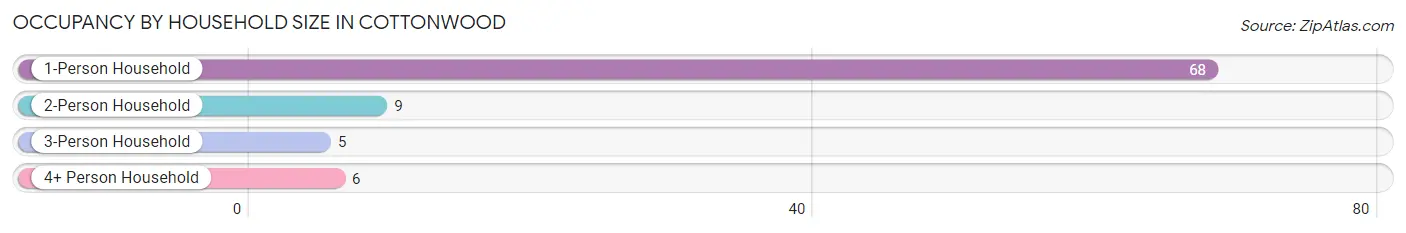
| Household Size | # Housing Units | % Housing Units |
| 1-Person Household | 68 | 77.3% |
| 2-Person Household | 9 | 10.2% |
| 3-Person Household | 5 | 5.7% |
| 4+ Person Household | 6 | 6.8% |
| Total Housing Units | 88 | 100.0% |
Occupancy by Ownership by Household Size in Cottonwood
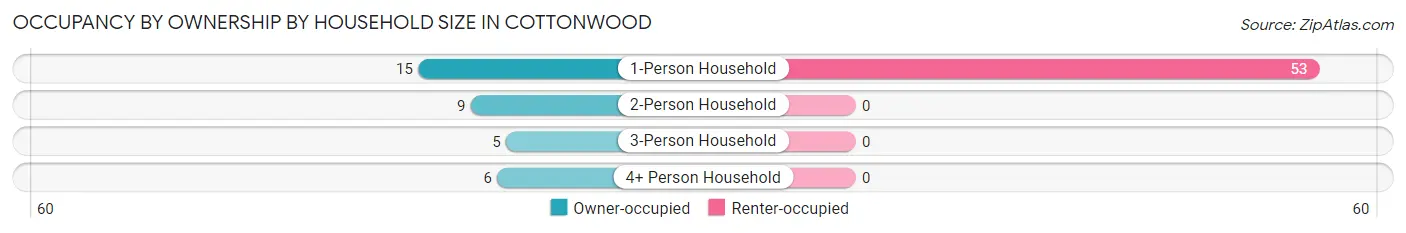
| Household Size | Owner-occupied | Renter-occupied |
| 1-Person Household | 15 (22.1%) | 53 (77.9%) |
| 2-Person Household | 9 (100.0%) | 0 (0.0%) |
| 3-Person Household | 5 (100.0%) | 0 (0.0%) |
| 4+ Person Household | 6 (100.0%) | 0 (0.0%) |
| Total Housing Units | 35 (39.8%) | 53 (60.2%) |
Occupancy by Educational Attainment in Cottonwood
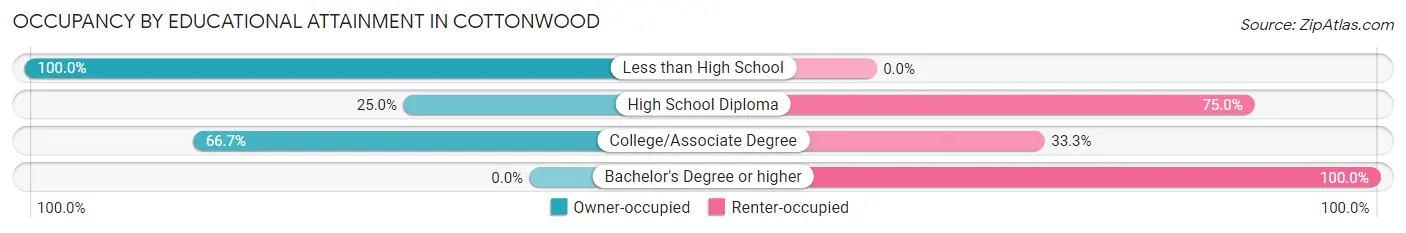
| Household Size | Owner-occupied | Renter-occupied |
| Less than High School | 20 (100.0%) | 0 (0.0%) |
| High School Diploma | 5 (25.0%) | 15 (75.0%) |
| College/Associate Degree | 10 (66.7%) | 5 (33.3%) |
| Bachelor's Degree or higher | 0 (0.0%) | 33 (100.0%) |
Occupancy by Age of Householder in Cottonwood

| Age Bracket | # Households | % Households |
| Under 35 Years | 0 | 0.0% |
| 35 to 44 Years | 0 | 0.0% |
| 45 to 54 Years | 5 | 5.7% |
| 55 to 64 Years | 55 | 62.5% |
| 65 to 74 Years | 24 | 27.3% |
| 75 to 84 Years | 4 | 4.5% |
| 85 Years and Over | 0 | 0.0% |
| Total | 88 | 100.0% |
Housing Finances in Cottonwood
Median Income by Occupancy in Cottonwood
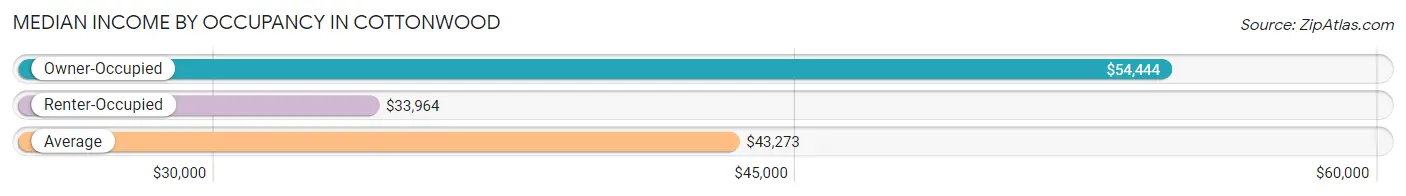
| Occupancy Type | # Households | Median Income |
| Owner-Occupied | 3,112 (50.1%) | $54,444 |
| Renter-Occupied | 3,105 (49.9%) | $33,964 |
| Average | 6,217 (100.0%) | $43,273 |
Occupancy by Householder Income Bracket in Cottonwood
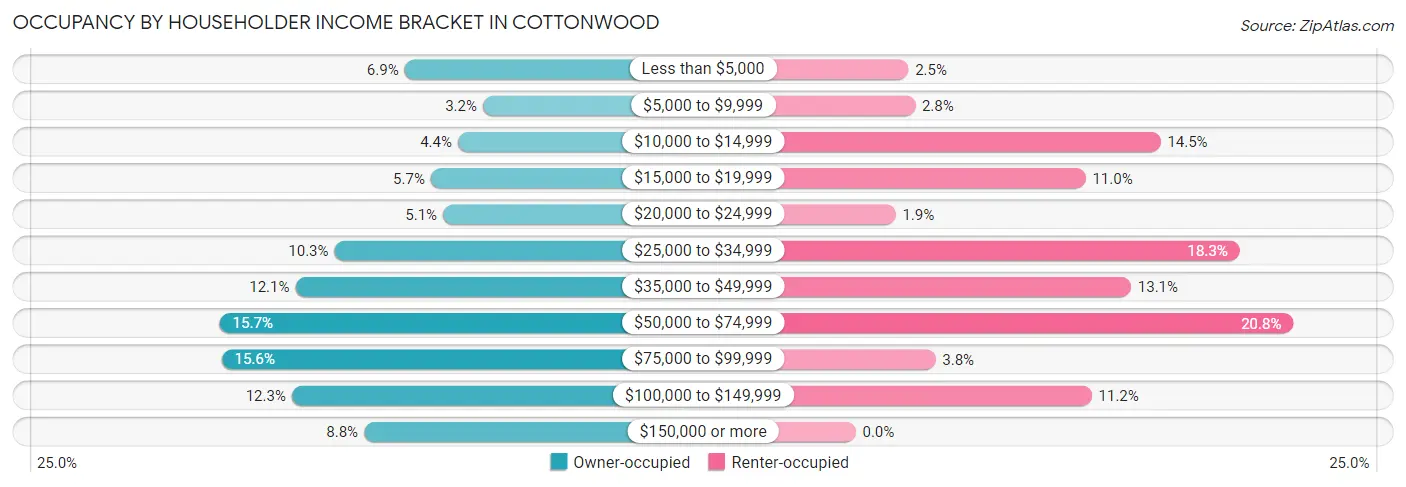
| Income Bracket | Owner-occupied | Renter-occupied |
| Less than $5,000 | 215 (6.9%) | 78 (2.5%) |
| $5,000 to $9,999 | 99 (3.2%) | 88 (2.8%) |
| $10,000 to $14,999 | 136 (4.4%) | 451 (14.5%) |
| $15,000 to $19,999 | 176 (5.7%) | 340 (11.0%) |
| $20,000 to $24,999 | 158 (5.1%) | 59 (1.9%) |
| $25,000 to $34,999 | 319 (10.2%) | 568 (18.3%) |
| $35,000 to $49,999 | 377 (12.1%) | 407 (13.1%) |
| $50,000 to $74,999 | 489 (15.7%) | 647 (20.8%) |
| $75,000 to $99,999 | 486 (15.6%) | 118 (3.8%) |
| $100,000 to $149,999 | 382 (12.3%) | 349 (11.2%) |
| $150,000 or more | 275 (8.8%) | 0 (0.0%) |
| Total | 3,112 (100.0%) | 3,105 (100.0%) |
Monthly Housing Cost Tiers in Cottonwood
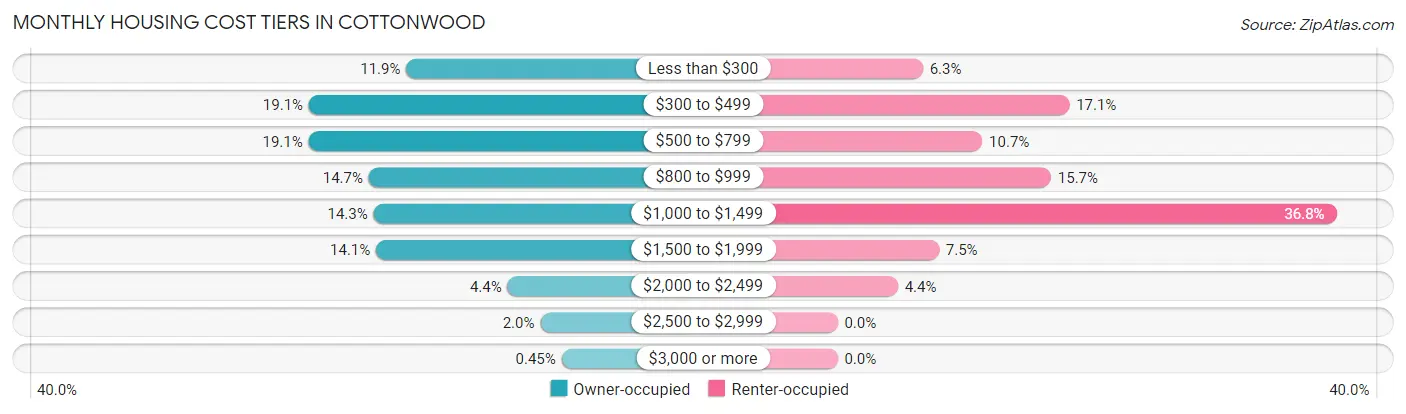
| Monthly Cost | Owner-occupied | Renter-occupied |
| Less than $300 | 370 (11.9%) | 195 (6.3%) |
| $300 to $499 | 593 (19.1%) | 530 (17.1%) |
| $500 to $799 | 594 (19.1%) | 331 (10.7%) |
| $800 to $999 | 456 (14.6%) | 488 (15.7%) |
| $1,000 to $1,499 | 445 (14.3%) | 1,141 (36.7%) |
| $1,500 to $1,999 | 439 (14.1%) | 232 (7.5%) |
| $2,000 to $2,499 | 138 (4.4%) | 138 (4.4%) |
| $2,500 to $2,999 | 63 (2.0%) | 0 (0.0%) |
| $3,000 or more | 14 (0.4%) | 0 (0.0%) |
| Total | 3,112 (100.0%) | 3,105 (100.0%) |
Physical Housing Characteristics in Cottonwood
Housing Structures in Cottonwood
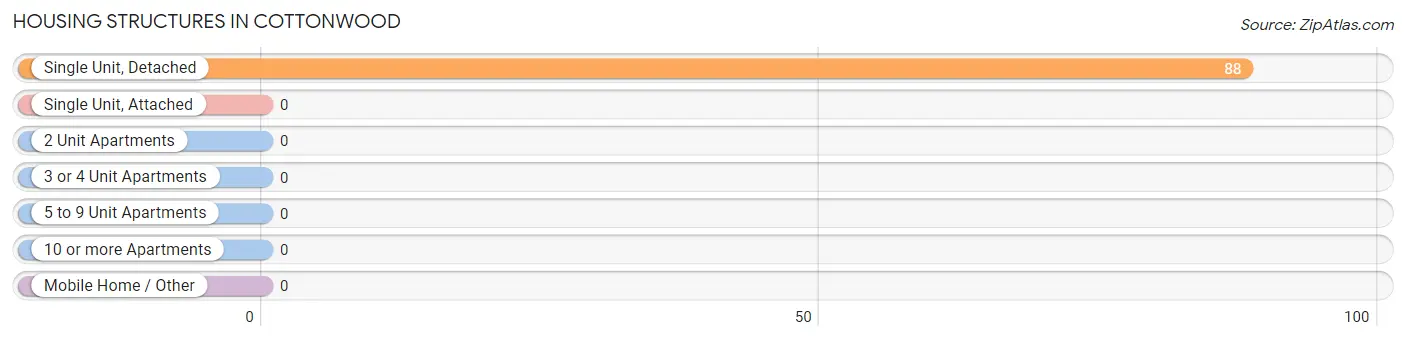
| Structure Type | # Housing Units | % Housing Units |
| Single Unit, Detached | 88 | 100.0% |
| Single Unit, Attached | 0 | 0.0% |
| 2 Unit Apartments | 0 | 0.0% |
| 3 or 4 Unit Apartments | 0 | 0.0% |
| 5 to 9 Unit Apartments | 0 | 0.0% |
| 10 or more Apartments | 0 | 0.0% |
| Mobile Home / Other | 0 | 0.0% |
| Total | 88 | 100.0% |
Housing Structures by Occupancy in Cottonwood
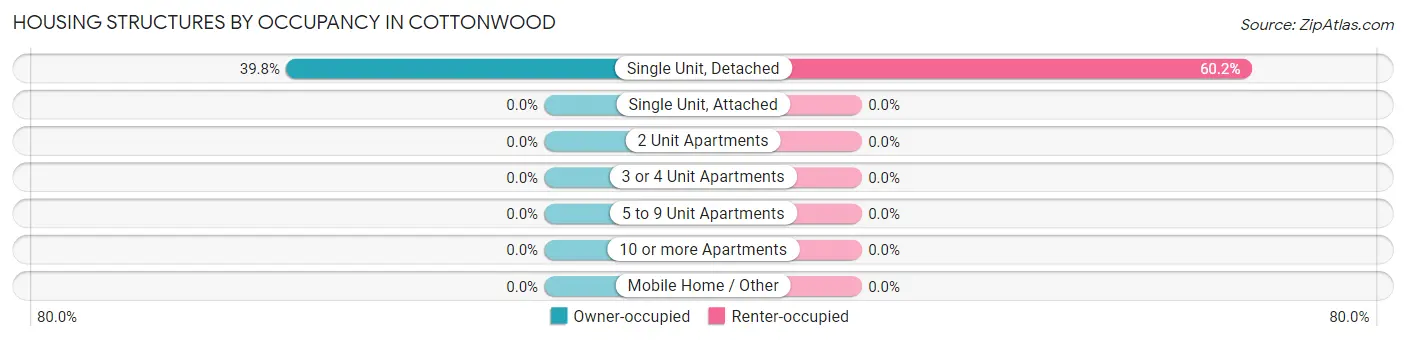
| Structure Type | Owner-occupied | Renter-occupied |
| Single Unit, Detached | 35 (39.8%) | 53 (60.2%) |
| Single Unit, Attached | 0 (0.0%) | 0 (0.0%) |
| 2 Unit Apartments | 0 (0.0%) | 0 (0.0%) |
| 3 or 4 Unit Apartments | 0 (0.0%) | 0 (0.0%) |
| 5 to 9 Unit Apartments | 0 (0.0%) | 0 (0.0%) |
| 10 or more Apartments | 0 (0.0%) | 0 (0.0%) |
| Mobile Home / Other | 0 (0.0%) | 0 (0.0%) |
| Total | 35 (39.8%) | 53 (60.2%) |
Housing Structures by Number of Rooms in Cottonwood
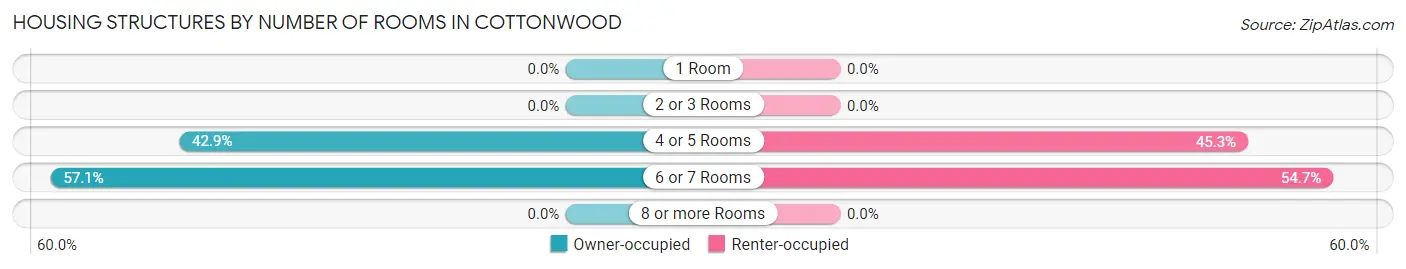
| Number of Rooms | Owner-occupied | Renter-occupied |
| 1 Room | 0 (0.0%) | 0 (0.0%) |
| 2 or 3 Rooms | 0 (0.0%) | 0 (0.0%) |
| 4 or 5 Rooms | 15 (42.9%) | 24 (45.3%) |
| 6 or 7 Rooms | 20 (57.1%) | 29 (54.7%) |
| 8 or more Rooms | 0 (0.0%) | 0 (0.0%) |
| Total | 35 (100.0%) | 53 (100.0%) |
Housing Structure by Heating Type in Cottonwood
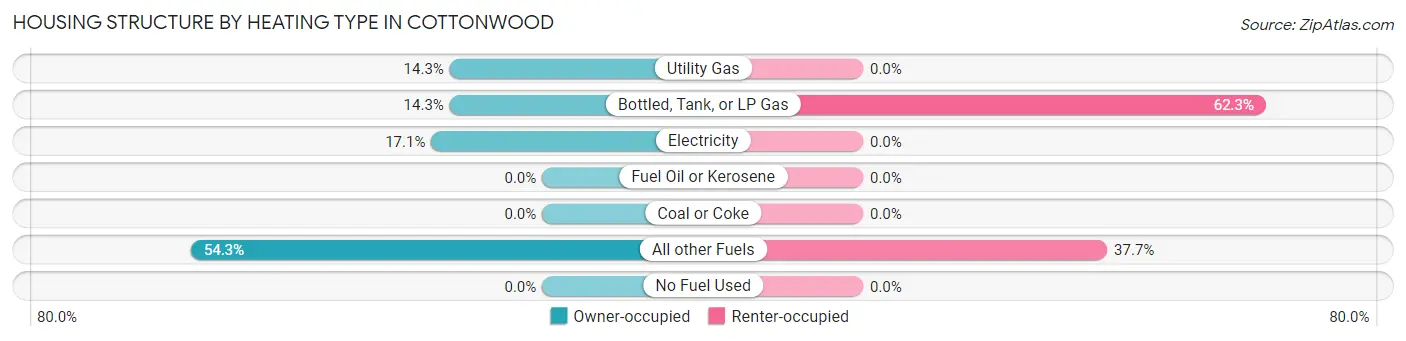
| Heating Type | Owner-occupied | Renter-occupied |
| Utility Gas | 5 (14.3%) | 0 (0.0%) |
| Bottled, Tank, or LP Gas | 5 (14.3%) | 33 (62.3%) |
| Electricity | 6 (17.1%) | 0 (0.0%) |
| Fuel Oil or Kerosene | 0 (0.0%) | 0 (0.0%) |
| Coal or Coke | 0 (0.0%) | 0 (0.0%) |
| All other Fuels | 19 (54.3%) | 20 (37.7%) |
| No Fuel Used | 0 (0.0%) | 0 (0.0%) |
| Total | 35 (100.0%) | 53 (100.0%) |
Household Vehicle Usage in Cottonwood
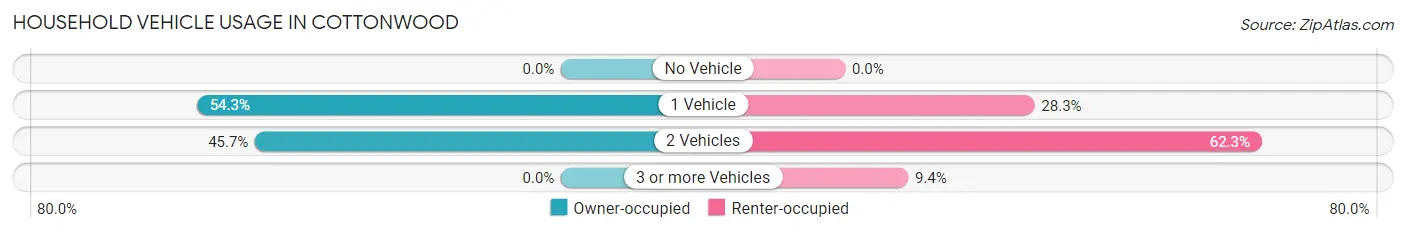
| Vehicles per Household | Owner-occupied | Renter-occupied |
| No Vehicle | 0 (0.0%) | 0 (0.0%) |
| 1 Vehicle | 19 (54.3%) | 15 (28.3%) |
| 2 Vehicles | 16 (45.7%) | 33 (62.3%) |
| 3 or more Vehicles | 0 (0.0%) | 5 (9.4%) |
| Total | 35 (100.0%) | 53 (100.0%) |
Real Estate & Mortgages in Cottonwood
Real Estate and Mortgage Overview in Cottonwood
| Characteristic | Without Mortgage | With Mortgage |
| Housing Units | 1,622 | 1,490 |
| Median Property Value | $178,800 | $320,400 |
| Median Household Income | $33,365 | $159 |
| Monthly Housing Costs | $444 | $0 |
| Real Estate Taxes | $840 | $0 |
Property Value by Mortgage Status in Cottonwood
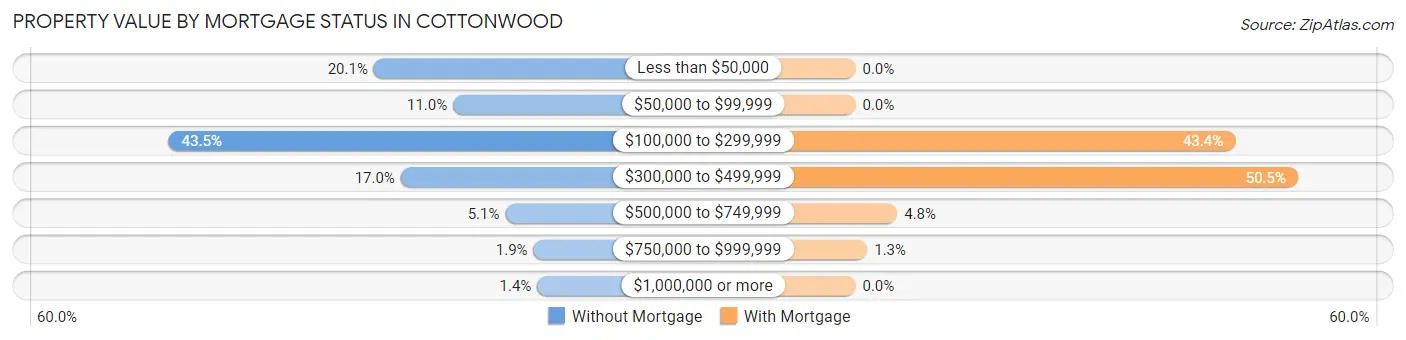
| Property Value | Without Mortgage | With Mortgage |
| Less than $50,000 | 326 (20.1%) | 0 (0.0%) |
| $50,000 to $99,999 | 179 (11.0%) | 0 (0.0%) |
| $100,000 to $299,999 | 706 (43.5%) | 646 (43.4%) |
| $300,000 to $499,999 | 276 (17.0%) | 753 (50.5%) |
| $500,000 to $749,999 | 82 (5.1%) | 71 (4.8%) |
| $750,000 to $999,999 | 30 (1.8%) | 20 (1.3%) |
| $1,000,000 or more | 23 (1.4%) | 0 (0.0%) |
| Total | 1,622 (100.0%) | 1,490 (100.0%) |
Household Income by Mortgage Status in Cottonwood
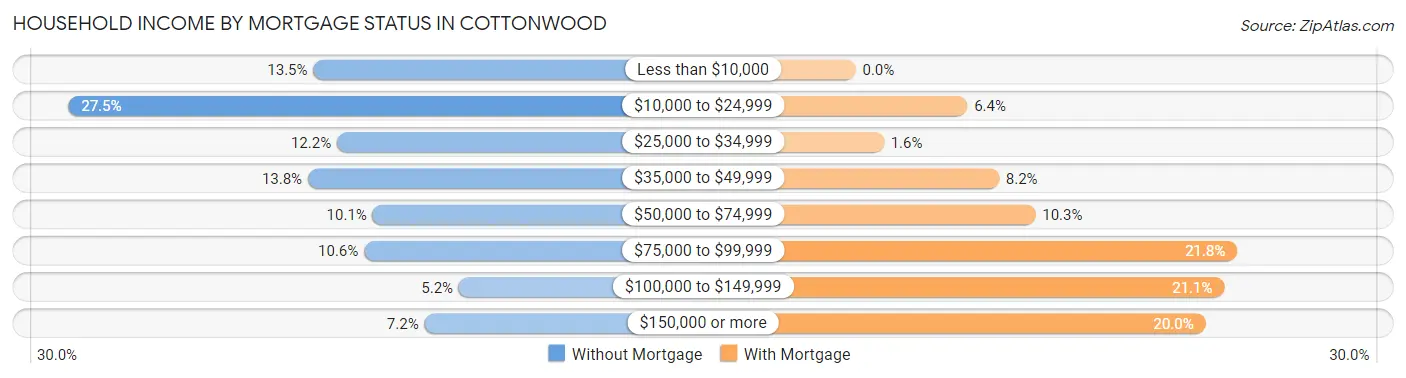
| Household Income | Without Mortgage | With Mortgage |
| Less than $10,000 | 219 (13.5%) | 0 (0.0%) |
| $10,000 to $24,999 | 446 (27.5%) | 95 (6.4%) |
| $25,000 to $34,999 | 197 (12.1%) | 24 (1.6%) |
| $35,000 to $49,999 | 224 (13.8%) | 122 (8.2%) |
| $50,000 to $74,999 | 164 (10.1%) | 153 (10.3%) |
| $75,000 to $99,999 | 172 (10.6%) | 325 (21.8%) |
| $100,000 to $149,999 | 84 (5.2%) | 314 (21.1%) |
| $150,000 or more | 116 (7.1%) | 298 (20.0%) |
| Total | 1,622 (100.0%) | 1,490 (100.0%) |
Property Value to Household Income Ratio in Cottonwood
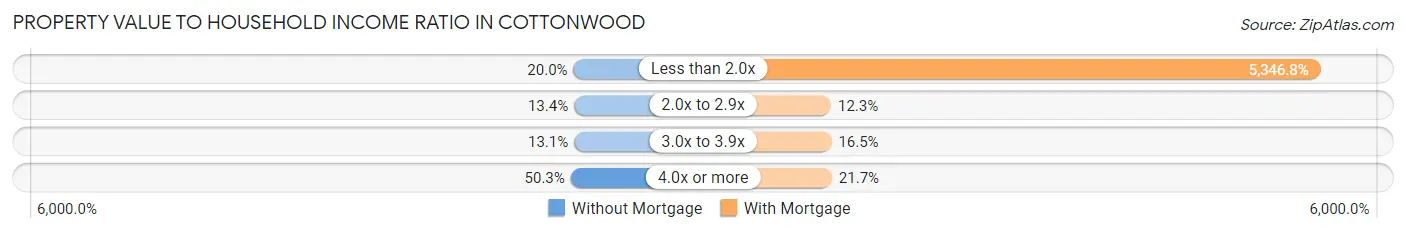
| Value-to-Income Ratio | Without Mortgage | With Mortgage |
| Less than 2.0x | 324 (20.0%) | 79,667 (5,346.8%) |
| 2.0x to 2.9x | 217 (13.4%) | 183 (12.3%) |
| 3.0x to 3.9x | 212 (13.1%) | 246 (16.5%) |
| 4.0x or more | 816 (50.3%) | 323 (21.7%) |
| Total | 1,622 (100.0%) | 1,490 (100.0%) |
Real Estate Taxes by Mortgage Status in Cottonwood
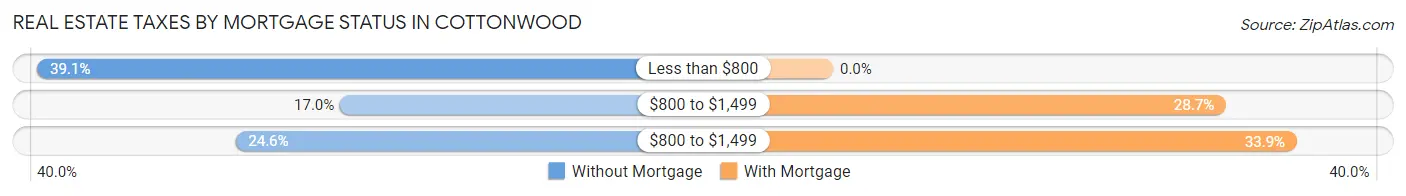
| Property Taxes | Without Mortgage | With Mortgage |
| Less than $800 | 634 (39.1%) | 0 (0.0%) |
| $800 to $1,499 | 275 (17.0%) | 428 (28.7%) |
| $800 to $1,499 | 399 (24.6%) | 505 (33.9%) |
| Total | 1,622 (100.0%) | 1,490 (100.0%) |
Health & Disability in Cottonwood
Health Insurance Coverage by Age in Cottonwood
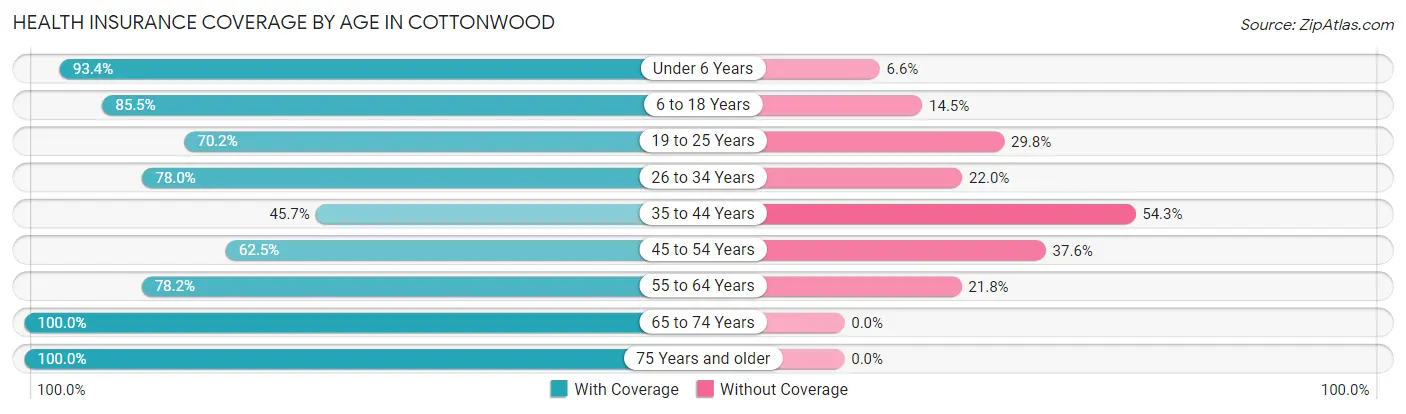
| Age Bracket | With Coverage | Without Coverage |
| Under 6 Years | 582 (93.4%) | 41 (6.6%) |
| 6 to 18 Years | 1,149 (85.5%) | 195 (14.5%) |
| 19 to 25 Years | 535 (70.2%) | 227 (29.8%) |
| 26 to 34 Years | 692 (78.0%) | 195 (22.0%) |
| 35 to 44 Years | 718 (45.7%) | 852 (54.3%) |
| 45 to 54 Years | 622 (62.5%) | 374 (37.6%) |
| 55 to 64 Years | 1,550 (78.2%) | 433 (21.8%) |
| 65 to 74 Years | 2,229 (100.0%) | 0 (0.0%) |
| 75 Years and older | 1,856 (100.0%) | 0 (0.0%) |
| Total | 9,933 (81.1%) | 2,317 (18.9%) |
Health Insurance Coverage by Citizenship Status in Cottonwood
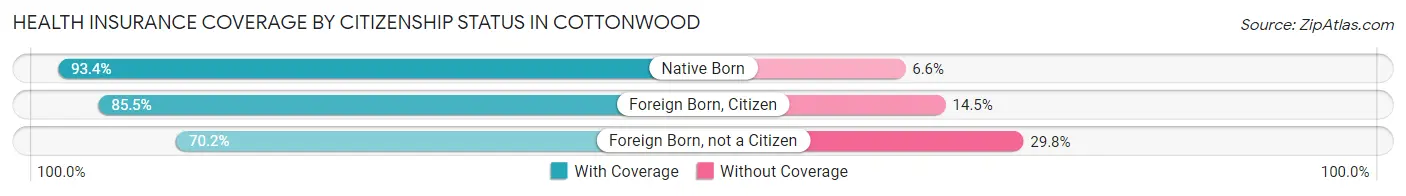
| Citizenship Status | With Coverage | Without Coverage |
| Native Born | 582 (93.4%) | 41 (6.6%) |
| Foreign Born, Citizen | 1,149 (85.5%) | 195 (14.5%) |
| Foreign Born, not a Citizen | 535 (70.2%) | 227 (29.8%) |
Health Insurance Coverage by Household Income in Cottonwood
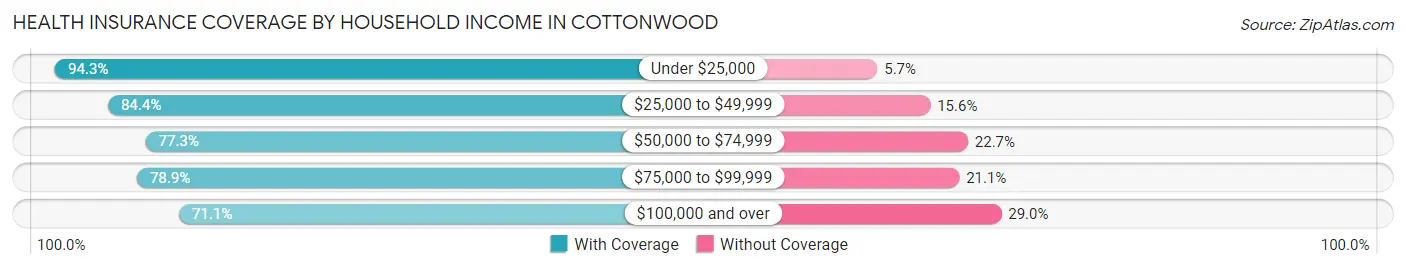
| Household Income | With Coverage | Without Coverage |
| Under $25,000 | 2,014 (94.3%) | 122 (5.7%) |
| $25,000 to $49,999 | 2,543 (84.4%) | 471 (15.6%) |
| $50,000 to $74,999 | 1,930 (77.3%) | 566 (22.7%) |
| $75,000 to $99,999 | 1,424 (78.9%) | 380 (21.1%) |
| $100,000 and over | 1,890 (71.1%) | 770 (28.9%) |
Public vs Private Health Insurance Coverage by Age in Cottonwood
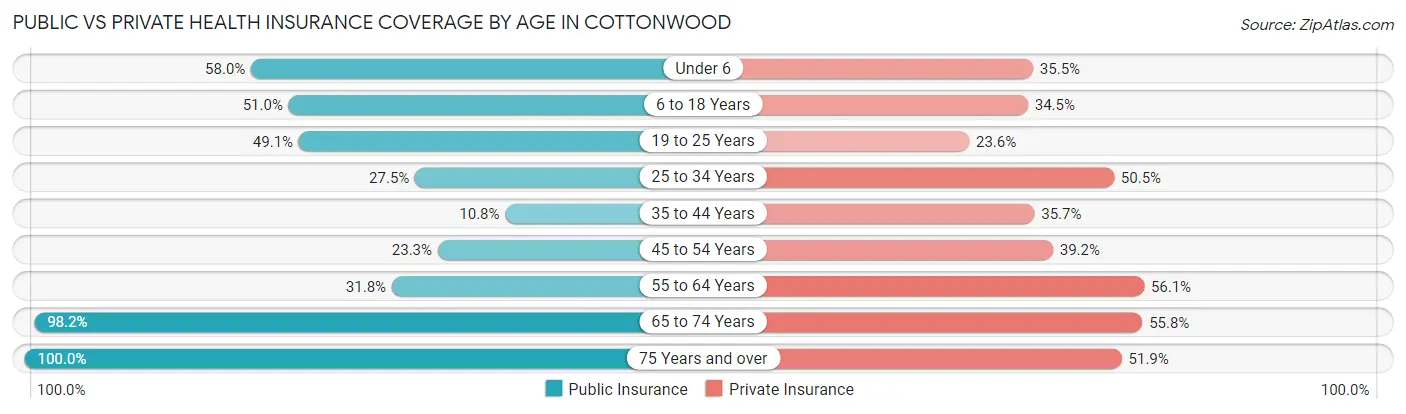
| Age Bracket | Public Insurance | Private Insurance |
| Under 6 | 361 (58.0%) | 221 (35.5%) |
| 6 to 18 Years | 685 (51.0%) | 464 (34.5%) |
| 19 to 25 Years | 374 (49.1%) | 180 (23.6%) |
| 25 to 34 Years | 244 (27.5%) | 448 (50.5%) |
| 35 to 44 Years | 169 (10.8%) | 561 (35.7%) |
| 45 to 54 Years | 232 (23.3%) | 390 (39.2%) |
| 55 to 64 Years | 631 (31.8%) | 1,112 (56.1%) |
| 65 to 74 Years | 2,189 (98.2%) | 1,243 (55.8%) |
| 75 Years and over | 1,856 (100.0%) | 964 (51.9%) |
| Total | 6,741 (55.0%) | 5,583 (45.6%) |
Disability Status by Sex by Age in Cottonwood

| Age Bracket | Male | Female |
| Under 5 Years | 0 (0.0%) | 0 (0.0%) |
| 5 to 17 Years | 103 (16.1%) | 0 (0.0%) |
| 18 to 34 Years | 85 (11.1%) | 93 (9.3%) |
| 35 to 64 Years | 503 (20.1%) | 296 (14.5%) |
| 65 to 74 Years | 181 (24.4%) | 469 (31.5%) |
| 75 Years and over | 376 (60.7%) | 693 (56.0%) |
Disability Class by Sex by Age in Cottonwood
Disability Class: Hearing Difficulty
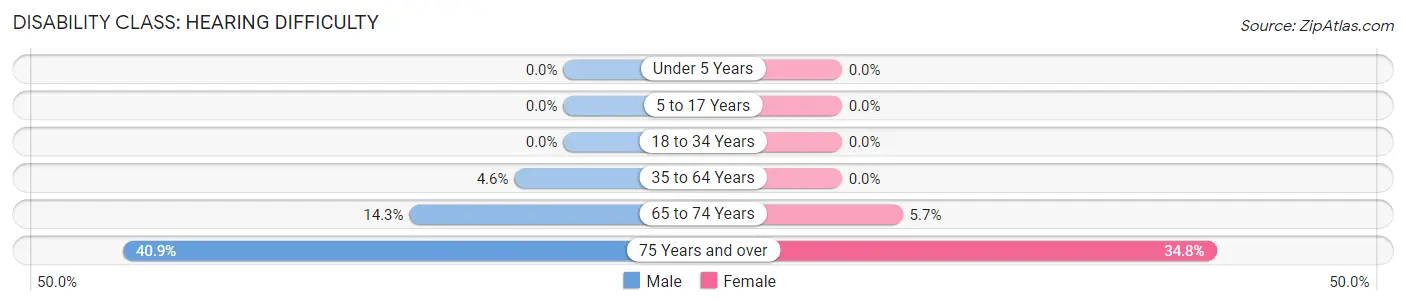
| Age Bracket | Male | Female |
| Under 5 Years | 0 (0.0%) | 0 (0.0%) |
| 5 to 17 Years | 0 (0.0%) | 0 (0.0%) |
| 18 to 34 Years | 0 (0.0%) | 0 (0.0%) |
| 35 to 64 Years | 114 (4.5%) | 0 (0.0%) |
| 65 to 74 Years | 106 (14.3%) | 84 (5.7%) |
| 75 Years and over | 253 (40.9%) | 430 (34.8%) |
Disability Class: Vision Difficulty
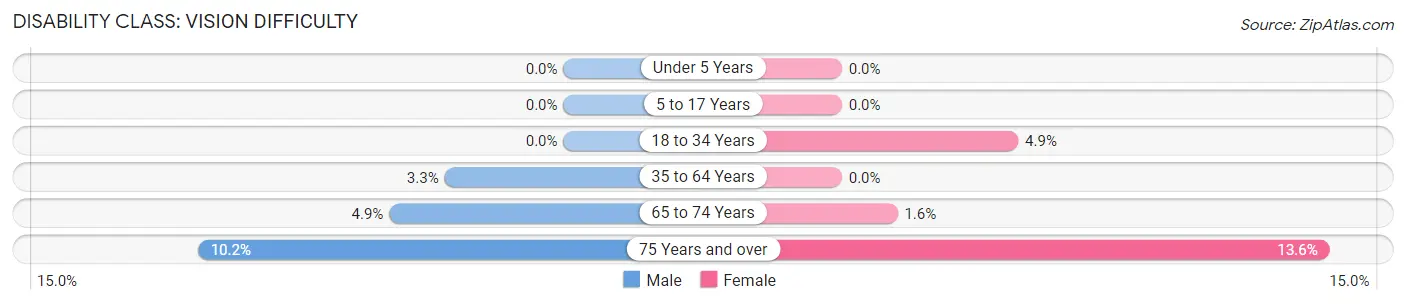
| Age Bracket | Male | Female |
| Under 5 Years | 0 (0.0%) | 0 (0.0%) |
| 5 to 17 Years | 0 (0.0%) | 0 (0.0%) |
| 18 to 34 Years | 0 (0.0%) | 49 (4.9%) |
| 35 to 64 Years | 83 (3.3%) | 0 (0.0%) |
| 65 to 74 Years | 36 (4.9%) | 23 (1.5%) |
| 75 Years and over | 63 (10.2%) | 168 (13.6%) |
Disability Class: Cognitive Difficulty
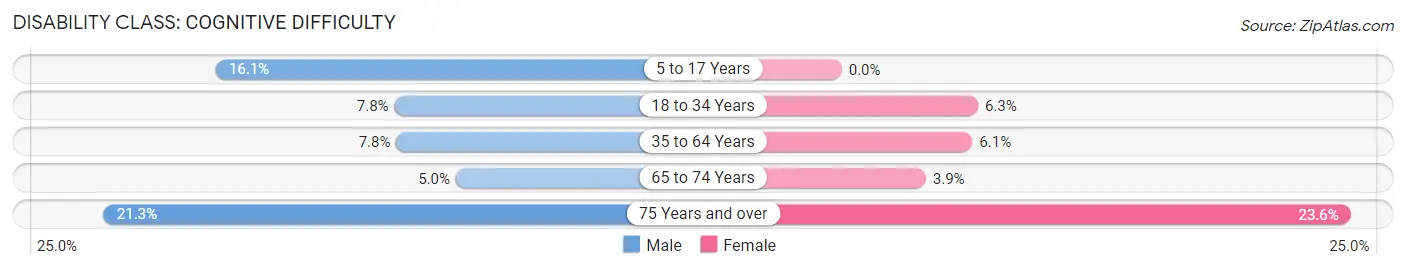
| Age Bracket | Male | Female |
| 5 to 17 Years | 103 (16.1%) | 0 (0.0%) |
| 18 to 34 Years | 60 (7.8%) | 63 (6.3%) |
| 35 to 64 Years | 194 (7.7%) | 124 (6.1%) |
| 65 to 74 Years | 37 (5.0%) | 58 (3.9%) |
| 75 Years and over | 132 (21.3%) | 292 (23.6%) |
Disability Class: Ambulatory Difficulty
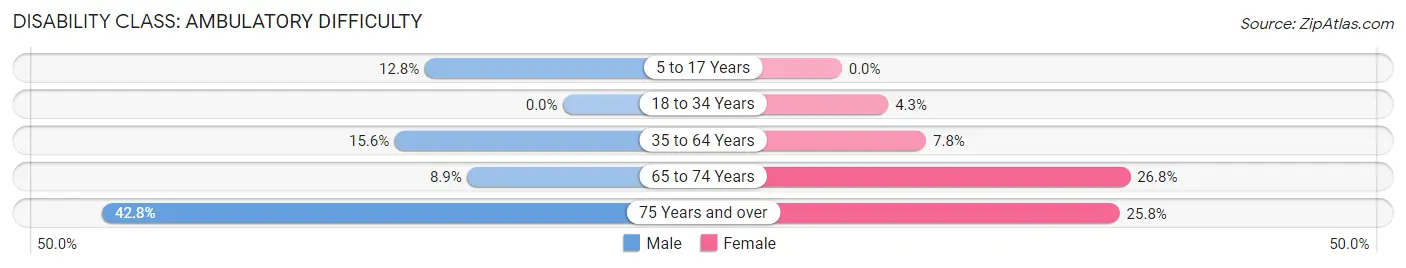
| Age Bracket | Male | Female |
| 5 to 17 Years | 82 (12.8%) | 0 (0.0%) |
| 18 to 34 Years | 0 (0.0%) | 43 (4.3%) |
| 35 to 64 Years | 391 (15.6%) | 160 (7.8%) |
| 65 to 74 Years | 66 (8.9%) | 398 (26.8%) |
| 75 Years and over | 265 (42.8%) | 319 (25.8%) |
Disability Class: Self-Care Difficulty
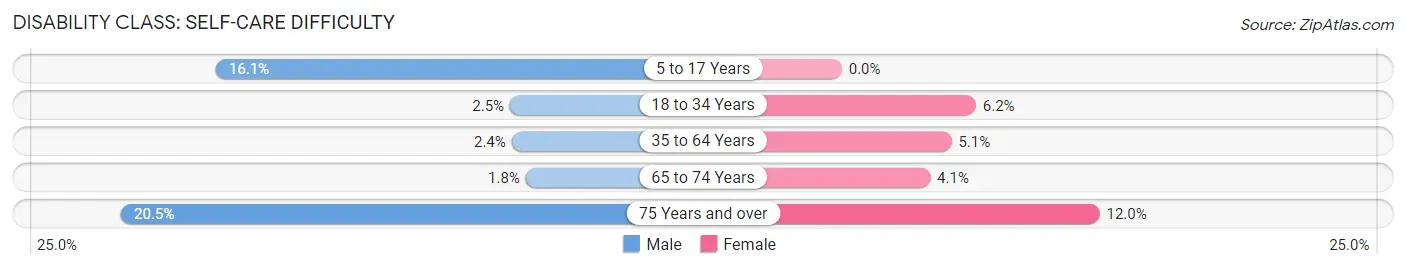
| Age Bracket | Male | Female |
| 5 to 17 Years | 103 (16.1%) | 0 (0.0%) |
| 18 to 34 Years | 19 (2.5%) | 62 (6.2%) |
| 35 to 64 Years | 60 (2.4%) | 104 (5.1%) |
| 65 to 74 Years | 13 (1.8%) | 61 (4.1%) |
| 75 Years and over | 127 (20.5%) | 148 (12.0%) |
Technology Access in Cottonwood
Computing Device Access in Cottonwood
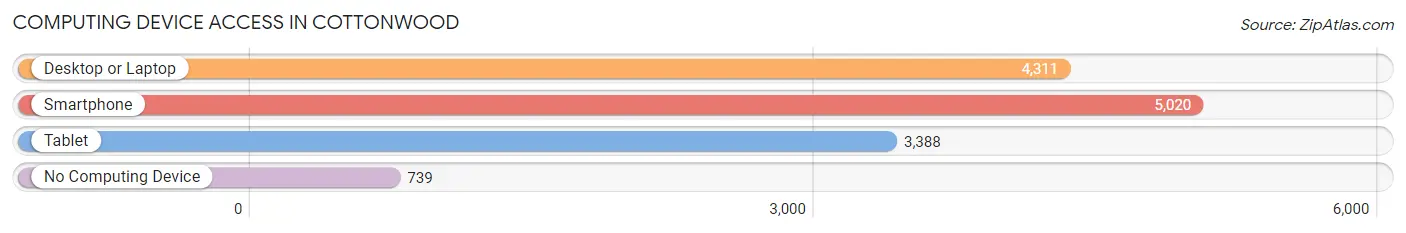
| Device Type | # Households | % Households |
| Desktop or Laptop | 4,311 | 69.3% |
| Smartphone | 5,020 | 80.7% |
| Tablet | 3,388 | 54.5% |
| No Computing Device | 739 | 11.9% |
| Total | 6,217 | 100.0% |
Internet Access in Cottonwood
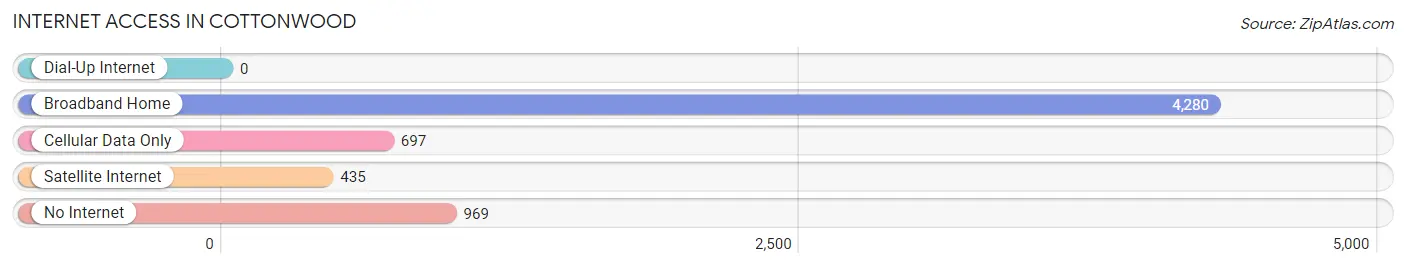
| Internet Type | # Households | % Households |
| Dial-Up Internet | 0 | 0.0% |
| Broadband Home | 4,280 | 68.8% |
| Cellular Data Only | 697 | 11.2% |
| Satellite Internet | 435 | 7.0% |
| No Internet | 969 | 15.6% |
| Total | 6,217 | 100.0% |
Cottonwood Summary
Cottonwood, Arizona is a small city located in the Verde Valley of Central Arizona. It is situated in the heart of the Verde Valley, between the cities of Sedona and Flagstaff. Cottonwood is the county seat of Yavapai County and is home to approximately 11,000 people.
History
The area that is now Cottonwood was first inhabited by the Yavapai people, who were the original inhabitants of the Verde Valley. The Yavapai were a peaceful people who lived in the area for centuries before the arrival of the first European settlers.
The first Europeans to settle in the area were miners who arrived in the late 1800s. They were drawn to the area by the discovery of gold and silver in the nearby hills. The miners established a small settlement, which they named Cottonwood, after the cottonwood trees that grew in the area.
The town of Cottonwood was officially established in 1879 and was incorporated in 1960. The town quickly grew and became an important center for the mining industry in the area. In the early 1900s, the town was home to several large mines, including the United Verde Copper Mine, which was one of the largest copper mines in the world at the time.
The town also became an important center for agriculture in the area. Cottonwood was home to several large farms and ranches, which produced a variety of crops, including cotton, alfalfa, and wheat.
Geography
Cottonwood is located in the Verde Valley of Central Arizona. It is situated in the heart of the Verde Valley, between the cities of Sedona and Flagstaff. The city is located at an elevation of 3,400 feet and is surrounded by the Coconino National Forest.
The city is located in a semi-arid climate, with hot summers and mild winters. The average annual temperature is around 70 degrees Fahrenheit. The area receives an average of 12 inches of precipitation per year, most of which falls in the summer months.
Economy
Cottonwood’s economy is largely based on tourism and agriculture. The city is home to several wineries, which attract visitors from all over the world. The city is also home to several large farms and ranches, which produce a variety of crops, including cotton, alfalfa, and wheat.
The city is also home to several manufacturing companies, which produce a variety of products, including furniture, clothing, and electronics. The city is also home to several retail stores, which sell a variety of goods, including clothing, jewelry, and home goods.
Demographics
As of the 2010 census, the population of Cottonwood was 11,265. The racial makeup of the city was 87.3% White, 0.7% African American, 1.2% Native American, 0.7% Asian, 0.1% Pacific Islander, 8.2% from other races, and 2.0% from two or more races. Hispanic or Latino of any race were 16.3% of the population.
The median household income in Cottonwood was $37,917, and the median family income was $45,938. The per capita income for the city was $20,945. About 14.3% of families and 17.7% of the population were below the poverty line, including 25.2% of those under age 18 and 8.2% of those age 65 or over.
Cottonwood is a small city with a rich history and a diverse economy. It is home to several wineries, farms, and manufacturing companies, which provide employment opportunities for the city’s residents. The city is also home to several retail stores, which attract visitors from all over the world. Cottonwood is a great place to live, work, and visit.
Common Questions
What is Per Capita Income in Cottonwood?
Per Capita income in Cottonwood is $29,166.
What is the Median Family Income in Cottonwood?
Median Family Income in Cottonwood is $64,744.
What is the Median Household income in Cottonwood?
Median Household Income in Cottonwood is $43,273.
What is Income or Wage Gap in Cottonwood?
Income or Wage Gap in Cottonwood is 25.0%.
Women in Cottonwood earn 75.0 cents for every dollar earned by a man.
What is Inequality or Gini Index in Cottonwood?
Inequality or Gini Index in Cottonwood is 0.45.
What is the Total Population of Cottonwood?
Total Population of Cottonwood is 12,314.
What is the Total Male Population of Cottonwood?
Total Male Population of Cottonwood is 5,762.
What is the Total Female Population of Cottonwood?
Total Female Population of Cottonwood is 6,552.
What is the Ratio of Males per 100 Females in Cottonwood?
There are 87.94 Males per 100 Females in Cottonwood.
What is the Ratio of Females per 100 Males in Cottonwood?
There are 113.71 Females per 100 Males in Cottonwood.
What is the Median Population Age in Cottonwood?
Median Population Age in Cottonwood is 54.9 Years.
What is the Average Family Size in Cottonwood
Average Family Size in Cottonwood is 2.9 People.
What is the Average Household Size in Cottonwood
Average Household Size in Cottonwood is 1.9 People.
How Large is the Labor Force in Cottonwood?
There are 5,221 People in the Labor Forcein in Cottonwood.
What is the Percentage of People in the Labor Force in Cottonwood?
48.6% of People are in the Labor Force in Cottonwood.
What is the Unemployment Rate in Cottonwood?
Unemployment Rate in Cottonwood is 2.8%.