Pine Ridge, SD Map & Demographics
Pine Ridge Map
Pine Ridge Overview
$10,806
PER CAPITA INCOME
$47,981
AVG FAMILY INCOME
$47,620
AVG HOUSEHOLD INCOME
15.6%
WAGE / INCOME GAP [ % ]
84.4¢/ $1
WAGE / INCOME GAP [ $ ]
0.38
INEQUALITY / GINI INDEX
2,921
TOTAL POPULATION
1,454
MALE POPULATION
1,467
FEMALE POPULATION
99.11
MALES / 100 FEMALES
100.89
FEMALES / 100 MALES
25.1
MEDIAN AGE
6.0
AVG FAMILY SIZE
5.8
AVG HOUSEHOLD SIZE
839
LABOR FORCE [ PEOPLE ]
44.5%
PERCENT IN LABOR FORCE
7.9%
UNEMPLOYMENT RATE
Pine Ridge Zip Codes
Pine Ridge Area Codes
Income in Pine Ridge
Income Overview in Pine Ridge
Per Capita Income in Pine Ridge is $10,806, while median incomes of families and households are $47,981 and $47,620 respectively.
| Characteristic | Number | Measure |
| Per Capita Income | 2,921 | $10,806 |
| Median Family Income | 442 | $47,981 |
| Mean Family Income | 442 | $53,872 |
| Median Household Income | 503 | $47,620 |
| Mean Household Income | 503 | $51,483 |
| Income Deficit | 442 | $0 |
| Wage / Income Gap (%) | 2,921 | 15.63% |
| Wage / Income Gap ($) | 2,921 | 84.37¢ per $1 |
| Gini / Inequality Index | 2,921 | 0.38 |
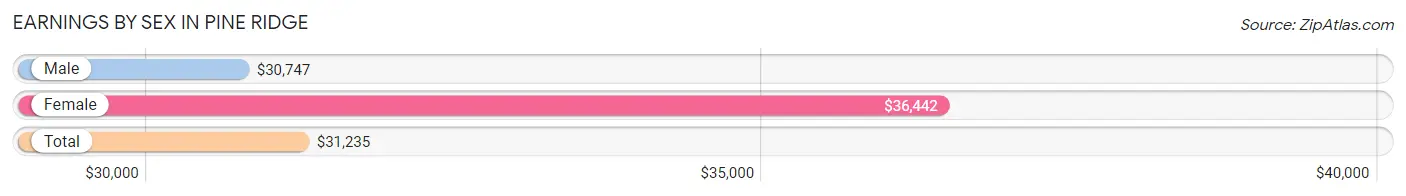
Earnings by Sex in Pine Ridge
Average Earnings in Pine Ridge are $31,235, $30,747 for men and $36,442 for women, a difference of 15.6%.
| Sex | Number | Average Earnings |
| Male | 385 (45.4%) | $30,747 |
| Female | 463 (54.6%) | $36,442 |
| Total | 848 (100.0%) | $31,235 |
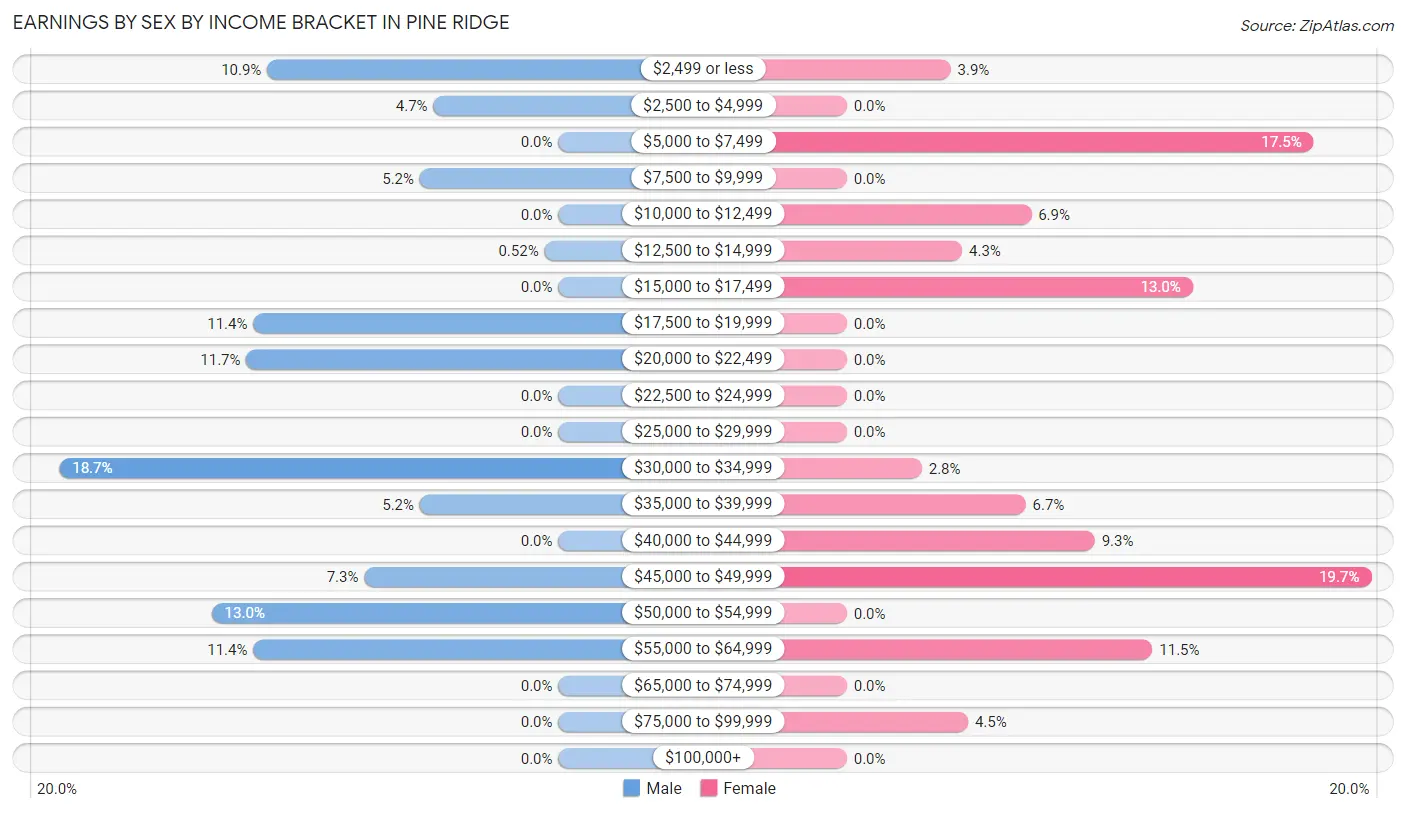
Earnings by Sex by Income Bracket in Pine Ridge
The most common earnings brackets in Pine Ridge are $30,000 to $34,999 for men (72 | 18.7%) and $45,000 to $49,999 for women (91 | 19.7%).
| Income | Male | Female |
| $2,499 or less | 42 (10.9%) | 18 (3.9%) |
| $2,500 to $4,999 | 18 (4.7%) | 0 (0.0%) |
| $5,000 to $7,499 | 0 (0.0%) | 81 (17.5%) |
| $7,500 to $9,999 | 20 (5.2%) | 0 (0.0%) |
| $10,000 to $12,499 | 0 (0.0%) | 32 (6.9%) |
| $12,500 to $14,999 | 2 (0.5%) | 20 (4.3%) |
| $15,000 to $17,499 | 0 (0.0%) | 60 (13.0%) |
| $17,500 to $19,999 | 44 (11.4%) | 0 (0.0%) |
| $20,000 to $22,499 | 45 (11.7%) | 0 (0.0%) |
| $22,500 to $24,999 | 0 (0.0%) | 0 (0.0%) |
| $25,000 to $29,999 | 0 (0.0%) | 0 (0.0%) |
| $30,000 to $34,999 | 72 (18.7%) | 13 (2.8%) |
| $35,000 to $39,999 | 20 (5.2%) | 31 (6.7%) |
| $40,000 to $44,999 | 0 (0.0%) | 43 (9.3%) |
| $45,000 to $49,999 | 28 (7.3%) | 91 (19.7%) |
| $50,000 to $54,999 | 50 (13.0%) | 0 (0.0%) |
| $55,000 to $64,999 | 44 (11.4%) | 53 (11.5%) |
| $65,000 to $74,999 | 0 (0.0%) | 0 (0.0%) |
| $75,000 to $99,999 | 0 (0.0%) | 21 (4.5%) |
| $100,000+ | 0 (0.0%) | 0 (0.0%) |
| Total | 385 (100.0%) | 463 (100.0%) |
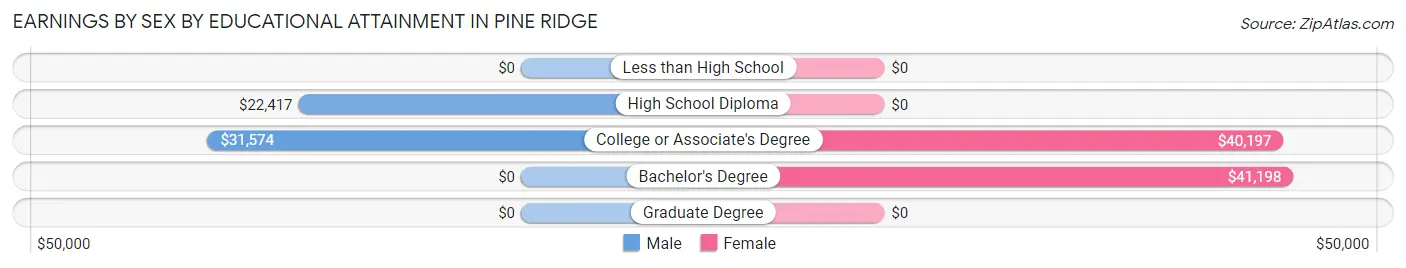
Earnings by Sex by Educational Attainment in Pine Ridge
Average earnings in Pine Ridge are $30,451 for men and $40,378 for women, a difference of 24.6%. Men with an educational attainment of college or associate's degree enjoy the highest average annual earnings of $31,574, while those with high school diploma education earn the least with $22,417. Women with an educational attainment of bachelor's degree earn the most with the average annual earnings of $41,198, while those with college or associate's degree education have the smallest earnings of $40,197.
| Educational Attainment | Male Income | Female Income |
| Less than High School | - | - |
| High School Diploma | $22,417 | $0 |
| College or Associate's Degree | $31,574 | $40,197 |
| Bachelor's Degree | - | - |
| Graduate Degree | - | - |
| Total | $30,451 | $40,378 |
Family Income in Pine Ridge
Family Income Brackets in Pine Ridge
According to the Pine Ridge family income data, there are 116 families falling into the $35,000 to $49,999 income range, which is the most common income bracket and makes up 26.2% of all families.
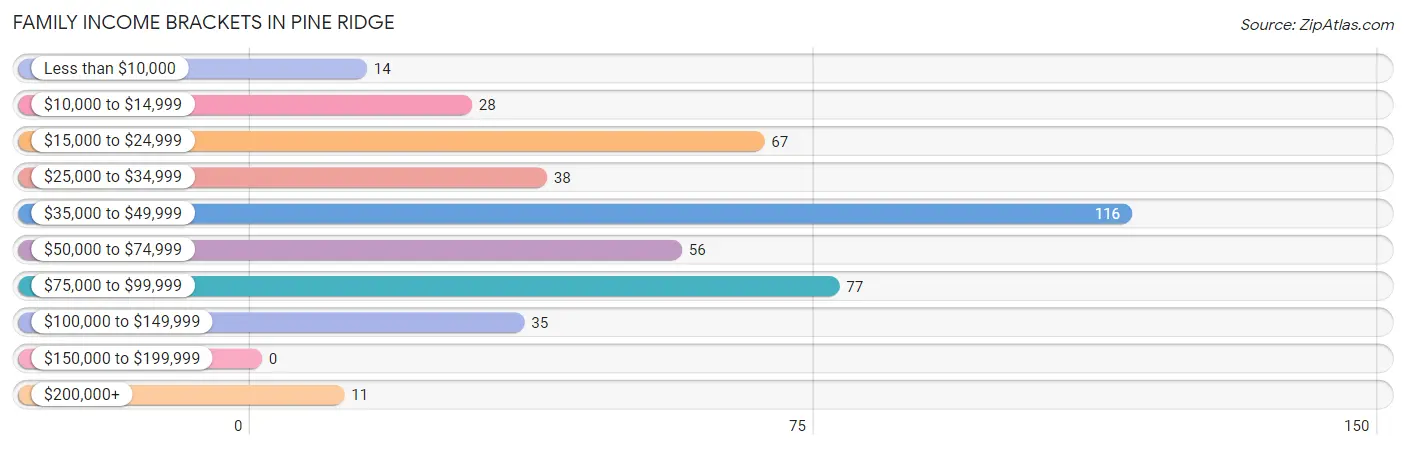
| Income Bracket | # Families | % Families |
| Less than $10,000 | 14 | 3.2% |
| $10,000 to $14,999 | 28 | 6.3% |
| $15,000 to $24,999 | 67 | 15.2% |
| $25,000 to $34,999 | 38 | 8.6% |
| $35,000 to $49,999 | 116 | 26.2% |
| $50,000 to $74,999 | 56 | 12.7% |
| $75,000 to $99,999 | 77 | 17.4% |
| $100,000 to $149,999 | 35 | 7.9% |
| $150,000 to $199,999 | 0 | 0.0% |
| $200,000+ | 11 | 2.5% |
Family Income by Famaliy Size in Pine Ridge
4-person families (112 | 25.3%) account for the highest median family income in Pine Ridge with $73,971 per family, while 4-person families (112 | 25.3%) have the highest median income of $18,493 per family member.
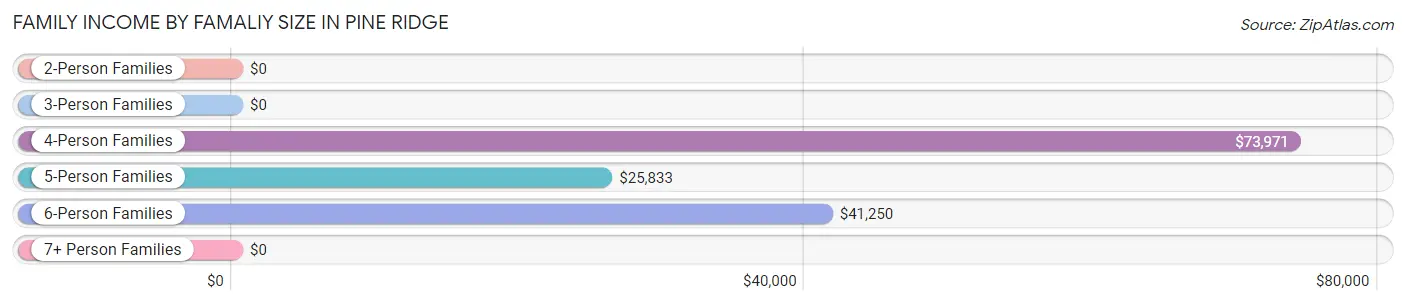
| Income Bracket | # Families | Median Income |
| 2-Person Families | 51 (11.5%) | $0 |
| 3-Person Families | 63 (14.2%) | $0 |
| 4-Person Families | 112 (25.3%) | $73,971 |
| 5-Person Families | 46 (10.4%) | $25,833 |
| 6-Person Families | 112 (25.3%) | $41,250 |
| 7+ Person Families | 58 (13.1%) | $0 |
| Total | 442 (100.0%) | $47,981 |
Family Income by Number of Earners in Pine Ridge
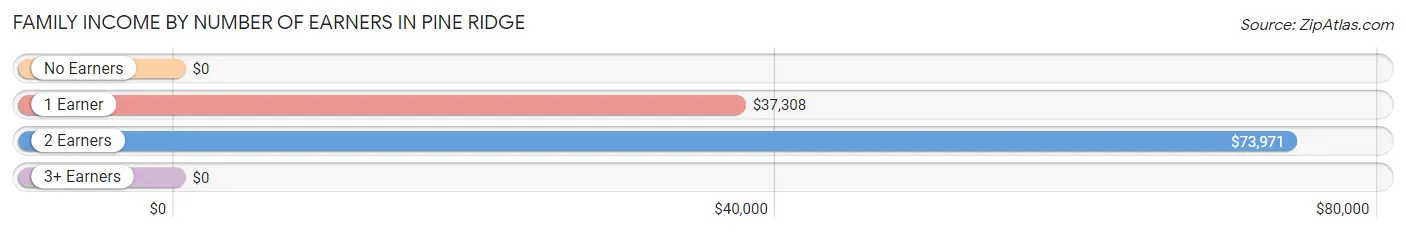
| Number of Earners | # Families | Median Income |
| No Earners | 18 (4.1%) | $0 |
| 1 Earner | 236 (53.4%) | $37,308 |
| 2 Earners | 158 (35.7%) | $73,971 |
| 3+ Earners | 30 (6.8%) | $0 |
| Total | 442 (100.0%) | $47,981 |
Household Income in Pine Ridge
Household Income Brackets in Pine Ridge
With 116 households falling in the category, the $35,000 to $49,999 income range is the most frequent in Pine Ridge, accounting for 23.1% of all households.
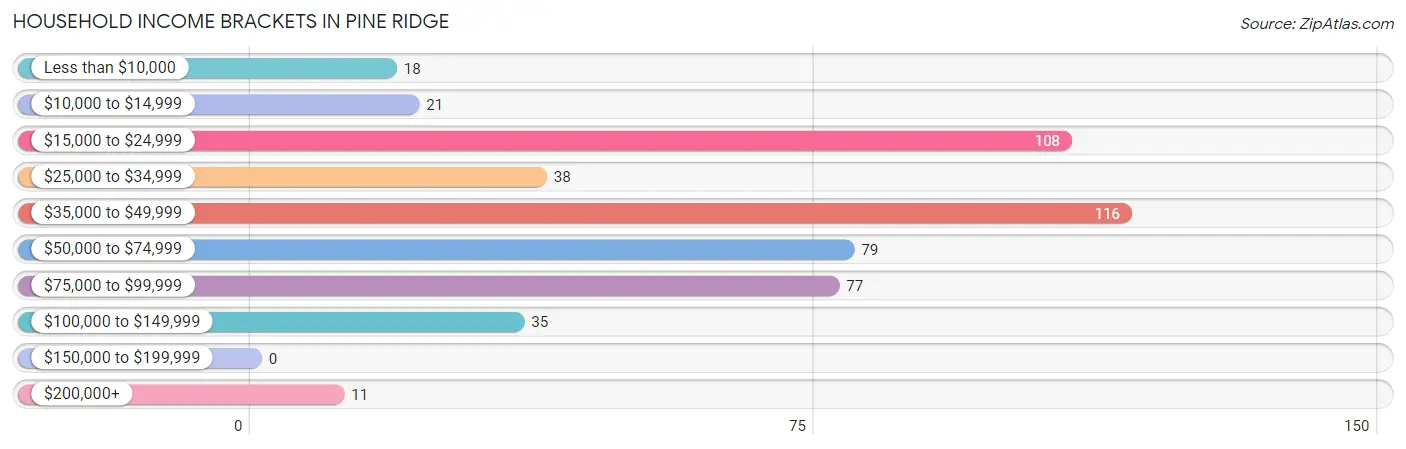
| Income Bracket | # Households | % Households |
| Less than $10,000 | 18 | 3.6% |
| $10,000 to $14,999 | 21 | 4.2% |
| $15,000 to $24,999 | 108 | 21.5% |
| $25,000 to $34,999 | 38 | 7.6% |
| $35,000 to $49,999 | 116 | 23.1% |
| $50,000 to $74,999 | 79 | 15.7% |
| $75,000 to $99,999 | 77 | 15.3% |
| $100,000 to $149,999 | 35 | 7.0% |
| $150,000 to $199,999 | 0 | 0.0% |
| $200,000+ | 11 | 2.2% |
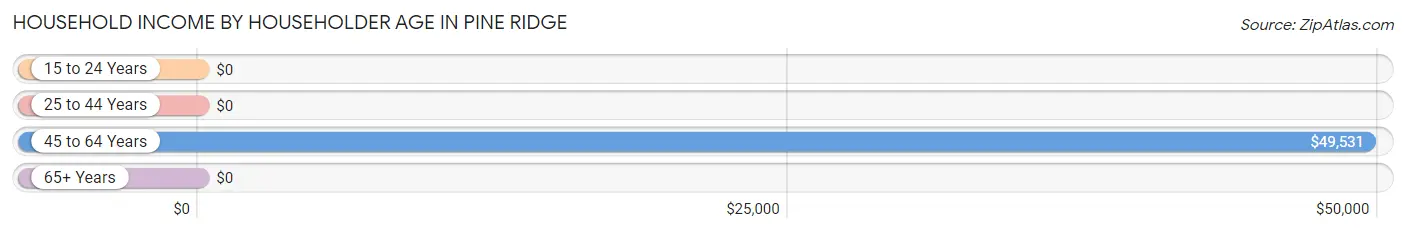
Household Income by Householder Age in Pine Ridge
The median household income in Pine Ridge is $47,620, with the highest median household income of $49,531 found in the 45 to 64 years age bracket for the primary householder. A total of 340 households (67.6%) fall into this category. Meanwhile, the 15 to 24 years age bracket for the primary householder has the lowest median household income of $0, with 4 households (0.8%) in this group.
| Income Bracket | # Households | Median Income |
| 15 to 24 Years | 4 (0.8%) | $0 |
| 25 to 44 Years | 85 (16.9%) | $0 |
| 45 to 64 Years | 340 (67.6%) | $49,531 |
| 65+ Years | 74 (14.7%) | $0 |
| Total | 503 (100.0%) | $47,620 |
Poverty in Pine Ridge
Income Below Poverty by Sex and Age in Pine Ridge
With 49.1% poverty level for males and 46.3% for females among the residents of Pine Ridge, 15 year old males and 35 to 44 year old females are the most vulnerable to poverty, with 33 males (68.8%) and 202 females (93.5%) in their respective age groups living below the poverty level.
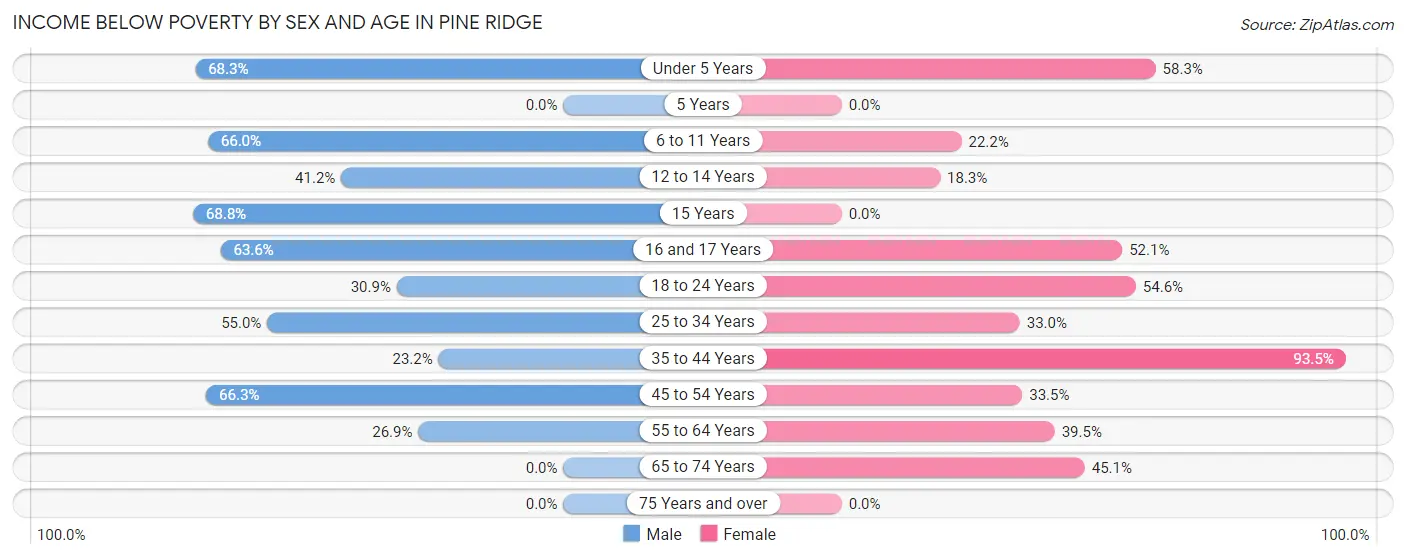
| Age Bracket | Male | Female |
| Under 5 Years | 138 (68.3%) | 67 (58.3%) |
| 5 Years | 0 (0.0%) | 0 (0.0%) |
| 6 to 11 Years | 161 (66.0%) | 24 (22.2%) |
| 12 to 14 Years | 73 (41.2%) | 23 (18.2%) |
| 15 Years | 33 (68.8%) | 0 (0.0%) |
| 16 and 17 Years | 35 (63.6%) | 38 (52.0%) |
| 18 to 24 Years | 30 (30.9%) | 107 (54.6%) |
| 25 to 34 Years | 94 (55.0%) | 75 (33.0%) |
| 35 to 44 Years | 44 (23.2%) | 202 (93.5%) |
| 45 to 54 Years | 59 (66.3%) | 65 (33.5%) |
| 55 to 64 Years | 42 (26.9%) | 51 (39.5%) |
| 65 to 74 Years | 0 (0.0%) | 23 (45.1%) |
| 75 Years and over | 0 (0.0%) | 0 (0.0%) |
| Total | 709 (49.1%) | 675 (46.3%) |
Income Above Poverty by Sex and Age in Pine Ridge
According to the poverty statistics in Pine Ridge, males aged 5 years and females aged 75 years and over are the age groups that are most secure financially, with 100.0% of males and 100.0% of females in these age groups living above the poverty line.
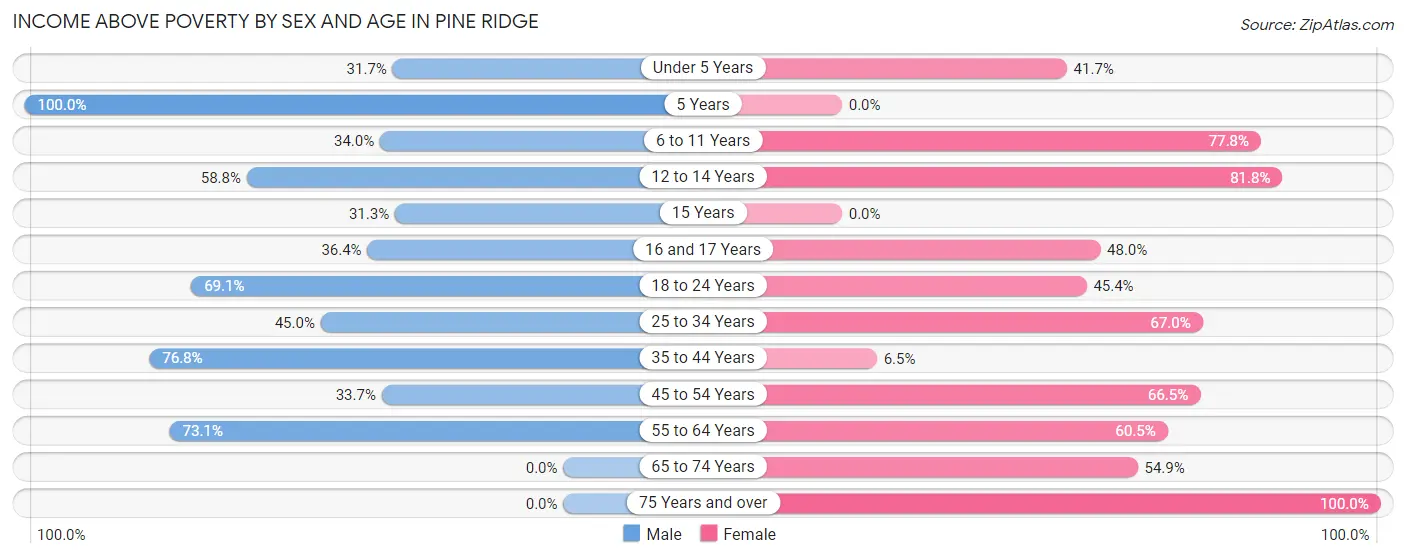
| Age Bracket | Male | Female |
| Under 5 Years | 64 (31.7%) | 48 (41.7%) |
| 5 Years | 15 (100.0%) | 0 (0.0%) |
| 6 to 11 Years | 83 (34.0%) | 84 (77.8%) |
| 12 to 14 Years | 104 (58.8%) | 103 (81.8%) |
| 15 Years | 15 (31.2%) | 0 (0.0%) |
| 16 and 17 Years | 20 (36.4%) | 35 (47.9%) |
| 18 to 24 Years | 67 (69.1%) | 89 (45.4%) |
| 25 to 34 Years | 77 (45.0%) | 152 (67.0%) |
| 35 to 44 Years | 146 (76.8%) | 14 (6.5%) |
| 45 to 54 Years | 30 (33.7%) | 129 (66.5%) |
| 55 to 64 Years | 114 (73.1%) | 78 (60.5%) |
| 65 to 74 Years | 0 (0.0%) | 28 (54.9%) |
| 75 Years and over | 0 (0.0%) | 23 (100.0%) |
| Total | 735 (50.9%) | 783 (53.7%) |
Income Below Poverty Among Married-Couple Families in Pine Ridge
The poverty statistics for married-couple families in Pine Ridge show that 49.4% or 44 of the total 89 families live below the poverty line. Families with 3 or 4 children have the highest poverty rate of 81.5%, comprising of 44 families. On the other hand, families with no children have the lowest poverty rate of 0.0%, which includes 0 families.
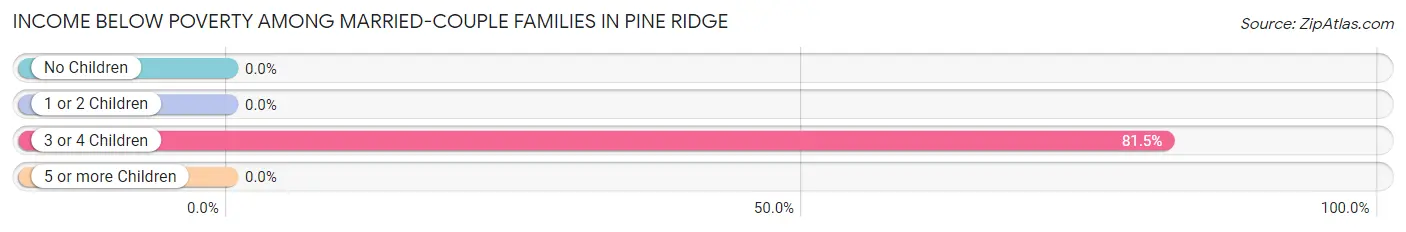
| Children | Above Poverty | Below Poverty |
| No Children | 5 (100.0%) | 0 (0.0%) |
| 1 or 2 Children | 19 (100.0%) | 0 (0.0%) |
| 3 or 4 Children | 10 (18.5%) | 44 (81.5%) |
| 5 or more Children | 11 (100.0%) | 0 (0.0%) |
| Total | 45 (50.6%) | 44 (49.4%) |
Income Below Poverty Among Single-Parent Households in Pine Ridge
According to the poverty data in Pine Ridge, 17.0% or 10 single-father households and 39.8% or 117 single-mother households are living below the poverty line. Among single-father households, those with no children have the highest poverty rate, with 10 households (24.4%) experiencing poverty. Likewise, among single-mother households, those with 5 or more children have the highest poverty rate, with 47 households (70.2%) falling below the poverty line.
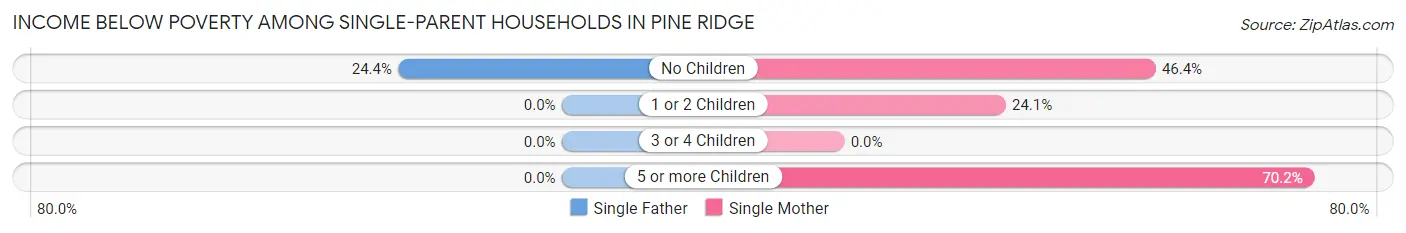
| Children | Single Father | Single Mother |
| No Children | 10 (24.4%) | 32 (46.4%) |
| 1 or 2 Children | 0 (0.0%) | 38 (24.0%) |
| 3 or 4 Children | 0 (0.0%) | 0 (0.0%) |
| 5 or more Children | 0 (0.0%) | 47 (70.2%) |
| Total | 10 (17.0%) | 117 (39.8%) |
Income Below Poverty Among Married-Couple vs Single-Parent Households in Pine Ridge
The poverty data for Pine Ridge shows that 44 of the married-couple family households (49.4%) and 127 of the single-parent households (36.0%) are living below the poverty level. Within the married-couple family households, those with 3 or 4 children have the highest poverty rate, with 44 households (81.5%) falling below the poverty line. Among the single-parent households, those with 5 or more children have the highest poverty rate, with 47 household (70.2%) living below poverty.
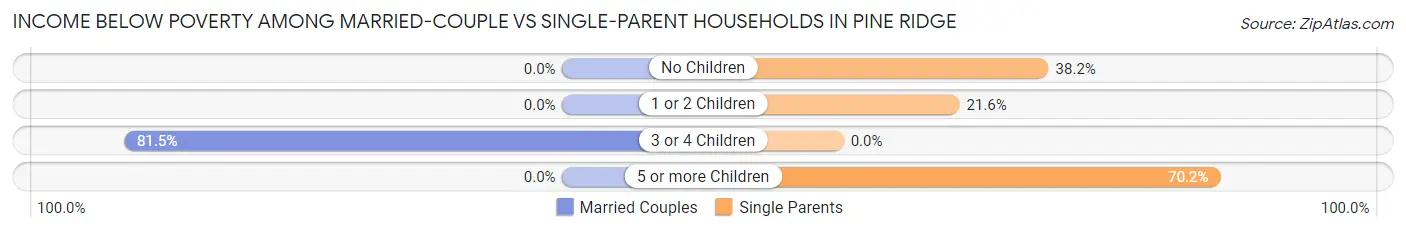
| Children | Married-Couple Families | Single-Parent Households |
| No Children | 0 (0.0%) | 42 (38.2%) |
| 1 or 2 Children | 0 (0.0%) | 38 (21.6%) |
| 3 or 4 Children | 44 (81.5%) | 0 (0.0%) |
| 5 or more Children | 0 (0.0%) | 47 (70.2%) |
| Total | 44 (49.4%) | 127 (36.0%) |
Race in Pine Ridge
The most populous races in Pine Ridge are Native / Alaskan (2,708 | 92.7%), Hispanic or Latino (375 | 12.8%), and White / Caucasian (213 | 7.3%).
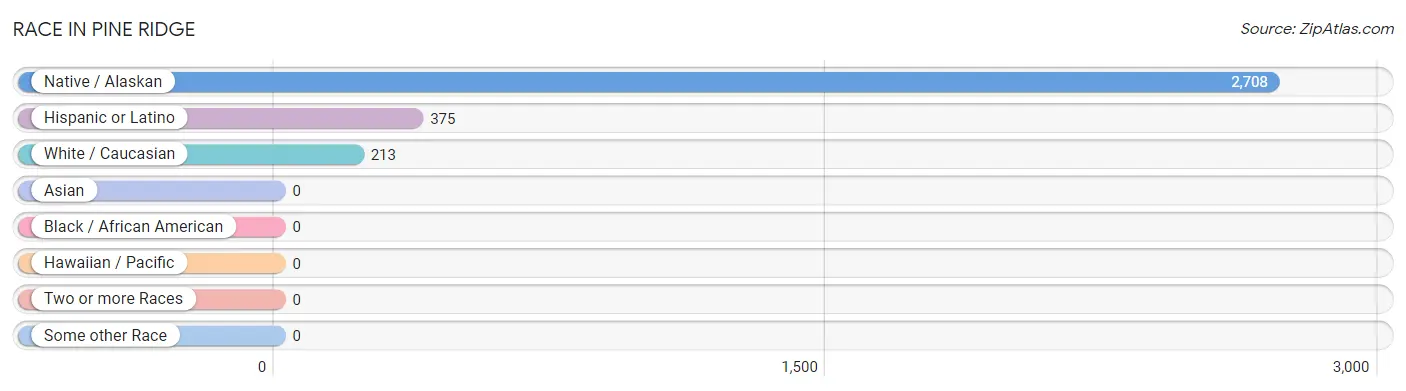
| Race | # Population | % Population |
| Asian | 0 | 0.0% |
| Black / African American | 0 | 0.0% |
| Hawaiian / Pacific | 0 | 0.0% |
| Hispanic or Latino | 375 | 12.8% |
| Native / Alaskan | 2,708 | 92.7% |
| White / Caucasian | 213 | 7.3% |
| Two or more Races | 0 | 0.0% |
| Some other Race | 0 | 0.0% |
| Total | 2,921 | 100.0% |
Ancestry in Pine Ridge
The most populous ancestries reported in Pine Ridge are Sioux (1,471 | 50.4%), Mexican (375 | 12.8%), American (194 | 6.6%), French (108 | 3.7%), and Irish (42 | 1.4%), together accounting for 75.0% of all Pine Ridge residents.
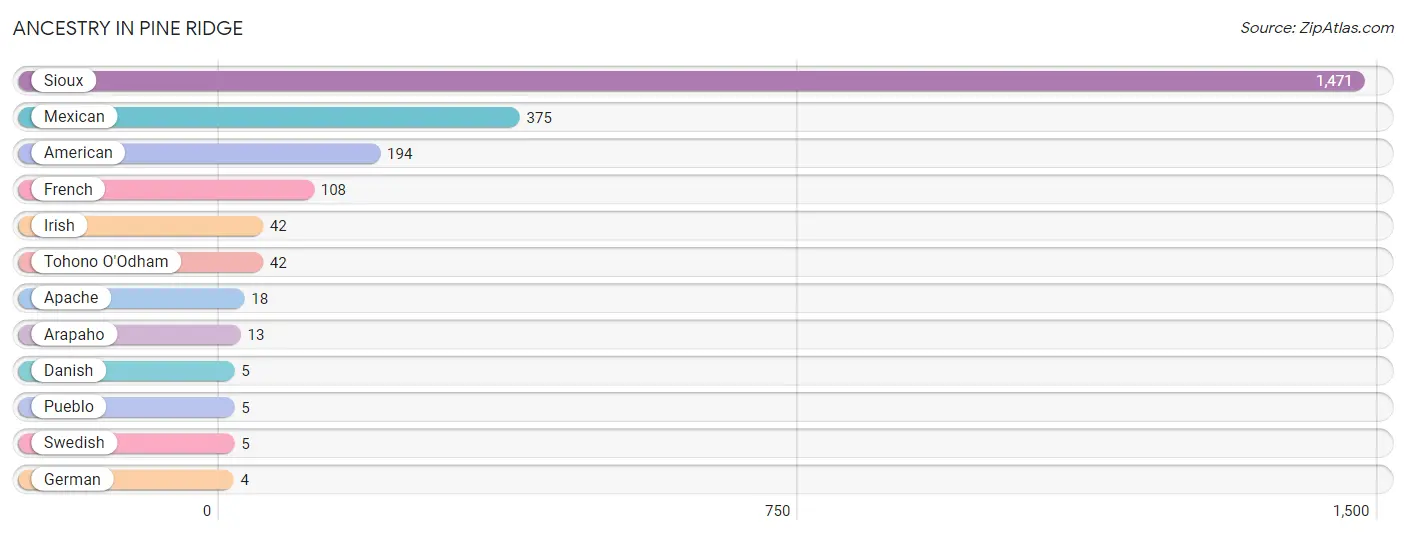
| Ancestry | # Population | % Population |
| American | 194 | 6.6% |
| Apache | 18 | 0.6% |
| Arapaho | 13 | 0.4% |
| Danish | 5 | 0.2% |
| French | 108 | 3.7% |
| German | 4 | 0.1% |
| Irish | 42 | 1.4% |
| Mexican | 375 | 12.8% |
| Pueblo | 5 | 0.2% |
| Sioux | 1,471 | 50.4% |
| Swedish | 5 | 0.2% |
| Tohono O'Odham | 42 | 1.4% | View All 12 Rows |
Immigrants in Pine Ridge

| Immigration Origin | # Population | % Population | View All 0 Rows |
Sex and Age in Pine Ridge
Sex and Age in Pine Ridge
The most populous age groups in Pine Ridge are 10 to 14 Years (265 | 18.2%) for men and 25 to 29 Years (157 | 10.7%) for women.
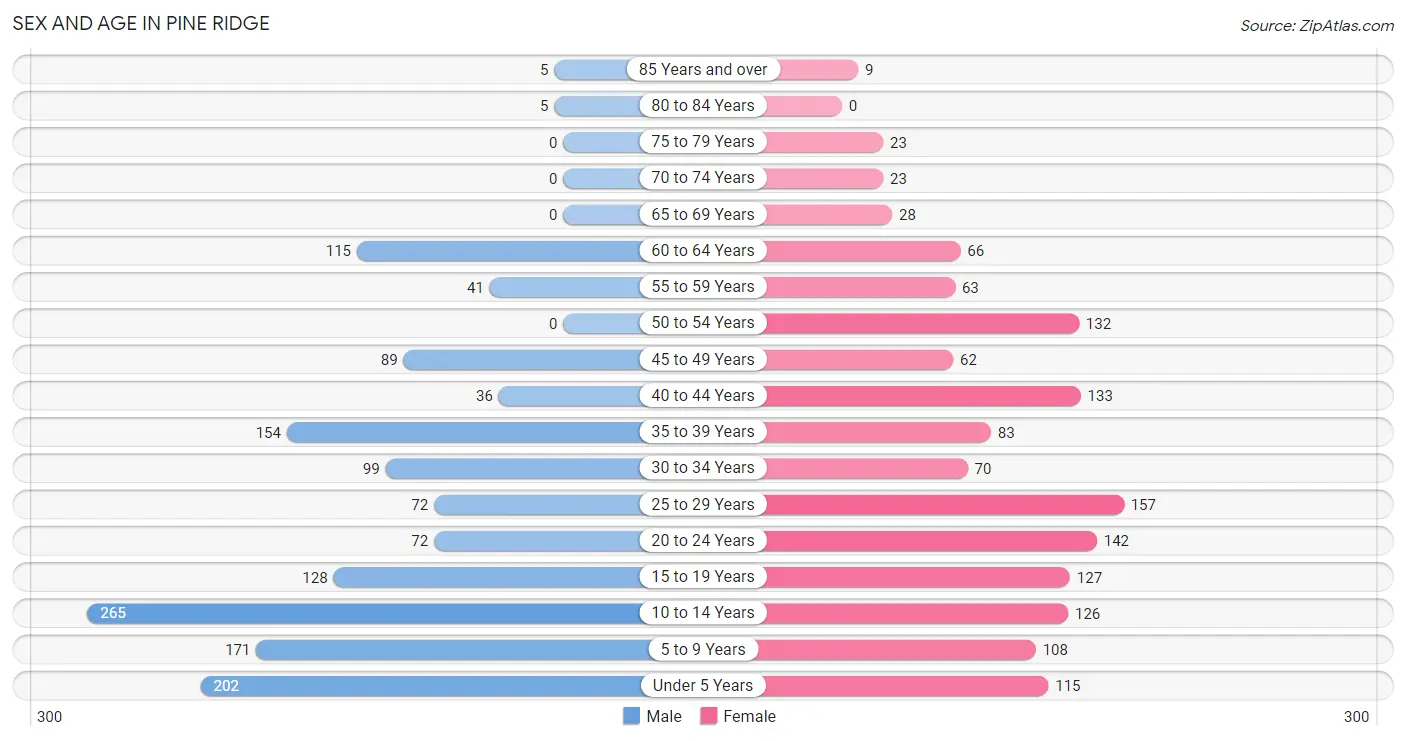
| Age Bracket | Male | Female |
| Under 5 Years | 202 (13.9%) | 115 (7.8%) |
| 5 to 9 Years | 171 (11.8%) | 108 (7.4%) |
| 10 to 14 Years | 265 (18.2%) | 126 (8.6%) |
| 15 to 19 Years | 128 (8.8%) | 127 (8.7%) |
| 20 to 24 Years | 72 (5.0%) | 142 (9.7%) |
| 25 to 29 Years | 72 (5.0%) | 157 (10.7%) |
| 30 to 34 Years | 99 (6.8%) | 70 (4.8%) |
| 35 to 39 Years | 154 (10.6%) | 83 (5.7%) |
| 40 to 44 Years | 36 (2.5%) | 133 (9.1%) |
| 45 to 49 Years | 89 (6.1%) | 62 (4.2%) |
| 50 to 54 Years | 0 (0.0%) | 132 (9.0%) |
| 55 to 59 Years | 41 (2.8%) | 63 (4.3%) |
| 60 to 64 Years | 115 (7.9%) | 66 (4.5%) |
| 65 to 69 Years | 0 (0.0%) | 28 (1.9%) |
| 70 to 74 Years | 0 (0.0%) | 23 (1.6%) |
| 75 to 79 Years | 0 (0.0%) | 23 (1.6%) |
| 80 to 84 Years | 5 (0.3%) | 0 (0.0%) |
| 85 Years and over | 5 (0.3%) | 9 (0.6%) |
| Total | 1,454 (100.0%) | 1,467 (100.0%) |
Families and Households in Pine Ridge
Median Family Size in Pine Ridge
The median family size in Pine Ridge is 6.02 persons per family, with married-couple families (89 | 20.1%) accounting for the largest median family size of 8.98 persons per family. On the other hand, single male/father families (59 | 13.4%) represent the smallest median family size with 3.97 persons per family.
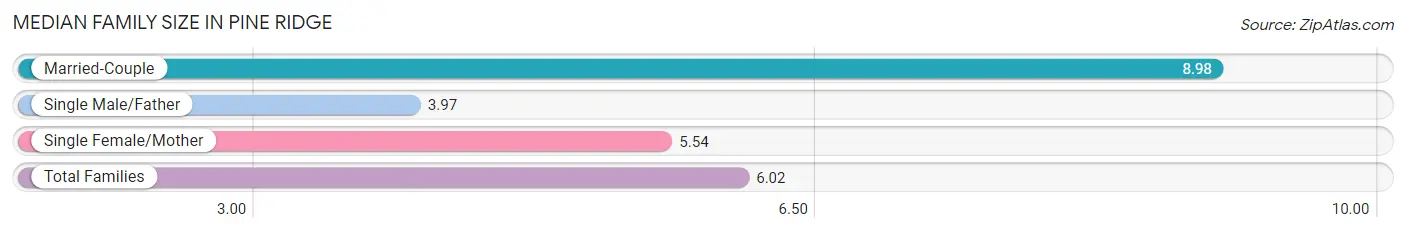
| Family Type | # Families | Family Size |
| Married-Couple | 89 (20.1%) | 8.98 |
| Single Male/Father | 59 (13.4%) | 3.97 |
| Single Female/Mother | 294 (66.5%) | 5.54 |
| Total Families | 442 (100.0%) | 6.02 |
Median Household Size in Pine Ridge
The median household size in Pine Ridge is 5.76 persons per household, with married-couple households (89 | 17.7%) accounting for the largest median household size of 9.34 persons per household. non-family households (61 | 12.1%) represent the smallest median household size with 1.51 persons per household.
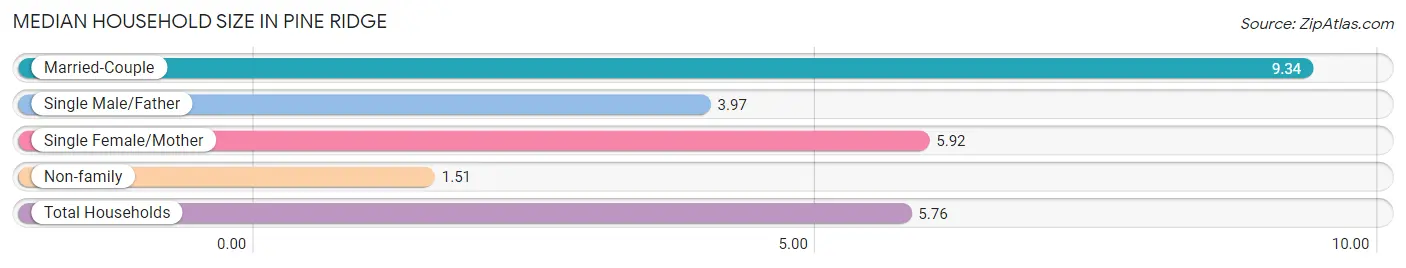
| Household Type | # Households | Household Size |
| Married-Couple | 89 (17.7%) | 9.34 |
| Single Male/Father | 59 (11.7%) | 3.97 |
| Single Female/Mother | 294 (58.5%) | 5.92 |
| Non-family | 61 (12.1%) | 1.51 |
| Total Households | 503 (100.0%) | 5.76 |
Household Size by Marriage Status in Pine Ridge
Out of a total of 503 households in Pine Ridge, 442 (87.9%) are family households, while 61 (12.1%) are nonfamily households. The most numerous type of family households are 6-person households, comprising 116, and the most common type of nonfamily households are 1-person households, comprising 38.
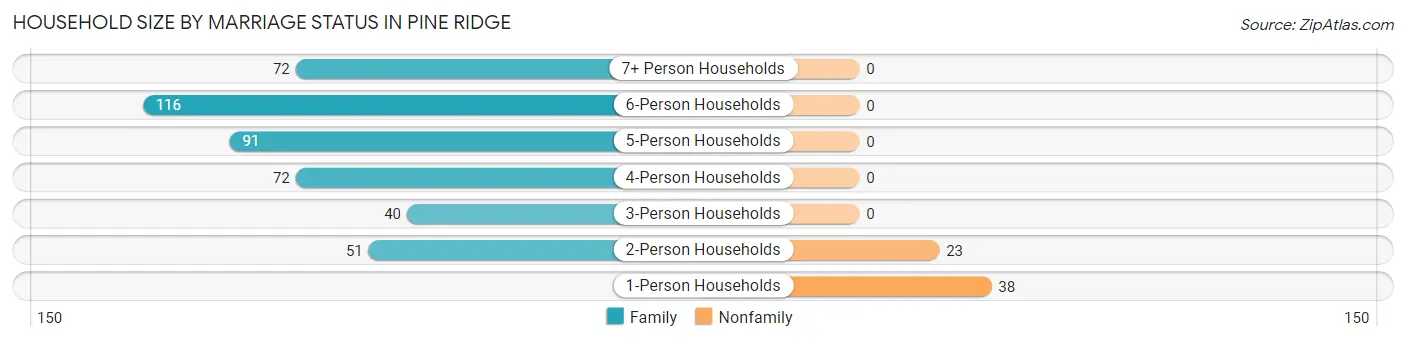
| Household Size | Family Households | Nonfamily Households |
| 1-Person Households | - | 38 (7.5%) |
| 2-Person Households | 51 (10.1%) | 23 (4.6%) |
| 3-Person Households | 40 (8.0%) | 0 (0.0%) |
| 4-Person Households | 72 (14.3%) | 0 (0.0%) |
| 5-Person Households | 91 (18.1%) | 0 (0.0%) |
| 6-Person Households | 116 (23.1%) | 0 (0.0%) |
| 7+ Person Households | 72 (14.3%) | 0 (0.0%) |
| Total | 442 (87.9%) | 61 (12.1%) |
Female Fertility in Pine Ridge
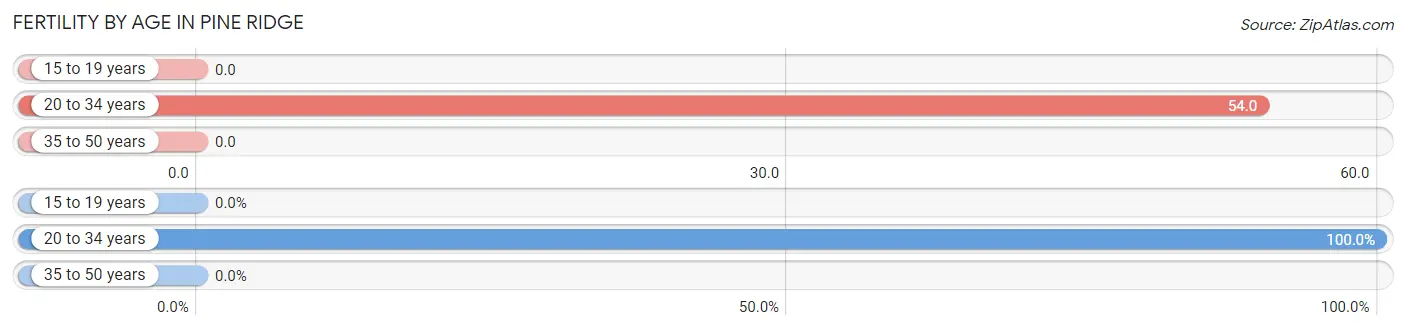
Fertility by Age in Pine Ridge
Average fertility rate in Pine Ridge is 24.0 births per 1,000 women. Women in the age bracket of 20 to 34 years have the highest fertility rate with 54.0 births per 1,000 women. Women in the age bracket of 20 to 34 years acount for 100.0% of all women with births.
| Age Bracket | Women with Births | Births / 1,000 Women |
| 15 to 19 years | 0 (0.0%) | 0.0 |
| 20 to 34 years | 20 (100.0%) | 54.0 |
| 35 to 50 years | 0 (0.0%) | 0.0 |
| Total | 20 (100.0%) | 24.0 |
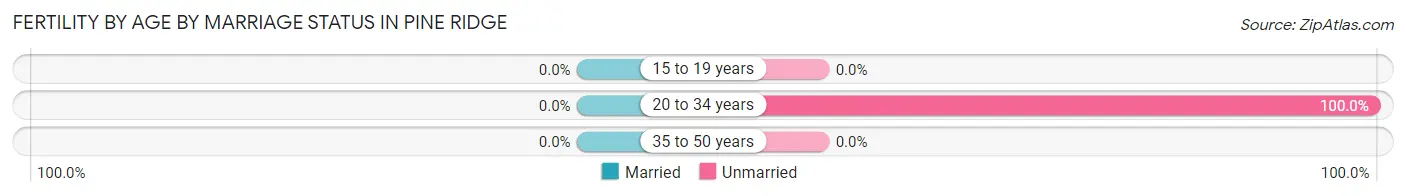
Fertility by Age by Marriage Status in Pine Ridge
| Age Bracket | Married | Unmarried |
| 15 to 19 years | 0 (0.0%) | 0 (0.0%) |
| 20 to 34 years | 0 (0.0%) | 20 (100.0%) |
| 35 to 50 years | 0 (0.0%) | 0 (0.0%) |
| Total | 0 (0.0%) | 20 (100.0%) |
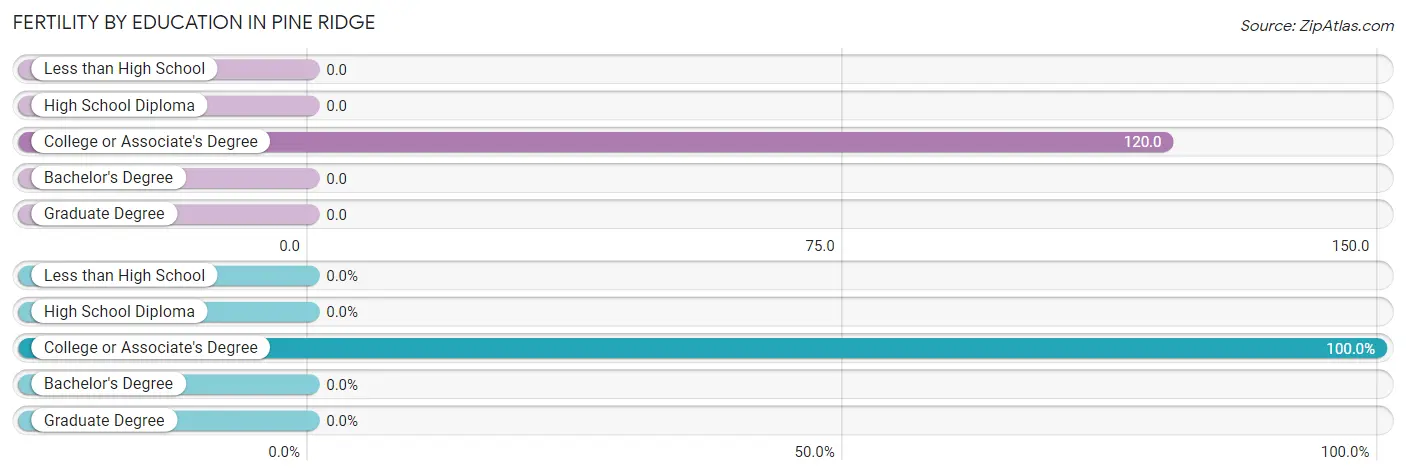
Fertility by Education in Pine Ridge
| Educational Attainment | Women with Births | Births / 1,000 Women |
| Less than High School | 0 (0.0%) | 0.0 |
| High School Diploma | 0 (0.0%) | 0.0 |
| College or Associate's Degree | 20 (100.0%) | 120.0 |
| Bachelor's Degree | 0 (0.0%) | 0.0 |
| Graduate Degree | 0 (0.0%) | 0.0 |
| Total | 20 (100.0%) | 24.0 |
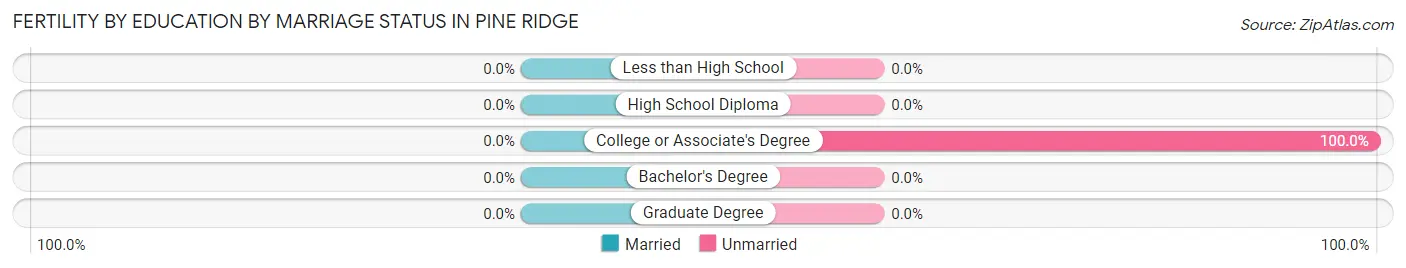
Fertility by Education by Marriage Status in Pine Ridge
| Educational Attainment | Married | Unmarried |
| Less than High School | 0 (0.0%) | 0 (0.0%) |
| High School Diploma | 0 (0.0%) | 0 (0.0%) |
| College or Associate's Degree | 0 (0.0%) | 20 (100.0%) |
| Bachelor's Degree | 0 (0.0%) | 0 (0.0%) |
| Graduate Degree | 0 (0.0%) | 0 (0.0%) |
| Total | 0 (0.0%) | 20 (100.0%) |
Employment Characteristics in Pine Ridge
Employment by Class of Employer in Pine Ridge
Among the 754 employed individuals in Pine Ridge, private company employees (217 | 28.8%), local government employees (216 | 28.6%), and federal government employees (174 | 23.1%) make up the most common classes of employment.
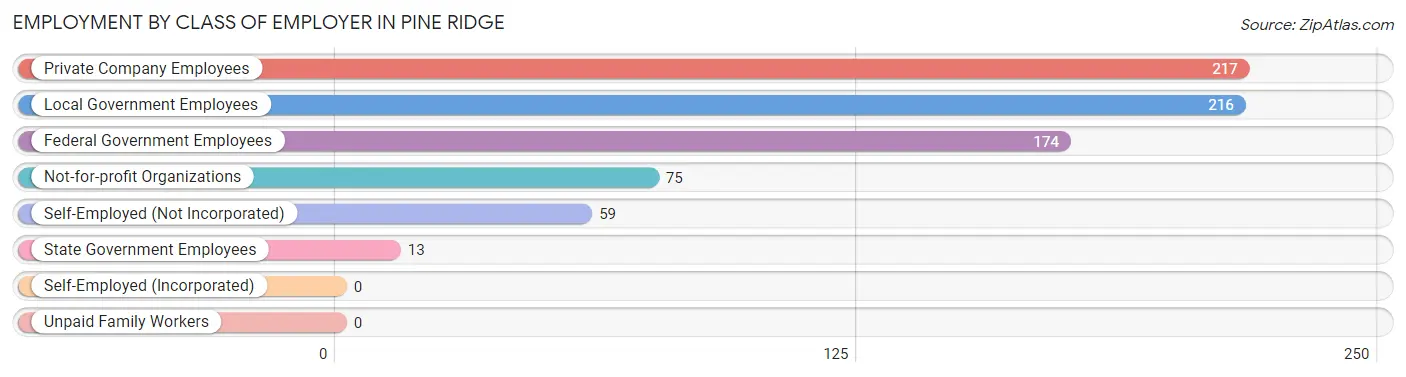
| Employer Class | # Employees | % Employees |
| Private Company Employees | 217 | 28.8% |
| Self-Employed (Incorporated) | 0 | 0.0% |
| Self-Employed (Not Incorporated) | 59 | 7.8% |
| Not-for-profit Organizations | 75 | 10.0% |
| Local Government Employees | 216 | 28.6% |
| State Government Employees | 13 | 1.7% |
| Federal Government Employees | 174 | 23.1% |
| Unpaid Family Workers | 0 | 0.0% |
| Total | 754 | 100.0% |
Employment Status by Age in Pine Ridge
According to the labor force statistics for Pine Ridge, out of the total population over 16 years of age (1,886), 44.5% or 839 individuals are in the labor force, with 7.9% or 66 of them unemployed. The age group with the highest labor force participation rate is 30 to 34 years, with 63.9% or 108 individuals in the labor force. Within the labor force, the 25 to 29 years age range has the highest percentage of unemployed individuals, with 23.7% or 18 of them being unemployed.
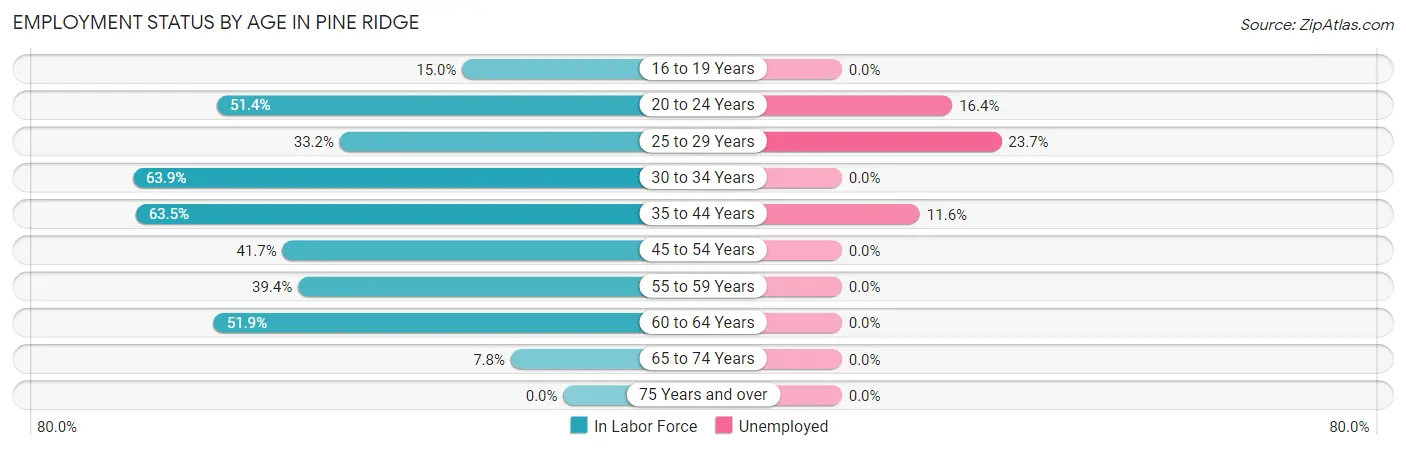
| Age Bracket | In Labor Force | Unemployed |
| 16 to 19 Years | 31 (15.0%) | 0 (0.0%) |
| 20 to 24 Years | 110 (51.4%) | 18 (16.4%) |
| 25 to 29 Years | 76 (33.2%) | 18 (23.7%) |
| 30 to 34 Years | 108 (63.9%) | 0 (0.0%) |
| 35 to 44 Years | 258 (63.5%) | 30 (11.6%) |
| 45 to 54 Years | 118 (41.7%) | 0 (0.0%) |
| 55 to 59 Years | 41 (39.4%) | 0 (0.0%) |
| 60 to 64 Years | 94 (51.9%) | 0 (0.0%) |
| 65 to 74 Years | 4 (7.8%) | 0 (0.0%) |
| 75 Years and over | 0 (0.0%) | 0 (0.0%) |
| Total | 839 (44.5%) | 66 (7.9%) |
Employment Status by Educational Attainment in Pine Ridge
According to labor force statistics for Pine Ridge, 50.7% of individuals (696) out of the total population between 25 and 64 years of age (1,372) are in the labor force, with 6.9% or 48 of them being unemployed. The group with the highest labor force participation rate are those with the educational attainment of bachelor's degree or higher, with 100.0% or 95 individuals in the labor force. Within the labor force, individuals with less than high school education have the highest percentage of unemployment, with 25.4% or 18 of them being unemployed.
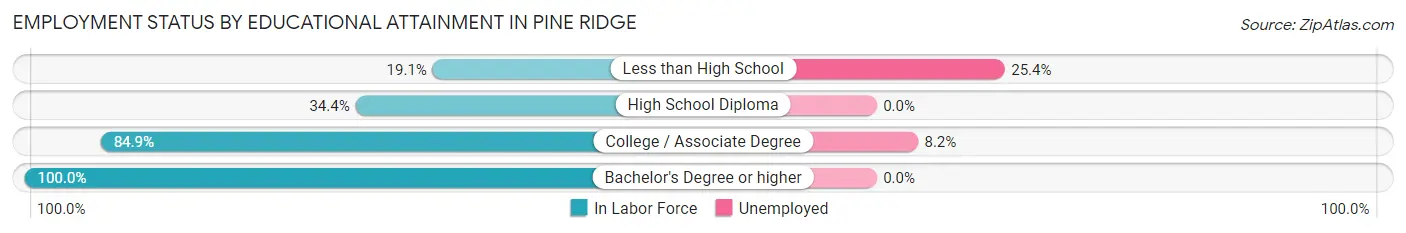
| Educational Attainment | In Labor Force | Unemployed |
| Less than High School | 71 (19.1%) | 94 (25.4%) |
| High School Diploma | 163 (34.4%) | 0 (0.0%) |
| College / Associate Degree | 366 (84.9%) | 35 (8.2%) |
| Bachelor's Degree or higher | 95 (100.0%) | 0 (0.0%) |
| Total | 696 (50.7%) | 95 (6.9%) |
Employment Occupations by Sex in Pine Ridge
Management, Business, Science and Arts Occupations
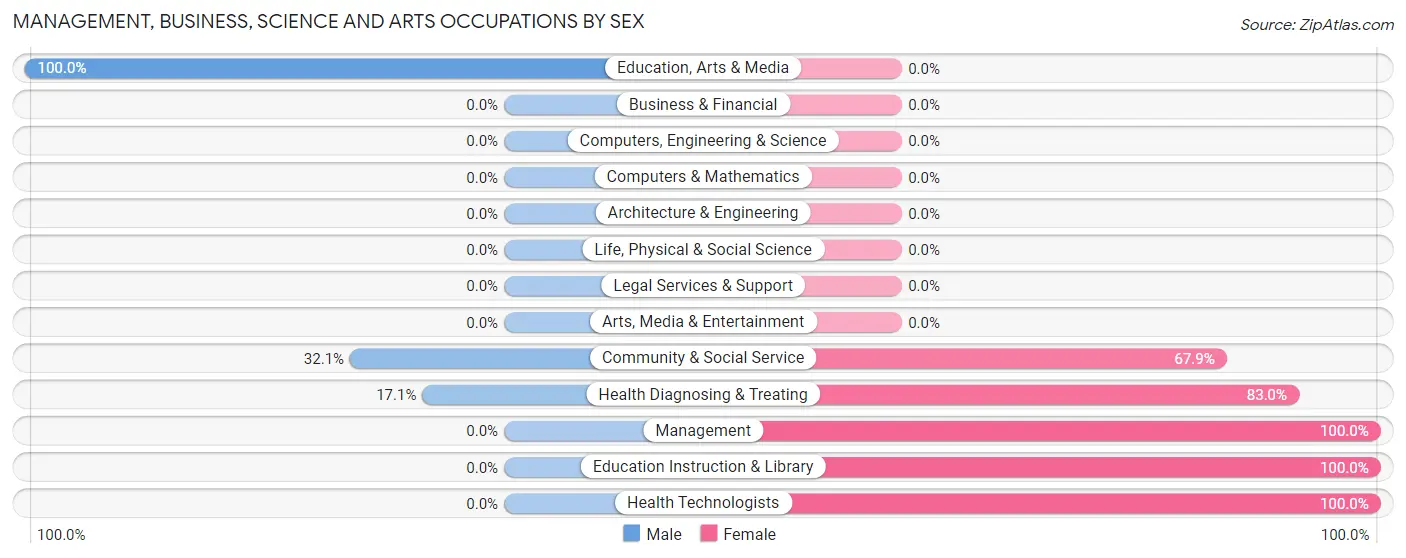
The most common Management, Business, Science and Arts occupations in Pine Ridge are Health Diagnosing & Treating (88 | 11.4%), Management (83 | 10.7%), Community & Social Service (56 | 7.2%), Education Instruction & Library (38 | 4.9%), and Health Technologists (21 | 2.7%).
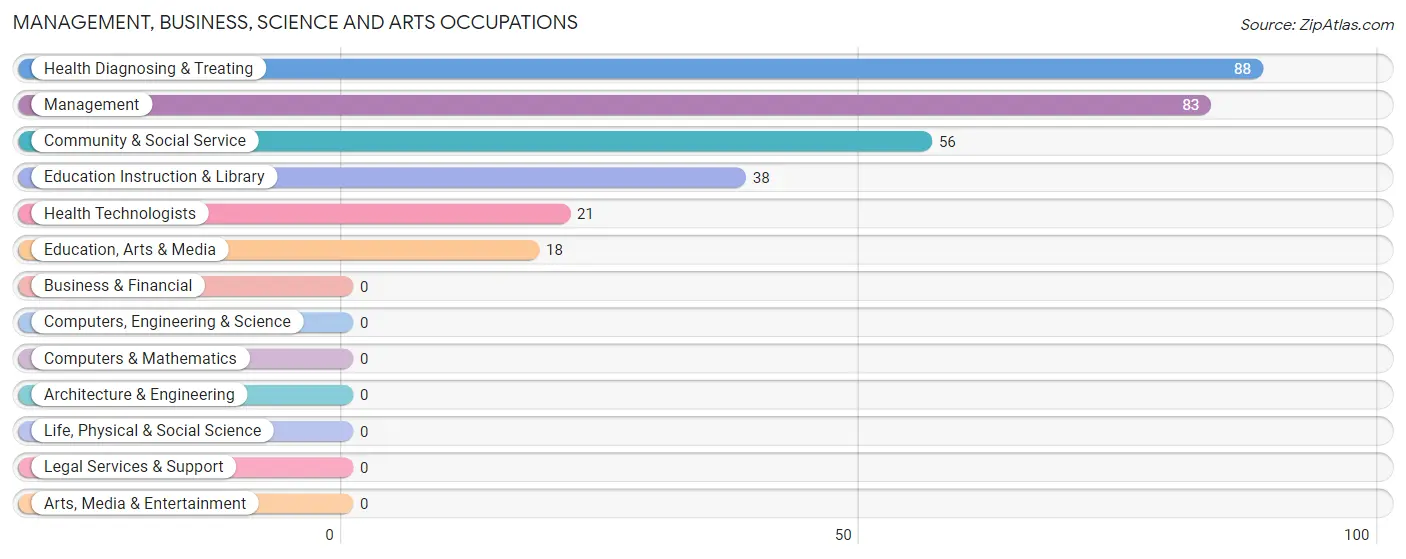
Management, Business, Science and Arts Occupations by Sex
Within the Management, Business, Science and Arts occupations in Pine Ridge, the most male-oriented occupations are Education, Arts & Media (100.0%), Community & Social Service (32.1%), and Health Diagnosing & Treating (17.1%), while the most female-oriented occupations are Management (100.0%), Education Instruction & Library (100.0%), and Health Technologists (100.0%).
| Occupation | Male | Female |
| Management | 0 (0.0%) | 83 (100.0%) |
| Business & Financial | 0 (0.0%) | 0 (0.0%) |
| Computers, Engineering & Science | 0 (0.0%) | 0 (0.0%) |
| Computers & Mathematics | 0 (0.0%) | 0 (0.0%) |
| Architecture & Engineering | 0 (0.0%) | 0 (0.0%) |
| Life, Physical & Social Science | 0 (0.0%) | 0 (0.0%) |
| Community & Social Service | 18 (32.1%) | 38 (67.9%) |
| Education, Arts & Media | 18 (100.0%) | 0 (0.0%) |
| Legal Services & Support | 0 (0.0%) | 0 (0.0%) |
| Education Instruction & Library | 0 (0.0%) | 38 (100.0%) |
| Arts, Media & Entertainment | 0 (0.0%) | 0 (0.0%) |
| Health Diagnosing & Treating | 15 (17.1%) | 73 (83.0%) |
| Health Technologists | 0 (0.0%) | 21 (100.0%) |
| Total (Category) | 33 (14.5%) | 194 (85.5%) |
| Total (Overall) | 334 (43.1%) | 440 (56.9%) |
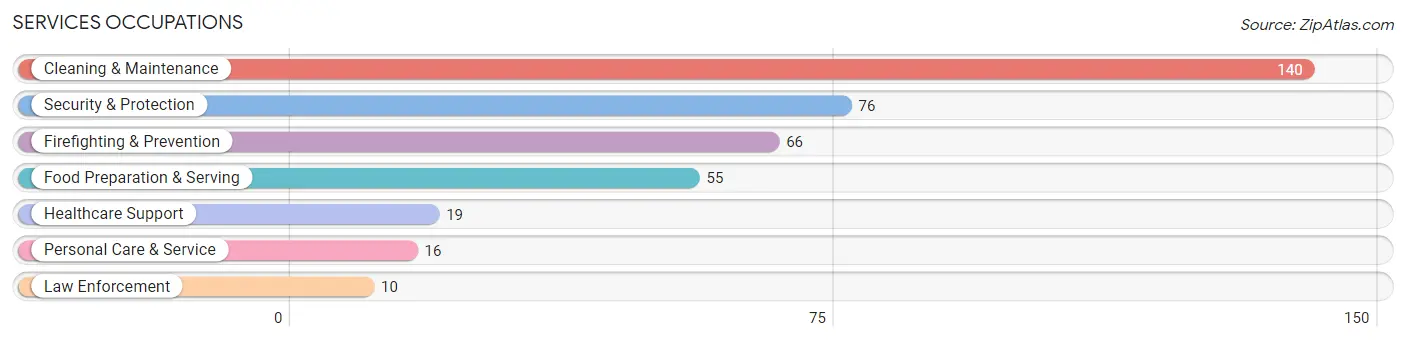
Services Occupations
The most common Services occupations in Pine Ridge are Cleaning & Maintenance (140 | 18.1%), Security & Protection (76 | 9.8%), Firefighting & Prevention (66 | 8.5%), Food Preparation & Serving (55 | 7.1%), and Healthcare Support (19 | 2.5%).
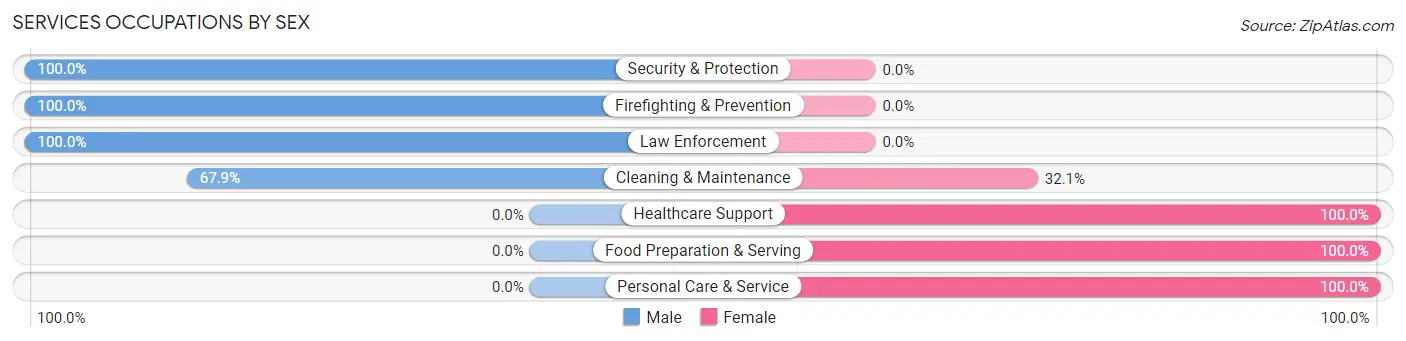
Services Occupations by Sex
Within the Services occupations in Pine Ridge, the most male-oriented occupations are Security & Protection (100.0%), Firefighting & Prevention (100.0%), and Law Enforcement (100.0%), while the most female-oriented occupations are Healthcare Support (100.0%), Food Preparation & Serving (100.0%), and Personal Care & Service (100.0%).
| Occupation | Male | Female |
| Healthcare Support | 0 (0.0%) | 19 (100.0%) |
| Security & Protection | 76 (100.0%) | 0 (0.0%) |
| Firefighting & Prevention | 66 (100.0%) | 0 (0.0%) |
| Law Enforcement | 10 (100.0%) | 0 (0.0%) |
| Food Preparation & Serving | 0 (0.0%) | 55 (100.0%) |
| Cleaning & Maintenance | 95 (67.9%) | 45 (32.1%) |
| Personal Care & Service | 0 (0.0%) | 16 (100.0%) |
| Total (Category) | 171 (55.9%) | 135 (44.1%) |
| Total (Overall) | 334 (43.1%) | 440 (56.9%) |
Sales and Office Occupations
The most common Sales and Office occupations in Pine Ridge are Office & Administration (90 | 11.6%), and Sales & Related (18 | 2.3%).
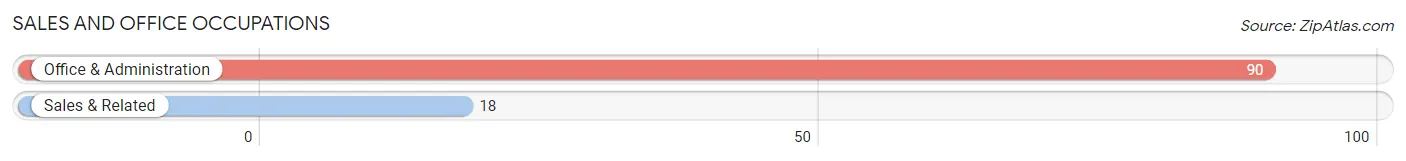
Sales and Office Occupations by Sex

| Occupation | Male | Female |
| Sales & Related | 0 (0.0%) | 18 (100.0%) |
| Office & Administration | 0 (0.0%) | 90 (100.0%) |
| Total (Category) | 0 (0.0%) | 108 (100.0%) |
| Total (Overall) | 334 (43.1%) | 440 (56.9%) |
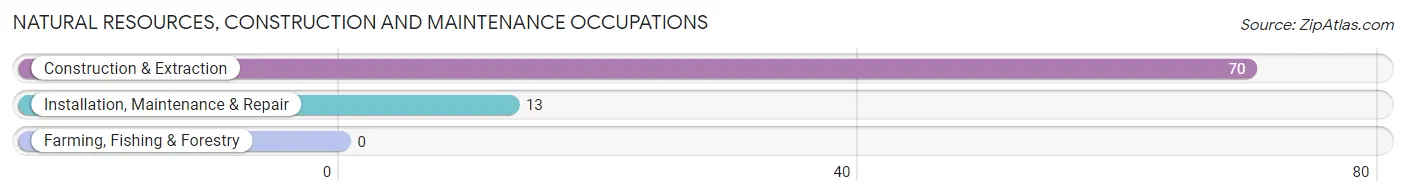
Natural Resources, Construction and Maintenance Occupations
The most common Natural Resources, Construction and Maintenance occupations in Pine Ridge are Construction & Extraction (70 | 9.0%), and Installation, Maintenance & Repair (13 | 1.7%).
Natural Resources, Construction and Maintenance Occupations by Sex
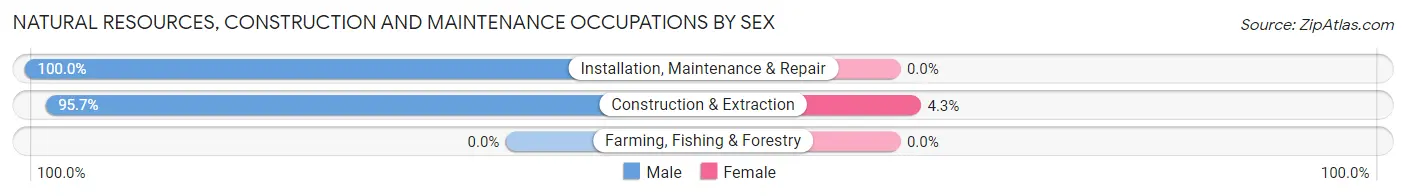
| Occupation | Male | Female |
| Farming, Fishing & Forestry | 0 (0.0%) | 0 (0.0%) |
| Construction & Extraction | 67 (95.7%) | 3 (4.3%) |
| Installation, Maintenance & Repair | 13 (100.0%) | 0 (0.0%) |
| Total (Category) | 80 (96.4%) | 3 (3.6%) |
| Total (Overall) | 334 (43.1%) | 440 (56.9%) |
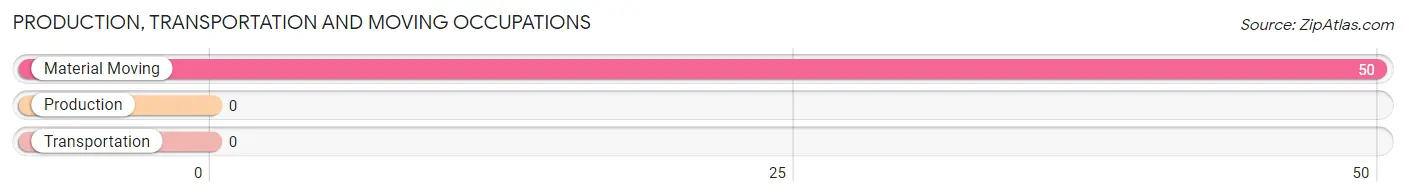
Production, Transportation and Moving Occupations
The most common Production, Transportation and Moving occupations in Pine Ridge are , and Material Moving (50 | 6.5%).
Production, Transportation and Moving Occupations by Sex
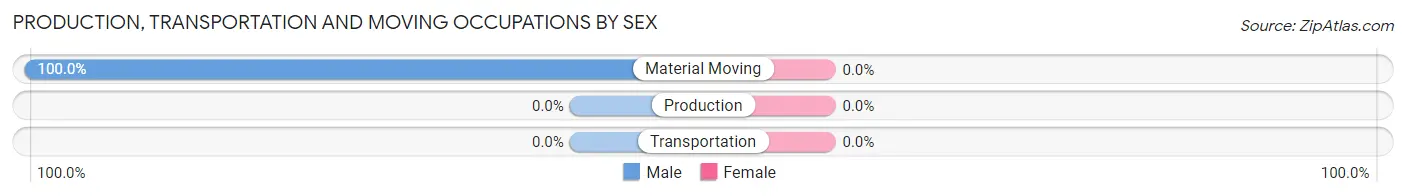
| Occupation | Male | Female |
| Production | 0 (0.0%) | 0 (0.0%) |
| Transportation | 0 (0.0%) | 0 (0.0%) |
| Material Moving | 50 (100.0%) | 0 (0.0%) |
| Total (Category) | 50 (100.0%) | 0 (0.0%) |
| Total (Overall) | 334 (43.1%) | 440 (56.9%) |
Employment Industries by Sex in Pine Ridge
Employment Industries in Pine Ridge
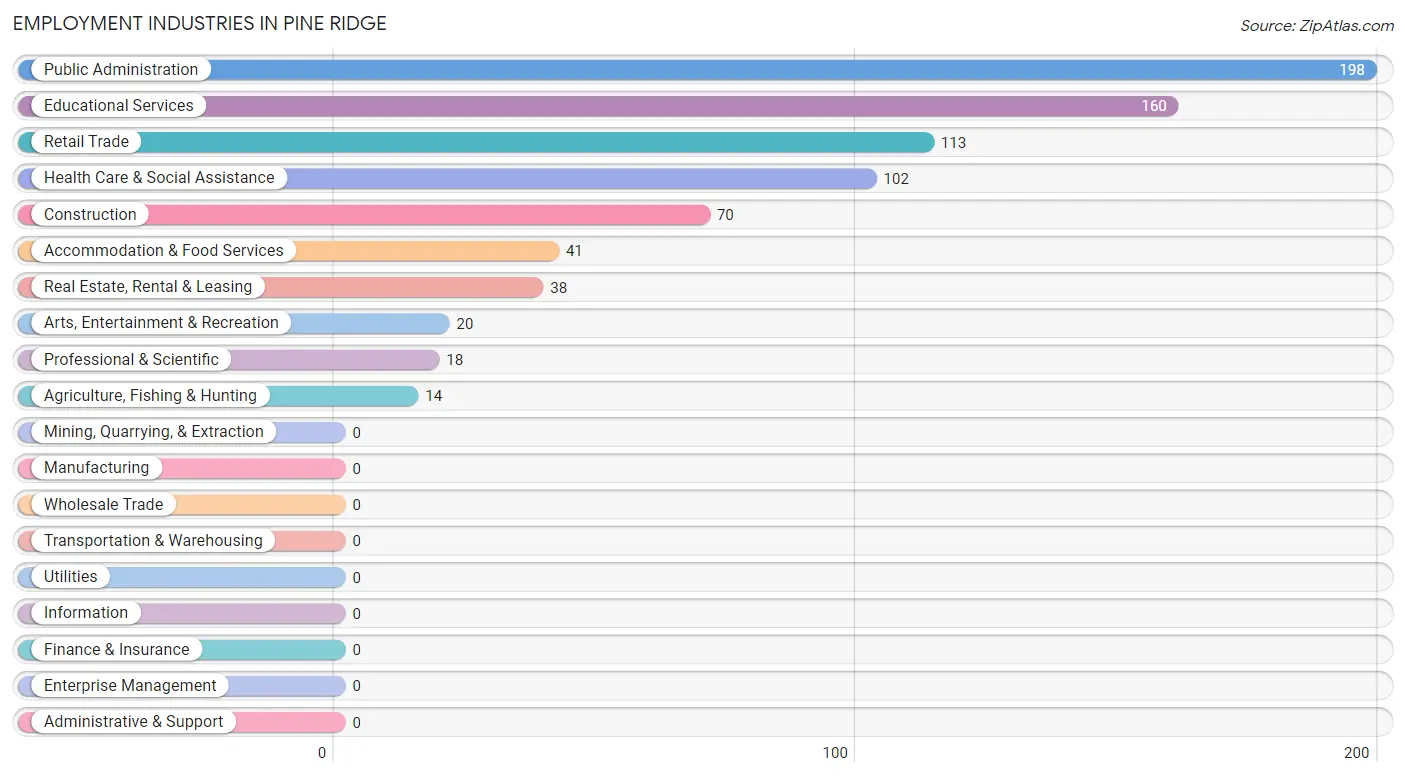
The major employment industries in Pine Ridge include Public Administration (198 | 25.6%), Educational Services (160 | 20.7%), Retail Trade (113 | 14.6%), Health Care & Social Assistance (102 | 13.2%), and Construction (70 | 9.0%).
Employment Industries by Sex in Pine Ridge
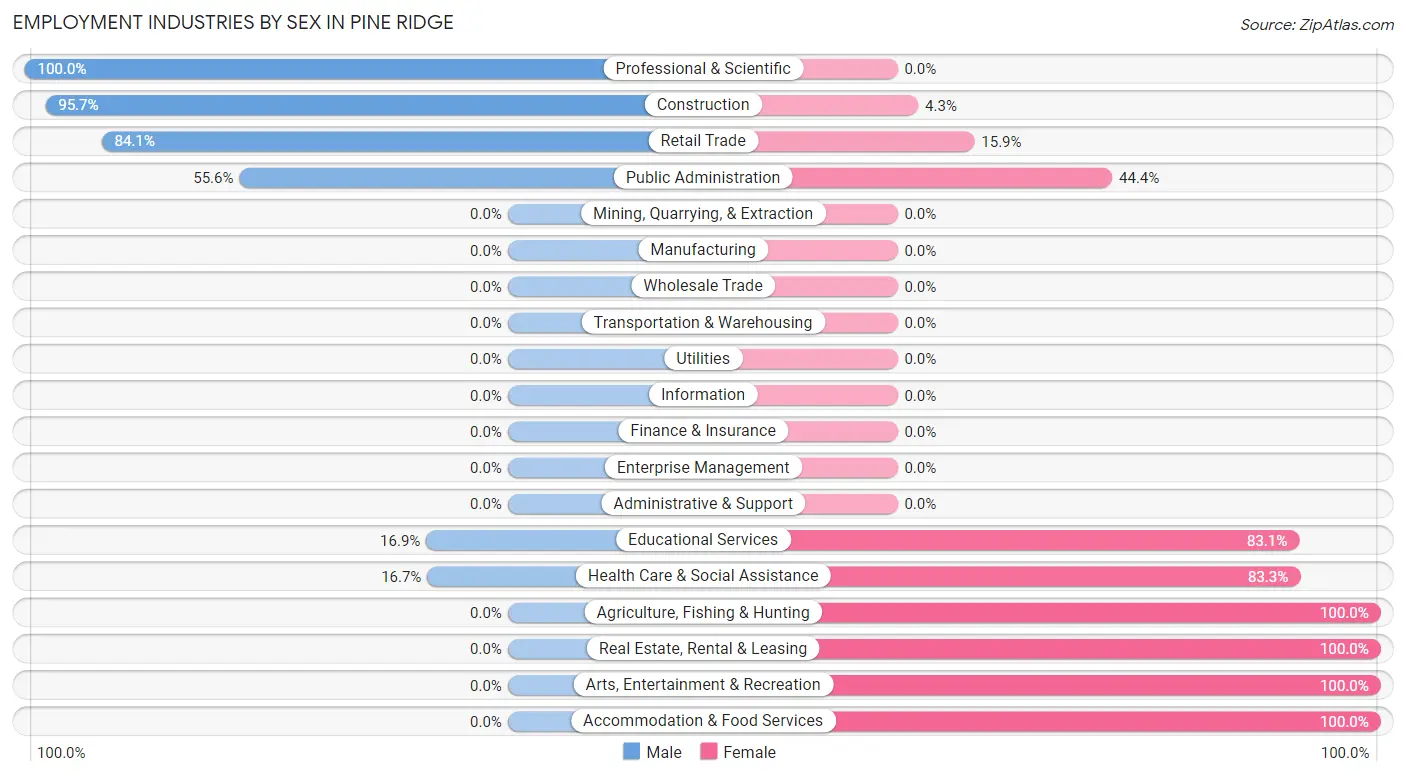
The Pine Ridge industries that see more men than women are Professional & Scientific (100.0%), Construction (95.7%), and Retail Trade (84.1%), whereas the industries that tend to have a higher number of women are Agriculture, Fishing & Hunting (100.0%), Real Estate, Rental & Leasing (100.0%), and Arts, Entertainment & Recreation (100.0%).
| Industry | Male | Female |
| Agriculture, Fishing & Hunting | 0 (0.0%) | 14 (100.0%) |
| Mining, Quarrying, & Extraction | 0 (0.0%) | 0 (0.0%) |
| Construction | 67 (95.7%) | 3 (4.3%) |
| Manufacturing | 0 (0.0%) | 0 (0.0%) |
| Wholesale Trade | 0 (0.0%) | 0 (0.0%) |
| Retail Trade | 95 (84.1%) | 18 (15.9%) |
| Transportation & Warehousing | 0 (0.0%) | 0 (0.0%) |
| Utilities | 0 (0.0%) | 0 (0.0%) |
| Information | 0 (0.0%) | 0 (0.0%) |
| Finance & Insurance | 0 (0.0%) | 0 (0.0%) |
| Real Estate, Rental & Leasing | 0 (0.0%) | 38 (100.0%) |
| Professional & Scientific | 18 (100.0%) | 0 (0.0%) |
| Enterprise Management | 0 (0.0%) | 0 (0.0%) |
| Administrative & Support | 0 (0.0%) | 0 (0.0%) |
| Educational Services | 27 (16.9%) | 133 (83.1%) |
| Health Care & Social Assistance | 17 (16.7%) | 85 (83.3%) |
| Arts, Entertainment & Recreation | 0 (0.0%) | 20 (100.0%) |
| Accommodation & Food Services | 0 (0.0%) | 41 (100.0%) |
| Public Administration | 110 (55.6%) | 88 (44.4%) |
| Total | 334 (43.1%) | 440 (56.9%) |
Education in Pine Ridge
School Enrollment in Pine Ridge
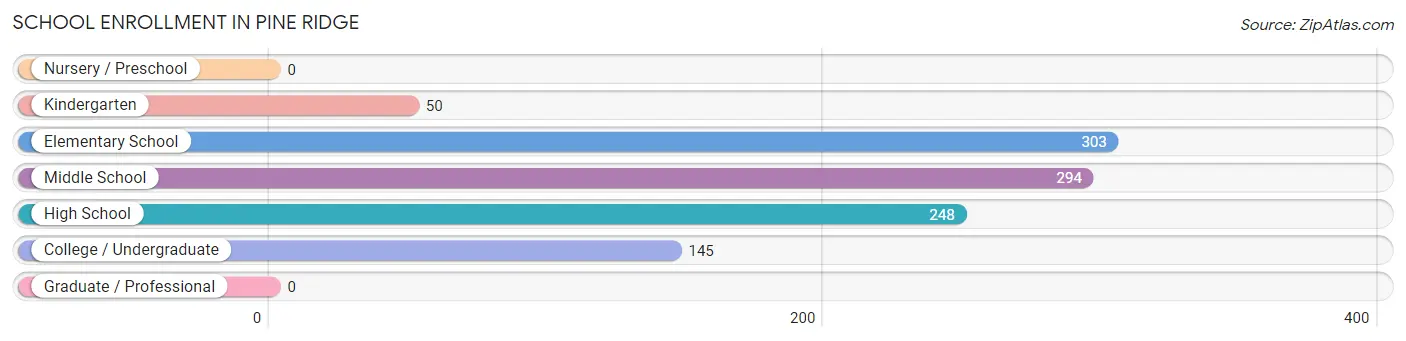
The most common levels of schooling among the 1,040 students in Pine Ridge are elementary school (303 | 29.1%), middle school (294 | 28.3%), and high school (248 | 23.8%).
| School Level | # Students | % Students |
| Nursery / Preschool | 0 | 0.0% |
| Kindergarten | 50 | 4.8% |
| Elementary School | 303 | 29.1% |
| Middle School | 294 | 28.3% |
| High School | 248 | 23.8% |
| College / Undergraduate | 145 | 13.9% |
| Graduate / Professional | 0 | 0.0% |
| Total | 1,040 | 100.0% |
School Enrollment by Age by Funding Source in Pine Ridge
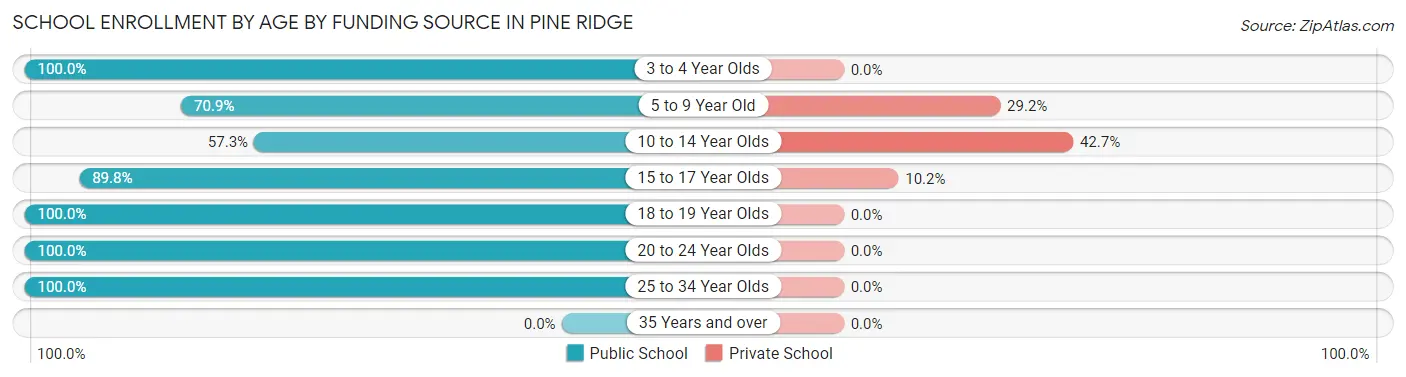
Out of a total of 1,040 students who are enrolled in schools in Pine Ridge, 256 (24.6%) attend a private institution, while the remaining 784 (75.4%) are enrolled in public schools. The age group of 10 to 14 year olds has the highest likelihood of being enrolled in private schools, with 167 (42.7% in the age bracket) enrolled. Conversely, the age group of 3 to 4 year olds has the lowest likelihood of being enrolled in a private school, with 34 (100.0% in the age bracket) attending a public institution.
| Age Bracket | Public School | Private School |
| 3 to 4 Year Olds | 34 (100.0%) | 0 (0.0%) |
| 5 to 9 Year Old | 175 (70.9%) | 72 (29.1%) |
| 10 to 14 Year Olds | 224 (57.3%) | 167 (42.7%) |
| 15 to 17 Year Olds | 150 (89.8%) | 17 (10.2%) |
| 18 to 19 Year Olds | 65 (100.0%) | 0 (0.0%) |
| 20 to 24 Year Olds | 20 (100.0%) | 0 (0.0%) |
| 25 to 34 Year Olds | 116 (100.0%) | 0 (0.0%) |
| 35 Years and over | 0 (0.0%) | 0 (0.0%) |
| Total | 784 (75.4%) | 256 (24.6%) |
Educational Attainment by Field of Study in Pine Ridge
Science & technology (35 | 36.8%), education (29 | 30.5%), business (18 | 19.0%), and arts & humanities (13 | 13.7%) are the most common fields of study among 95 individuals in Pine Ridge who have obtained a bachelor's degree or higher.
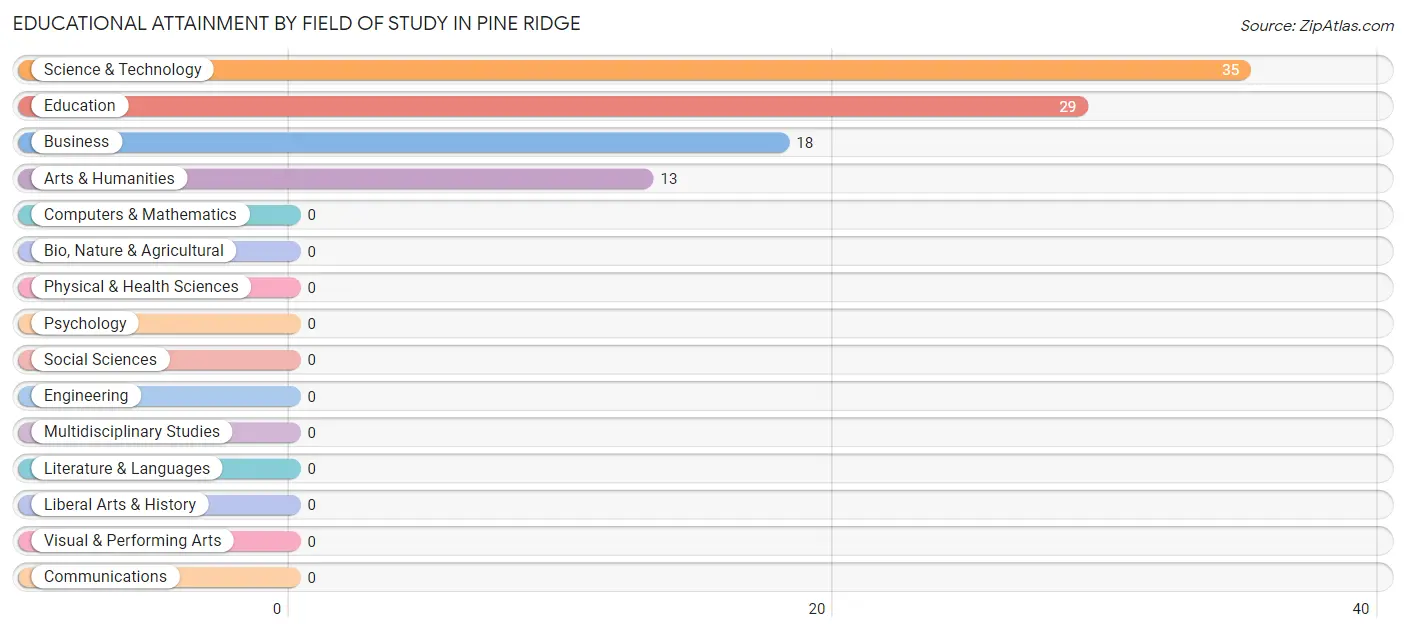
| Field of Study | # Graduates | % Graduates |
| Computers & Mathematics | 0 | 0.0% |
| Bio, Nature & Agricultural | 0 | 0.0% |
| Physical & Health Sciences | 0 | 0.0% |
| Psychology | 0 | 0.0% |
| Social Sciences | 0 | 0.0% |
| Engineering | 0 | 0.0% |
| Multidisciplinary Studies | 0 | 0.0% |
| Science & Technology | 35 | 36.8% |
| Business | 18 | 19.0% |
| Education | 29 | 30.5% |
| Literature & Languages | 0 | 0.0% |
| Liberal Arts & History | 0 | 0.0% |
| Visual & Performing Arts | 0 | 0.0% |
| Communications | 0 | 0.0% |
| Arts & Humanities | 13 | 13.7% |
| Total | 95 | 100.0% |
Transportation & Commute in Pine Ridge
Vehicle Availability by Sex in Pine Ridge
The most prevalent vehicle ownership categories in Pine Ridge are males with 3 vehicles (208, accounting for 62.3%) and females with 3 vehicles (168, making up 49.9%).
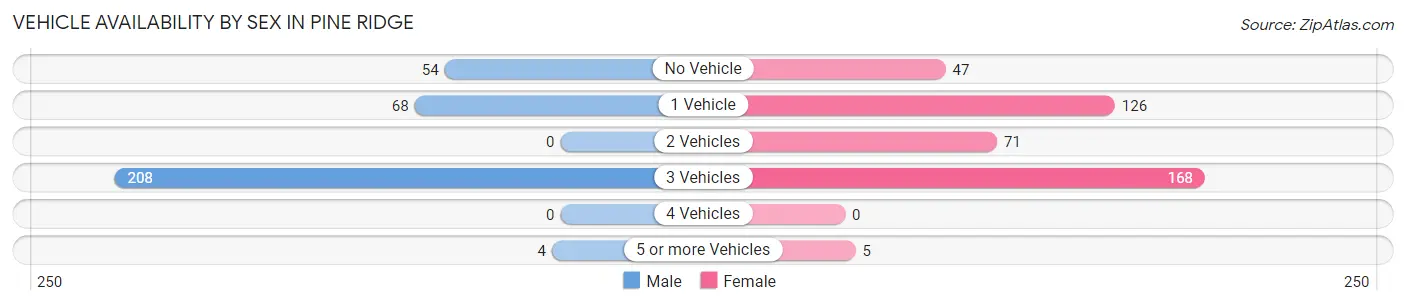
| Vehicles Available | Male | Female |
| No Vehicle | 54 (16.2%) | 47 (11.3%) |
| 1 Vehicle | 68 (20.4%) | 126 (30.2%) |
| 2 Vehicles | 0 (0.0%) | 71 (17.0%) |
| 3 Vehicles | 208 (62.3%) | 168 (40.3%) |
| 4 Vehicles | 0 (0.0%) | 0 (0.0%) |
| 5 or more Vehicles | 4 (1.2%) | 5 (1.2%) |
| Total | 334 (100.0%) | 417 (100.0%) |
Commute Time in Pine Ridge
The most frequently occuring commute durations in Pine Ridge are 5 to 9 minutes (267 commuters, 36.4%), 10 to 14 minutes (185 commuters, 25.2%), and less than 5 minutes (145 commuters, 19.8%).
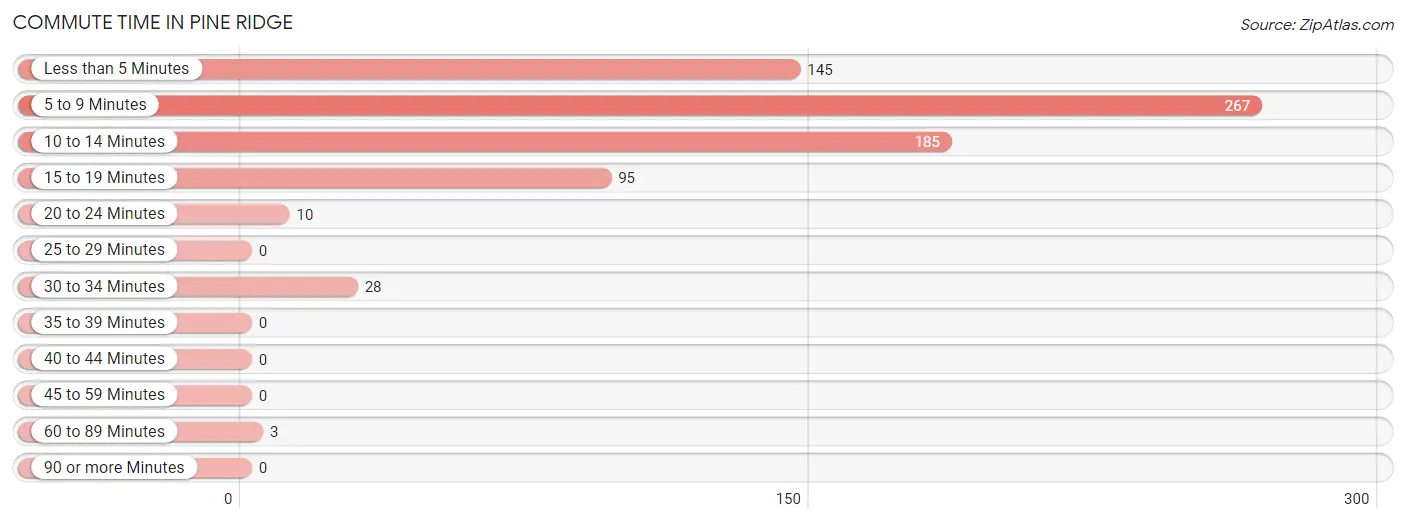
| Commute Time | # Commuters | % Commuters |
| Less than 5 Minutes | 145 | 19.8% |
| 5 to 9 Minutes | 267 | 36.4% |
| 10 to 14 Minutes | 185 | 25.2% |
| 15 to 19 Minutes | 95 | 13.0% |
| 20 to 24 Minutes | 10 | 1.4% |
| 25 to 29 Minutes | 0 | 0.0% |
| 30 to 34 Minutes | 28 | 3.8% |
| 35 to 39 Minutes | 0 | 0.0% |
| 40 to 44 Minutes | 0 | 0.0% |
| 45 to 59 Minutes | 0 | 0.0% |
| 60 to 89 Minutes | 3 | 0.4% |
| 90 or more Minutes | 0 | 0.0% |
Commute Time by Sex in Pine Ridge
The most common commute times in Pine Ridge are less than 5 minutes (116 commuters, 34.7%) for males and 5 to 9 minutes (199 commuters, 49.9%) for females.
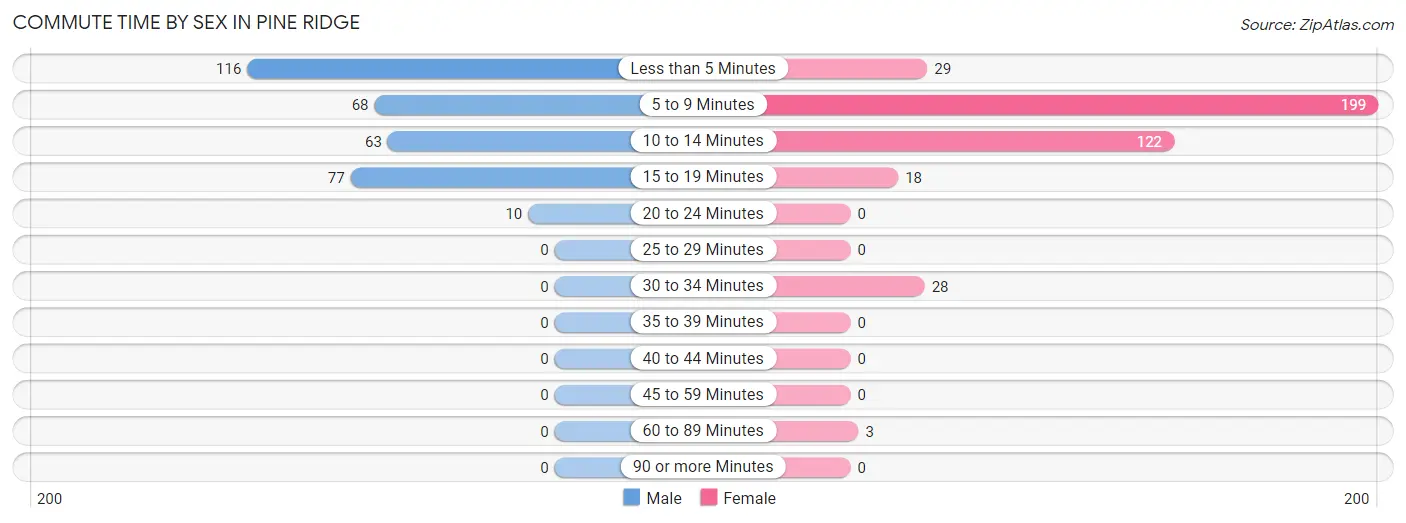
| Commute Time | Male | Female |
| Less than 5 Minutes | 116 (34.7%) | 29 (7.3%) |
| 5 to 9 Minutes | 68 (20.4%) | 199 (49.9%) |
| 10 to 14 Minutes | 63 (18.9%) | 122 (30.6%) |
| 15 to 19 Minutes | 77 (23.1%) | 18 (4.5%) |
| 20 to 24 Minutes | 10 (3.0%) | 0 (0.0%) |
| 25 to 29 Minutes | 0 (0.0%) | 0 (0.0%) |
| 30 to 34 Minutes | 0 (0.0%) | 28 (7.0%) |
| 35 to 39 Minutes | 0 (0.0%) | 0 (0.0%) |
| 40 to 44 Minutes | 0 (0.0%) | 0 (0.0%) |
| 45 to 59 Minutes | 0 (0.0%) | 0 (0.0%) |
| 60 to 89 Minutes | 0 (0.0%) | 3 (0.7%) |
| 90 or more Minutes | 0 (0.0%) | 0 (0.0%) |
Time of Departure to Work by Sex in Pine Ridge
The most frequent times of departure to work in Pine Ridge are 7:00 AM to 7:29 AM (122, 36.5%) for males and 7:30 AM to 7:59 AM (159, 39.9%) for females.
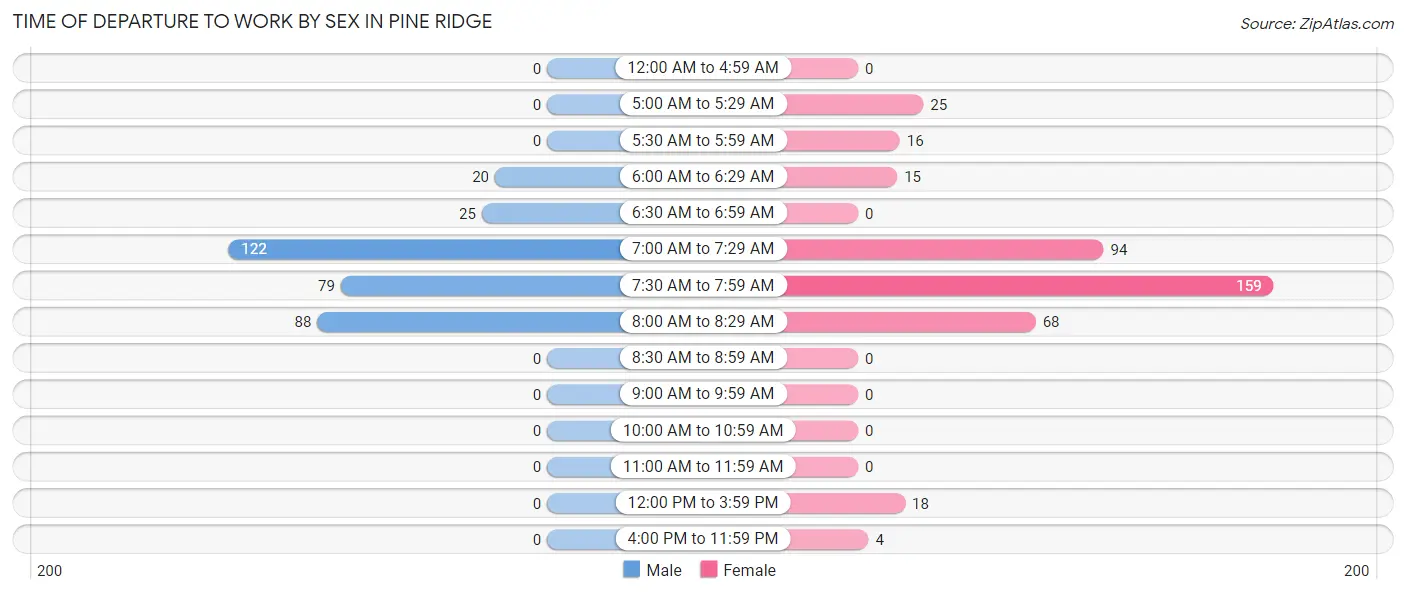
| Time of Departure | Male | Female |
| 12:00 AM to 4:59 AM | 0 (0.0%) | 0 (0.0%) |
| 5:00 AM to 5:29 AM | 0 (0.0%) | 25 (6.3%) |
| 5:30 AM to 5:59 AM | 0 (0.0%) | 16 (4.0%) |
| 6:00 AM to 6:29 AM | 20 (6.0%) | 15 (3.8%) |
| 6:30 AM to 6:59 AM | 25 (7.5%) | 0 (0.0%) |
| 7:00 AM to 7:29 AM | 122 (36.5%) | 94 (23.6%) |
| 7:30 AM to 7:59 AM | 79 (23.6%) | 159 (39.9%) |
| 8:00 AM to 8:29 AM | 88 (26.4%) | 68 (17.0%) |
| 8:30 AM to 8:59 AM | 0 (0.0%) | 0 (0.0%) |
| 9:00 AM to 9:59 AM | 0 (0.0%) | 0 (0.0%) |
| 10:00 AM to 10:59 AM | 0 (0.0%) | 0 (0.0%) |
| 11:00 AM to 11:59 AM | 0 (0.0%) | 0 (0.0%) |
| 12:00 PM to 3:59 PM | 0 (0.0%) | 18 (4.5%) |
| 4:00 PM to 11:59 PM | 0 (0.0%) | 4 (1.0%) |
| Total | 334 (100.0%) | 399 (100.0%) |
Housing Occupancy in Pine Ridge
Occupancy by Ownership in Pine Ridge
Of the total 503 dwellings in Pine Ridge, owner-occupied units account for 148 (29.4%), while renter-occupied units make up 355 (70.6%).
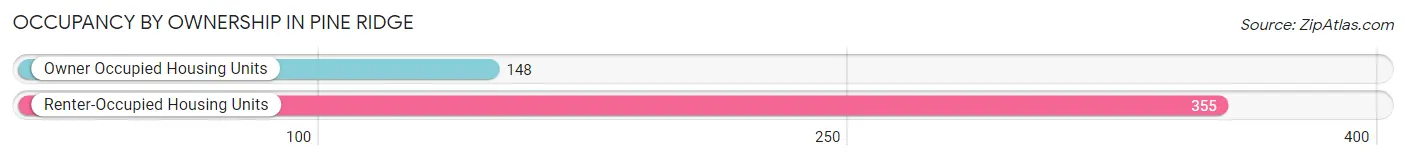
| Occupancy | # Housing Units | % Housing Units |
| Owner Occupied Housing Units | 148 | 29.4% |
| Renter-Occupied Housing Units | 355 | 70.6% |
| Total Occupied Housing Units | 503 | 100.0% |
Occupancy by Household Size in Pine Ridge
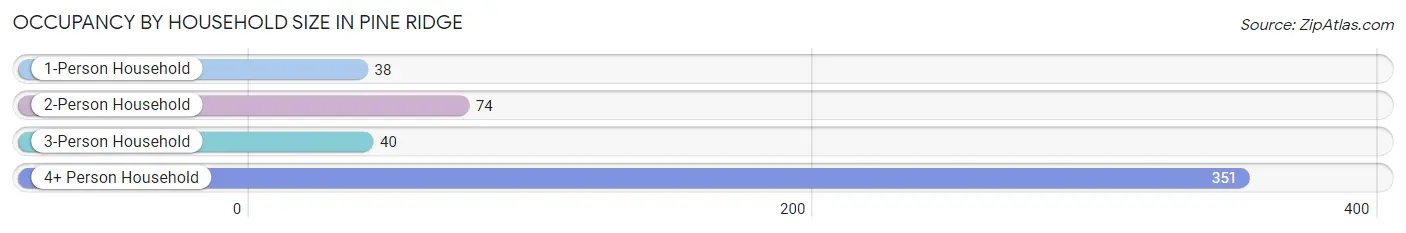
| Household Size | # Housing Units | % Housing Units |
| 1-Person Household | 38 | 7.5% |
| 2-Person Household | 74 | 14.7% |
| 3-Person Household | 40 | 8.0% |
| 4+ Person Household | 351 | 69.8% |
| Total Housing Units | 503 | 100.0% |
Occupancy by Ownership by Household Size in Pine Ridge
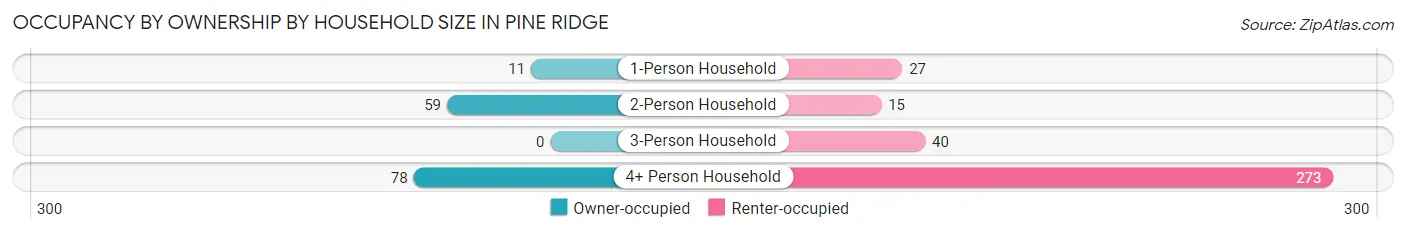
| Household Size | Owner-occupied | Renter-occupied |
| 1-Person Household | 11 (28.9%) | 27 (71.1%) |
| 2-Person Household | 59 (79.7%) | 15 (20.3%) |
| 3-Person Household | 0 (0.0%) | 40 (100.0%) |
| 4+ Person Household | 78 (22.2%) | 273 (77.8%) |
| Total Housing Units | 148 (29.4%) | 355 (70.6%) |
Occupancy by Educational Attainment in Pine Ridge
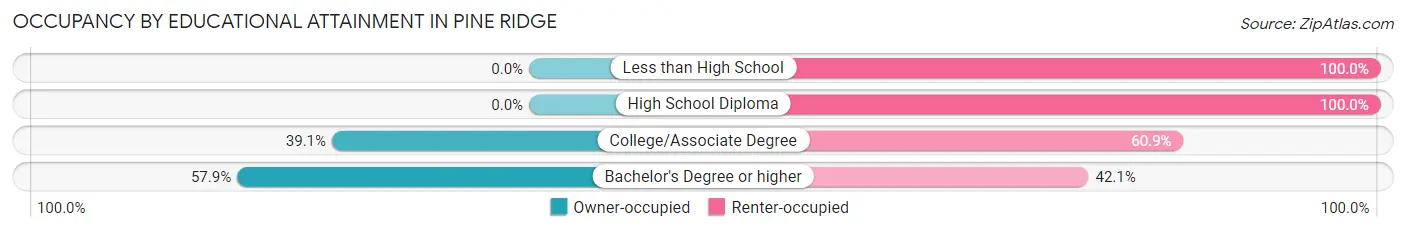
| Household Size | Owner-occupied | Renter-occupied |
| Less than High School | 0 (0.0%) | 124 (100.0%) |
| High School Diploma | 0 (0.0%) | 46 (100.0%) |
| College/Associate Degree | 93 (39.1%) | 145 (60.9%) |
| Bachelor's Degree or higher | 55 (57.9%) | 40 (42.1%) |
Occupancy by Age of Householder in Pine Ridge
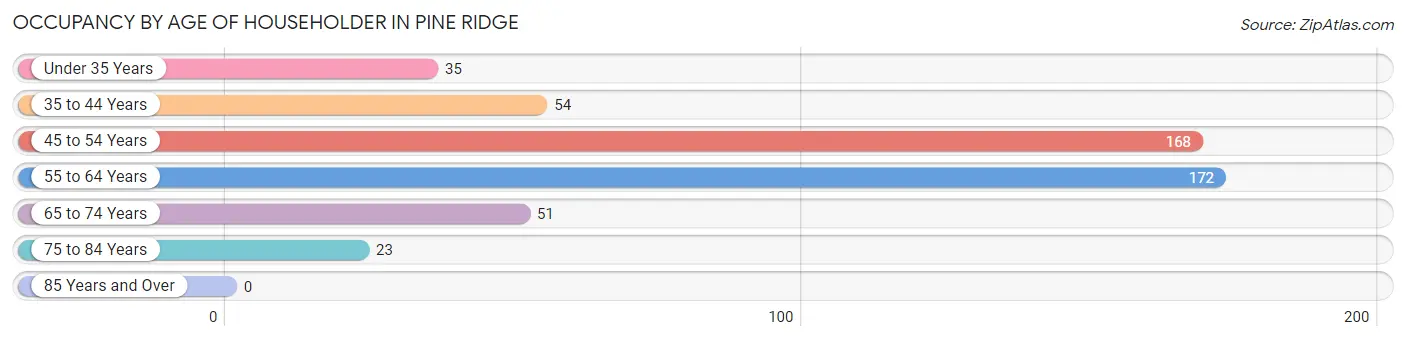
| Age Bracket | # Households | % Households |
| Under 35 Years | 35 | 7.0% |
| 35 to 44 Years | 54 | 10.7% |
| 45 to 54 Years | 168 | 33.4% |
| 55 to 64 Years | 172 | 34.2% |
| 65 to 74 Years | 51 | 10.1% |
| 75 to 84 Years | 23 | 4.6% |
| 85 Years and Over | 0 | 0.0% |
| Total | 503 | 100.0% |
Housing Finances in Pine Ridge
Median Income by Occupancy in Pine Ridge
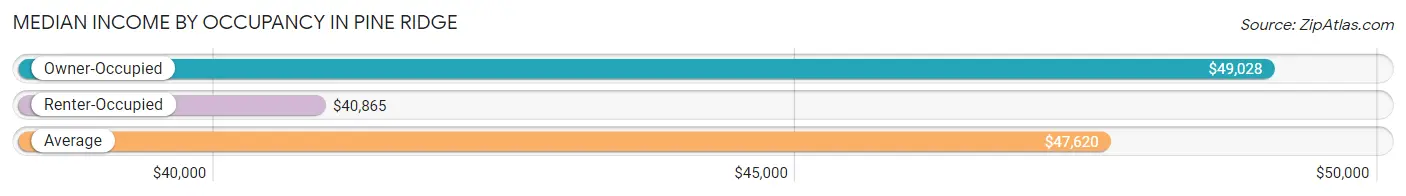
| Occupancy Type | # Households | Median Income |
| Owner-Occupied | 148 (29.4%) | $49,028 |
| Renter-Occupied | 355 (70.6%) | $40,865 |
| Average | 503 (100.0%) | $47,620 |
Occupancy by Householder Income Bracket in Pine Ridge
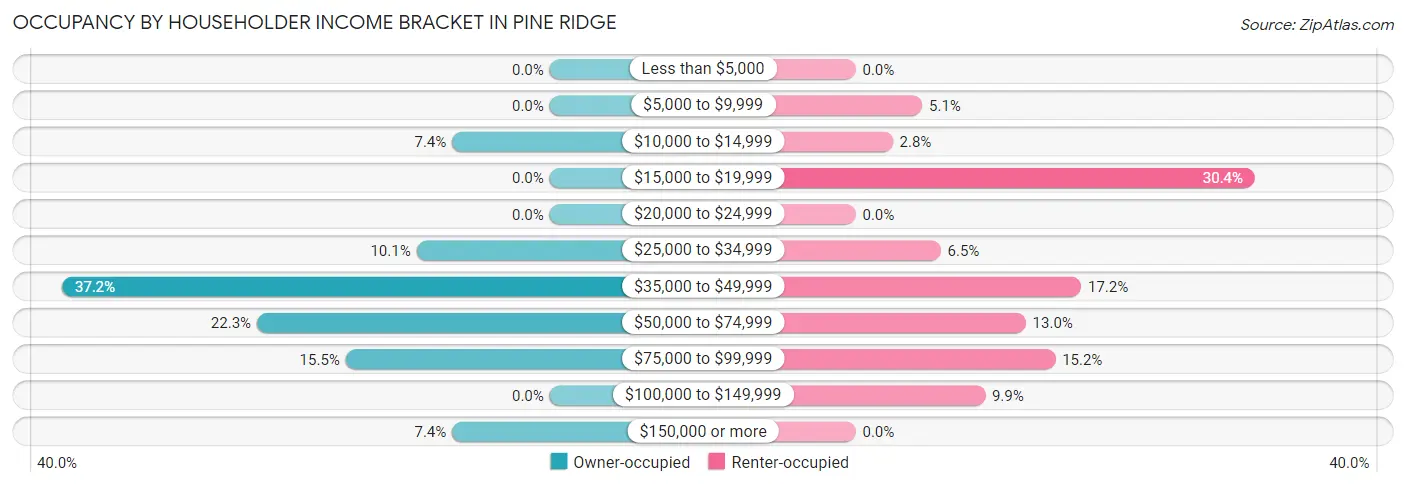
| Income Bracket | Owner-occupied | Renter-occupied |
| Less than $5,000 | 0 (0.0%) | 0 (0.0%) |
| $5,000 to $9,999 | 0 (0.0%) | 18 (5.1%) |
| $10,000 to $14,999 | 11 (7.4%) | 10 (2.8%) |
| $15,000 to $19,999 | 0 (0.0%) | 108 (30.4%) |
| $20,000 to $24,999 | 0 (0.0%) | 0 (0.0%) |
| $25,000 to $34,999 | 15 (10.1%) | 23 (6.5%) |
| $35,000 to $49,999 | 55 (37.2%) | 61 (17.2%) |
| $50,000 to $74,999 | 33 (22.3%) | 46 (13.0%) |
| $75,000 to $99,999 | 23 (15.5%) | 54 (15.2%) |
| $100,000 to $149,999 | 0 (0.0%) | 35 (9.9%) |
| $150,000 or more | 11 (7.4%) | 0 (0.0%) |
| Total | 148 (100.0%) | 355 (100.0%) |
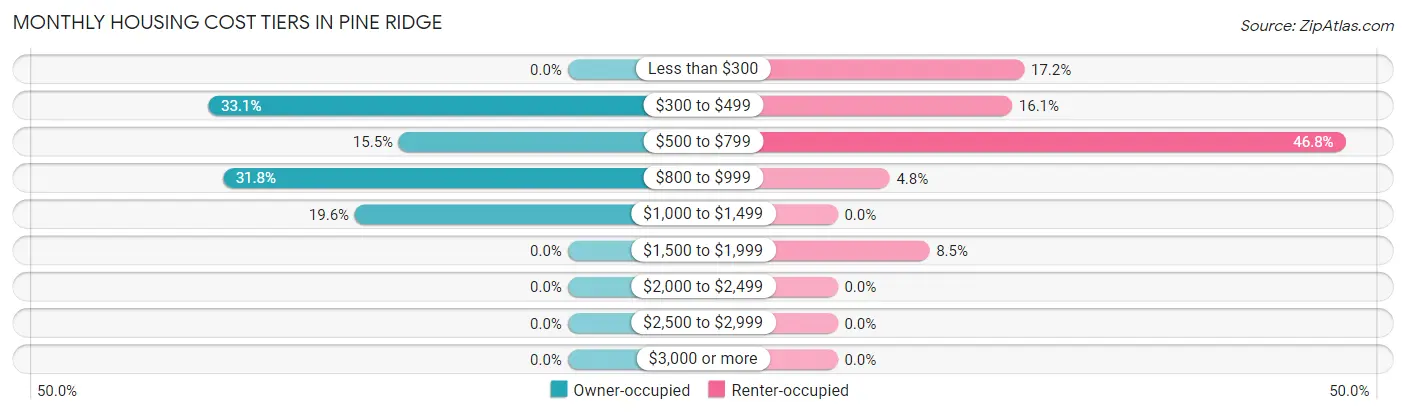
Monthly Housing Cost Tiers in Pine Ridge
| Monthly Cost | Owner-occupied | Renter-occupied |
| Less than $300 | 0 (0.0%) | 61 (17.2%) |
| $300 to $499 | 49 (33.1%) | 57 (16.1%) |
| $500 to $799 | 23 (15.5%) | 166 (46.8%) |
| $800 to $999 | 47 (31.8%) | 17 (4.8%) |
| $1,000 to $1,499 | 29 (19.6%) | 0 (0.0%) |
| $1,500 to $1,999 | 0 (0.0%) | 30 (8.5%) |
| $2,000 to $2,499 | 0 (0.0%) | 0 (0.0%) |
| $2,500 to $2,999 | 0 (0.0%) | 0 (0.0%) |
| $3,000 or more | 0 (0.0%) | 0 (0.0%) |
| Total | 148 (100.0%) | 355 (100.0%) |
Physical Housing Characteristics in Pine Ridge
Housing Structures in Pine Ridge
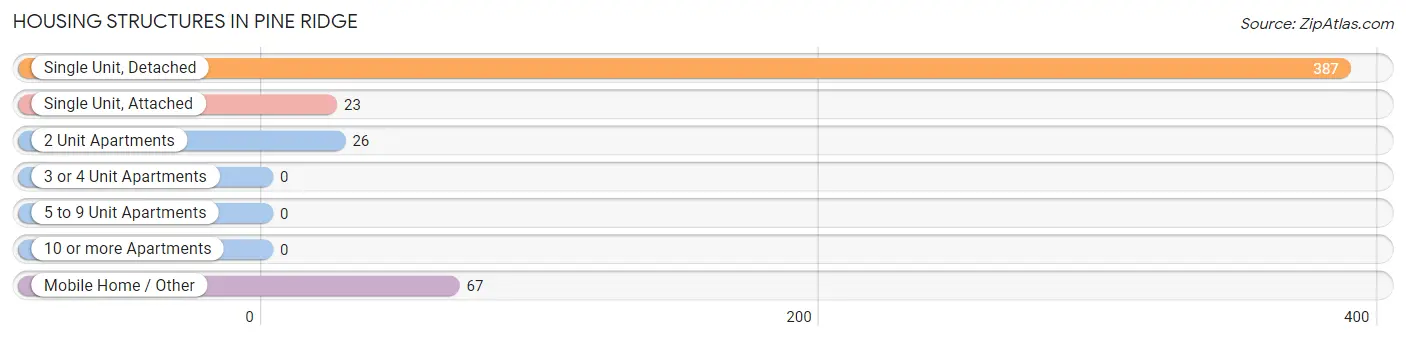
| Structure Type | # Housing Units | % Housing Units |
| Single Unit, Detached | 387 | 76.9% |
| Single Unit, Attached | 23 | 4.6% |
| 2 Unit Apartments | 26 | 5.2% |
| 3 or 4 Unit Apartments | 0 | 0.0% |
| 5 to 9 Unit Apartments | 0 | 0.0% |
| 10 or more Apartments | 0 | 0.0% |
| Mobile Home / Other | 67 | 13.3% |
| Total | 503 | 100.0% |
Housing Structures by Occupancy in Pine Ridge
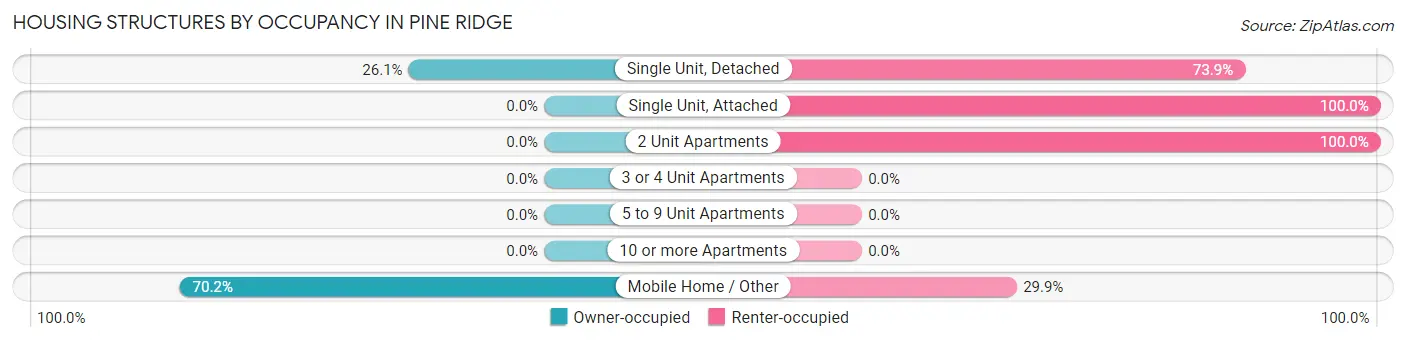
| Structure Type | Owner-occupied | Renter-occupied |
| Single Unit, Detached | 101 (26.1%) | 286 (73.9%) |
| Single Unit, Attached | 0 (0.0%) | 23 (100.0%) |
| 2 Unit Apartments | 0 (0.0%) | 26 (100.0%) |
| 3 or 4 Unit Apartments | 0 (0.0%) | 0 (0.0%) |
| 5 to 9 Unit Apartments | 0 (0.0%) | 0 (0.0%) |
| 10 or more Apartments | 0 (0.0%) | 0 (0.0%) |
| Mobile Home / Other | 47 (70.2%) | 20 (29.8%) |
| Total | 148 (29.4%) | 355 (70.6%) |
Housing Structures by Number of Rooms in Pine Ridge
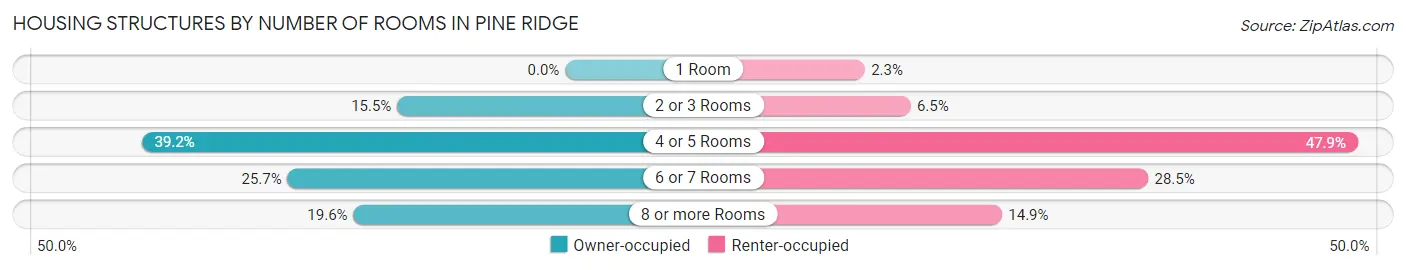
| Number of Rooms | Owner-occupied | Renter-occupied |
| 1 Room | 0 (0.0%) | 8 (2.2%) |
| 2 or 3 Rooms | 23 (15.5%) | 23 (6.5%) |
| 4 or 5 Rooms | 58 (39.2%) | 170 (47.9%) |
| 6 or 7 Rooms | 38 (25.7%) | 101 (28.4%) |
| 8 or more Rooms | 29 (19.6%) | 53 (14.9%) |
| Total | 148 (100.0%) | 355 (100.0%) |
Housing Structure by Heating Type in Pine Ridge
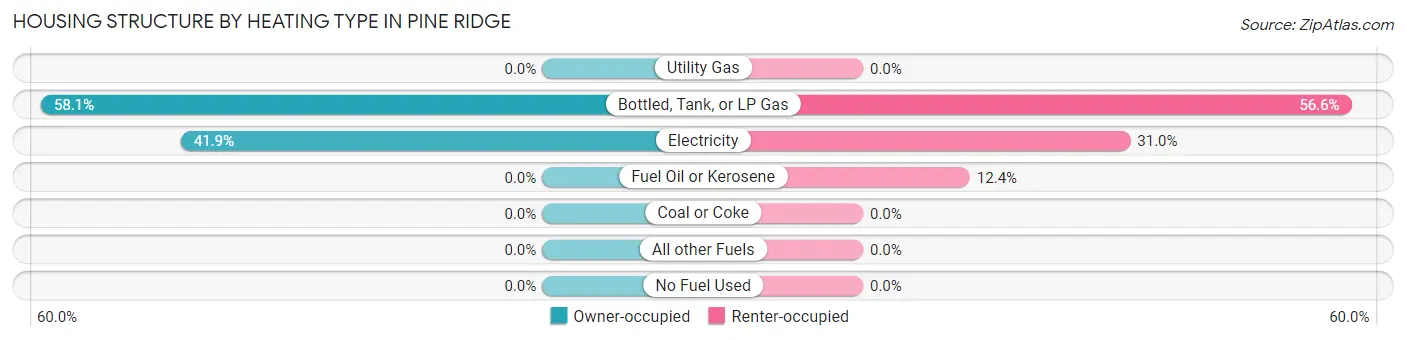
| Heating Type | Owner-occupied | Renter-occupied |
| Utility Gas | 0 (0.0%) | 0 (0.0%) |
| Bottled, Tank, or LP Gas | 86 (58.1%) | 201 (56.6%) |
| Electricity | 62 (41.9%) | 110 (31.0%) |
| Fuel Oil or Kerosene | 0 (0.0%) | 44 (12.4%) |
| Coal or Coke | 0 (0.0%) | 0 (0.0%) |
| All other Fuels | 0 (0.0%) | 0 (0.0%) |
| No Fuel Used | 0 (0.0%) | 0 (0.0%) |
| Total | 148 (100.0%) | 355 (100.0%) |
Household Vehicle Usage in Pine Ridge
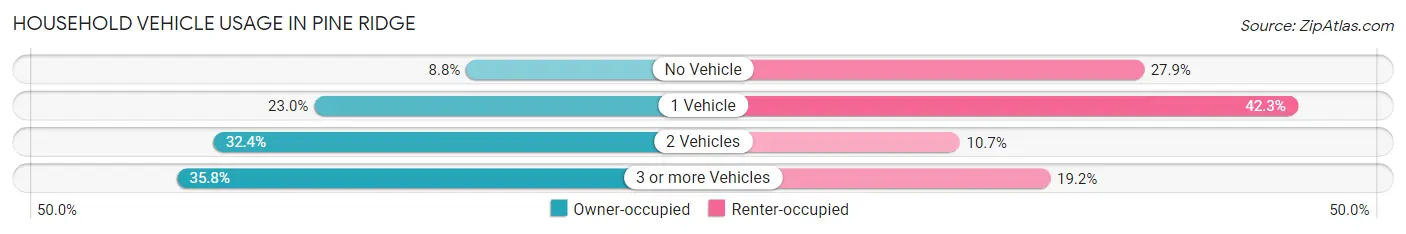
| Vehicles per Household | Owner-occupied | Renter-occupied |
| No Vehicle | 13 (8.8%) | 99 (27.9%) |
| 1 Vehicle | 34 (23.0%) | 150 (42.2%) |
| 2 Vehicles | 48 (32.4%) | 38 (10.7%) |
| 3 or more Vehicles | 53 (35.8%) | 68 (19.2%) |
| Total | 148 (100.0%) | 355 (100.0%) |
Real Estate & Mortgages in Pine Ridge
Real Estate and Mortgage Overview in Pine Ridge
| Characteristic | Without Mortgage | With Mortgage |
| Housing Units | 96 | 52 |
| Median Property Value | - | - |
| Median Household Income | $40,938 | $11 |
| Monthly Housing Costs | $497 | $0 |
| Real Estate Taxes | - | - |
Property Value by Mortgage Status in Pine Ridge
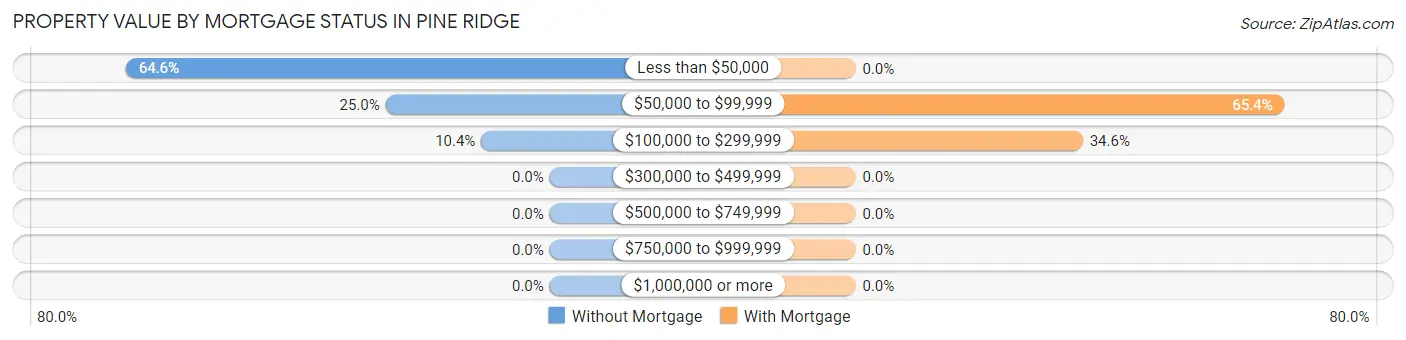
| Property Value | Without Mortgage | With Mortgage |
| Less than $50,000 | 62 (64.6%) | 0 (0.0%) |
| $50,000 to $99,999 | 24 (25.0%) | 34 (65.4%) |
| $100,000 to $299,999 | 10 (10.4%) | 18 (34.6%) |
| $300,000 to $499,999 | 0 (0.0%) | 0 (0.0%) |
| $500,000 to $749,999 | 0 (0.0%) | 0 (0.0%) |
| $750,000 to $999,999 | 0 (0.0%) | 0 (0.0%) |
| $1,000,000 or more | 0 (0.0%) | 0 (0.0%) |
| Total | 96 (100.0%) | 52 (100.0%) |
Household Income by Mortgage Status in Pine Ridge
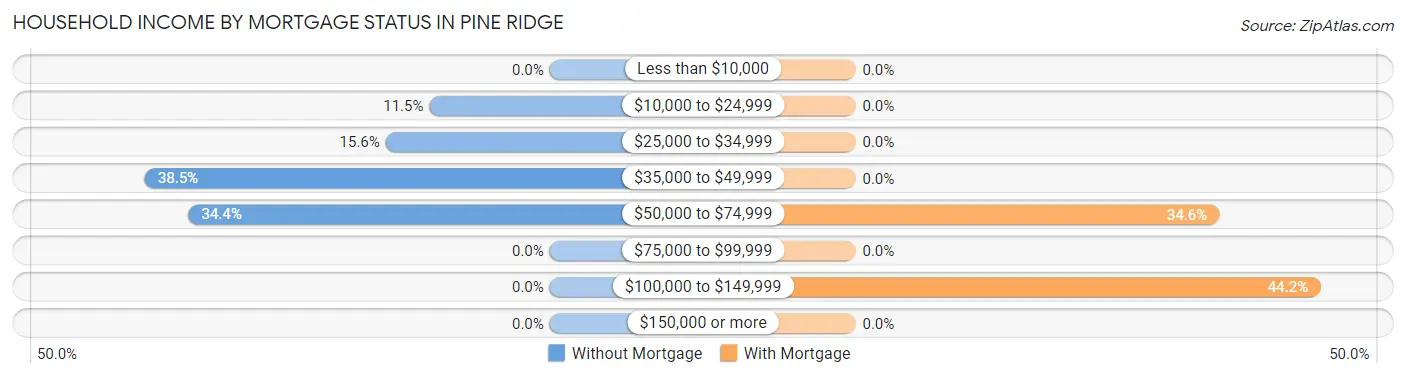
| Household Income | Without Mortgage | With Mortgage |
| Less than $10,000 | 0 (0.0%) | 0 (0.0%) |
| $10,000 to $24,999 | 11 (11.5%) | 0 (0.0%) |
| $25,000 to $34,999 | 15 (15.6%) | 0 (0.0%) |
| $35,000 to $49,999 | 37 (38.5%) | 0 (0.0%) |
| $50,000 to $74,999 | 33 (34.4%) | 18 (34.6%) |
| $75,000 to $99,999 | 0 (0.0%) | 0 (0.0%) |
| $100,000 to $149,999 | 0 (0.0%) | 23 (44.2%) |
| $150,000 or more | 0 (0.0%) | 0 (0.0%) |
| Total | 96 (100.0%) | 52 (100.0%) |
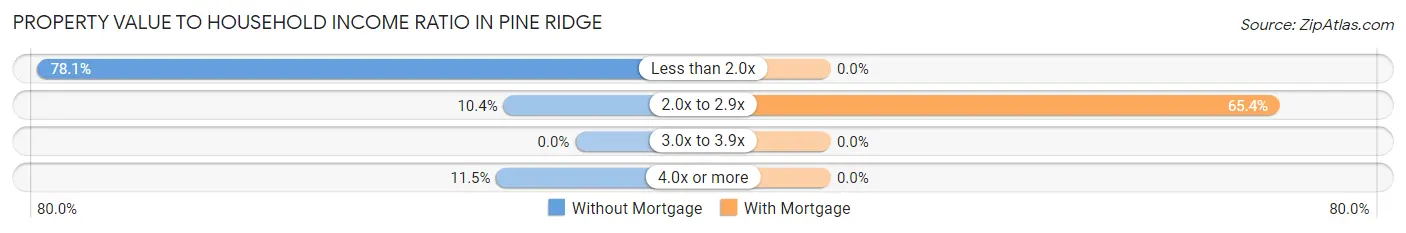
Property Value to Household Income Ratio in Pine Ridge
| Value-to-Income Ratio | Without Mortgage | With Mortgage |
| Less than 2.0x | 75 (78.1%) | 0 (0.0%) |
| 2.0x to 2.9x | 10 (10.4%) | 34 (65.4%) |
| 3.0x to 3.9x | 0 (0.0%) | 0 (0.0%) |
| 4.0x or more | 11 (11.5%) | 0 (0.0%) |
| Total | 96 (100.0%) | 52 (100.0%) |
Real Estate Taxes by Mortgage Status in Pine Ridge
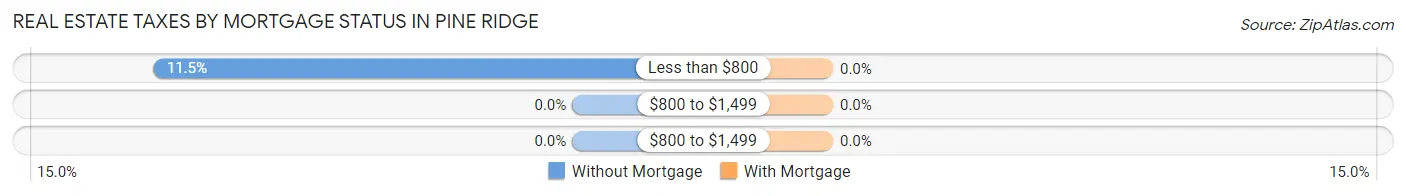
| Property Taxes | Without Mortgage | With Mortgage |
| Less than $800 | 11 (11.5%) | 0 (0.0%) |
| $800 to $1,499 | 0 (0.0%) | 0 (0.0%) |
| $800 to $1,499 | 0 (0.0%) | 0 (0.0%) |
| Total | 96 (100.0%) | 52 (100.0%) |
Health & Disability in Pine Ridge
Health Insurance Coverage by Age in Pine Ridge
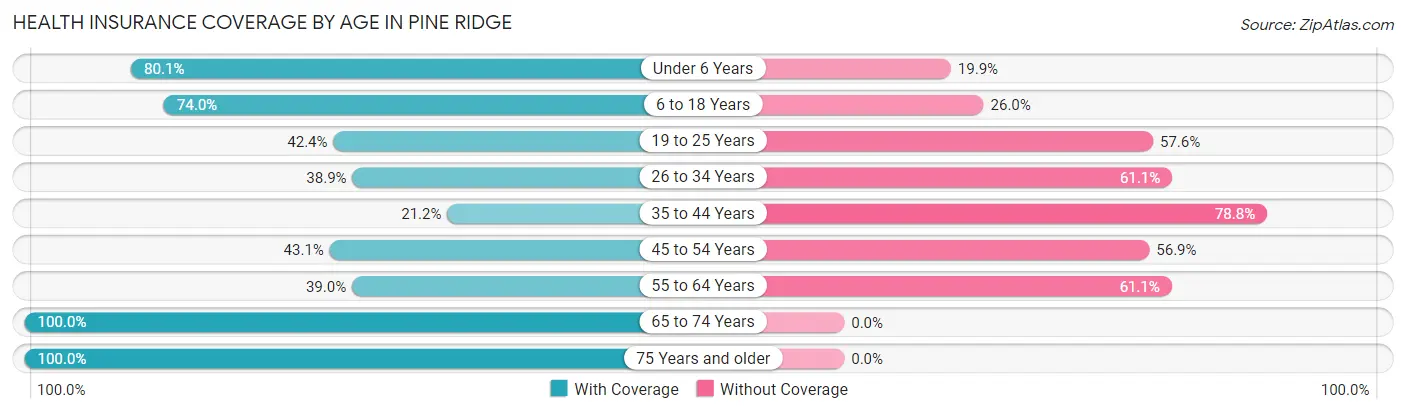
| Age Bracket | With Coverage | Without Coverage |
| Under 6 Years | 266 (80.1%) | 66 (19.9%) |
| 6 to 18 Years | 644 (74.0%) | 226 (26.0%) |
| 19 to 25 Years | 126 (42.4%) | 171 (57.6%) |
| 26 to 34 Years | 138 (38.9%) | 217 (61.1%) |
| 35 to 44 Years | 86 (21.2%) | 320 (78.8%) |
| 45 to 54 Years | 122 (43.1%) | 161 (56.9%) |
| 55 to 64 Years | 111 (39.0%) | 174 (61.1%) |
| 65 to 74 Years | 51 (100.0%) | 0 (0.0%) |
| 75 Years and older | 23 (100.0%) | 0 (0.0%) |
| Total | 1,567 (54.0%) | 1,335 (46.0%) |
Health Insurance Coverage by Citizenship Status in Pine Ridge
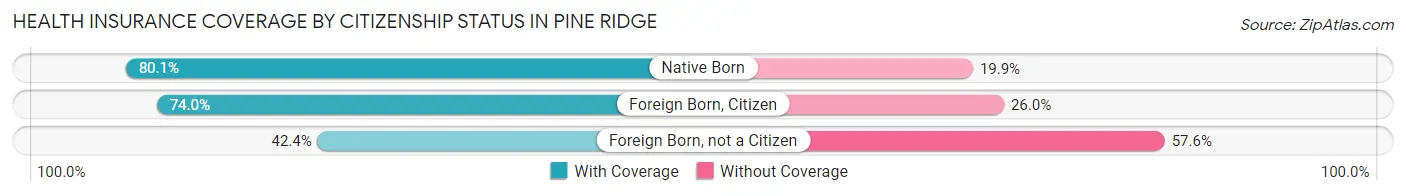
| Citizenship Status | With Coverage | Without Coverage |
| Native Born | 266 (80.1%) | 66 (19.9%) |
| Foreign Born, Citizen | 644 (74.0%) | 226 (26.0%) |
| Foreign Born, not a Citizen | 126 (42.4%) | 171 (57.6%) |
Health Insurance Coverage by Household Income in Pine Ridge
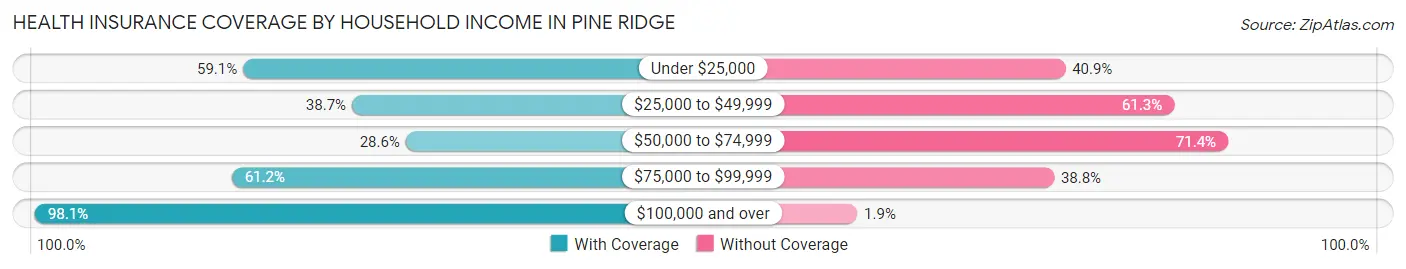
| Household Income | With Coverage | Without Coverage |
| Under $25,000 | 410 (59.1%) | 284 (40.9%) |
| $25,000 to $49,999 | 352 (38.7%) | 558 (61.3%) |
| $50,000 to $74,999 | 141 (28.6%) | 352 (71.4%) |
| $75,000 to $99,999 | 205 (61.2%) | 130 (38.8%) |
| $100,000 and over | 456 (98.1%) | 9 (1.9%) |
Public vs Private Health Insurance Coverage by Age in Pine Ridge
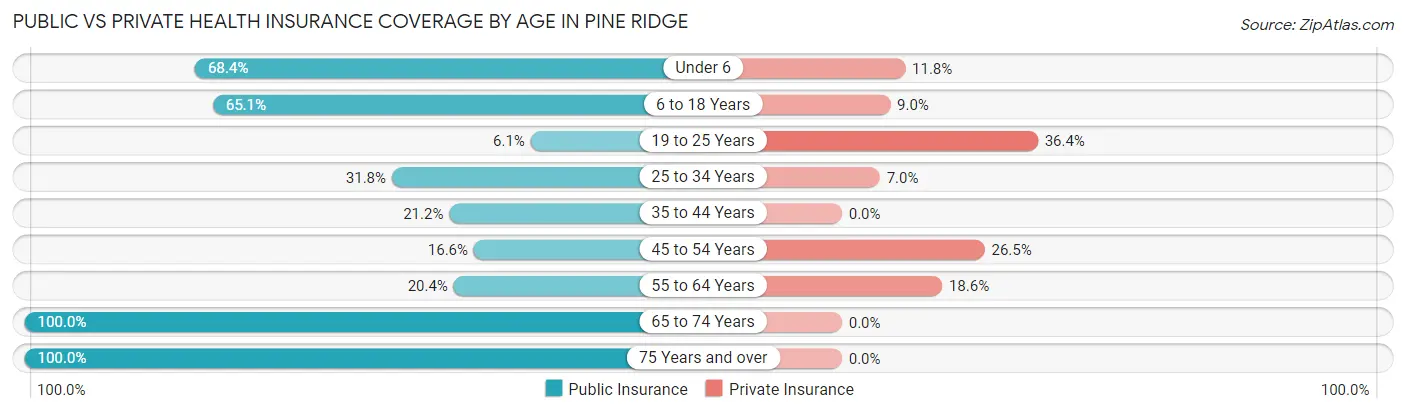
| Age Bracket | Public Insurance | Private Insurance |
| Under 6 | 227 (68.4%) | 39 (11.7%) |
| 6 to 18 Years | 566 (65.1%) | 78 (9.0%) |
| 19 to 25 Years | 18 (6.1%) | 108 (36.4%) |
| 25 to 34 Years | 113 (31.8%) | 25 (7.0%) |
| 35 to 44 Years | 86 (21.2%) | 0 (0.0%) |
| 45 to 54 Years | 47 (16.6%) | 75 (26.5%) |
| 55 to 64 Years | 58 (20.3%) | 53 (18.6%) |
| 65 to 74 Years | 51 (100.0%) | 0 (0.0%) |
| 75 Years and over | 23 (100.0%) | 0 (0.0%) |
| Total | 1,189 (41.0%) | 378 (13.0%) |
Disability Status by Sex by Age in Pine Ridge
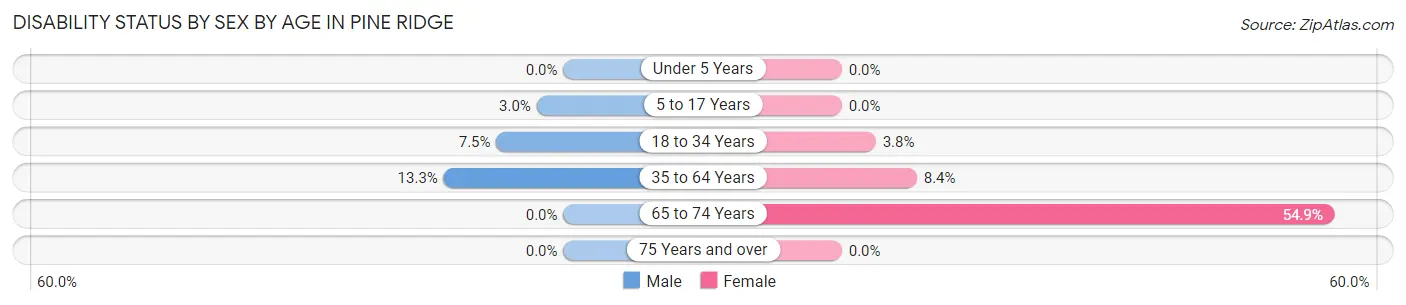
| Age Bracket | Male | Female |
| Under 5 Years | 0 (0.0%) | 0 (0.0%) |
| 5 to 17 Years | 16 (3.0%) | 0 (0.0%) |
| 18 to 34 Years | 20 (7.5%) | 16 (3.8%) |
| 35 to 64 Years | 58 (13.3%) | 45 (8.4%) |
| 65 to 74 Years | 0 (0.0%) | 28 (54.9%) |
| 75 Years and over | 0 (0.0%) | 0 (0.0%) |
Disability Class by Sex by Age in Pine Ridge
Disability Class: Hearing Difficulty
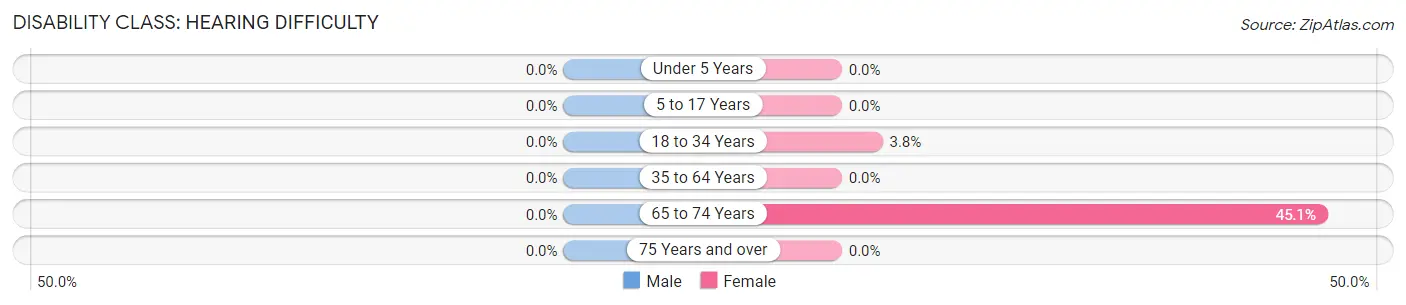
| Age Bracket | Male | Female |
| Under 5 Years | 0 (0.0%) | 0 (0.0%) |
| 5 to 17 Years | 0 (0.0%) | 0 (0.0%) |
| 18 to 34 Years | 0 (0.0%) | 16 (3.8%) |
| 35 to 64 Years | 0 (0.0%) | 0 (0.0%) |
| 65 to 74 Years | 0 (0.0%) | 23 (45.1%) |
| 75 Years and over | 0 (0.0%) | 0 (0.0%) |
Disability Class: Vision Difficulty
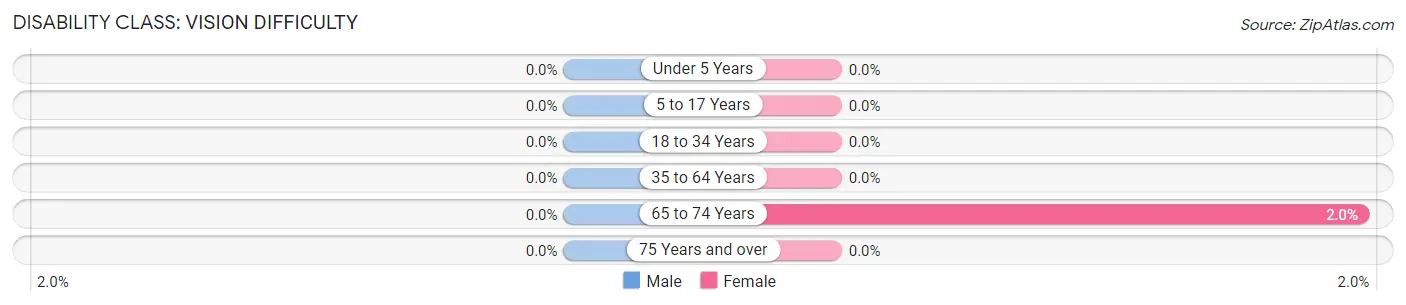
| Age Bracket | Male | Female |
| Under 5 Years | 0 (0.0%) | 0 (0.0%) |
| 5 to 17 Years | 0 (0.0%) | 0 (0.0%) |
| 18 to 34 Years | 0 (0.0%) | 0 (0.0%) |
| 35 to 64 Years | 0 (0.0%) | 0 (0.0%) |
| 65 to 74 Years | 0 (0.0%) | 1 (2.0%) |
| 75 Years and over | 0 (0.0%) | 0 (0.0%) |
Disability Class: Cognitive Difficulty
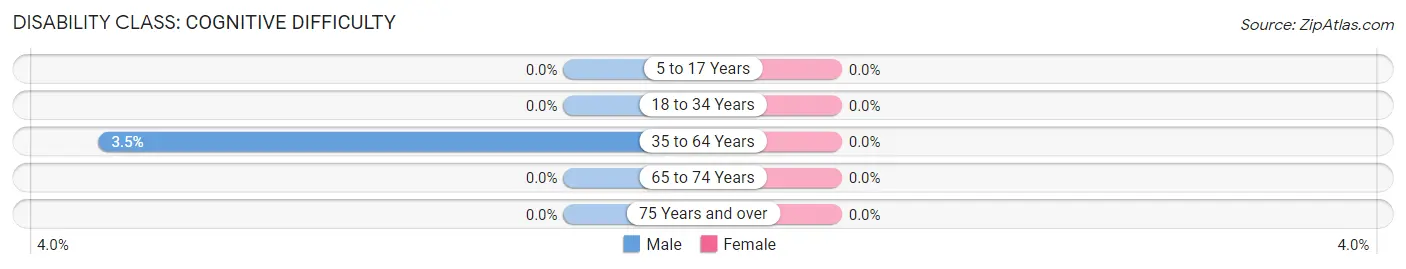
| Age Bracket | Male | Female |
| 5 to 17 Years | 0 (0.0%) | 0 (0.0%) |
| 18 to 34 Years | 0 (0.0%) | 0 (0.0%) |
| 35 to 64 Years | 15 (3.5%) | 0 (0.0%) |
| 65 to 74 Years | 0 (0.0%) | 0 (0.0%) |
| 75 Years and over | 0 (0.0%) | 0 (0.0%) |
Disability Class: Ambulatory Difficulty
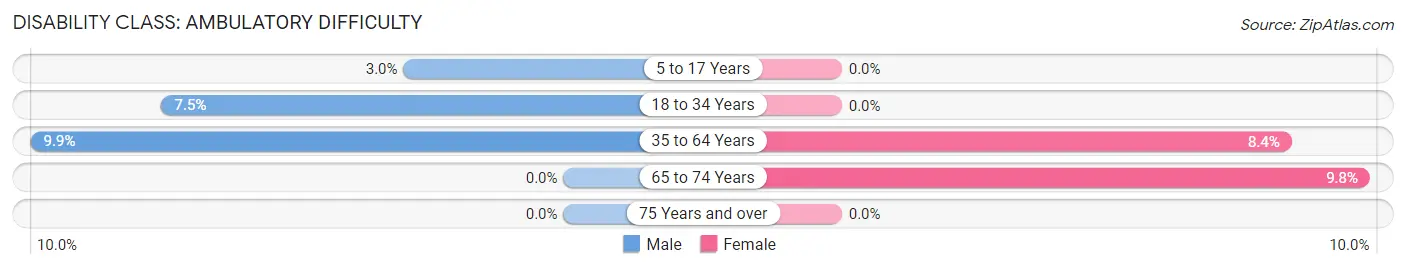
| Age Bracket | Male | Female |
| 5 to 17 Years | 16 (3.0%) | 0 (0.0%) |
| 18 to 34 Years | 20 (7.5%) | 0 (0.0%) |
| 35 to 64 Years | 43 (9.9%) | 45 (8.4%) |
| 65 to 74 Years | 0 (0.0%) | 5 (9.8%) |
| 75 Years and over | 0 (0.0%) | 0 (0.0%) |
Disability Class: Self-Care Difficulty
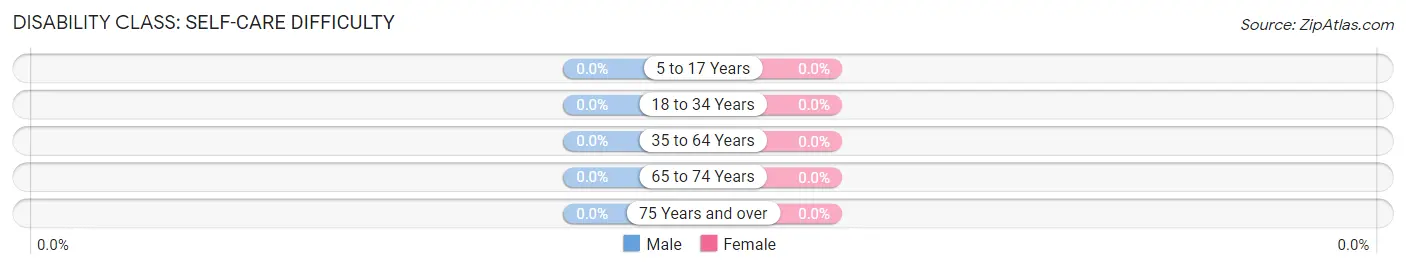
| Age Bracket | Male | Female |
| 5 to 17 Years | 0 (0.0%) | 0 (0.0%) |
| 18 to 34 Years | 0 (0.0%) | 0 (0.0%) |
| 35 to 64 Years | 0 (0.0%) | 0 (0.0%) |
| 65 to 74 Years | 0 (0.0%) | 0 (0.0%) |
| 75 Years and over | 0 (0.0%) | 0 (0.0%) |
Technology Access in Pine Ridge
Computing Device Access in Pine Ridge
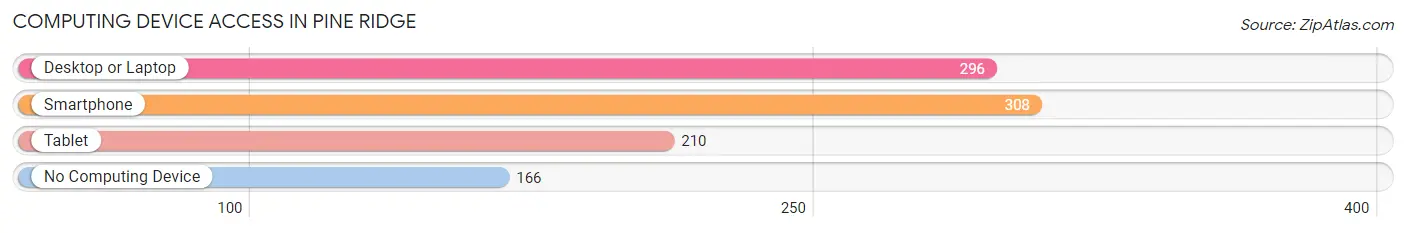
| Device Type | # Households | % Households |
| Desktop or Laptop | 296 | 58.9% |
| Smartphone | 308 | 61.2% |
| Tablet | 210 | 41.7% |
| No Computing Device | 166 | 33.0% |
| Total | 503 | 100.0% |
Internet Access in Pine Ridge
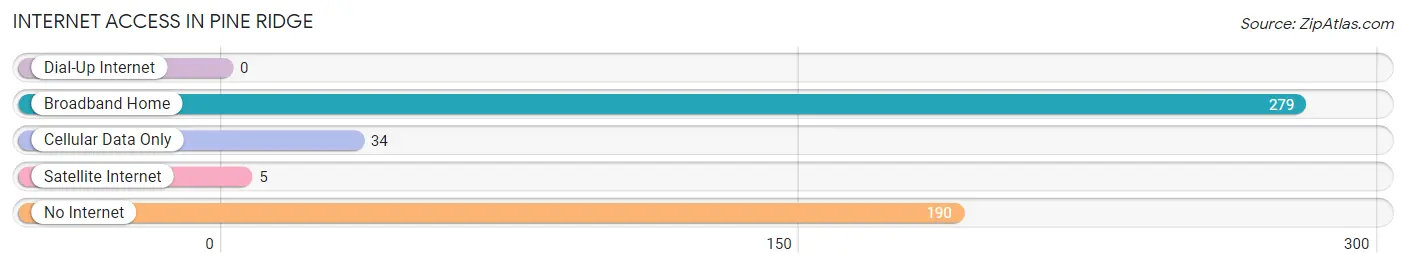
| Internet Type | # Households | % Households |
| Dial-Up Internet | 0 | 0.0% |
| Broadband Home | 279 | 55.5% |
| Cellular Data Only | 34 | 6.8% |
| Satellite Internet | 5 | 1.0% |
| No Internet | 190 | 37.8% |
| Total | 503 | 100.0% |
Pine Ridge Summary
Pine Ridge is a small unincorporated community located in the southwestern corner of South Dakota, in the United States. It is situated in the Oglala Lakota County, and is the largest community in the county. The population of Pine Ridge was estimated to be 8,530 in 2019.
History
The Pine Ridge area has been inhabited by the Oglala Lakota people for centuries. The area was first explored by Europeans in the late 1700s, and the first permanent settlement was established in 1876. The settlement was named Pine Ridge because of the abundance of pine trees in the area.
In 1889, the U.S. government established the Pine Ridge Indian Reservation, which was home to the Oglala Lakota people. The reservation was established to protect the Oglala Lakota people from further encroachment by white settlers.
In the late 19th century, the reservation was home to several Indian agencies, including the Pine Ridge Agency, the Rosebud Agency, and the Cheyenne River Agency. These agencies were responsible for providing services to the Oglala Lakota people, such as education, health care, and economic development.
In the early 20th century, the reservation was home to several Indian boarding schools, which were established to assimilate Native American children into white culture. These schools were often run by Christian missionaries, and the students were forced to abandon their traditional culture and language.
In 1973, the Oglala Lakota people declared the Pine Ridge Reservation to be an independent nation, the Oglala Sioux Nation. This declaration was made in response to the U.S. government’s failure to honor its treaty obligations to the Oglala Lakota people.
Geography
Pine Ridge is located in the southwestern corner of South Dakota, in the United States. It is situated in the Oglala Lakota County, and is the largest community in the county. The community is located on the Pine Ridge Indian Reservation, which covers an area of 3,468 square miles.
The terrain of the reservation is mostly flat, with rolling hills and valleys. The area is covered with grasslands, pine forests, and sagebrush. The reservation is home to several lakes, including the White Clay Lake, the Red Shirt Lake, and the Wounded Knee Lake.
The climate of the area is semi-arid, with hot summers and cold winters. The average annual temperature is 48°F, and the average annual precipitation is 16 inches.
Economy
The economy of Pine Ridge is largely based on agriculture and tourism. The reservation is home to several farms, which produce a variety of crops, including corn, wheat, and hay. The reservation is also home to several tourist attractions, including the Badlands National Park, the Crazy Horse Memorial, and the Wounded Knee Massacre Site.
The reservation is also home to several businesses, including a casino, a hotel, and several restaurants. The reservation is also home to several manufacturing companies, which produce a variety of products, including furniture, clothing, and jewelry.
Demographics
The population of Pine Ridge was estimated to be 8,530 in 2019. The population is predominantly Native American, with the Oglala Lakota people making up the majority of the population. The median age of the population is 28.7 years, and the median household income is $20,945.
The majority of the population is Christian, with the Catholic Church being the largest denomination. The reservation is also home to several other religious denominations, including the Native American Church, the Assemblies of God, and the Church of Jesus Christ of Latter-day Saints.
Conclusion
Pine Ridge is a small unincorporated community located in the southwestern corner of South Dakota, in the United States. It is situated in the Oglala Lakota County, and is the largest community in the county. The population of Pine Ridge was estimated to be 8,530 in 2019. The economy of Pine Ridge is largely based on agriculture and tourism, and the population is predominantly Native American, with the Oglala Lakota people making up the majority of the population. The median age of the population is 28.7 years, and the median household income is $20,945.
Common Questions
What is Per Capita Income in Pine Ridge?
Per Capita income in Pine Ridge is $10,806.
What is the Median Family Income in Pine Ridge?
Median Family Income in Pine Ridge is $47,981.
What is the Median Household income in Pine Ridge?
Median Household Income in Pine Ridge is $47,620.
What is Income or Wage Gap in Pine Ridge?
Income or Wage Gap in Pine Ridge is 15.6%.
Women in Pine Ridge earn 84.4 cents for every dollar earned by a man.
What is Inequality or Gini Index in Pine Ridge?
Inequality or Gini Index in Pine Ridge is 0.38.
What is the Total Population of Pine Ridge?
Total Population of Pine Ridge is 2,921.
What is the Total Male Population of Pine Ridge?
Total Male Population of Pine Ridge is 1,454.
What is the Total Female Population of Pine Ridge?
Total Female Population of Pine Ridge is 1,467.
What is the Ratio of Males per 100 Females in Pine Ridge?
There are 99.11 Males per 100 Females in Pine Ridge.
What is the Ratio of Females per 100 Males in Pine Ridge?
There are 100.89 Females per 100 Males in Pine Ridge.
What is the Median Population Age in Pine Ridge?
Median Population Age in Pine Ridge is 25.1 Years.
What is the Average Family Size in Pine Ridge
Average Family Size in Pine Ridge is 6.0 People.
What is the Average Household Size in Pine Ridge
Average Household Size in Pine Ridge is 5.8 People.
How Large is the Labor Force in Pine Ridge?
There are 839 People in the Labor Forcein in Pine Ridge.
What is the Percentage of People in the Labor Force in Pine Ridge?
44.5% of People are in the Labor Force in Pine Ridge.
What is the Unemployment Rate in Pine Ridge?
Unemployment Rate in Pine Ridge is 7.9%.