Tolleson, AZ Map & Demographics
Tolleson Map
Tolleson Overview
$20,563
PER CAPITA INCOME
$48,100
AVG FAMILY INCOME
$47,875
AVG HOUSEHOLD INCOME
55.5%
WAGE / INCOME GAP [ % ]
44.5¢/ $1
WAGE / INCOME GAP [ $ ]
0.40
INEQUALITY / GINI INDEX
7,221
TOTAL POPULATION
3,482
MALE POPULATION
3,739
FEMALE POPULATION
93.13
MALES / 100 FEMALES
107.38
FEMALES / 100 MALES
33.3
MEDIAN AGE
3.2
AVG FAMILY SIZE
2.8
AVG HOUSEHOLD SIZE
2,875
LABOR FORCE [ PEOPLE ]
50.1%
PERCENT IN LABOR FORCE
2.4%
UNEMPLOYMENT RATE
Tolleson Zip Codes
Tolleson Area Codes
Income in Tolleson
Income Overview in Tolleson
Per Capita Income in Tolleson is $20,563, while median incomes of families and households are $48,100 and $47,875 respectively.
| Characteristic | Number | Measure |
| Per Capita Income | 7,221 | $20,563 |
| Median Family Income | 1,792 | $48,100 |
| Mean Family Income | 1,792 | $53,408 |
| Median Household Income | 2,569 | $47,875 |
| Mean Household Income | 2,569 | $56,542 |
| Income Deficit | 1,792 | $0 |
| Wage / Income Gap (%) | 7,221 | 55.47% |
| Wage / Income Gap ($) | 7,221 | 44.53¢ per $1 |
| Gini / Inequality Index | 7,221 | 0.40 |
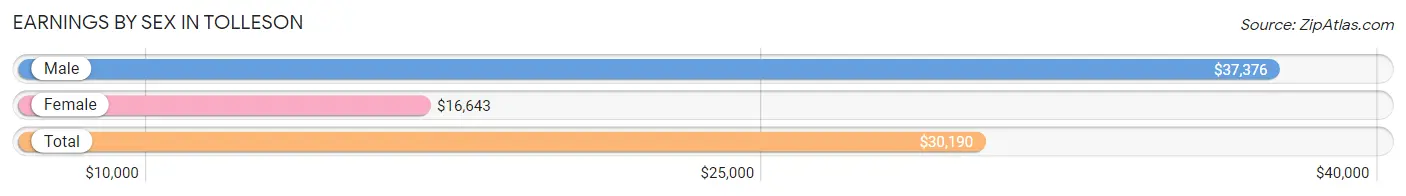
Earnings by Sex in Tolleson
Average Earnings in Tolleson are $30,190, $37,376 for men and $16,643 for women, a difference of 55.5%.
| Sex | Number | Average Earnings |
| Male | 1,533 (48.4%) | $37,376 |
| Female | 1,631 (51.5%) | $16,643 |
| Total | 3,164 (100.0%) | $30,190 |
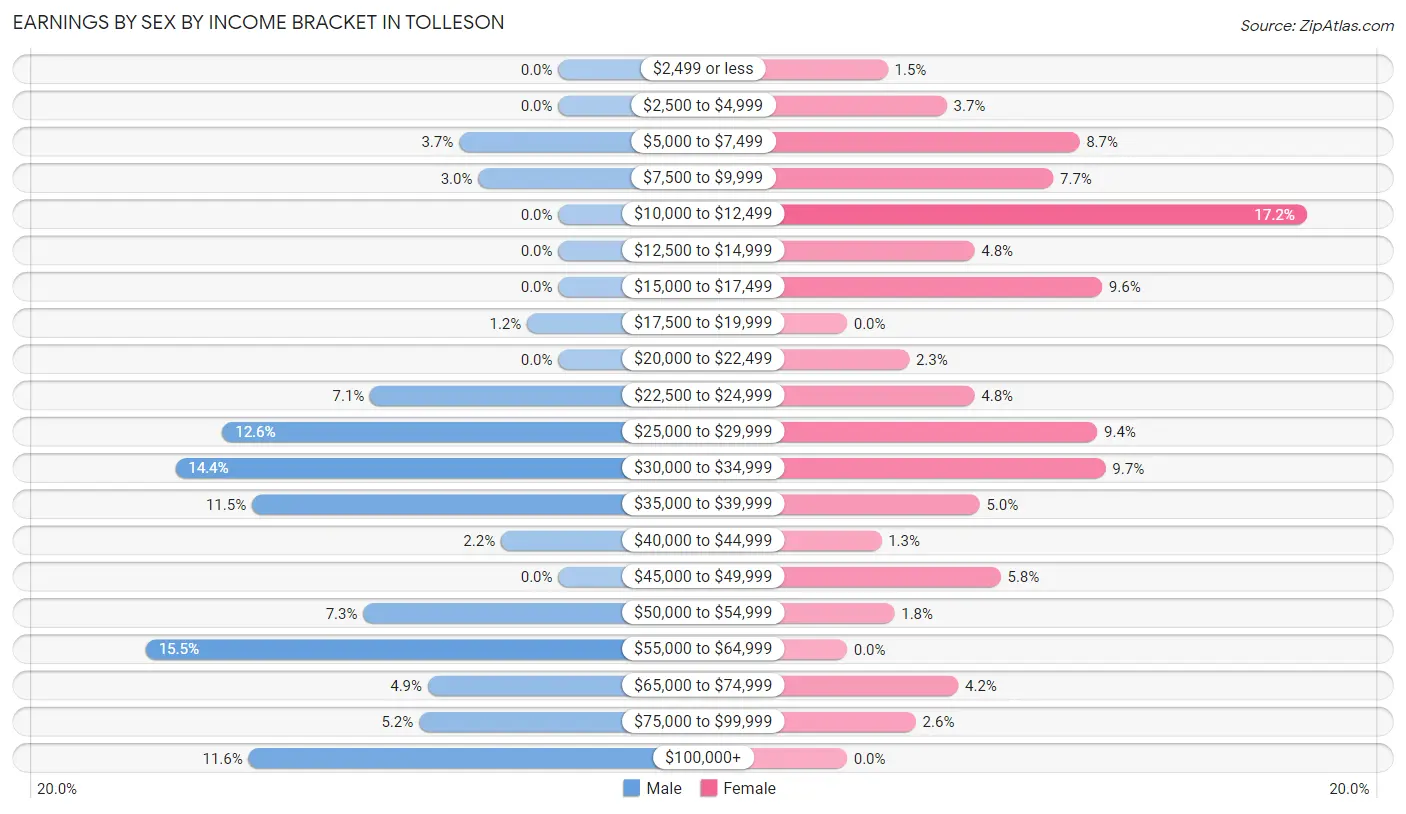
Earnings by Sex by Income Bracket in Tolleson
The most common earnings brackets in Tolleson are $55,000 to $64,999 for men (237 | 15.5%) and $10,000 to $12,499 for women (281 | 17.2%).
| Income | Male | Female |
| $2,499 or less | 0 (0.0%) | 25 (1.5%) |
| $2,500 to $4,999 | 0 (0.0%) | 61 (3.7%) |
| $5,000 to $7,499 | 57 (3.7%) | 142 (8.7%) |
| $7,500 to $9,999 | 46 (3.0%) | 126 (7.7%) |
| $10,000 to $12,499 | 0 (0.0%) | 281 (17.2%) |
| $12,500 to $14,999 | 0 (0.0%) | 78 (4.8%) |
| $15,000 to $17,499 | 0 (0.0%) | 156 (9.6%) |
| $17,500 to $19,999 | 18 (1.2%) | 0 (0.0%) |
| $20,000 to $22,499 | 0 (0.0%) | 38 (2.3%) |
| $22,500 to $24,999 | 108 (7.0%) | 78 (4.8%) |
| $25,000 to $29,999 | 193 (12.6%) | 153 (9.4%) |
| $30,000 to $34,999 | 220 (14.3%) | 158 (9.7%) |
| $35,000 to $39,999 | 176 (11.5%) | 81 (5.0%) |
| $40,000 to $44,999 | 33 (2.1%) | 21 (1.3%) |
| $45,000 to $49,999 | 0 (0.0%) | 94 (5.8%) |
| $50,000 to $54,999 | 112 (7.3%) | 29 (1.8%) |
| $55,000 to $64,999 | 237 (15.5%) | 0 (0.0%) |
| $65,000 to $74,999 | 75 (4.9%) | 68 (4.2%) |
| $75,000 to $99,999 | 80 (5.2%) | 42 (2.6%) |
| $100,000+ | 178 (11.6%) | 0 (0.0%) |
| Total | 1,533 (100.0%) | 1,631 (100.0%) |
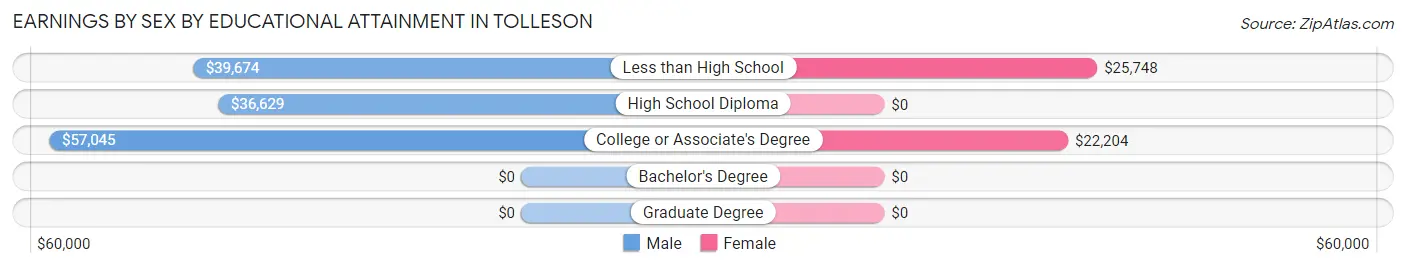
Earnings by Sex by Educational Attainment in Tolleson
Average earnings in Tolleson are $52,307 for men and $24,551 for women, a difference of 53.1%. Men with an educational attainment of college or associate's degree enjoy the highest average annual earnings of $57,045, while those with high school diploma education earn the least with $36,629. Women with an educational attainment of less than high school earn the most with the average annual earnings of $25,748, while those with college or associate's degree education have the smallest earnings of $22,204.
| Educational Attainment | Male Income | Female Income |
| Less than High School | $39,674 | $25,748 |
| High School Diploma | $36,629 | $0 |
| College or Associate's Degree | $57,045 | $22,204 |
| Bachelor's Degree | - | - |
| Graduate Degree | - | - |
| Total | $52,307 | $24,551 |
Family Income in Tolleson
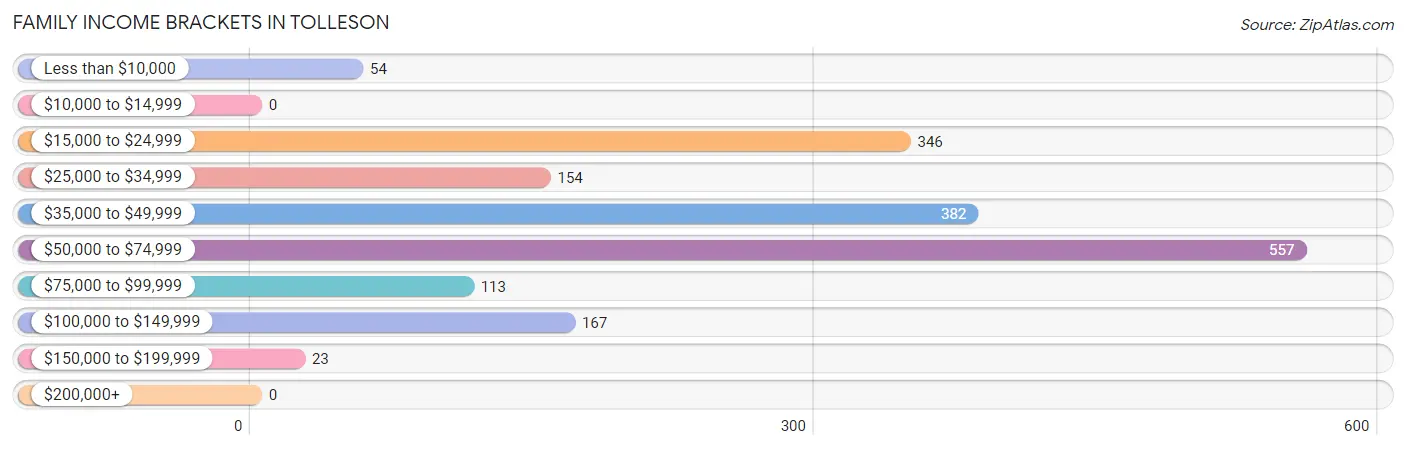
Family Income Brackets in Tolleson
According to the Tolleson family income data, there are 557 families falling into the $50,000 to $74,999 income range, which is the most common income bracket and makes up 31.1% of all families.
| Income Bracket | # Families | % Families |
| Less than $10,000 | 54 | 3.0% |
| $10,000 to $14,999 | 0 | 0.0% |
| $15,000 to $24,999 | 346 | 19.3% |
| $25,000 to $34,999 | 154 | 8.6% |
| $35,000 to $49,999 | 382 | 21.3% |
| $50,000 to $74,999 | 557 | 31.1% |
| $75,000 to $99,999 | 113 | 6.3% |
| $100,000 to $149,999 | 167 | 9.3% |
| $150,000 to $199,999 | 23 | 1.3% |
| $200,000+ | 0 | 0.0% |
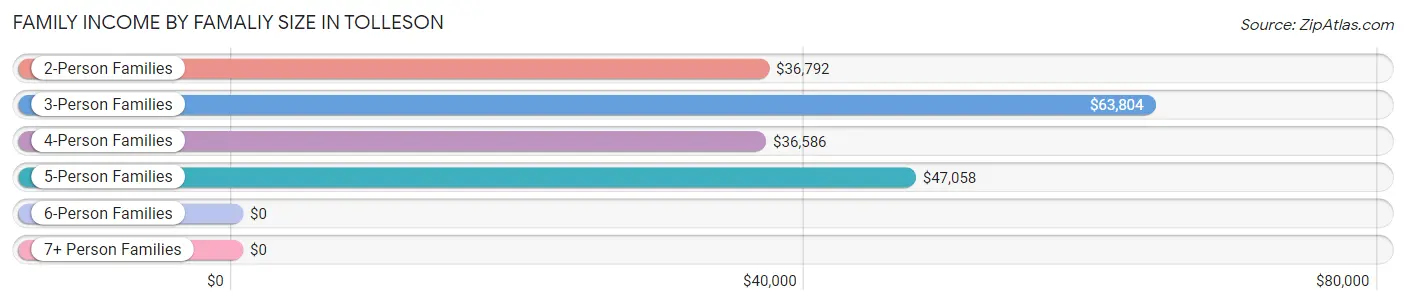
Family Income by Famaliy Size in Tolleson
3-person families (418 | 23.3%) account for the highest median family income in Tolleson with $63,804 per family, while 3-person families (418 | 23.3%) have the highest median income of $21,268 per family member.
| Income Bracket | # Families | Median Income |
| 2-Person Families | 744 (41.5%) | $36,792 |
| 3-Person Families | 418 (23.3%) | $63,804 |
| 4-Person Families | 411 (22.9%) | $36,586 |
| 5-Person Families | 163 (9.1%) | $47,058 |
| 6-Person Families | 0 (0.0%) | $0 |
| 7+ Person Families | 56 (3.1%) | $0 |
| Total | 1,792 (100.0%) | $48,100 |
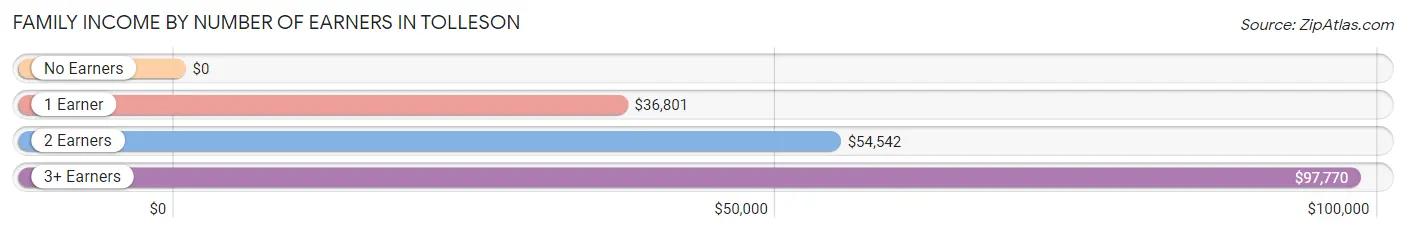
Family Income by Number of Earners in Tolleson
| Number of Earners | # Families | Median Income |
| No Earners | 386 (21.5%) | $0 |
| 1 Earner | 721 (40.2%) | $36,801 |
| 2 Earners | 561 (31.3%) | $54,542 |
| 3+ Earners | 124 (6.9%) | $97,770 |
| Total | 1,792 (100.0%) | $48,100 |
Household Income in Tolleson
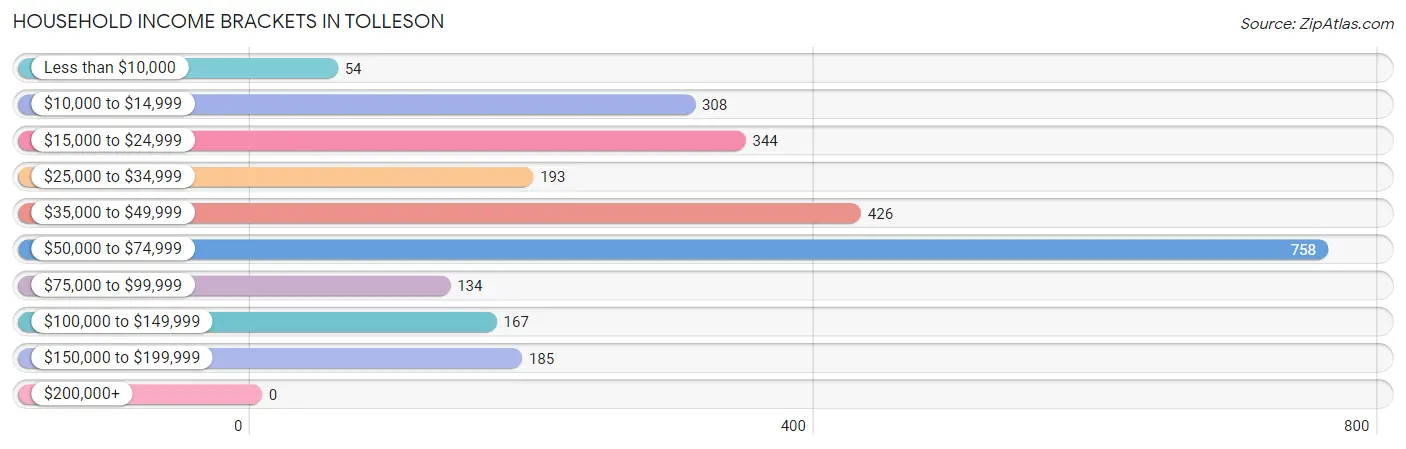
Household Income Brackets in Tolleson
With 758 households falling in the category, the $50,000 to $74,999 income range is the most frequent in Tolleson, accounting for 29.5% of all households.
| Income Bracket | # Households | % Households |
| Less than $10,000 | 54 | 2.1% |
| $10,000 to $14,999 | 308 | 12.0% |
| $15,000 to $24,999 | 344 | 13.4% |
| $25,000 to $34,999 | 193 | 7.5% |
| $35,000 to $49,999 | 426 | 16.6% |
| $50,000 to $74,999 | 758 | 29.5% |
| $75,000 to $99,999 | 134 | 5.2% |
| $100,000 to $149,999 | 167 | 6.5% |
| $150,000 to $199,999 | 185 | 7.2% |
| $200,000+ | 0 | 0.0% |
Household Income by Householder Age in Tolleson
The median household income in Tolleson is $47,875, with the highest median household income of $51,582 found in the 25 to 44 years age bracket for the primary householder. A total of 969 households (37.7%) fall into this category. Meanwhile, the 15 to 24 years age bracket for the primary householder has the lowest median household income of $0, with 213 households (8.3%) in this group.
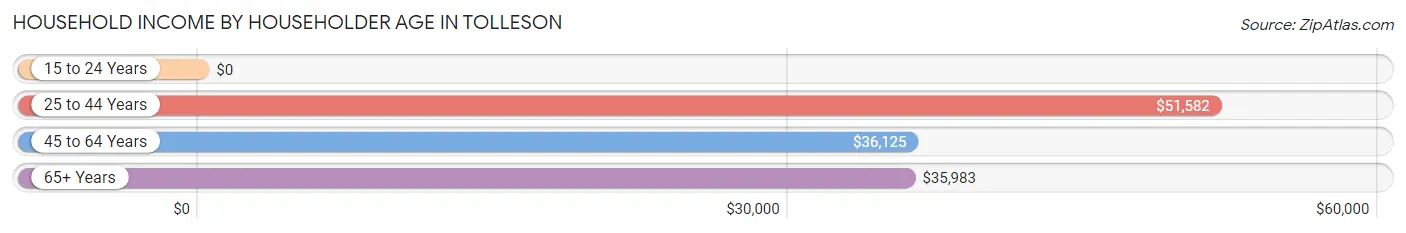
| Income Bracket | # Households | Median Income |
| 15 to 24 Years | 213 (8.3%) | $0 |
| 25 to 44 Years | 969 (37.7%) | $51,582 |
| 45 to 64 Years | 598 (23.3%) | $36,125 |
| 65+ Years | 789 (30.7%) | $35,983 |
| Total | 2,569 (100.0%) | $47,875 |
Poverty in Tolleson
Income Below Poverty by Sex and Age in Tolleson
With 16.5% poverty level for males and 27.1% for females among the residents of Tolleson, 75 year old and over males and 16 and 17 year old females are the most vulnerable to poverty, with 197 males (55.3%) and 61 females (64.9%) in their respective age groups living below the poverty level.
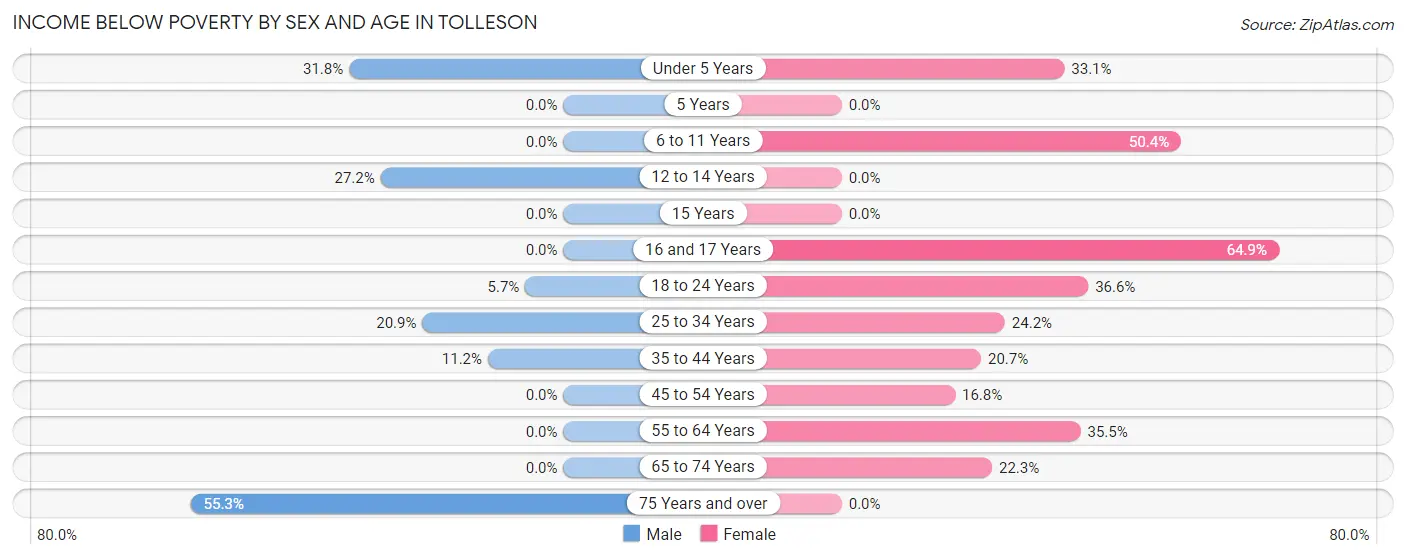
| Age Bracket | Male | Female |
| Under 5 Years | 119 (31.8%) | 39 (33.1%) |
| 5 Years | 0 (0.0%) | 0 (0.0%) |
| 6 to 11 Years | 0 (0.0%) | 204 (50.4%) |
| 12 to 14 Years | 82 (27.2%) | 0 (0.0%) |
| 15 Years | 0 (0.0%) | 0 (0.0%) |
| 16 and 17 Years | 0 (0.0%) | 61 (64.9%) |
| 18 to 24 Years | 27 (5.7%) | 161 (36.6%) |
| 25 to 34 Years | 89 (20.9%) | 125 (24.2%) |
| 35 to 44 Years | 61 (11.2%) | 104 (20.7%) |
| 45 to 54 Years | 0 (0.0%) | 75 (16.8%) |
| 55 to 64 Years | 0 (0.0%) | 95 (35.4%) |
| 65 to 74 Years | 0 (0.0%) | 143 (22.3%) |
| 75 Years and over | 197 (55.3%) | 0 (0.0%) |
| Total | 575 (16.5%) | 1,007 (27.1%) |
Income Above Poverty by Sex and Age in Tolleson
According to the poverty statistics in Tolleson, males aged 5 years and females aged 5 years are the age groups that are most secure financially, with 100.0% of males and 100.0% of females in these age groups living above the poverty line.
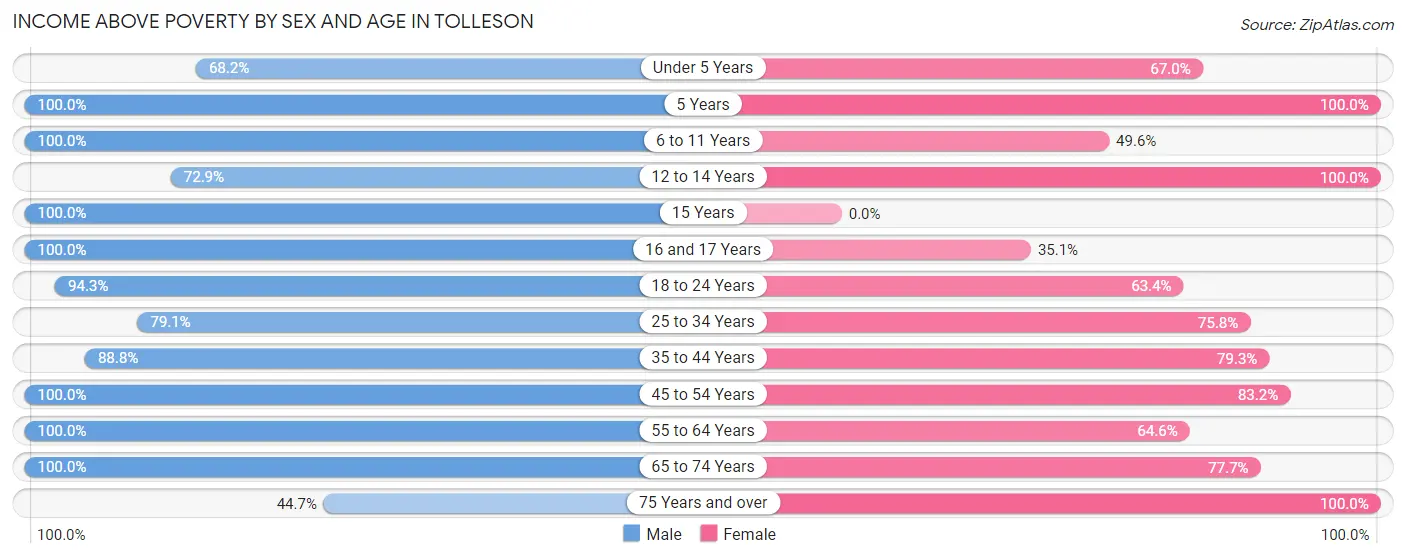
| Age Bracket | Male | Female |
| Under 5 Years | 255 (68.2%) | 79 (66.9%) |
| 5 Years | 38 (100.0%) | 16 (100.0%) |
| 6 to 11 Years | 50 (100.0%) | 201 (49.6%) |
| 12 to 14 Years | 220 (72.9%) | 131 (100.0%) |
| 15 Years | 30 (100.0%) | 0 (0.0%) |
| 16 and 17 Years | 258 (100.0%) | 33 (35.1%) |
| 18 to 24 Years | 449 (94.3%) | 279 (63.4%) |
| 25 to 34 Years | 336 (79.1%) | 391 (75.8%) |
| 35 to 44 Years | 483 (88.8%) | 399 (79.3%) |
| 45 to 54 Years | 145 (100.0%) | 371 (83.2%) |
| 55 to 64 Years | 30 (100.0%) | 173 (64.5%) |
| 65 to 74 Years | 454 (100.0%) | 498 (77.7%) |
| 75 Years and over | 159 (44.7%) | 143 (100.0%) |
| Total | 2,907 (83.5%) | 2,714 (72.9%) |
Income Below Poverty Among Married-Couple Families in Tolleson
The poverty statistics for married-couple families in Tolleson show that 11.8% or 138 of the total 1,166 families live below the poverty line. Families with 1 or 2 children have the highest poverty rate of 18.8%, comprising of 77 families. On the other hand, families with 3 or 4 children have the lowest poverty rate of 0.0%, which includes 0 families.
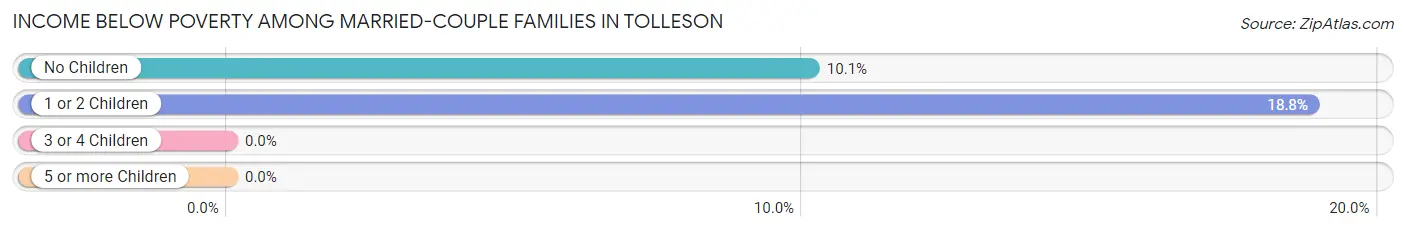
| Children | Above Poverty | Below Poverty |
| No Children | 541 (89.9%) | 61 (10.1%) |
| 1 or 2 Children | 332 (81.2%) | 77 (18.8%) |
| 3 or 4 Children | 136 (100.0%) | 0 (0.0%) |
| 5 or more Children | 19 (100.0%) | 0 (0.0%) |
| Total | 1,028 (88.2%) | 138 (11.8%) |
Income Below Poverty Among Single-Parent Households in Tolleson
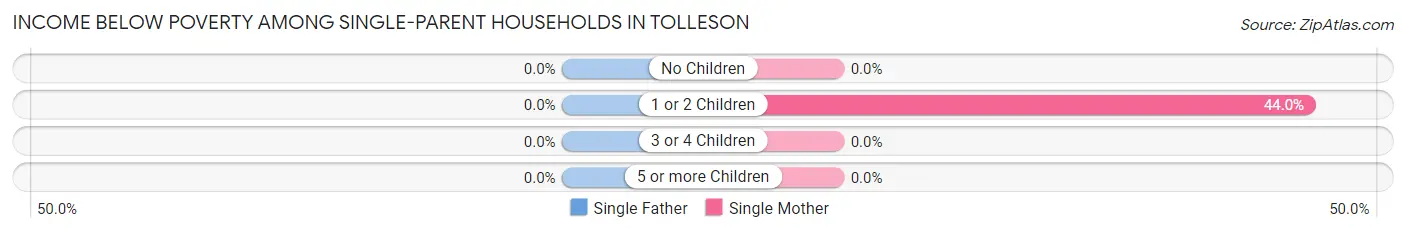
| Children | Single Father | Single Mother |
| No Children | 0 (0.0%) | 0 (0.0%) |
| 1 or 2 Children | 0 (0.0%) | 201 (44.0%) |
| 3 or 4 Children | 0 (0.0%) | 0 (0.0%) |
| 5 or more Children | 0 (0.0%) | 0 (0.0%) |
| Total | 0 (0.0%) | 201 (36.5%) |
Income Below Poverty Among Married-Couple vs Single-Parent Households in Tolleson
The poverty data for Tolleson shows that 138 of the married-couple family households (11.8%) and 201 of the single-parent households (32.1%) are living below the poverty level. Within the married-couple family households, those with 1 or 2 children have the highest poverty rate, with 77 households (18.8%) falling below the poverty line. Among the single-parent households, those with 1 or 2 children have the highest poverty rate, with 201 household (39.6%) living below poverty.
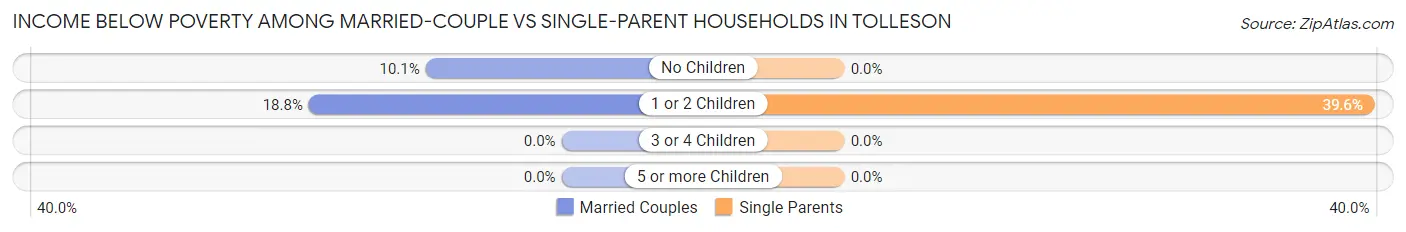
| Children | Married-Couple Families | Single-Parent Households |
| No Children | 61 (10.1%) | 0 (0.0%) |
| 1 or 2 Children | 77 (18.8%) | 201 (39.6%) |
| 3 or 4 Children | 0 (0.0%) | 0 (0.0%) |
| 5 or more Children | 0 (0.0%) | 0 (0.0%) |
| Total | 138 (11.8%) | 201 (32.1%) |
Race in Tolleson
The most populous races in Tolleson are Hispanic or Latino (5,857 | 81.1%), White / Caucasian (3,297 | 45.7%), and Two or more Races (1,927 | 26.7%).
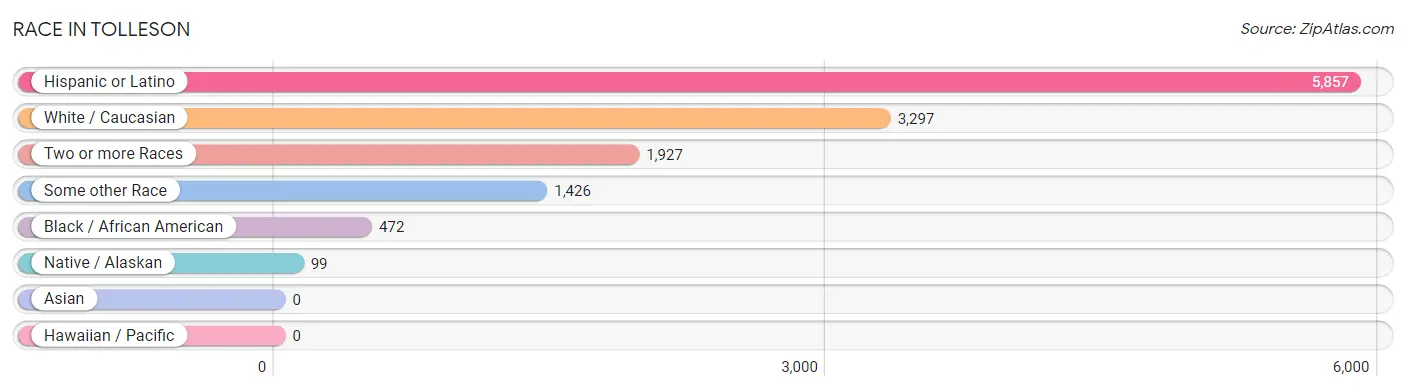
| Race | # Population | % Population |
| Asian | 0 | 0.0% |
| Black / African American | 472 | 6.5% |
| Hawaiian / Pacific | 0 | 0.0% |
| Hispanic or Latino | 5,857 | 81.1% |
| Native / Alaskan | 99 | 1.4% |
| White / Caucasian | 3,297 | 45.7% |
| Two or more Races | 1,927 | 26.7% |
| Some other Race | 1,426 | 19.8% |
| Total | 7,221 | 100.0% |
Ancestry in Tolleson
The most populous ancestries reported in Tolleson are Mexican (5,754 | 79.7%), Italian (594 | 8.2%), Chickasaw (161 | 2.2%), Subsaharan African (150 | 2.1%), and English (136 | 1.9%), together accounting for 94.1% of all Tolleson residents.
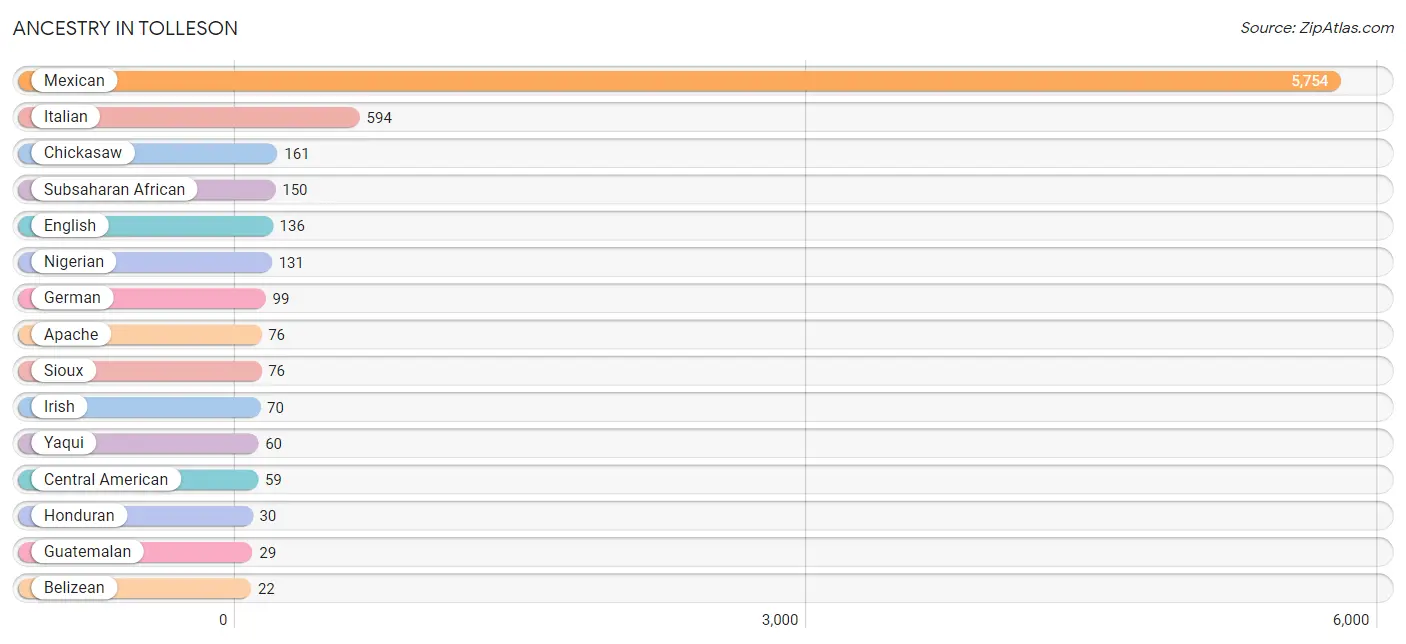
| Ancestry | # Population | % Population |
| African | 19 | 0.3% |
| American | 19 | 0.3% |
| Apache | 76 | 1.1% |
| Austrian | 19 | 0.3% |
| Belizean | 22 | 0.3% |
| Central American | 59 | 0.8% |
| Chickasaw | 161 | 2.2% |
| English | 136 | 1.9% |
| German | 99 | 1.4% |
| Guatemalan | 29 | 0.4% |
| Honduran | 30 | 0.4% |
| Irish | 70 | 1.0% |
| Italian | 594 | 8.2% |
| Mexican | 5,754 | 79.7% |
| Nigerian | 131 | 1.8% |
| Portuguese | 18 | 0.3% |
| Sioux | 76 | 1.1% |
| Spaniard | 18 | 0.3% |
| Subsaharan African | 150 | 2.1% |
| Tohono O'Odham | 21 | 0.3% |
| Yaqui | 60 | 0.8% | View All 21 Rows |
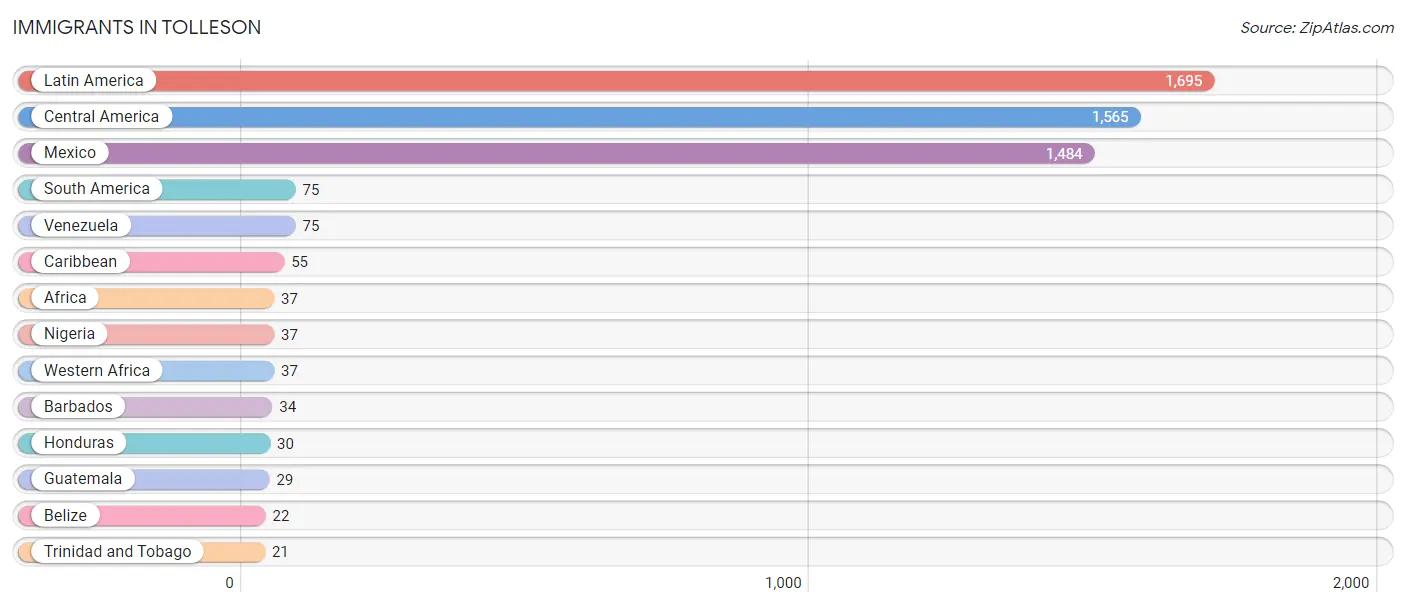
Immigrants in Tolleson
The most numerous immigrant groups reported in Tolleson came from Latin America (1,695 | 23.5%), Central America (1,565 | 21.7%), Mexico (1,484 | 20.5%), South America (75 | 1.0%), and Venezuela (75 | 1.0%), together accounting for 67.8% of all Tolleson residents.
| Immigration Origin | # Population | % Population |
| Africa | 37 | 0.5% |
| Barbados | 34 | 0.5% |
| Belize | 22 | 0.3% |
| Caribbean | 55 | 0.8% |
| Central America | 1,565 | 21.7% |
| Guatemala | 29 | 0.4% |
| Honduras | 30 | 0.4% |
| Latin America | 1,695 | 23.5% |
| Mexico | 1,484 | 20.5% |
| Nigeria | 37 | 0.5% |
| South America | 75 | 1.0% |
| Trinidad and Tobago | 21 | 0.3% |
| Venezuela | 75 | 1.0% |
| Western Africa | 37 | 0.5% | View All 14 Rows |
Sex and Age in Tolleson
Sex and Age in Tolleson
The most populous age groups in Tolleson are 15 to 19 Years (443 | 12.7%) for men and 70 to 74 Years (442 | 11.8%) for women.
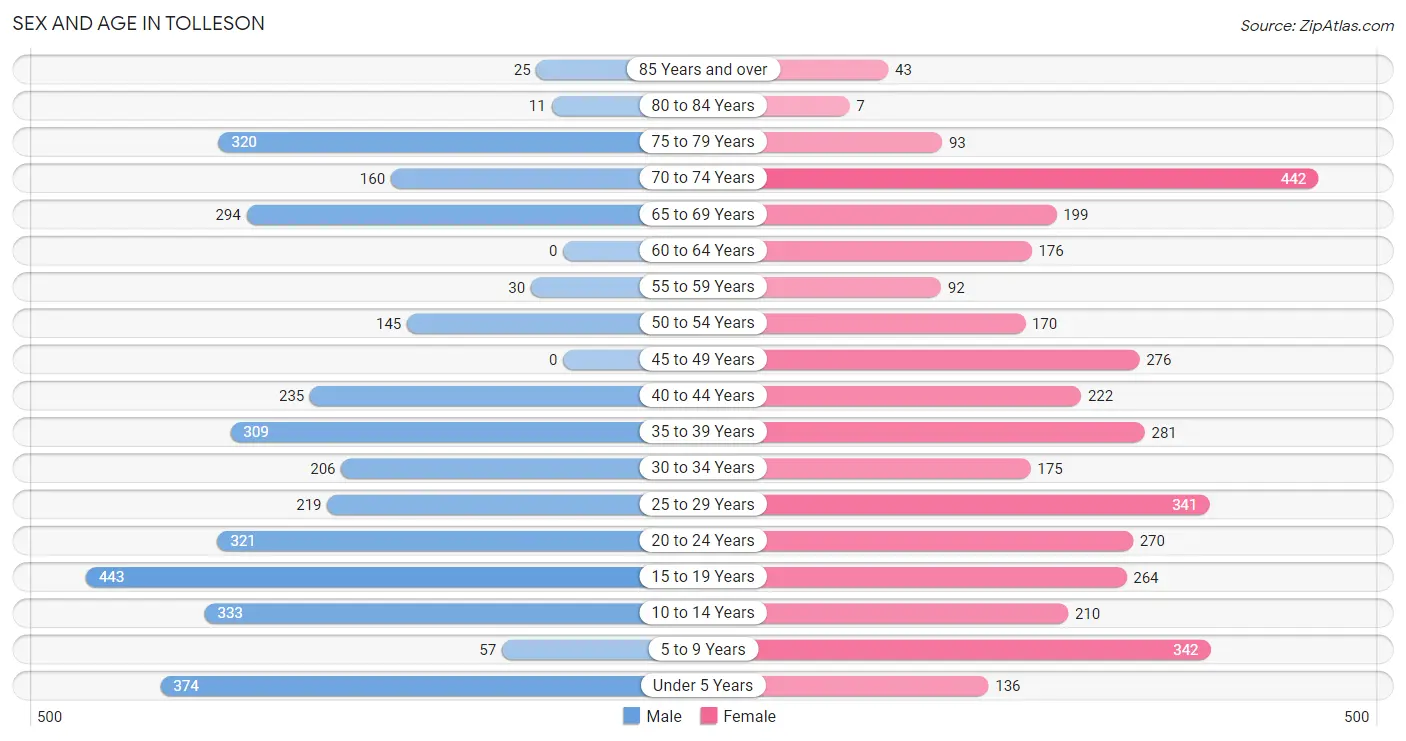
| Age Bracket | Male | Female |
| Under 5 Years | 374 (10.7%) | 136 (3.6%) |
| 5 to 9 Years | 57 (1.6%) | 342 (9.1%) |
| 10 to 14 Years | 333 (9.6%) | 210 (5.6%) |
| 15 to 19 Years | 443 (12.7%) | 264 (7.1%) |
| 20 to 24 Years | 321 (9.2%) | 270 (7.2%) |
| 25 to 29 Years | 219 (6.3%) | 341 (9.1%) |
| 30 to 34 Years | 206 (5.9%) | 175 (4.7%) |
| 35 to 39 Years | 309 (8.9%) | 281 (7.5%) |
| 40 to 44 Years | 235 (6.8%) | 222 (5.9%) |
| 45 to 49 Years | 0 (0.0%) | 276 (7.4%) |
| 50 to 54 Years | 145 (4.2%) | 170 (4.5%) |
| 55 to 59 Years | 30 (0.9%) | 92 (2.5%) |
| 60 to 64 Years | 0 (0.0%) | 176 (4.7%) |
| 65 to 69 Years | 294 (8.4%) | 199 (5.3%) |
| 70 to 74 Years | 160 (4.6%) | 442 (11.8%) |
| 75 to 79 Years | 320 (9.2%) | 93 (2.5%) |
| 80 to 84 Years | 11 (0.3%) | 7 (0.2%) |
| 85 Years and over | 25 (0.7%) | 43 (1.1%) |
| Total | 3,482 (100.0%) | 3,739 (100.0%) |
Families and Households in Tolleson
Median Family Size in Tolleson
The median family size in Tolleson is 3.21 persons per family, with married-couple families (1,166 | 65.1%) accounting for the largest median family size of 3.4 persons per family. On the other hand, single male/father families (76 | 4.2%) represent the smallest median family size with 1.97 persons per family.
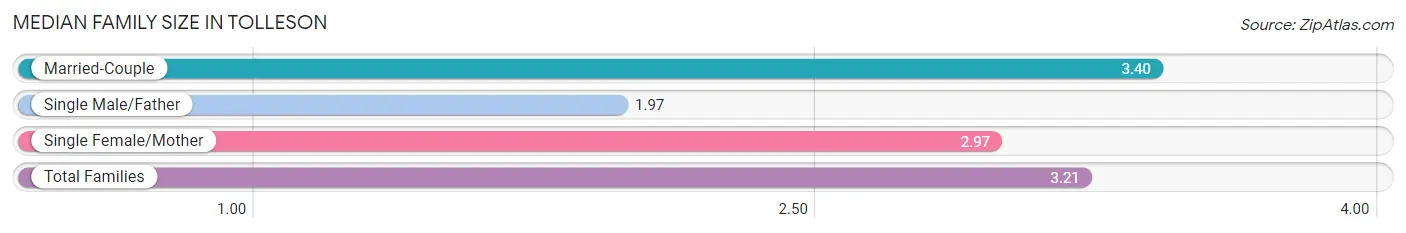
| Family Type | # Families | Family Size |
| Married-Couple | 1,166 (65.1%) | 3.40 |
| Single Male/Father | 76 (4.2%) | 1.97 |
| Single Female/Mother | 550 (30.7%) | 2.97 |
| Total Families | 1,792 (100.0%) | 3.21 |
Median Household Size in Tolleson
The median household size in Tolleson is 2.81 persons per household, with married-couple households (1,166 | 45.4%) accounting for the largest median household size of 3.41 persons per household. non-family households (777 | 30.2%) represent the smallest median household size with 1.82 persons per household.
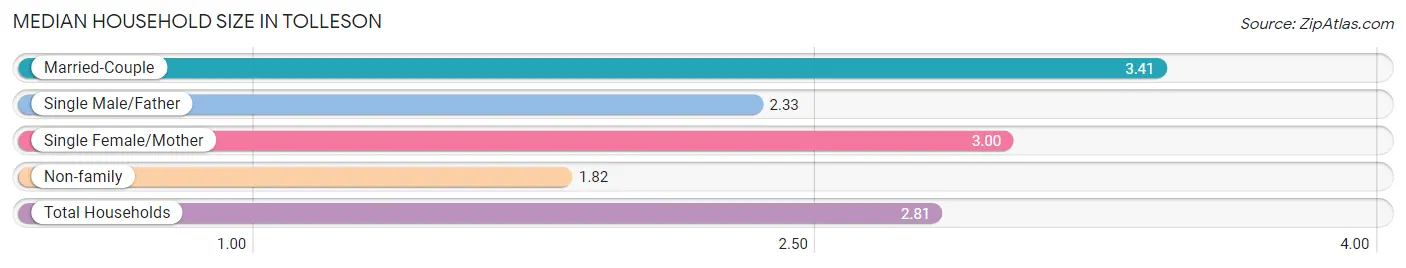
| Household Type | # Households | Household Size |
| Married-Couple | 1,166 (45.4%) | 3.41 |
| Single Male/Father | 76 (3.0%) | 2.33 |
| Single Female/Mother | 550 (21.4%) | 3.00 |
| Non-family | 777 (30.2%) | 1.82 |
| Total Households | 2,569 (100.0%) | 2.81 |
Household Size by Marriage Status in Tolleson
Out of a total of 2,569 households in Tolleson, 1,792 (69.8%) are family households, while 777 (30.2%) are nonfamily households. The most numerous type of family households are 2-person households, comprising 708, and the most common type of nonfamily households are 1-person households, comprising 322.
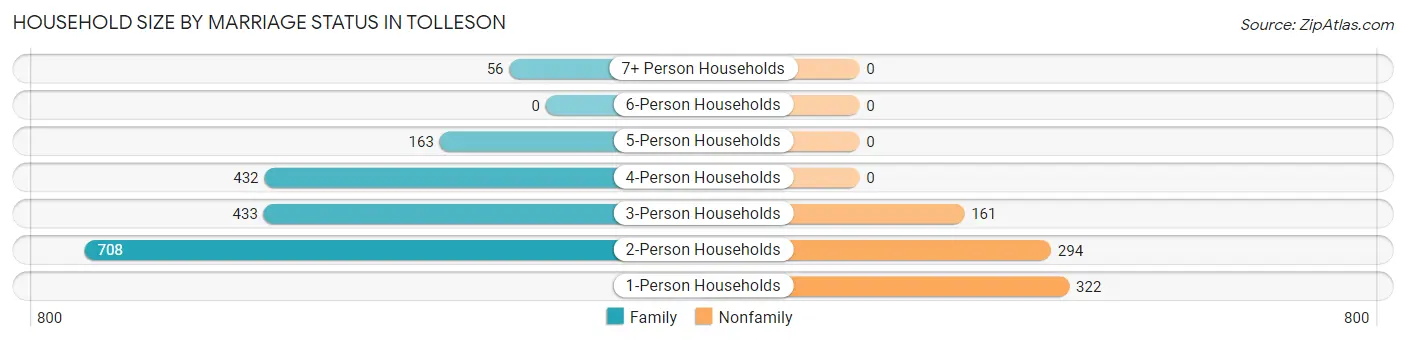
| Household Size | Family Households | Nonfamily Households |
| 1-Person Households | - | 322 (12.5%) |
| 2-Person Households | 708 (27.6%) | 294 (11.4%) |
| 3-Person Households | 433 (16.9%) | 161 (6.3%) |
| 4-Person Households | 432 (16.8%) | 0 (0.0%) |
| 5-Person Households | 163 (6.3%) | 0 (0.0%) |
| 6-Person Households | 0 (0.0%) | 0 (0.0%) |
| 7+ Person Households | 56 (2.2%) | 0 (0.0%) |
| Total | 1,792 (69.8%) | 777 (30.2%) |
Female Fertility in Tolleson
Fertility by Age in Tolleson
| Age Bracket | Women with Births | Births / 1,000 Women |
| 15 to 19 years | 0 (0.0%) | 0.0 |
| 20 to 34 years | 0 (0.0%) | 0.0 |
| 35 to 50 years | 0 (0.0%) | 0.0 |
| Total | 0 (0.0%) | 0.0 |
Fertility by Age by Marriage Status in Tolleson
| Age Bracket | Married | Unmarried |
| 15 to 19 years | 0 (0.0%) | 0 (0.0%) |
| 20 to 34 years | 0 (0.0%) | 0 (0.0%) |
| 35 to 50 years | 0 (0.0%) | 0 (0.0%) |
| Total | 0 (0.0%) | 0 (0.0%) |
Fertility by Education in Tolleson
| Educational Attainment | Women with Births | Births / 1,000 Women |
| Less than High School | 0 (0.0%) | 0.0 |
| High School Diploma | 0 (0.0%) | 0.0 |
| College or Associate's Degree | 0 (0.0%) | 0.0 |
| Bachelor's Degree | 0 (0.0%) | 0.0 |
| Graduate Degree | 0 (0.0%) | 0.0 |
| Total | 0 (0.0%) | 0.0 |
Fertility by Education by Marriage Status in Tolleson
| Educational Attainment | Married | Unmarried |
| Less than High School | 0 (0.0%) | 0 (0.0%) |
| High School Diploma | 0 (0.0%) | 0 (0.0%) |
| College or Associate's Degree | 0 (0.0%) | 0 (0.0%) |
| Bachelor's Degree | 0 (0.0%) | 0 (0.0%) |
| Graduate Degree | 0 (0.0%) | 0 (0.0%) |
| Total | 0 (0.0%) | 0 (0.0%) |
Employment Characteristics in Tolleson
Employment by Class of Employer in Tolleson
Among the 2,804 employed individuals in Tolleson, private company employees (2,318 | 82.7%), local government employees (140 | 5.0%), and not-for-profit organizations (136 | 4.9%) make up the most common classes of employment.
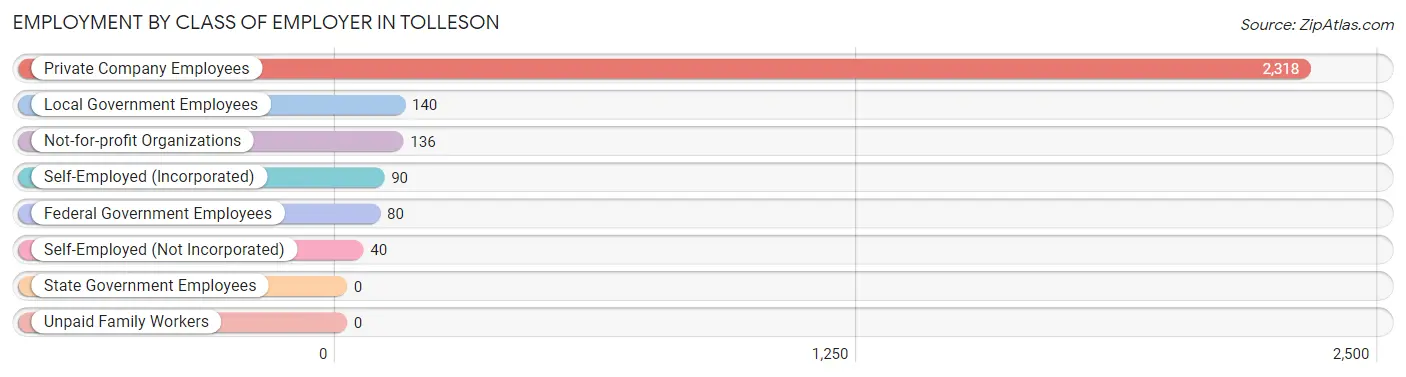
| Employer Class | # Employees | % Employees |
| Private Company Employees | 2,318 | 82.7% |
| Self-Employed (Incorporated) | 90 | 3.2% |
| Self-Employed (Not Incorporated) | 40 | 1.4% |
| Not-for-profit Organizations | 136 | 4.9% |
| Local Government Employees | 140 | 5.0% |
| State Government Employees | 0 | 0.0% |
| Federal Government Employees | 80 | 2.9% |
| Unpaid Family Workers | 0 | 0.0% |
| Total | 2,804 | 100.0% |
Employment Status by Age in Tolleson
According to the labor force statistics for Tolleson, out of the total population over 16 years of age (5,739), 50.1% or 2,875 individuals are in the labor force, with 2.4% or 69 of them unemployed. The age group with the highest labor force participation rate is 20 to 24 years, with 97.1% or 574 individuals in the labor force. Within the labor force, the 35 to 44 years age range has the highest percentage of unemployed individuals, with 8.1% or 70 of them being unemployed.
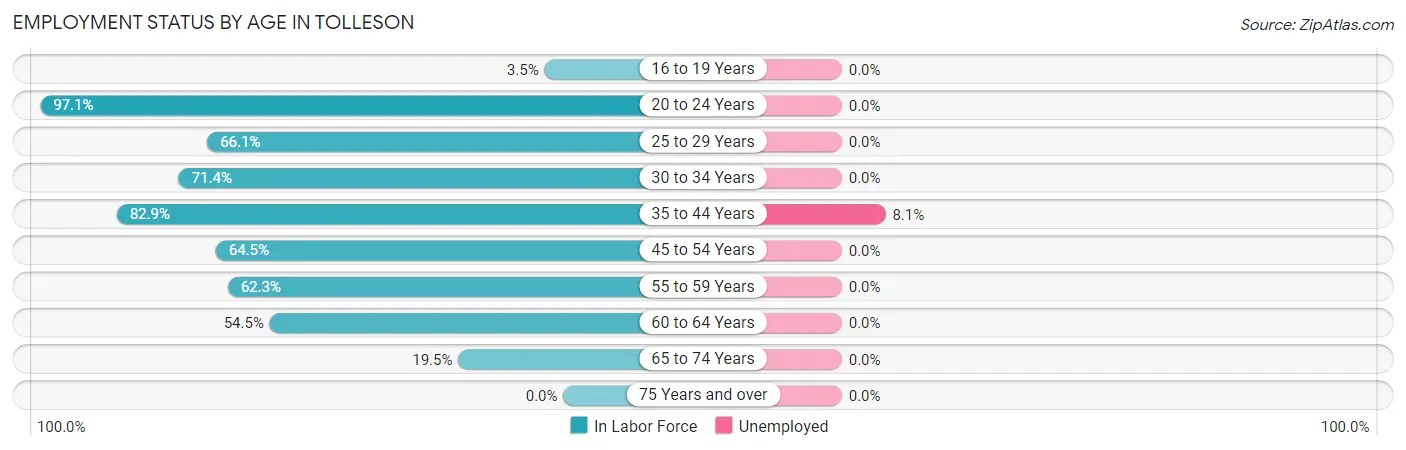
| Age Bracket | In Labor Force | Unemployed |
| 16 to 19 Years | 24 (3.5%) | 0 (0.0%) |
| 20 to 24 Years | 574 (97.1%) | 0 (0.0%) |
| 25 to 29 Years | 370 (66.1%) | 0 (0.0%) |
| 30 to 34 Years | 272 (71.4%) | 0 (0.0%) |
| 35 to 44 Years | 868 (82.9%) | 70 (8.1%) |
| 45 to 54 Years | 381 (64.5%) | 0 (0.0%) |
| 55 to 59 Years | 76 (62.3%) | 0 (0.0%) |
| 60 to 64 Years | 96 (54.5%) | 0 (0.0%) |
| 65 to 74 Years | 214 (19.5%) | 0 (0.0%) |
| 75 Years and over | 0 (0.0%) | 0 (0.0%) |
| Total | 2,875 (50.1%) | 69 (2.4%) |
Employment Status by Educational Attainment in Tolleson
According to labor force statistics for Tolleson, 71.7% of individuals (2,063) out of the total population between 25 and 64 years of age (2,877) are in the labor force, with 3.4% or 70 of them being unemployed. The group with the highest labor force participation rate are those with the educational attainment of college / associate degree, with 82.3% or 969 individuals in the labor force. Within the labor force, individuals with college / associate degree education have the highest percentage of unemployment, with 7.2% or 70 of them being unemployed.
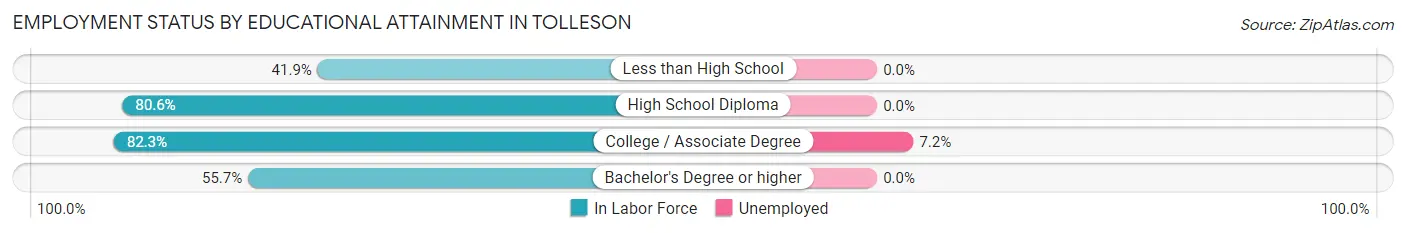
| Educational Attainment | In Labor Force | Unemployed |
| Less than High School | 237 (41.9%) | 0 (0.0%) |
| High School Diploma | 730 (80.6%) | 0 (0.0%) |
| College / Associate Degree | 969 (82.3%) | 85 (7.2%) |
| Bachelor's Degree or higher | 127 (55.7%) | 0 (0.0%) |
| Total | 2,063 (71.7%) | 98 (3.4%) |
Employment Occupations by Sex in Tolleson
Management, Business, Science and Arts Occupations
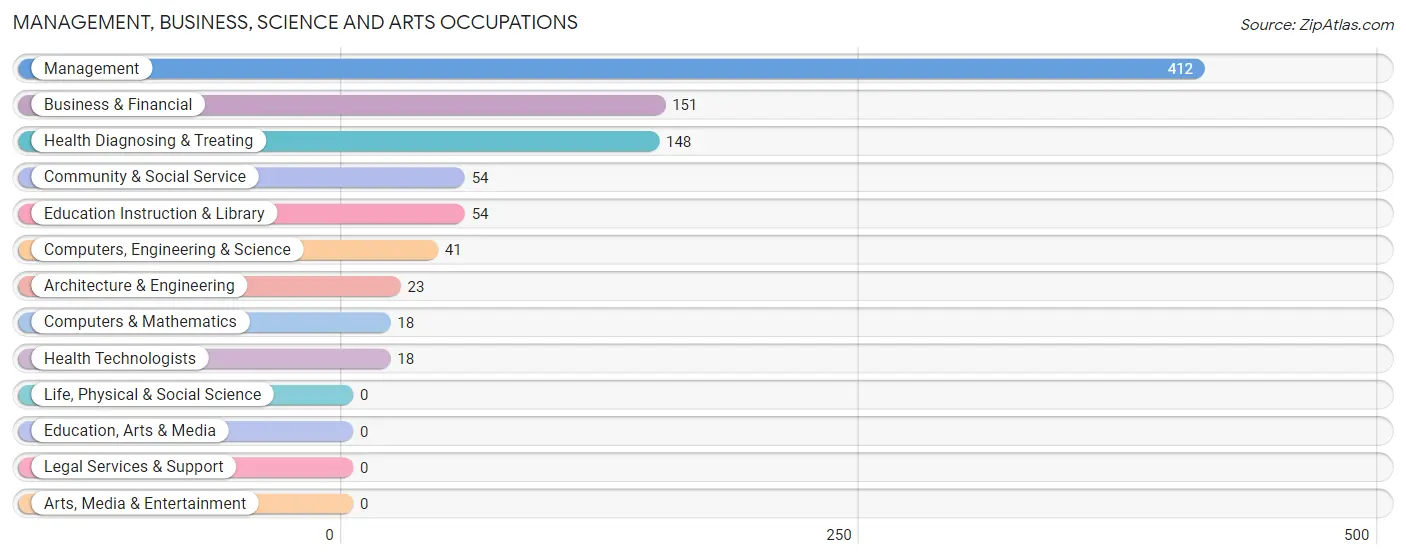
The most common Management, Business, Science and Arts occupations in Tolleson are Management (412 | 14.7%), Business & Financial (151 | 5.4%), Health Diagnosing & Treating (148 | 5.3%), Community & Social Service (54 | 1.9%), and Education Instruction & Library (54 | 1.9%).
Management, Business, Science and Arts Occupations by Sex
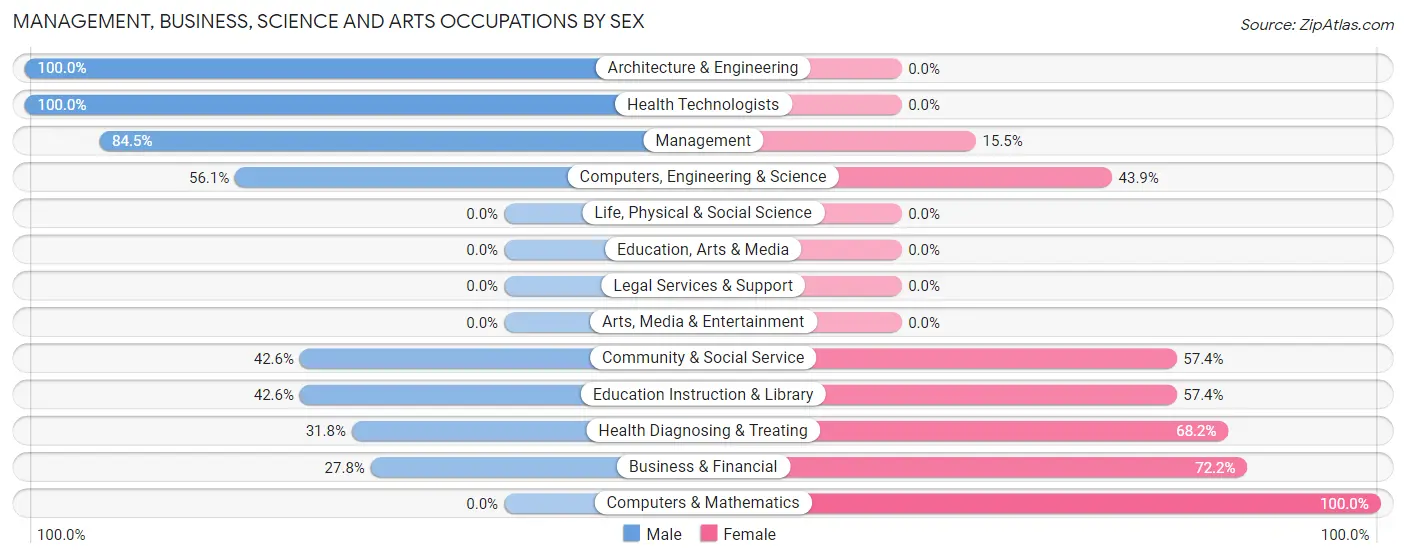
Within the Management, Business, Science and Arts occupations in Tolleson, the most male-oriented occupations are Architecture & Engineering (100.0%), Health Technologists (100.0%), and Management (84.5%), while the most female-oriented occupations are Computers & Mathematics (100.0%), Business & Financial (72.2%), and Health Diagnosing & Treating (68.2%).
| Occupation | Male | Female |
| Management | 348 (84.5%) | 64 (15.5%) |
| Business & Financial | 42 (27.8%) | 109 (72.2%) |
| Computers, Engineering & Science | 23 (56.1%) | 18 (43.9%) |
| Computers & Mathematics | 0 (0.0%) | 18 (100.0%) |
| Architecture & Engineering | 23 (100.0%) | 0 (0.0%) |
| Life, Physical & Social Science | 0 (0.0%) | 0 (0.0%) |
| Community & Social Service | 23 (42.6%) | 31 (57.4%) |
| Education, Arts & Media | 0 (0.0%) | 0 (0.0%) |
| Legal Services & Support | 0 (0.0%) | 0 (0.0%) |
| Education Instruction & Library | 23 (42.6%) | 31 (57.4%) |
| Arts, Media & Entertainment | 0 (0.0%) | 0 (0.0%) |
| Health Diagnosing & Treating | 47 (31.8%) | 101 (68.2%) |
| Health Technologists | 18 (100.0%) | 0 (0.0%) |
| Total (Category) | 483 (59.9%) | 323 (40.1%) |
| Total (Overall) | 1,430 (51.0%) | 1,374 (49.0%) |
Services Occupations
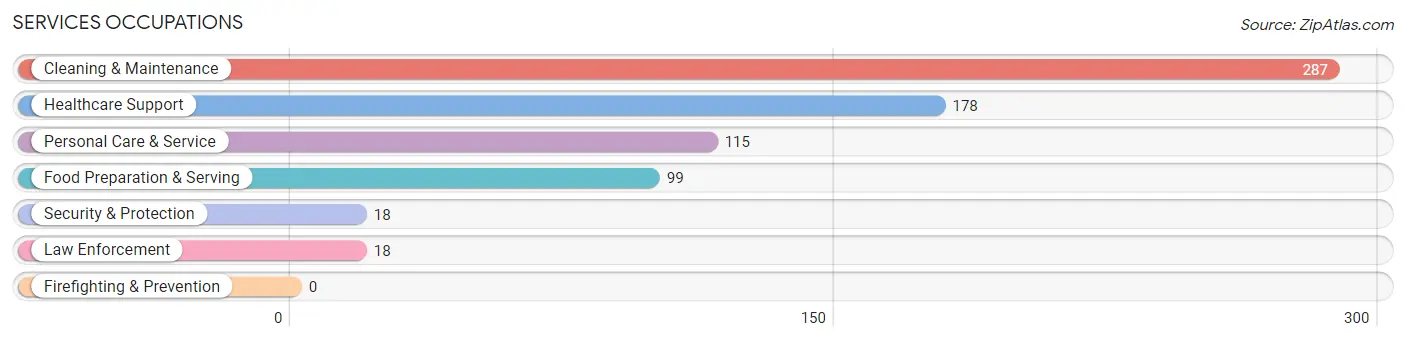
The most common Services occupations in Tolleson are Cleaning & Maintenance (287 | 10.2%), Healthcare Support (178 | 6.4%), Personal Care & Service (115 | 4.1%), Food Preparation & Serving (99 | 3.5%), and Security & Protection (18 | 0.6%).
Services Occupations by Sex
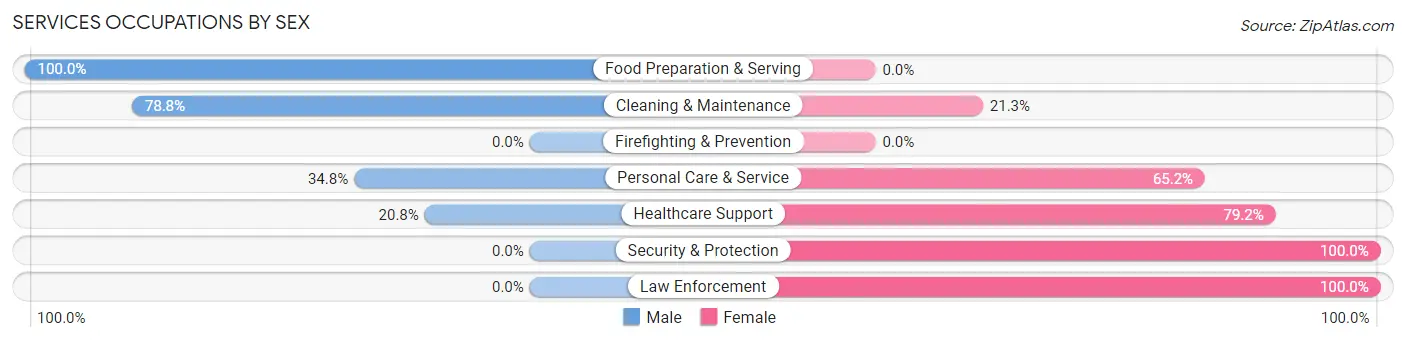
Within the Services occupations in Tolleson, the most male-oriented occupations are Food Preparation & Serving (100.0%), Cleaning & Maintenance (78.7%), and Personal Care & Service (34.8%), while the most female-oriented occupations are Security & Protection (100.0%), Law Enforcement (100.0%), and Healthcare Support (79.2%).
| Occupation | Male | Female |
| Healthcare Support | 37 (20.8%) | 141 (79.2%) |
| Security & Protection | 0 (0.0%) | 18 (100.0%) |
| Firefighting & Prevention | 0 (0.0%) | 0 (0.0%) |
| Law Enforcement | 0 (0.0%) | 18 (100.0%) |
| Food Preparation & Serving | 99 (100.0%) | 0 (0.0%) |
| Cleaning & Maintenance | 226 (78.7%) | 61 (21.2%) |
| Personal Care & Service | 40 (34.8%) | 75 (65.2%) |
| Total (Category) | 402 (57.7%) | 295 (42.3%) |
| Total (Overall) | 1,430 (51.0%) | 1,374 (49.0%) |
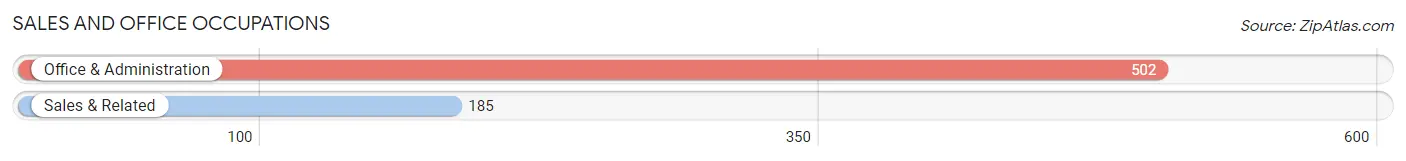
Sales and Office Occupations
The most common Sales and Office occupations in Tolleson are Office & Administration (502 | 17.9%), and Sales & Related (185 | 6.6%).
Sales and Office Occupations by Sex
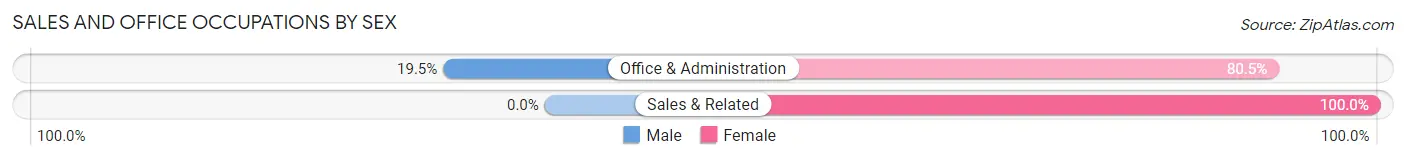
| Occupation | Male | Female |
| Sales & Related | 0 (0.0%) | 185 (100.0%) |
| Office & Administration | 98 (19.5%) | 404 (80.5%) |
| Total (Category) | 98 (14.3%) | 589 (85.7%) |
| Total (Overall) | 1,430 (51.0%) | 1,374 (49.0%) |
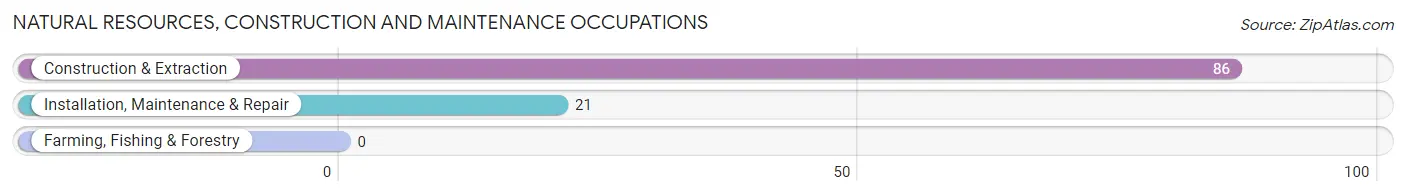
Natural Resources, Construction and Maintenance Occupations
The most common Natural Resources, Construction and Maintenance occupations in Tolleson are Construction & Extraction (86 | 3.1%), and Installation, Maintenance & Repair (21 | 0.7%).
Natural Resources, Construction and Maintenance Occupations by Sex
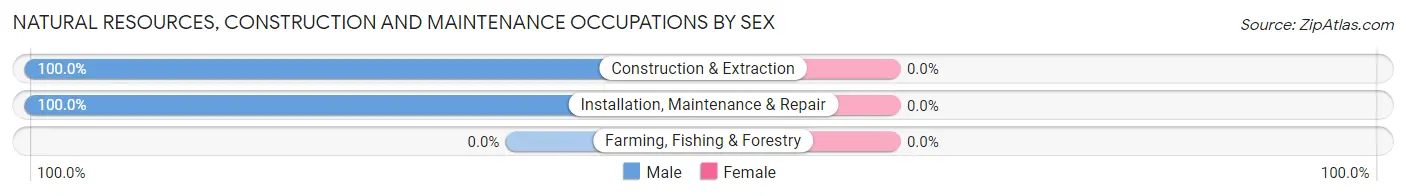
| Occupation | Male | Female |
| Farming, Fishing & Forestry | 0 (0.0%) | 0 (0.0%) |
| Construction & Extraction | 86 (100.0%) | 0 (0.0%) |
| Installation, Maintenance & Repair | 21 (100.0%) | 0 (0.0%) |
| Total (Category) | 107 (100.0%) | 0 (0.0%) |
| Total (Overall) | 1,430 (51.0%) | 1,374 (49.0%) |
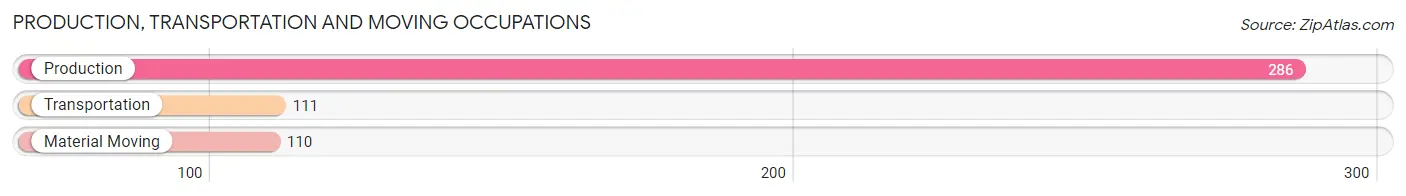
Production, Transportation and Moving Occupations
The most common Production, Transportation and Moving occupations in Tolleson are Production (286 | 10.2%), Transportation (111 | 4.0%), and Material Moving (110 | 3.9%).
Production, Transportation and Moving Occupations by Sex
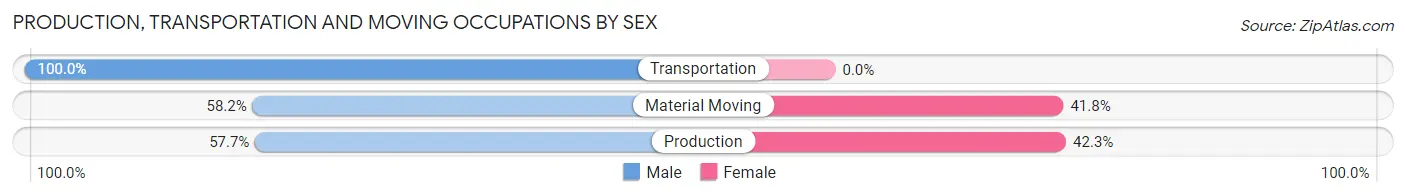
| Occupation | Male | Female |
| Production | 165 (57.7%) | 121 (42.3%) |
| Transportation | 111 (100.0%) | 0 (0.0%) |
| Material Moving | 64 (58.2%) | 46 (41.8%) |
| Total (Category) | 340 (67.1%) | 167 (32.9%) |
| Total (Overall) | 1,430 (51.0%) | 1,374 (49.0%) |
Employment Industries by Sex in Tolleson
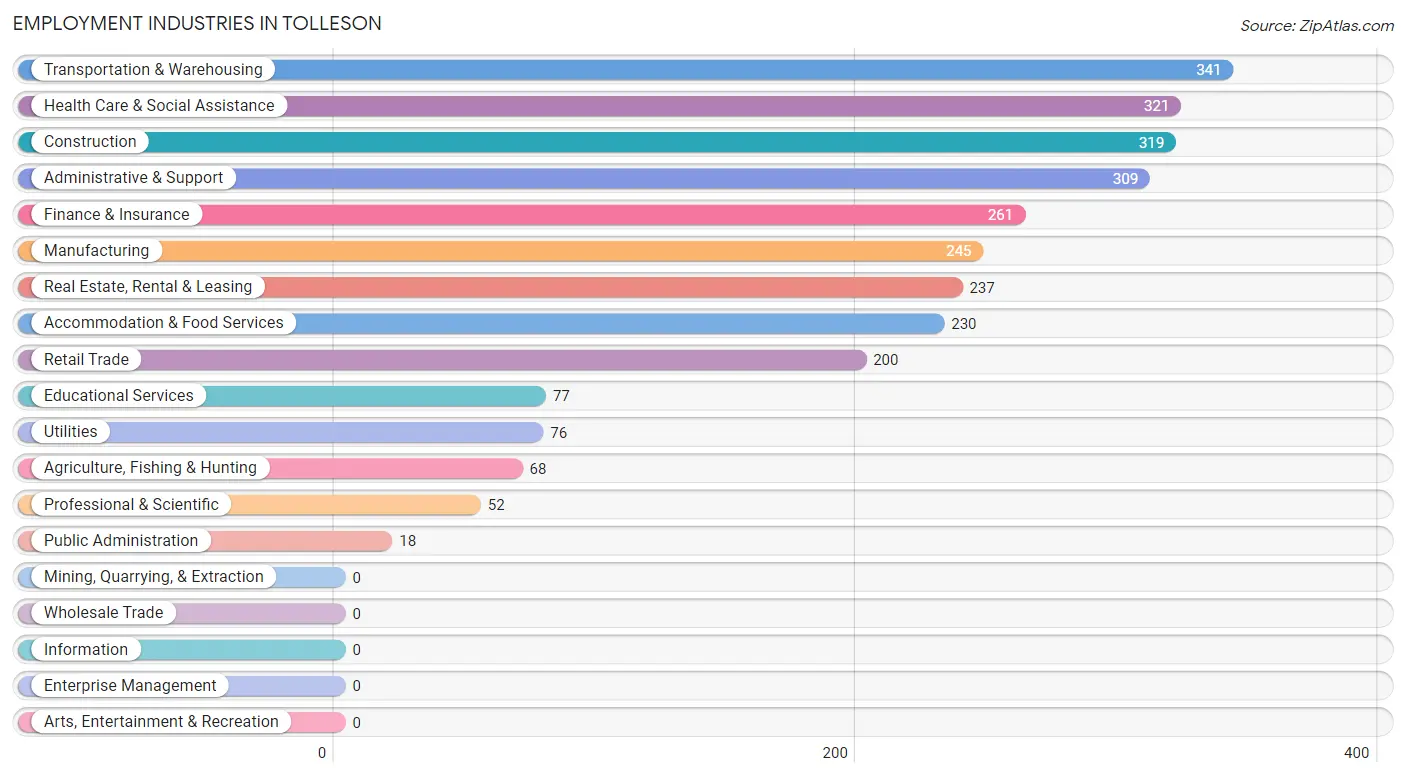
Employment Industries in Tolleson
The major employment industries in Tolleson include Transportation & Warehousing (341 | 12.2%), Health Care & Social Assistance (321 | 11.5%), Construction (319 | 11.4%), Administrative & Support (309 | 11.0%), and Finance & Insurance (261 | 9.3%).
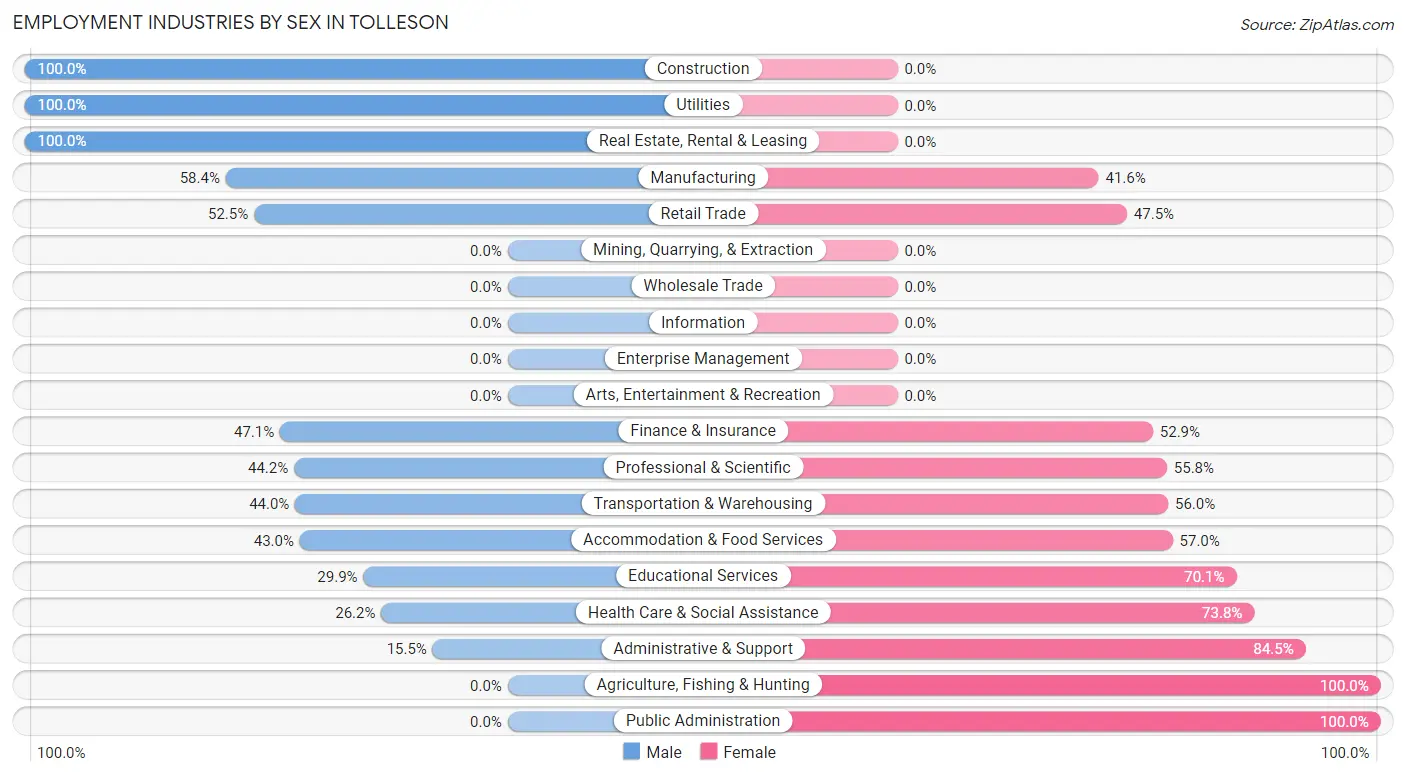
Employment Industries by Sex in Tolleson
The Tolleson industries that see more men than women are Construction (100.0%), Utilities (100.0%), and Real Estate, Rental & Leasing (100.0%), whereas the industries that tend to have a higher number of women are Agriculture, Fishing & Hunting (100.0%), Public Administration (100.0%), and Administrative & Support (84.5%).
| Industry | Male | Female |
| Agriculture, Fishing & Hunting | 0 (0.0%) | 68 (100.0%) |
| Mining, Quarrying, & Extraction | 0 (0.0%) | 0 (0.0%) |
| Construction | 319 (100.0%) | 0 (0.0%) |
| Manufacturing | 143 (58.4%) | 102 (41.6%) |
| Wholesale Trade | 0 (0.0%) | 0 (0.0%) |
| Retail Trade | 105 (52.5%) | 95 (47.5%) |
| Transportation & Warehousing | 150 (44.0%) | 191 (56.0%) |
| Utilities | 76 (100.0%) | 0 (0.0%) |
| Information | 0 (0.0%) | 0 (0.0%) |
| Finance & Insurance | 123 (47.1%) | 138 (52.9%) |
| Real Estate, Rental & Leasing | 237 (100.0%) | 0 (0.0%) |
| Professional & Scientific | 23 (44.2%) | 29 (55.8%) |
| Enterprise Management | 0 (0.0%) | 0 (0.0%) |
| Administrative & Support | 48 (15.5%) | 261 (84.5%) |
| Educational Services | 23 (29.9%) | 54 (70.1%) |
| Health Care & Social Assistance | 84 (26.2%) | 237 (73.8%) |
| Arts, Entertainment & Recreation | 0 (0.0%) | 0 (0.0%) |
| Accommodation & Food Services | 99 (43.0%) | 131 (57.0%) |
| Public Administration | 0 (0.0%) | 18 (100.0%) |
| Total | 1,430 (51.0%) | 1,374 (49.0%) |
Education in Tolleson
School Enrollment in Tolleson
The most common levels of schooling among the 1,998 students in Tolleson are middle school (543 | 27.2%), high school (453 | 22.7%), and college / undergraduate (433 | 21.7%).
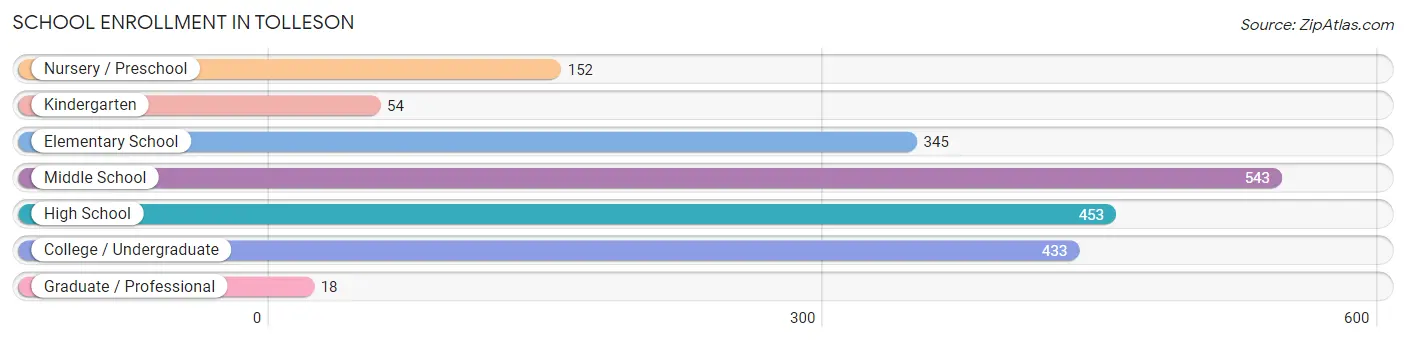
| School Level | # Students | % Students |
| Nursery / Preschool | 152 | 7.6% |
| Kindergarten | 54 | 2.7% |
| Elementary School | 345 | 17.3% |
| Middle School | 543 | 27.2% |
| High School | 453 | 22.7% |
| College / Undergraduate | 433 | 21.7% |
| Graduate / Professional | 18 | 0.9% |
| Total | 1,998 | 100.0% |
School Enrollment by Age by Funding Source in Tolleson
Out of a total of 1,998 students who are enrolled in schools in Tolleson, 112 (5.6%) attend a private institution, while the remaining 1,886 (94.4%) are enrolled in public schools. The age group of 5 to 9 year old has the highest likelihood of being enrolled in private schools, with 112 (28.1% in the age bracket) enrolled. Conversely, the age group of 3 to 4 year olds has the lowest likelihood of being enrolled in a private school, with 152 (100.0% in the age bracket) attending a public institution.
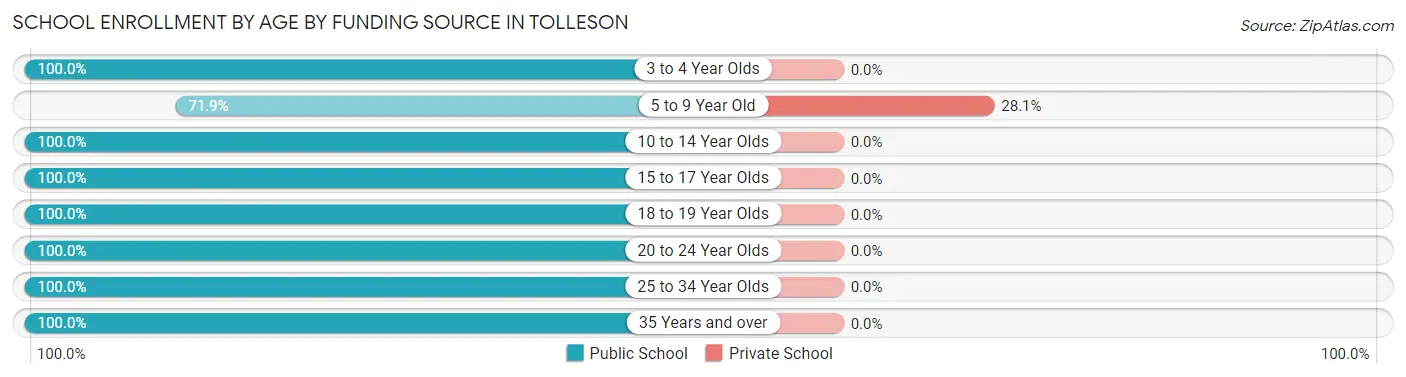
| Age Bracket | Public School | Private School |
| 3 to 4 Year Olds | 152 (100.0%) | 0 (0.0%) |
| 5 to 9 Year Old | 287 (71.9%) | 112 (28.1%) |
| 10 to 14 Year Olds | 543 (100.0%) | 0 (0.0%) |
| 15 to 17 Year Olds | 382 (100.0%) | 0 (0.0%) |
| 18 to 19 Year Olds | 203 (100.0%) | 0 (0.0%) |
| 20 to 24 Year Olds | 98 (100.0%) | 0 (0.0%) |
| 25 to 34 Year Olds | 86 (100.0%) | 0 (0.0%) |
| 35 Years and over | 135 (100.0%) | 0 (0.0%) |
| Total | 1,886 (94.4%) | 112 (5.6%) |
Educational Attainment by Field of Study in Tolleson
Education (159 | 52.0%), physical & health sciences (46 | 15.0%), business (42 | 13.7%), literature & languages (23 | 7.5%), and science & technology (18 | 5.9%) are the most common fields of study among 306 individuals in Tolleson who have obtained a bachelor's degree or higher.
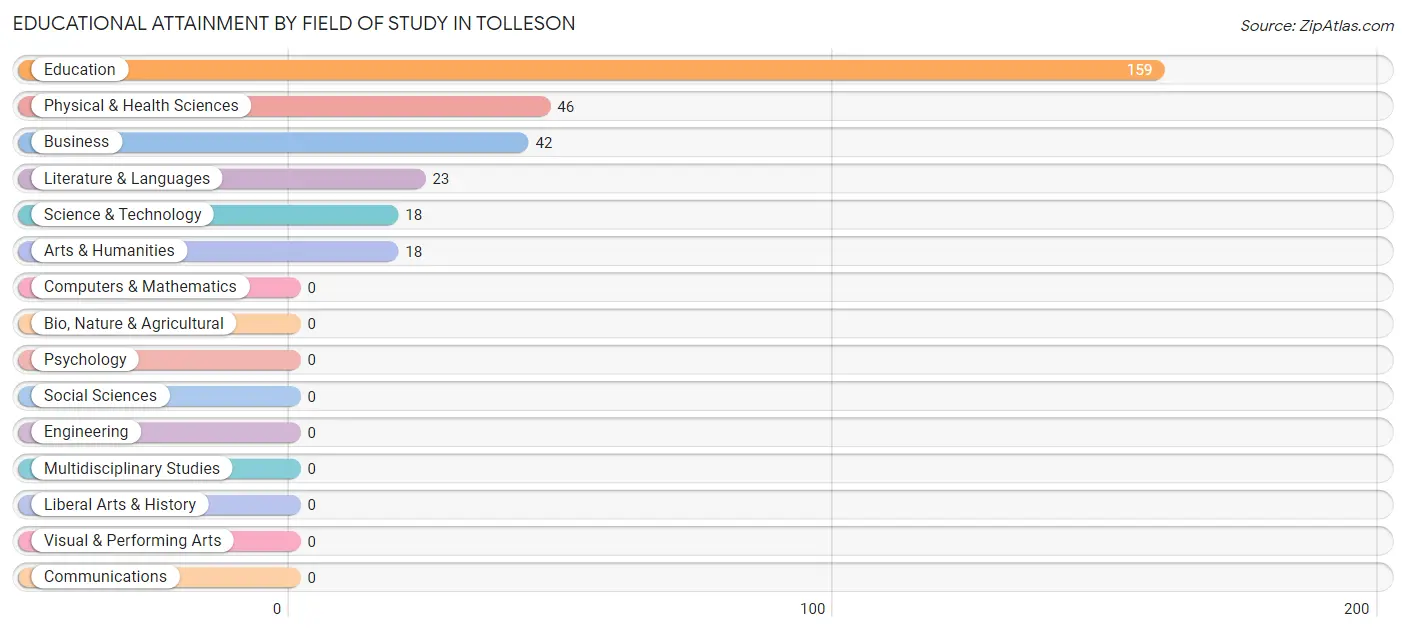
| Field of Study | # Graduates | % Graduates |
| Computers & Mathematics | 0 | 0.0% |
| Bio, Nature & Agricultural | 0 | 0.0% |
| Physical & Health Sciences | 46 | 15.0% |
| Psychology | 0 | 0.0% |
| Social Sciences | 0 | 0.0% |
| Engineering | 0 | 0.0% |
| Multidisciplinary Studies | 0 | 0.0% |
| Science & Technology | 18 | 5.9% |
| Business | 42 | 13.7% |
| Education | 159 | 52.0% |
| Literature & Languages | 23 | 7.5% |
| Liberal Arts & History | 0 | 0.0% |
| Visual & Performing Arts | 0 | 0.0% |
| Communications | 0 | 0.0% |
| Arts & Humanities | 18 | 5.9% |
| Total | 306 | 100.0% |
Transportation & Commute in Tolleson
Vehicle Availability by Sex in Tolleson
The most prevalent vehicle ownership categories in Tolleson are males with 2 vehicles (635, accounting for 44.4%) and females with 2 vehicles (400, making up 46.2%).
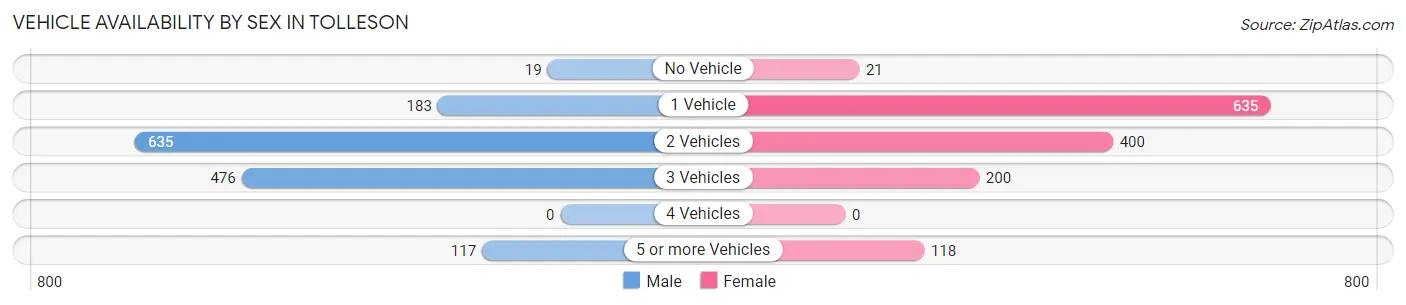
| Vehicles Available | Male | Female |
| No Vehicle | 19 (1.3%) | 21 (1.5%) |
| 1 Vehicle | 183 (12.8%) | 635 (46.2%) |
| 2 Vehicles | 635 (44.4%) | 400 (29.1%) |
| 3 Vehicles | 476 (33.3%) | 200 (14.6%) |
| 4 Vehicles | 0 (0.0%) | 0 (0.0%) |
| 5 or more Vehicles | 117 (8.2%) | 118 (8.6%) |
| Total | 1,430 (100.0%) | 1,374 (100.0%) |
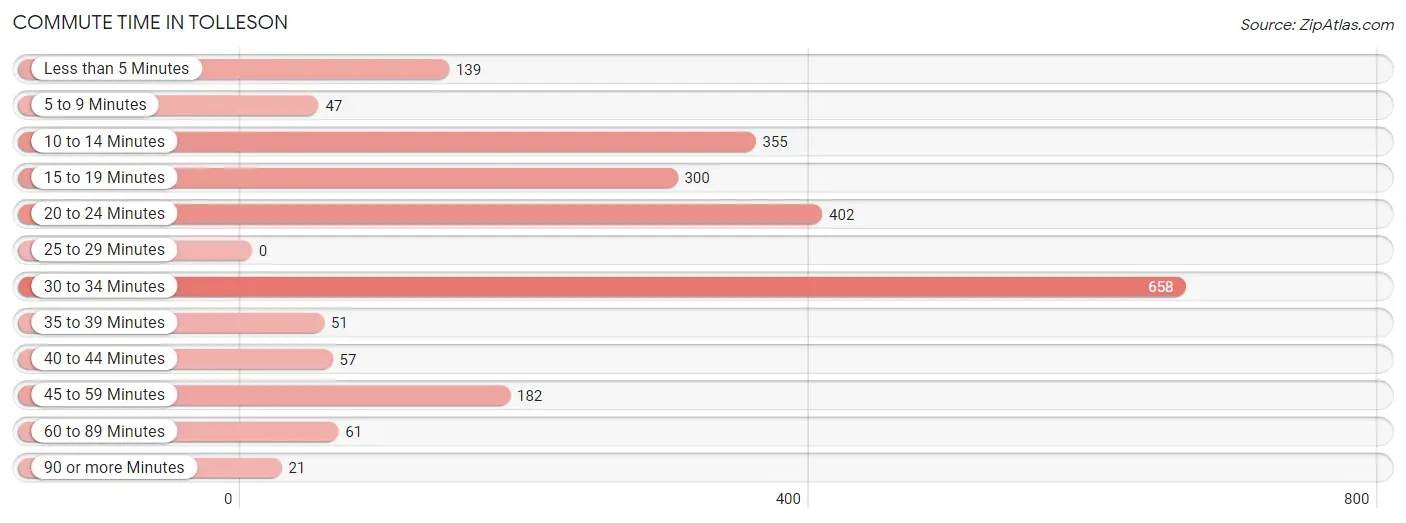
Commute Time in Tolleson
The most frequently occuring commute durations in Tolleson are 30 to 34 minutes (658 commuters, 28.9%), 20 to 24 minutes (402 commuters, 17.7%), and 10 to 14 minutes (355 commuters, 15.6%).
| Commute Time | # Commuters | % Commuters |
| Less than 5 Minutes | 139 | 6.1% |
| 5 to 9 Minutes | 47 | 2.1% |
| 10 to 14 Minutes | 355 | 15.6% |
| 15 to 19 Minutes | 300 | 13.2% |
| 20 to 24 Minutes | 402 | 17.7% |
| 25 to 29 Minutes | 0 | 0.0% |
| 30 to 34 Minutes | 658 | 28.9% |
| 35 to 39 Minutes | 51 | 2.2% |
| 40 to 44 Minutes | 57 | 2.5% |
| 45 to 59 Minutes | 182 | 8.0% |
| 60 to 89 Minutes | 61 | 2.7% |
| 90 or more Minutes | 21 | 0.9% |
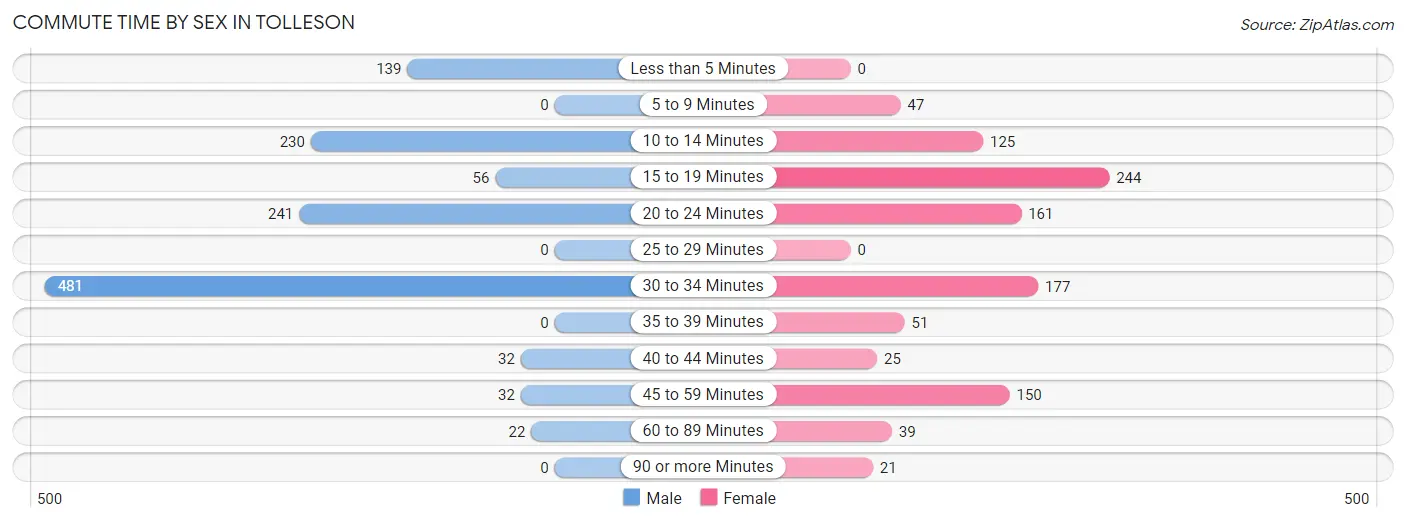
Commute Time by Sex in Tolleson
The most common commute times in Tolleson are 30 to 34 minutes (481 commuters, 39.0%) for males and 15 to 19 minutes (244 commuters, 23.5%) for females.
| Commute Time | Male | Female |
| Less than 5 Minutes | 139 (11.3%) | 0 (0.0%) |
| 5 to 9 Minutes | 0 (0.0%) | 47 (4.5%) |
| 10 to 14 Minutes | 230 (18.6%) | 125 (12.0%) |
| 15 to 19 Minutes | 56 (4.5%) | 244 (23.5%) |
| 20 to 24 Minutes | 241 (19.6%) | 161 (15.5%) |
| 25 to 29 Minutes | 0 (0.0%) | 0 (0.0%) |
| 30 to 34 Minutes | 481 (39.0%) | 177 (17.0%) |
| 35 to 39 Minutes | 0 (0.0%) | 51 (4.9%) |
| 40 to 44 Minutes | 32 (2.6%) | 25 (2.4%) |
| 45 to 59 Minutes | 32 (2.6%) | 150 (14.4%) |
| 60 to 89 Minutes | 22 (1.8%) | 39 (3.7%) |
| 90 or more Minutes | 0 (0.0%) | 21 (2.0%) |
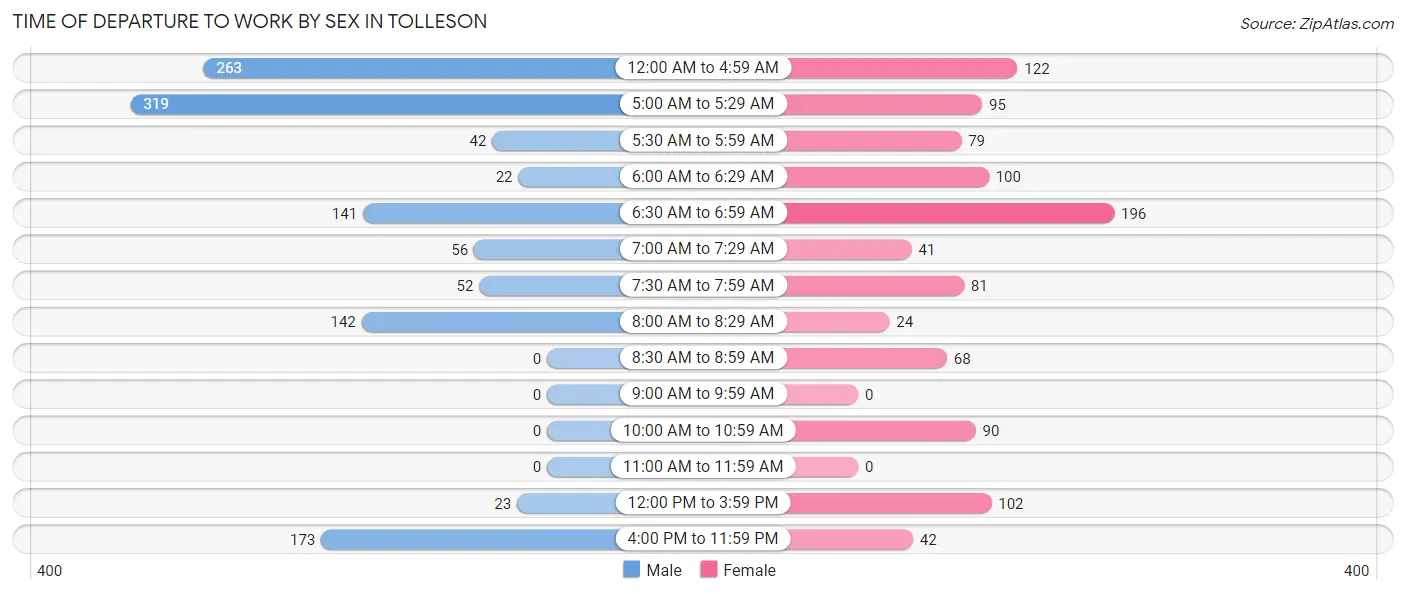
Time of Departure to Work by Sex in Tolleson
The most frequent times of departure to work in Tolleson are 5:00 AM to 5:29 AM (319, 25.9%) for males and 6:30 AM to 6:59 AM (196, 18.9%) for females.
| Time of Departure | Male | Female |
| 12:00 AM to 4:59 AM | 263 (21.3%) | 122 (11.7%) |
| 5:00 AM to 5:29 AM | 319 (25.9%) | 95 (9.1%) |
| 5:30 AM to 5:59 AM | 42 (3.4%) | 79 (7.6%) |
| 6:00 AM to 6:29 AM | 22 (1.8%) | 100 (9.6%) |
| 6:30 AM to 6:59 AM | 141 (11.4%) | 196 (18.9%) |
| 7:00 AM to 7:29 AM | 56 (4.5%) | 41 (3.9%) |
| 7:30 AM to 7:59 AM | 52 (4.2%) | 81 (7.8%) |
| 8:00 AM to 8:29 AM | 142 (11.5%) | 24 (2.3%) |
| 8:30 AM to 8:59 AM | 0 (0.0%) | 68 (6.5%) |
| 9:00 AM to 9:59 AM | 0 (0.0%) | 0 (0.0%) |
| 10:00 AM to 10:59 AM | 0 (0.0%) | 90 (8.6%) |
| 11:00 AM to 11:59 AM | 0 (0.0%) | 0 (0.0%) |
| 12:00 PM to 3:59 PM | 23 (1.9%) | 102 (9.8%) |
| 4:00 PM to 11:59 PM | 173 (14.0%) | 42 (4.0%) |
| Total | 1,233 (100.0%) | 1,040 (100.0%) |
Housing Occupancy in Tolleson
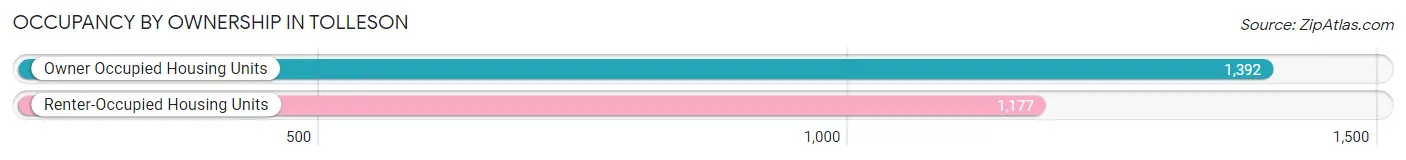
Occupancy by Ownership in Tolleson
Of the total 2,569 dwellings in Tolleson, owner-occupied units account for 1,392 (54.2%), while renter-occupied units make up 1,177 (45.8%).
| Occupancy | # Housing Units | % Housing Units |
| Owner Occupied Housing Units | 1,392 | 54.2% |
| Renter-Occupied Housing Units | 1,177 | 45.8% |
| Total Occupied Housing Units | 2,569 | 100.0% |
Occupancy by Household Size in Tolleson
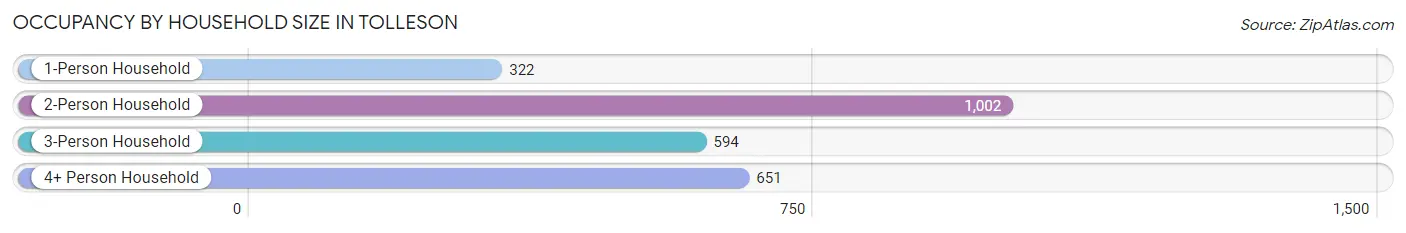
| Household Size | # Housing Units | % Housing Units |
| 1-Person Household | 322 | 12.5% |
| 2-Person Household | 1,002 | 39.0% |
| 3-Person Household | 594 | 23.1% |
| 4+ Person Household | 651 | 25.3% |
| Total Housing Units | 2,569 | 100.0% |
Occupancy by Ownership by Household Size in Tolleson
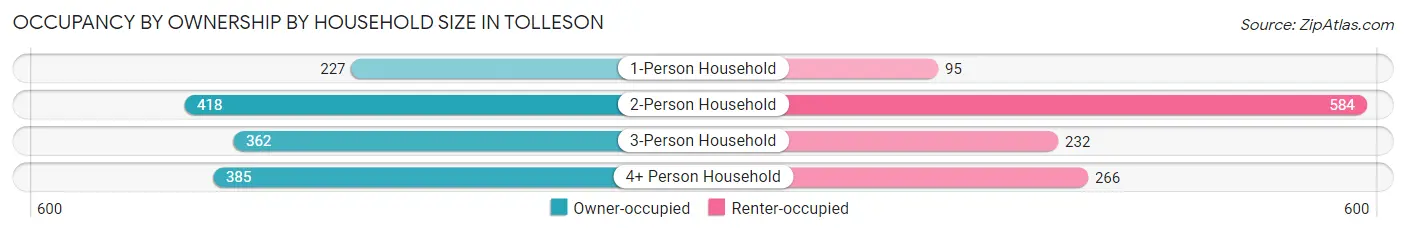
| Household Size | Owner-occupied | Renter-occupied |
| 1-Person Household | 227 (70.5%) | 95 (29.5%) |
| 2-Person Household | 418 (41.7%) | 584 (58.3%) |
| 3-Person Household | 362 (60.9%) | 232 (39.1%) |
| 4+ Person Household | 385 (59.1%) | 266 (40.9%) |
| Total Housing Units | 1,392 (54.2%) | 1,177 (45.8%) |
Occupancy by Educational Attainment in Tolleson
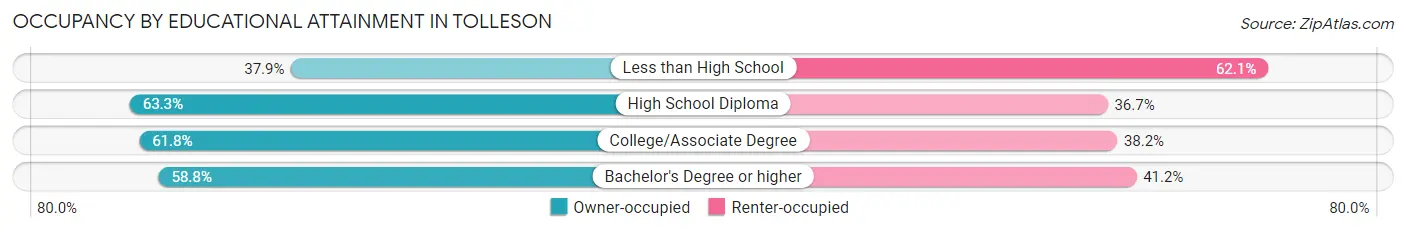
| Household Size | Owner-occupied | Renter-occupied |
| Less than High School | 318 (37.9%) | 522 (62.1%) |
| High School Diploma | 452 (63.3%) | 262 (36.7%) |
| College/Associate Degree | 518 (61.8%) | 320 (38.2%) |
| Bachelor's Degree or higher | 104 (58.8%) | 73 (41.2%) |
Occupancy by Age of Householder in Tolleson
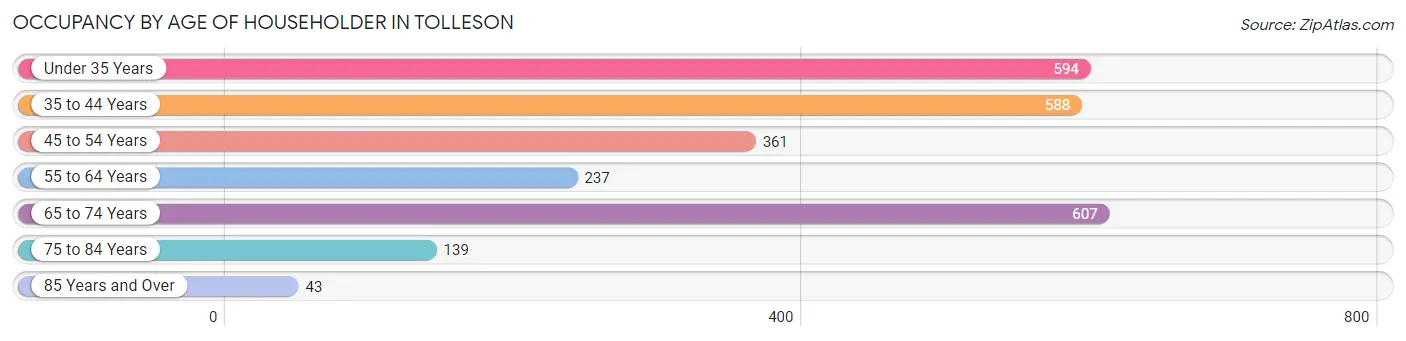
| Age Bracket | # Households | % Households |
| Under 35 Years | 594 | 23.1% |
| 35 to 44 Years | 588 | 22.9% |
| 45 to 54 Years | 361 | 14.1% |
| 55 to 64 Years | 237 | 9.2% |
| 65 to 74 Years | 607 | 23.6% |
| 75 to 84 Years | 139 | 5.4% |
| 85 Years and Over | 43 | 1.7% |
| Total | 2,569 | 100.0% |
Housing Finances in Tolleson
Median Income by Occupancy in Tolleson
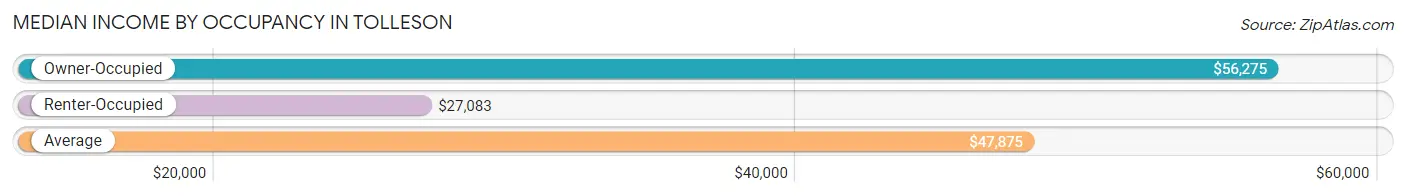
| Occupancy Type | # Households | Median Income |
| Owner-Occupied | 1,392 (54.2%) | $56,275 |
| Renter-Occupied | 1,177 (45.8%) | $27,083 |
| Average | 2,569 (100.0%) | $47,875 |
Occupancy by Householder Income Bracket in Tolleson
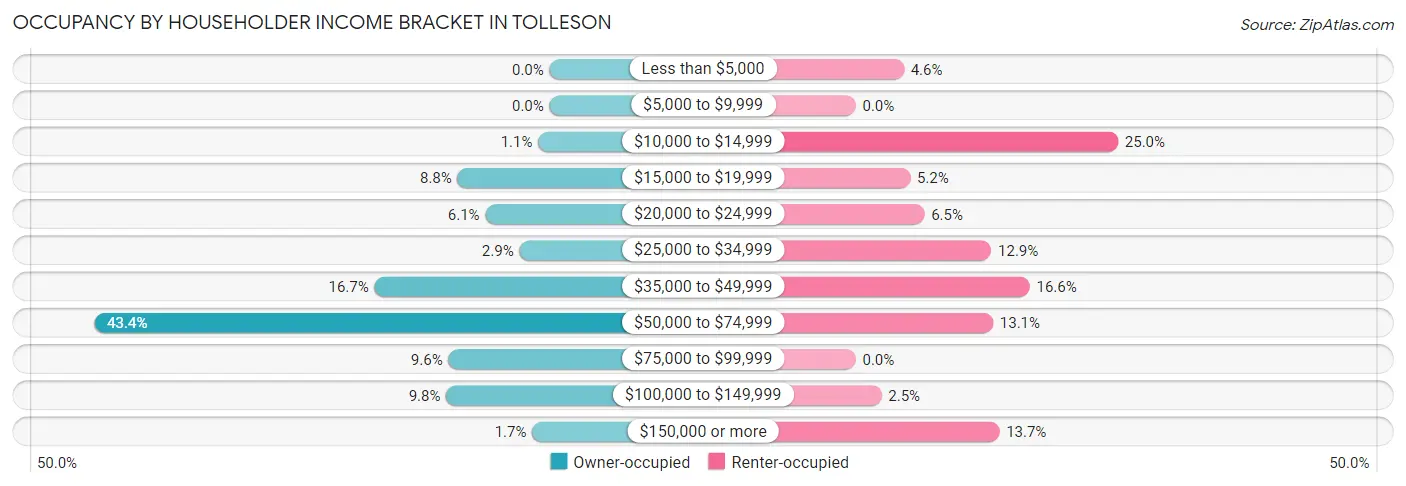
| Income Bracket | Owner-occupied | Renter-occupied |
| Less than $5,000 | 0 (0.0%) | 54 (4.6%) |
| $5,000 to $9,999 | 0 (0.0%) | 0 (0.0%) |
| $10,000 to $14,999 | 15 (1.1%) | 294 (25.0%) |
| $15,000 to $19,999 | 122 (8.8%) | 61 (5.2%) |
| $20,000 to $24,999 | 85 (6.1%) | 77 (6.5%) |
| $25,000 to $34,999 | 40 (2.9%) | 152 (12.9%) |
| $35,000 to $49,999 | 232 (16.7%) | 195 (16.6%) |
| $50,000 to $74,999 | 604 (43.4%) | 154 (13.1%) |
| $75,000 to $99,999 | 134 (9.6%) | 0 (0.0%) |
| $100,000 to $149,999 | 137 (9.8%) | 29 (2.5%) |
| $150,000 or more | 23 (1.7%) | 161 (13.7%) |
| Total | 1,392 (100.0%) | 1,177 (100.0%) |
Monthly Housing Cost Tiers in Tolleson
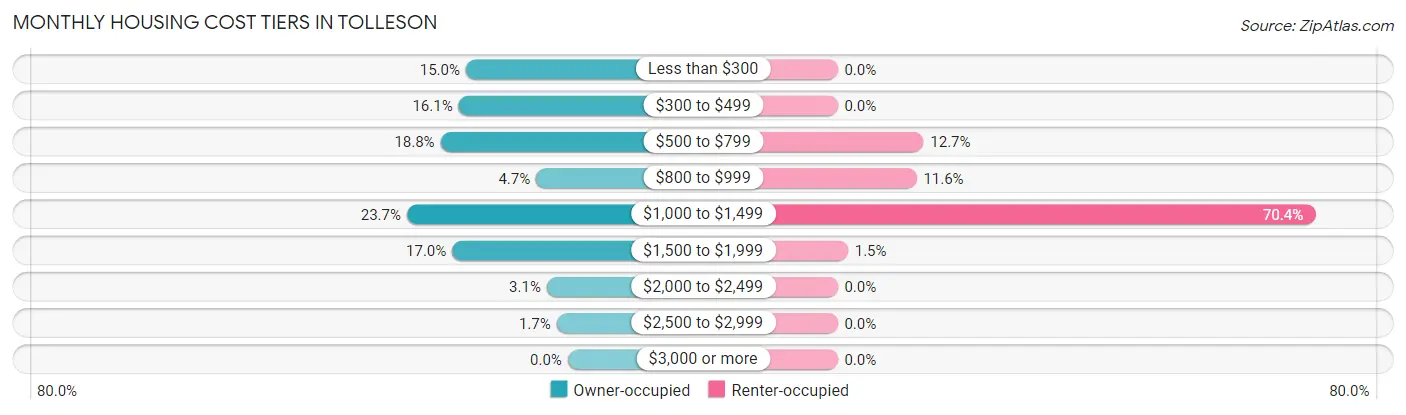
| Monthly Cost | Owner-occupied | Renter-occupied |
| Less than $300 | 209 (15.0%) | 0 (0.0%) |
| $300 to $499 | 224 (16.1%) | 0 (0.0%) |
| $500 to $799 | 261 (18.8%) | 149 (12.7%) |
| $800 to $999 | 65 (4.7%) | 137 (11.6%) |
| $1,000 to $1,499 | 330 (23.7%) | 828 (70.4%) |
| $1,500 to $1,999 | 237 (17.0%) | 18 (1.5%) |
| $2,000 to $2,499 | 43 (3.1%) | 0 (0.0%) |
| $2,500 to $2,999 | 23 (1.7%) | 0 (0.0%) |
| $3,000 or more | 0 (0.0%) | 0 (0.0%) |
| Total | 1,392 (100.0%) | 1,177 (100.0%) |
Physical Housing Characteristics in Tolleson
Housing Structures in Tolleson
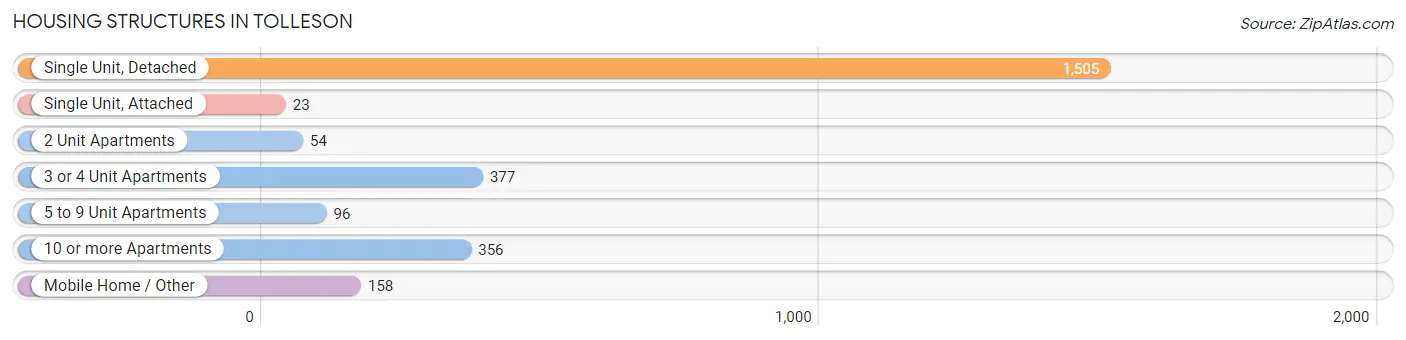
| Structure Type | # Housing Units | % Housing Units |
| Single Unit, Detached | 1,505 | 58.6% |
| Single Unit, Attached | 23 | 0.9% |
| 2 Unit Apartments | 54 | 2.1% |
| 3 or 4 Unit Apartments | 377 | 14.7% |
| 5 to 9 Unit Apartments | 96 | 3.7% |
| 10 or more Apartments | 356 | 13.9% |
| Mobile Home / Other | 158 | 6.1% |
| Total | 2,569 | 100.0% |
Housing Structures by Occupancy in Tolleson
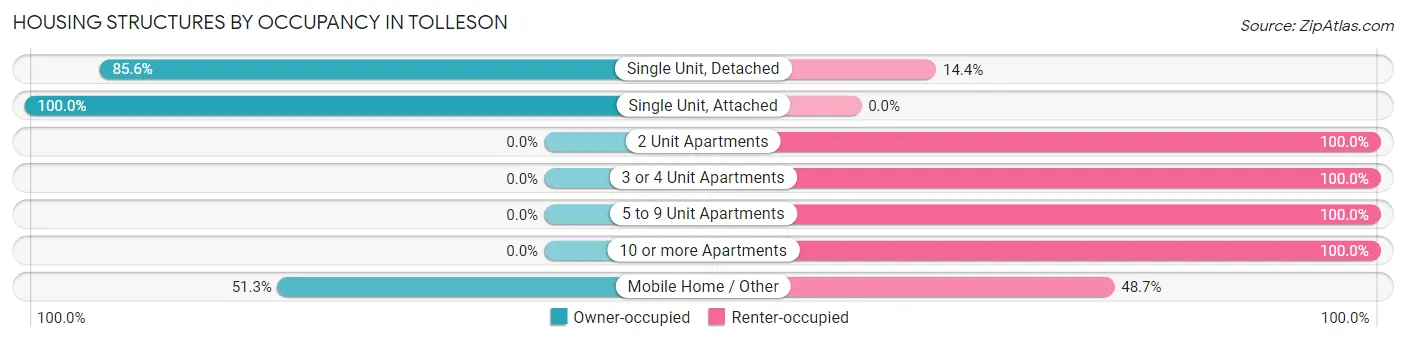
| Structure Type | Owner-occupied | Renter-occupied |
| Single Unit, Detached | 1,288 (85.6%) | 217 (14.4%) |
| Single Unit, Attached | 23 (100.0%) | 0 (0.0%) |
| 2 Unit Apartments | 0 (0.0%) | 54 (100.0%) |
| 3 or 4 Unit Apartments | 0 (0.0%) | 377 (100.0%) |
| 5 to 9 Unit Apartments | 0 (0.0%) | 96 (100.0%) |
| 10 or more Apartments | 0 (0.0%) | 356 (100.0%) |
| Mobile Home / Other | 81 (51.3%) | 77 (48.7%) |
| Total | 1,392 (54.2%) | 1,177 (45.8%) |
Housing Structures by Number of Rooms in Tolleson
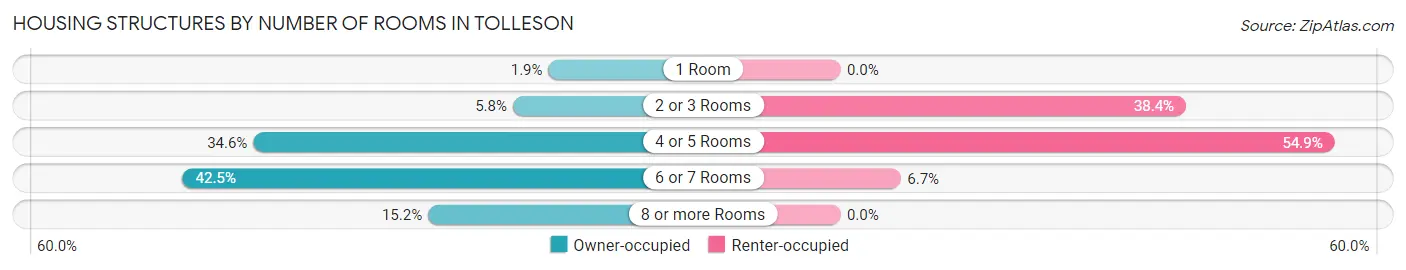
| Number of Rooms | Owner-occupied | Renter-occupied |
| 1 Room | 26 (1.9%) | 0 (0.0%) |
| 2 or 3 Rooms | 81 (5.8%) | 452 (38.4%) |
| 4 or 5 Rooms | 482 (34.6%) | 646 (54.9%) |
| 6 or 7 Rooms | 591 (42.5%) | 79 (6.7%) |
| 8 or more Rooms | 212 (15.2%) | 0 (0.0%) |
| Total | 1,392 (100.0%) | 1,177 (100.0%) |
Housing Structure by Heating Type in Tolleson
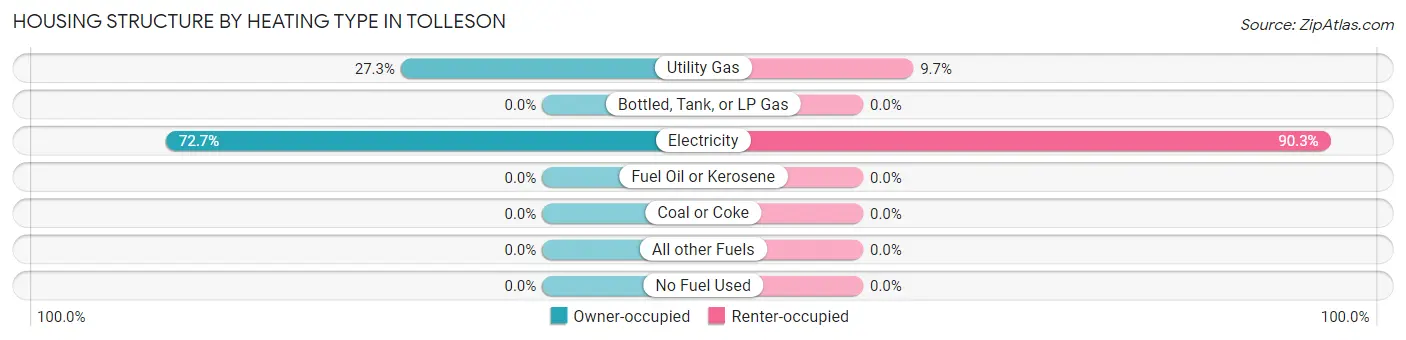
| Heating Type | Owner-occupied | Renter-occupied |
| Utility Gas | 380 (27.3%) | 114 (9.7%) |
| Bottled, Tank, or LP Gas | 0 (0.0%) | 0 (0.0%) |
| Electricity | 1,012 (72.7%) | 1,063 (90.3%) |
| Fuel Oil or Kerosene | 0 (0.0%) | 0 (0.0%) |
| Coal or Coke | 0 (0.0%) | 0 (0.0%) |
| All other Fuels | 0 (0.0%) | 0 (0.0%) |
| No Fuel Used | 0 (0.0%) | 0 (0.0%) |
| Total | 1,392 (100.0%) | 1,177 (100.0%) |
Household Vehicle Usage in Tolleson
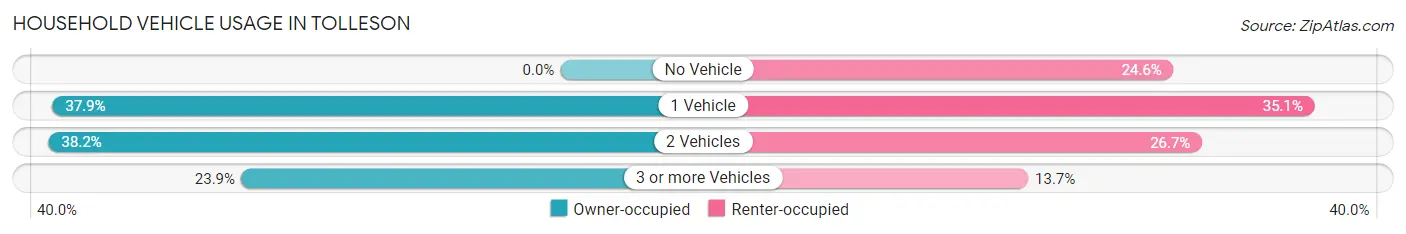
| Vehicles per Household | Owner-occupied | Renter-occupied |
| No Vehicle | 0 (0.0%) | 289 (24.5%) |
| 1 Vehicle | 528 (37.9%) | 413 (35.1%) |
| 2 Vehicles | 532 (38.2%) | 314 (26.7%) |
| 3 or more Vehicles | 332 (23.8%) | 161 (13.7%) |
| Total | 1,392 (100.0%) | 1,177 (100.0%) |
Real Estate & Mortgages in Tolleson
Real Estate and Mortgage Overview in Tolleson
| Characteristic | Without Mortgage | With Mortgage |
| Housing Units | 690 | 702 |
| Median Property Value | $275,900 | $274,200 |
| Median Household Income | $42,619 | $23 |
| Monthly Housing Costs | $427 | $0 |
| Real Estate Taxes | $907 | $0 |
Property Value by Mortgage Status in Tolleson
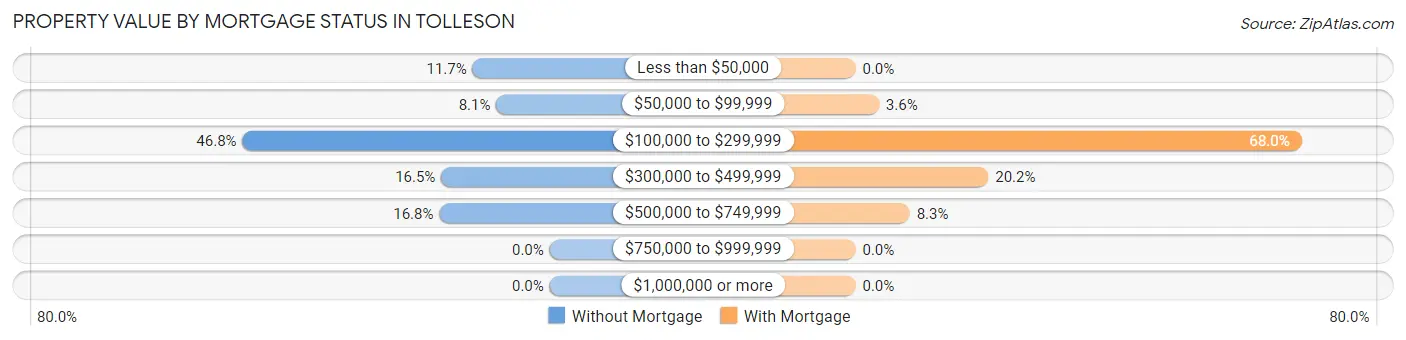
| Property Value | Without Mortgage | With Mortgage |
| Less than $50,000 | 81 (11.7%) | 0 (0.0%) |
| $50,000 to $99,999 | 56 (8.1%) | 25 (3.6%) |
| $100,000 to $299,999 | 323 (46.8%) | 477 (67.9%) |
| $300,000 to $499,999 | 114 (16.5%) | 142 (20.2%) |
| $500,000 to $749,999 | 116 (16.8%) | 58 (8.3%) |
| $750,000 to $999,999 | 0 (0.0%) | 0 (0.0%) |
| $1,000,000 or more | 0 (0.0%) | 0 (0.0%) |
| Total | 690 (100.0%) | 702 (100.0%) |
Household Income by Mortgage Status in Tolleson
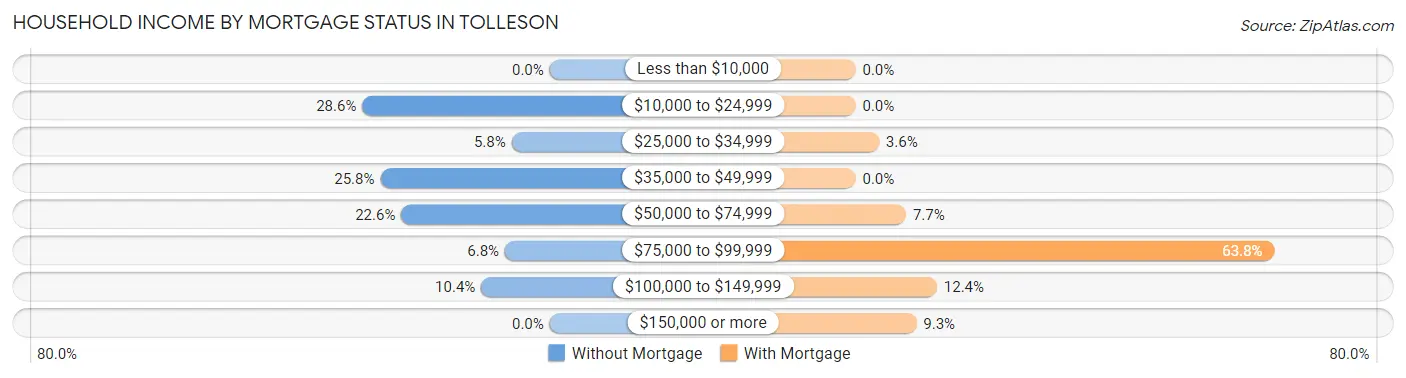
| Household Income | Without Mortgage | With Mortgage |
| Less than $10,000 | 0 (0.0%) | 0 (0.0%) |
| $10,000 to $24,999 | 197 (28.5%) | 0 (0.0%) |
| $25,000 to $34,999 | 40 (5.8%) | 25 (3.6%) |
| $35,000 to $49,999 | 178 (25.8%) | 0 (0.0%) |
| $50,000 to $74,999 | 156 (22.6%) | 54 (7.7%) |
| $75,000 to $99,999 | 47 (6.8%) | 448 (63.8%) |
| $100,000 to $149,999 | 72 (10.4%) | 87 (12.4%) |
| $150,000 or more | 0 (0.0%) | 65 (9.3%) |
| Total | 690 (100.0%) | 702 (100.0%) |
Property Value to Household Income Ratio in Tolleson
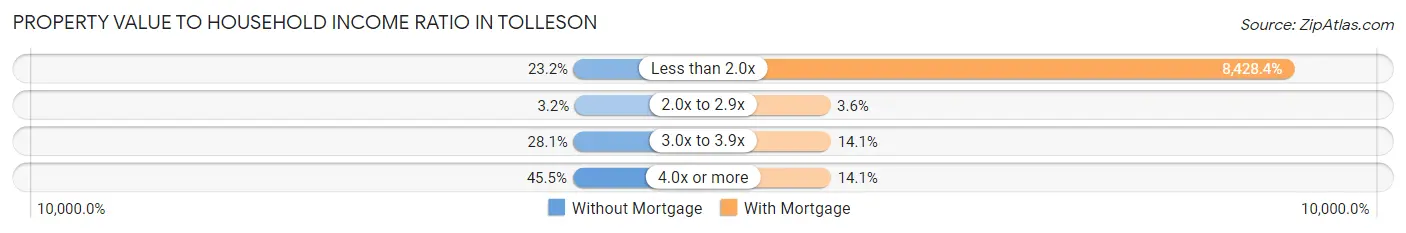
| Value-to-Income Ratio | Without Mortgage | With Mortgage |
| Less than 2.0x | 160 (23.2%) | 59,167 (8,428.4%) |
| 2.0x to 2.9x | 22 (3.2%) | 25 (3.6%) |
| 3.0x to 3.9x | 194 (28.1%) | 99 (14.1%) |
| 4.0x or more | 314 (45.5%) | 99 (14.1%) |
| Total | 690 (100.0%) | 702 (100.0%) |
Real Estate Taxes by Mortgage Status in Tolleson
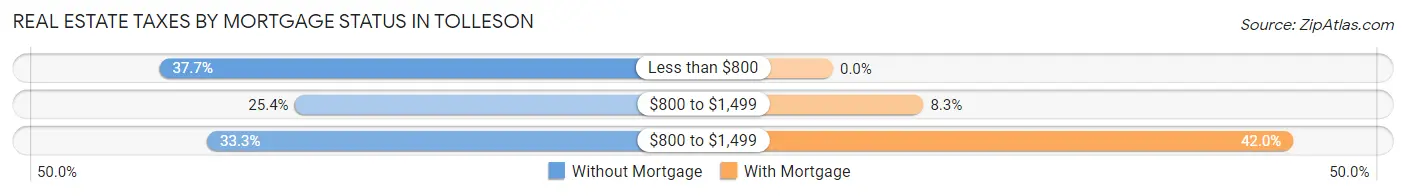
| Property Taxes | Without Mortgage | With Mortgage |
| Less than $800 | 260 (37.7%) | 0 (0.0%) |
| $800 to $1,499 | 175 (25.4%) | 58 (8.3%) |
| $800 to $1,499 | 230 (33.3%) | 295 (42.0%) |
| Total | 690 (100.0%) | 702 (100.0%) |
Health & Disability in Tolleson
Health Insurance Coverage by Age in Tolleson
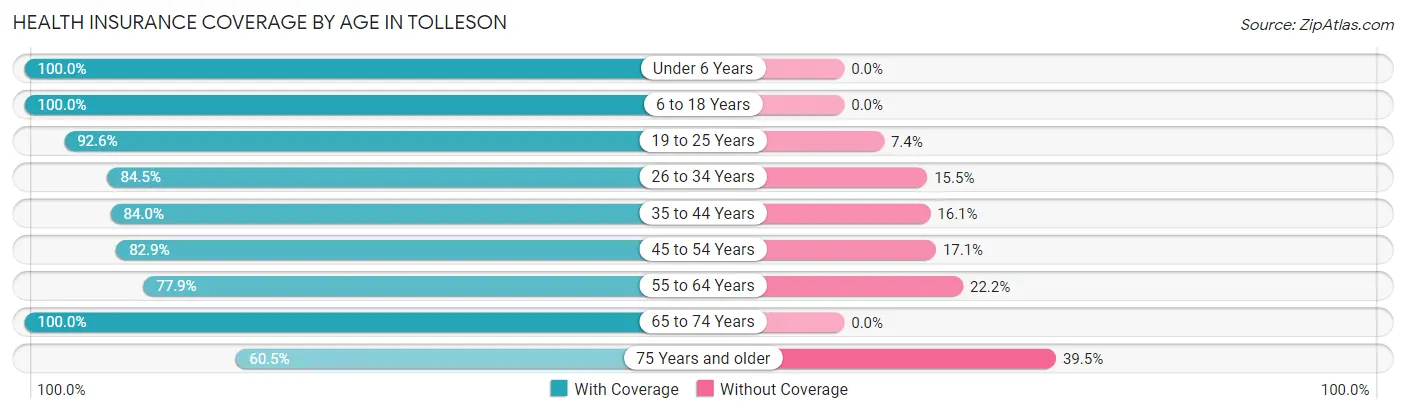
| Age Bracket | With Coverage | Without Coverage |
| Under 6 Years | 564 (100.0%) | 0 (0.0%) |
| 6 to 18 Years | 1,324 (100.0%) | 0 (0.0%) |
| 19 to 25 Years | 963 (92.6%) | 77 (7.4%) |
| 26 to 34 Years | 645 (84.5%) | 118 (15.5%) |
| 35 to 44 Years | 879 (84.0%) | 168 (16.1%) |
| 45 to 54 Years | 490 (82.9%) | 101 (17.1%) |
| 55 to 64 Years | 232 (77.8%) | 66 (22.2%) |
| 65 to 74 Years | 1,095 (100.0%) | 0 (0.0%) |
| 75 Years and older | 302 (60.5%) | 197 (39.5%) |
| Total | 6,494 (89.9%) | 727 (10.1%) |
Health Insurance Coverage by Citizenship Status in Tolleson
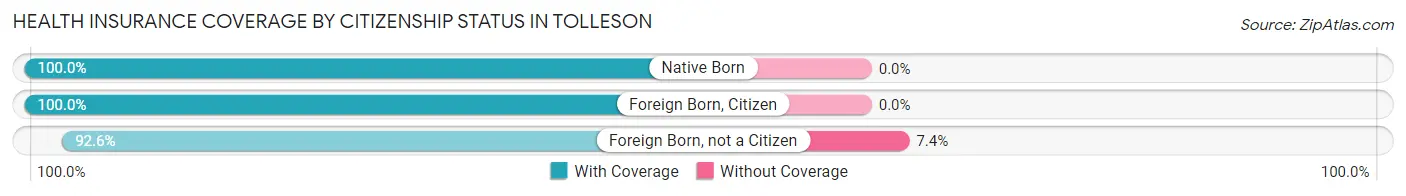
| Citizenship Status | With Coverage | Without Coverage |
| Native Born | 564 (100.0%) | 0 (0.0%) |
| Foreign Born, Citizen | 1,324 (100.0%) | 0 (0.0%) |
| Foreign Born, not a Citizen | 963 (92.6%) | 77 (7.4%) |
Health Insurance Coverage by Household Income in Tolleson
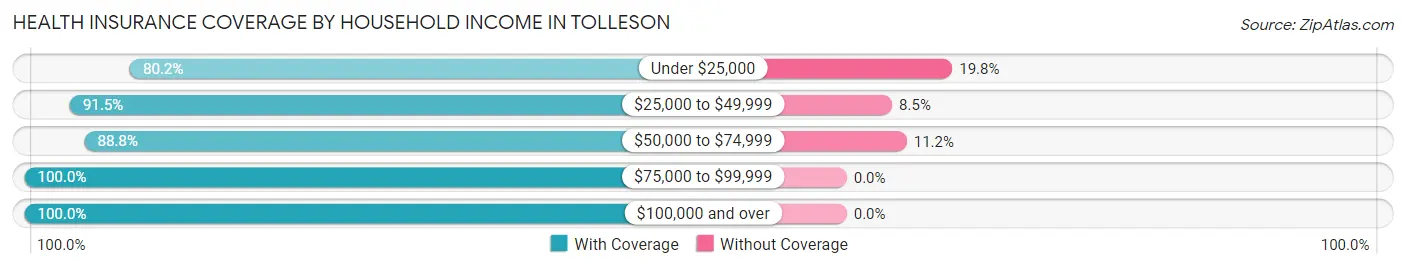
| Household Income | With Coverage | Without Coverage |
| Under $25,000 | 1,380 (80.2%) | 340 (19.8%) |
| $25,000 to $49,999 | 1,551 (91.5%) | 144 (8.5%) |
| $50,000 to $74,999 | 1,919 (88.8%) | 243 (11.2%) |
| $75,000 to $99,999 | 578 (100.0%) | 0 (0.0%) |
| $100,000 and over | 1,066 (100.0%) | 0 (0.0%) |
Public vs Private Health Insurance Coverage by Age in Tolleson
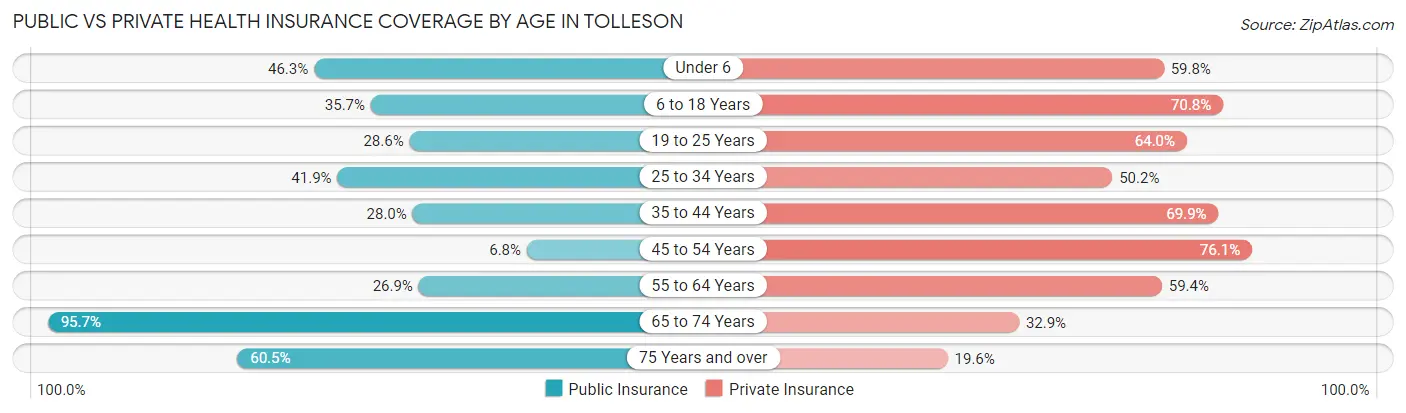
| Age Bracket | Public Insurance | Private Insurance |
| Under 6 | 261 (46.3%) | 337 (59.8%) |
| 6 to 18 Years | 473 (35.7%) | 937 (70.8%) |
| 19 to 25 Years | 297 (28.6%) | 666 (64.0%) |
| 25 to 34 Years | 320 (41.9%) | 383 (50.2%) |
| 35 to 44 Years | 293 (28.0%) | 732 (69.9%) |
| 45 to 54 Years | 40 (6.8%) | 450 (76.1%) |
| 55 to 64 Years | 80 (26.9%) | 177 (59.4%) |
| 65 to 74 Years | 1,048 (95.7%) | 360 (32.9%) |
| 75 Years and over | 302 (60.5%) | 98 (19.6%) |
| Total | 3,114 (43.1%) | 4,140 (57.3%) |
Disability Status by Sex by Age in Tolleson
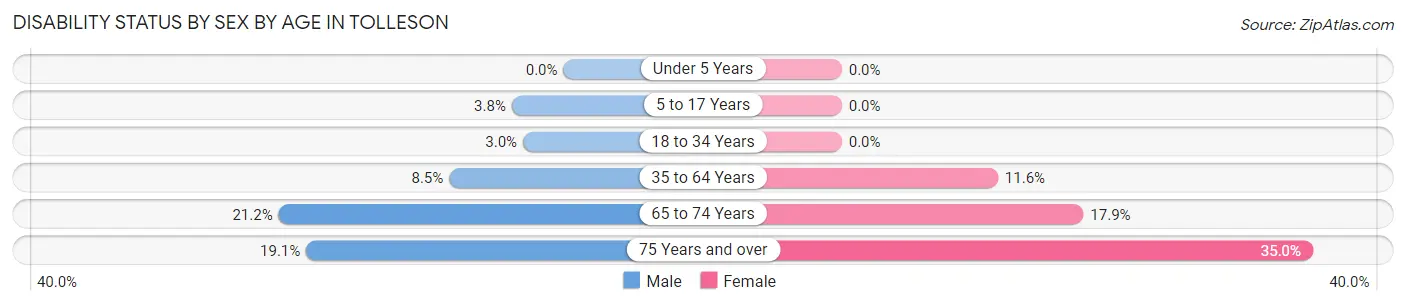
| Age Bracket | Male | Female |
| Under 5 Years | 0 (0.0%) | 0 (0.0%) |
| 5 to 17 Years | 26 (3.8%) | 0 (0.0%) |
| 18 to 34 Years | 27 (3.0%) | 0 (0.0%) |
| 35 to 64 Years | 61 (8.5%) | 141 (11.6%) |
| 65 to 74 Years | 96 (21.1%) | 115 (17.9%) |
| 75 Years and over | 68 (19.1%) | 50 (35.0%) |
Disability Class by Sex by Age in Tolleson
Disability Class: Hearing Difficulty
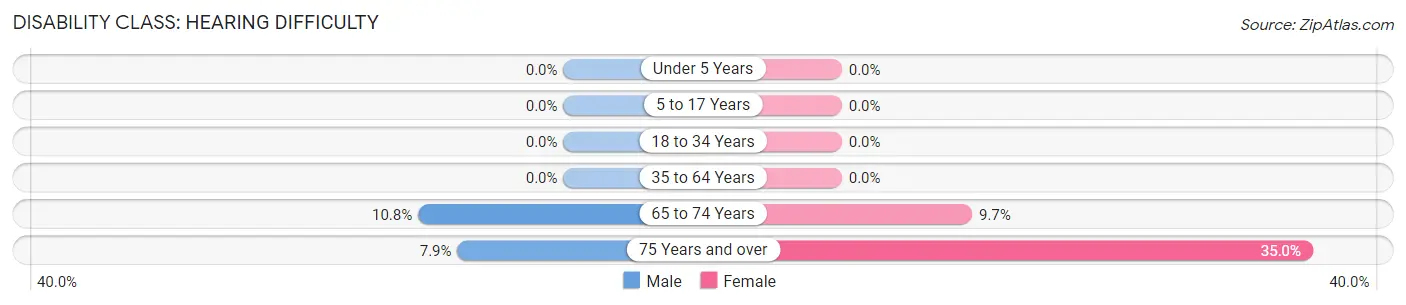
| Age Bracket | Male | Female |
| Under 5 Years | 0 (0.0%) | 0 (0.0%) |
| 5 to 17 Years | 0 (0.0%) | 0 (0.0%) |
| 18 to 34 Years | 0 (0.0%) | 0 (0.0%) |
| 35 to 64 Years | 0 (0.0%) | 0 (0.0%) |
| 65 to 74 Years | 49 (10.8%) | 62 (9.7%) |
| 75 Years and over | 28 (7.9%) | 50 (35.0%) |
Disability Class: Vision Difficulty
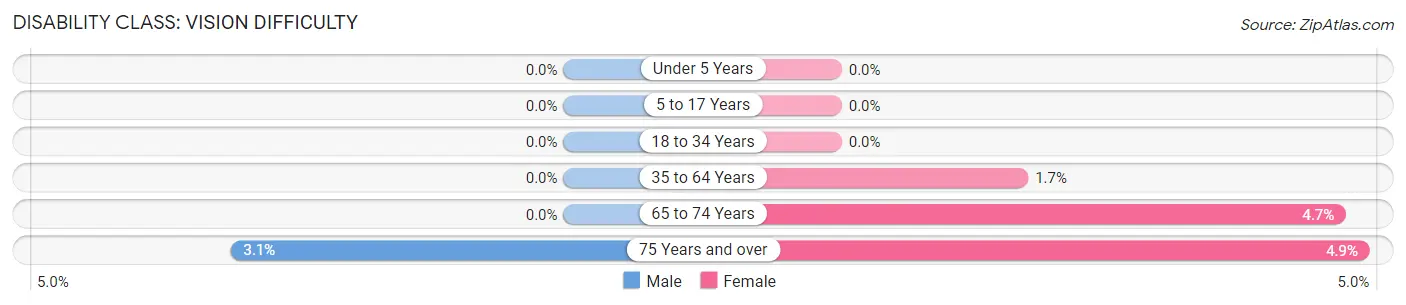
| Age Bracket | Male | Female |
| Under 5 Years | 0 (0.0%) | 0 (0.0%) |
| 5 to 17 Years | 0 (0.0%) | 0 (0.0%) |
| 18 to 34 Years | 0 (0.0%) | 0 (0.0%) |
| 35 to 64 Years | 0 (0.0%) | 21 (1.7%) |
| 65 to 74 Years | 0 (0.0%) | 30 (4.7%) |
| 75 Years and over | 11 (3.1%) | 7 (4.9%) |
Disability Class: Cognitive Difficulty
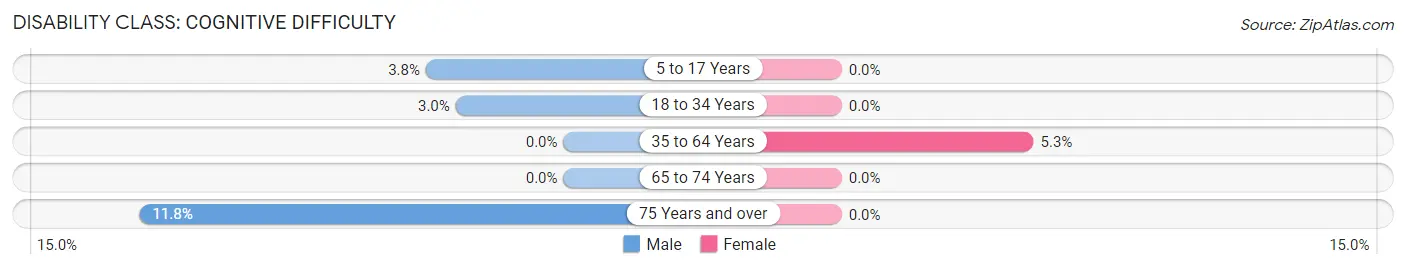
| Age Bracket | Male | Female |
| 5 to 17 Years | 26 (3.8%) | 0 (0.0%) |
| 18 to 34 Years | 27 (3.0%) | 0 (0.0%) |
| 35 to 64 Years | 0 (0.0%) | 65 (5.3%) |
| 65 to 74 Years | 0 (0.0%) | 0 (0.0%) |
| 75 Years and over | 42 (11.8%) | 0 (0.0%) |
Disability Class: Ambulatory Difficulty
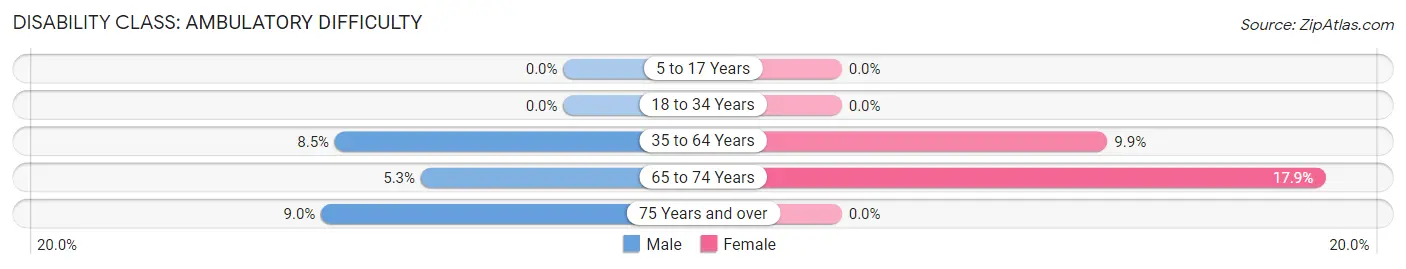
| Age Bracket | Male | Female |
| 5 to 17 Years | 0 (0.0%) | 0 (0.0%) |
| 18 to 34 Years | 0 (0.0%) | 0 (0.0%) |
| 35 to 64 Years | 61 (8.5%) | 120 (9.9%) |
| 65 to 74 Years | 24 (5.3%) | 115 (17.9%) |
| 75 Years and over | 32 (9.0%) | 0 (0.0%) |
Disability Class: Self-Care Difficulty
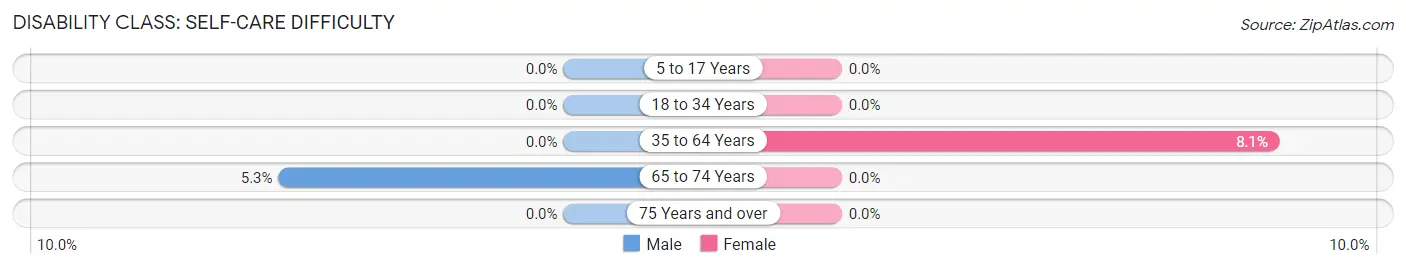
| Age Bracket | Male | Female |
| 5 to 17 Years | 0 (0.0%) | 0 (0.0%) |
| 18 to 34 Years | 0 (0.0%) | 0 (0.0%) |
| 35 to 64 Years | 0 (0.0%) | 99 (8.1%) |
| 65 to 74 Years | 24 (5.3%) | 0 (0.0%) |
| 75 Years and over | 0 (0.0%) | 0 (0.0%) |
Technology Access in Tolleson
Computing Device Access in Tolleson
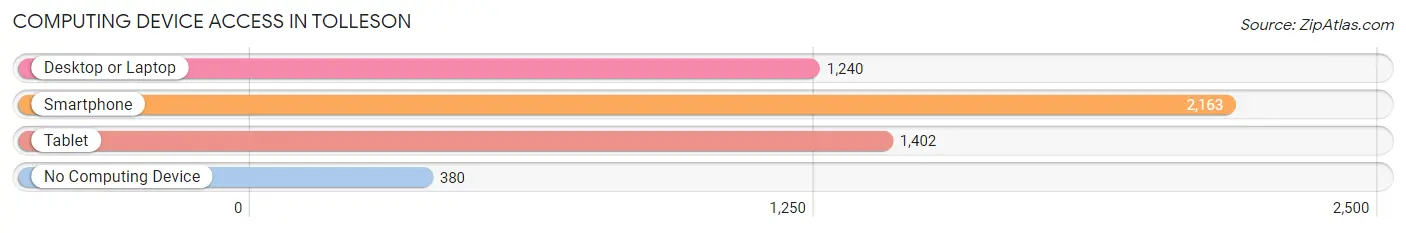
| Device Type | # Households | % Households |
| Desktop or Laptop | 1,240 | 48.3% |
| Smartphone | 2,163 | 84.2% |
| Tablet | 1,402 | 54.6% |
| No Computing Device | 380 | 14.8% |
| Total | 2,569 | 100.0% |
Internet Access in Tolleson
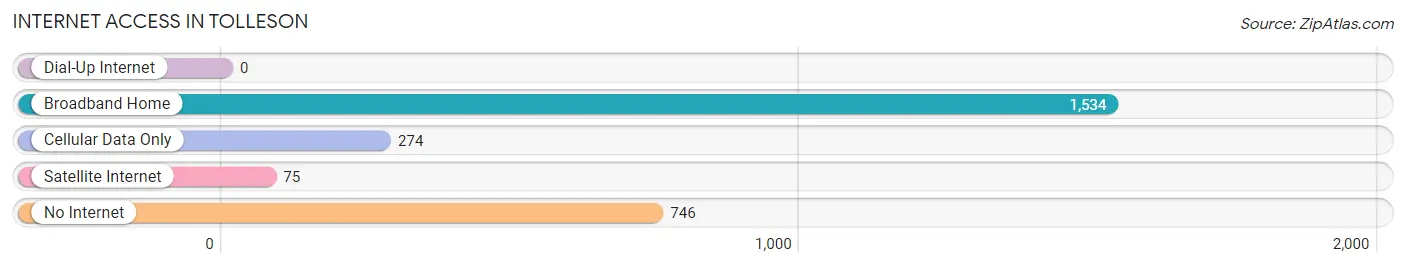
| Internet Type | # Households | % Households |
| Dial-Up Internet | 0 | 0.0% |
| Broadband Home | 1,534 | 59.7% |
| Cellular Data Only | 274 | 10.7% |
| Satellite Internet | 75 | 2.9% |
| No Internet | 746 | 29.0% |
| Total | 2,569 | 100.0% |
Tolleson Summary
Tolleson, Arizona is a small city located in Maricopa County, Arizona. It is part of the Phoenix metropolitan area and is located about 15 miles west of downtown Phoenix. The city was founded in 1912 and incorporated in 1929. As of the 2010 census, the population of Tolleson was 6,545.
Geography
Tolleson is located at 33°26′N 112°17′W (33.4333, -112.2833). It is situated in the Salt River Valley, near the confluence of the Gila and Salt Rivers. The city is bordered by Avondale to the north, Goodyear to the east, and Laveen to the south. The city covers an area of 8.2 square miles, all of which is land.
Climate
Tolleson has a hot desert climate, with hot summers and mild winters. The average high temperature in July is 106°F, and the average low temperature in January is 43°F. The average annual precipitation is 8.2 inches.
Demographics
As of the 2010 census, there were 6,545 people, 2,072 households, and 1,541 families residing in the city. The population density was 797.3 people per square mile. The racial makeup of the city was 63.2% White, 2.3% African American, 1.2% Native American, 0.7% Asian, 0.1% Pacific Islander, 30.2% from other races, and 2.4% from two or more races. Hispanic or Latino of any race were 64.2% of the population.
Economy
Tolleson's economy is largely based on agriculture and light industry. The city is home to several large agricultural companies, including the Arizona Cotton Growers Association, the Arizona Dairymen's Association, and the Arizona Cattlemen's Association. The city is also home to several light industrial companies, including the Tolleson Refinery, the Tolleson Steel Company, and the Tolleson Plastics Company.
The city's largest employer is the Tolleson Union High School District, which employs over 1,000 people. Other major employers include the Arizona Department of Corrections, the Arizona Department of Transportation, and the Arizona Department of Public Safety.
Education
Tolleson is served by the Tolleson Union High School District, which operates four public high schools: Tolleson Union High School, Westview High School, Estrella Foothills High School, and Desert Edge High School. The city is also served by the Tolleson Elementary School District, which operates seven public elementary schools.
Conclusion
Tolleson, Arizona is a small city located in Maricopa County, Arizona. It is part of the Phoenix metropolitan area and is located about 15 miles west of downtown Phoenix. The city was founded in 1912 and incorporated in 1929. As of the 2010 census, the population of Tolleson was 6,545. The city has a hot desert climate, with hot summers and mild winters. The racial makeup of the city was 63.2% White, 2.3% African American, 1.2% Native American, 0.7% Asian, 0.1% Pacific Islander, 30.2% from other races, and 2.4% from two or more races. Hispanic or Latino of any race were 64.2% of the population. The city's economy is largely based on agriculture and light industry. The city is served by the Tolleson Union High School District, which operates four public high schools, and the Tolleson Elementary School District, which operates seven public elementary schools.
Common Questions
What is Per Capita Income in Tolleson?
Per Capita income in Tolleson is $20,563.
What is the Median Family Income in Tolleson?
Median Family Income in Tolleson is $48,100.
What is the Median Household income in Tolleson?
Median Household Income in Tolleson is $47,875.
What is Income or Wage Gap in Tolleson?
Income or Wage Gap in Tolleson is 55.5%.
Women in Tolleson earn 44.5 cents for every dollar earned by a man.
What is Inequality or Gini Index in Tolleson?
Inequality or Gini Index in Tolleson is 0.40.
What is the Total Population of Tolleson?
Total Population of Tolleson is 7,221.
What is the Total Male Population of Tolleson?
Total Male Population of Tolleson is 3,482.
What is the Total Female Population of Tolleson?
Total Female Population of Tolleson is 3,739.
What is the Ratio of Males per 100 Females in Tolleson?
There are 93.13 Males per 100 Females in Tolleson.
What is the Ratio of Females per 100 Males in Tolleson?
There are 107.38 Females per 100 Males in Tolleson.
What is the Median Population Age in Tolleson?
Median Population Age in Tolleson is 33.3 Years.
What is the Average Family Size in Tolleson
Average Family Size in Tolleson is 3.2 People.
What is the Average Household Size in Tolleson
Average Household Size in Tolleson is 2.8 People.
How Large is the Labor Force in Tolleson?
There are 2,875 People in the Labor Forcein in Tolleson.
What is the Percentage of People in the Labor Force in Tolleson?
50.1% of People are in the Labor Force in Tolleson.
What is the Unemployment Rate in Tolleson?
Unemployment Rate in Tolleson is 2.4%.