Florence, AZ Map & Demographics
Florence Map
Florence Overview
$24,151
PER CAPITA INCOME
$73,871
AVG FAMILY INCOME
$74,025
AVG HOUSEHOLD INCOME
11.1%
WAGE / INCOME GAP [ % ]
88.9¢/ $1
WAGE / INCOME GAP [ $ ]
0.42
INEQUALITY / GINI INDEX
25,783
TOTAL POPULATION
19,237
MALE POPULATION
6,546
FEMALE POPULATION
293.87
MALES / 100 FEMALES
34.03
FEMALES / 100 MALES
42.8
MEDIAN AGE
2.8
AVG FAMILY SIZE
2.3
AVG HOUSEHOLD SIZE
4,969
LABOR FORCE [ PEOPLE ]
20.6%
PERCENT IN LABOR FORCE
7.6%
UNEMPLOYMENT RATE
Florence Zip Codes
Florence Area Codes
Income in Florence
Income Overview in Florence
Per Capita Income in Florence is $24,151, while median incomes of families and households are $73,871 and $74,025 respectively.
| Characteristic | Number | Measure |
| Per Capita Income | 25,783 | $24,151 |
| Median Family Income | 3,580 | $73,871 |
| Mean Family Income | 3,580 | $99,347 |
| Median Household Income | 5,670 | $74,025 |
| Mean Household Income | 5,670 | $97,892 |
| Income Deficit | 3,580 | $0 |
| Wage / Income Gap (%) | 25,783 | 11.06% |
| Wage / Income Gap ($) | 25,783 | 88.94¢ per $1 |
| Gini / Inequality Index | 25,783 | 0.42 |
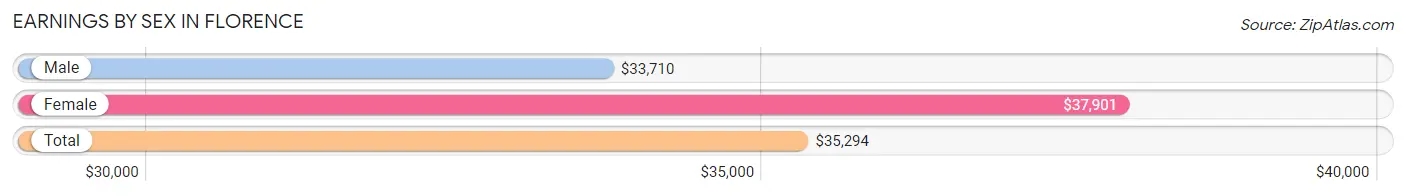
Earnings by Sex in Florence
Average Earnings in Florence are $35,294, $33,710 for men and $37,901 for women, a difference of 11.1%.
| Sex | Number | Average Earnings |
| Male | 4,684 (67.3%) | $33,710 |
| Female | 2,278 (32.7%) | $37,901 |
| Total | 6,962 (100.0%) | $35,294 |
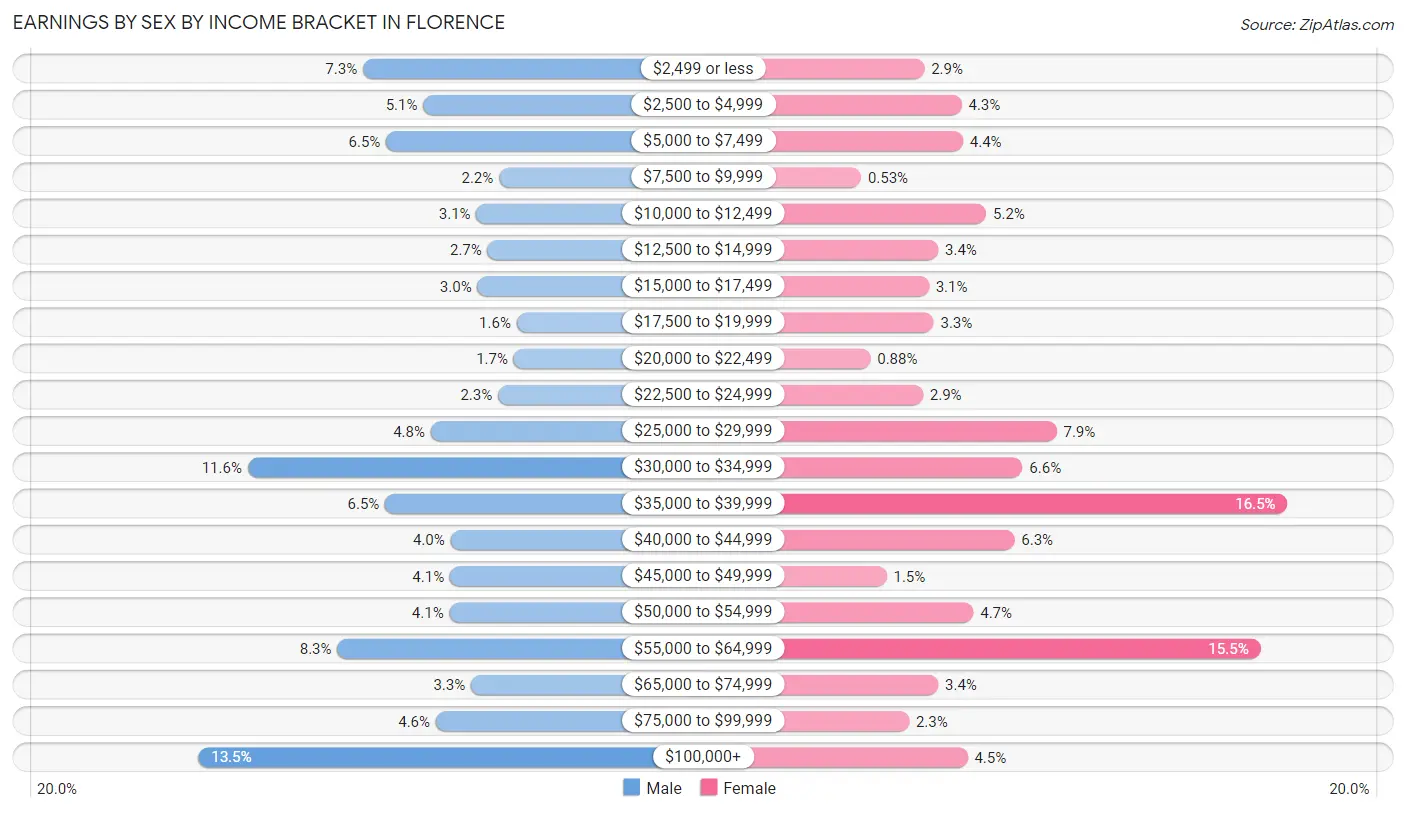
Earnings by Sex by Income Bracket in Florence
The most common earnings brackets in Florence are $100,000+ for men (632 | 13.5%) and $35,000 to $39,999 for women (376 | 16.5%).
| Income | Male | Female |
| $2,499 or less | 343 (7.3%) | 66 (2.9%) |
| $2,500 to $4,999 | 237 (5.1%) | 98 (4.3%) |
| $5,000 to $7,499 | 302 (6.5%) | 99 (4.3%) |
| $7,500 to $9,999 | 104 (2.2%) | 12 (0.5%) |
| $10,000 to $12,499 | 144 (3.1%) | 119 (5.2%) |
| $12,500 to $14,999 | 124 (2.6%) | 78 (3.4%) |
| $15,000 to $17,499 | 142 (3.0%) | 70 (3.1%) |
| $17,500 to $19,999 | 73 (1.6%) | 74 (3.3%) |
| $20,000 to $22,499 | 78 (1.7%) | 20 (0.9%) |
| $22,500 to $24,999 | 106 (2.3%) | 65 (2.9%) |
| $25,000 to $29,999 | 224 (4.8%) | 179 (7.9%) |
| $30,000 to $34,999 | 545 (11.6%) | 150 (6.6%) |
| $35,000 to $39,999 | 304 (6.5%) | 376 (16.5%) |
| $40,000 to $44,999 | 189 (4.0%) | 143 (6.3%) |
| $45,000 to $49,999 | 190 (4.1%) | 34 (1.5%) |
| $50,000 to $54,999 | 191 (4.1%) | 108 (4.7%) |
| $55,000 to $64,999 | 388 (8.3%) | 353 (15.5%) |
| $65,000 to $74,999 | 153 (3.3%) | 78 (3.4%) |
| $75,000 to $99,999 | 215 (4.6%) | 53 (2.3%) |
| $100,000+ | 632 (13.5%) | 103 (4.5%) |
| Total | 4,684 (100.0%) | 2,278 (100.0%) |
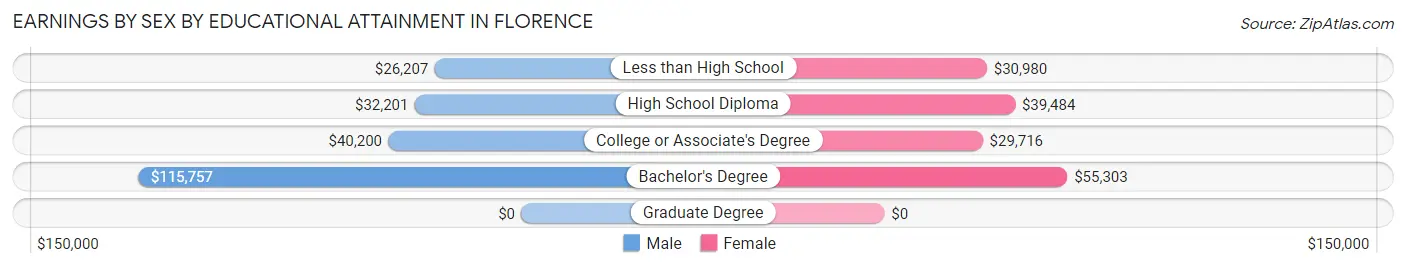
Earnings by Sex by Educational Attainment in Florence
Average earnings in Florence are $35,452 for men and $39,204 for women, a difference of 9.6%. Men with an educational attainment of bachelor's degree enjoy the highest average annual earnings of $115,757, while those with less than high school education earn the least with $26,207. Women with an educational attainment of bachelor's degree earn the most with the average annual earnings of $55,303, while those with college or associate's degree education have the smallest earnings of $29,716.
| Educational Attainment | Male Income | Female Income |
| Less than High School | $26,207 | $30,980 |
| High School Diploma | $32,201 | $39,484 |
| College or Associate's Degree | $40,200 | $29,716 |
| Bachelor's Degree | $115,757 | $55,303 |
| Graduate Degree | - | - |
| Total | $35,452 | $39,204 |
Family Income in Florence
Family Income Brackets in Florence
According to the Florence family income data, there are 952 families falling into the $50,000 to $74,999 income range, which is the most common income bracket and makes up 26.6% of all families. Conversely, the $10,000 to $14,999 income bracket is the least frequent group with only 4 families (0.1%) belonging to this category.
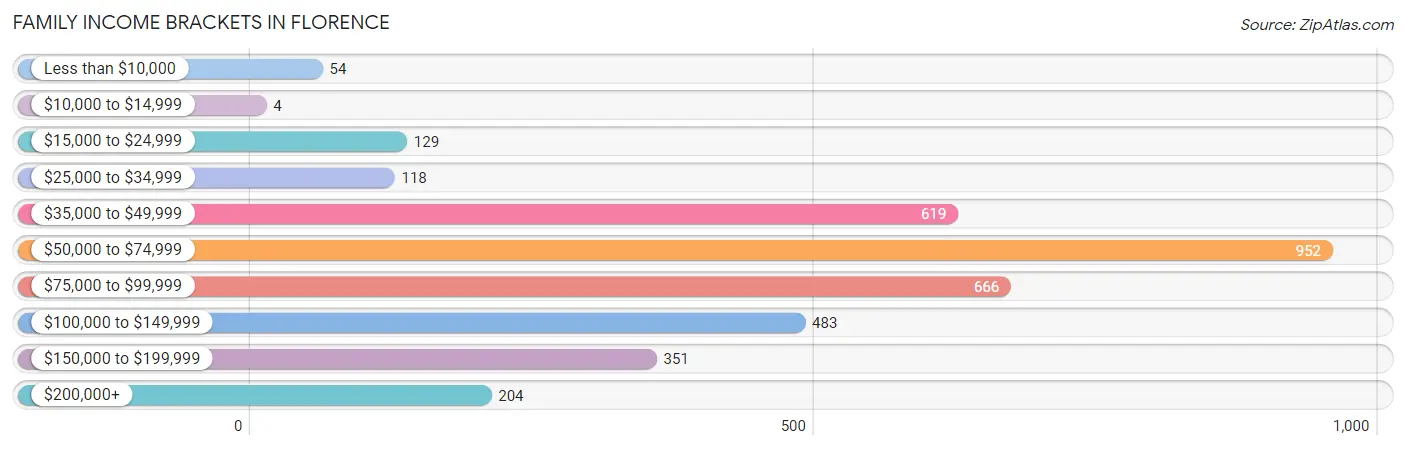
| Income Bracket | # Families | % Families |
| Less than $10,000 | 54 | 1.5% |
| $10,000 to $14,999 | 4 | 0.1% |
| $15,000 to $24,999 | 129 | 3.6% |
| $25,000 to $34,999 | 118 | 3.3% |
| $35,000 to $49,999 | 619 | 17.3% |
| $50,000 to $74,999 | 952 | 26.6% |
| $75,000 to $99,999 | 666 | 18.6% |
| $100,000 to $149,999 | 483 | 13.5% |
| $150,000 to $199,999 | 351 | 9.8% |
| $200,000+ | 204 | 5.7% |
Family Income by Famaliy Size in Florence
7+ person families (52 | 1.5%) account for the highest median family income in Florence with $155,862 per family, while 2-person families (2,413 | 67.4%) have the highest median income of $35,816 per family member.
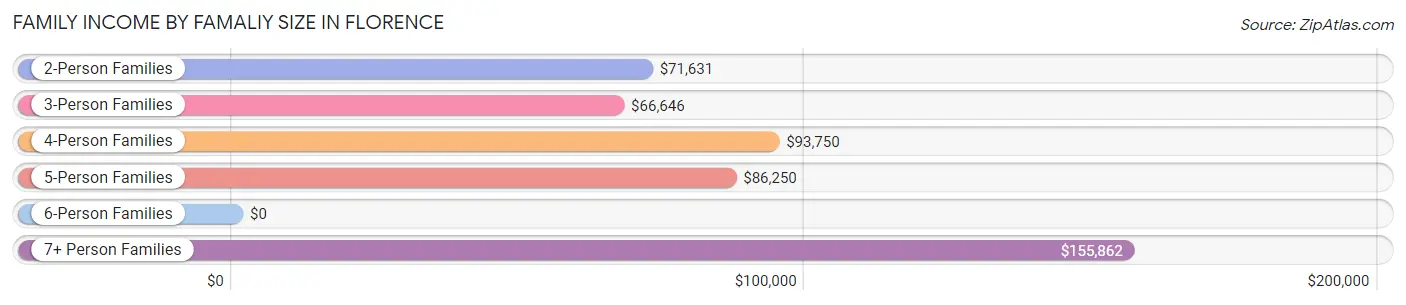
| Income Bracket | # Families | Median Income |
| 2-Person Families | 2,413 (67.4%) | $71,631 |
| 3-Person Families | 410 (11.5%) | $66,646 |
| 4-Person Families | 475 (13.3%) | $93,750 |
| 5-Person Families | 74 (2.1%) | $86,250 |
| 6-Person Families | 156 (4.4%) | $0 |
| 7+ Person Families | 52 (1.5%) | $155,862 |
| Total | 3,580 (100.0%) | $73,871 |
Family Income by Number of Earners in Florence
The median family income in Florence is $73,871, with families comprising 3+ earners (275) having the highest median family income of $118,451, while families with no earners (1,707) have the lowest median family income of $64,641, accounting for 7.7% and 47.7% of families, respectively.
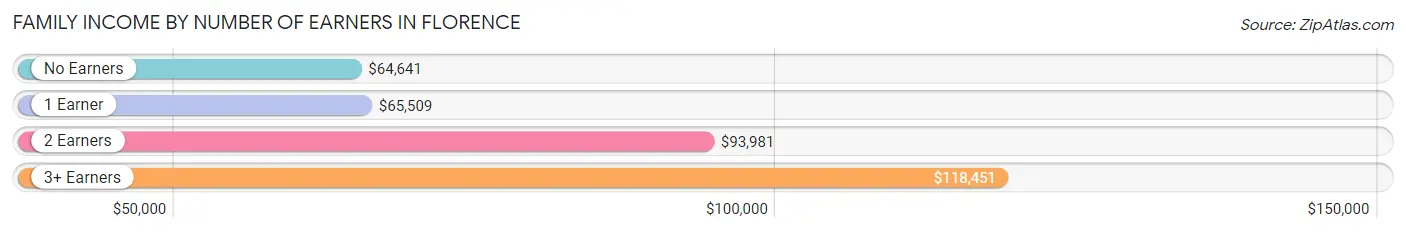
| Number of Earners | # Families | Median Income |
| No Earners | 1,707 (47.7%) | $64,641 |
| 1 Earner | 788 (22.0%) | $65,509 |
| 2 Earners | 810 (22.6%) | $93,981 |
| 3+ Earners | 275 (7.7%) | $118,451 |
| Total | 3,580 (100.0%) | $73,871 |
Household Income in Florence
Household Income Brackets in Florence
With 1,174 households falling in the category, the $50,000 to $74,999 income range is the most frequent in Florence, accounting for 20.7% of all households. In contrast, only 40 households (0.7%) fall into the $10,000 to $14,999 income bracket, making it the least populous group.
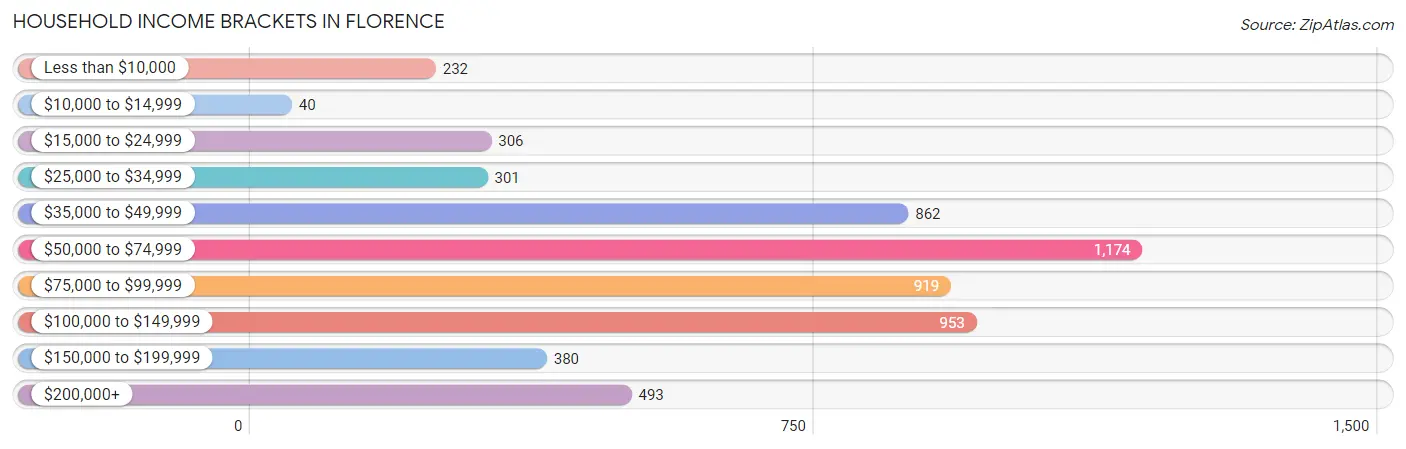
| Income Bracket | # Households | % Households |
| Less than $10,000 | 232 | 4.1% |
| $10,000 to $14,999 | 40 | 0.7% |
| $15,000 to $24,999 | 306 | 5.4% |
| $25,000 to $34,999 | 301 | 5.3% |
| $35,000 to $49,999 | 862 | 15.2% |
| $50,000 to $74,999 | 1,174 | 20.7% |
| $75,000 to $99,999 | 919 | 16.2% |
| $100,000 to $149,999 | 953 | 16.8% |
| $150,000 to $199,999 | 380 | 6.7% |
| $200,000+ | 493 | 8.7% |
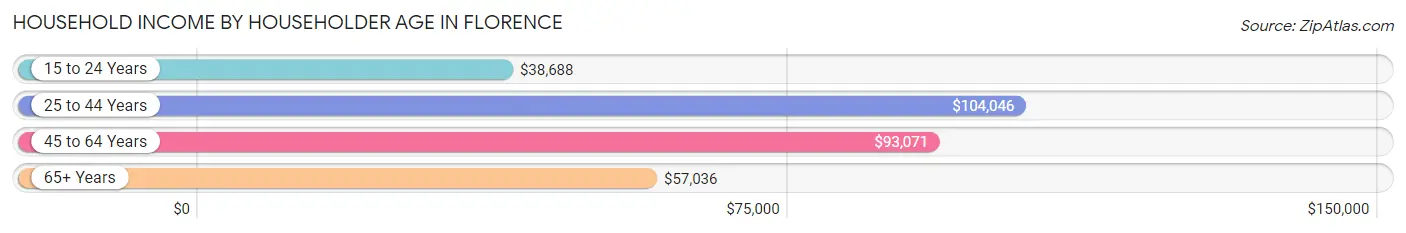
Household Income by Householder Age in Florence
The median household income in Florence is $74,025, with the highest median household income of $104,046 found in the 25 to 44 years age bracket for the primary householder. A total of 1,217 households (21.5%) fall into this category. Meanwhile, the 15 to 24 years age bracket for the primary householder has the lowest median household income of $38,688, with 69 households (1.2%) in this group.
| Income Bracket | # Households | Median Income |
| 15 to 24 Years | 69 (1.2%) | $38,688 |
| 25 to 44 Years | 1,217 (21.5%) | $104,046 |
| 45 to 64 Years | 1,721 (30.3%) | $93,071 |
| 65+ Years | 2,663 (47.0%) | $57,036 |
| Total | 5,670 (100.0%) | $74,025 |
Poverty in Florence
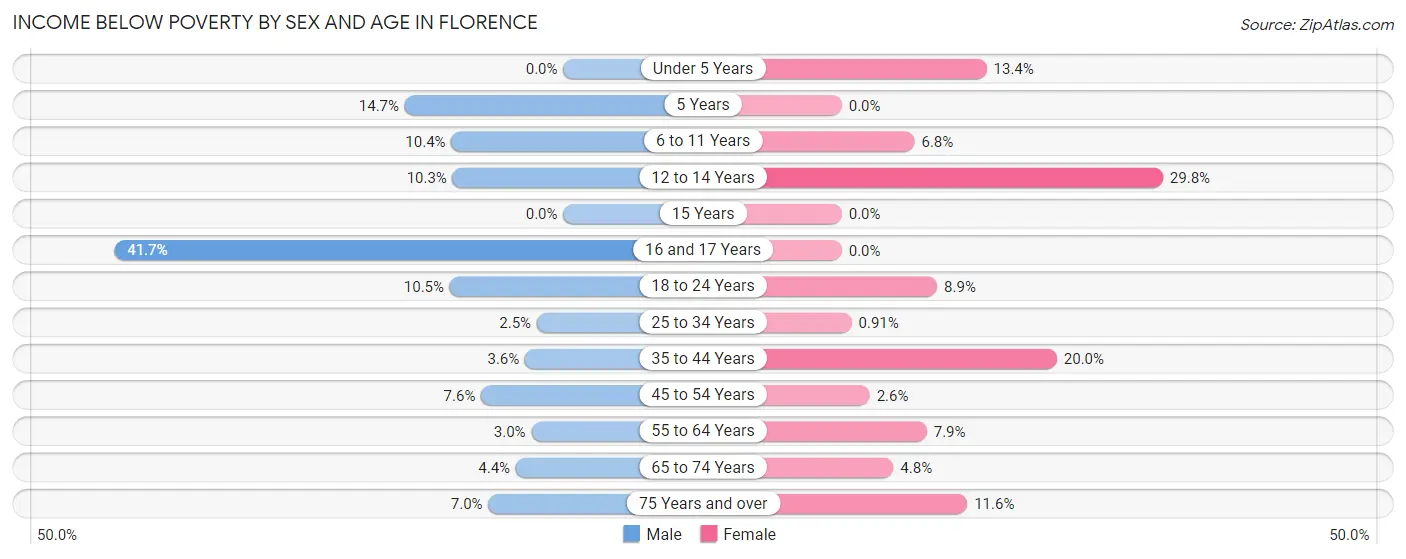
Income Below Poverty by Sex and Age in Florence
With 5.5% poverty level for males and 8.2% for females among the residents of Florence, 16 and 17 year old males and 12 to 14 year old females are the most vulnerable to poverty, with 10 males (41.7%) and 45 females (29.8%) in their respective age groups living below the poverty level.
| Age Bracket | Male | Female |
| Under 5 Years | 0 (0.0%) | 25 (13.4%) |
| 5 Years | 10 (14.7%) | 0 (0.0%) |
| 6 to 11 Years | 40 (10.4%) | 22 (6.8%) |
| 12 to 14 Years | 23 (10.3%) | 45 (29.8%) |
| 15 Years | 0 (0.0%) | 0 (0.0%) |
| 16 and 17 Years | 10 (41.7%) | 0 (0.0%) |
| 18 to 24 Years | 42 (10.5%) | 34 (8.8%) |
| 25 to 34 Years | 20 (2.5%) | 6 (0.9%) |
| 35 to 44 Years | 20 (3.5%) | 105 (20.0%) |
| 45 to 54 Years | 43 (7.6%) | 9 (2.6%) |
| 55 to 64 Years | 35 (3.0%) | 102 (7.9%) |
| 65 to 74 Years | 56 (4.4%) | 72 (4.8%) |
| 75 Years and over | 68 (7.0%) | 103 (11.6%) |
| Total | 367 (5.5%) | 523 (8.2%) |
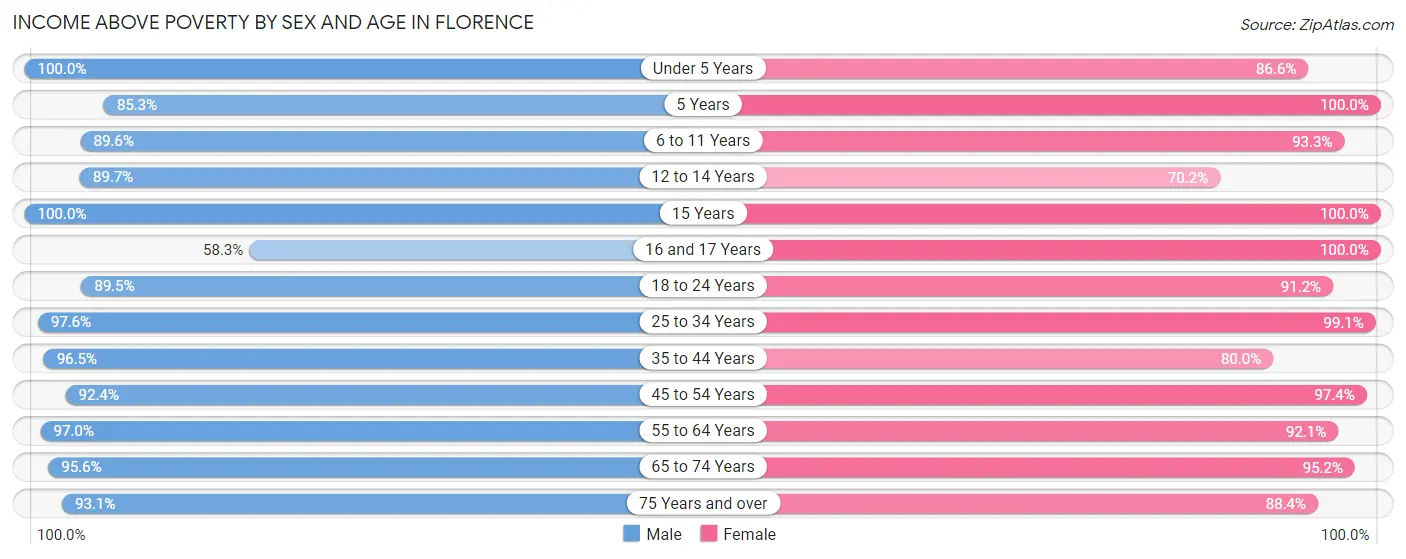
Income Above Poverty by Sex and Age in Florence
According to the poverty statistics in Florence, males aged under 5 years and females aged 5 years are the age groups that are most secure financially, with 100.0% of males and 100.0% of females in these age groups living above the poverty line.
| Age Bracket | Male | Female |
| Under 5 Years | 200 (100.0%) | 161 (86.6%) |
| 5 Years | 58 (85.3%) | 98 (100.0%) |
| 6 to 11 Years | 345 (89.6%) | 304 (93.2%) |
| 12 to 14 Years | 201 (89.7%) | 106 (70.2%) |
| 15 Years | 2 (100.0%) | 5 (100.0%) |
| 16 and 17 Years | 14 (58.3%) | 37 (100.0%) |
| 18 to 24 Years | 357 (89.5%) | 350 (91.1%) |
| 25 to 34 Years | 797 (97.6%) | 655 (99.1%) |
| 35 to 44 Years | 544 (96.5%) | 421 (80.0%) |
| 45 to 54 Years | 521 (92.4%) | 338 (97.4%) |
| 55 to 64 Years | 1,149 (97.0%) | 1,191 (92.1%) |
| 65 to 74 Years | 1,217 (95.6%) | 1,431 (95.2%) |
| 75 Years and over | 910 (93.0%) | 782 (88.4%) |
| Total | 6,315 (94.5%) | 5,879 (91.8%) |
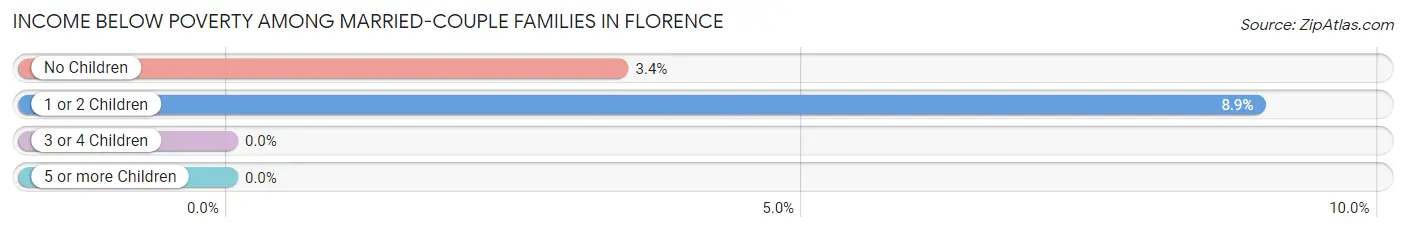
Income Below Poverty Among Married-Couple Families in Florence
The poverty statistics for married-couple families in Florence show that 4.1% or 123 of the total 3,003 families live below the poverty line. Families with 1 or 2 children have the highest poverty rate of 8.9%, comprising of 42 families. On the other hand, families with 3 or 4 children have the lowest poverty rate of 0.0%, which includes 0 families.
| Children | Above Poverty | Below Poverty |
| No Children | 2,304 (96.6%) | 81 (3.4%) |
| 1 or 2 Children | 428 (91.1%) | 42 (8.9%) |
| 3 or 4 Children | 148 (100.0%) | 0 (0.0%) |
| 5 or more Children | 0 (0.0%) | 0 (0.0%) |
| Total | 2,880 (95.9%) | 123 (4.1%) |
Income Below Poverty Among Single-Parent Households in Florence
According to the poverty data in Florence, 5.6% or 12 single-father households and 8.0% or 29 single-mother households are living below the poverty line. Among single-father households, those with 5 or more children have the highest poverty rate, with 12 households (100.0%) experiencing poverty. Likewise, among single-mother households, those with 3 or 4 children have the highest poverty rate, with 22 households (45.8%) falling below the poverty line.
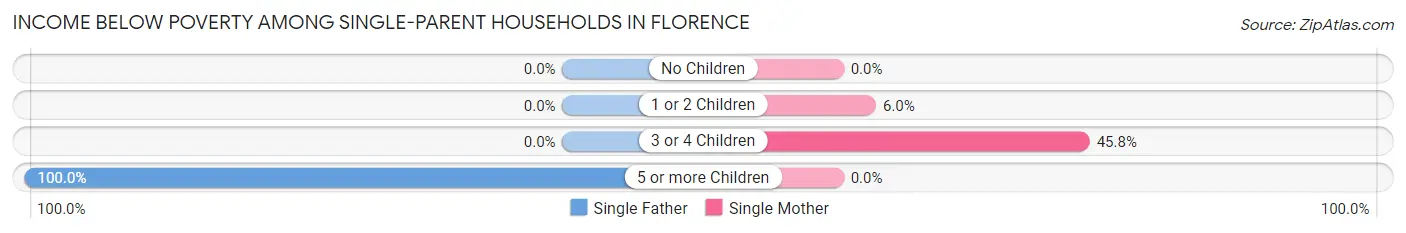
| Children | Single Father | Single Mother |
| No Children | 0 (0.0%) | 0 (0.0%) |
| 1 or 2 Children | 0 (0.0%) | 7 (6.0%) |
| 3 or 4 Children | 0 (0.0%) | 22 (45.8%) |
| 5 or more Children | 12 (100.0%) | 0 (0.0%) |
| Total | 12 (5.6%) | 29 (8.0%) |
Income Below Poverty Among Married-Couple vs Single-Parent Households in Florence
The poverty data for Florence shows that 123 of the married-couple family households (4.1%) and 41 of the single-parent households (7.1%) are living below the poverty level. Within the married-couple family households, those with 1 or 2 children have the highest poverty rate, with 42 households (8.9%) falling below the poverty line. Among the single-parent households, those with 5 or more children have the highest poverty rate, with 12 household (100.0%) living below poverty.
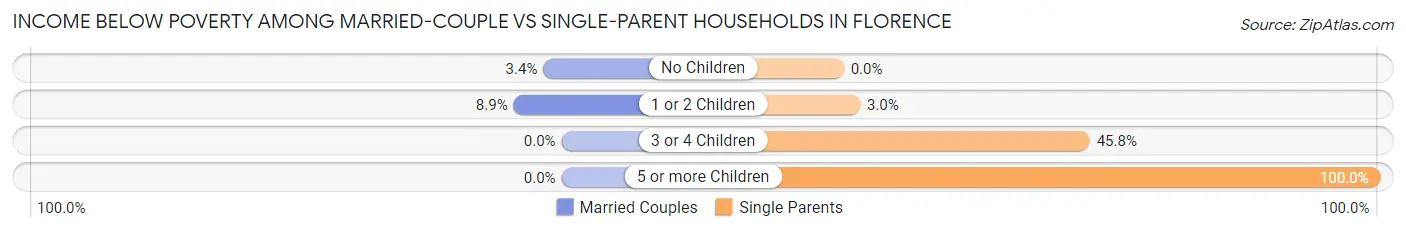
| Children | Married-Couple Families | Single-Parent Households |
| No Children | 81 (3.4%) | 0 (0.0%) |
| 1 or 2 Children | 42 (8.9%) | 7 (3.0%) |
| 3 or 4 Children | 0 (0.0%) | 22 (45.8%) |
| 5 or more Children | 0 (0.0%) | 12 (100.0%) |
| Total | 123 (4.1%) | 41 (7.1%) |
Race in Florence
The most populous races in Florence are White / Caucasian (16,982 | 65.9%), Hispanic or Latino (8,983 | 34.8%), and Some other Race (3,384 | 13.1%).
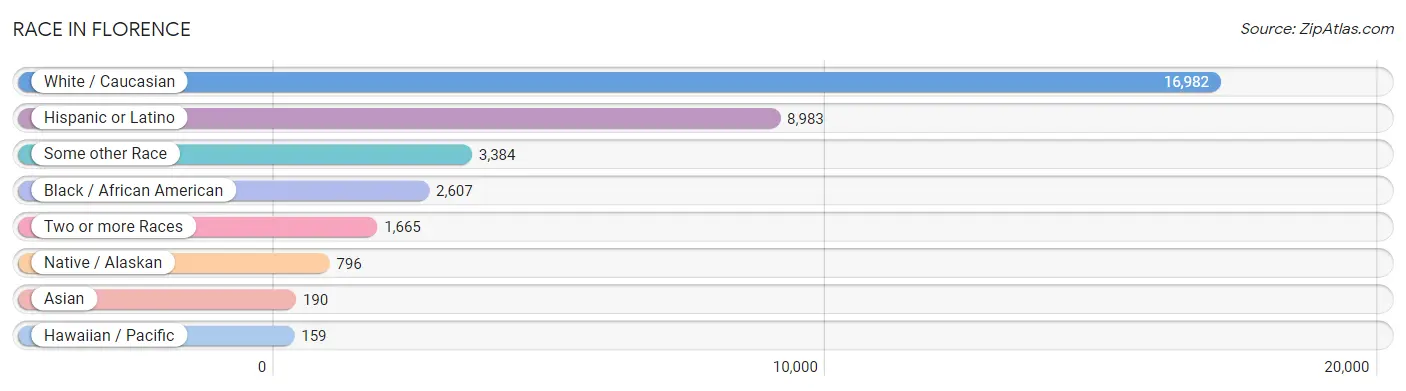
| Race | # Population | % Population |
| Asian | 190 | 0.7% |
| Black / African American | 2,607 | 10.1% |
| Hawaiian / Pacific | 159 | 0.6% |
| Hispanic or Latino | 8,983 | 34.8% |
| Native / Alaskan | 796 | 3.1% |
| White / Caucasian | 16,982 | 65.9% |
| Two or more Races | 1,665 | 6.5% |
| Some other Race | 3,384 | 13.1% |
| Total | 25,783 | 100.0% |
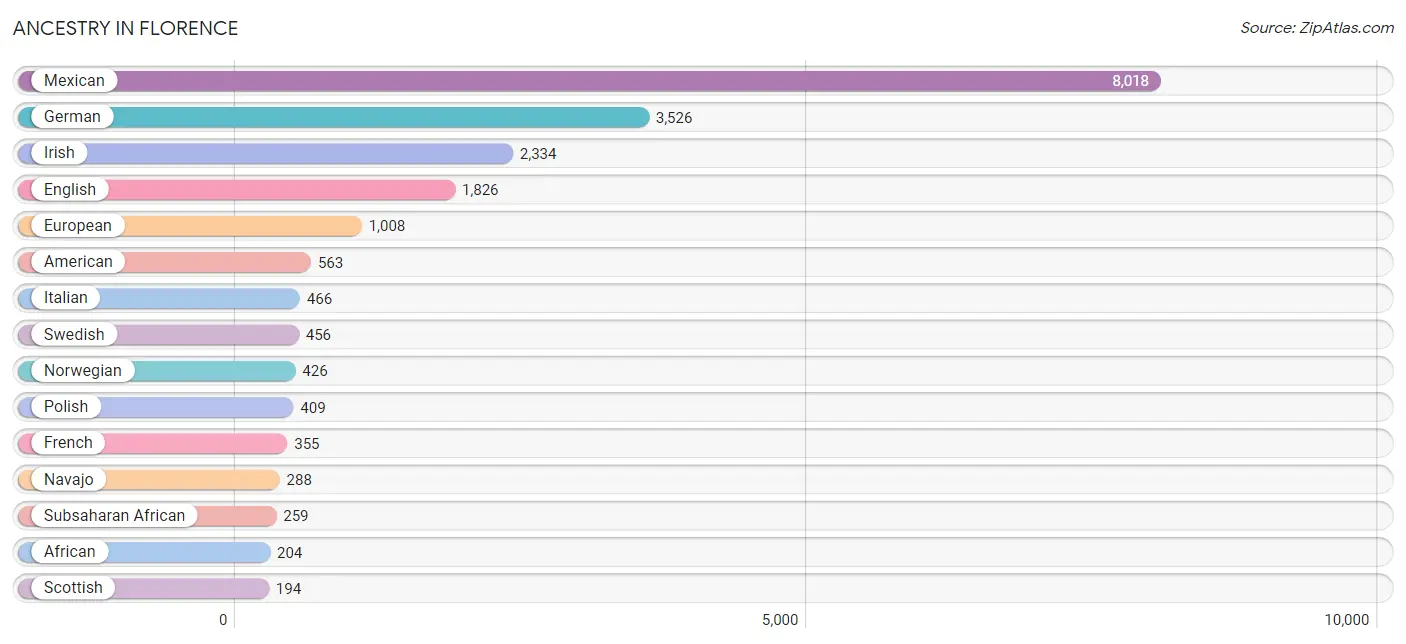
Ancestry in Florence
The most populous ancestries reported in Florence are Mexican (8,018 | 31.1%), German (3,526 | 13.7%), Irish (2,334 | 9.0%), English (1,826 | 7.1%), and European (1,008 | 3.9%), together accounting for 64.8% of all Florence residents.
| Ancestry | # Population | % Population |
| African | 204 | 0.8% |
| Alaskan Athabascan | 9 | 0.0% |
| American | 563 | 2.2% |
| Apache | 28 | 0.1% |
| Arab | 56 | 0.2% |
| Armenian | 25 | 0.1% |
| Australian | 31 | 0.1% |
| Austrian | 16 | 0.1% |
| Belizean | 9 | 0.0% |
| Bhutanese | 61 | 0.2% |
| Blackfeet | 32 | 0.1% |
| British | 76 | 0.3% |
| Central American | 143 | 0.5% |
| Cherokee | 72 | 0.3% |
| Chippewa | 7 | 0.0% |
| Choctaw | 37 | 0.1% |
| Colombian | 9 | 0.0% |
| Croatian | 11 | 0.0% |
| Cuban | 105 | 0.4% |
| Czech | 61 | 0.2% |
| Danish | 116 | 0.4% |
| Dutch | 176 | 0.7% |
| Dutch West Indian | 14 | 0.1% |
| Eastern European | 20 | 0.1% |
| English | 1,826 | 7.1% |
| Ethiopian | 9 | 0.0% |
| European | 1,008 | 3.9% |
| Finnish | 12 | 0.1% |
| French | 355 | 1.4% |
| French Canadian | 81 | 0.3% |
| German | 3,526 | 13.7% |
| Greek | 11 | 0.0% |
| Guamanian / Chamorro | 25 | 0.1% |
| Guatemalan | 68 | 0.3% |
| Guyanese | 9 | 0.0% |
| Haitian | 10 | 0.0% |
| Honduran | 47 | 0.2% |
| Hopi | 9 | 0.0% |
| Hungarian | 109 | 0.4% |
| Indian (Asian) | 174 | 0.7% |
| Iranian | 18 | 0.1% |
| Iraqi | 19 | 0.1% |
| Irish | 2,334 | 9.0% |
| Italian | 466 | 1.8% |
| Jamaican | 29 | 0.1% |
| Japanese | 24 | 0.1% |
| Korean | 101 | 0.4% |
| Lithuanian | 29 | 0.1% |
| Luxembourger | 15 | 0.1% |
| Mexican | 8,018 | 31.1% |
| Mexican American Indian | 9 | 0.0% |
| Moroccan | 9 | 0.0% |
| Native Hawaiian | 127 | 0.5% |
| Navajo | 288 | 1.1% |
| Nigerian | 7 | 0.0% |
| Northern European | 103 | 0.4% |
| Norwegian | 426 | 1.7% |
| Pakistani | 11 | 0.0% |
| Pima | 121 | 0.5% |
| Polish | 409 | 1.6% |
| Portuguese | 65 | 0.3% |
| Puerto Rican | 101 | 0.4% |
| Russian | 44 | 0.2% |
| Salvadoran | 28 | 0.1% |
| Scandinavian | 27 | 0.1% |
| Scotch-Irish | 92 | 0.4% |
| Scottish | 194 | 0.7% |
| Sioux | 12 | 0.1% |
| Slovak | 38 | 0.2% |
| South American | 9 | 0.0% |
| Spaniard | 133 | 0.5% |
| Spanish | 96 | 0.4% |
| Sri Lankan | 22 | 0.1% |
| Subsaharan African | 259 | 1.0% |
| Sudanese | 39 | 0.2% |
| Swedish | 456 | 1.8% |
| Swiss | 47 | 0.2% |
| Thai | 1 | 0.0% |
| Tohono O'Odham | 81 | 0.3% |
| Ukrainian | 38 | 0.2% |
| Welsh | 133 | 0.5% |
| Yaqui | 194 | 0.7% |
| Yuman | 23 | 0.1% | View All 83 Rows |
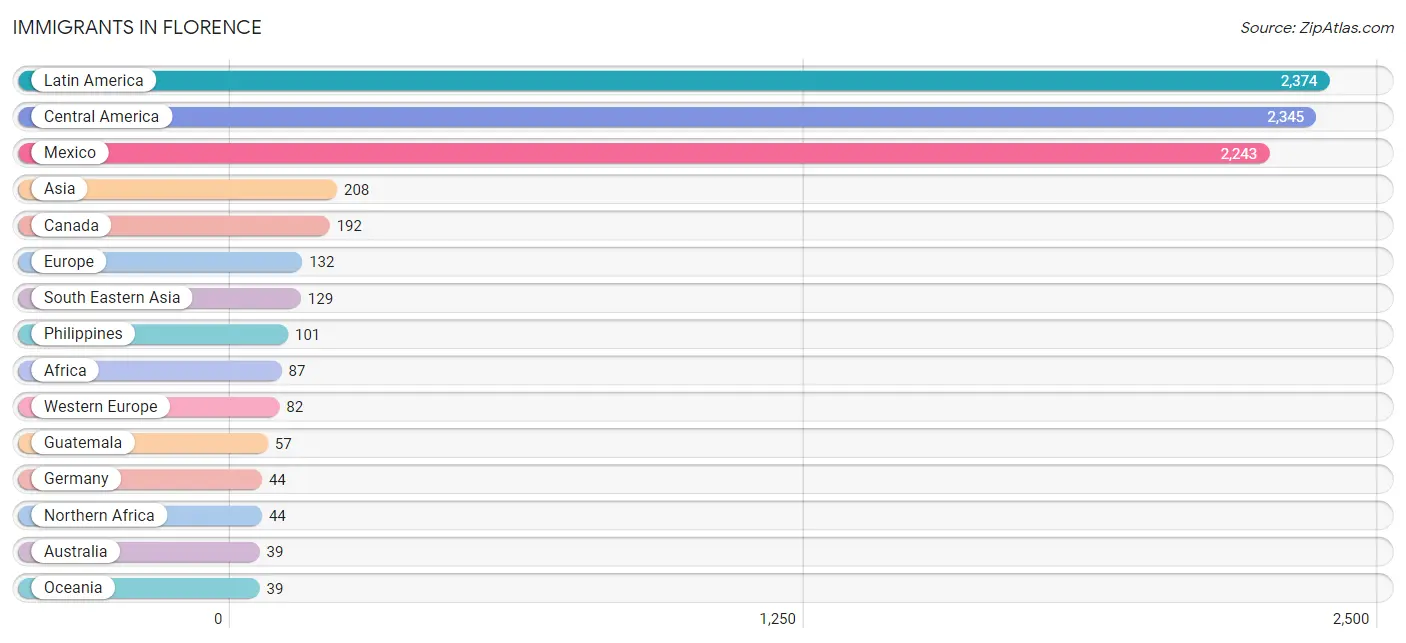
Immigrants in Florence
The most numerous immigrant groups reported in Florence came from Latin America (2,374 | 9.2%), Central America (2,345 | 9.1%), Mexico (2,243 | 8.7%), Asia (208 | 0.8%), and Canada (192 | 0.7%), together accounting for 28.6% of all Florence residents.
| Immigration Origin | # Population | % Population |
| Africa | 87 | 0.3% |
| Asia | 208 | 0.8% |
| Australia | 39 | 0.2% |
| Austria | 38 | 0.2% |
| Belize | 17 | 0.1% |
| Cambodia | 17 | 0.1% |
| Canada | 192 | 0.7% |
| Caribbean | 12 | 0.1% |
| Central America | 2,345 | 9.1% |
| China | 36 | 0.1% |
| Colombia | 9 | 0.0% |
| Cuba | 12 | 0.1% |
| Eastern Africa | 37 | 0.1% |
| Eastern Asia | 36 | 0.1% |
| Eastern Europe | 16 | 0.1% |
| Egypt | 5 | 0.0% |
| England | 9 | 0.0% |
| Ethiopia | 9 | 0.0% |
| Europe | 132 | 0.5% |
| Germany | 44 | 0.2% |
| Guatemala | 57 | 0.2% |
| Honduras | 28 | 0.1% |
| Iran | 18 | 0.1% |
| Kuwait | 18 | 0.1% |
| Latin America | 2,374 | 9.2% |
| Mexico | 2,243 | 8.7% |
| Northern Africa | 44 | 0.2% |
| Northern Europe | 34 | 0.1% |
| Oceania | 39 | 0.2% |
| Peru | 8 | 0.0% |
| Philippines | 101 | 0.4% |
| Poland | 16 | 0.1% |
| South America | 17 | 0.1% |
| South Central Asia | 25 | 0.1% |
| South Eastern Asia | 129 | 0.5% |
| Sudan | 39 | 0.2% |
| Uzbekistan | 7 | 0.0% |
| Vietnam | 11 | 0.0% |
| Western Asia | 18 | 0.1% |
| Western Europe | 82 | 0.3% | View All 40 Rows |
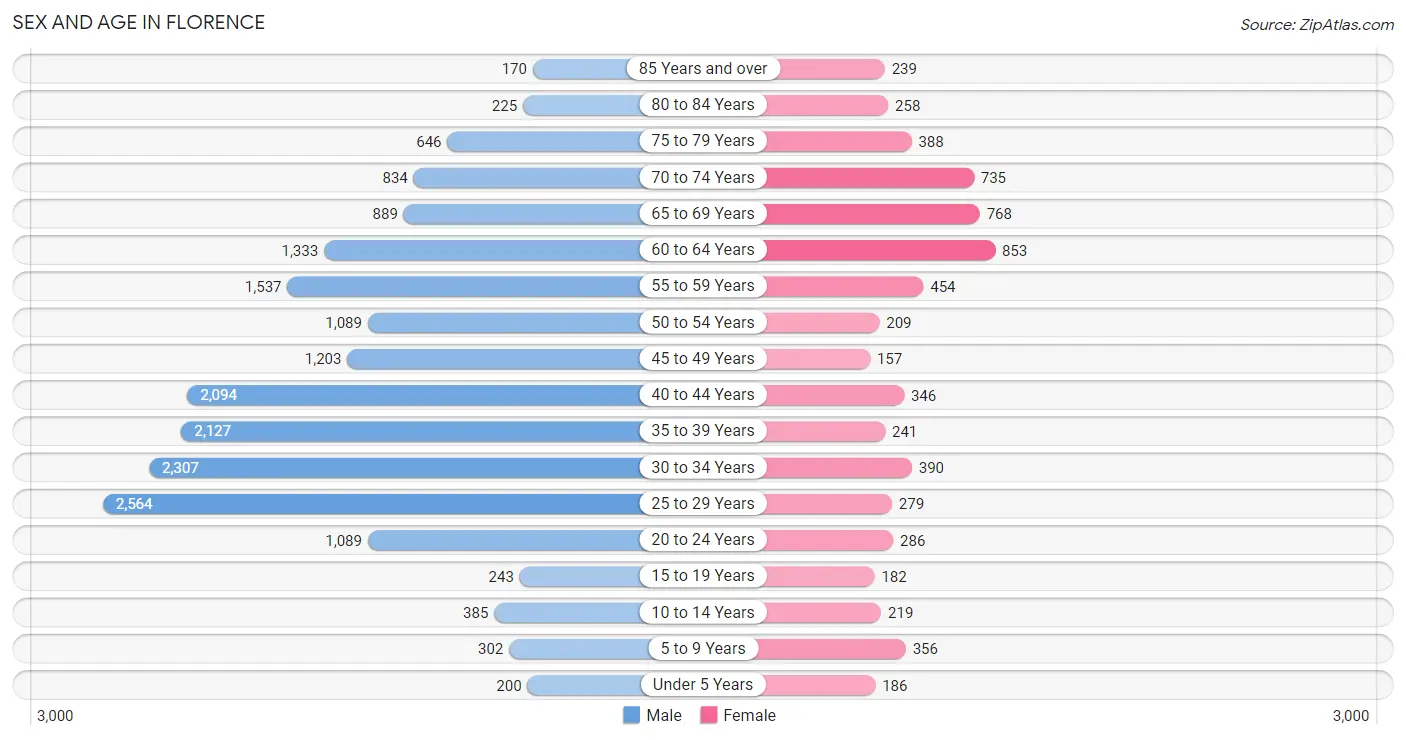
Sex and Age in Florence
Sex and Age in Florence
The most populous age groups in Florence are 25 to 29 Years (2,564 | 13.3%) for men and 60 to 64 Years (853 | 13.0%) for women.
| Age Bracket | Male | Female |
| Under 5 Years | 200 (1.0%) | 186 (2.8%) |
| 5 to 9 Years | 302 (1.6%) | 356 (5.4%) |
| 10 to 14 Years | 385 (2.0%) | 219 (3.4%) |
| 15 to 19 Years | 243 (1.3%) | 182 (2.8%) |
| 20 to 24 Years | 1,089 (5.7%) | 286 (4.4%) |
| 25 to 29 Years | 2,564 (13.3%) | 279 (4.3%) |
| 30 to 34 Years | 2,307 (12.0%) | 390 (6.0%) |
| 35 to 39 Years | 2,127 (11.1%) | 241 (3.7%) |
| 40 to 44 Years | 2,094 (10.9%) | 346 (5.3%) |
| 45 to 49 Years | 1,203 (6.2%) | 157 (2.4%) |
| 50 to 54 Years | 1,089 (5.7%) | 209 (3.2%) |
| 55 to 59 Years | 1,537 (8.0%) | 454 (6.9%) |
| 60 to 64 Years | 1,333 (6.9%) | 853 (13.0%) |
| 65 to 69 Years | 889 (4.6%) | 768 (11.7%) |
| 70 to 74 Years | 834 (4.3%) | 735 (11.2%) |
| 75 to 79 Years | 646 (3.4%) | 388 (5.9%) |
| 80 to 84 Years | 225 (1.2%) | 258 (3.9%) |
| 85 Years and over | 170 (0.9%) | 239 (3.6%) |
| Total | 19,237 (100.0%) | 6,546 (100.0%) |
Families and Households in Florence
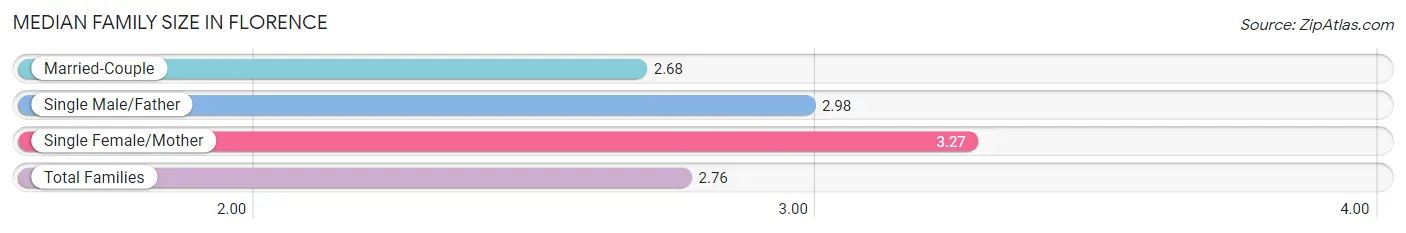
Median Family Size in Florence
The median family size in Florence is 2.76 persons per family, with single female/mother families (364 | 10.2%) accounting for the largest median family size of 3.27 persons per family. On the other hand, married-couple families (3,003 | 83.9%) represent the smallest median family size with 2.68 persons per family.
| Family Type | # Families | Family Size |
| Married-Couple | 3,003 (83.9%) | 2.68 |
| Single Male/Father | 213 (5.9%) | 2.98 |
| Single Female/Mother | 364 (10.2%) | 3.27 |
| Total Families | 3,580 (100.0%) | 2.76 |
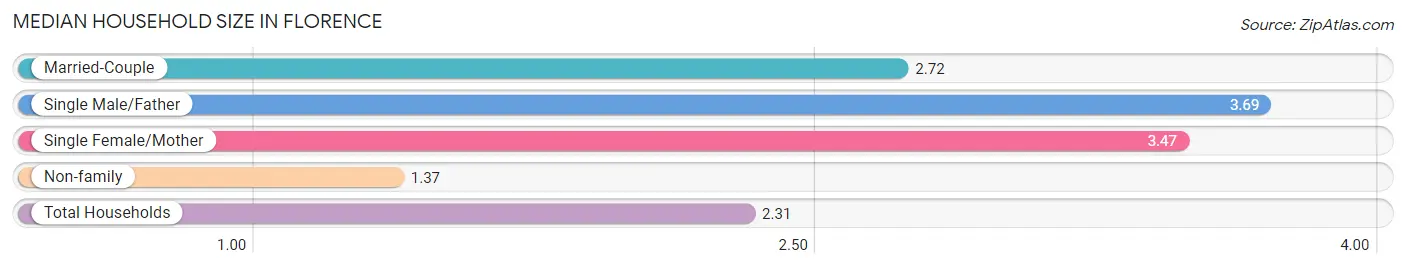
Median Household Size in Florence
The median household size in Florence is 2.31 persons per household, with single male/father households (213 | 3.8%) accounting for the largest median household size of 3.69 persons per household. non-family households (2,090 | 36.9%) represent the smallest median household size with 1.37 persons per household.
| Household Type | # Households | Household Size |
| Married-Couple | 3,003 (53.0%) | 2.72 |
| Single Male/Father | 213 (3.8%) | 3.69 |
| Single Female/Mother | 364 (6.4%) | 3.47 |
| Non-family | 2,090 (36.9%) | 1.37 |
| Total Households | 5,670 (100.0%) | 2.31 |
Household Size by Marriage Status in Florence
Out of a total of 5,670 households in Florence, 3,580 (63.1%) are family households, while 2,090 (36.9%) are nonfamily households. The most numerous type of family households are 2-person households, comprising 2,254, and the most common type of nonfamily households are 1-person households, comprising 1,399.
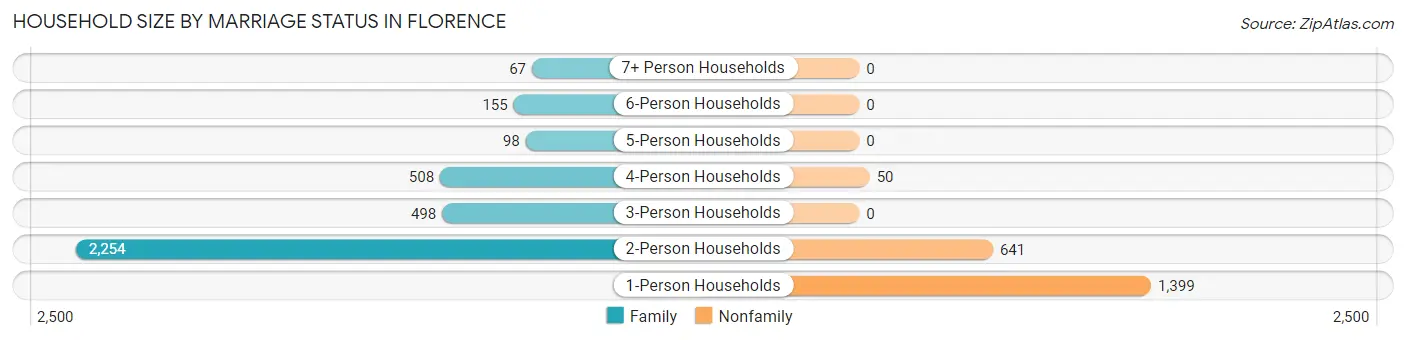
| Household Size | Family Households | Nonfamily Households |
| 1-Person Households | - | 1,399 (24.7%) |
| 2-Person Households | 2,254 (39.8%) | 641 (11.3%) |
| 3-Person Households | 498 (8.8%) | 0 (0.0%) |
| 4-Person Households | 508 (9.0%) | 50 (0.9%) |
| 5-Person Households | 98 (1.7%) | 0 (0.0%) |
| 6-Person Households | 155 (2.7%) | 0 (0.0%) |
| 7+ Person Households | 67 (1.2%) | 0 (0.0%) |
| Total | 3,580 (63.1%) | 2,090 (36.9%) |
Female Fertility in Florence
Fertility by Age in Florence
Average fertility rate in Florence is 149.0 births per 1,000 women. Women in the age bracket of 20 to 34 years have the highest fertility rate with 283.0 births per 1,000 women. Women in the age bracket of 20 to 34 years acount for 93.1% of all women with births.
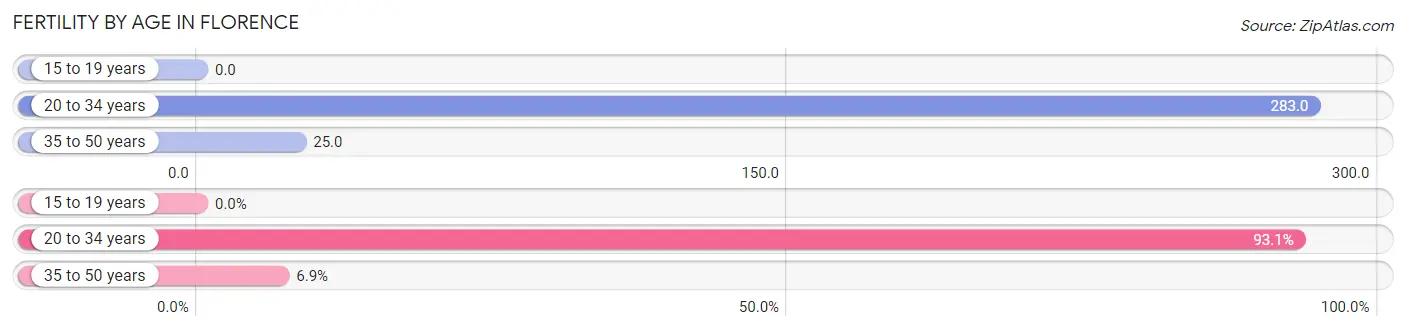
| Age Bracket | Women with Births | Births / 1,000 Women |
| 15 to 19 years | 0 (0.0%) | 0.0 |
| 20 to 34 years | 270 (93.1%) | 283.0 |
| 35 to 50 years | 20 (6.9%) | 25.0 |
| Total | 290 (100.0%) | 149.0 |
Fertility by Age by Marriage Status in Florence
78.3% of women with births (290) in Florence are married. The highest percentage of unmarried women with births falls into 35 to 50 years age bracket with 70.0% of them unmarried at the time of birth, while the lowest percentage of unmarried women with births belong to 20 to 34 years age bracket with 18.1% of them unmarried.
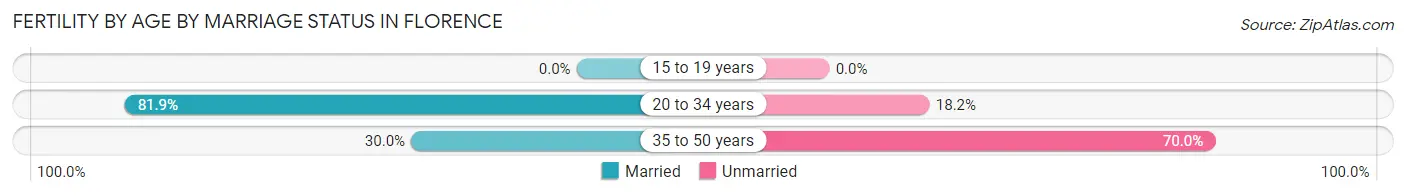
| Age Bracket | Married | Unmarried |
| 15 to 19 years | 0 (0.0%) | 0 (0.0%) |
| 20 to 34 years | 221 (81.9%) | 49 (18.1%) |
| 35 to 50 years | 6 (30.0%) | 14 (70.0%) |
| Total | 227 (78.3%) | 63 (21.7%) |
Fertility by Education in Florence
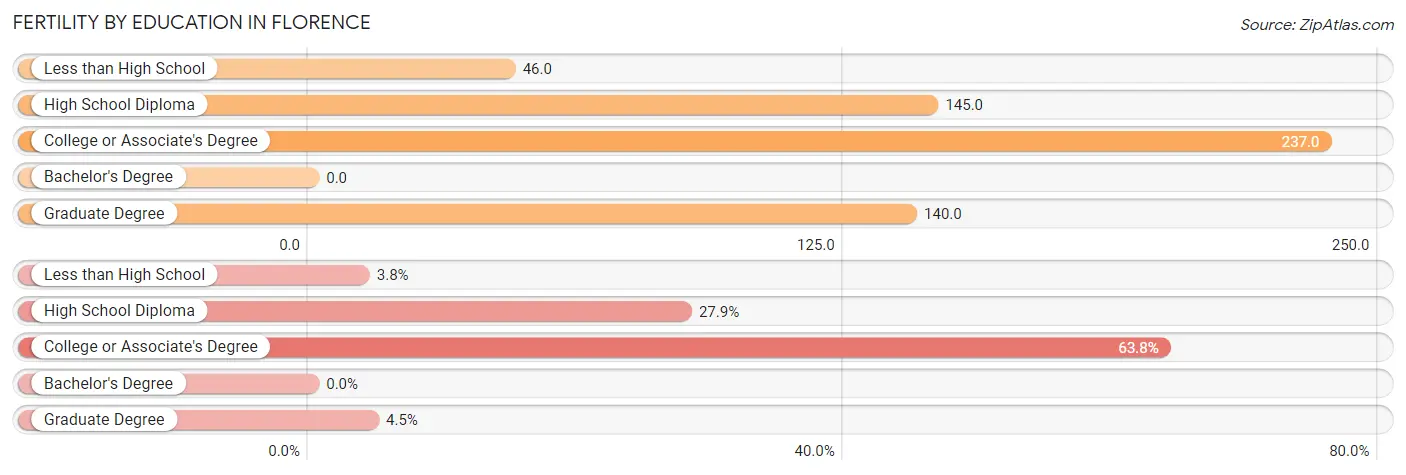
| Educational Attainment | Women with Births | Births / 1,000 Women |
| Less than High School | 11 (3.8%) | 46.0 |
| High School Diploma | 81 (27.9%) | 145.0 |
| College or Associate's Degree | 185 (63.8%) | 237.0 |
| Bachelor's Degree | 0 (0.0%) | 0.0 |
| Graduate Degree | 13 (4.5%) | 140.0 |
| Total | 290 (100.0%) | 149.0 |
Fertility by Education by Marriage Status in Florence
21.7% of women with births in Florence are unmarried. Women with the educational attainment of graduate degree are most likely to be married with 100.0% of them married at childbirth, while women with the educational attainment of less than high school are least likely to be married with 100.0% of them unmarried at childbirth.
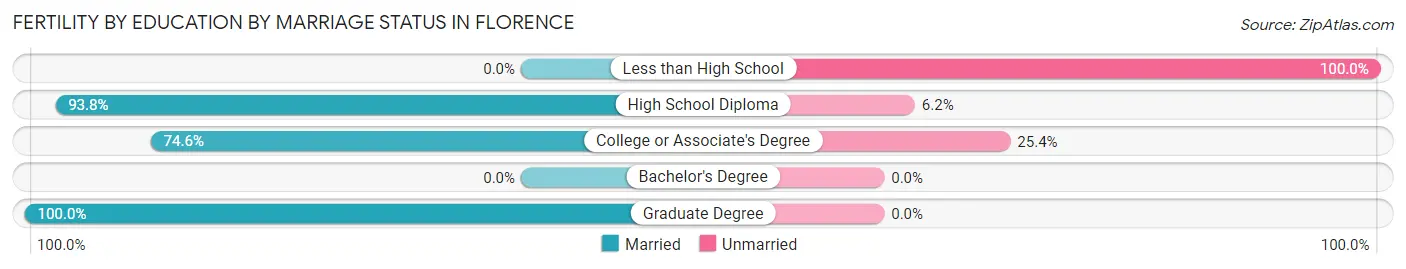
| Educational Attainment | Married | Unmarried |
| Less than High School | 0 (0.0%) | 11 (100.0%) |
| High School Diploma | 76 (93.8%) | 5 (6.2%) |
| College or Associate's Degree | 138 (74.6%) | 47 (25.4%) |
| Bachelor's Degree | 0 (0.0%) | 0 (0.0%) |
| Graduate Degree | 13 (100.0%) | 0 (0.0%) |
| Total | 227 (78.3%) | 63 (21.7%) |
Employment Characteristics in Florence
Employment by Class of Employer in Florence
Among the 4,495 employed individuals in Florence, private company employees (2,418 | 53.8%), local government employees (628 | 14.0%), and state government employees (500 | 11.1%) make up the most common classes of employment.
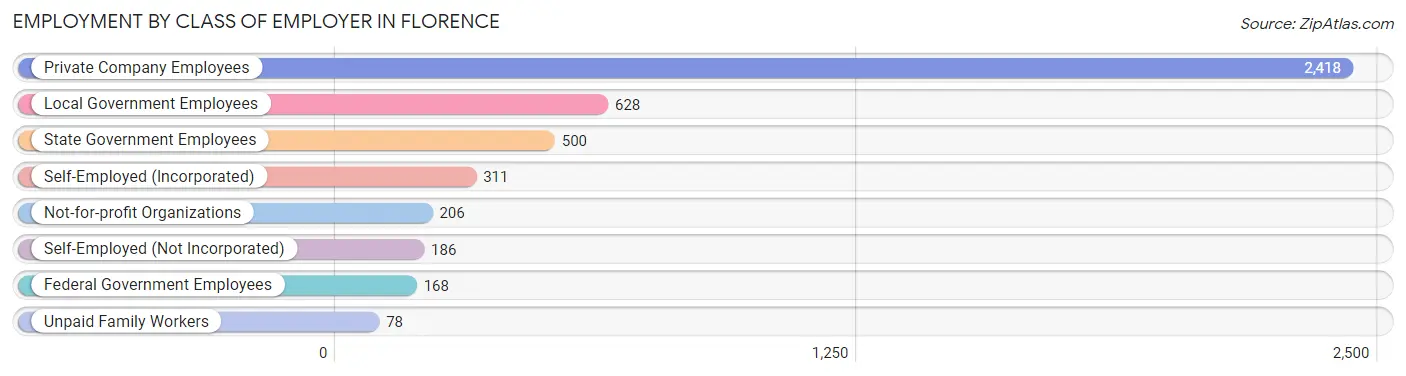
| Employer Class | # Employees | % Employees |
| Private Company Employees | 2,418 | 53.8% |
| Self-Employed (Incorporated) | 311 | 6.9% |
| Self-Employed (Not Incorporated) | 186 | 4.1% |
| Not-for-profit Organizations | 206 | 4.6% |
| Local Government Employees | 628 | 14.0% |
| State Government Employees | 500 | 11.1% |
| Federal Government Employees | 168 | 3.7% |
| Unpaid Family Workers | 78 | 1.7% |
| Total | 4,495 | 100.0% |
Employment Status by Age in Florence
According to the labor force statistics for Florence, out of the total population over 16 years of age (24,121), 20.6% or 4,969 individuals are in the labor force, with 7.6% or 378 of them unemployed. The age group with the highest labor force participation rate is 16 to 19 years, with 45.3% or 186 individuals in the labor force. Within the labor force, the 20 to 24 years age range has the highest percentage of unemployed individuals, with 42.0% or 169 of them being unemployed.
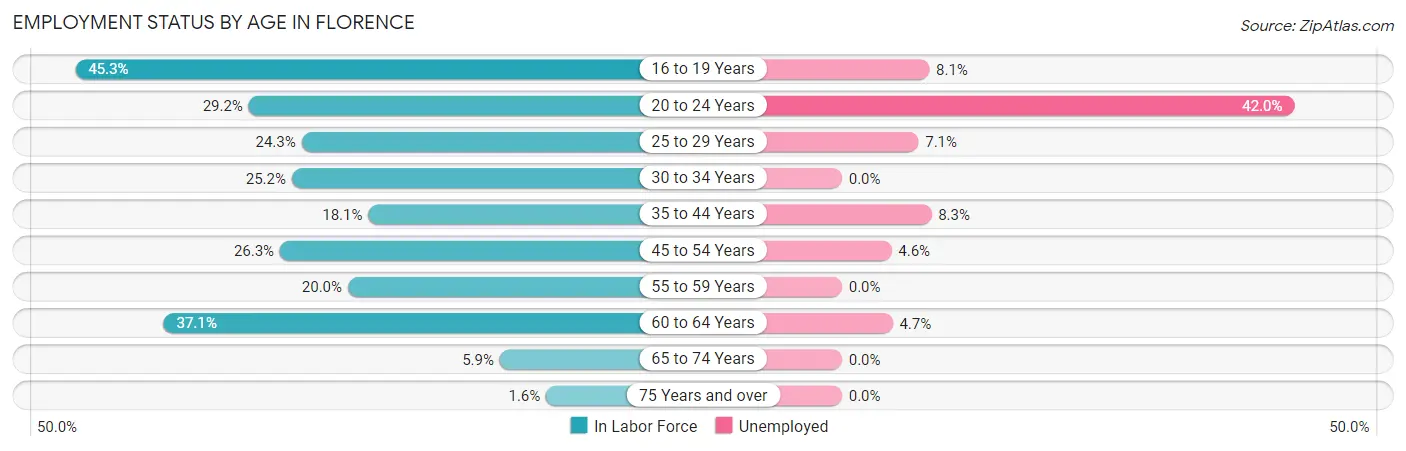
| Age Bracket | In Labor Force | Unemployed |
| 16 to 19 Years | 186 (45.3%) | 15 (8.1%) |
| 20 to 24 Years | 402 (29.2%) | 169 (42.0%) |
| 25 to 29 Years | 691 (24.3%) | 49 (7.1%) |
| 30 to 34 Years | 680 (25.2%) | 0 (0.0%) |
| 35 to 44 Years | 870 (18.1%) | 72 (8.3%) |
| 45 to 54 Years | 699 (26.3%) | 32 (4.6%) |
| 55 to 59 Years | 398 (20.0%) | 0 (0.0%) |
| 60 to 64 Years | 811 (37.1%) | 38 (4.7%) |
| 65 to 74 Years | 190 (5.9%) | 0 (0.0%) |
| 75 Years and over | 31 (1.6%) | 0 (0.0%) |
| Total | 4,969 (20.6%) | 378 (7.6%) |
Employment Status by Educational Attainment in Florence
According to labor force statistics for Florence, 24.1% of individuals (4,141) out of the total population between 25 and 64 years of age (17,183) are in the labor force, with 4.6% or 190 of them being unemployed. The group with the highest labor force participation rate are those with the educational attainment of bachelor's degree or higher, with 57.2% or 1,185 individuals in the labor force. Within the labor force, individuals with less than high school education have the highest percentage of unemployment, with 19.6% or 67 of them being unemployed.
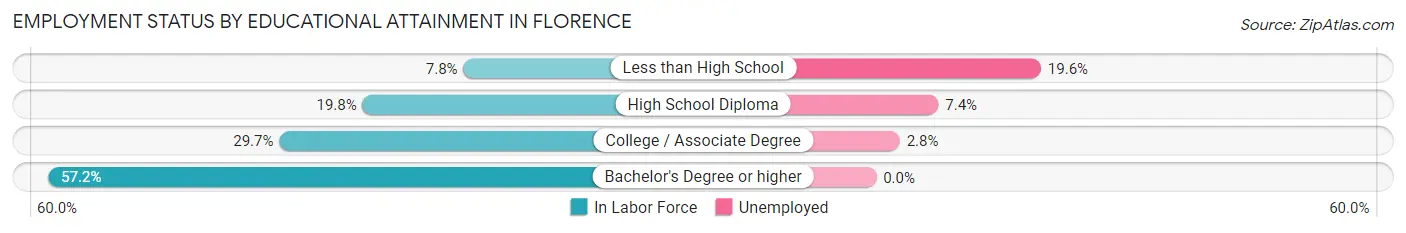
| Educational Attainment | In Labor Force | Unemployed |
| Less than High School | 344 (7.8%) | 864 (19.6%) |
| High School Diploma | 1,109 (19.8%) | 414 (7.4%) |
| College / Associate Degree | 1,516 (29.7%) | 143 (2.8%) |
| Bachelor's Degree or higher | 1,185 (57.2%) | 0 (0.0%) |
| Total | 4,141 (24.1%) | 790 (4.6%) |
Employment Occupations by Sex in Florence
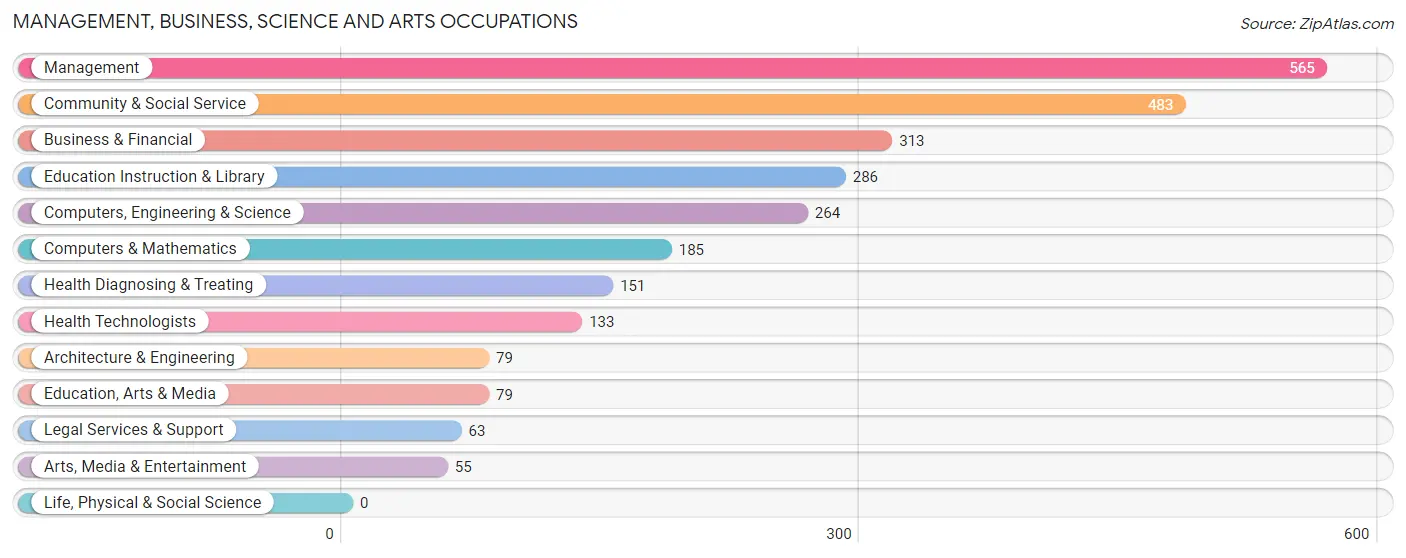
Management, Business, Science and Arts Occupations
The most common Management, Business, Science and Arts occupations in Florence are Management (565 | 12.3%), Community & Social Service (483 | 10.5%), Business & Financial (313 | 6.8%), Education Instruction & Library (286 | 6.2%), and Computers, Engineering & Science (264 | 5.8%).
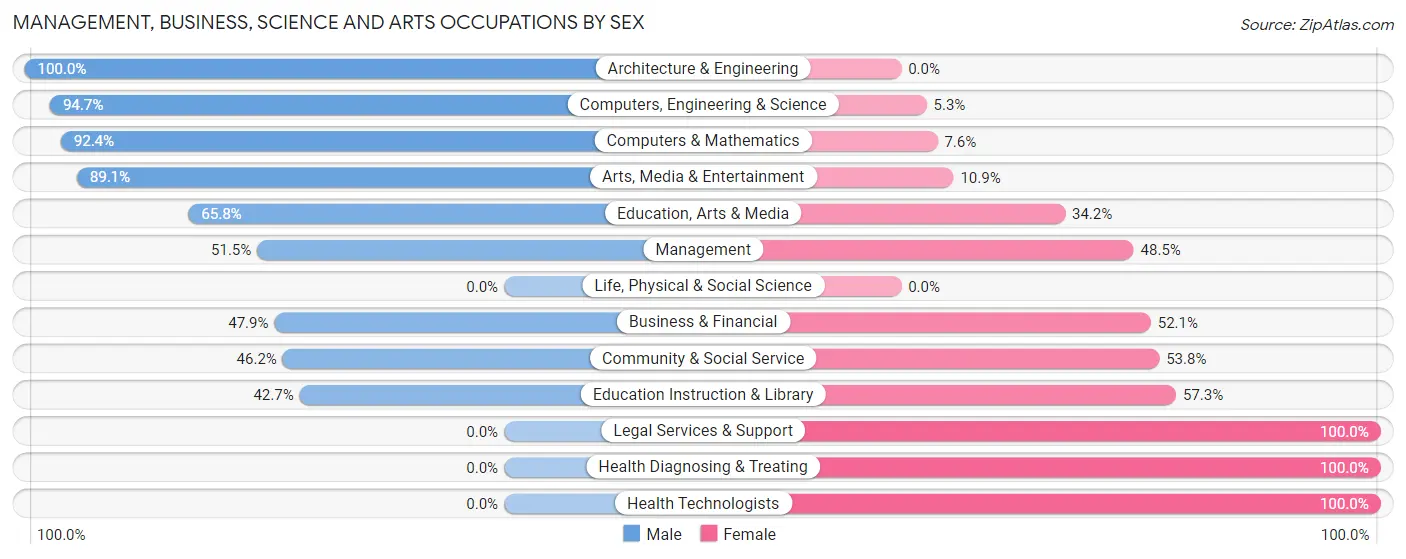
Management, Business, Science and Arts Occupations by Sex
Within the Management, Business, Science and Arts occupations in Florence, the most male-oriented occupations are Architecture & Engineering (100.0%), Computers, Engineering & Science (94.7%), and Computers & Mathematics (92.4%), while the most female-oriented occupations are Legal Services & Support (100.0%), Health Diagnosing & Treating (100.0%), and Health Technologists (100.0%).
| Occupation | Male | Female |
| Management | 291 (51.5%) | 274 (48.5%) |
| Business & Financial | 150 (47.9%) | 163 (52.1%) |
| Computers, Engineering & Science | 250 (94.7%) | 14 (5.3%) |
| Computers & Mathematics | 171 (92.4%) | 14 (7.6%) |
| Architecture & Engineering | 79 (100.0%) | 0 (0.0%) |
| Life, Physical & Social Science | 0 (0.0%) | 0 (0.0%) |
| Community & Social Service | 223 (46.2%) | 260 (53.8%) |
| Education, Arts & Media | 52 (65.8%) | 27 (34.2%) |
| Legal Services & Support | 0 (0.0%) | 63 (100.0%) |
| Education Instruction & Library | 122 (42.7%) | 164 (57.3%) |
| Arts, Media & Entertainment | 49 (89.1%) | 6 (10.9%) |
| Health Diagnosing & Treating | 0 (0.0%) | 151 (100.0%) |
| Health Technologists | 0 (0.0%) | 133 (100.0%) |
| Total (Category) | 914 (51.5%) | 862 (48.5%) |
| Total (Overall) | 2,667 (58.2%) | 1,915 (41.8%) |
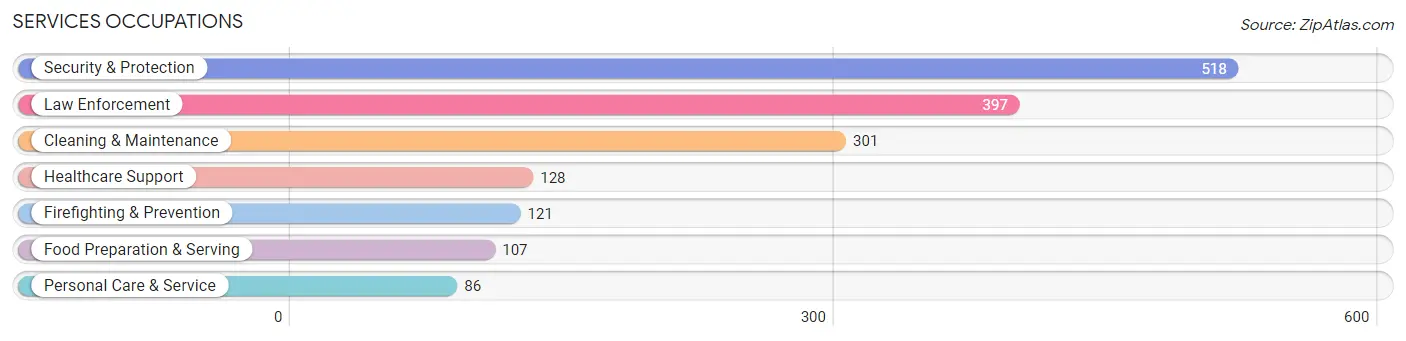
Services Occupations
The most common Services occupations in Florence are Security & Protection (518 | 11.3%), Law Enforcement (397 | 8.7%), Cleaning & Maintenance (301 | 6.6%), Healthcare Support (128 | 2.8%), and Firefighting & Prevention (121 | 2.6%).
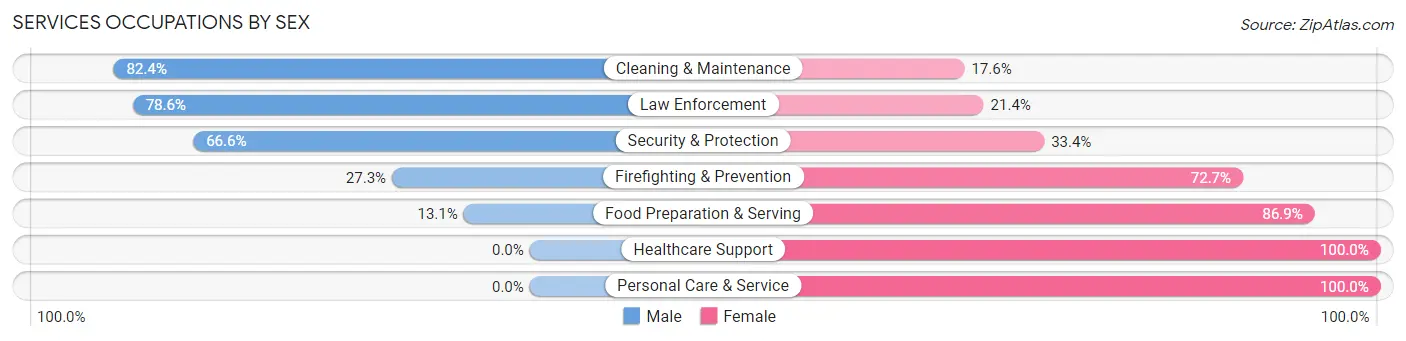
Services Occupations by Sex
Within the Services occupations in Florence, the most male-oriented occupations are Cleaning & Maintenance (82.4%), Law Enforcement (78.6%), and Security & Protection (66.6%), while the most female-oriented occupations are Healthcare Support (100.0%), Personal Care & Service (100.0%), and Food Preparation & Serving (86.9%).
| Occupation | Male | Female |
| Healthcare Support | 0 (0.0%) | 128 (100.0%) |
| Security & Protection | 345 (66.6%) | 173 (33.4%) |
| Firefighting & Prevention | 33 (27.3%) | 88 (72.7%) |
| Law Enforcement | 312 (78.6%) | 85 (21.4%) |
| Food Preparation & Serving | 14 (13.1%) | 93 (86.9%) |
| Cleaning & Maintenance | 248 (82.4%) | 53 (17.6%) |
| Personal Care & Service | 0 (0.0%) | 86 (100.0%) |
| Total (Category) | 607 (53.2%) | 533 (46.8%) |
| Total (Overall) | 2,667 (58.2%) | 1,915 (41.8%) |
Sales and Office Occupations
The most common Sales and Office occupations in Florence are Office & Administration (436 | 9.5%), and Sales & Related (245 | 5.3%).

Sales and Office Occupations by Sex
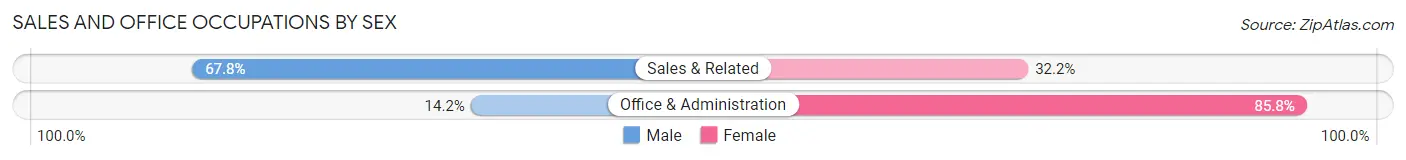
| Occupation | Male | Female |
| Sales & Related | 166 (67.8%) | 79 (32.2%) |
| Office & Administration | 62 (14.2%) | 374 (85.8%) |
| Total (Category) | 228 (33.5%) | 453 (66.5%) |
| Total (Overall) | 2,667 (58.2%) | 1,915 (41.8%) |
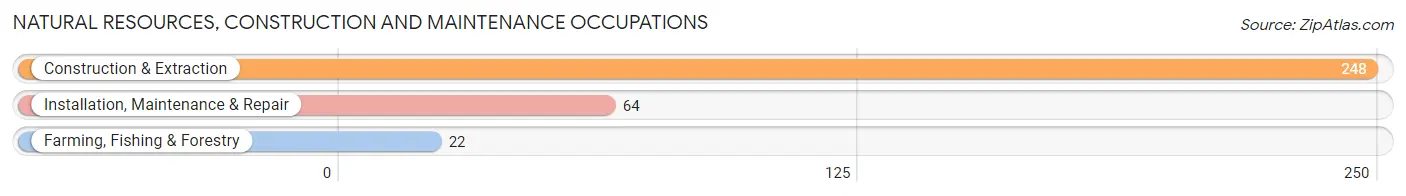
Natural Resources, Construction and Maintenance Occupations
The most common Natural Resources, Construction and Maintenance occupations in Florence are Construction & Extraction (248 | 5.4%), Installation, Maintenance & Repair (64 | 1.4%), and Farming, Fishing & Forestry (22 | 0.5%).
Natural Resources, Construction and Maintenance Occupations by Sex
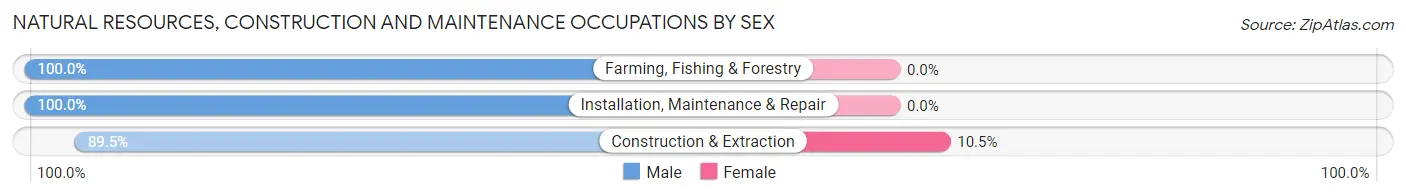
| Occupation | Male | Female |
| Farming, Fishing & Forestry | 22 (100.0%) | 0 (0.0%) |
| Construction & Extraction | 222 (89.5%) | 26 (10.5%) |
| Installation, Maintenance & Repair | 64 (100.0%) | 0 (0.0%) |
| Total (Category) | 308 (92.2%) | 26 (7.8%) |
| Total (Overall) | 2,667 (58.2%) | 1,915 (41.8%) |
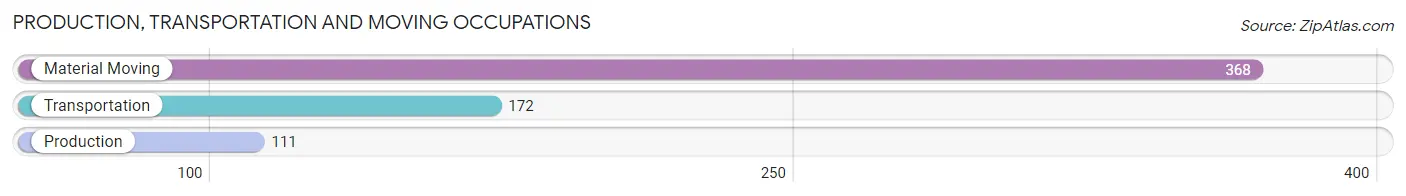
Production, Transportation and Moving Occupations
The most common Production, Transportation and Moving occupations in Florence are Material Moving (368 | 8.0%), Transportation (172 | 3.7%), and Production (111 | 2.4%).
Production, Transportation and Moving Occupations by Sex

| Occupation | Male | Female |
| Production | 103 (92.8%) | 8 (7.2%) |
| Transportation | 154 (89.5%) | 18 (10.5%) |
| Material Moving | 353 (95.9%) | 15 (4.1%) |
| Total (Category) | 610 (93.7%) | 41 (6.3%) |
| Total (Overall) | 2,667 (58.2%) | 1,915 (41.8%) |
Employment Industries by Sex in Florence
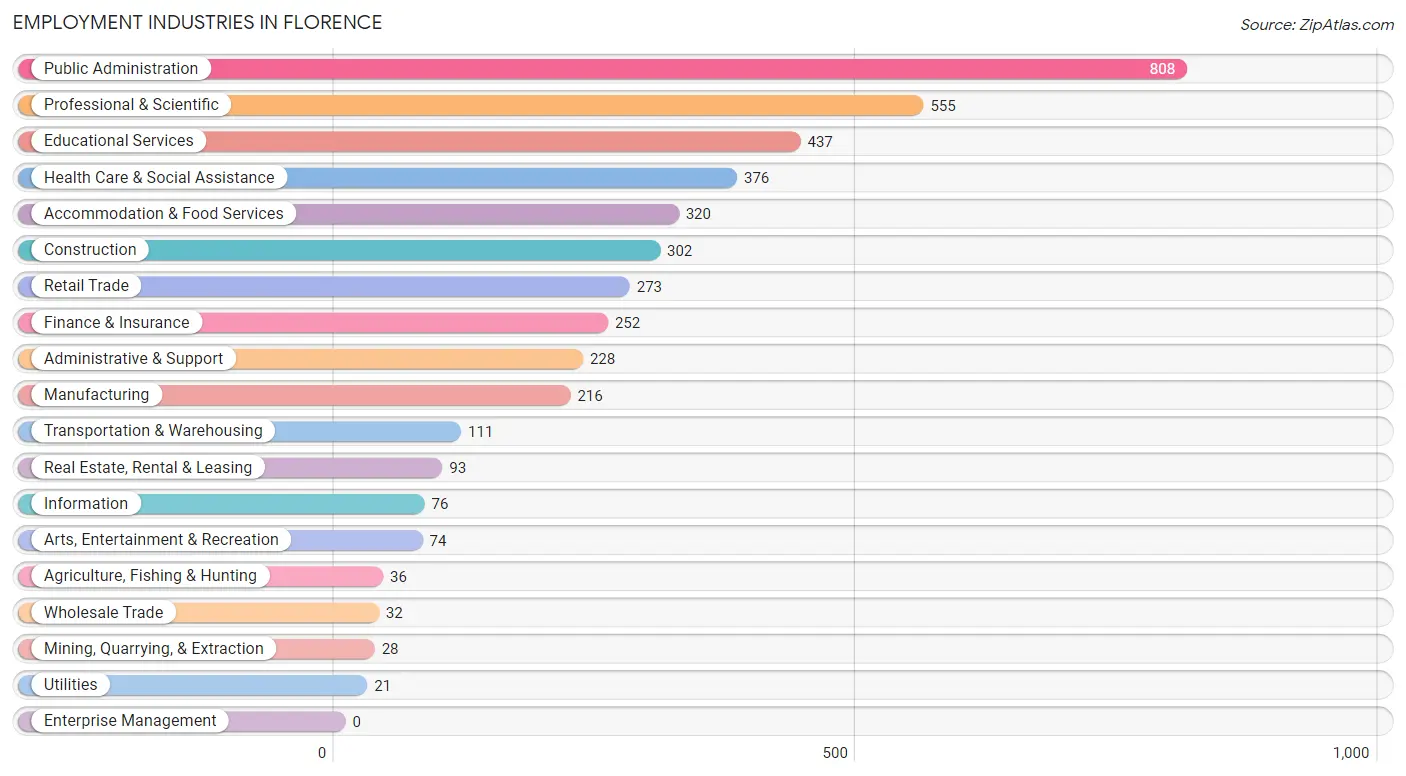
Employment Industries in Florence
The major employment industries in Florence include Public Administration (808 | 17.6%), Professional & Scientific (555 | 12.1%), Educational Services (437 | 9.5%), Health Care & Social Assistance (376 | 8.2%), and Accommodation & Food Services (320 | 7.0%).
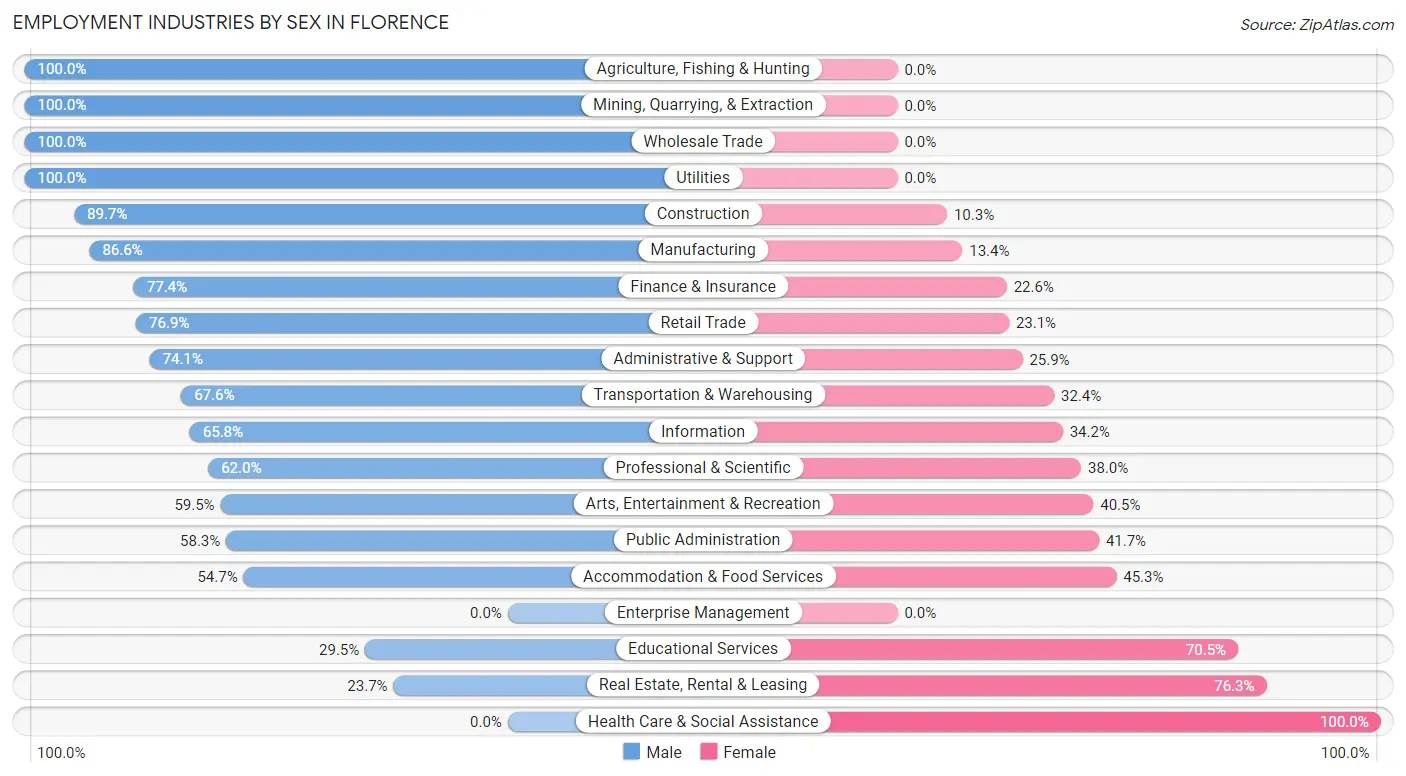
Employment Industries by Sex in Florence
The Florence industries that see more men than women are Agriculture, Fishing & Hunting (100.0%), Mining, Quarrying, & Extraction (100.0%), and Wholesale Trade (100.0%), whereas the industries that tend to have a higher number of women are Health Care & Social Assistance (100.0%), Real Estate, Rental & Leasing (76.3%), and Educational Services (70.5%).
| Industry | Male | Female |
| Agriculture, Fishing & Hunting | 36 (100.0%) | 0 (0.0%) |
| Mining, Quarrying, & Extraction | 28 (100.0%) | 0 (0.0%) |
| Construction | 271 (89.7%) | 31 (10.3%) |
| Manufacturing | 187 (86.6%) | 29 (13.4%) |
| Wholesale Trade | 32 (100.0%) | 0 (0.0%) |
| Retail Trade | 210 (76.9%) | 63 (23.1%) |
| Transportation & Warehousing | 75 (67.6%) | 36 (32.4%) |
| Utilities | 21 (100.0%) | 0 (0.0%) |
| Information | 50 (65.8%) | 26 (34.2%) |
| Finance & Insurance | 195 (77.4%) | 57 (22.6%) |
| Real Estate, Rental & Leasing | 22 (23.7%) | 71 (76.3%) |
| Professional & Scientific | 344 (62.0%) | 211 (38.0%) |
| Enterprise Management | 0 (0.0%) | 0 (0.0%) |
| Administrative & Support | 169 (74.1%) | 59 (25.9%) |
| Educational Services | 129 (29.5%) | 308 (70.5%) |
| Health Care & Social Assistance | 0 (0.0%) | 376 (100.0%) |
| Arts, Entertainment & Recreation | 44 (59.5%) | 30 (40.5%) |
| Accommodation & Food Services | 175 (54.7%) | 145 (45.3%) |
| Public Administration | 471 (58.3%) | 337 (41.7%) |
| Total | 2,667 (58.2%) | 1,915 (41.8%) |
Education in Florence
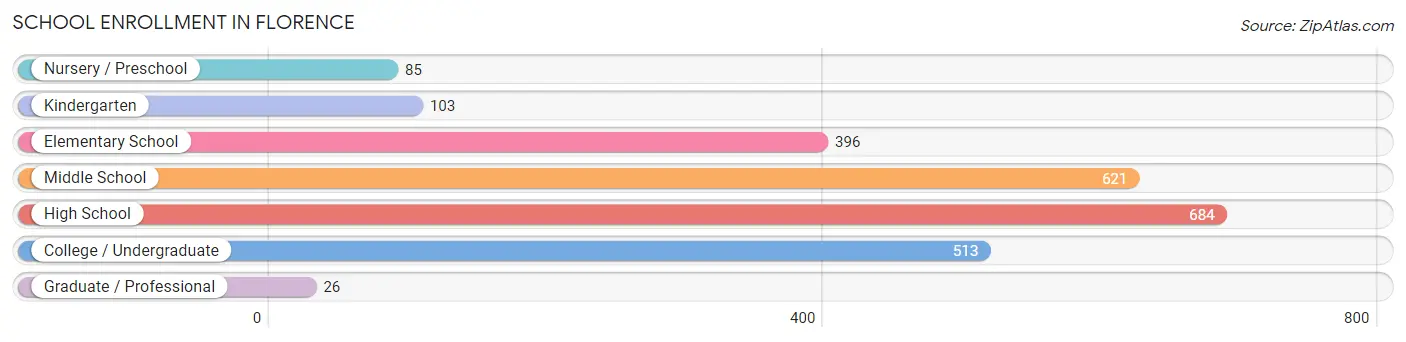
School Enrollment in Florence
The most common levels of schooling among the 2,428 students in Florence are high school (684 | 28.2%), middle school (621 | 25.6%), and college / undergraduate (513 | 21.1%).
| School Level | # Students | % Students |
| Nursery / Preschool | 85 | 3.5% |
| Kindergarten | 103 | 4.2% |
| Elementary School | 396 | 16.3% |
| Middle School | 621 | 25.6% |
| High School | 684 | 28.2% |
| College / Undergraduate | 513 | 21.1% |
| Graduate / Professional | 26 | 1.1% |
| Total | 2,428 | 100.0% |
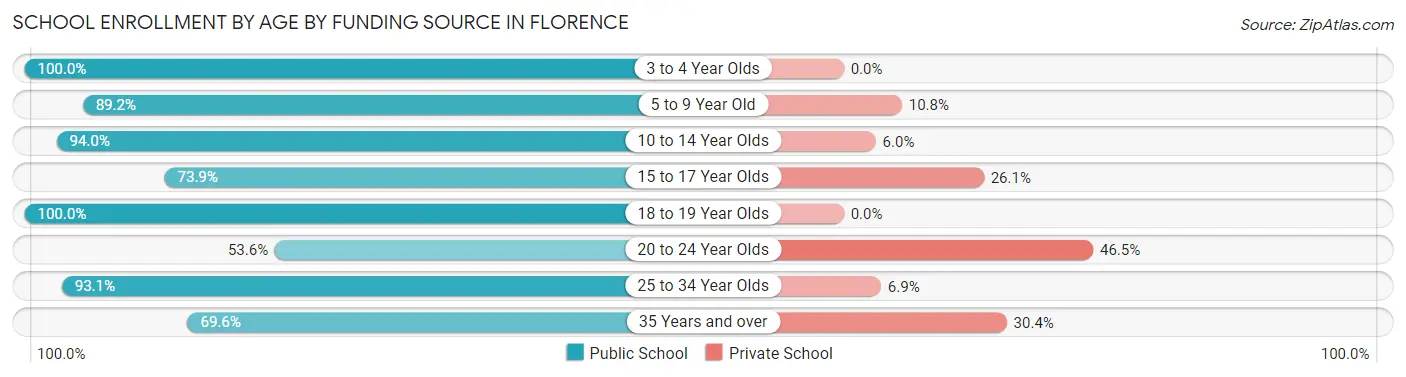
School Enrollment by Age by Funding Source in Florence
Out of a total of 2,428 students who are enrolled in schools in Florence, 391 (16.1%) attend a private institution, while the remaining 2,037 (83.9%) are enrolled in public schools. The age group of 20 to 24 year olds has the highest likelihood of being enrolled in private schools, with 98 (46.5% in the age bracket) enrolled. Conversely, the age group of 3 to 4 year olds has the lowest likelihood of being enrolled in a private school, with 8 (100.0% in the age bracket) attending a public institution.
| Age Bracket | Public School | Private School |
| 3 to 4 Year Olds | 8 (100.0%) | 0 (0.0%) |
| 5 to 9 Year Old | 527 (89.2%) | 64 (10.8%) |
| 10 to 14 Year Olds | 568 (94.0%) | 36 (6.0%) |
| 15 to 17 Year Olds | 85 (73.9%) | 30 (26.1%) |
| 18 to 19 Year Olds | 62 (100.0%) | 0 (0.0%) |
| 20 to 24 Year Olds | 113 (53.5%) | 98 (46.5%) |
| 25 to 34 Year Olds | 362 (93.1%) | 27 (6.9%) |
| 35 Years and over | 312 (69.6%) | 136 (30.4%) |
| Total | 2,037 (83.9%) | 391 (16.1%) |
Educational Attainment by Field of Study in Florence
Business (571 | 15.6%), education (477 | 13.1%), computers & mathematics (470 | 12.9%), communications (381 | 10.4%), and social sciences (375 | 10.3%) are the most common fields of study among 3,655 individuals in Florence who have obtained a bachelor's degree or higher.
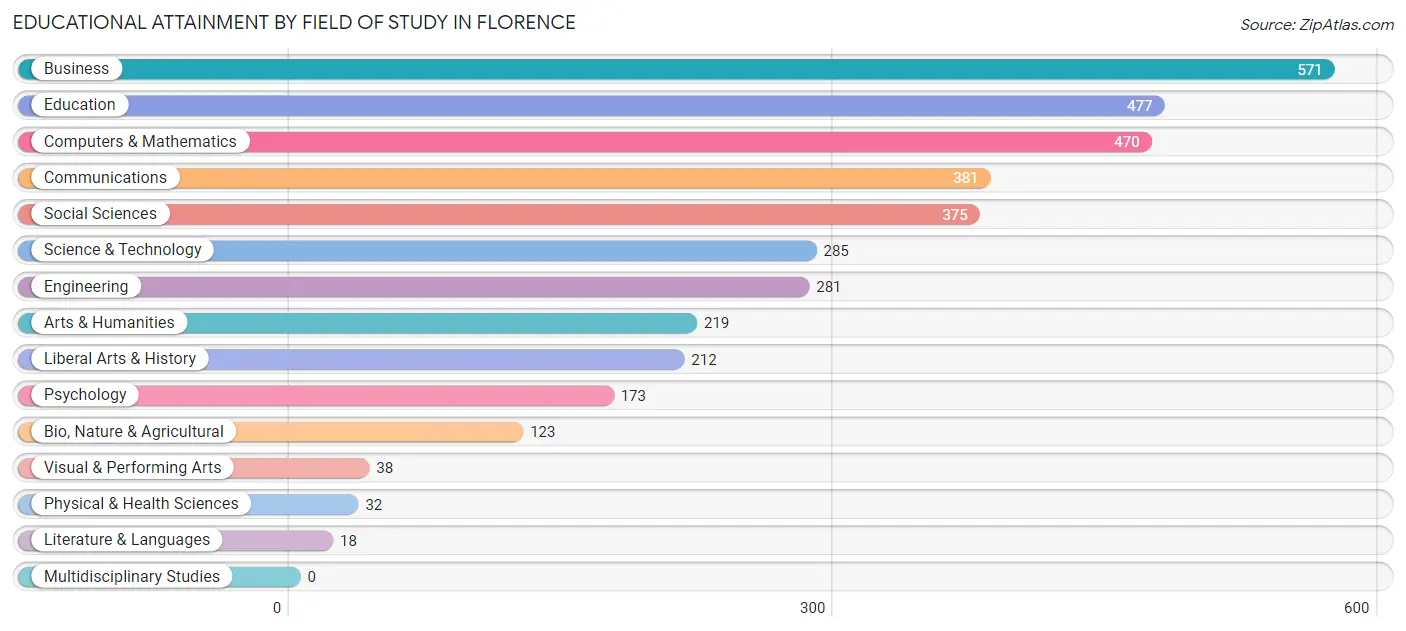
| Field of Study | # Graduates | % Graduates |
| Computers & Mathematics | 470 | 12.9% |
| Bio, Nature & Agricultural | 123 | 3.4% |
| Physical & Health Sciences | 32 | 0.9% |
| Psychology | 173 | 4.7% |
| Social Sciences | 375 | 10.3% |
| Engineering | 281 | 7.7% |
| Multidisciplinary Studies | 0 | 0.0% |
| Science & Technology | 285 | 7.8% |
| Business | 571 | 15.6% |
| Education | 477 | 13.1% |
| Literature & Languages | 18 | 0.5% |
| Liberal Arts & History | 212 | 5.8% |
| Visual & Performing Arts | 38 | 1.0% |
| Communications | 381 | 10.4% |
| Arts & Humanities | 219 | 6.0% |
| Total | 3,655 | 100.0% |
Transportation & Commute in Florence
Vehicle Availability by Sex in Florence
The most prevalent vehicle ownership categories in Florence are males with 2 vehicles (1,001, accounting for 38.0%) and females with 2 vehicles (826, making up 53.8%).
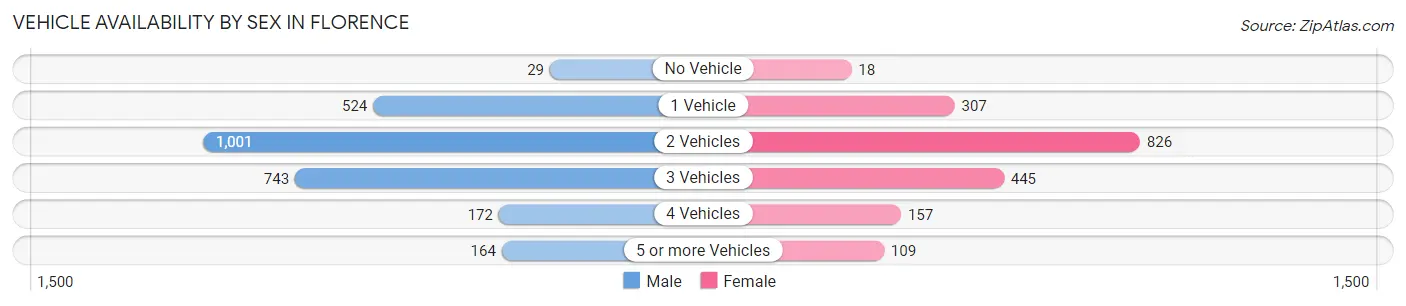
| Vehicles Available | Male | Female |
| No Vehicle | 29 (1.1%) | 18 (1.0%) |
| 1 Vehicle | 524 (19.9%) | 307 (16.5%) |
| 2 Vehicles | 1,001 (38.0%) | 826 (44.4%) |
| 3 Vehicles | 743 (28.2%) | 445 (23.9%) |
| 4 Vehicles | 172 (6.5%) | 157 (8.4%) |
| 5 or more Vehicles | 164 (6.2%) | 109 (5.9%) |
| Total | 2,633 (100.0%) | 1,862 (100.0%) |
Commute Time in Florence
The most frequently occuring commute durations in Florence are 5 to 9 minutes (786 commuters, 20.7%), 60 to 89 minutes (720 commuters, 19.0%), and 45 to 59 minutes (425 commuters, 11.2%).
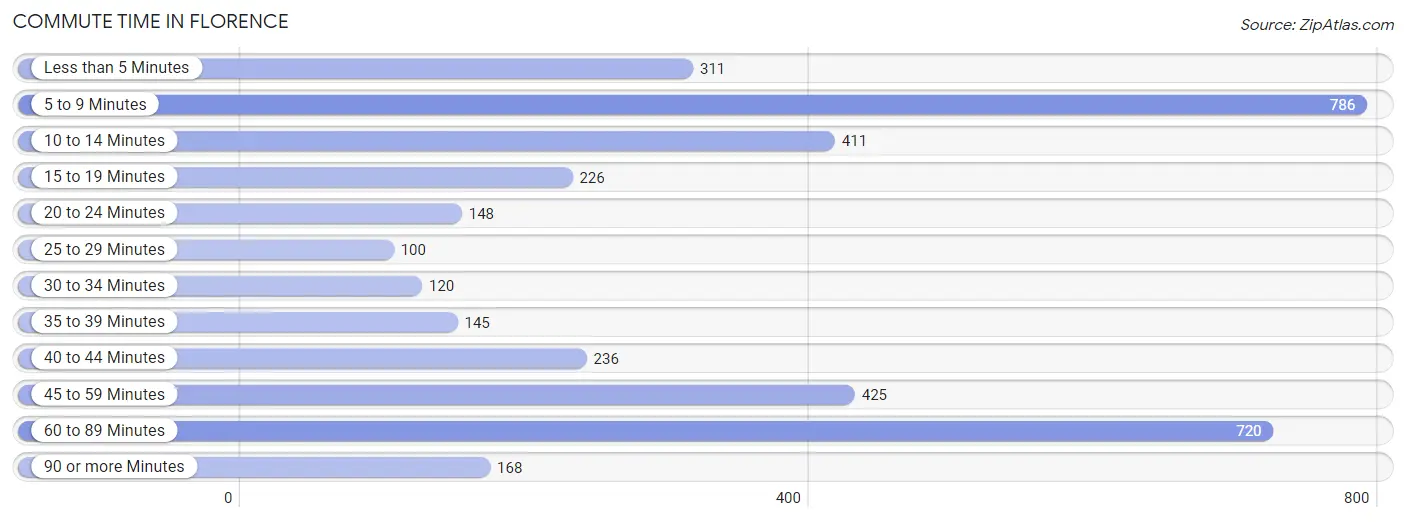
| Commute Time | # Commuters | % Commuters |
| Less than 5 Minutes | 311 | 8.2% |
| 5 to 9 Minutes | 786 | 20.7% |
| 10 to 14 Minutes | 411 | 10.8% |
| 15 to 19 Minutes | 226 | 5.9% |
| 20 to 24 Minutes | 148 | 3.9% |
| 25 to 29 Minutes | 100 | 2.6% |
| 30 to 34 Minutes | 120 | 3.2% |
| 35 to 39 Minutes | 145 | 3.8% |
| 40 to 44 Minutes | 236 | 6.2% |
| 45 to 59 Minutes | 425 | 11.2% |
| 60 to 89 Minutes | 720 | 19.0% |
| 90 or more Minutes | 168 | 4.4% |
Commute Time by Sex in Florence
The most common commute times in Florence are 60 to 89 minutes (563 commuters, 24.4%) for males and 45 to 59 minutes (262 commuters, 17.6%) for females.
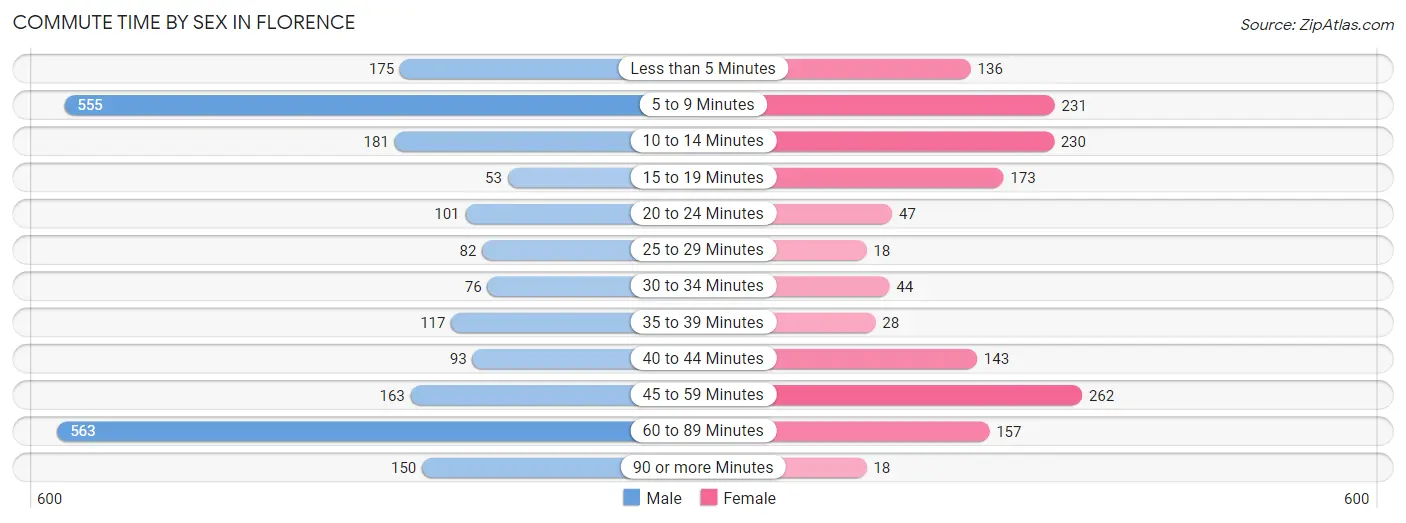
| Commute Time | Male | Female |
| Less than 5 Minutes | 175 (7.6%) | 136 (9.1%) |
| 5 to 9 Minutes | 555 (24.0%) | 231 (15.5%) |
| 10 to 14 Minutes | 181 (7.8%) | 230 (15.5%) |
| 15 to 19 Minutes | 53 (2.3%) | 173 (11.6%) |
| 20 to 24 Minutes | 101 (4.4%) | 47 (3.2%) |
| 25 to 29 Minutes | 82 (3.5%) | 18 (1.2%) |
| 30 to 34 Minutes | 76 (3.3%) | 44 (3.0%) |
| 35 to 39 Minutes | 117 (5.1%) | 28 (1.9%) |
| 40 to 44 Minutes | 93 (4.0%) | 143 (9.6%) |
| 45 to 59 Minutes | 163 (7.1%) | 262 (17.6%) |
| 60 to 89 Minutes | 563 (24.4%) | 157 (10.6%) |
| 90 or more Minutes | 150 (6.5%) | 18 (1.2%) |
Time of Departure to Work by Sex in Florence
The most frequent times of departure to work in Florence are 12:00 AM to 4:59 AM (520, 22.5%) for males and 7:00 AM to 7:29 AM (238, 16.0%) for females.
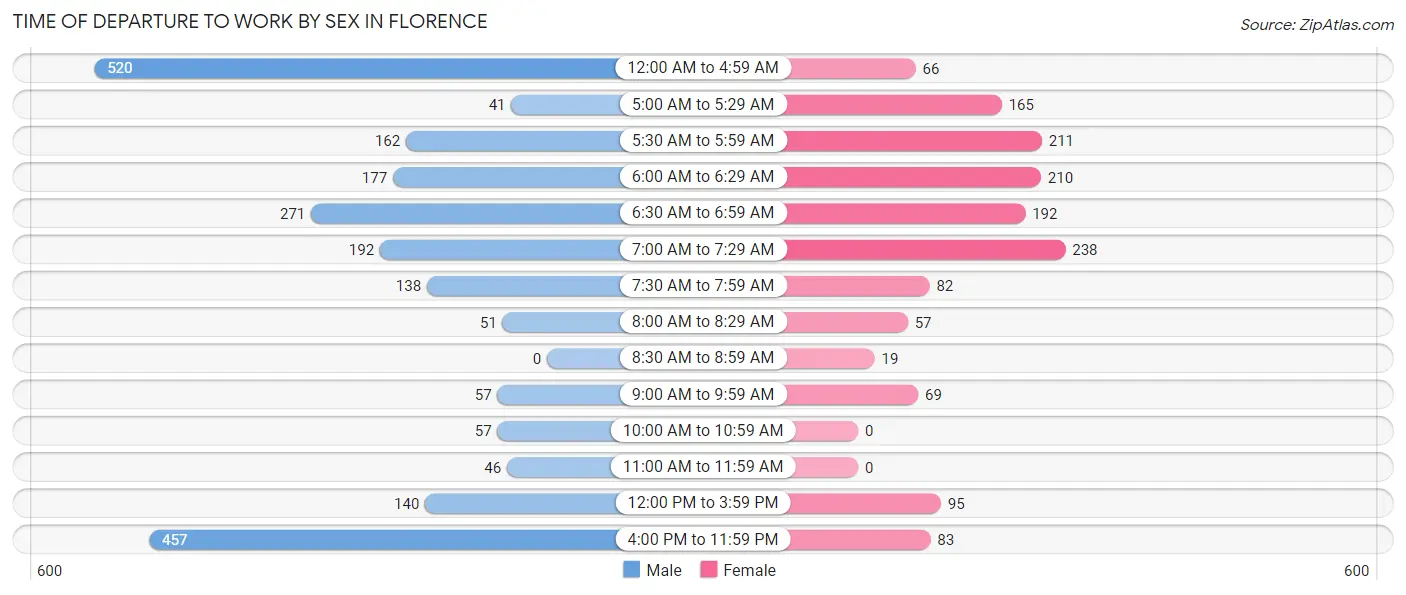
| Time of Departure | Male | Female |
| 12:00 AM to 4:59 AM | 520 (22.5%) | 66 (4.4%) |
| 5:00 AM to 5:29 AM | 41 (1.8%) | 165 (11.1%) |
| 5:30 AM to 5:59 AM | 162 (7.0%) | 211 (14.2%) |
| 6:00 AM to 6:29 AM | 177 (7.7%) | 210 (14.1%) |
| 6:30 AM to 6:59 AM | 271 (11.7%) | 192 (12.9%) |
| 7:00 AM to 7:29 AM | 192 (8.3%) | 238 (16.0%) |
| 7:30 AM to 7:59 AM | 138 (6.0%) | 82 (5.5%) |
| 8:00 AM to 8:29 AM | 51 (2.2%) | 57 (3.8%) |
| 8:30 AM to 8:59 AM | 0 (0.0%) | 19 (1.3%) |
| 9:00 AM to 9:59 AM | 57 (2.5%) | 69 (4.6%) |
| 10:00 AM to 10:59 AM | 57 (2.5%) | 0 (0.0%) |
| 11:00 AM to 11:59 AM | 46 (2.0%) | 0 (0.0%) |
| 12:00 PM to 3:59 PM | 140 (6.1%) | 95 (6.4%) |
| 4:00 PM to 11:59 PM | 457 (19.8%) | 83 (5.6%) |
| Total | 2,309 (100.0%) | 1,487 (100.0%) |
Housing Occupancy in Florence
Occupancy by Ownership in Florence
Of the total 5,670 dwellings in Florence, owner-occupied units account for 4,688 (82.7%), while renter-occupied units make up 982 (17.3%).
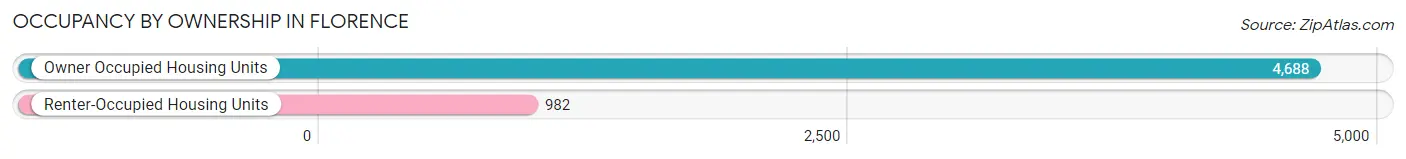
| Occupancy | # Housing Units | % Housing Units |
| Owner Occupied Housing Units | 4,688 | 82.7% |
| Renter-Occupied Housing Units | 982 | 17.3% |
| Total Occupied Housing Units | 5,670 | 100.0% |
Occupancy by Household Size in Florence
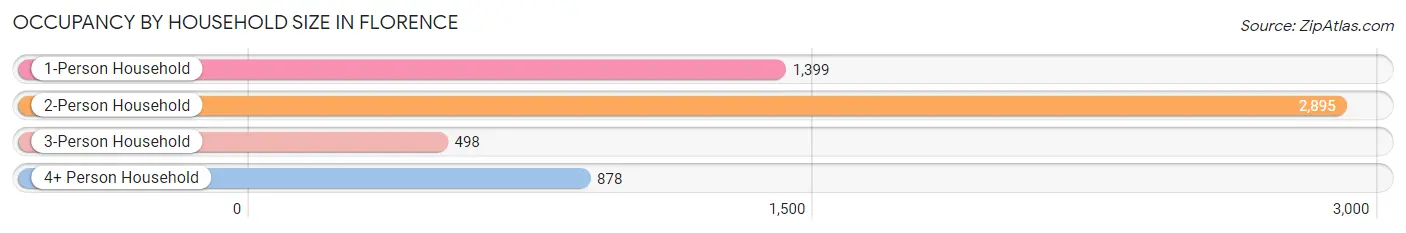
| Household Size | # Housing Units | % Housing Units |
| 1-Person Household | 1,399 | 24.7% |
| 2-Person Household | 2,895 | 51.1% |
| 3-Person Household | 498 | 8.8% |
| 4+ Person Household | 878 | 15.5% |
| Total Housing Units | 5,670 | 100.0% |
Occupancy by Ownership by Household Size in Florence
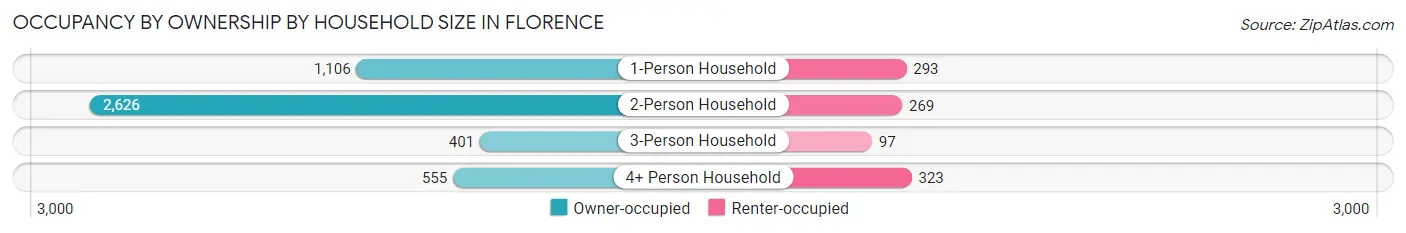
| Household Size | Owner-occupied | Renter-occupied |
| 1-Person Household | 1,106 (79.1%) | 293 (20.9%) |
| 2-Person Household | 2,626 (90.7%) | 269 (9.3%) |
| 3-Person Household | 401 (80.5%) | 97 (19.5%) |
| 4+ Person Household | 555 (63.2%) | 323 (36.8%) |
| Total Housing Units | 4,688 (82.7%) | 982 (17.3%) |
Occupancy by Educational Attainment in Florence
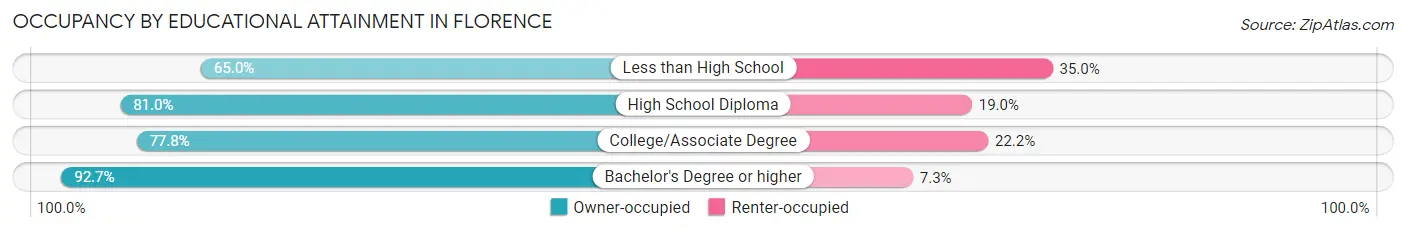
| Household Size | Owner-occupied | Renter-occupied |
| Less than High School | 160 (65.0%) | 86 (35.0%) |
| High School Diploma | 1,077 (81.0%) | 252 (19.0%) |
| College/Associate Degree | 1,807 (77.8%) | 515 (22.2%) |
| Bachelor's Degree or higher | 1,644 (92.7%) | 129 (7.3%) |
Occupancy by Age of Householder in Florence
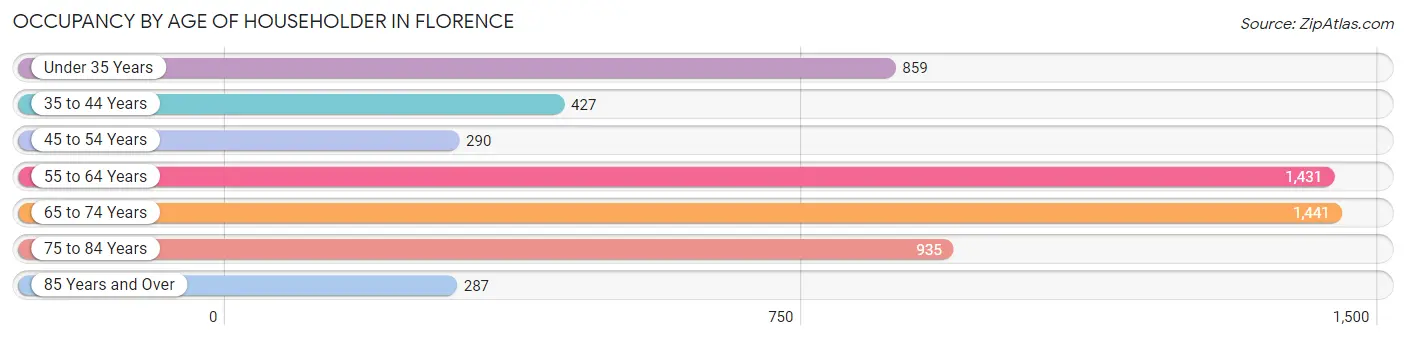
| Age Bracket | # Households | % Households |
| Under 35 Years | 859 | 15.1% |
| 35 to 44 Years | 427 | 7.5% |
| 45 to 54 Years | 290 | 5.1% |
| 55 to 64 Years | 1,431 | 25.2% |
| 65 to 74 Years | 1,441 | 25.4% |
| 75 to 84 Years | 935 | 16.5% |
| 85 Years and Over | 287 | 5.1% |
| Total | 5,670 | 100.0% |
Housing Finances in Florence
Median Income by Occupancy in Florence
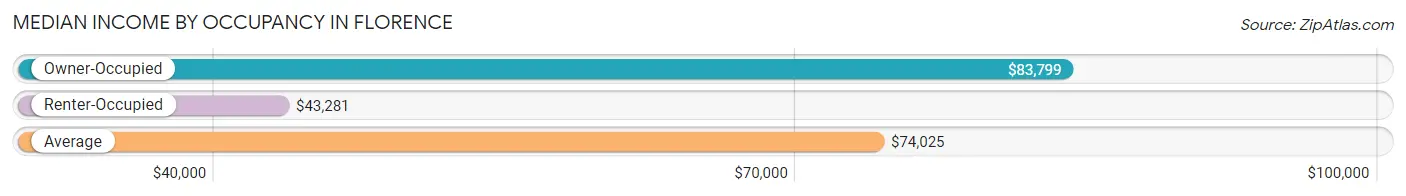
| Occupancy Type | # Households | Median Income |
| Owner-Occupied | 4,688 (82.7%) | $83,799 |
| Renter-Occupied | 982 (17.3%) | $43,281 |
| Average | 5,670 (100.0%) | $74,025 |
Occupancy by Householder Income Bracket in Florence
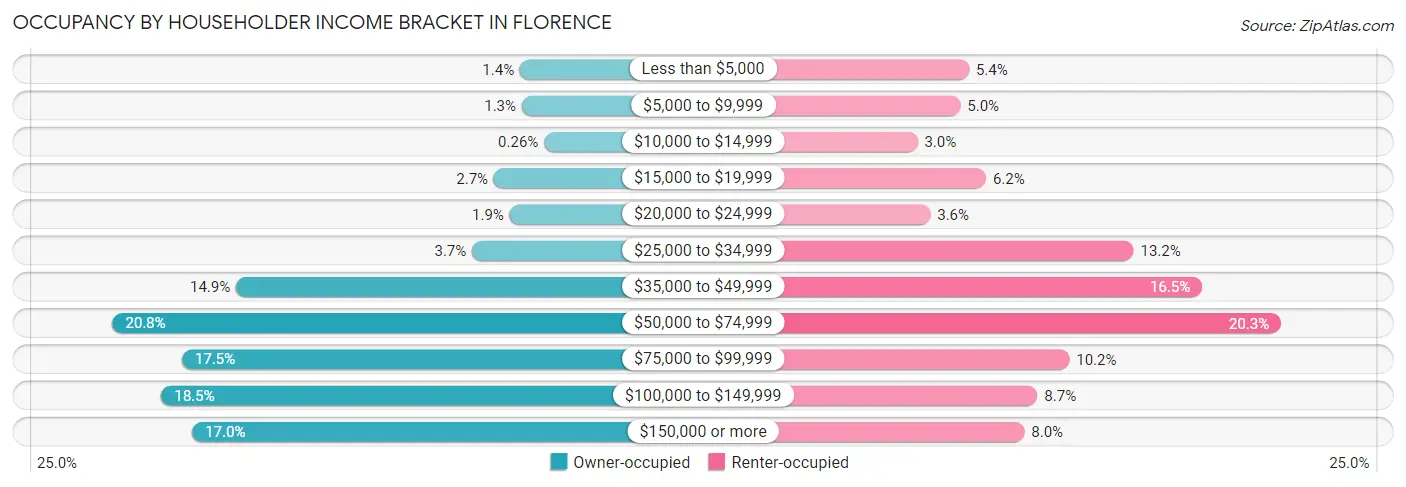
| Income Bracket | Owner-occupied | Renter-occupied |
| Less than $5,000 | 66 (1.4%) | 53 (5.4%) |
| $5,000 to $9,999 | 62 (1.3%) | 49 (5.0%) |
| $10,000 to $14,999 | 12 (0.3%) | 29 (2.9%) |
| $15,000 to $19,999 | 124 (2.6%) | 61 (6.2%) |
| $20,000 to $24,999 | 89 (1.9%) | 35 (3.6%) |
| $25,000 to $34,999 | 173 (3.7%) | 130 (13.2%) |
| $35,000 to $49,999 | 700 (14.9%) | 162 (16.5%) |
| $50,000 to $74,999 | 976 (20.8%) | 199 (20.3%) |
| $75,000 to $99,999 | 821 (17.5%) | 100 (10.2%) |
| $100,000 to $149,999 | 867 (18.5%) | 85 (8.7%) |
| $150,000 or more | 798 (17.0%) | 79 (8.0%) |
| Total | 4,688 (100.0%) | 982 (100.0%) |
Monthly Housing Cost Tiers in Florence
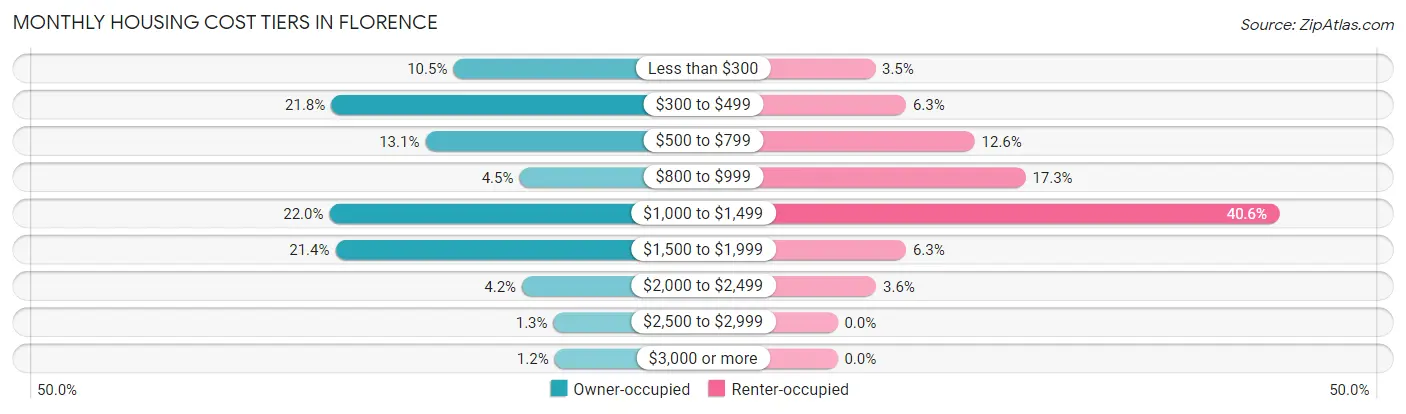
| Monthly Cost | Owner-occupied | Renter-occupied |
| Less than $300 | 494 (10.5%) | 34 (3.5%) |
| $300 to $499 | 1,021 (21.8%) | 62 (6.3%) |
| $500 to $799 | 615 (13.1%) | 124 (12.6%) |
| $800 to $999 | 209 (4.5%) | 170 (17.3%) |
| $1,000 to $1,499 | 1,029 (22.0%) | 399 (40.6%) |
| $1,500 to $1,999 | 1,003 (21.4%) | 62 (6.3%) |
| $2,000 to $2,499 | 198 (4.2%) | 35 (3.6%) |
| $2,500 to $2,999 | 62 (1.3%) | 0 (0.0%) |
| $3,000 or more | 57 (1.2%) | 0 (0.0%) |
| Total | 4,688 (100.0%) | 982 (100.0%) |
Physical Housing Characteristics in Florence
Housing Structures in Florence
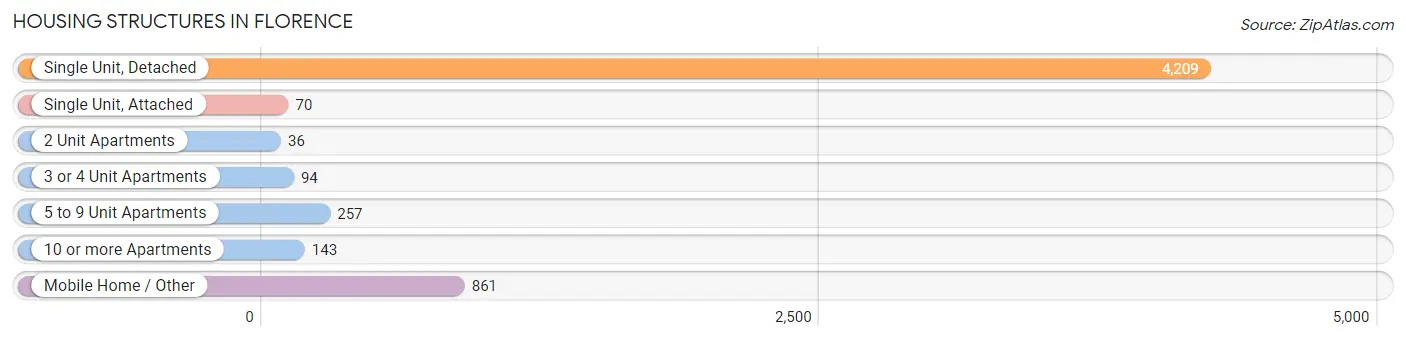
| Structure Type | # Housing Units | % Housing Units |
| Single Unit, Detached | 4,209 | 74.2% |
| Single Unit, Attached | 70 | 1.2% |
| 2 Unit Apartments | 36 | 0.6% |
| 3 or 4 Unit Apartments | 94 | 1.7% |
| 5 to 9 Unit Apartments | 257 | 4.5% |
| 10 or more Apartments | 143 | 2.5% |
| Mobile Home / Other | 861 | 15.2% |
| Total | 5,670 | 100.0% |
Housing Structures by Occupancy in Florence
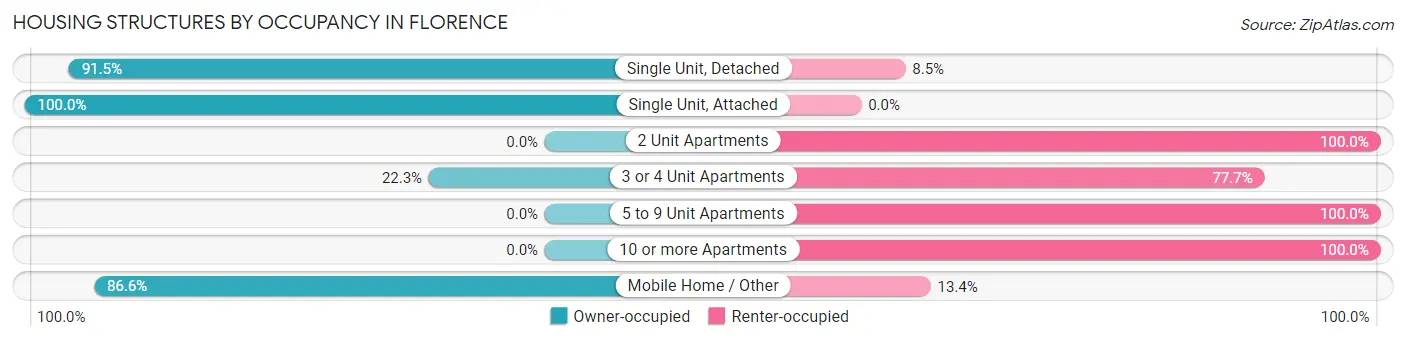
| Structure Type | Owner-occupied | Renter-occupied |
| Single Unit, Detached | 3,851 (91.5%) | 358 (8.5%) |
| Single Unit, Attached | 70 (100.0%) | 0 (0.0%) |
| 2 Unit Apartments | 0 (0.0%) | 36 (100.0%) |
| 3 or 4 Unit Apartments | 21 (22.3%) | 73 (77.7%) |
| 5 to 9 Unit Apartments | 0 (0.0%) | 257 (100.0%) |
| 10 or more Apartments | 0 (0.0%) | 143 (100.0%) |
| Mobile Home / Other | 746 (86.6%) | 115 (13.4%) |
| Total | 4,688 (82.7%) | 982 (17.3%) |
Housing Structures by Number of Rooms in Florence
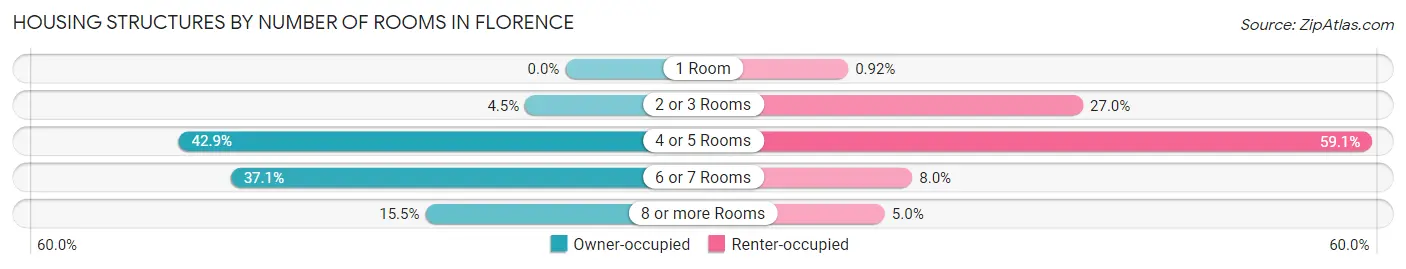
| Number of Rooms | Owner-occupied | Renter-occupied |
| 1 Room | 0 (0.0%) | 9 (0.9%) |
| 2 or 3 Rooms | 209 (4.5%) | 265 (27.0%) |
| 4 or 5 Rooms | 2,011 (42.9%) | 580 (59.1%) |
| 6 or 7 Rooms | 1,740 (37.1%) | 79 (8.0%) |
| 8 or more Rooms | 728 (15.5%) | 49 (5.0%) |
| Total | 4,688 (100.0%) | 982 (100.0%) |
Housing Structure by Heating Type in Florence
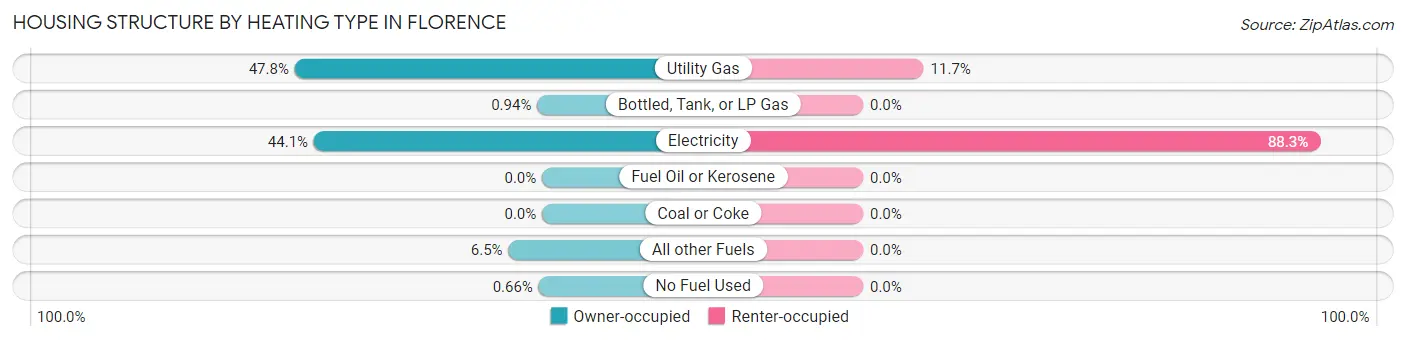
| Heating Type | Owner-occupied | Renter-occupied |
| Utility Gas | 2,241 (47.8%) | 115 (11.7%) |
| Bottled, Tank, or LP Gas | 44 (0.9%) | 0 (0.0%) |
| Electricity | 2,067 (44.1%) | 867 (88.3%) |
| Fuel Oil or Kerosene | 0 (0.0%) | 0 (0.0%) |
| Coal or Coke | 0 (0.0%) | 0 (0.0%) |
| All other Fuels | 305 (6.5%) | 0 (0.0%) |
| No Fuel Used | 31 (0.7%) | 0 (0.0%) |
| Total | 4,688 (100.0%) | 982 (100.0%) |
Household Vehicle Usage in Florence
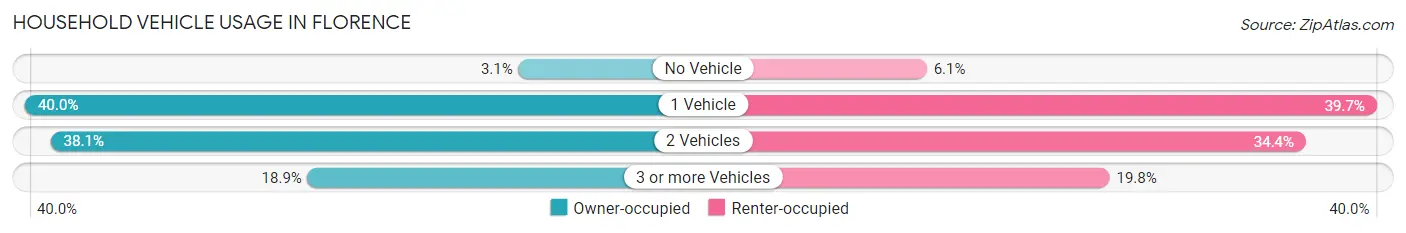
| Vehicles per Household | Owner-occupied | Renter-occupied |
| No Vehicle | 146 (3.1%) | 60 (6.1%) |
| 1 Vehicle | 1,874 (40.0%) | 390 (39.7%) |
| 2 Vehicles | 1,784 (38.1%) | 338 (34.4%) |
| 3 or more Vehicles | 884 (18.9%) | 194 (19.8%) |
| Total | 4,688 (100.0%) | 982 (100.0%) |
Real Estate & Mortgages in Florence
Real Estate and Mortgage Overview in Florence
| Characteristic | Without Mortgage | With Mortgage |
| Housing Units | 2,155 | 2,533 |
| Median Property Value | $208,700 | $342,500 |
| Median Household Income | $71,588 | $520 |
| Monthly Housing Costs | $353 | $41 |
| Real Estate Taxes | $1,926 | $105 |
Property Value by Mortgage Status in Florence
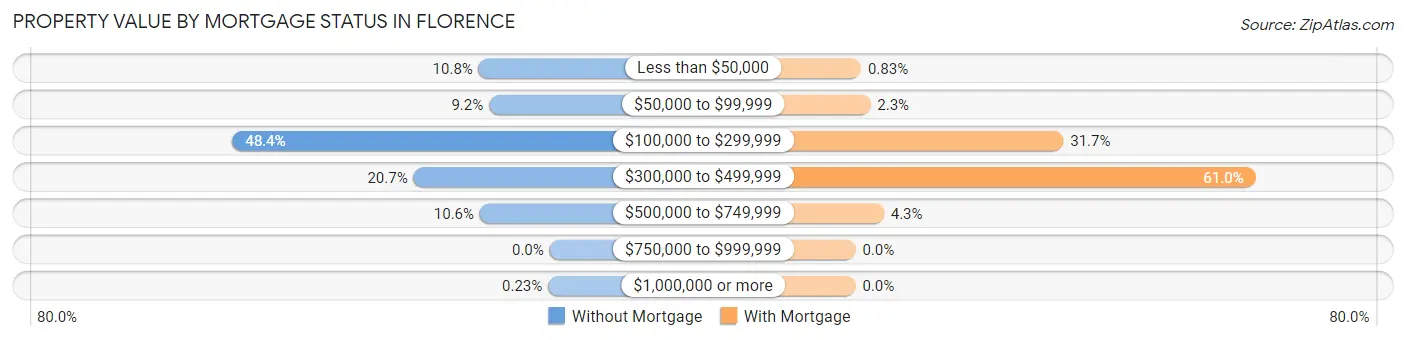
| Property Value | Without Mortgage | With Mortgage |
| Less than $50,000 | 233 (10.8%) | 21 (0.8%) |
| $50,000 to $99,999 | 199 (9.2%) | 57 (2.2%) |
| $100,000 to $299,999 | 1,042 (48.3%) | 802 (31.7%) |
| $300,000 to $499,999 | 447 (20.7%) | 1,544 (61.0%) |
| $500,000 to $749,999 | 229 (10.6%) | 109 (4.3%) |
| $750,000 to $999,999 | 0 (0.0%) | 0 (0.0%) |
| $1,000,000 or more | 5 (0.2%) | 0 (0.0%) |
| Total | 2,155 (100.0%) | 2,533 (100.0%) |
Household Income by Mortgage Status in Florence
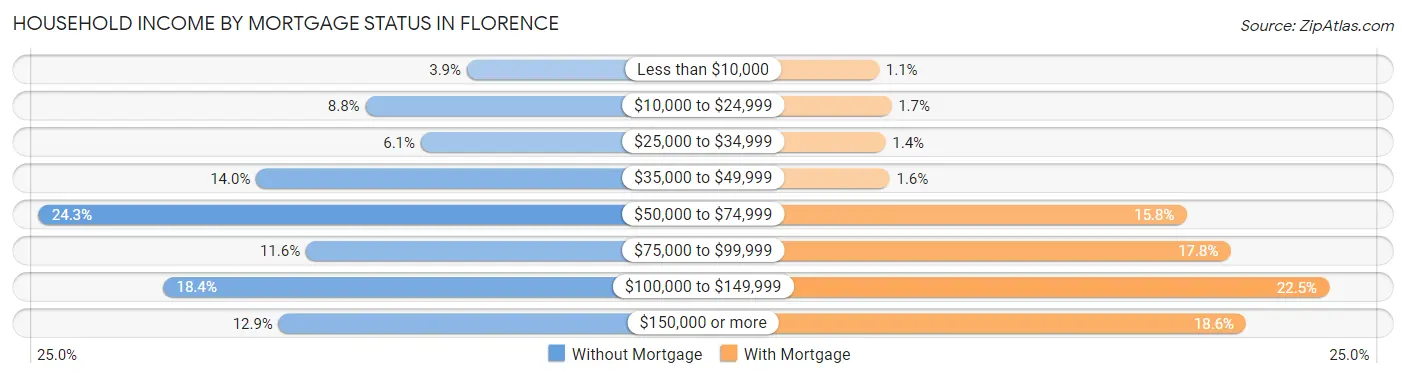
| Household Income | Without Mortgage | With Mortgage |
| Less than $10,000 | 85 (3.9%) | 28 (1.1%) |
| $10,000 to $24,999 | 189 (8.8%) | 43 (1.7%) |
| $25,000 to $34,999 | 132 (6.1%) | 36 (1.4%) |
| $35,000 to $49,999 | 301 (14.0%) | 41 (1.6%) |
| $50,000 to $74,999 | 524 (24.3%) | 399 (15.8%) |
| $75,000 to $99,999 | 250 (11.6%) | 452 (17.8%) |
| $100,000 to $149,999 | 396 (18.4%) | 571 (22.5%) |
| $150,000 or more | 278 (12.9%) | 471 (18.6%) |
| Total | 2,155 (100.0%) | 2,533 (100.0%) |
Property Value to Household Income Ratio in Florence
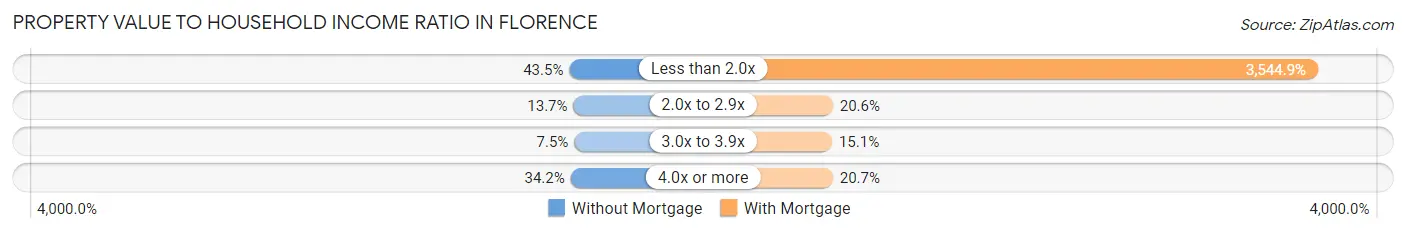
| Value-to-Income Ratio | Without Mortgage | With Mortgage |
| Less than 2.0x | 937 (43.5%) | 89,792 (3,544.9%) |
| 2.0x to 2.9x | 296 (13.7%) | 522 (20.6%) |
| 3.0x to 3.9x | 162 (7.5%) | 383 (15.1%) |
| 4.0x or more | 737 (34.2%) | 525 (20.7%) |
| Total | 2,155 (100.0%) | 2,533 (100.0%) |
Real Estate Taxes by Mortgage Status in Florence
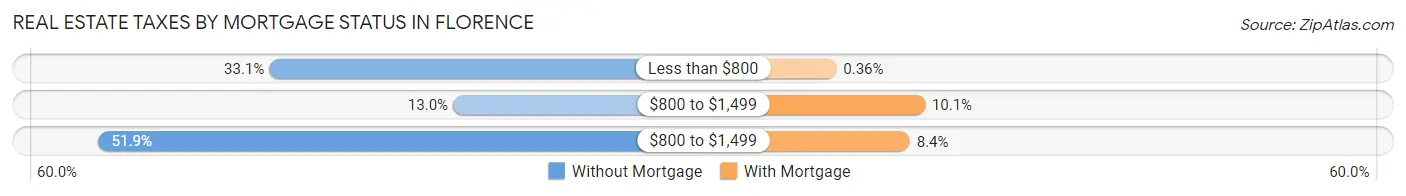
| Property Taxes | Without Mortgage | With Mortgage |
| Less than $800 | 713 (33.1%) | 9 (0.4%) |
| $800 to $1,499 | 279 (13.0%) | 255 (10.1%) |
| $800 to $1,499 | 1,118 (51.9%) | 213 (8.4%) |
| Total | 2,155 (100.0%) | 2,533 (100.0%) |
Health & Disability in Florence
Health Insurance Coverage by Age in Florence
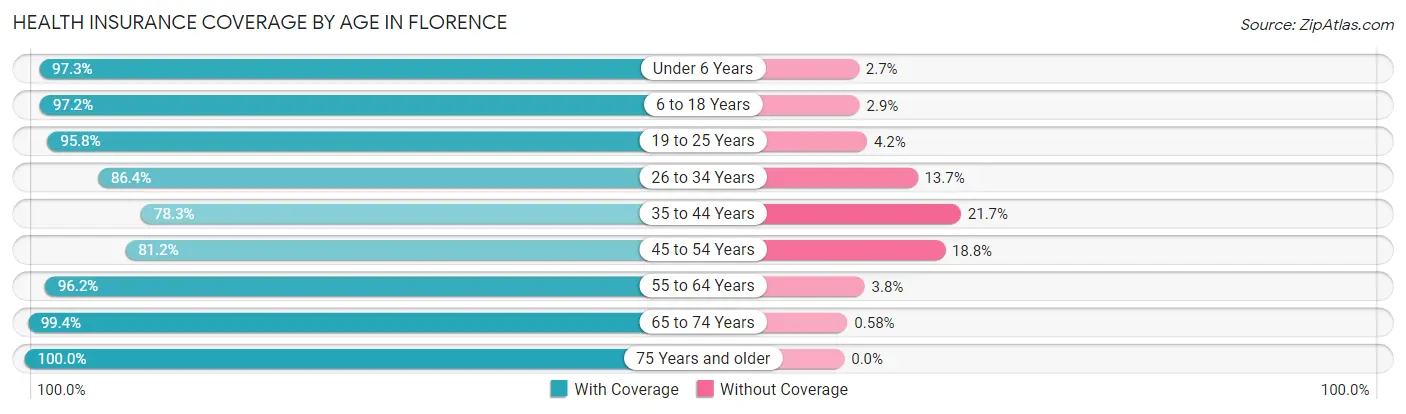
| Age Bracket | With Coverage | Without Coverage |
| Under 6 Years | 537 (97.3%) | 15 (2.7%) |
| 6 to 18 Years | 1,260 (97.2%) | 37 (2.9%) |
| 19 to 25 Years | 723 (95.8%) | 32 (4.2%) |
| 26 to 34 Years | 1,177 (86.4%) | 186 (13.7%) |
| 35 to 44 Years | 853 (78.3%) | 237 (21.7%) |
| 45 to 54 Years | 740 (81.2%) | 171 (18.8%) |
| 55 to 64 Years | 2,383 (96.2%) | 94 (3.8%) |
| 65 to 74 Years | 2,760 (99.4%) | 16 (0.6%) |
| 75 Years and older | 1,863 (100.0%) | 0 (0.0%) |
| Total | 12,296 (94.0%) | 788 (6.0%) |
Health Insurance Coverage by Citizenship Status in Florence
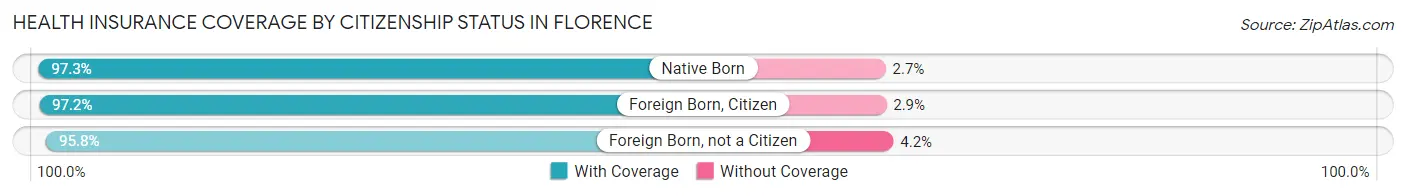
| Citizenship Status | With Coverage | Without Coverage |
| Native Born | 537 (97.3%) | 15 (2.7%) |
| Foreign Born, Citizen | 1,260 (97.2%) | 37 (2.9%) |
| Foreign Born, not a Citizen | 723 (95.8%) | 32 (4.2%) |
Health Insurance Coverage by Household Income in Florence
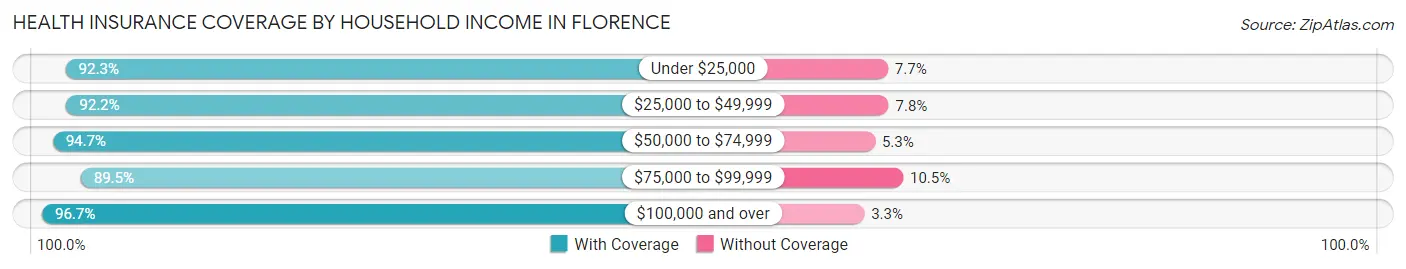
| Household Income | With Coverage | Without Coverage |
| Under $25,000 | 851 (92.3%) | 71 (7.7%) |
| $25,000 to $49,999 | 1,943 (92.2%) | 165 (7.8%) |
| $50,000 to $74,999 | 2,677 (94.7%) | 149 (5.3%) |
| $75,000 to $99,999 | 2,055 (89.5%) | 242 (10.5%) |
| $100,000 and over | 4,770 (96.7%) | 161 (3.3%) |
Public vs Private Health Insurance Coverage by Age in Florence
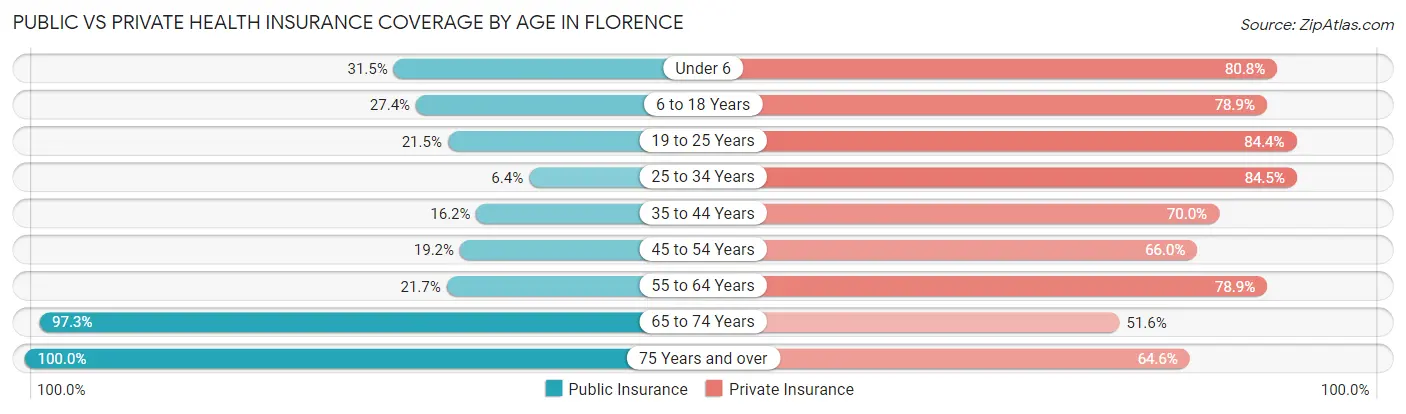
| Age Bracket | Public Insurance | Private Insurance |
| Under 6 | 174 (31.5%) | 446 (80.8%) |
| 6 to 18 Years | 355 (27.4%) | 1,023 (78.9%) |
| 19 to 25 Years | 162 (21.5%) | 637 (84.4%) |
| 25 to 34 Years | 87 (6.4%) | 1,151 (84.5%) |
| 35 to 44 Years | 176 (16.2%) | 763 (70.0%) |
| 45 to 54 Years | 175 (19.2%) | 601 (66.0%) |
| 55 to 64 Years | 537 (21.7%) | 1,955 (78.9%) |
| 65 to 74 Years | 2,701 (97.3%) | 1,431 (51.5%) |
| 75 Years and over | 1,863 (100.0%) | 1,203 (64.6%) |
| Total | 6,230 (47.6%) | 9,210 (70.4%) |
Disability Status by Sex by Age in Florence
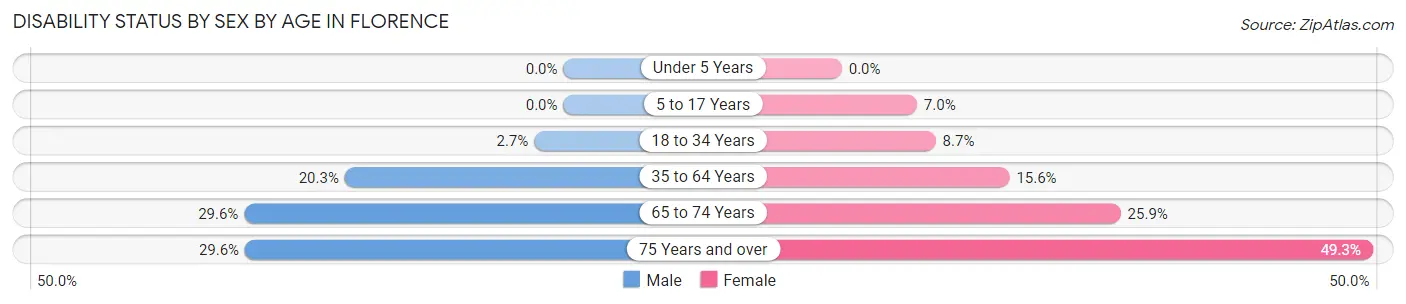
| Age Bracket | Male | Female |
| Under 5 Years | 0 (0.0%) | 0 (0.0%) |
| 5 to 17 Years | 0 (0.0%) | 43 (7.0%) |
| 18 to 34 Years | 33 (2.7%) | 91 (8.7%) |
| 35 to 64 Years | 469 (20.3%) | 337 (15.6%) |
| 65 to 74 Years | 377 (29.6%) | 389 (25.9%) |
| 75 Years and over | 289 (29.5%) | 436 (49.3%) |
Disability Class by Sex by Age in Florence
Disability Class: Hearing Difficulty
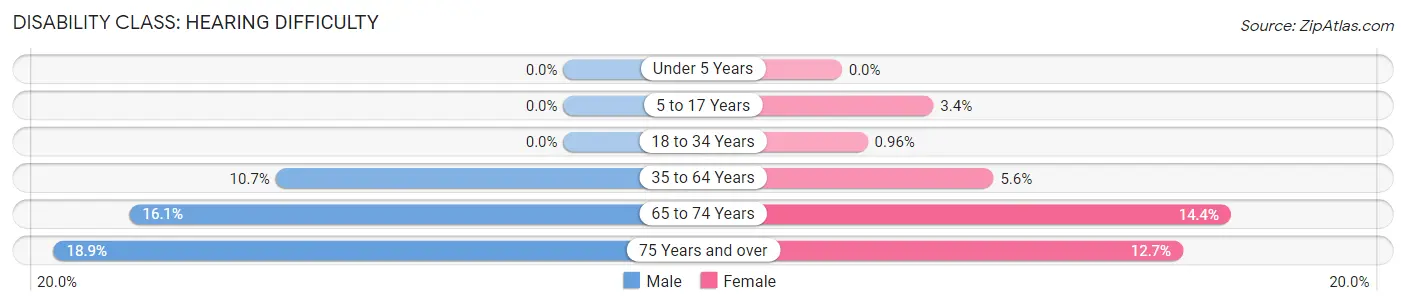
| Age Bracket | Male | Female |
| Under 5 Years | 0 (0.0%) | 0 (0.0%) |
| 5 to 17 Years | 0 (0.0%) | 21 (3.4%) |
| 18 to 34 Years | 0 (0.0%) | 10 (1.0%) |
| 35 to 64 Years | 247 (10.7%) | 122 (5.6%) |
| 65 to 74 Years | 205 (16.1%) | 217 (14.4%) |
| 75 Years and over | 185 (18.9%) | 112 (12.7%) |
Disability Class: Vision Difficulty
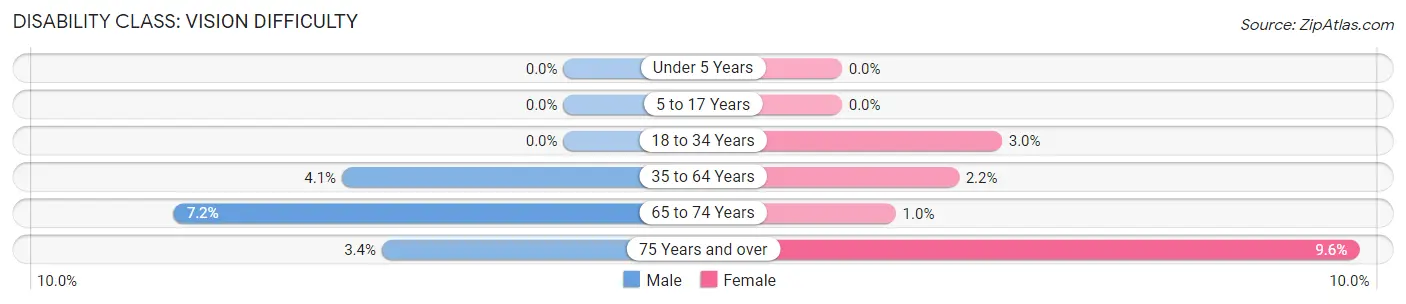
| Age Bracket | Male | Female |
| Under 5 Years | 0 (0.0%) | 0 (0.0%) |
| 5 to 17 Years | 0 (0.0%) | 0 (0.0%) |
| 18 to 34 Years | 0 (0.0%) | 31 (3.0%) |
| 35 to 64 Years | 95 (4.1%) | 47 (2.2%) |
| 65 to 74 Years | 92 (7.2%) | 15 (1.0%) |
| 75 Years and over | 33 (3.4%) | 85 (9.6%) |
Disability Class: Cognitive Difficulty
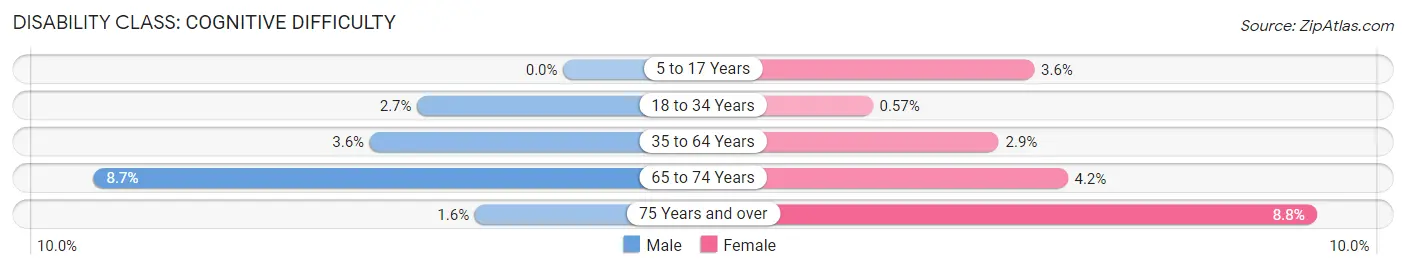
| Age Bracket | Male | Female |
| 5 to 17 Years | 0 (0.0%) | 22 (3.6%) |
| 18 to 34 Years | 33 (2.7%) | 6 (0.6%) |
| 35 to 64 Years | 83 (3.6%) | 63 (2.9%) |
| 65 to 74 Years | 111 (8.7%) | 63 (4.2%) |
| 75 Years and over | 16 (1.6%) | 78 (8.8%) |
Disability Class: Ambulatory Difficulty
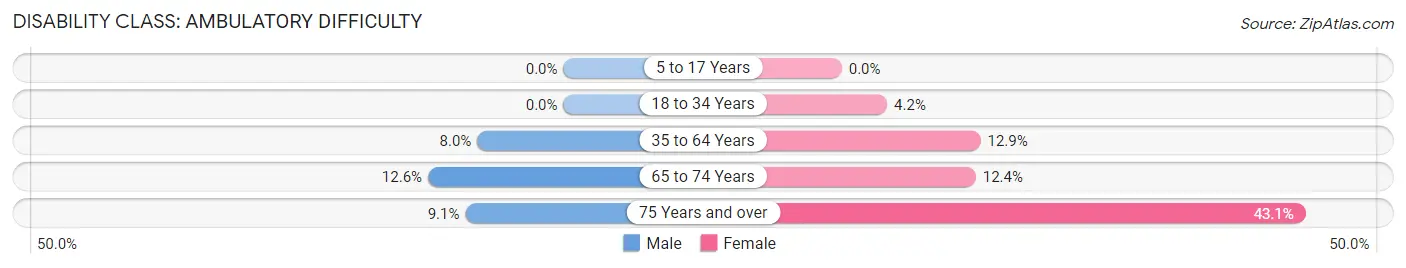
| Age Bracket | Male | Female |
| 5 to 17 Years | 0 (0.0%) | 0 (0.0%) |
| 18 to 34 Years | 0 (0.0%) | 44 (4.2%) |
| 35 to 64 Years | 185 (8.0%) | 279 (12.9%) |
| 65 to 74 Years | 160 (12.6%) | 187 (12.4%) |
| 75 Years and over | 89 (9.1%) | 381 (43.0%) |
Disability Class: Self-Care Difficulty
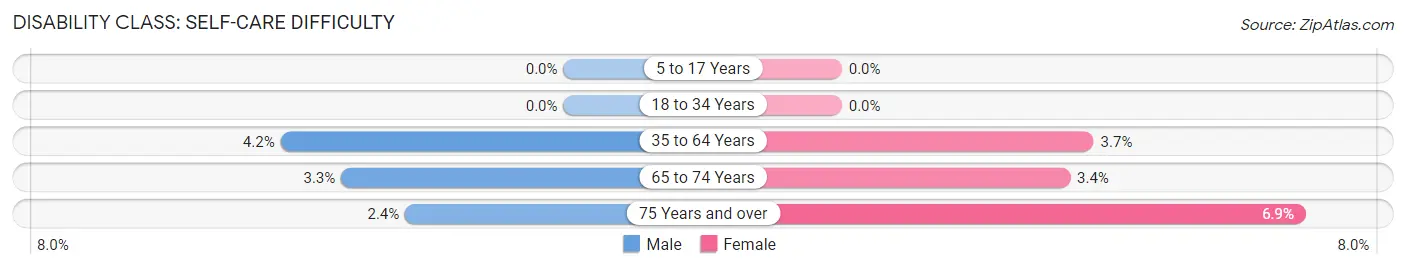
| Age Bracket | Male | Female |
| 5 to 17 Years | 0 (0.0%) | 0 (0.0%) |
| 18 to 34 Years | 0 (0.0%) | 0 (0.0%) |
| 35 to 64 Years | 97 (4.2%) | 81 (3.7%) |
| 65 to 74 Years | 42 (3.3%) | 51 (3.4%) |
| 75 Years and over | 23 (2.4%) | 61 (6.9%) |
Technology Access in Florence
Computing Device Access in Florence
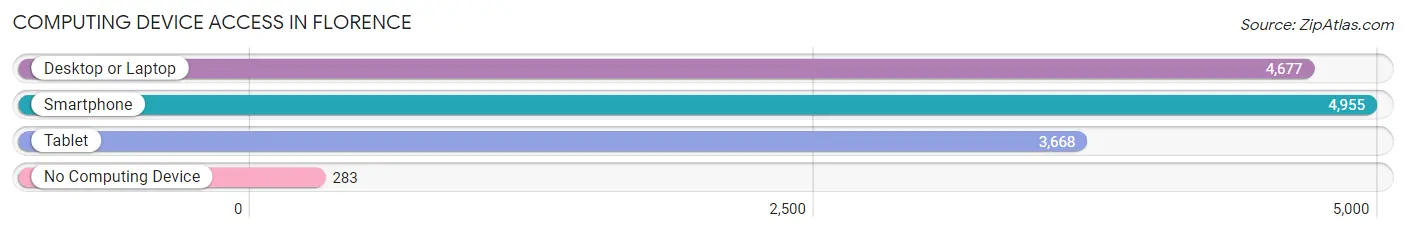
| Device Type | # Households | % Households |
| Desktop or Laptop | 4,677 | 82.5% |
| Smartphone | 4,955 | 87.4% |
| Tablet | 3,668 | 64.7% |
| No Computing Device | 283 | 5.0% |
| Total | 5,670 | 100.0% |
Internet Access in Florence
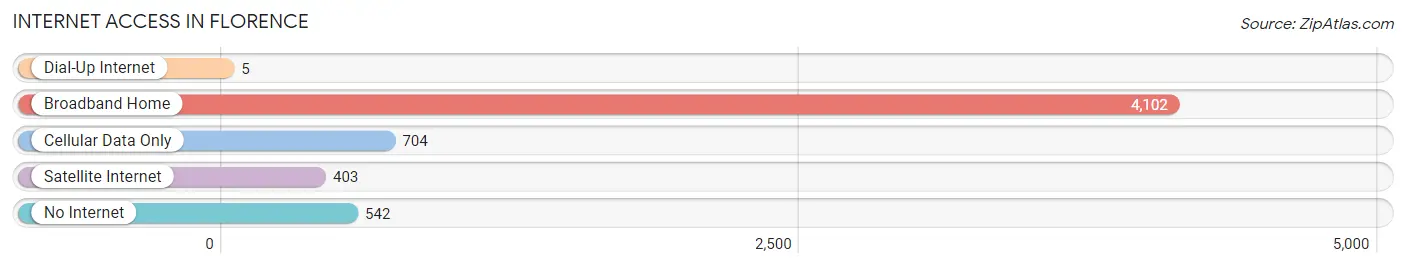
| Internet Type | # Households | % Households |
| Dial-Up Internet | 5 | 0.1% |
| Broadband Home | 4,102 | 72.4% |
| Cellular Data Only | 704 | 12.4% |
| Satellite Internet | 403 | 7.1% |
| No Internet | 542 | 9.6% |
| Total | 5,670 | 100.0% |
Florence Summary
Florence, Arizona is a small town located in Pinal County, Arizona, about 60 miles southeast of Phoenix. It is the county seat of Pinal County and has a population of approximately 25,000 people. The town was founded in 1866 and is the oldest continuously inhabited community in the state of Arizona.
History
Florence was founded in 1866 by William S. Oury, a Confederate veteran of the Civil War. Oury named the town after his daughter, Florence. The town was originally a stagecoach stop on the Butterfield Overland Mail route. In 1871, the town was incorporated and became the county seat of Pinal County.
In the late 1800s, Florence was a bustling mining town. The town was home to several copper mines, including the Florence Copper Mine, which was the first copper mine in Arizona. The town also had a number of saloons, hotels, and other businesses.
In the early 1900s, Florence began to decline as the mining industry in the area began to decline. The town was also hit hard by the Great Depression. In the 1940s, the town began to experience a resurgence as the military began to use the area for training. The town was also home to a number of prisoner of war camps during World War II.
Geography
Florence is located in the Sonoran Desert in Pinal County, Arizona. The town is situated at an elevation of 1,890 feet and is surrounded by the Gila and Santa Cruz Rivers. The town is located about 60 miles southeast of Phoenix and is about a two-hour drive from Tucson.
The town is located in a semi-arid climate, with hot summers and mild winters. The average temperature in the summer is around 100 degrees Fahrenheit, while the average temperature in the winter is around 60 degrees Fahrenheit.
Economy
Florence is a small town with a population of about 25,000 people. The town is home to a number of small businesses, including restaurants, retail stores, and other services. The town is also home to a number of manufacturing companies, including a copper smelter and a paper mill.
The town is also home to a number of government agencies, including the Pinal County Sheriff's Office, the Arizona Department of Corrections, and the Arizona State Prison Complex. The town is also home to a number of educational institutions, including Central Arizona College and the University of Arizona South.
Demographics
As of the 2010 census, the population of Florence was 25,536. The racial makeup of the town was 75.3% White, 0.9% African American, 1.2% Native American, 0.5% Asian, 0.1% Pacific Islander, 19.2% from other races, and 3.8% from two or more races. Hispanic or Latino of any race were 37.2% of the population.
The median income for a household in Florence was $35,945, and the median income for a family was $41,945. The per capita income for the town was $17,845. About 17.2% of families and 21.3% of the population were below the poverty line, including 28.3% of those under age 18 and 11.2% of those age 65 or over.
Common Questions
What is Per Capita Income in Florence?
Per Capita income in Florence is $24,151.
What is the Median Family Income in Florence?
Median Family Income in Florence is $73,871.
What is the Median Household income in Florence?
Median Household Income in Florence is $74,025.
What is Income or Wage Gap in Florence?
Income or Wage Gap in Florence is 11.1%.
Women in Florence earn 88.9 cents for every dollar earned by a man.
What is Inequality or Gini Index in Florence?
Inequality or Gini Index in Florence is 0.42.
What is the Total Population of Florence?
Total Population of Florence is 25,783.
What is the Total Male Population of Florence?
Total Male Population of Florence is 19,237.
What is the Total Female Population of Florence?
Total Female Population of Florence is 6,546.
What is the Ratio of Males per 100 Females in Florence?
There are 293.87 Males per 100 Females in Florence.
What is the Ratio of Females per 100 Males in Florence?
There are 34.03 Females per 100 Males in Florence.
What is the Median Population Age in Florence?
Median Population Age in Florence is 42.8 Years.
What is the Average Family Size in Florence
Average Family Size in Florence is 2.8 People.
What is the Average Household Size in Florence
Average Household Size in Florence is 2.3 People.
How Large is the Labor Force in Florence?
There are 4,969 People in the Labor Forcein in Florence.
What is the Percentage of People in the Labor Force in Florence?
20.6% of People are in the Labor Force in Florence.
What is the Unemployment Rate in Florence?
Unemployment Rate in Florence is 7.6%.