Casa Grande, AZ Map & Demographics
Casa Grande Map
Casa Grande Overview
$33,262
PER CAPITA INCOME
$69,680
AVG FAMILY INCOME
$64,535
AVG HOUSEHOLD INCOME
23.0%
WAGE / INCOME GAP [ % ]
77.0¢/ $1
WAGE / INCOME GAP [ $ ]
$10,146
FAMILY INCOME DEFICIT
0.47
INEQUALITY / GINI INDEX
55,186
TOTAL POPULATION
28,229
MALE POPULATION
26,957
FEMALE POPULATION
104.72
MALES / 100 FEMALES
95.49
FEMALES / 100 MALES
35.9
MEDIAN AGE
3.2
AVG FAMILY SIZE
2.7
AVG HOUSEHOLD SIZE
24,754
LABOR FORCE [ PEOPLE ]
57.9%
PERCENT IN LABOR FORCE
6.8%
UNEMPLOYMENT RATE
Income in Casa Grande
Income Overview in Casa Grande
Per Capita Income in Casa Grande is $33,262, while median incomes of families and households are $69,680 and $64,535 respectively.
| Characteristic | Number | Measure |
| Per Capita Income | 55,186 | $33,262 |
| Median Family Income | 14,052 | $69,680 |
| Mean Family Income | 14,052 | $99,750 |
| Median Household Income | 20,027 | $64,535 |
| Mean Household Income | 20,027 | $89,469 |
| Income Deficit | 14,052 | $10,146 |
| Wage / Income Gap (%) | 55,186 | 23.05% |
| Wage / Income Gap ($) | 55,186 | 76.95¢ per $1 |
| Gini / Inequality Index | 55,186 | 0.47 |
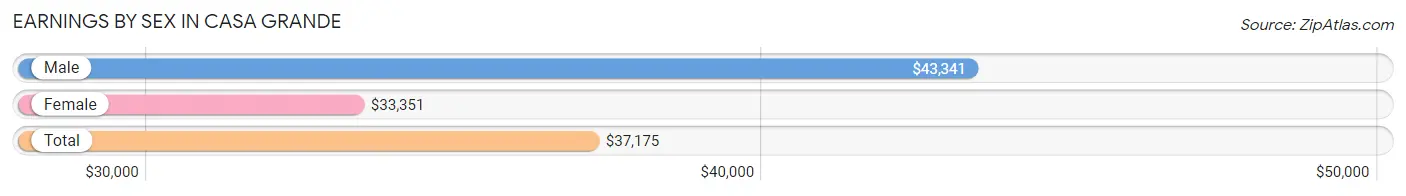
Earnings by Sex in Casa Grande
Average Earnings in Casa Grande are $37,175, $43,341 for men and $33,351 for women, a difference of 23.1%.
| Sex | Number | Average Earnings |
| Male | 13,859 (54.6%) | $43,341 |
| Female | 11,529 (45.4%) | $33,351 |
| Total | 25,388 (100.0%) | $37,175 |
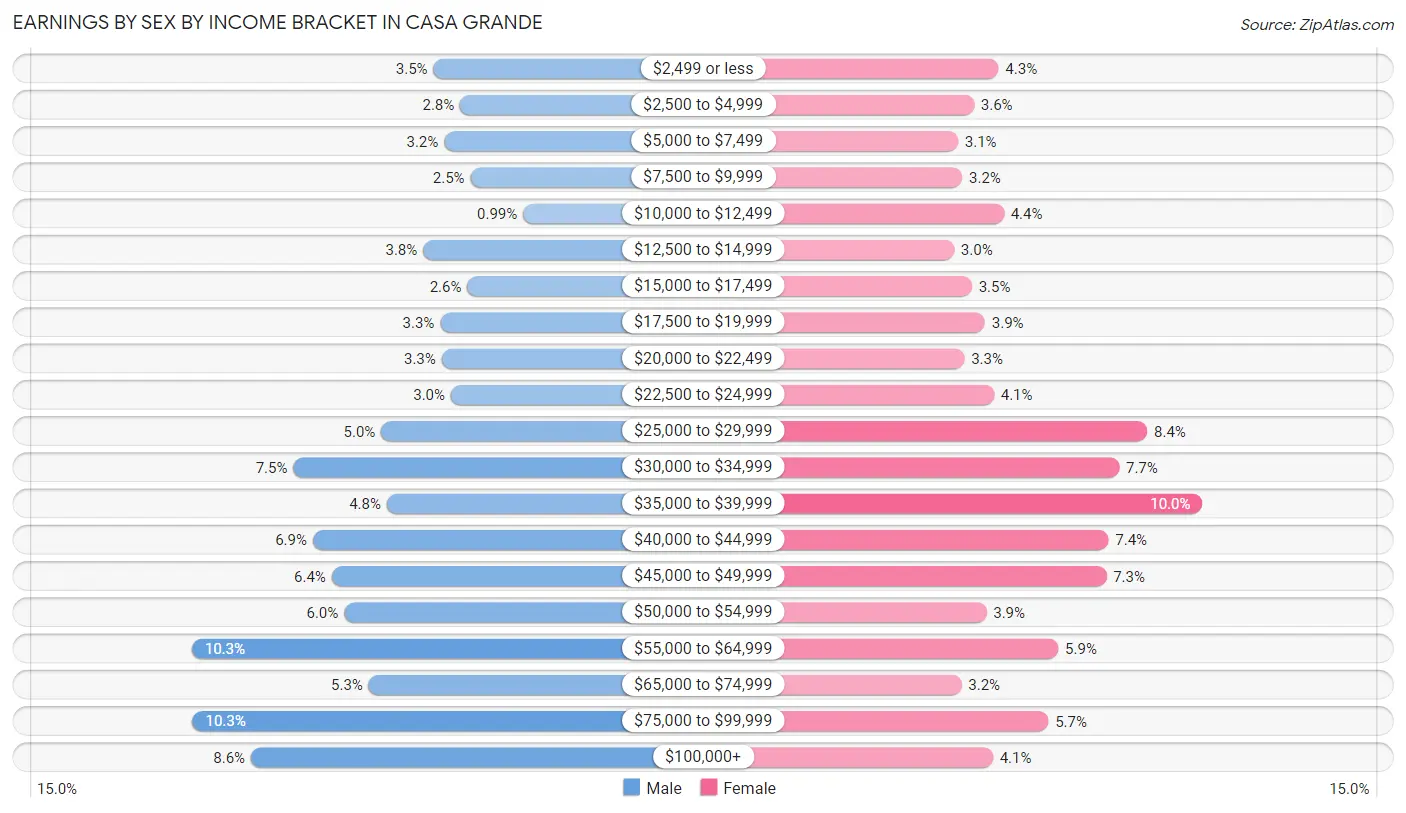
Earnings by Sex by Income Bracket in Casa Grande
The most common earnings brackets in Casa Grande are $55,000 to $64,999 for men (1,427 | 10.3%) and $35,000 to $39,999 for women (1,152 | 10.0%).
| Income | Male | Female |
| $2,499 or less | 486 (3.5%) | 491 (4.3%) |
| $2,500 to $4,999 | 382 (2.8%) | 412 (3.6%) |
| $5,000 to $7,499 | 445 (3.2%) | 360 (3.1%) |
| $7,500 to $9,999 | 343 (2.5%) | 374 (3.2%) |
| $10,000 to $12,499 | 137 (1.0%) | 509 (4.4%) |
| $12,500 to $14,999 | 526 (3.8%) | 347 (3.0%) |
| $15,000 to $17,499 | 355 (2.6%) | 405 (3.5%) |
| $17,500 to $19,999 | 460 (3.3%) | 447 (3.9%) |
| $20,000 to $22,499 | 454 (3.3%) | 380 (3.3%) |
| $22,500 to $24,999 | 419 (3.0%) | 476 (4.1%) |
| $25,000 to $29,999 | 690 (5.0%) | 973 (8.4%) |
| $30,000 to $34,999 | 1,032 (7.4%) | 882 (7.6%) |
| $35,000 to $39,999 | 668 (4.8%) | 1,152 (10.0%) |
| $40,000 to $44,999 | 956 (6.9%) | 847 (7.3%) |
| $45,000 to $49,999 | 883 (6.4%) | 841 (7.3%) |
| $50,000 to $54,999 | 835 (6.0%) | 452 (3.9%) |
| $55,000 to $64,999 | 1,427 (10.3%) | 685 (5.9%) |
| $65,000 to $74,999 | 738 (5.3%) | 371 (3.2%) |
| $75,000 to $99,999 | 1,425 (10.3%) | 652 (5.7%) |
| $100,000+ | 1,198 (8.6%) | 473 (4.1%) |
| Total | 13,859 (100.0%) | 11,529 (100.0%) |
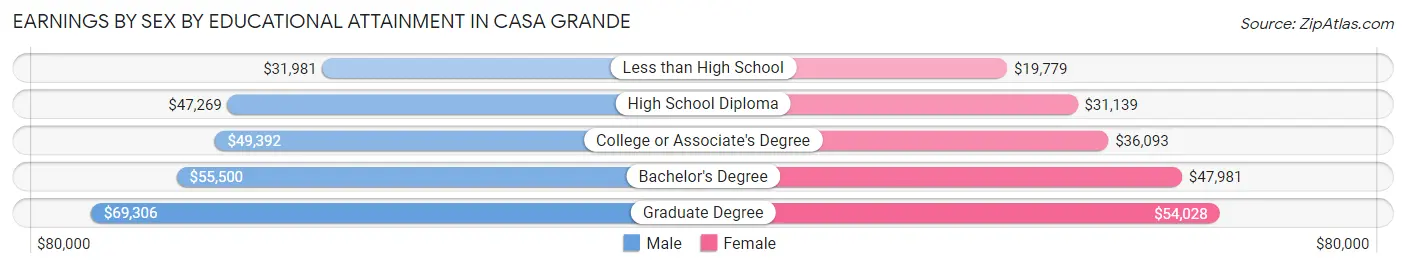
Earnings by Sex by Educational Attainment in Casa Grande
Average earnings in Casa Grande are $48,458 for men and $36,506 for women, a difference of 24.7%. Men with an educational attainment of graduate degree enjoy the highest average annual earnings of $69,306, while those with less than high school education earn the least with $31,981. Women with an educational attainment of graduate degree earn the most with the average annual earnings of $54,028, while those with less than high school education have the smallest earnings of $19,779.
| Educational Attainment | Male Income | Female Income |
| Less than High School | $31,981 | $19,779 |
| High School Diploma | $47,269 | $31,139 |
| College or Associate's Degree | $49,392 | $36,093 |
| Bachelor's Degree | $55,500 | $47,981 |
| Graduate Degree | $69,306 | $54,028 |
| Total | $48,458 | $36,506 |
Family Income in Casa Grande
Family Income Brackets in Casa Grande
According to the Casa Grande family income data, there are 3,063 families falling into the $50,000 to $74,999 income range, which is the most common income bracket and makes up 21.8% of all families. Conversely, the $10,000 to $14,999 income bracket is the least frequent group with only 141 families (1.0%) belonging to this category.
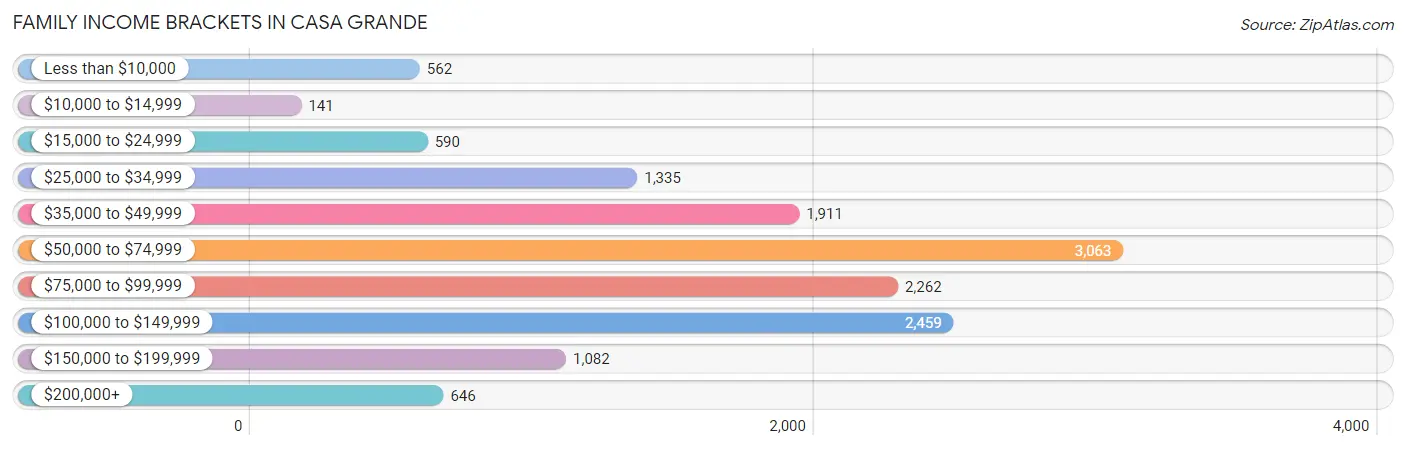
| Income Bracket | # Families | % Families |
| Less than $10,000 | 562 | 4.0% |
| $10,000 to $14,999 | 141 | 1.0% |
| $15,000 to $24,999 | 590 | 4.2% |
| $25,000 to $34,999 | 1,335 | 9.5% |
| $35,000 to $49,999 | 1,911 | 13.6% |
| $50,000 to $74,999 | 3,063 | 21.8% |
| $75,000 to $99,999 | 2,262 | 16.1% |
| $100,000 to $149,999 | 2,459 | 17.5% |
| $150,000 to $199,999 | 1,082 | 7.7% |
| $200,000+ | 646 | 4.6% |
Family Income by Famaliy Size in Casa Grande
7+ person families (224 | 1.6%) account for the highest median family income in Casa Grande with $131,757 per family, while 2-person families (6,482 | 46.1%) have the highest median income of $32,706 per family member.
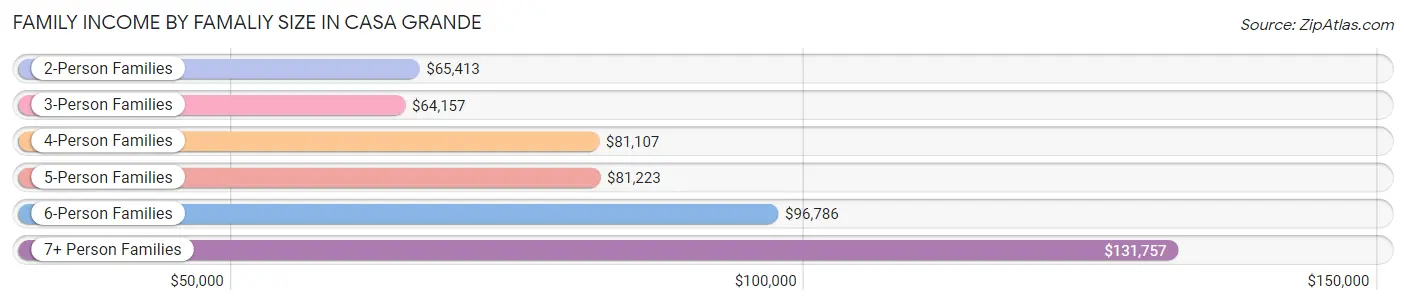
| Income Bracket | # Families | Median Income |
| 2-Person Families | 6,482 (46.1%) | $65,413 |
| 3-Person Families | 2,496 (17.8%) | $64,157 |
| 4-Person Families | 1,938 (13.8%) | $81,107 |
| 5-Person Families | 2,274 (16.2%) | $81,223 |
| 6-Person Families | 638 (4.5%) | $96,786 |
| 7+ Person Families | 224 (1.6%) | $131,757 |
| Total | 14,052 (100.0%) | $69,680 |
Family Income by Number of Earners in Casa Grande
The median family income in Casa Grande is $69,680, with families comprising 3+ earners (1,547) having the highest median family income of $107,298, while families with 1 earner (4,592) have the lowest median family income of $48,917, accounting for 11.0% and 32.7% of families, respectively.
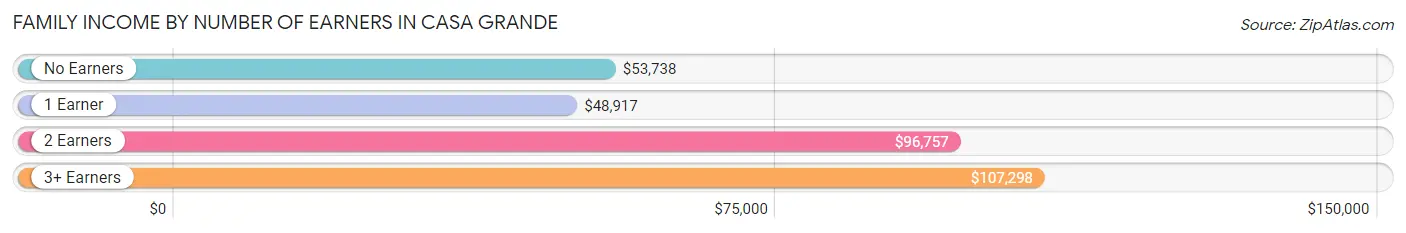
| Number of Earners | # Families | Median Income |
| No Earners | 3,614 (25.7%) | $53,738 |
| 1 Earner | 4,592 (32.7%) | $48,917 |
| 2 Earners | 4,299 (30.6%) | $96,757 |
| 3+ Earners | 1,547 (11.0%) | $107,298 |
| Total | 14,052 (100.0%) | $69,680 |
Household Income in Casa Grande
Household Income Brackets in Casa Grande
With 4,045 households falling in the category, the $50,000 to $74,999 income range is the most frequent in Casa Grande, accounting for 20.2% of all households. In contrast, only 461 households (2.3%) fall into the $10,000 to $14,999 income bracket, making it the least populous group.
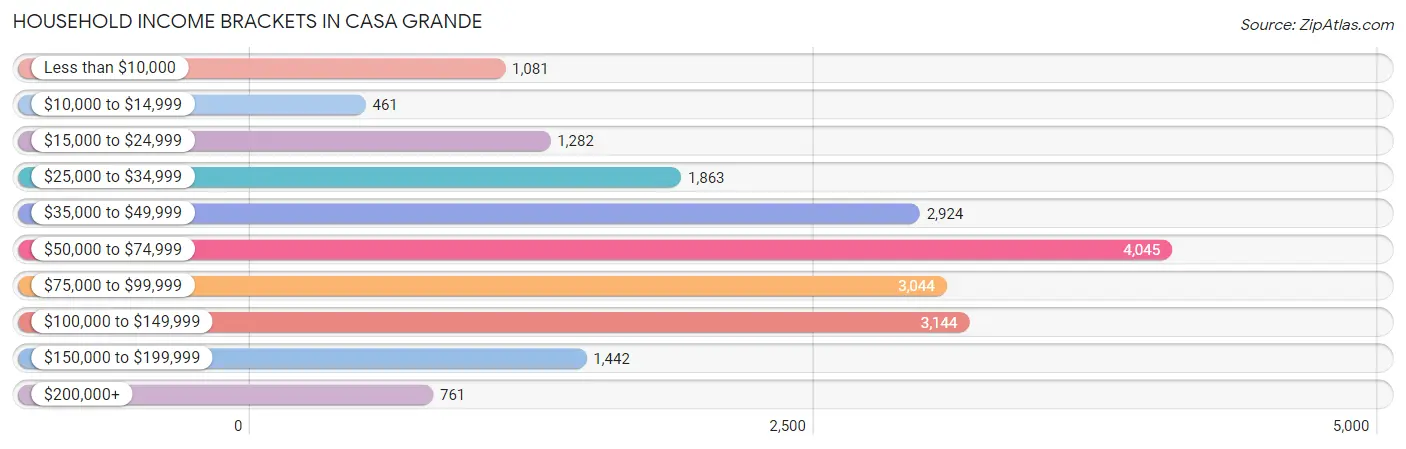
| Income Bracket | # Households | % Households |
| Less than $10,000 | 1,081 | 5.4% |
| $10,000 to $14,999 | 461 | 2.3% |
| $15,000 to $24,999 | 1,282 | 6.4% |
| $25,000 to $34,999 | 1,863 | 9.3% |
| $35,000 to $49,999 | 2,924 | 14.6% |
| $50,000 to $74,999 | 4,045 | 20.2% |
| $75,000 to $99,999 | 3,044 | 15.2% |
| $100,000 to $149,999 | 3,144 | 15.7% |
| $150,000 to $199,999 | 1,442 | 7.2% |
| $200,000+ | 761 | 3.8% |
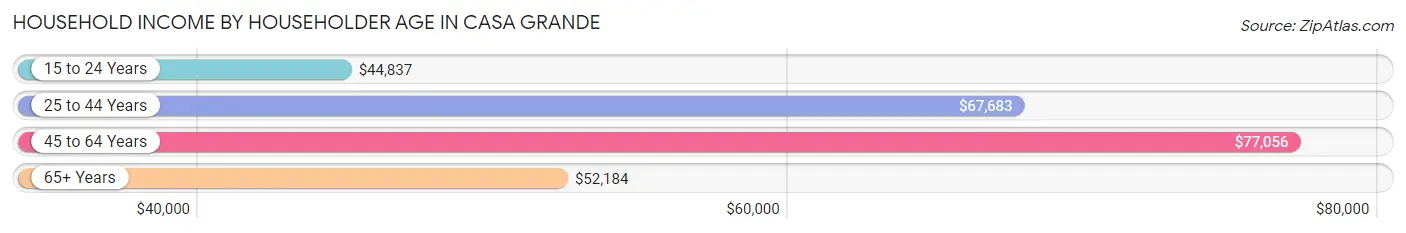
Household Income by Householder Age in Casa Grande
The median household income in Casa Grande is $64,535, with the highest median household income of $77,056 found in the 45 to 64 years age bracket for the primary householder. A total of 5,734 households (28.6%) fall into this category. Meanwhile, the 15 to 24 years age bracket for the primary householder has the lowest median household income of $44,837, with 1,101 households (5.5%) in this group.
| Income Bracket | # Households | Median Income |
| 15 to 24 Years | 1,101 (5.5%) | $44,837 |
| 25 to 44 Years | 6,529 (32.6%) | $67,683 |
| 45 to 64 Years | 5,734 (28.6%) | $77,056 |
| 65+ Years | 6,663 (33.3%) | $52,184 |
| Total | 20,027 (100.0%) | $64,535 |
Poverty in Casa Grande
Income Below Poverty by Sex and Age in Casa Grande
With 15.0% poverty level for males and 13.8% for females among the residents of Casa Grande, 5 year old males and 15 year old females are the most vulnerable to poverty, with 202 males (48.6%) and 105 females (27.3%) in their respective age groups living below the poverty level.
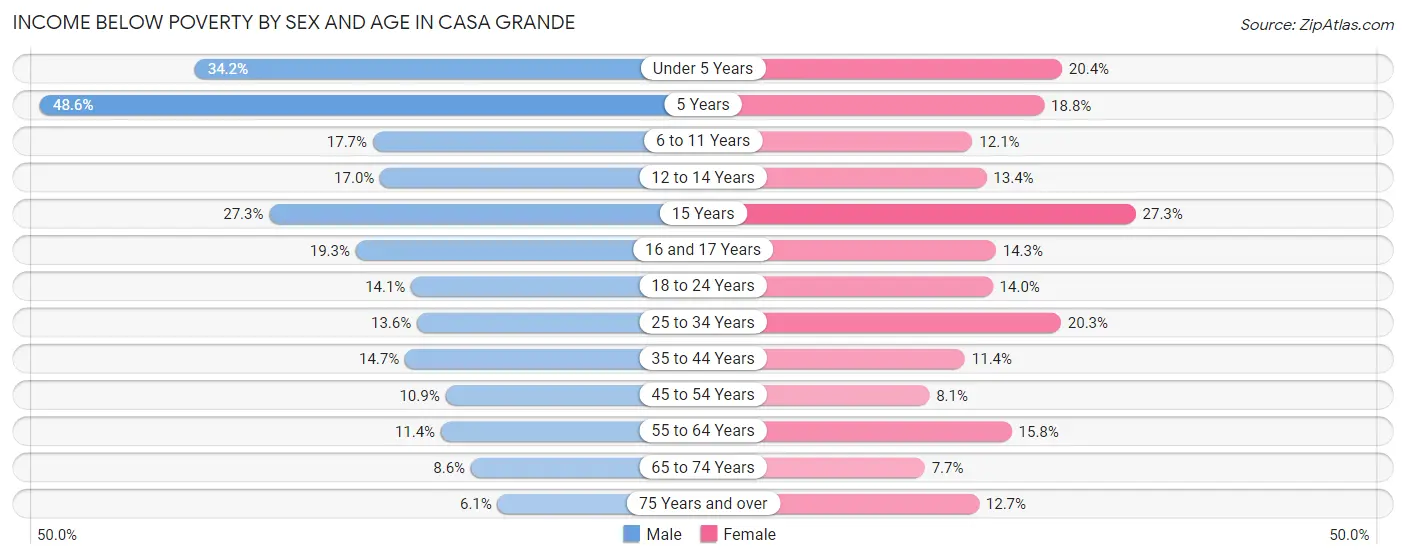
| Age Bracket | Male | Female |
| Under 5 Years | 645 (34.2%) | 276 (20.4%) |
| 5 Years | 202 (48.6%) | 71 (18.8%) |
| 6 to 11 Years | 437 (17.7%) | 248 (12.1%) |
| 12 to 14 Years | 249 (17.0%) | 170 (13.4%) |
| 15 Years | 155 (27.3%) | 105 (27.3%) |
| 16 and 17 Years | 125 (19.3%) | 70 (14.3%) |
| 18 to 24 Years | 464 (14.1%) | 330 (14.0%) |
| 25 to 34 Years | 513 (13.6%) | 839 (20.3%) |
| 35 to 44 Years | 455 (14.7%) | 333 (11.4%) |
| 45 to 54 Years | 356 (10.9%) | 216 (8.1%) |
| 55 to 64 Years | 243 (11.4%) | 441 (15.8%) |
| 65 to 74 Years | 223 (8.6%) | 236 (7.7%) |
| 75 Years and over | 148 (6.1%) | 390 (12.7%) |
| Total | 4,215 (15.0%) | 3,725 (13.8%) |
Income Above Poverty by Sex and Age in Casa Grande
According to the poverty statistics in Casa Grande, males aged 75 years and over and females aged 65 to 74 years are the age groups that are most secure financially, with 93.9% of males and 92.3% of females in these age groups living above the poverty line.
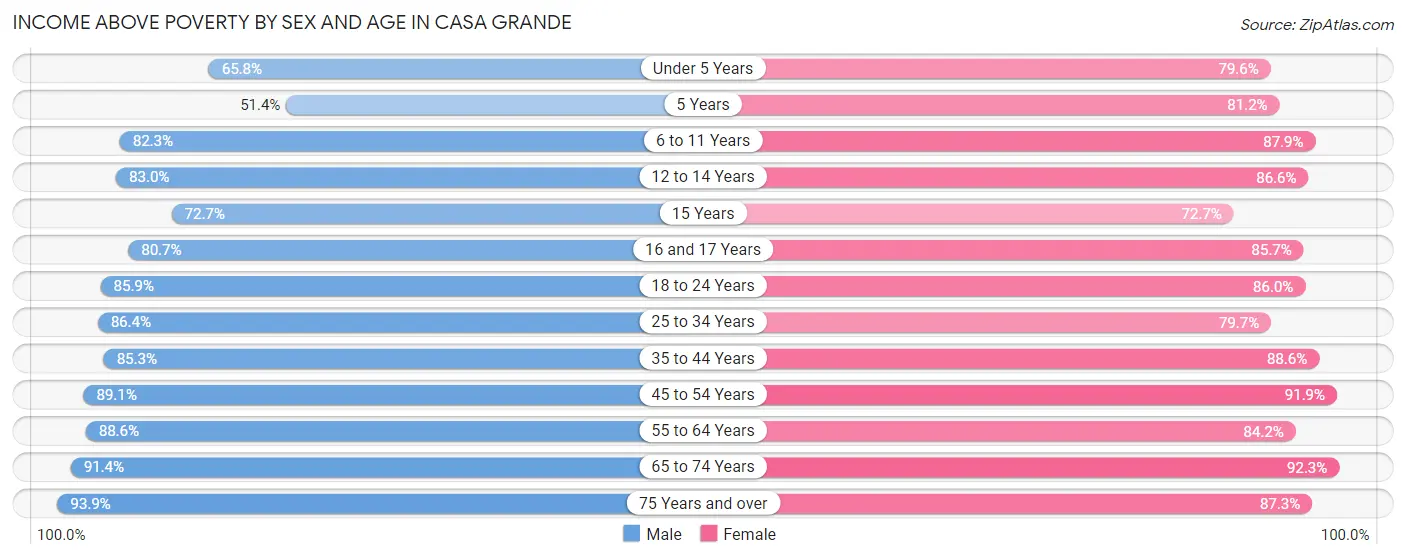
| Age Bracket | Male | Female |
| Under 5 Years | 1,241 (65.8%) | 1,075 (79.6%) |
| 5 Years | 214 (51.4%) | 307 (81.2%) |
| 6 to 11 Years | 2,035 (82.3%) | 1,799 (87.9%) |
| 12 to 14 Years | 1,216 (83.0%) | 1,097 (86.6%) |
| 15 Years | 413 (72.7%) | 280 (72.7%) |
| 16 and 17 Years | 524 (80.7%) | 420 (85.7%) |
| 18 to 24 Years | 2,821 (85.9%) | 2,027 (86.0%) |
| 25 to 34 Years | 3,264 (86.4%) | 3,287 (79.7%) |
| 35 to 44 Years | 2,643 (85.3%) | 2,582 (88.6%) |
| 45 to 54 Years | 2,898 (89.1%) | 2,448 (91.9%) |
| 55 to 64 Years | 1,896 (88.6%) | 2,358 (84.2%) |
| 65 to 74 Years | 2,376 (91.4%) | 2,827 (92.3%) |
| 75 Years and over | 2,278 (93.9%) | 2,677 (87.3%) |
| Total | 23,819 (85.0%) | 23,184 (86.2%) |
Income Below Poverty Among Married-Couple Families in Casa Grande
The poverty statistics for married-couple families in Casa Grande show that 6.4% or 647 of the total 10,157 families live below the poverty line. Families with 3 or 4 children have the highest poverty rate of 13.2%, comprising of 203 families. On the other hand, families with 5 or more children have the lowest poverty rate of 2.7%, which includes 4 families.
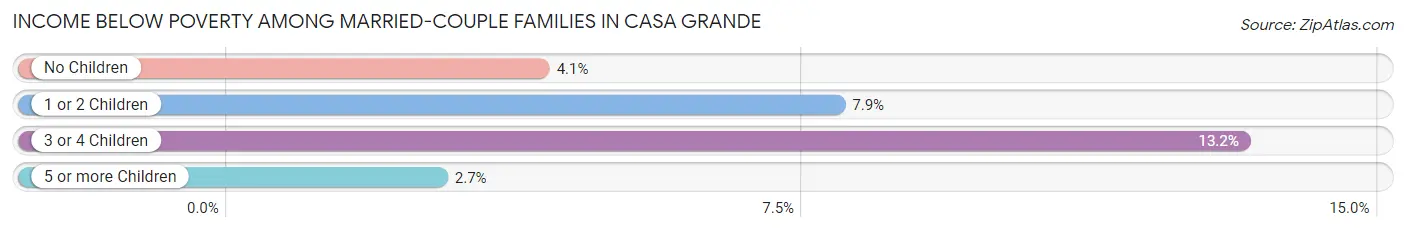
| Children | Above Poverty | Below Poverty |
| No Children | 5,772 (95.9%) | 245 (4.1%) |
| 1 or 2 Children | 2,264 (92.1%) | 195 (7.9%) |
| 3 or 4 Children | 1,332 (86.8%) | 203 (13.2%) |
| 5 or more Children | 142 (97.3%) | 4 (2.7%) |
| Total | 9,510 (93.6%) | 647 (6.4%) |
Income Below Poverty Among Single-Parent Households in Casa Grande
According to the poverty data in Casa Grande, 14.9% or 172 single-father households and 28.0% or 767 single-mother households are living below the poverty line. Among single-father households, those with 3 or 4 children have the highest poverty rate, with 80 households (100.0%) experiencing poverty. Likewise, among single-mother households, those with 5 or more children have the highest poverty rate, with 42 households (100.0%) falling below the poverty line.
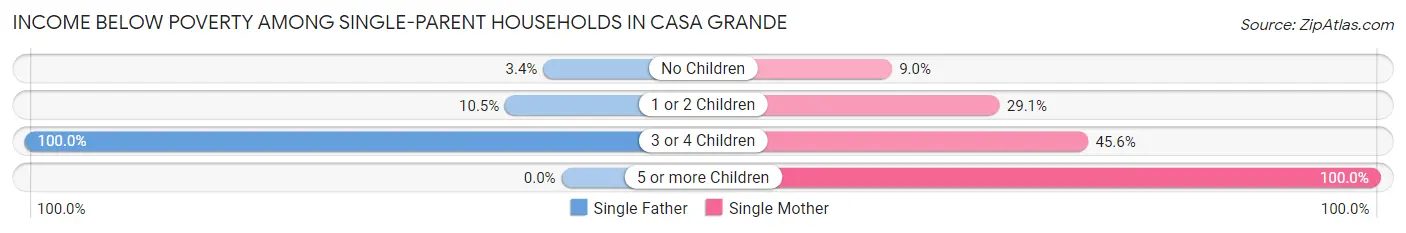
| Children | Single Father | Single Mother |
| No Children | 10 (3.4%) | 67 (9.0%) |
| 1 or 2 Children | 82 (10.5%) | 414 (29.1%) |
| 3 or 4 Children | 80 (100.0%) | 244 (45.6%) |
| 5 or more Children | 0 (0.0%) | 42 (100.0%) |
| Total | 172 (14.9%) | 767 (28.0%) |
Income Below Poverty Among Married-Couple vs Single-Parent Households in Casa Grande
The poverty data for Casa Grande shows that 647 of the married-couple family households (6.4%) and 939 of the single-parent households (24.1%) are living below the poverty level. Within the married-couple family households, those with 3 or 4 children have the highest poverty rate, with 203 households (13.2%) falling below the poverty line. Among the single-parent households, those with 5 or more children have the highest poverty rate, with 42 household (100.0%) living below poverty.
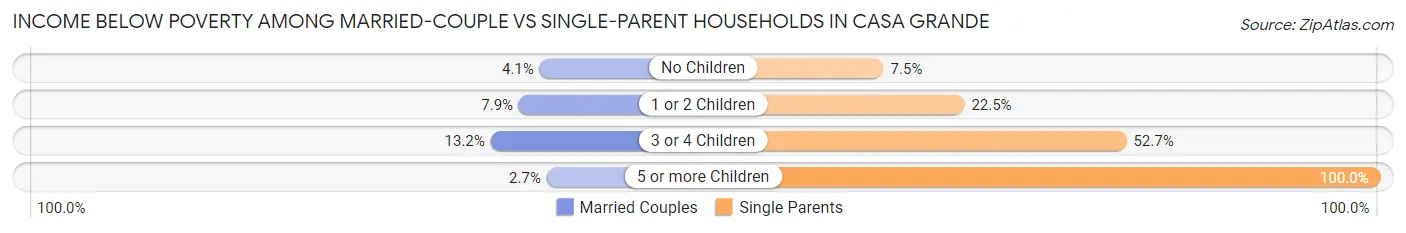
| Children | Married-Couple Families | Single-Parent Households |
| No Children | 245 (4.1%) | 77 (7.4%) |
| 1 or 2 Children | 195 (7.9%) | 496 (22.5%) |
| 3 or 4 Children | 203 (13.2%) | 324 (52.7%) |
| 5 or more Children | 4 (2.7%) | 42 (100.0%) |
| Total | 647 (6.4%) | 939 (24.1%) |
Race in Casa Grande
The most populous races in Casa Grande are White / Caucasian (35,694 | 64.7%), Hispanic or Latino (24,625 | 44.6%), and Two or more Races (9,497 | 17.2%).
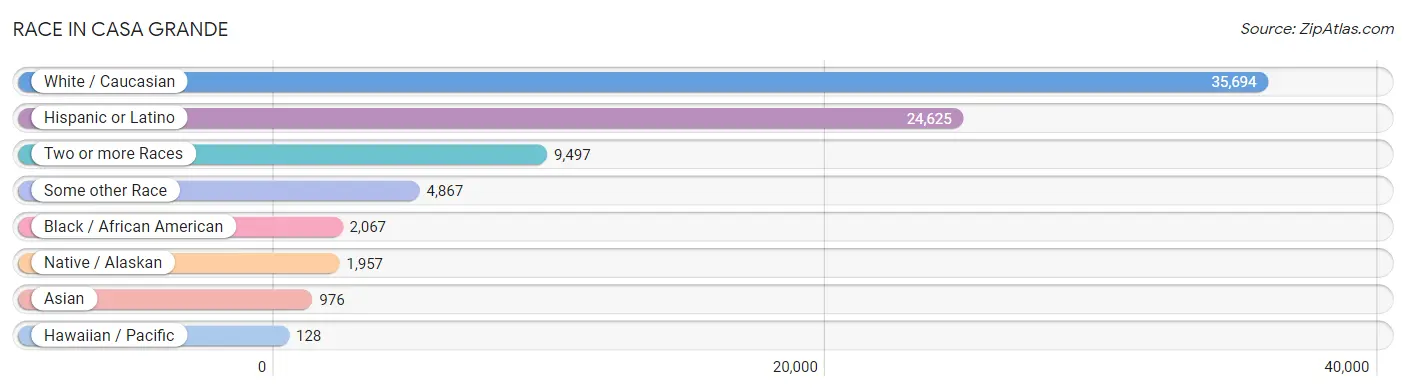
| Race | # Population | % Population |
| Asian | 976 | 1.8% |
| Black / African American | 2,067 | 3.7% |
| Hawaiian / Pacific | 128 | 0.2% |
| Hispanic or Latino | 24,625 | 44.6% |
| Native / Alaskan | 1,957 | 3.5% |
| White / Caucasian | 35,694 | 64.7% |
| Two or more Races | 9,497 | 17.2% |
| Some other Race | 4,867 | 8.8% |
| Total | 55,186 | 100.0% |
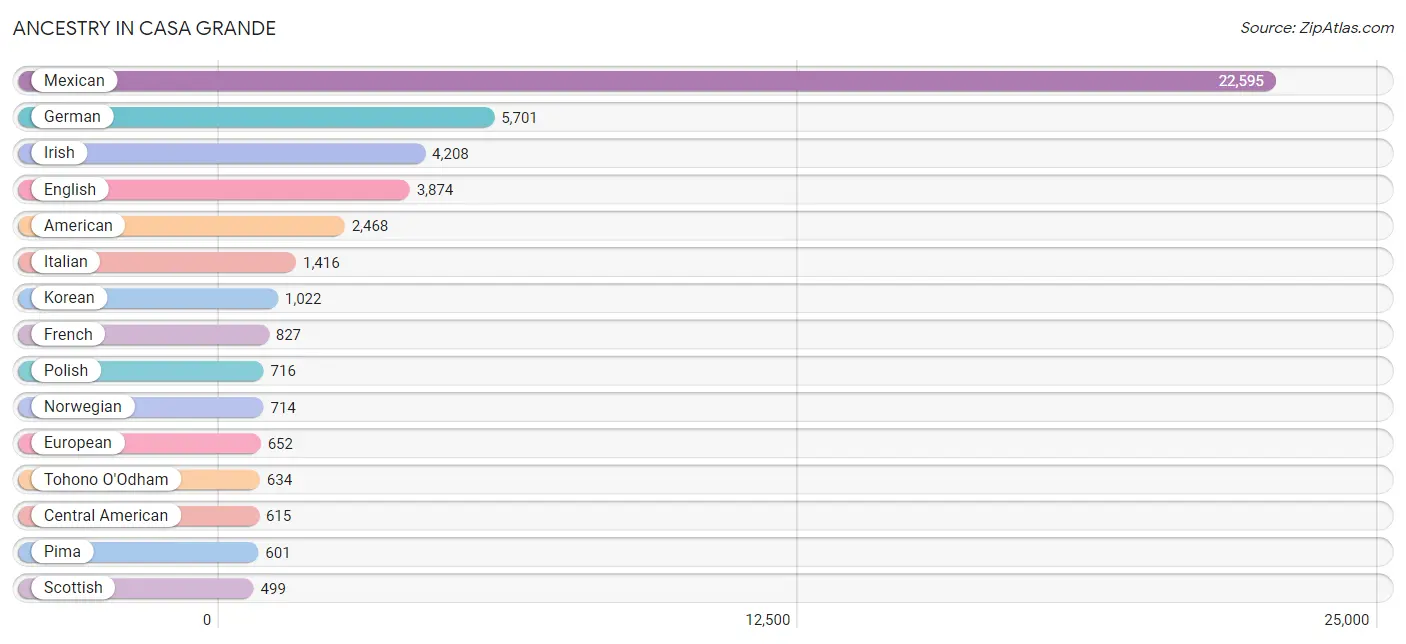
Ancestry in Casa Grande
The most populous ancestries reported in Casa Grande are Mexican (22,595 | 40.9%), German (5,701 | 10.3%), Irish (4,208 | 7.6%), English (3,874 | 7.0%), and American (2,468 | 4.5%), together accounting for 70.4% of all Casa Grande residents.
| Ancestry | # Population | % Population |
| African | 238 | 0.4% |
| Albanian | 18 | 0.0% |
| American | 2,468 | 4.5% |
| Apache | 70 | 0.1% |
| Arab | 26 | 0.1% |
| Assyrian / Chaldean / Syriac | 8 | 0.0% |
| Australian | 7 | 0.0% |
| Austrian | 23 | 0.0% |
| Basque | 11 | 0.0% |
| Belgian | 9 | 0.0% |
| Belizean | 34 | 0.1% |
| Blackfeet | 7 | 0.0% |
| British | 118 | 0.2% |
| Canadian | 350 | 0.6% |
| Cape Verdean | 19 | 0.0% |
| Central American | 615 | 1.1% |
| Central American Indian | 24 | 0.0% |
| Cherokee | 343 | 0.6% |
| Chilean | 17 | 0.0% |
| Chinese | 2 | 0.0% |
| Chippewa | 45 | 0.1% |
| Choctaw | 188 | 0.3% |
| Colombian | 10 | 0.0% |
| Comanche | 46 | 0.1% |
| Creek | 15 | 0.0% |
| Cuban | 125 | 0.2% |
| Czech | 43 | 0.1% |
| Czechoslovakian | 39 | 0.1% |
| Danish | 269 | 0.5% |
| Dominican | 21 | 0.0% |
| Dutch | 443 | 0.8% |
| Eastern European | 69 | 0.1% |
| Ecuadorian | 28 | 0.1% |
| English | 3,874 | 7.0% |
| European | 652 | 1.2% |
| Finnish | 107 | 0.2% |
| French | 827 | 1.5% |
| French Canadian | 170 | 0.3% |
| German | 5,701 | 10.3% |
| German Russian | 8 | 0.0% |
| Greek | 127 | 0.2% |
| Guamanian / Chamorro | 58 | 0.1% |
| Guatemalan | 39 | 0.1% |
| Hopi | 122 | 0.2% |
| Hungarian | 244 | 0.4% |
| Icelander | 6 | 0.0% |
| Indian (Asian) | 106 | 0.2% |
| Iranian | 384 | 0.7% |
| Iraqi | 19 | 0.0% |
| Irish | 4,208 | 7.6% |
| Israeli | 22 | 0.0% |
| Italian | 1,416 | 2.6% |
| Jamaican | 193 | 0.4% |
| Korean | 1,022 | 1.8% |
| Lithuanian | 21 | 0.0% |
| Luxembourger | 8 | 0.0% |
| Mexican | 22,595 | 40.9% |
| Mexican American Indian | 40 | 0.1% |
| Native Hawaiian | 123 | 0.2% |
| Navajo | 399 | 0.7% |
| Nicaraguan | 81 | 0.2% |
| Northern European | 137 | 0.3% |
| Norwegian | 714 | 1.3% |
| Pakistani | 36 | 0.1% |
| Pima | 601 | 1.1% |
| Polish | 716 | 1.3% |
| Portuguese | 140 | 0.3% |
| Pueblo | 14 | 0.0% |
| Puerto Rican | 310 | 0.6% |
| Romanian | 39 | 0.1% |
| Russian | 67 | 0.1% |
| Salvadoran | 495 | 0.9% |
| Scandinavian | 169 | 0.3% |
| Scotch-Irish | 323 | 0.6% |
| Scottish | 499 | 0.9% |
| Sioux | 205 | 0.4% |
| Slovak | 42 | 0.1% |
| Slovene | 62 | 0.1% |
| South American | 55 | 0.1% |
| Spaniard | 330 | 0.6% |
| Spanish | 269 | 0.5% |
| Sri Lankan | 118 | 0.2% |
| Subsaharan African | 257 | 0.5% |
| Swedish | 494 | 0.9% |
| Swiss | 189 | 0.3% |
| Syrian | 7 | 0.0% |
| Thai | 179 | 0.3% |
| Tohono O'Odham | 634 | 1.1% |
| Trinidadian and Tobagonian | 8 | 0.0% |
| Ukrainian | 114 | 0.2% |
| Welsh | 174 | 0.3% |
| Yaqui | 309 | 0.6% |
| Yugoslavian | 7 | 0.0% | View All 93 Rows |
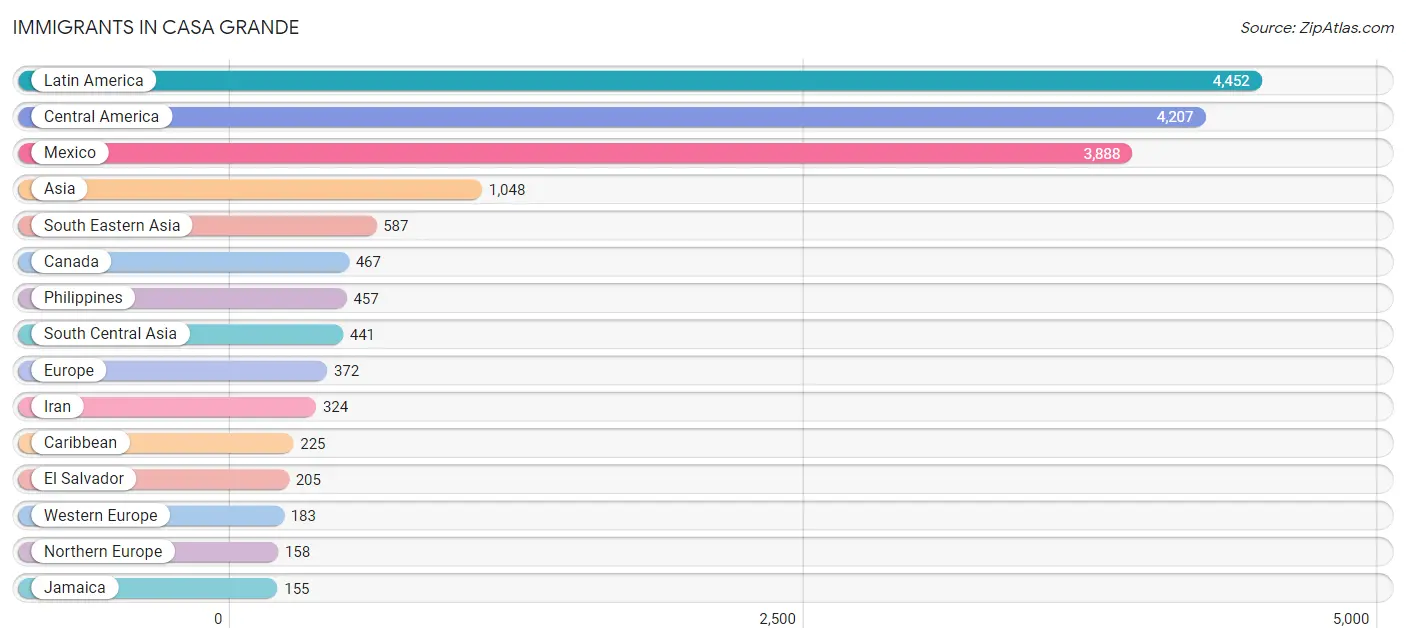
Immigrants in Casa Grande
The most numerous immigrant groups reported in Casa Grande came from Latin America (4,452 | 8.1%), Central America (4,207 | 7.6%), Mexico (3,888 | 7.0%), Asia (1,048 | 1.9%), and South Eastern Asia (587 | 1.1%), together accounting for 25.7% of all Casa Grande residents.
| Immigration Origin | # Population | % Population |
| Africa | 28 | 0.1% |
| Asia | 1,048 | 1.9% |
| Australia | 15 | 0.0% |
| Belarus | 8 | 0.0% |
| Belize | 33 | 0.1% |
| Canada | 467 | 0.9% |
| Caribbean | 225 | 0.4% |
| Central America | 4,207 | 7.6% |
| China | 20 | 0.0% |
| Cuba | 62 | 0.1% |
| Eastern Africa | 20 | 0.0% |
| Eastern Asia | 20 | 0.0% |
| Eastern Europe | 18 | 0.0% |
| Ecuador | 15 | 0.0% |
| El Salvador | 205 | 0.4% |
| England | 72 | 0.1% |
| Europe | 372 | 0.7% |
| France | 8 | 0.0% |
| Germany | 144 | 0.3% |
| Guatemala | 3 | 0.0% |
| Guyana | 5 | 0.0% |
| India | 117 | 0.2% |
| Iran | 324 | 0.6% |
| Ireland | 26 | 0.1% |
| Jamaica | 155 | 0.3% |
| Kenya | 20 | 0.0% |
| Latin America | 4,452 | 8.1% |
| Lithuania | 6 | 0.0% |
| Mexico | 3,888 | 7.0% |
| Netherlands | 31 | 0.1% |
| Nicaragua | 78 | 0.1% |
| Northern Europe | 158 | 0.3% |
| Oceania | 15 | 0.0% |
| Philippines | 457 | 0.8% |
| Poland | 4 | 0.0% |
| Portugal | 13 | 0.0% |
| Scotland | 43 | 0.1% |
| South Africa | 8 | 0.0% |
| South America | 20 | 0.0% |
| South Central Asia | 441 | 0.8% |
| South Eastern Asia | 587 | 1.1% |
| Southern Europe | 13 | 0.0% |
| Taiwan | 6 | 0.0% |
| Thailand | 12 | 0.0% |
| Trinidad and Tobago | 8 | 0.0% |
| Vietnam | 118 | 0.2% |
| Western Europe | 183 | 0.3% | View All 47 Rows |
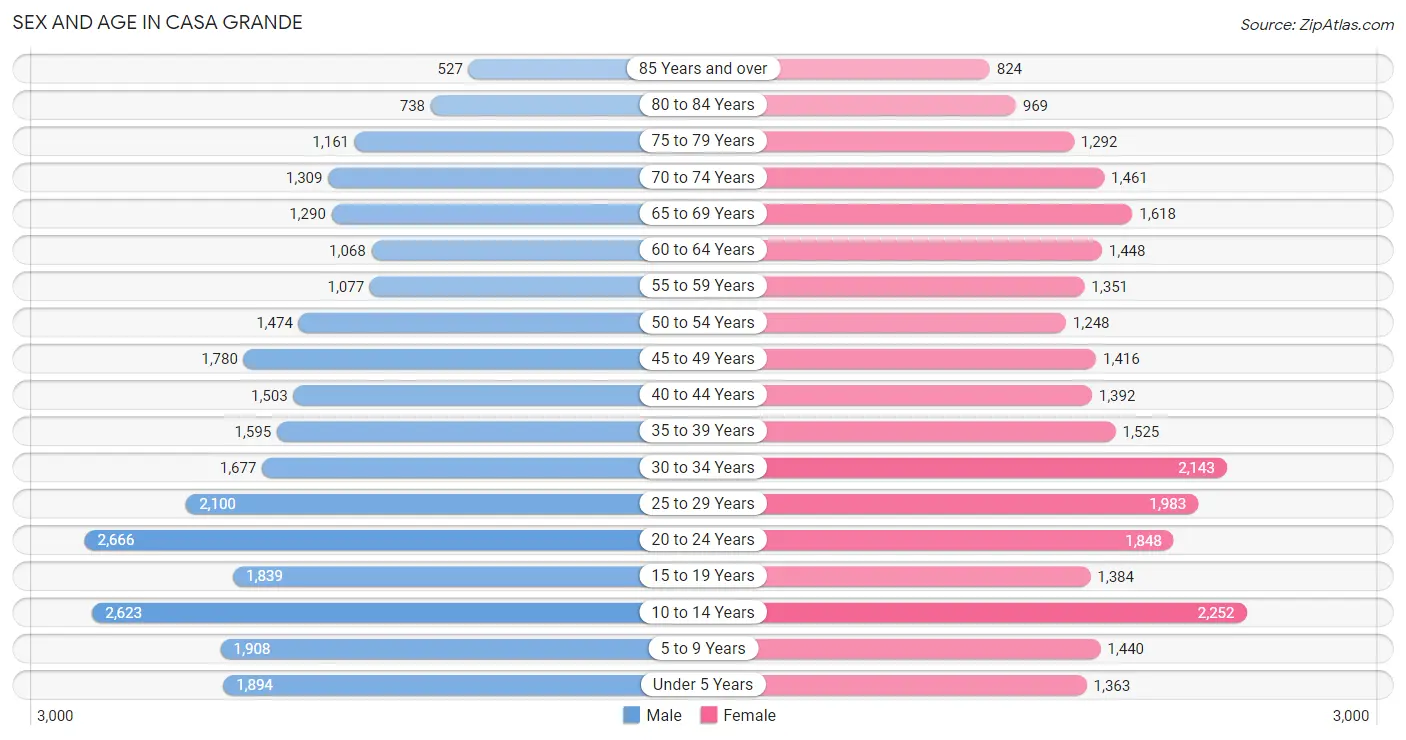
Sex and Age in Casa Grande
Sex and Age in Casa Grande
The most populous age groups in Casa Grande are 20 to 24 Years (2,666 | 9.4%) for men and 10 to 14 Years (2,252 | 8.4%) for women.
| Age Bracket | Male | Female |
| Under 5 Years | 1,894 (6.7%) | 1,363 (5.1%) |
| 5 to 9 Years | 1,908 (6.8%) | 1,440 (5.3%) |
| 10 to 14 Years | 2,623 (9.3%) | 2,252 (8.4%) |
| 15 to 19 Years | 1,839 (6.5%) | 1,384 (5.1%) |
| 20 to 24 Years | 2,666 (9.4%) | 1,848 (6.9%) |
| 25 to 29 Years | 2,100 (7.4%) | 1,983 (7.4%) |
| 30 to 34 Years | 1,677 (5.9%) | 2,143 (8.0%) |
| 35 to 39 Years | 1,595 (5.7%) | 1,525 (5.7%) |
| 40 to 44 Years | 1,503 (5.3%) | 1,392 (5.2%) |
| 45 to 49 Years | 1,780 (6.3%) | 1,416 (5.2%) |
| 50 to 54 Years | 1,474 (5.2%) | 1,248 (4.6%) |
| 55 to 59 Years | 1,077 (3.8%) | 1,351 (5.0%) |
| 60 to 64 Years | 1,068 (3.8%) | 1,448 (5.4%) |
| 65 to 69 Years | 1,290 (4.6%) | 1,618 (6.0%) |
| 70 to 74 Years | 1,309 (4.6%) | 1,461 (5.4%) |
| 75 to 79 Years | 1,161 (4.1%) | 1,292 (4.8%) |
| 80 to 84 Years | 738 (2.6%) | 969 (3.6%) |
| 85 Years and over | 527 (1.9%) | 824 (3.1%) |
| Total | 28,229 (100.0%) | 26,957 (100.0%) |
Families and Households in Casa Grande
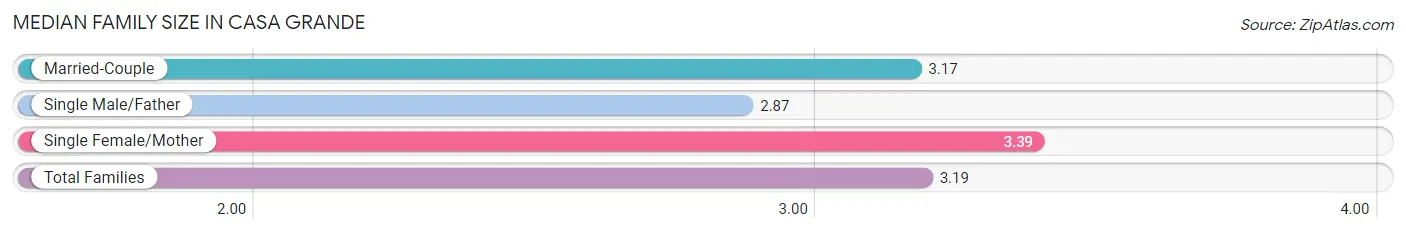
Median Family Size in Casa Grande
The median family size in Casa Grande is 3.19 persons per family, with single female/mother families (2,741 | 19.5%) accounting for the largest median family size of 3.39 persons per family. On the other hand, single male/father families (1,154 | 8.2%) represent the smallest median family size with 2.87 persons per family.
| Family Type | # Families | Family Size |
| Married-Couple | 10,157 (72.3%) | 3.17 |
| Single Male/Father | 1,154 (8.2%) | 2.87 |
| Single Female/Mother | 2,741 (19.5%) | 3.39 |
| Total Families | 14,052 (100.0%) | 3.19 |
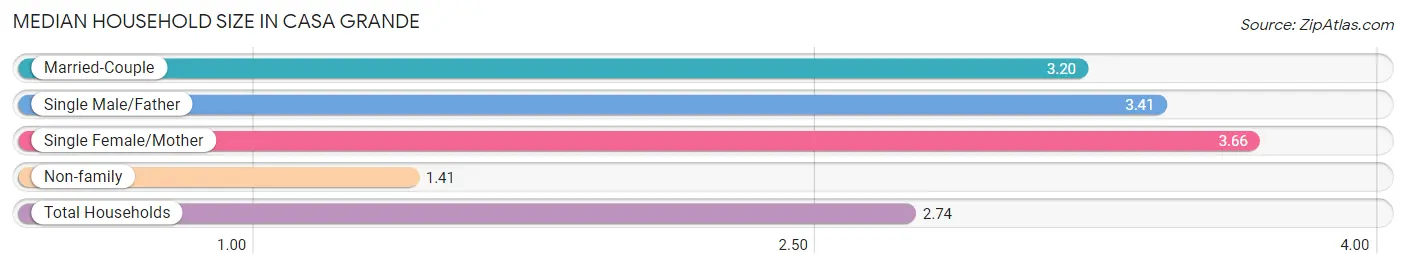
Median Household Size in Casa Grande
The median household size in Casa Grande is 2.74 persons per household, with single female/mother households (2,741 | 13.7%) accounting for the largest median household size of 3.66 persons per household. non-family households (5,975 | 29.8%) represent the smallest median household size with 1.41 persons per household.
| Household Type | # Households | Household Size |
| Married-Couple | 10,157 (50.7%) | 3.20 |
| Single Male/Father | 1,154 (5.8%) | 3.41 |
| Single Female/Mother | 2,741 (13.7%) | 3.66 |
| Non-family | 5,975 (29.8%) | 1.41 |
| Total Households | 20,027 (100.0%) | 2.74 |
Household Size by Marriage Status in Casa Grande
Out of a total of 20,027 households in Casa Grande, 14,052 (70.2%) are family households, while 5,975 (29.8%) are nonfamily households. The most numerous type of family households are 2-person households, comprising 5,921, and the most common type of nonfamily households are 1-person households, comprising 4,466.
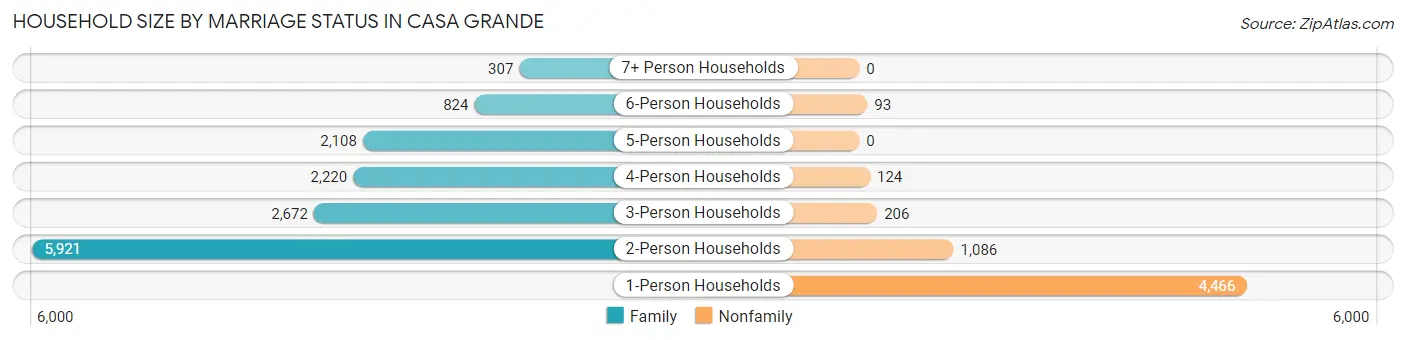
| Household Size | Family Households | Nonfamily Households |
| 1-Person Households | - | 4,466 (22.3%) |
| 2-Person Households | 5,921 (29.6%) | 1,086 (5.4%) |
| 3-Person Households | 2,672 (13.3%) | 206 (1.0%) |
| 4-Person Households | 2,220 (11.1%) | 124 (0.6%) |
| 5-Person Households | 2,108 (10.5%) | 0 (0.0%) |
| 6-Person Households | 824 (4.1%) | 93 (0.5%) |
| 7+ Person Households | 307 (1.5%) | 0 (0.0%) |
| Total | 14,052 (70.2%) | 5,975 (29.8%) |
Female Fertility in Casa Grande
Fertility by Age in Casa Grande
Average fertility rate in Casa Grande is 59.0 births per 1,000 women. Women in the age bracket of 20 to 34 years have the highest fertility rate with 102.0 births per 1,000 women. Women in the age bracket of 20 to 34 years acount for 86.0% of all women with births.
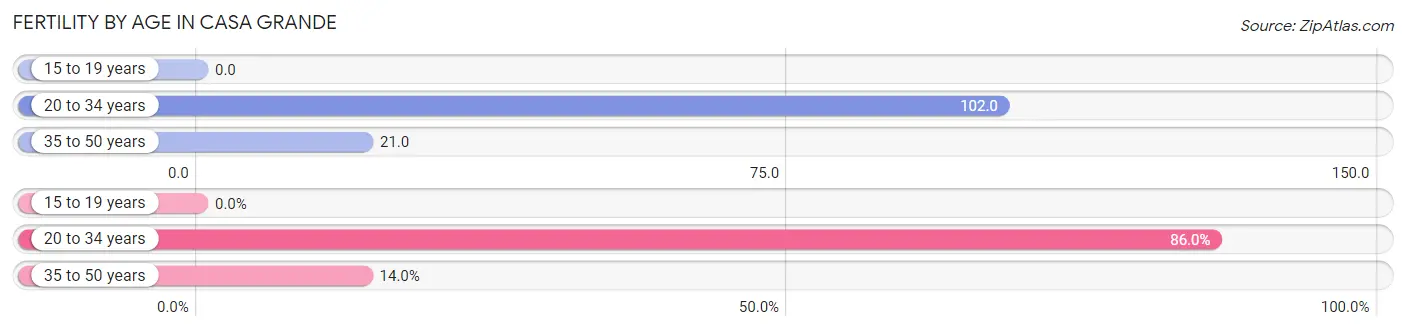
| Age Bracket | Women with Births | Births / 1,000 Women |
| 15 to 19 years | 0 (0.0%) | 0.0 |
| 20 to 34 years | 610 (86.0%) | 102.0 |
| 35 to 50 years | 99 (14.0%) | 21.0 |
| Total | 709 (100.0%) | 59.0 |
Fertility by Age by Marriage Status in Casa Grande
59.0% of women with births (709) in Casa Grande are married. The highest percentage of unmarried women with births falls into 20 to 34 years age bracket with 44.4% of them unmarried at the time of birth, while the lowest percentage of unmarried women with births belong to 35 to 50 years age bracket with 20.2% of them unmarried.
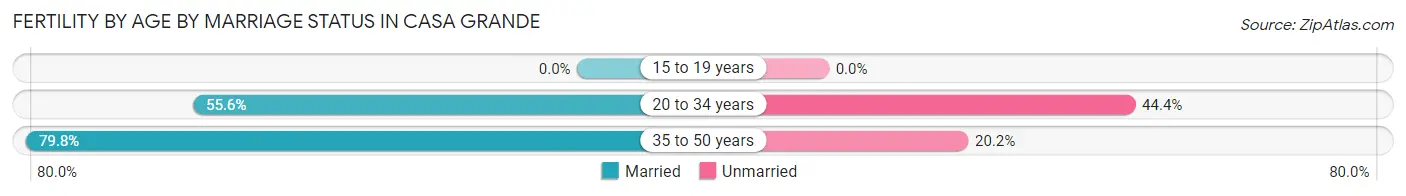
| Age Bracket | Married | Unmarried |
| 15 to 19 years | 0 (0.0%) | 0 (0.0%) |
| 20 to 34 years | 339 (55.6%) | 271 (44.4%) |
| 35 to 50 years | 79 (79.8%) | 20 (20.2%) |
| Total | 418 (59.0%) | 291 (41.0%) |
Fertility by Education in Casa Grande
Average fertility rate in Casa Grande is 59.0 births per 1,000 women. Women with the education attainment of high school diploma have the highest fertility rate of 94.0 births per 1,000 women, while women with the education attainment of less than high school have the lowest fertility at 36.0 births per 1,000 women. Women with the education attainment of high school diploma represent 46.5% of all women with births.
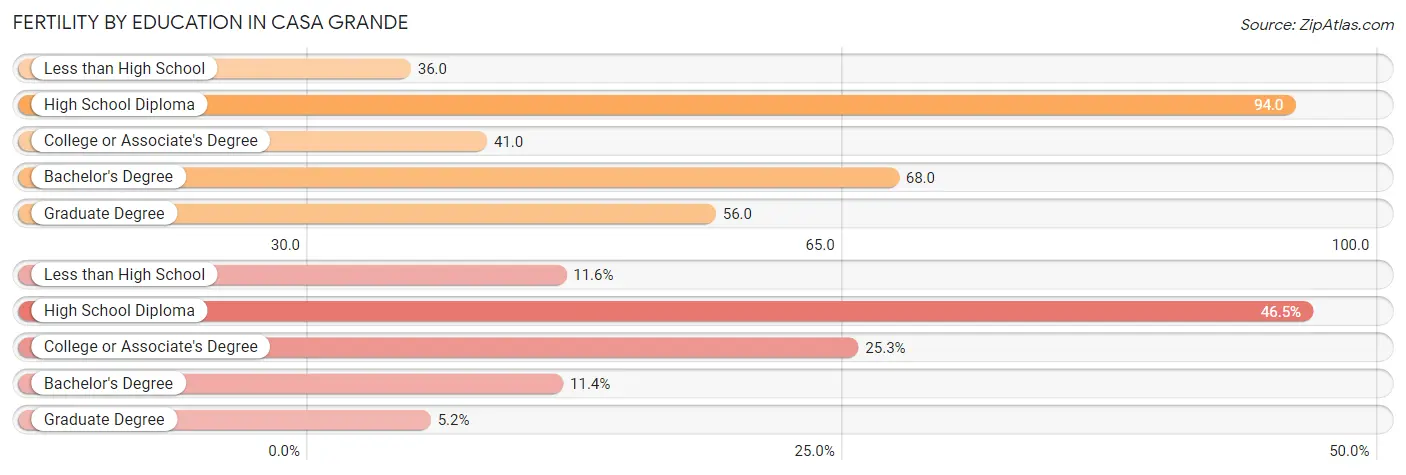
| Educational Attainment | Women with Births | Births / 1,000 Women |
| Less than High School | 82 (11.6%) | 36.0 |
| High School Diploma | 330 (46.5%) | 94.0 |
| College or Associate's Degree | 179 (25.3%) | 41.0 |
| Bachelor's Degree | 81 (11.4%) | 68.0 |
| Graduate Degree | 37 (5.2%) | 56.0 |
| Total | 709 (100.0%) | 59.0 |
Fertility by Education by Marriage Status in Casa Grande
41.0% of women with births in Casa Grande are unmarried. Women with the educational attainment of graduate degree are most likely to be married with 100.0% of them married at childbirth, while women with the educational attainment of less than high school are least likely to be married with 91.5% of them unmarried at childbirth.
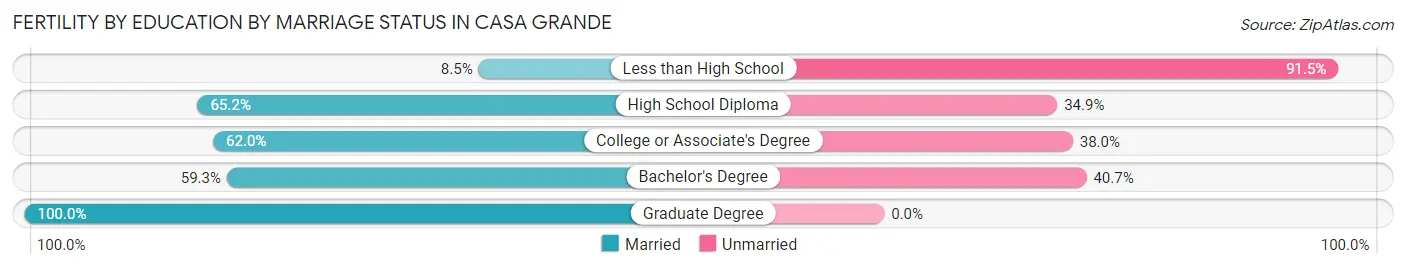
| Educational Attainment | Married | Unmarried |
| Less than High School | 7 (8.5%) | 75 (91.5%) |
| High School Diploma | 215 (65.1%) | 115 (34.8%) |
| College or Associate's Degree | 111 (62.0%) | 68 (38.0%) |
| Bachelor's Degree | 48 (59.3%) | 33 (40.7%) |
| Graduate Degree | 37 (100.0%) | 0 (0.0%) |
| Total | 418 (59.0%) | 291 (41.0%) |
Employment Characteristics in Casa Grande
Employment by Class of Employer in Casa Grande
Among the 22,629 employed individuals in Casa Grande, private company employees (16,081 | 71.1%), local government employees (1,637 | 7.2%), and not-for-profit organizations (1,607 | 7.1%) make up the most common classes of employment.
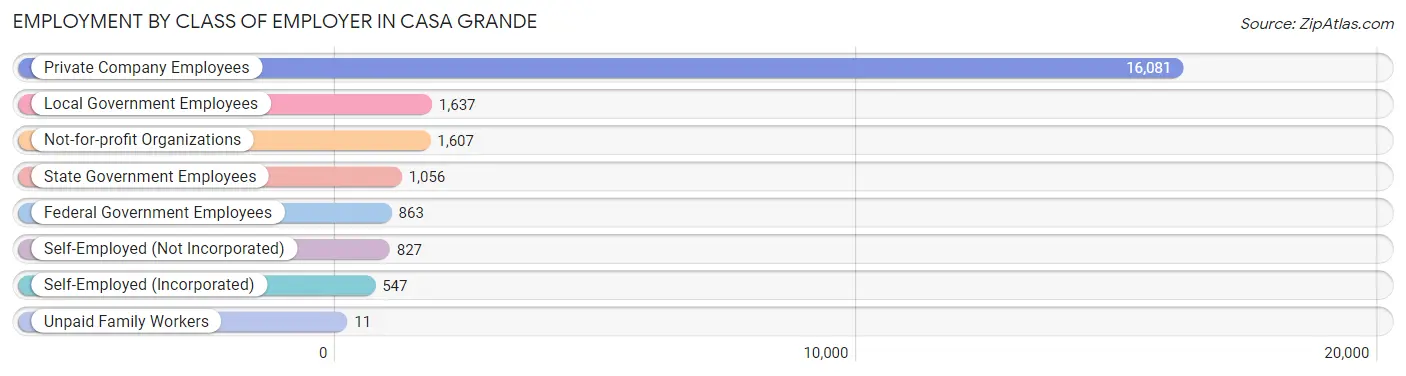
| Employer Class | # Employees | % Employees |
| Private Company Employees | 16,081 | 71.1% |
| Self-Employed (Incorporated) | 547 | 2.4% |
| Self-Employed (Not Incorporated) | 827 | 3.6% |
| Not-for-profit Organizations | 1,607 | 7.1% |
| Local Government Employees | 1,637 | 7.2% |
| State Government Employees | 1,056 | 4.7% |
| Federal Government Employees | 863 | 3.8% |
| Unpaid Family Workers | 11 | 0.1% |
| Total | 22,629 | 100.0% |
Employment Status by Age in Casa Grande
According to the labor force statistics for Casa Grande, out of the total population over 16 years of age (42,753), 57.9% or 24,754 individuals are in the labor force, with 6.8% or 1,683 of them unemployed. The age group with the highest labor force participation rate is 30 to 34 years, with 83.9% or 3,205 individuals in the labor force. Within the labor force, the 16 to 19 years age range has the highest percentage of unemployed individuals, with 15.2% or 136 of them being unemployed.
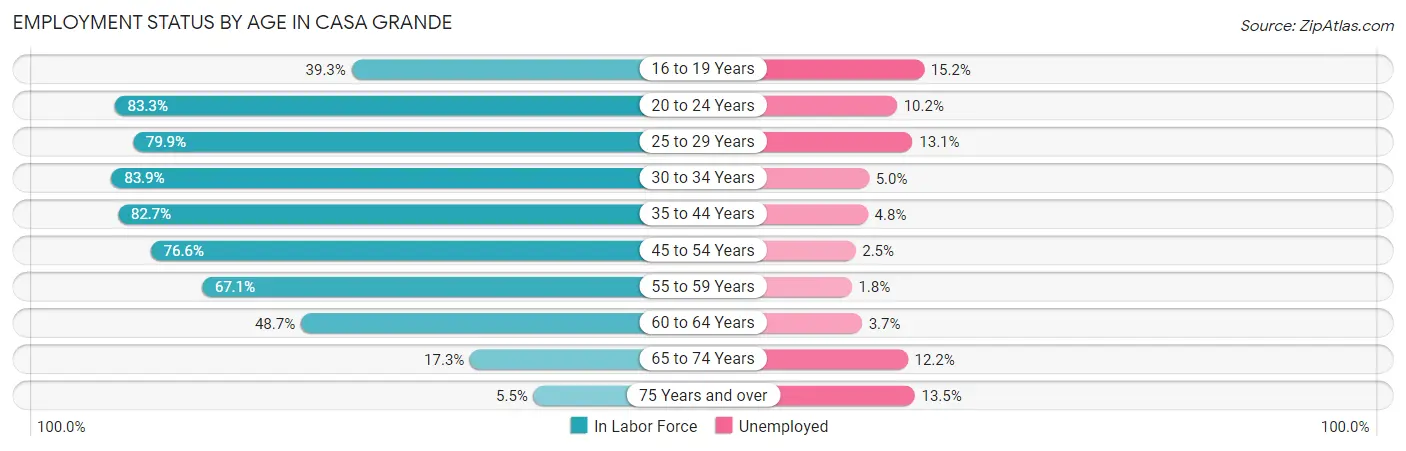
| Age Bracket | In Labor Force | Unemployed |
| 16 to 19 Years | 892 (39.3%) | 136 (15.2%) |
| 20 to 24 Years | 3,760 (83.3%) | 384 (10.2%) |
| 25 to 29 Years | 3,262 (79.9%) | 427 (13.1%) |
| 30 to 34 Years | 3,205 (83.9%) | 160 (5.0%) |
| 35 to 44 Years | 4,974 (82.7%) | 239 (4.8%) |
| 45 to 54 Years | 4,533 (76.6%) | 113 (2.5%) |
| 55 to 59 Years | 1,629 (67.1%) | 29 (1.8%) |
| 60 to 64 Years | 1,225 (48.7%) | 45 (3.7%) |
| 65 to 74 Years | 982 (17.3%) | 120 (12.2%) |
| 75 Years and over | 303 (5.5%) | 41 (13.5%) |
| Total | 24,754 (57.9%) | 1,683 (6.8%) |
Employment Status by Educational Attainment in Casa Grande
According to labor force statistics for Casa Grande, 76.0% of individuals (18,833) out of the total population between 25 and 64 years of age (24,780) are in the labor force, with 5.4% or 1,017 of them being unemployed. The group with the highest labor force participation rate are those with the educational attainment of bachelor's degree or higher, with 83.4% or 3,970 individuals in the labor force. Within the labor force, individuals with less than high school education have the highest percentage of unemployment, with 6.5% or 117 of them being unemployed.
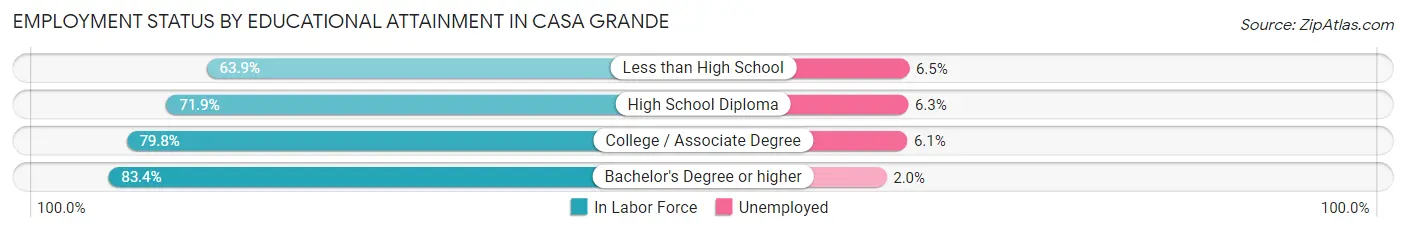
| Educational Attainment | In Labor Force | Unemployed |
| Less than High School | 1,794 (63.9%) | 183 (6.5%) |
| High School Diploma | 5,999 (71.9%) | 526 (6.3%) |
| College / Associate Degree | 7,077 (79.8%) | 541 (6.1%) |
| Bachelor's Degree or higher | 3,970 (83.4%) | 95 (2.0%) |
| Total | 18,833 (76.0%) | 1,338 (5.4%) |
Employment Occupations by Sex in Casa Grande
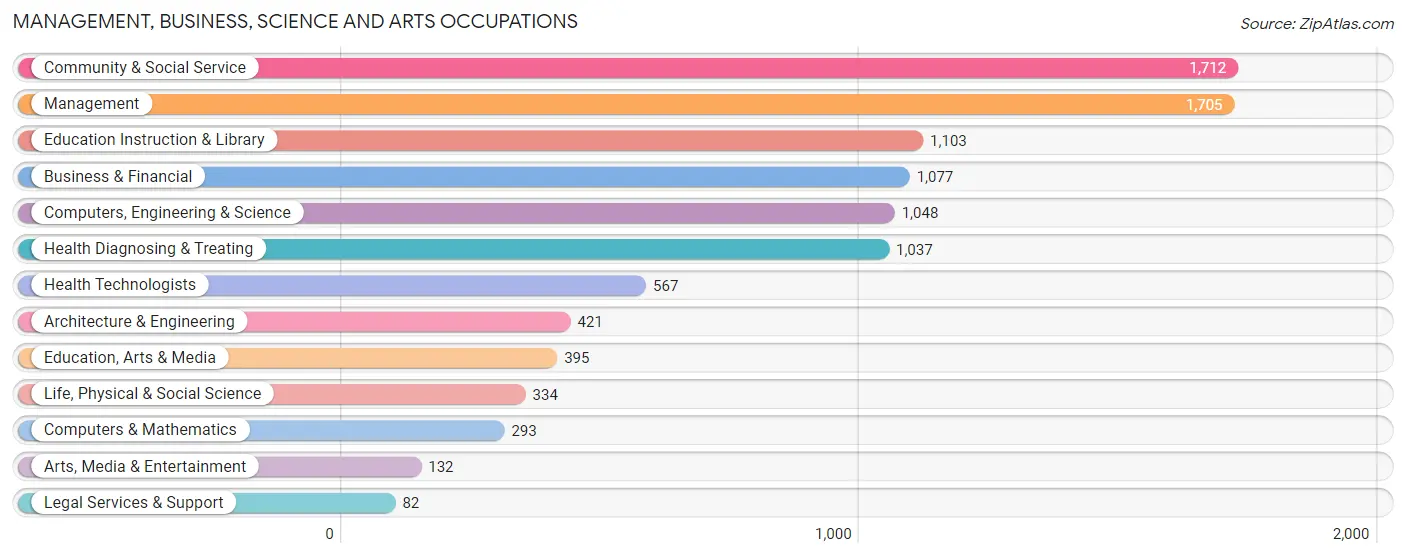
Management, Business, Science and Arts Occupations
The most common Management, Business, Science and Arts occupations in Casa Grande are Community & Social Service (1,712 | 7.4%), Management (1,705 | 7.4%), Education Instruction & Library (1,103 | 4.8%), Business & Financial (1,077 | 4.7%), and Computers, Engineering & Science (1,048 | 4.6%).
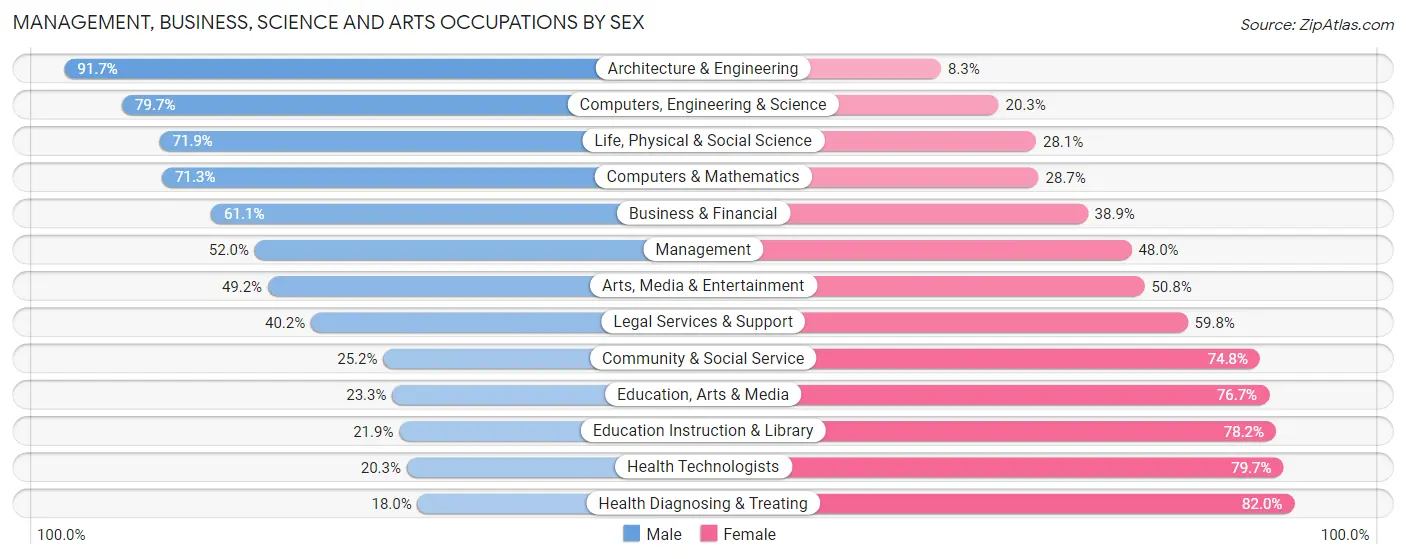
Management, Business, Science and Arts Occupations by Sex
Within the Management, Business, Science and Arts occupations in Casa Grande, the most male-oriented occupations are Architecture & Engineering (91.7%), Computers, Engineering & Science (79.7%), and Life, Physical & Social Science (71.9%), while the most female-oriented occupations are Health Diagnosing & Treating (82.0%), Health Technologists (79.7%), and Education Instruction & Library (78.1%).
| Occupation | Male | Female |
| Management | 886 (52.0%) | 819 (48.0%) |
| Business & Financial | 658 (61.1%) | 419 (38.9%) |
| Computers, Engineering & Science | 835 (79.7%) | 213 (20.3%) |
| Computers & Mathematics | 209 (71.3%) | 84 (28.7%) |
| Architecture & Engineering | 386 (91.7%) | 35 (8.3%) |
| Life, Physical & Social Science | 240 (71.9%) | 94 (28.1%) |
| Community & Social Service | 431 (25.2%) | 1,281 (74.8%) |
| Education, Arts & Media | 92 (23.3%) | 303 (76.7%) |
| Legal Services & Support | 33 (40.2%) | 49 (59.8%) |
| Education Instruction & Library | 241 (21.8%) | 862 (78.1%) |
| Arts, Media & Entertainment | 65 (49.2%) | 67 (50.8%) |
| Health Diagnosing & Treating | 187 (18.0%) | 850 (82.0%) |
| Health Technologists | 115 (20.3%) | 452 (79.7%) |
| Total (Category) | 2,997 (45.6%) | 3,582 (54.4%) |
| Total (Overall) | 12,633 (54.9%) | 10,366 (45.1%) |
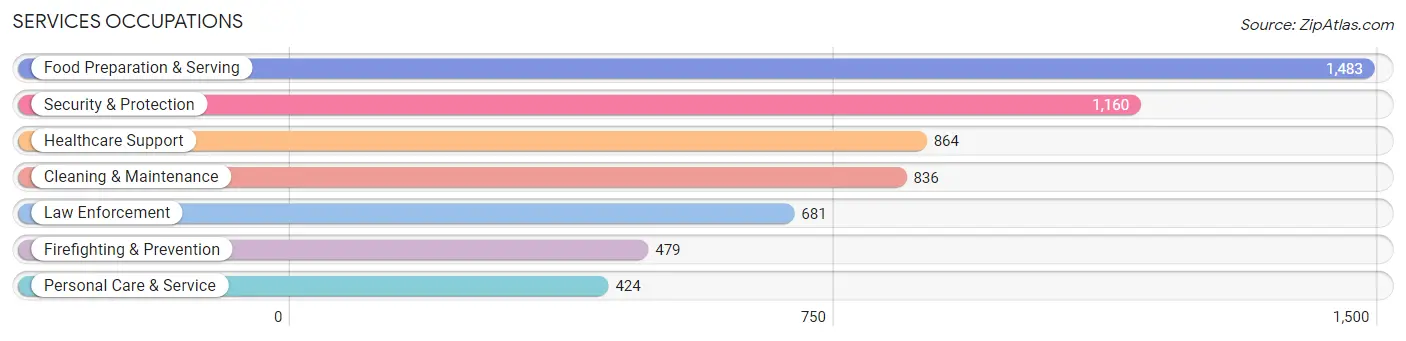
Services Occupations
The most common Services occupations in Casa Grande are Food Preparation & Serving (1,483 | 6.5%), Security & Protection (1,160 | 5.0%), Healthcare Support (864 | 3.8%), Cleaning & Maintenance (836 | 3.6%), and Law Enforcement (681 | 3.0%).
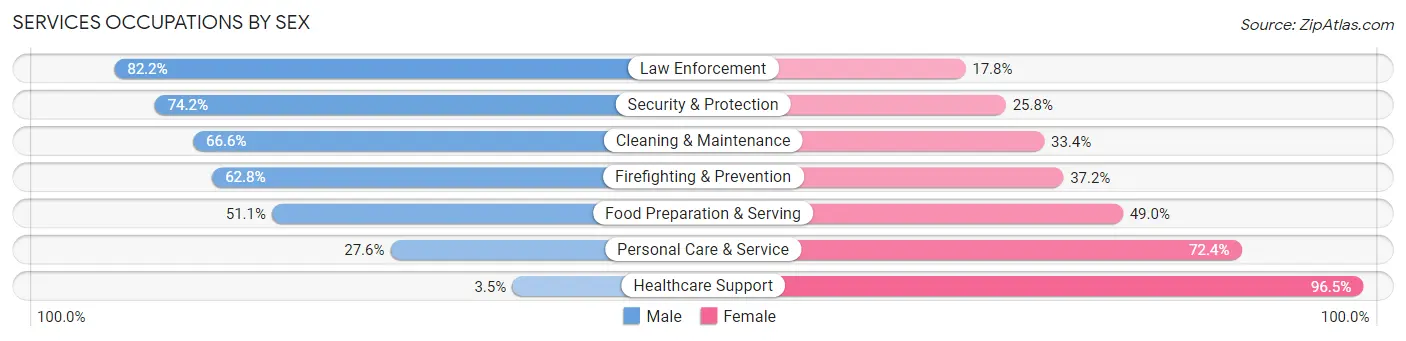
Services Occupations by Sex
Within the Services occupations in Casa Grande, the most male-oriented occupations are Law Enforcement (82.2%), Security & Protection (74.2%), and Cleaning & Maintenance (66.6%), while the most female-oriented occupations are Healthcare Support (96.5%), Personal Care & Service (72.4%), and Food Preparation & Serving (48.9%).
| Occupation | Male | Female |
| Healthcare Support | 30 (3.5%) | 834 (96.5%) |
| Security & Protection | 861 (74.2%) | 299 (25.8%) |
| Firefighting & Prevention | 301 (62.8%) | 178 (37.2%) |
| Law Enforcement | 560 (82.2%) | 121 (17.8%) |
| Food Preparation & Serving | 757 (51.0%) | 726 (48.9%) |
| Cleaning & Maintenance | 557 (66.6%) | 279 (33.4%) |
| Personal Care & Service | 117 (27.6%) | 307 (72.4%) |
| Total (Category) | 2,322 (48.7%) | 2,445 (51.3%) |
| Total (Overall) | 12,633 (54.9%) | 10,366 (45.1%) |
Sales and Office Occupations
The most common Sales and Office occupations in Casa Grande are Office & Administration (2,654 | 11.5%), and Sales & Related (2,171 | 9.4%).

Sales and Office Occupations by Sex

| Occupation | Male | Female |
| Sales & Related | 1,227 (56.5%) | 944 (43.5%) |
| Office & Administration | 470 (17.7%) | 2,184 (82.3%) |
| Total (Category) | 1,697 (35.2%) | 3,128 (64.8%) |
| Total (Overall) | 12,633 (54.9%) | 10,366 (45.1%) |
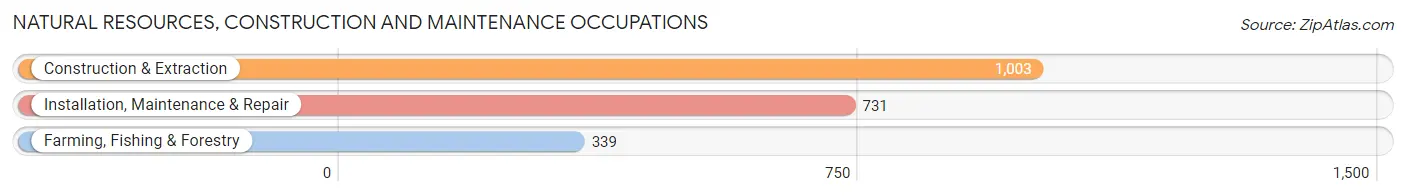
Natural Resources, Construction and Maintenance Occupations
The most common Natural Resources, Construction and Maintenance occupations in Casa Grande are Construction & Extraction (1,003 | 4.4%), Installation, Maintenance & Repair (731 | 3.2%), and Farming, Fishing & Forestry (339 | 1.5%).
Natural Resources, Construction and Maintenance Occupations by Sex
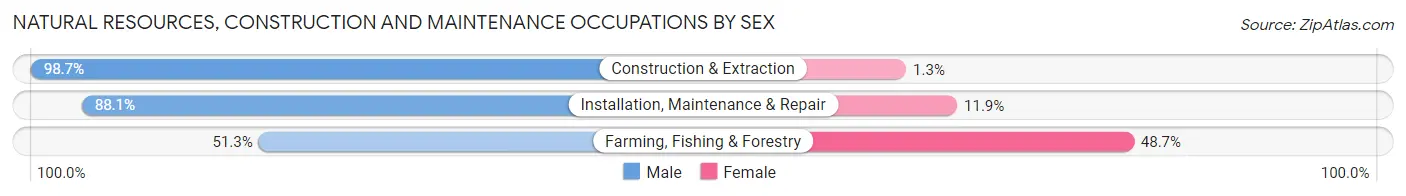
| Occupation | Male | Female |
| Farming, Fishing & Forestry | 174 (51.3%) | 165 (48.7%) |
| Construction & Extraction | 990 (98.7%) | 13 (1.3%) |
| Installation, Maintenance & Repair | 644 (88.1%) | 87 (11.9%) |
| Total (Category) | 1,808 (87.2%) | 265 (12.8%) |
| Total (Overall) | 12,633 (54.9%) | 10,366 (45.1%) |
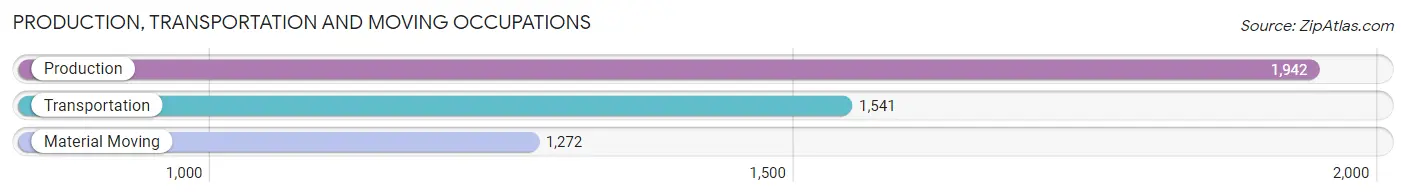
Production, Transportation and Moving Occupations
The most common Production, Transportation and Moving occupations in Casa Grande are Production (1,942 | 8.4%), Transportation (1,541 | 6.7%), and Material Moving (1,272 | 5.5%).
Production, Transportation and Moving Occupations by Sex
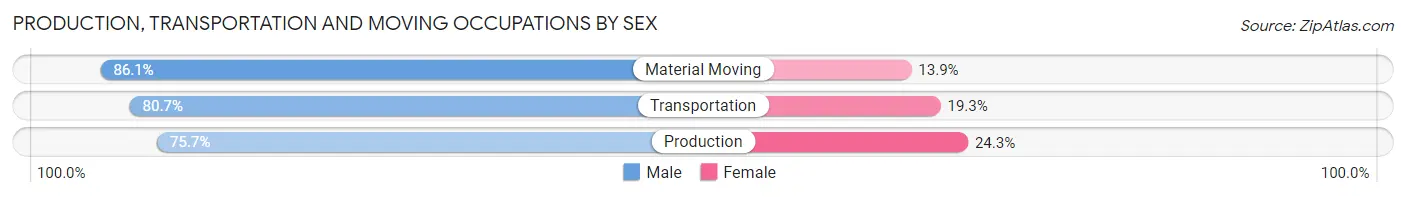
| Occupation | Male | Female |
| Production | 1,470 (75.7%) | 472 (24.3%) |
| Transportation | 1,244 (80.7%) | 297 (19.3%) |
| Material Moving | 1,095 (86.1%) | 177 (13.9%) |
| Total (Category) | 3,809 (80.1%) | 946 (19.9%) |
| Total (Overall) | 12,633 (54.9%) | 10,366 (45.1%) |
Employment Industries by Sex in Casa Grande
Employment Industries in Casa Grande
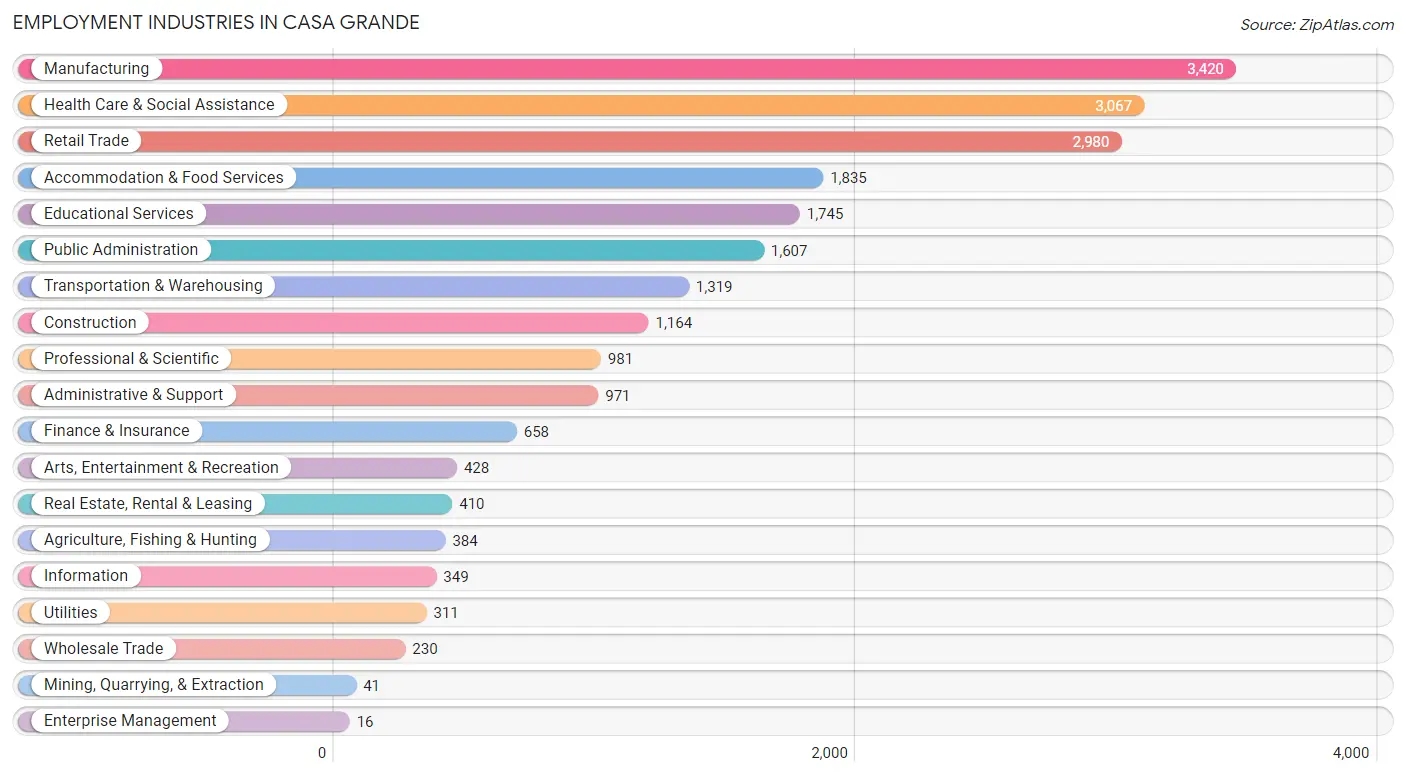
The major employment industries in Casa Grande include Manufacturing (3,420 | 14.9%), Health Care & Social Assistance (3,067 | 13.3%), Retail Trade (2,980 | 13.0%), Accommodation & Food Services (1,835 | 8.0%), and Educational Services (1,745 | 7.6%).
Employment Industries by Sex in Casa Grande
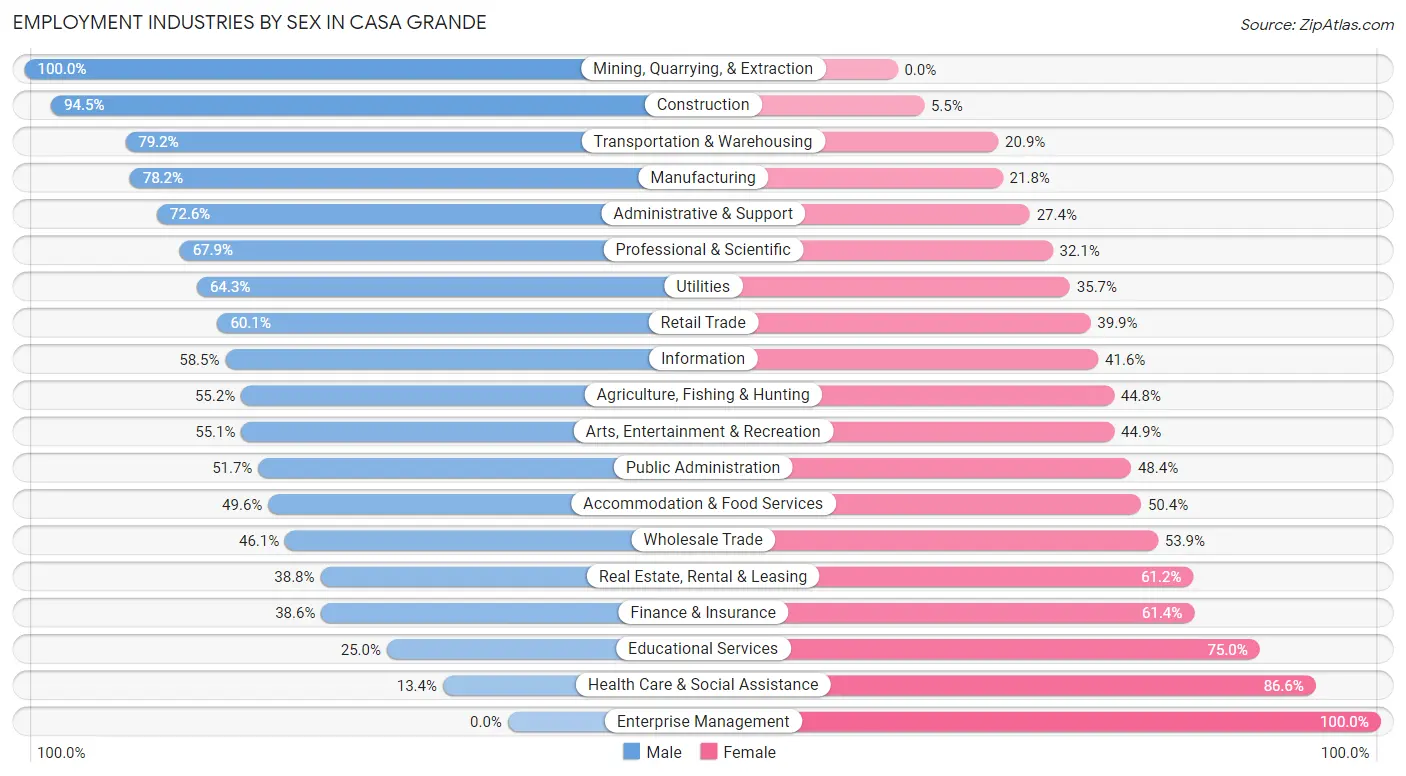
The Casa Grande industries that see more men than women are Mining, Quarrying, & Extraction (100.0%), Construction (94.5%), and Transportation & Warehousing (79.1%), whereas the industries that tend to have a higher number of women are Enterprise Management (100.0%), Health Care & Social Assistance (86.6%), and Educational Services (75.0%).
| Industry | Male | Female |
| Agriculture, Fishing & Hunting | 212 (55.2%) | 172 (44.8%) |
| Mining, Quarrying, & Extraction | 41 (100.0%) | 0 (0.0%) |
| Construction | 1,100 (94.5%) | 64 (5.5%) |
| Manufacturing | 2,675 (78.2%) | 745 (21.8%) |
| Wholesale Trade | 106 (46.1%) | 124 (53.9%) |
| Retail Trade | 1,790 (60.1%) | 1,190 (39.9%) |
| Transportation & Warehousing | 1,044 (79.1%) | 275 (20.8%) |
| Utilities | 200 (64.3%) | 111 (35.7%) |
| Information | 204 (58.5%) | 145 (41.5%) |
| Finance & Insurance | 254 (38.6%) | 404 (61.4%) |
| Real Estate, Rental & Leasing | 159 (38.8%) | 251 (61.2%) |
| Professional & Scientific | 666 (67.9%) | 315 (32.1%) |
| Enterprise Management | 0 (0.0%) | 16 (100.0%) |
| Administrative & Support | 705 (72.6%) | 266 (27.4%) |
| Educational Services | 437 (25.0%) | 1,308 (75.0%) |
| Health Care & Social Assistance | 412 (13.4%) | 2,655 (86.6%) |
| Arts, Entertainment & Recreation | 236 (55.1%) | 192 (44.9%) |
| Accommodation & Food Services | 910 (49.6%) | 925 (50.4%) |
| Public Administration | 830 (51.6%) | 777 (48.3%) |
| Total | 12,633 (54.9%) | 10,366 (45.1%) |
Education in Casa Grande
School Enrollment in Casa Grande
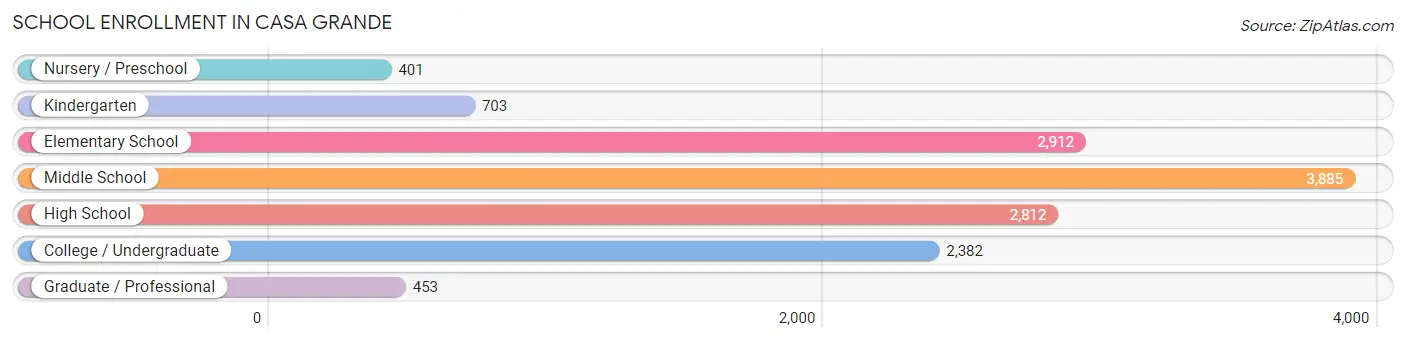
The most common levels of schooling among the 13,548 students in Casa Grande are middle school (3,885 | 28.7%), elementary school (2,912 | 21.5%), and high school (2,812 | 20.8%).
| School Level | # Students | % Students |
| Nursery / Preschool | 401 | 3.0% |
| Kindergarten | 703 | 5.2% |
| Elementary School | 2,912 | 21.5% |
| Middle School | 3,885 | 28.7% |
| High School | 2,812 | 20.8% |
| College / Undergraduate | 2,382 | 17.6% |
| Graduate / Professional | 453 | 3.3% |
| Total | 13,548 | 100.0% |
School Enrollment by Age by Funding Source in Casa Grande
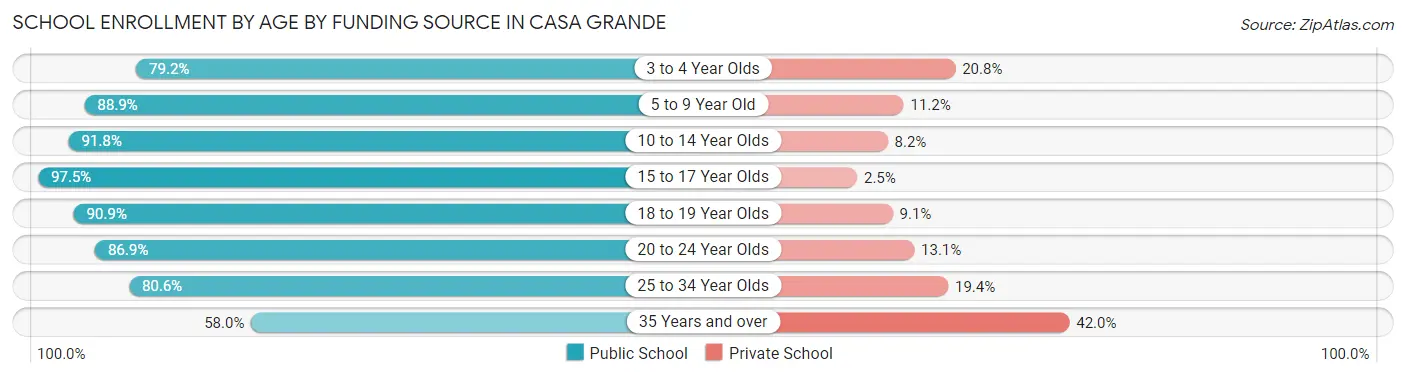
Out of a total of 13,548 students who are enrolled in schools in Casa Grande, 1,544 (11.4%) attend a private institution, while the remaining 12,004 (88.6%) are enrolled in public schools. The age group of 35 years and over has the highest likelihood of being enrolled in private schools, with 332 (42.0% in the age bracket) enrolled. Conversely, the age group of 15 to 17 year olds has the lowest likelihood of being enrolled in a private school, with 1,916 (97.5% in the age bracket) attending a public institution.
| Age Bracket | Public School | Private School |
| 3 to 4 Year Olds | 244 (79.2%) | 64 (20.8%) |
| 5 to 9 Year Old | 2,796 (88.8%) | 351 (11.2%) |
| 10 to 14 Year Olds | 4,458 (91.8%) | 397 (8.2%) |
| 15 to 17 Year Olds | 1,916 (97.5%) | 49 (2.5%) |
| 18 to 19 Year Olds | 479 (90.9%) | 48 (9.1%) |
| 20 to 24 Year Olds | 1,020 (86.9%) | 154 (13.1%) |
| 25 to 34 Year Olds | 630 (80.6%) | 152 (19.4%) |
| 35 Years and over | 458 (58.0%) | 332 (42.0%) |
| Total | 12,004 (88.6%) | 1,544 (11.4%) |
Educational Attainment by Field of Study in Casa Grande
Business (1,596 | 18.8%), education (1,333 | 15.7%), engineering (1,019 | 12.0%), science & technology (857 | 10.1%), and arts & humanities (678 | 8.0%) are the most common fields of study among 8,487 individuals in Casa Grande who have obtained a bachelor's degree or higher.
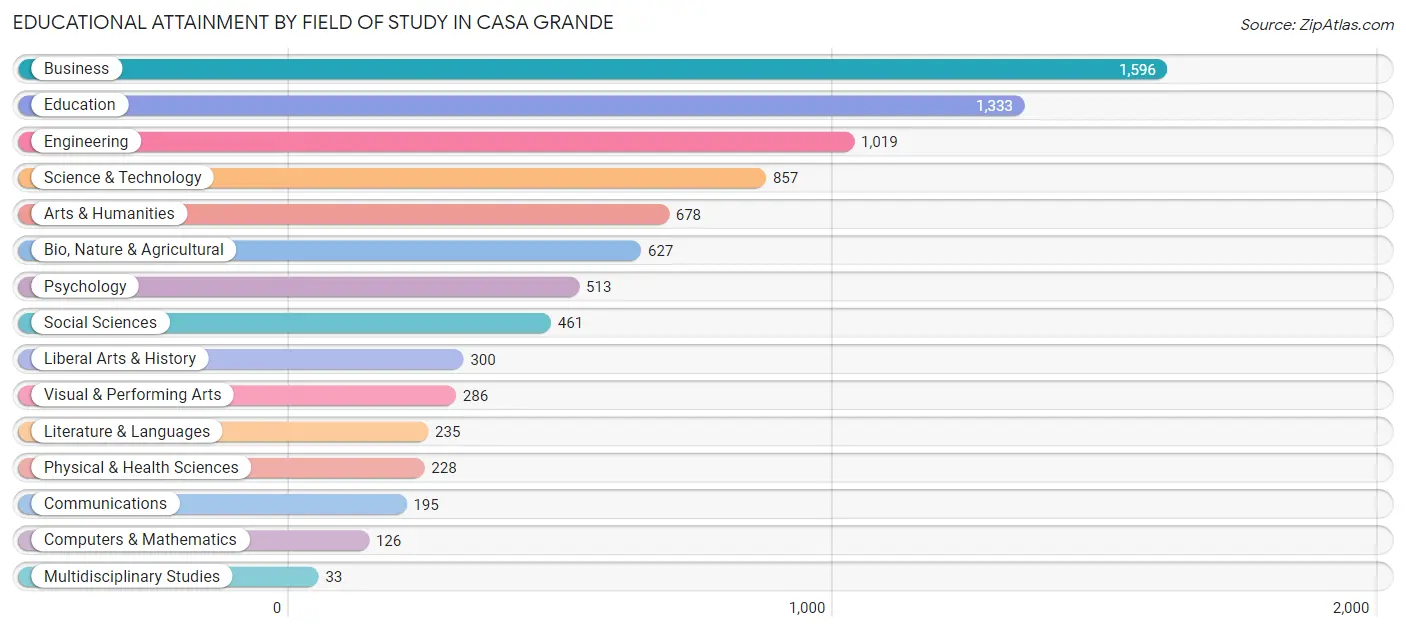
| Field of Study | # Graduates | % Graduates |
| Computers & Mathematics | 126 | 1.5% |
| Bio, Nature & Agricultural | 627 | 7.4% |
| Physical & Health Sciences | 228 | 2.7% |
| Psychology | 513 | 6.0% |
| Social Sciences | 461 | 5.4% |
| Engineering | 1,019 | 12.0% |
| Multidisciplinary Studies | 33 | 0.4% |
| Science & Technology | 857 | 10.1% |
| Business | 1,596 | 18.8% |
| Education | 1,333 | 15.7% |
| Literature & Languages | 235 | 2.8% |
| Liberal Arts & History | 300 | 3.5% |
| Visual & Performing Arts | 286 | 3.4% |
| Communications | 195 | 2.3% |
| Arts & Humanities | 678 | 8.0% |
| Total | 8,487 | 100.0% |
Transportation & Commute in Casa Grande
Vehicle Availability by Sex in Casa Grande
The most prevalent vehicle ownership categories in Casa Grande are males with 2 vehicles (5,093, accounting for 40.5%) and females with 2 vehicles (4,117, making up 50.7%).
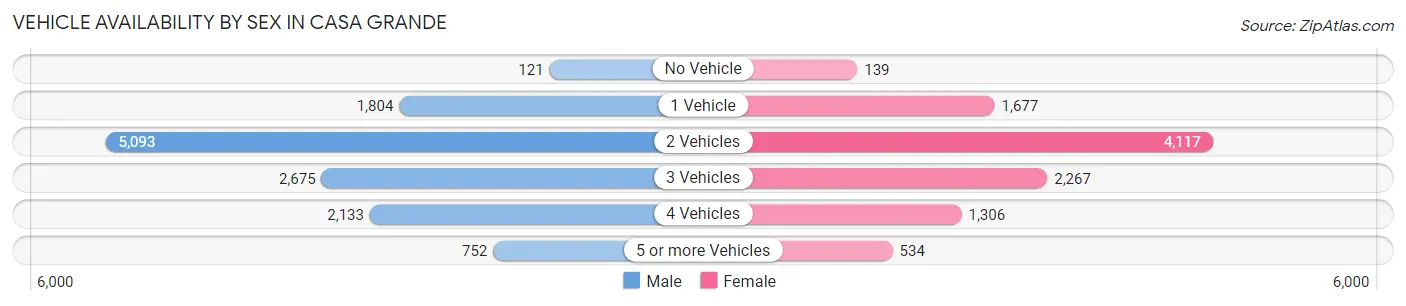
| Vehicles Available | Male | Female |
| No Vehicle | 121 (1.0%) | 139 (1.4%) |
| 1 Vehicle | 1,804 (14.3%) | 1,677 (16.7%) |
| 2 Vehicles | 5,093 (40.5%) | 4,117 (41.0%) |
| 3 Vehicles | 2,675 (21.3%) | 2,267 (22.6%) |
| 4 Vehicles | 2,133 (17.0%) | 1,306 (13.0%) |
| 5 or more Vehicles | 752 (6.0%) | 534 (5.3%) |
| Total | 12,578 (100.0%) | 10,040 (100.0%) |
Commute Time in Casa Grande
The most frequently occuring commute durations in Casa Grande are 10 to 14 minutes (4,729 commuters, 22.5%), 15 to 19 minutes (3,513 commuters, 16.7%), and 5 to 9 minutes (2,692 commuters, 12.8%).
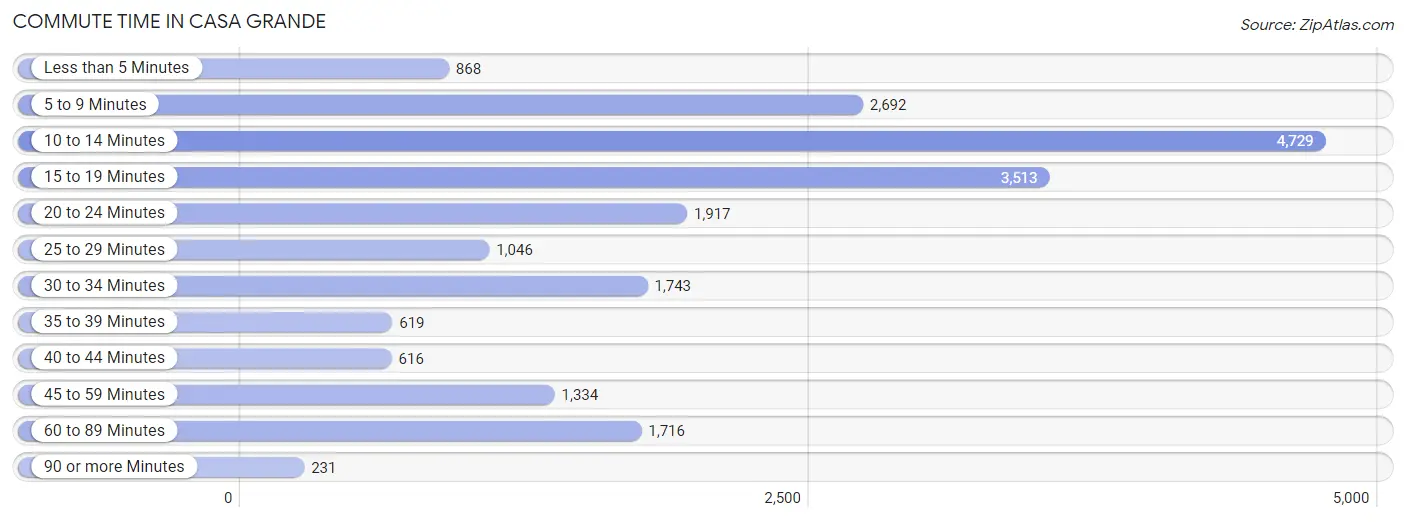
| Commute Time | # Commuters | % Commuters |
| Less than 5 Minutes | 868 | 4.1% |
| 5 to 9 Minutes | 2,692 | 12.8% |
| 10 to 14 Minutes | 4,729 | 22.5% |
| 15 to 19 Minutes | 3,513 | 16.7% |
| 20 to 24 Minutes | 1,917 | 9.1% |
| 25 to 29 Minutes | 1,046 | 5.0% |
| 30 to 34 Minutes | 1,743 | 8.3% |
| 35 to 39 Minutes | 619 | 2.9% |
| 40 to 44 Minutes | 616 | 2.9% |
| 45 to 59 Minutes | 1,334 | 6.4% |
| 60 to 89 Minutes | 1,716 | 8.2% |
| 90 or more Minutes | 231 | 1.1% |
Commute Time by Sex in Casa Grande
The most common commute times in Casa Grande are 10 to 14 minutes (2,565 commuters, 21.3%) for males and 10 to 14 minutes (2,164 commuters, 24.0%) for females.
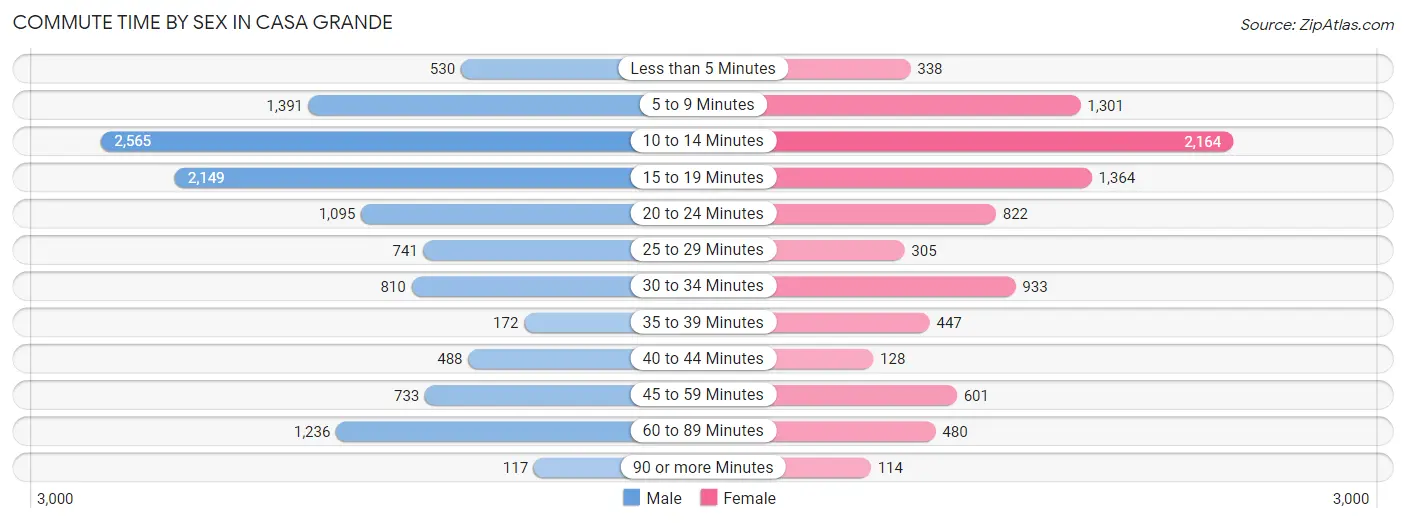
| Commute Time | Male | Female |
| Less than 5 Minutes | 530 (4.4%) | 338 (3.8%) |
| 5 to 9 Minutes | 1,391 (11.6%) | 1,301 (14.5%) |
| 10 to 14 Minutes | 2,565 (21.3%) | 2,164 (24.0%) |
| 15 to 19 Minutes | 2,149 (17.9%) | 1,364 (15.2%) |
| 20 to 24 Minutes | 1,095 (9.1%) | 822 (9.1%) |
| 25 to 29 Minutes | 741 (6.2%) | 305 (3.4%) |
| 30 to 34 Minutes | 810 (6.7%) | 933 (10.4%) |
| 35 to 39 Minutes | 172 (1.4%) | 447 (5.0%) |
| 40 to 44 Minutes | 488 (4.1%) | 128 (1.4%) |
| 45 to 59 Minutes | 733 (6.1%) | 601 (6.7%) |
| 60 to 89 Minutes | 1,236 (10.3%) | 480 (5.3%) |
| 90 or more Minutes | 117 (1.0%) | 114 (1.3%) |
Time of Departure to Work by Sex in Casa Grande
The most frequent times of departure to work in Casa Grande are 12:00 AM to 4:59 AM (2,292, 19.1%) for males and 7:00 AM to 7:29 AM (1,551, 17.2%) for females.
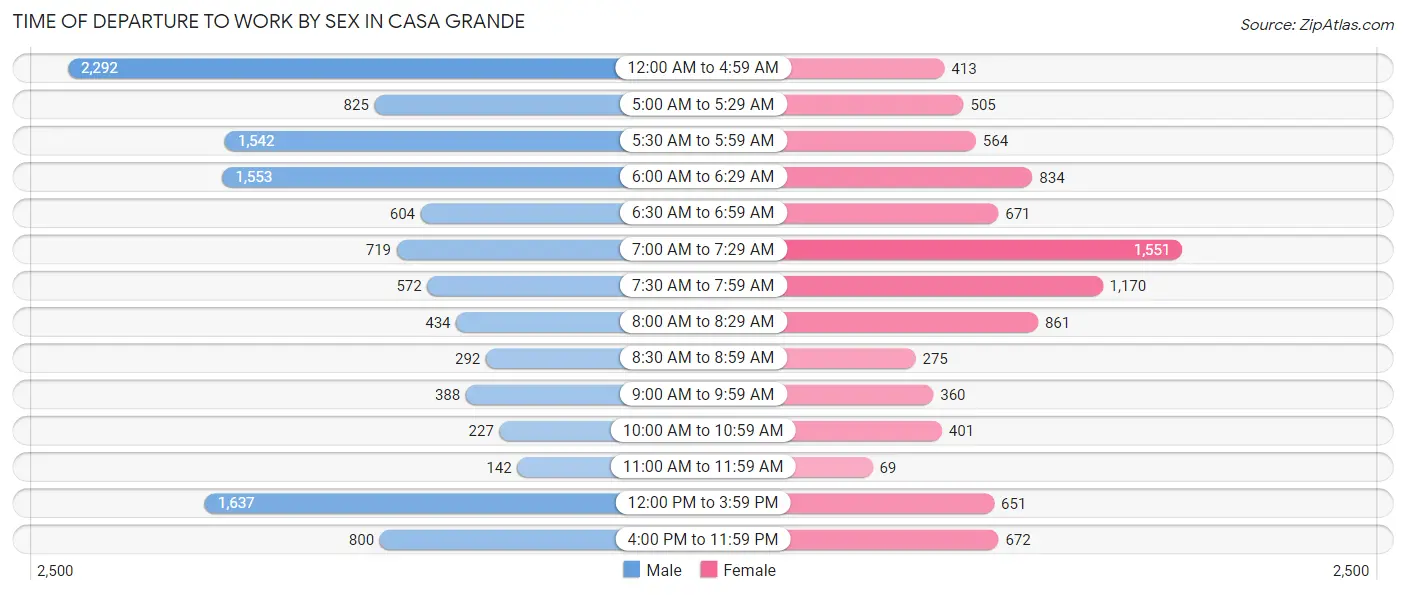
| Time of Departure | Male | Female |
| 12:00 AM to 4:59 AM | 2,292 (19.1%) | 413 (4.6%) |
| 5:00 AM to 5:29 AM | 825 (6.9%) | 505 (5.6%) |
| 5:30 AM to 5:59 AM | 1,542 (12.8%) | 564 (6.3%) |
| 6:00 AM to 6:29 AM | 1,553 (12.9%) | 834 (9.3%) |
| 6:30 AM to 6:59 AM | 604 (5.0%) | 671 (7.5%) |
| 7:00 AM to 7:29 AM | 719 (6.0%) | 1,551 (17.2%) |
| 7:30 AM to 7:59 AM | 572 (4.8%) | 1,170 (13.0%) |
| 8:00 AM to 8:29 AM | 434 (3.6%) | 861 (9.6%) |
| 8:30 AM to 8:59 AM | 292 (2.4%) | 275 (3.1%) |
| 9:00 AM to 9:59 AM | 388 (3.2%) | 360 (4.0%) |
| 10:00 AM to 10:59 AM | 227 (1.9%) | 401 (4.5%) |
| 11:00 AM to 11:59 AM | 142 (1.2%) | 69 (0.8%) |
| 12:00 PM to 3:59 PM | 1,637 (13.6%) | 651 (7.2%) |
| 4:00 PM to 11:59 PM | 800 (6.7%) | 672 (7.5%) |
| Total | 12,027 (100.0%) | 8,997 (100.0%) |
Housing Occupancy in Casa Grande
Occupancy by Ownership in Casa Grande
Of the total 20,027 dwellings in Casa Grande, owner-occupied units account for 13,976 (69.8%), while renter-occupied units make up 6,051 (30.2%).
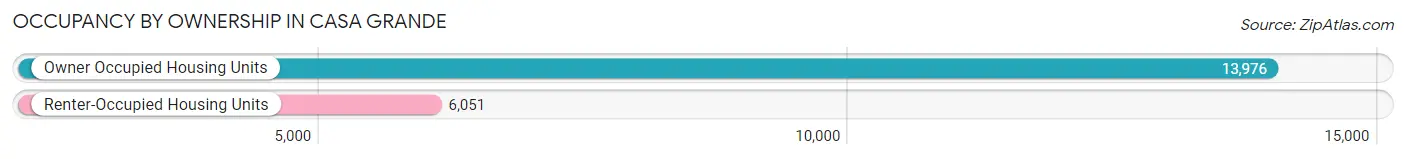
| Occupancy | # Housing Units | % Housing Units |
| Owner Occupied Housing Units | 13,976 | 69.8% |
| Renter-Occupied Housing Units | 6,051 | 30.2% |
| Total Occupied Housing Units | 20,027 | 100.0% |
Occupancy by Household Size in Casa Grande
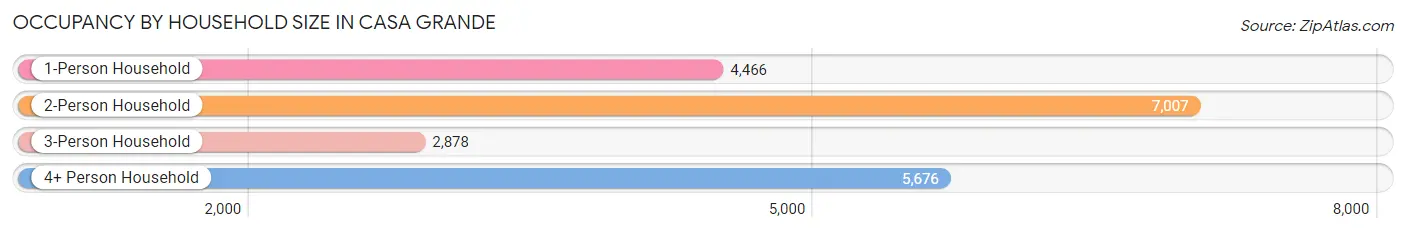
| Household Size | # Housing Units | % Housing Units |
| 1-Person Household | 4,466 | 22.3% |
| 2-Person Household | 7,007 | 35.0% |
| 3-Person Household | 2,878 | 14.4% |
| 4+ Person Household | 5,676 | 28.3% |
| Total Housing Units | 20,027 | 100.0% |
Occupancy by Ownership by Household Size in Casa Grande
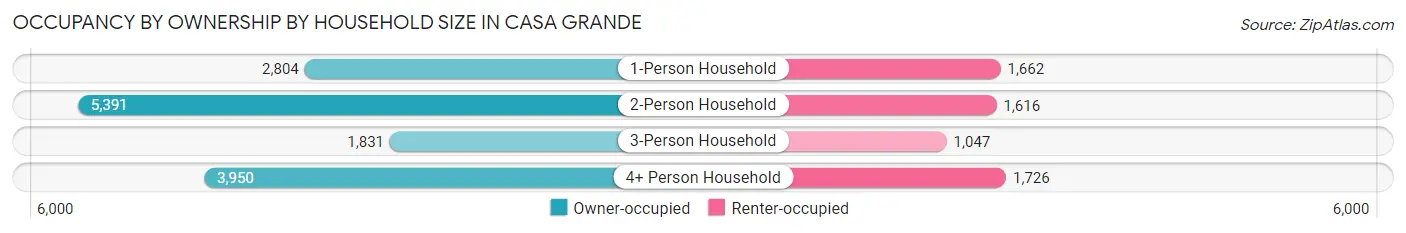
| Household Size | Owner-occupied | Renter-occupied |
| 1-Person Household | 2,804 (62.8%) | 1,662 (37.2%) |
| 2-Person Household | 5,391 (76.9%) | 1,616 (23.1%) |
| 3-Person Household | 1,831 (63.6%) | 1,047 (36.4%) |
| 4+ Person Household | 3,950 (69.6%) | 1,726 (30.4%) |
| Total Housing Units | 13,976 (69.8%) | 6,051 (30.2%) |
Occupancy by Educational Attainment in Casa Grande
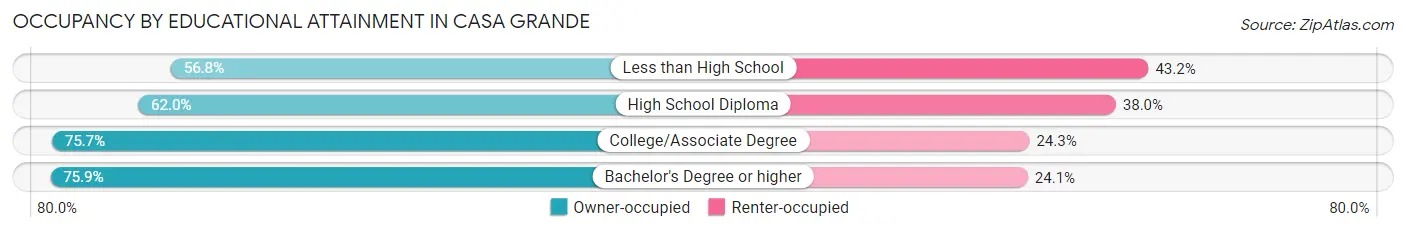
| Household Size | Owner-occupied | Renter-occupied |
| Less than High School | 1,055 (56.8%) | 802 (43.2%) |
| High School Diploma | 3,810 (62.0%) | 2,337 (38.0%) |
| College/Associate Degree | 5,562 (75.7%) | 1,787 (24.3%) |
| Bachelor's Degree or higher | 3,549 (75.9%) | 1,125 (24.1%) |
Occupancy by Age of Householder in Casa Grande
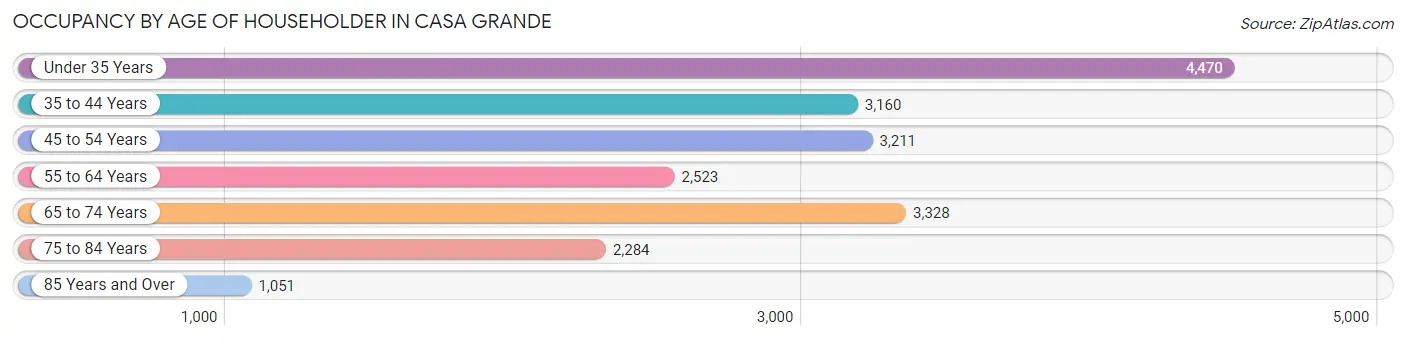
| Age Bracket | # Households | % Households |
| Under 35 Years | 4,470 | 22.3% |
| 35 to 44 Years | 3,160 | 15.8% |
| 45 to 54 Years | 3,211 | 16.0% |
| 55 to 64 Years | 2,523 | 12.6% |
| 65 to 74 Years | 3,328 | 16.6% |
| 75 to 84 Years | 2,284 | 11.4% |
| 85 Years and Over | 1,051 | 5.2% |
| Total | 20,027 | 100.0% |
Housing Finances in Casa Grande
Median Income by Occupancy in Casa Grande
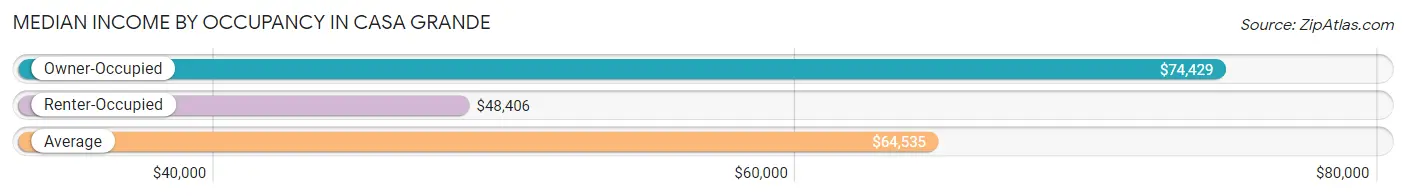
| Occupancy Type | # Households | Median Income |
| Owner-Occupied | 13,976 (69.8%) | $74,429 |
| Renter-Occupied | 6,051 (30.2%) | $48,406 |
| Average | 20,027 (100.0%) | $64,535 |
Occupancy by Householder Income Bracket in Casa Grande
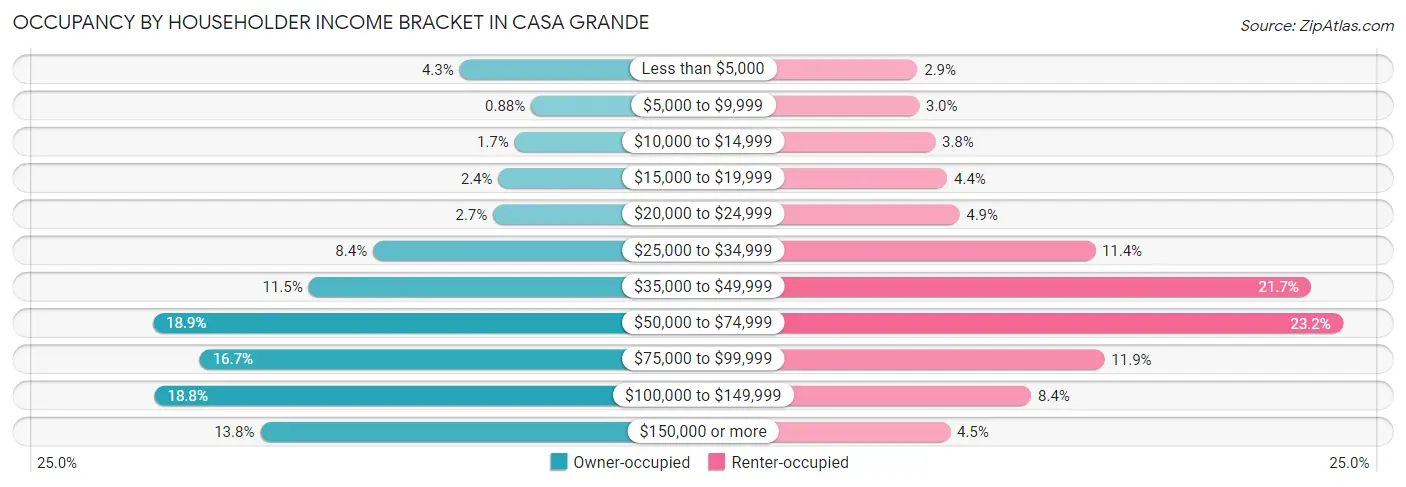
| Income Bracket | Owner-occupied | Renter-occupied |
| Less than $5,000 | 599 (4.3%) | 178 (2.9%) |
| $5,000 to $9,999 | 123 (0.9%) | 182 (3.0%) |
| $10,000 to $14,999 | 234 (1.7%) | 229 (3.8%) |
| $15,000 to $19,999 | 341 (2.4%) | 264 (4.4%) |
| $20,000 to $24,999 | 376 (2.7%) | 299 (4.9%) |
| $25,000 to $34,999 | 1,176 (8.4%) | 690 (11.4%) |
| $35,000 to $49,999 | 1,604 (11.5%) | 1,311 (21.7%) |
| $50,000 to $74,999 | 2,639 (18.9%) | 1,403 (23.2%) |
| $75,000 to $99,999 | 2,329 (16.7%) | 717 (11.8%) |
| $100,000 to $149,999 | 2,629 (18.8%) | 506 (8.4%) |
| $150,000 or more | 1,926 (13.8%) | 272 (4.5%) |
| Total | 13,976 (100.0%) | 6,051 (100.0%) |
Monthly Housing Cost Tiers in Casa Grande
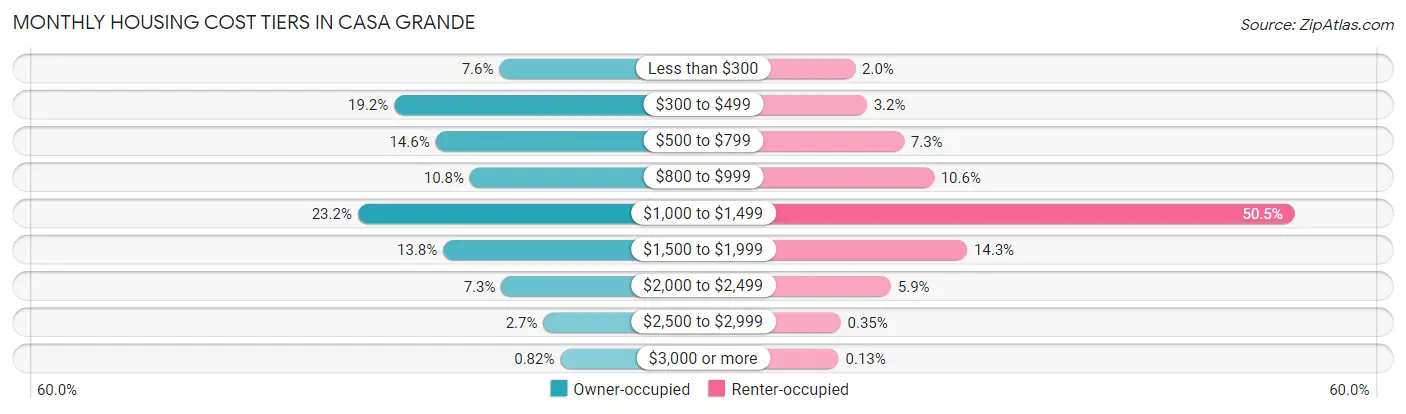
| Monthly Cost | Owner-occupied | Renter-occupied |
| Less than $300 | 1,057 (7.6%) | 118 (1.9%) |
| $300 to $499 | 2,680 (19.2%) | 196 (3.2%) |
| $500 to $799 | 2,042 (14.6%) | 444 (7.3%) |
| $800 to $999 | 1,512 (10.8%) | 644 (10.6%) |
| $1,000 to $1,499 | 3,243 (23.2%) | 3,056 (50.5%) |
| $1,500 to $1,999 | 1,925 (13.8%) | 866 (14.3%) |
| $2,000 to $2,499 | 1,026 (7.3%) | 357 (5.9%) |
| $2,500 to $2,999 | 377 (2.7%) | 21 (0.4%) |
| $3,000 or more | 114 (0.8%) | 8 (0.1%) |
| Total | 13,976 (100.0%) | 6,051 (100.0%) |
Physical Housing Characteristics in Casa Grande
Housing Structures in Casa Grande
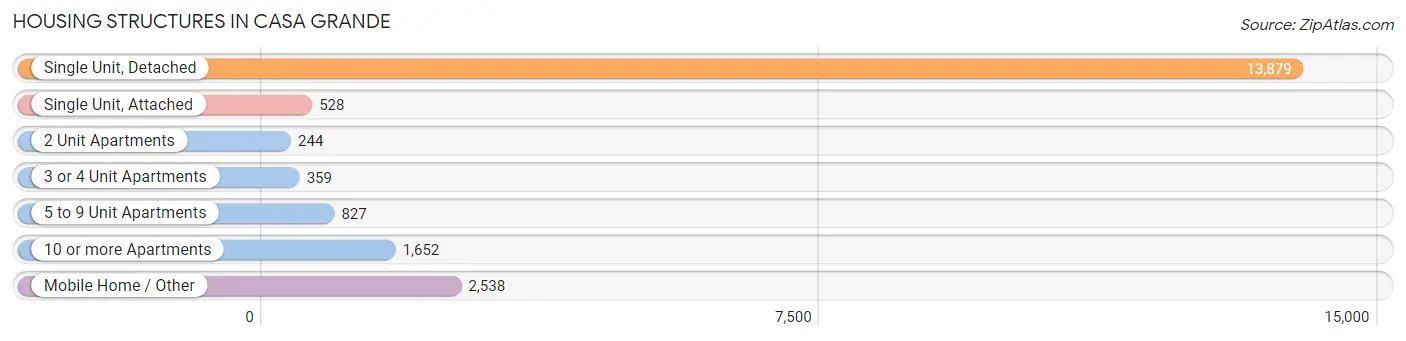
| Structure Type | # Housing Units | % Housing Units |
| Single Unit, Detached | 13,879 | 69.3% |
| Single Unit, Attached | 528 | 2.6% |
| 2 Unit Apartments | 244 | 1.2% |
| 3 or 4 Unit Apartments | 359 | 1.8% |
| 5 to 9 Unit Apartments | 827 | 4.1% |
| 10 or more Apartments | 1,652 | 8.3% |
| Mobile Home / Other | 2,538 | 12.7% |
| Total | 20,027 | 100.0% |
Housing Structures by Occupancy in Casa Grande
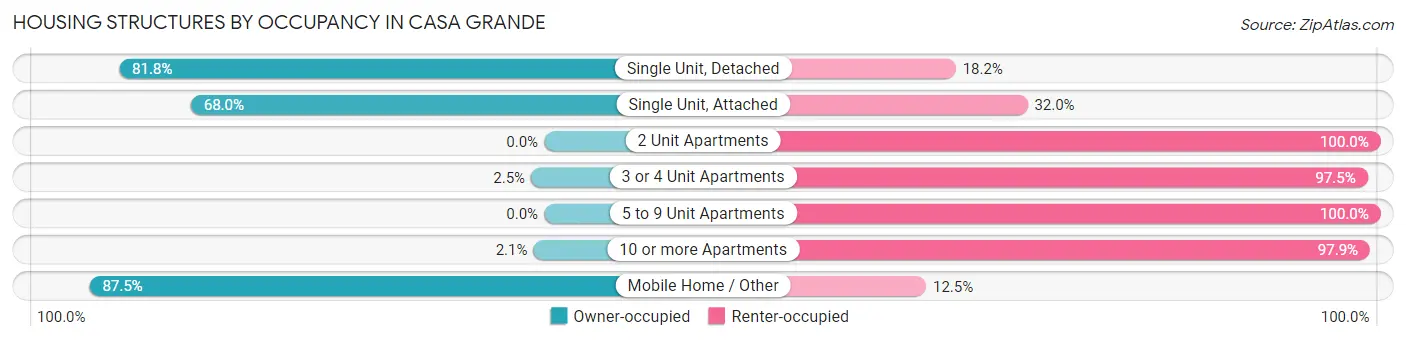
| Structure Type | Owner-occupied | Renter-occupied |
| Single Unit, Detached | 11,353 (81.8%) | 2,526 (18.2%) |
| Single Unit, Attached | 359 (68.0%) | 169 (32.0%) |
| 2 Unit Apartments | 0 (0.0%) | 244 (100.0%) |
| 3 or 4 Unit Apartments | 9 (2.5%) | 350 (97.5%) |
| 5 to 9 Unit Apartments | 0 (0.0%) | 827 (100.0%) |
| 10 or more Apartments | 34 (2.1%) | 1,618 (97.9%) |
| Mobile Home / Other | 2,221 (87.5%) | 317 (12.5%) |
| Total | 13,976 (69.8%) | 6,051 (30.2%) |
Housing Structures by Number of Rooms in Casa Grande
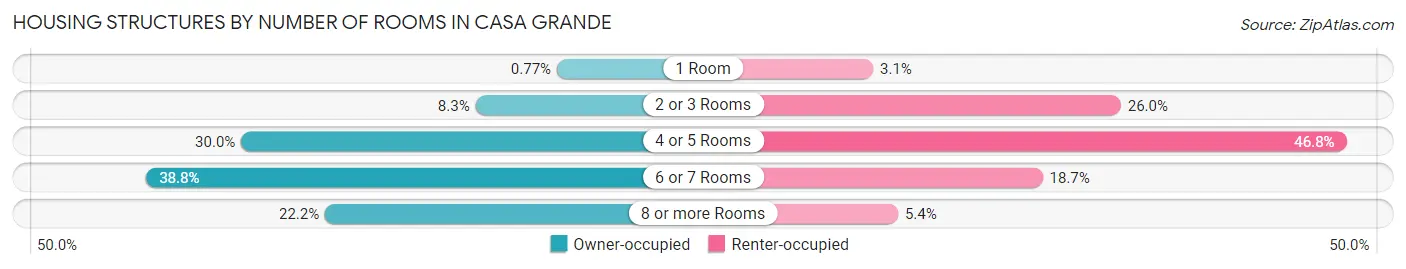
| Number of Rooms | Owner-occupied | Renter-occupied |
| 1 Room | 108 (0.8%) | 186 (3.1%) |
| 2 or 3 Rooms | 1,160 (8.3%) | 1,572 (26.0%) |
| 4 or 5 Rooms | 4,188 (30.0%) | 2,834 (46.8%) |
| 6 or 7 Rooms | 5,416 (38.8%) | 1,134 (18.7%) |
| 8 or more Rooms | 3,104 (22.2%) | 325 (5.4%) |
| Total | 13,976 (100.0%) | 6,051 (100.0%) |
Housing Structure by Heating Type in Casa Grande
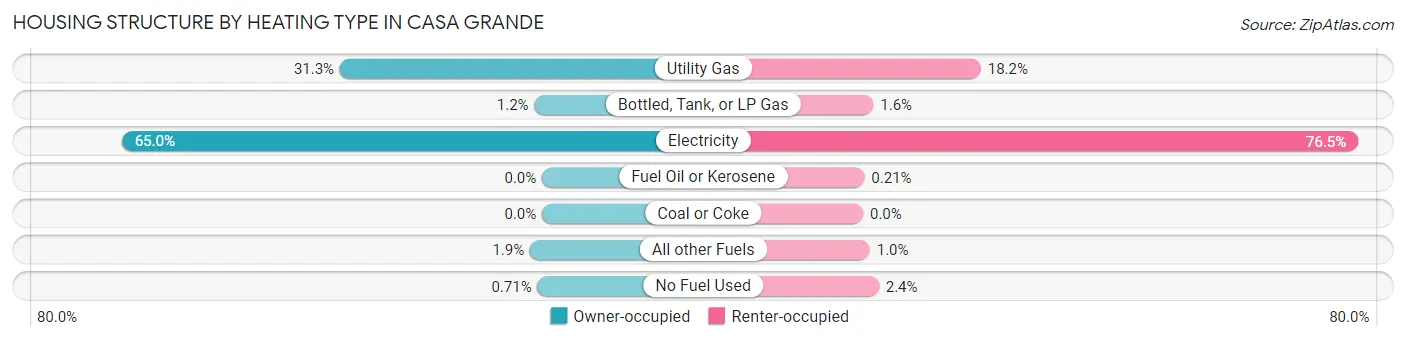
| Heating Type | Owner-occupied | Renter-occupied |
| Utility Gas | 4,368 (31.2%) | 1,101 (18.2%) |
| Bottled, Tank, or LP Gas | 167 (1.2%) | 96 (1.6%) |
| Electricity | 9,082 (65.0%) | 4,631 (76.5%) |
| Fuel Oil or Kerosene | 0 (0.0%) | 13 (0.2%) |
| Coal or Coke | 0 (0.0%) | 0 (0.0%) |
| All other Fuels | 260 (1.9%) | 63 (1.0%) |
| No Fuel Used | 99 (0.7%) | 147 (2.4%) |
| Total | 13,976 (100.0%) | 6,051 (100.0%) |
Household Vehicle Usage in Casa Grande
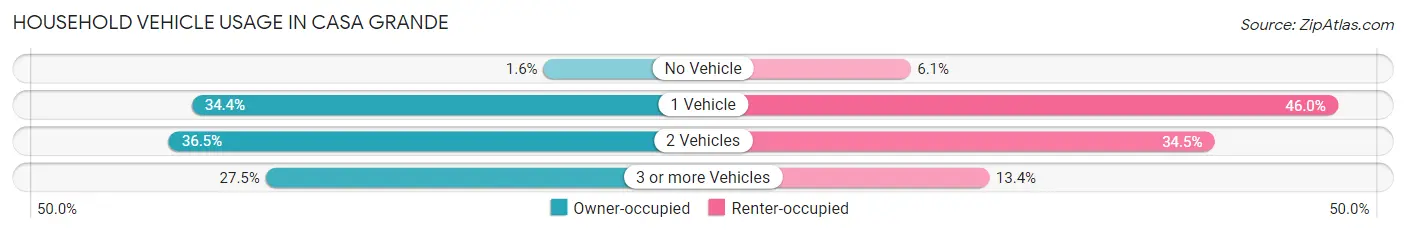
| Vehicles per Household | Owner-occupied | Renter-occupied |
| No Vehicle | 220 (1.6%) | 369 (6.1%) |
| 1 Vehicle | 4,807 (34.4%) | 2,783 (46.0%) |
| 2 Vehicles | 5,106 (36.5%) | 2,086 (34.5%) |
| 3 or more Vehicles | 3,843 (27.5%) | 813 (13.4%) |
| Total | 13,976 (100.0%) | 6,051 (100.0%) |
Real Estate & Mortgages in Casa Grande
Real Estate and Mortgage Overview in Casa Grande
| Characteristic | Without Mortgage | With Mortgage |
| Housing Units | 6,248 | 7,728 |
| Median Property Value | $158,900 | $249,300 |
| Median Household Income | $62,925 | $1,174 |
| Monthly Housing Costs | $456 | $114 |
| Real Estate Taxes | $1,140 | $159 |
Property Value by Mortgage Status in Casa Grande
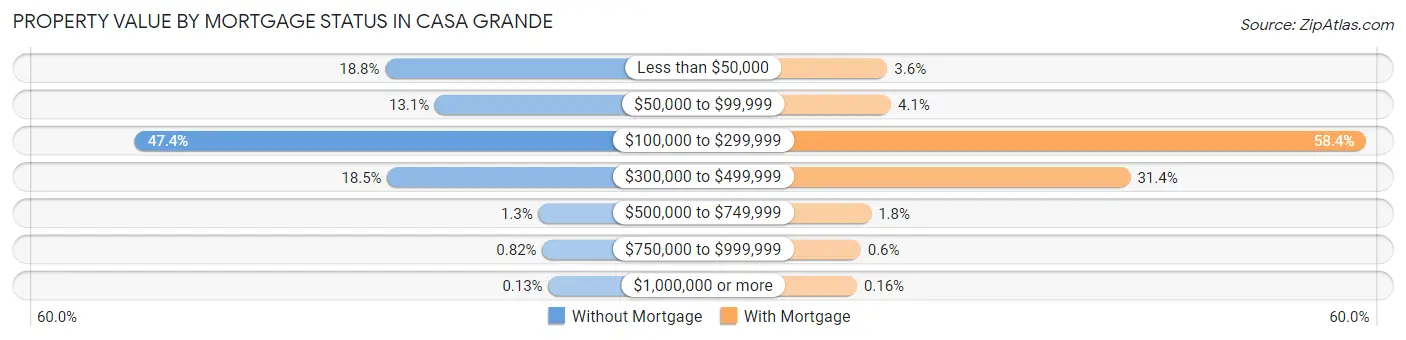
| Property Value | Without Mortgage | With Mortgage |
| Less than $50,000 | 1,173 (18.8%) | 281 (3.6%) |
| $50,000 to $99,999 | 818 (13.1%) | 314 (4.1%) |
| $100,000 to $299,999 | 2,961 (47.4%) | 4,509 (58.4%) |
| $300,000 to $499,999 | 1,158 (18.5%) | 2,428 (31.4%) |
| $500,000 to $749,999 | 79 (1.3%) | 138 (1.8%) |
| $750,000 to $999,999 | 51 (0.8%) | 46 (0.6%) |
| $1,000,000 or more | 8 (0.1%) | 12 (0.2%) |
| Total | 6,248 (100.0%) | 7,728 (100.0%) |
Household Income by Mortgage Status in Casa Grande
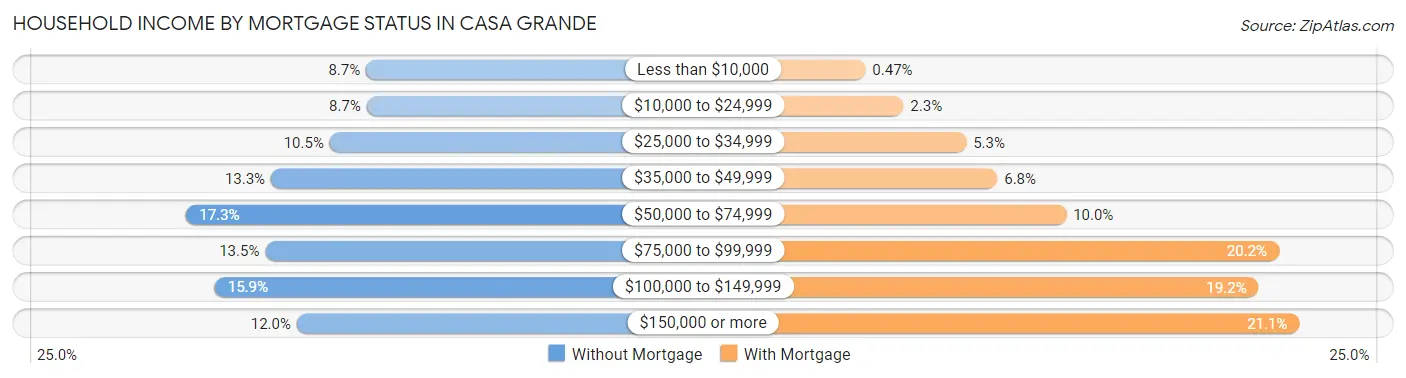
| Household Income | Without Mortgage | With Mortgage |
| Less than $10,000 | 546 (8.7%) | 36 (0.5%) |
| $10,000 to $24,999 | 544 (8.7%) | 176 (2.3%) |
| $25,000 to $34,999 | 654 (10.5%) | 407 (5.3%) |
| $35,000 to $49,999 | 829 (13.3%) | 522 (6.8%) |
| $50,000 to $74,999 | 1,081 (17.3%) | 775 (10.0%) |
| $75,000 to $99,999 | 846 (13.5%) | 1,558 (20.2%) |
| $100,000 to $149,999 | 996 (15.9%) | 1,483 (19.2%) |
| $150,000 or more | 752 (12.0%) | 1,633 (21.1%) |
| Total | 6,248 (100.0%) | 7,728 (100.0%) |
Property Value to Household Income Ratio in Casa Grande
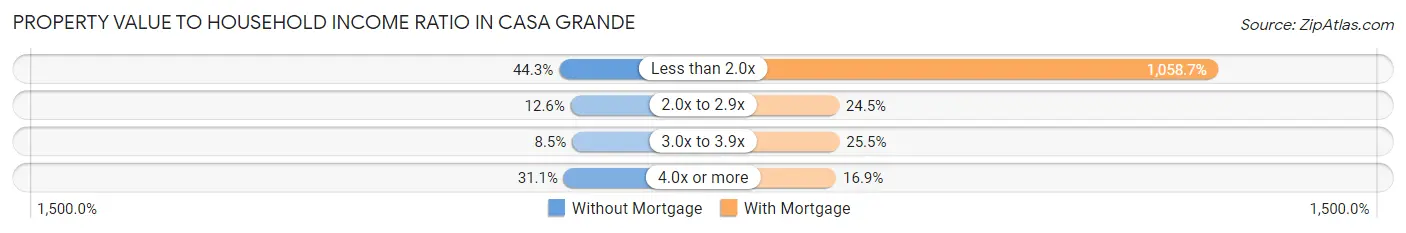
| Value-to-Income Ratio | Without Mortgage | With Mortgage |
| Less than 2.0x | 2,769 (44.3%) | 81,816 (1,058.7%) |
| 2.0x to 2.9x | 790 (12.6%) | 1,894 (24.5%) |
| 3.0x to 3.9x | 530 (8.5%) | 1,970 (25.5%) |
| 4.0x or more | 1,943 (31.1%) | 1,305 (16.9%) |
| Total | 6,248 (100.0%) | 7,728 (100.0%) |
Real Estate Taxes by Mortgage Status in Casa Grande
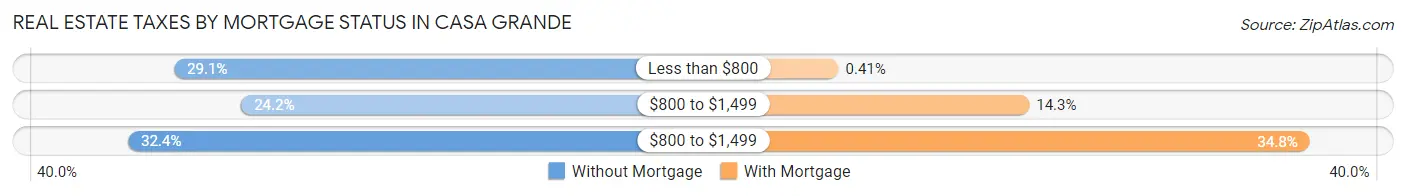
| Property Taxes | Without Mortgage | With Mortgage |
| Less than $800 | 1,816 (29.1%) | 32 (0.4%) |
| $800 to $1,499 | 1,510 (24.2%) | 1,108 (14.3%) |
| $800 to $1,499 | 2,027 (32.4%) | 2,691 (34.8%) |
| Total | 6,248 (100.0%) | 7,728 (100.0%) |
Health & Disability in Casa Grande
Health Insurance Coverage by Age in Casa Grande
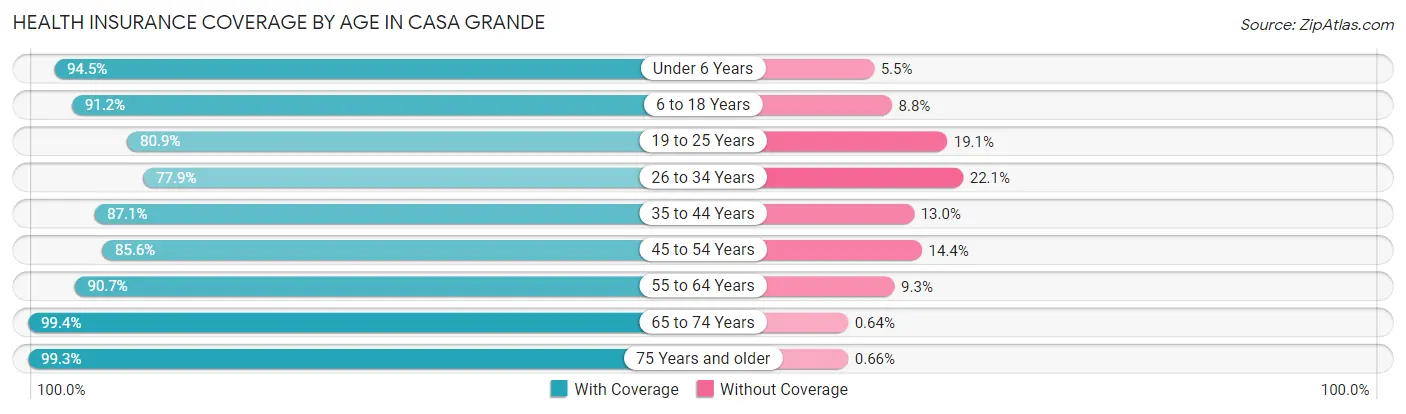
| Age Bracket | With Coverage | Without Coverage |
| Under 6 Years | 3,829 (94.5%) | 222 (5.5%) |
| 6 to 18 Years | 9,211 (91.2%) | 891 (8.8%) |
| 19 to 25 Years | 4,529 (80.9%) | 1,070 (19.1%) |
| 26 to 34 Years | 5,736 (77.9%) | 1,627 (22.1%) |
| 35 to 44 Years | 5,176 (87.1%) | 770 (13.0%) |
| 45 to 54 Years | 5,052 (85.6%) | 851 (14.4%) |
| 55 to 64 Years | 4,479 (90.7%) | 459 (9.3%) |
| 65 to 74 Years | 5,626 (99.4%) | 36 (0.6%) |
| 75 Years and older | 5,457 (99.3%) | 36 (0.7%) |
| Total | 49,095 (89.2%) | 5,962 (10.8%) |
Health Insurance Coverage by Citizenship Status in Casa Grande

| Citizenship Status | With Coverage | Without Coverage |
| Native Born | 3,829 (94.5%) | 222 (5.5%) |
| Foreign Born, Citizen | 9,211 (91.2%) | 891 (8.8%) |
| Foreign Born, not a Citizen | 4,529 (80.9%) | 1,070 (19.1%) |
Health Insurance Coverage by Household Income in Casa Grande
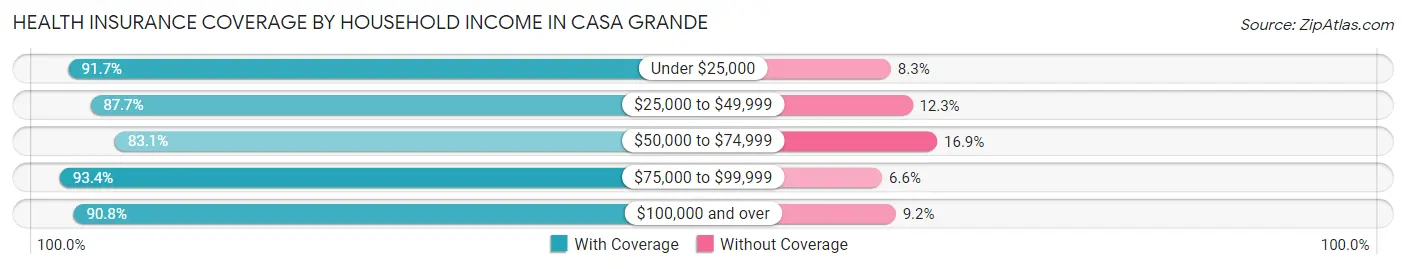
| Household Income | With Coverage | Without Coverage |
| Under $25,000 | 4,701 (91.7%) | 423 (8.3%) |
| $25,000 to $49,999 | 10,118 (87.7%) | 1,419 (12.3%) |
| $50,000 to $74,999 | 9,050 (83.1%) | 1,843 (16.9%) |
| $75,000 to $99,999 | 8,291 (93.4%) | 588 (6.6%) |
| $100,000 and over | 16,673 (90.8%) | 1,683 (9.2%) |
Public vs Private Health Insurance Coverage by Age in Casa Grande
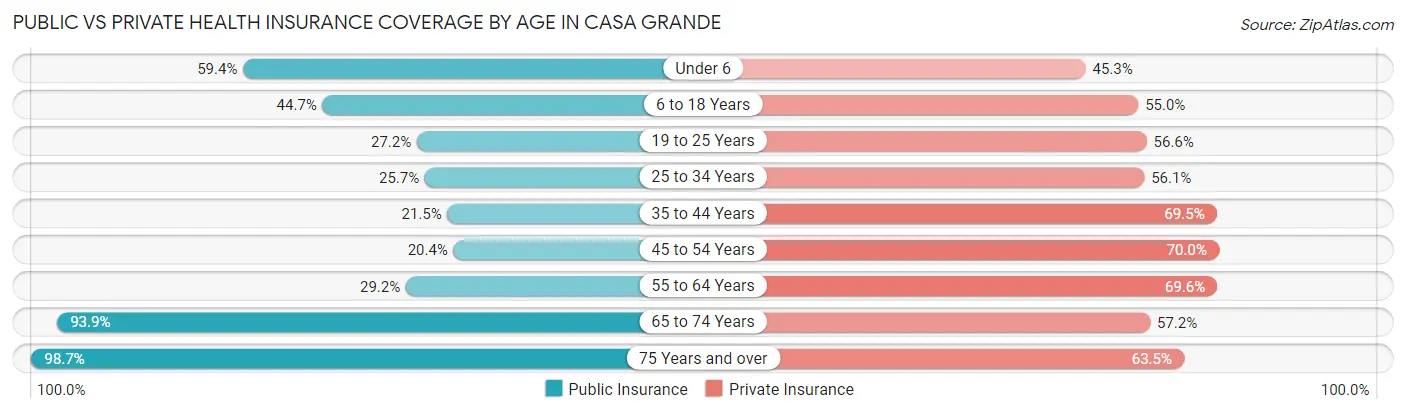
| Age Bracket | Public Insurance | Private Insurance |
| Under 6 | 2,407 (59.4%) | 1,833 (45.3%) |
| 6 to 18 Years | 4,514 (44.7%) | 5,558 (55.0%) |
| 19 to 25 Years | 1,520 (27.2%) | 3,168 (56.6%) |
| 25 to 34 Years | 1,890 (25.7%) | 4,133 (56.1%) |
| 35 to 44 Years | 1,278 (21.5%) | 4,135 (69.5%) |
| 45 to 54 Years | 1,201 (20.3%) | 4,130 (70.0%) |
| 55 to 64 Years | 1,442 (29.2%) | 3,439 (69.6%) |
| 65 to 74 Years | 5,319 (93.9%) | 3,240 (57.2%) |
| 75 Years and over | 5,423 (98.7%) | 3,487 (63.5%) |
| Total | 24,994 (45.4%) | 33,123 (60.2%) |
Disability Status by Sex by Age in Casa Grande
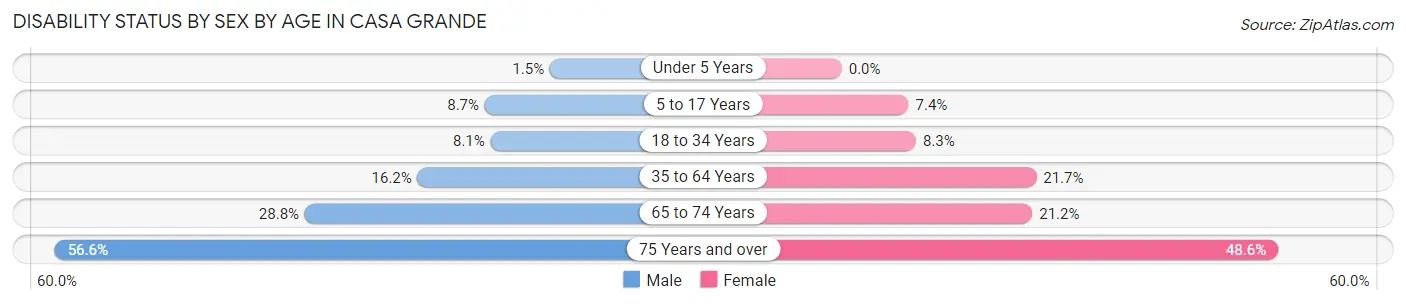
| Age Bracket | Male | Female |
| Under 5 Years | 28 (1.5%) | 0 (0.0%) |
| 5 to 17 Years | 502 (8.7%) | 340 (7.4%) |
| 18 to 34 Years | 572 (8.1%) | 536 (8.3%) |
| 35 to 64 Years | 1,365 (16.2%) | 1,815 (21.7%) |
| 65 to 74 Years | 748 (28.8%) | 650 (21.2%) |
| 75 Years and over | 1,374 (56.6%) | 1,490 (48.6%) |
Disability Class by Sex by Age in Casa Grande
Disability Class: Hearing Difficulty
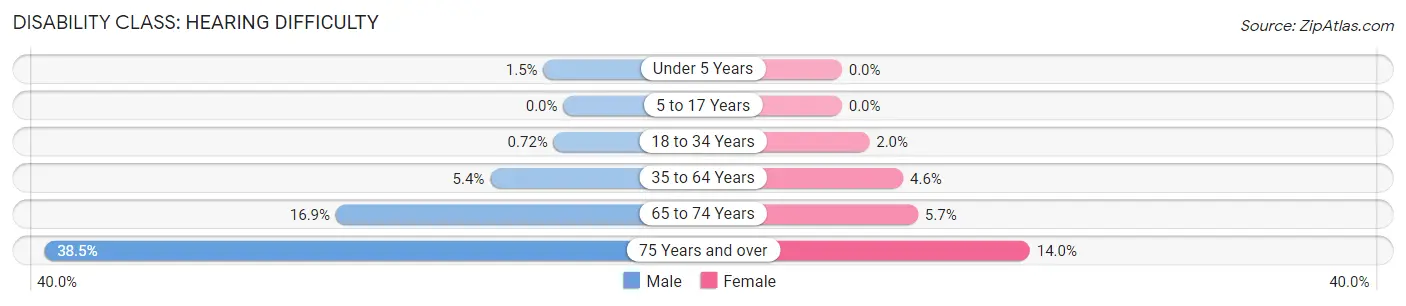
| Age Bracket | Male | Female |
| Under 5 Years | 28 (1.5%) | 0 (0.0%) |
| 5 to 17 Years | 0 (0.0%) | 0 (0.0%) |
| 18 to 34 Years | 51 (0.7%) | 132 (2.0%) |
| 35 to 64 Years | 457 (5.4%) | 381 (4.5%) |
| 65 to 74 Years | 439 (16.9%) | 173 (5.7%) |
| 75 Years and over | 935 (38.5%) | 428 (14.0%) |
Disability Class: Vision Difficulty
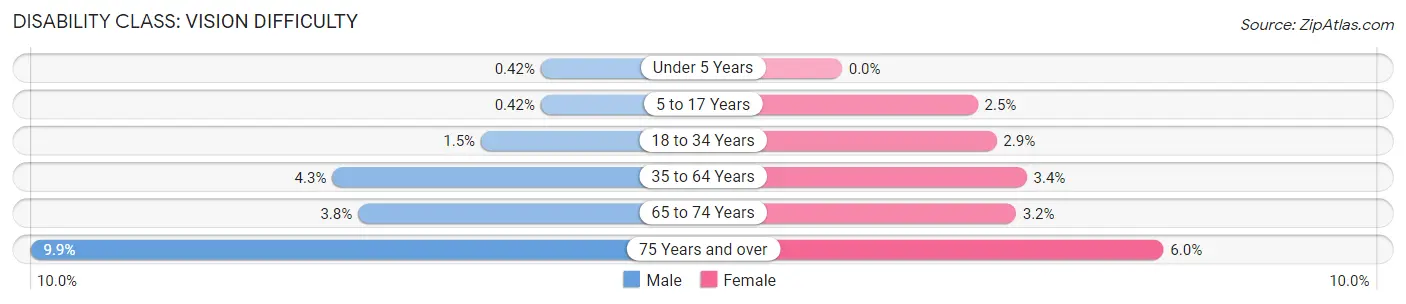
| Age Bracket | Male | Female |
| Under 5 Years | 8 (0.4%) | 0 (0.0%) |
| 5 to 17 Years | 24 (0.4%) | 115 (2.5%) |
| 18 to 34 Years | 108 (1.5%) | 186 (2.9%) |
| 35 to 64 Years | 361 (4.3%) | 287 (3.4%) |
| 65 to 74 Years | 99 (3.8%) | 99 (3.2%) |
| 75 Years and over | 240 (9.9%) | 183 (6.0%) |
Disability Class: Cognitive Difficulty
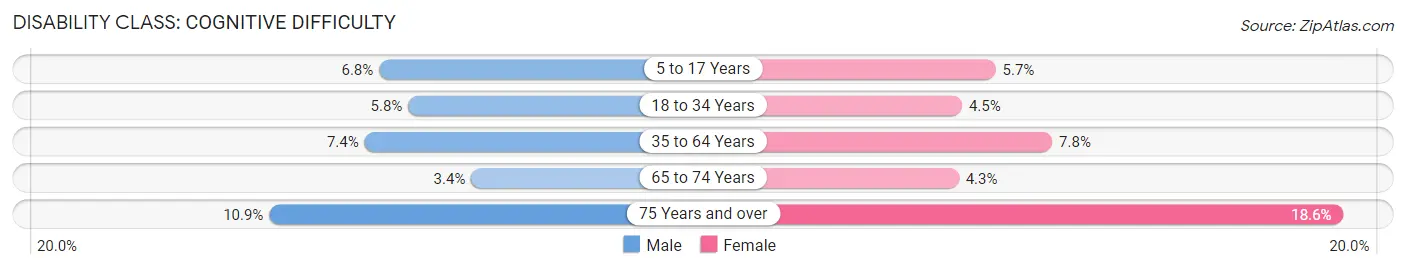
| Age Bracket | Male | Female |
| 5 to 17 Years | 393 (6.8%) | 261 (5.7%) |
| 18 to 34 Years | 407 (5.8%) | 289 (4.5%) |
| 35 to 64 Years | 621 (7.4%) | 654 (7.8%) |
| 65 to 74 Years | 89 (3.4%) | 133 (4.3%) |
| 75 Years and over | 265 (10.9%) | 571 (18.6%) |
Disability Class: Ambulatory Difficulty
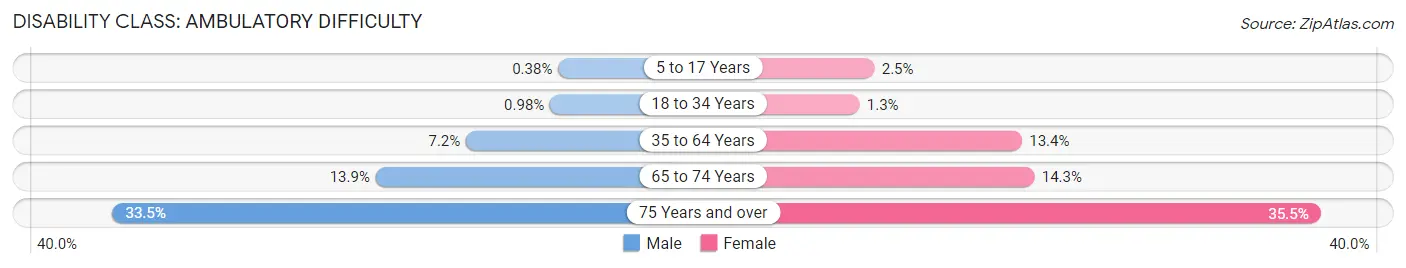
| Age Bracket | Male | Female |
| 5 to 17 Years | 22 (0.4%) | 112 (2.5%) |
| 18 to 34 Years | 69 (1.0%) | 87 (1.3%) |
| 35 to 64 Years | 607 (7.2%) | 1,123 (13.4%) |
| 65 to 74 Years | 362 (13.9%) | 439 (14.3%) |
| 75 Years and over | 812 (33.5%) | 1,090 (35.5%) |
Disability Class: Self-Care Difficulty
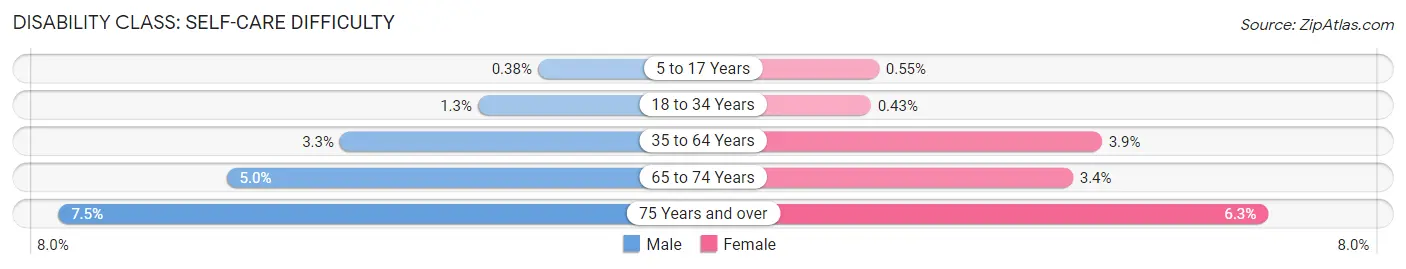
| Age Bracket | Male | Female |
| 5 to 17 Years | 22 (0.4%) | 25 (0.5%) |
| 18 to 34 Years | 90 (1.3%) | 28 (0.4%) |
| 35 to 64 Years | 279 (3.3%) | 323 (3.9%) |
| 65 to 74 Years | 130 (5.0%) | 105 (3.4%) |
| 75 Years and over | 182 (7.5%) | 194 (6.3%) |
Technology Access in Casa Grande
Computing Device Access in Casa Grande
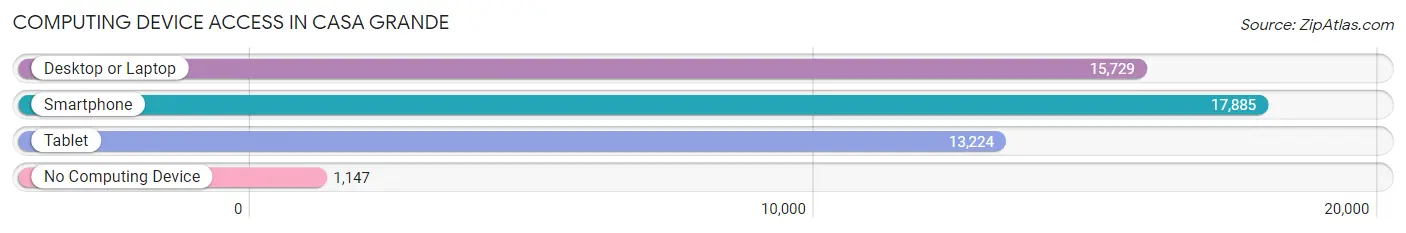
| Device Type | # Households | % Households |
| Desktop or Laptop | 15,729 | 78.5% |
| Smartphone | 17,885 | 89.3% |
| Tablet | 13,224 | 66.0% |
| No Computing Device | 1,147 | 5.7% |
| Total | 20,027 | 100.0% |
Internet Access in Casa Grande
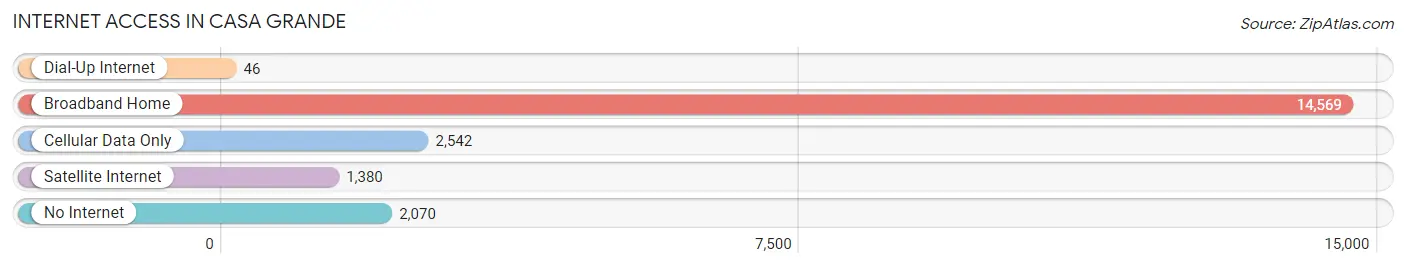
| Internet Type | # Households | % Households |
| Dial-Up Internet | 46 | 0.2% |
| Broadband Home | 14,569 | 72.8% |
| Cellular Data Only | 2,542 | 12.7% |
| Satellite Internet | 1,380 | 6.9% |
| No Internet | 2,070 | 10.3% |
| Total | 20,027 | 100.0% |
Casa Grande Summary
Casa Grande is a city located in Pinal County, Arizona, United States. It is situated between Phoenix and Tucson and is part of the Phoenix metropolitan area. The city is the largest in the county and is home to a population of over 50,000 people.
History
The area that is now Casa Grande was first inhabited by the Hohokam people, who were a Native American tribe that lived in the area from around 300 BC to 1450 AD. The Hohokam were known for their irrigation systems and their extensive network of canals. The area was later settled by Spanish missionaries in the late 1700s. The city was officially founded in 1879 and was named after the nearby Casa Grande Ruins National Monument.
Geography
Casa Grande is located in the Sonoran Desert of Arizona. It is situated between Phoenix and Tucson and is part of the Phoenix metropolitan area. The city is located at an elevation of 1,085 feet (331 m) and has an area of 37.2 square miles (96.2 km2). The city is bordered by the Gila River to the east and the Santa Cruz River to the west.
Economy
Casa Grande’s economy is largely based on agriculture and manufacturing. The city is home to several large agricultural companies, including the Arizona Cotton Growers Association, the Arizona Citrus Growers Association, and the Arizona Dairymen’s Association. The city is also home to several manufacturing companies, including Intel, Honeywell, and Boeing.
Demographics
As of the 2010 census, Casa Grande had a population of 48,571. The racial makeup of the city was 73.2% White, 1.3% African American, 0.9% Native American, 0.7% Asian, 0.1% Pacific Islander, 20.2% from other races, and 3.6% from two or more races. Hispanic or Latino of any race were 44.2% of the population.
The median income for a household in the city was $37,845, and the median income for a family was $45,919. The per capita income for the city was $19,845. About 17.2% of families and 21.7% of the population were below the poverty line, including 30.3% of those under age 18 and 11.2% of those age 65 or over.
Casa Grande is a diverse city with a rich history and a vibrant economy. The city is home to a variety of industries, including agriculture, manufacturing, and technology. The city is also home to a diverse population, with a variety of ethnic backgrounds and cultures. Casa Grande is an important part of the Phoenix metropolitan area and is a great place to live and work.
Common Questions
What is Per Capita Income in Casa Grande?
Per Capita income in Casa Grande is $33,262.
What is the Median Family Income in Casa Grande?
Median Family Income in Casa Grande is $69,680.
What is the Median Household income in Casa Grande?
Median Household Income in Casa Grande is $64,535.
What is Income or Wage Gap in Casa Grande?
Income or Wage Gap in Casa Grande is 23.0%.
Women in Casa Grande earn 77.0 cents for every dollar earned by a man.
What is Family Income Deficit in Casa Grande?
Family Income Deficit in Casa Grande is $10,146.
Families that are below poverty line in Casa Grande earn $10,146 less on average than the poverty threshold level.
What is Inequality or Gini Index in Casa Grande?
Inequality or Gini Index in Casa Grande is 0.47.
What is the Total Population of Casa Grande?
Total Population of Casa Grande is 55,186.
What is the Total Male Population of Casa Grande?
Total Male Population of Casa Grande is 28,229.
What is the Total Female Population of Casa Grande?
Total Female Population of Casa Grande is 26,957.
What is the Ratio of Males per 100 Females in Casa Grande?
There are 104.72 Males per 100 Females in Casa Grande.
What is the Ratio of Females per 100 Males in Casa Grande?
There are 95.49 Females per 100 Males in Casa Grande.
What is the Median Population Age in Casa Grande?
Median Population Age in Casa Grande is 35.9 Years.
What is the Average Family Size in Casa Grande
Average Family Size in Casa Grande is 3.2 People.
What is the Average Household Size in Casa Grande
Average Household Size in Casa Grande is 2.7 People.
How Large is the Labor Force in Casa Grande?
There are 24,754 People in the Labor Forcein in Casa Grande.
What is the Percentage of People in the Labor Force in Casa Grande?
57.9% of People are in the Labor Force in Casa Grande.
What is the Unemployment Rate in Casa Grande?
Unemployment Rate in Casa Grande is 6.8%.