Tuba City, AZ Map & Demographics
Tuba City Map
Tuba City Overview
$22,240
PER CAPITA INCOME
$69,093
AVG FAMILY INCOME
$62,136
AVG HOUSEHOLD INCOME
0.7%
WAGE / INCOME GAP [ % ]
99.3¢/ $1
WAGE / INCOME GAP [ $ ]
$13,960
FAMILY INCOME DEFICIT
0.42
INEQUALITY / GINI INDEX
8,372
TOTAL POPULATION
3,772
MALE POPULATION
4,600
FEMALE POPULATION
82.00
MALES / 100 FEMALES
121.95
FEMALES / 100 MALES
34.2
MEDIAN AGE
4.3
AVG FAMILY SIZE
3.7
AVG HOUSEHOLD SIZE
3,228
LABOR FORCE [ PEOPLE ]
51.6%
PERCENT IN LABOR FORCE
10.4%
UNEMPLOYMENT RATE
Tuba City Zip Codes
Tuba City Area Codes
Income in Tuba City
Income Overview in Tuba City
Per Capita Income in Tuba City is $22,240, while median incomes of families and households are $69,093 and $62,136 respectively.
| Characteristic | Number | Measure |
| Per Capita Income | 8,372 | $22,240 |
| Median Family Income | 1,707 | $69,093 |
| Mean Family Income | 1,707 | $84,200 |
| Median Household Income | 2,273 | $62,136 |
| Mean Household Income | 2,273 | $78,446 |
| Income Deficit | 1,707 | $13,960 |
| Wage / Income Gap (%) | 8,372 | 0.73% |
| Wage / Income Gap ($) | 8,372 | 99.27¢ per $1 |
| Gini / Inequality Index | 8,372 | 0.42 |
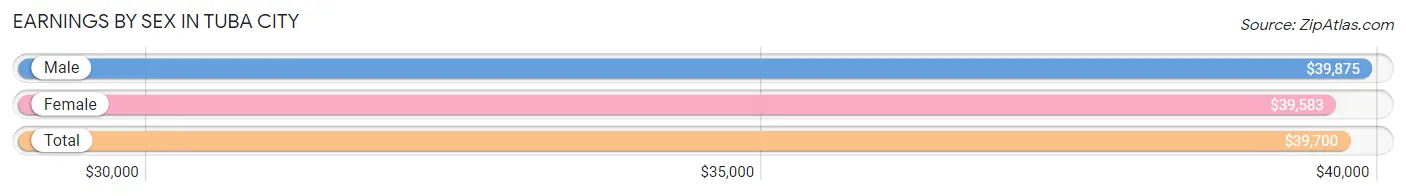
Earnings by Sex in Tuba City
Average Earnings in Tuba City are $39,700, $39,875 for men and $39,583 for women, a difference of 0.7%.
| Sex | Number | Average Earnings |
| Male | 1,489 (41.9%) | $39,875 |
| Female | 2,061 (58.1%) | $39,583 |
| Total | 3,550 (100.0%) | $39,700 |
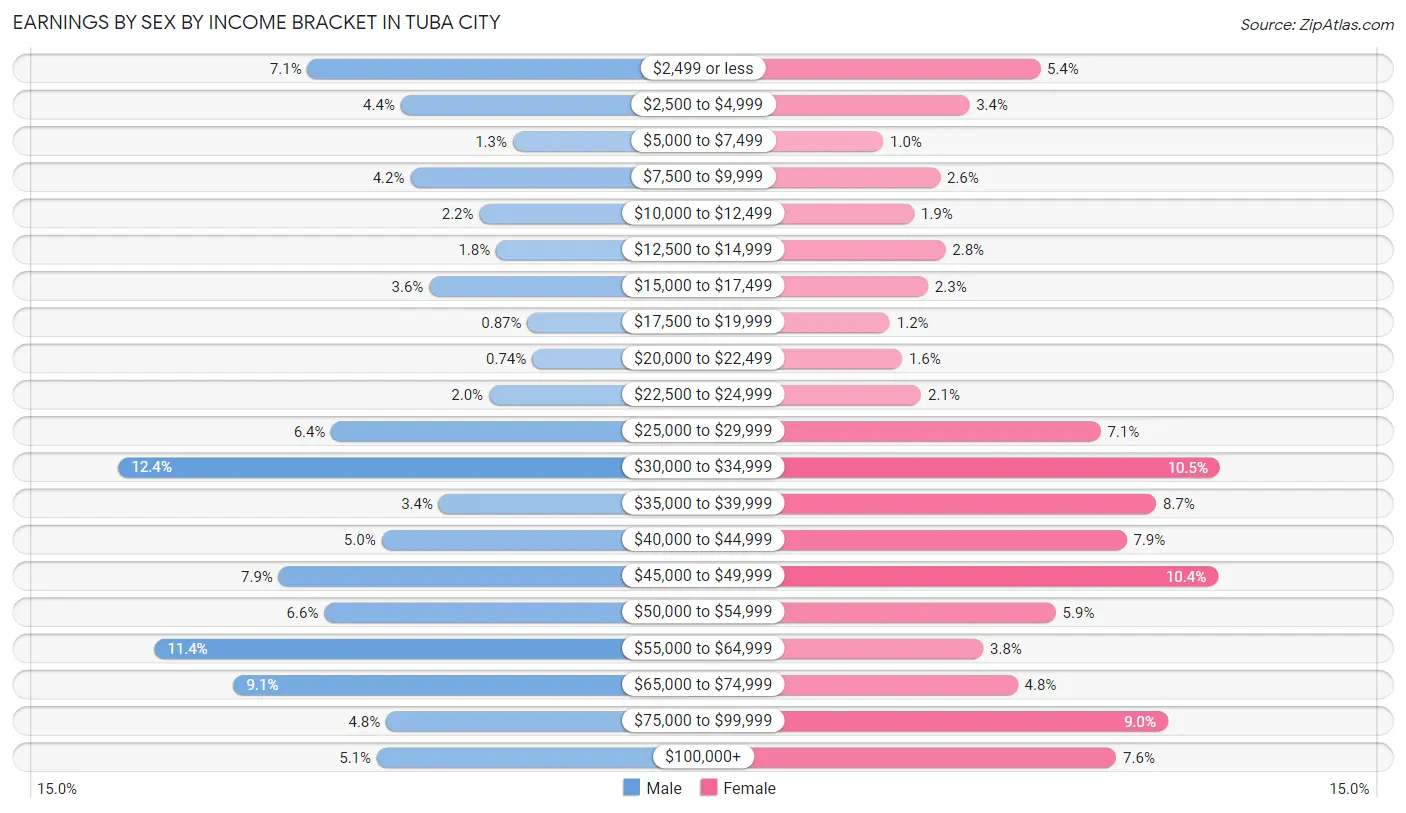
Earnings by Sex by Income Bracket in Tuba City
The most common earnings brackets in Tuba City are $30,000 to $34,999 for men (184 | 12.4%) and $30,000 to $34,999 for women (216 | 10.5%).
| Income | Male | Female |
| $2,499 or less | 105 (7.0%) | 112 (5.4%) |
| $2,500 to $4,999 | 66 (4.4%) | 71 (3.4%) |
| $5,000 to $7,499 | 19 (1.3%) | 21 (1.0%) |
| $7,500 to $9,999 | 62 (4.2%) | 54 (2.6%) |
| $10,000 to $12,499 | 33 (2.2%) | 39 (1.9%) |
| $12,500 to $14,999 | 26 (1.8%) | 57 (2.8%) |
| $15,000 to $17,499 | 54 (3.6%) | 47 (2.3%) |
| $17,500 to $19,999 | 13 (0.9%) | 25 (1.2%) |
| $20,000 to $22,499 | 11 (0.7%) | 32 (1.5%) |
| $22,500 to $24,999 | 29 (1.9%) | 43 (2.1%) |
| $25,000 to $29,999 | 95 (6.4%) | 147 (7.1%) |
| $30,000 to $34,999 | 184 (12.4%) | 216 (10.5%) |
| $35,000 to $39,999 | 50 (3.4%) | 179 (8.7%) |
| $40,000 to $44,999 | 74 (5.0%) | 162 (7.9%) |
| $45,000 to $49,999 | 117 (7.9%) | 215 (10.4%) |
| $50,000 to $54,999 | 98 (6.6%) | 121 (5.9%) |
| $55,000 to $64,999 | 169 (11.4%) | 79 (3.8%) |
| $65,000 to $74,999 | 136 (9.1%) | 99 (4.8%) |
| $75,000 to $99,999 | 72 (4.8%) | 186 (9.0%) |
| $100,000+ | 76 (5.1%) | 156 (7.6%) |
| Total | 1,489 (100.0%) | 2,061 (100.0%) |
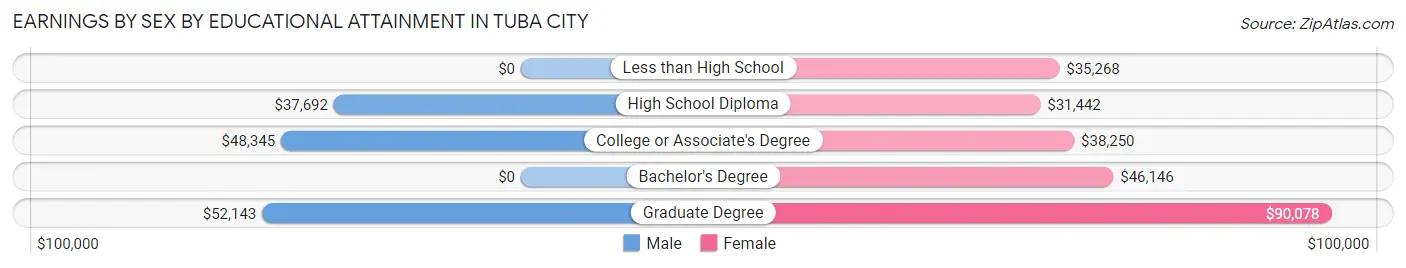
Earnings by Sex by Educational Attainment in Tuba City
Average earnings in Tuba City are $41,838 for men and $42,375 for women, a difference of 1.3%. Men with an educational attainment of graduate degree enjoy the highest average annual earnings of $52,143, while those with high school diploma education earn the least with $37,692. Women with an educational attainment of graduate degree earn the most with the average annual earnings of $90,078, while those with high school diploma education have the smallest earnings of $31,442.
| Educational Attainment | Male Income | Female Income |
| Less than High School | - | - |
| High School Diploma | $37,692 | $31,442 |
| College or Associate's Degree | $48,345 | $38,250 |
| Bachelor's Degree | - | - |
| Graduate Degree | $52,143 | $90,078 |
| Total | $41,838 | $42,375 |
Family Income in Tuba City
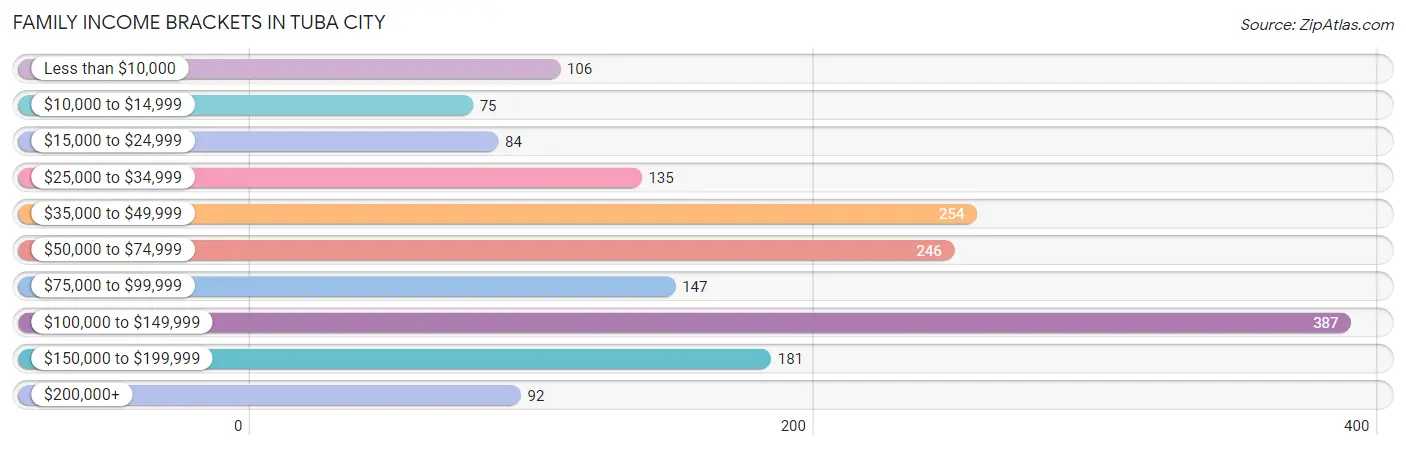
Family Income Brackets in Tuba City
According to the Tuba City family income data, there are 387 families falling into the $100,000 to $149,999 income range, which is the most common income bracket and makes up 22.7% of all families. Conversely, the $10,000 to $14,999 income bracket is the least frequent group with only 75 families (4.4%) belonging to this category.
| Income Bracket | # Families | % Families |
| Less than $10,000 | 106 | 6.2% |
| $10,000 to $14,999 | 75 | 4.4% |
| $15,000 to $24,999 | 84 | 4.9% |
| $25,000 to $34,999 | 135 | 7.9% |
| $35,000 to $49,999 | 254 | 14.9% |
| $50,000 to $74,999 | 246 | 14.4% |
| $75,000 to $99,999 | 147 | 8.6% |
| $100,000 to $149,999 | 387 | 22.7% |
| $150,000 to $199,999 | 181 | 10.6% |
| $200,000+ | 92 | 5.4% |
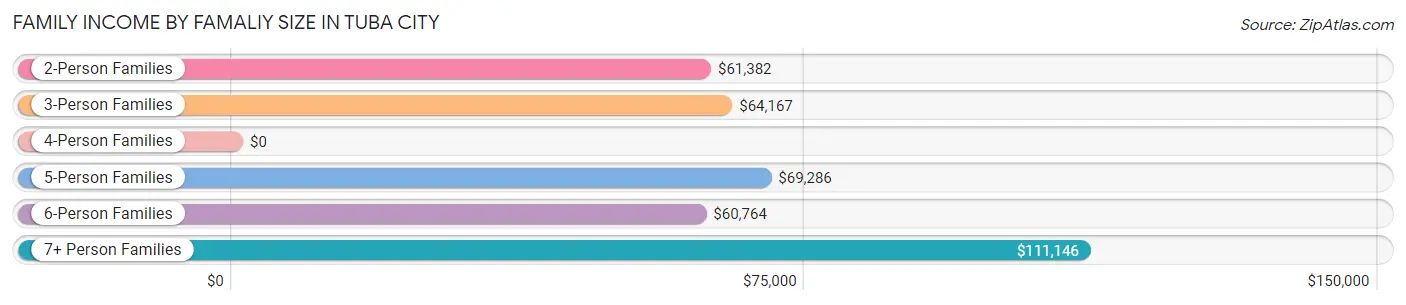
Family Income by Famaliy Size in Tuba City
7+ person families (201 | 11.8%) account for the highest median family income in Tuba City with $111,146 per family, while 2-person families (353 | 20.7%) have the highest median income of $30,691 per family member.
| Income Bracket | # Families | Median Income |
| 2-Person Families | 353 (20.7%) | $61,382 |
| 3-Person Families | 482 (28.2%) | $64,167 |
| 4-Person Families | 247 (14.5%) | $0 |
| 5-Person Families | 224 (13.1%) | $69,286 |
| 6-Person Families | 200 (11.7%) | $60,764 |
| 7+ Person Families | 201 (11.8%) | $111,146 |
| Total | 1,707 (100.0%) | $69,093 |
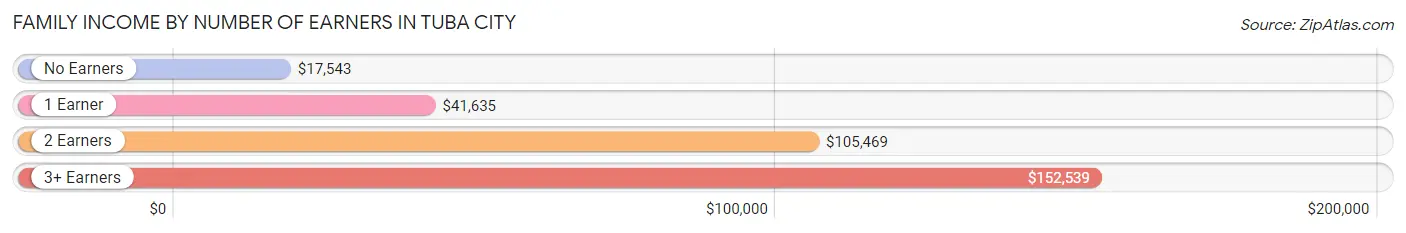
Family Income by Number of Earners in Tuba City
The median family income in Tuba City is $69,093, with families comprising 3+ earners (279) having the highest median family income of $152,539, while families with no earners (213) have the lowest median family income of $17,543, accounting for 16.3% and 12.5% of families, respectively.
| Number of Earners | # Families | Median Income |
| No Earners | 213 (12.5%) | $17,543 |
| 1 Earner | 612 (35.8%) | $41,635 |
| 2 Earners | 603 (35.3%) | $105,469 |
| 3+ Earners | 279 (16.3%) | $152,539 |
| Total | 1,707 (100.0%) | $69,093 |
Household Income in Tuba City
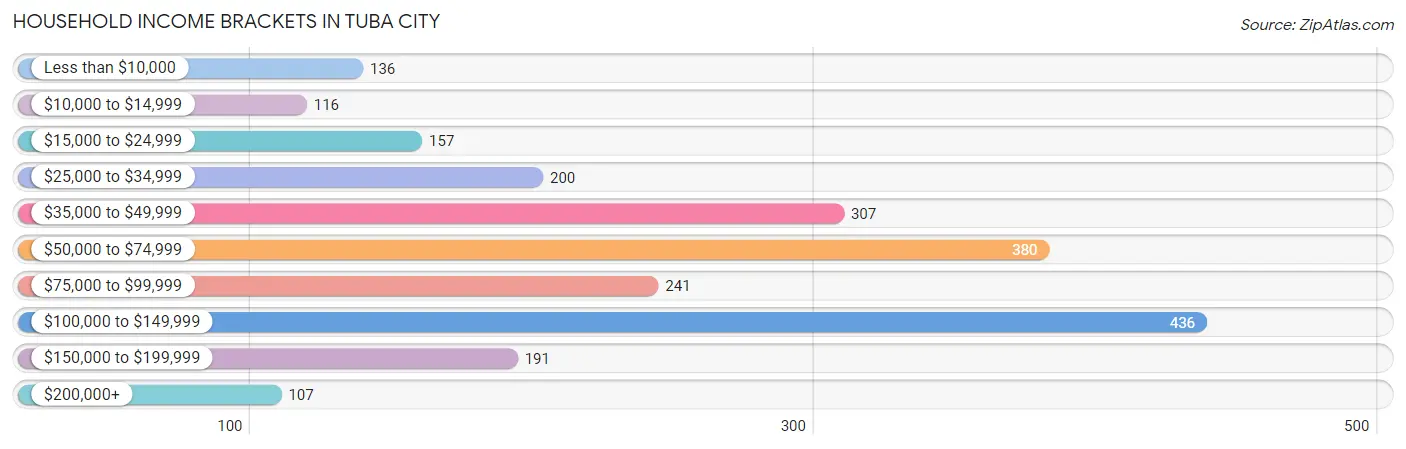
Household Income Brackets in Tuba City
With 436 households falling in the category, the $100,000 to $149,999 income range is the most frequent in Tuba City, accounting for 19.2% of all households. In contrast, only 107 households (4.7%) fall into the $200,000+ income bracket, making it the least populous group.
| Income Bracket | # Households | % Households |
| Less than $10,000 | 136 | 6.0% |
| $10,000 to $14,999 | 116 | 5.1% |
| $15,000 to $24,999 | 157 | 6.9% |
| $25,000 to $34,999 | 200 | 8.8% |
| $35,000 to $49,999 | 307 | 13.5% |
| $50,000 to $74,999 | 380 | 16.7% |
| $75,000 to $99,999 | 241 | 10.6% |
| $100,000 to $149,999 | 436 | 19.2% |
| $150,000 to $199,999 | 191 | 8.4% |
| $200,000+ | 107 | 4.7% |
Household Income by Householder Age in Tuba City
The median household income in Tuba City is $62,136, with the highest median household income of $83,036 found in the 45 to 64 years age bracket for the primary householder. A total of 1,062 households (46.7%) fall into this category. Meanwhile, the 15 to 24 years age bracket for the primary householder has the lowest median household income of $0, with 14 households (0.6%) in this group.
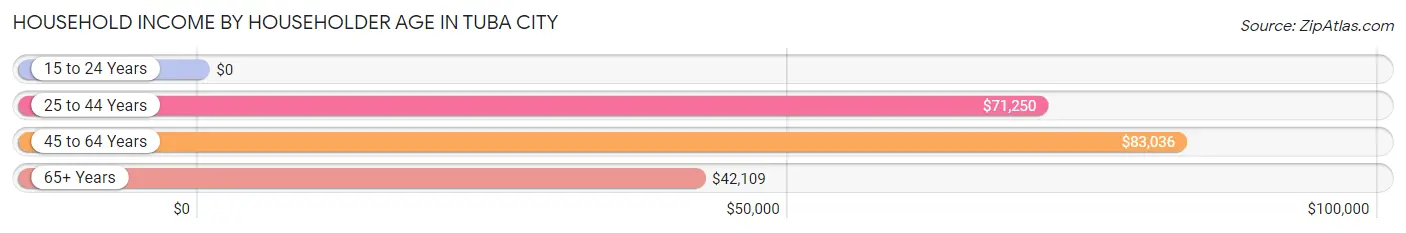
| Income Bracket | # Households | Median Income |
| 15 to 24 Years | 14 (0.6%) | $0 |
| 25 to 44 Years | 595 (26.2%) | $71,250 |
| 45 to 64 Years | 1,062 (46.7%) | $83,036 |
| 65+ Years | 602 (26.5%) | $42,109 |
| Total | 2,273 (100.0%) | $62,136 |
Poverty in Tuba City
Income Below Poverty by Sex and Age in Tuba City
With 23.4% poverty level for males and 22.2% for females among the residents of Tuba City, under 5 year old males and 12 to 14 year old females are the most vulnerable to poverty, with 86 males (37.9%) and 167 females (51.1%) in their respective age groups living below the poverty level.
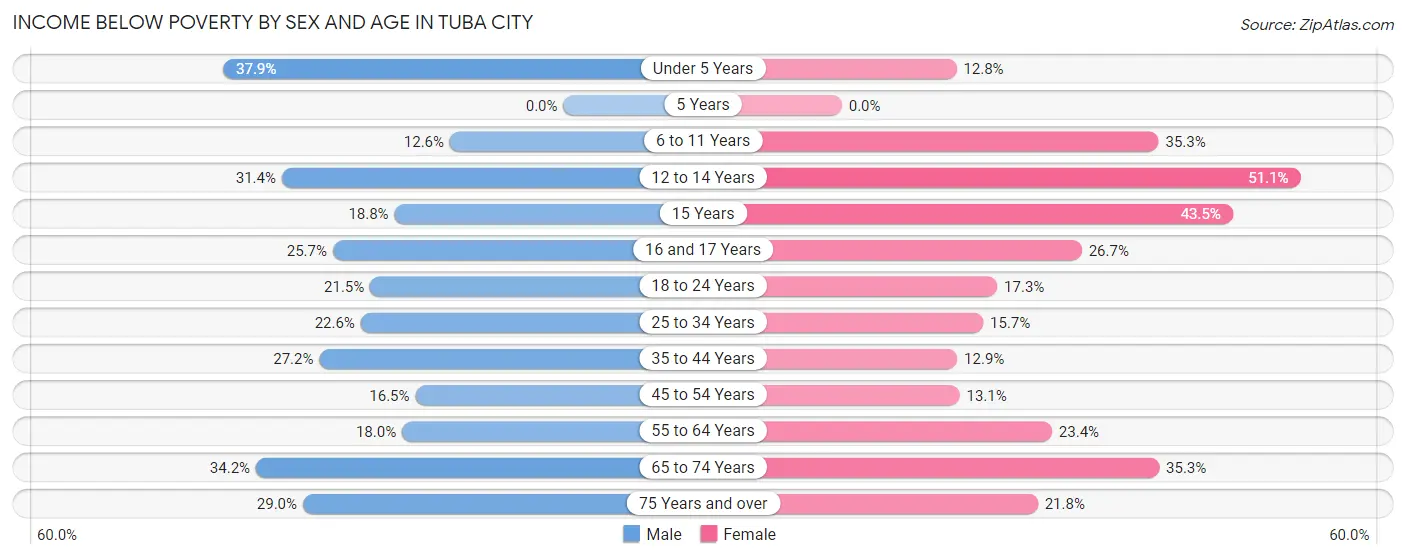
| Age Bracket | Male | Female |
| Under 5 Years | 86 (37.9%) | 35 (12.8%) |
| 5 Years | 0 (0.0%) | 0 (0.0%) |
| 6 to 11 Years | 45 (12.6%) | 121 (35.3%) |
| 12 to 14 Years | 90 (31.4%) | 167 (51.1%) |
| 15 Years | 19 (18.8%) | 37 (43.5%) |
| 16 and 17 Years | 19 (25.7%) | 31 (26.7%) |
| 18 to 24 Years | 105 (21.5%) | 91 (17.3%) |
| 25 to 34 Years | 109 (22.6%) | 91 (15.7%) |
| 35 to 44 Years | 137 (27.2%) | 83 (12.9%) |
| 45 to 54 Years | 59 (16.5%) | 73 (13.1%) |
| 55 to 64 Years | 76 (18.0%) | 128 (23.4%) |
| 65 to 74 Years | 88 (34.2%) | 129 (35.3%) |
| 75 Years and over | 47 (29.0%) | 36 (21.8%) |
| Total | 880 (23.4%) | 1,022 (22.2%) |
Income Above Poverty by Sex and Age in Tuba City
According to the poverty statistics in Tuba City, males aged 5 years and females aged 5 years are the age groups that are most secure financially, with 100.0% of males and 100.0% of females in these age groups living above the poverty line.
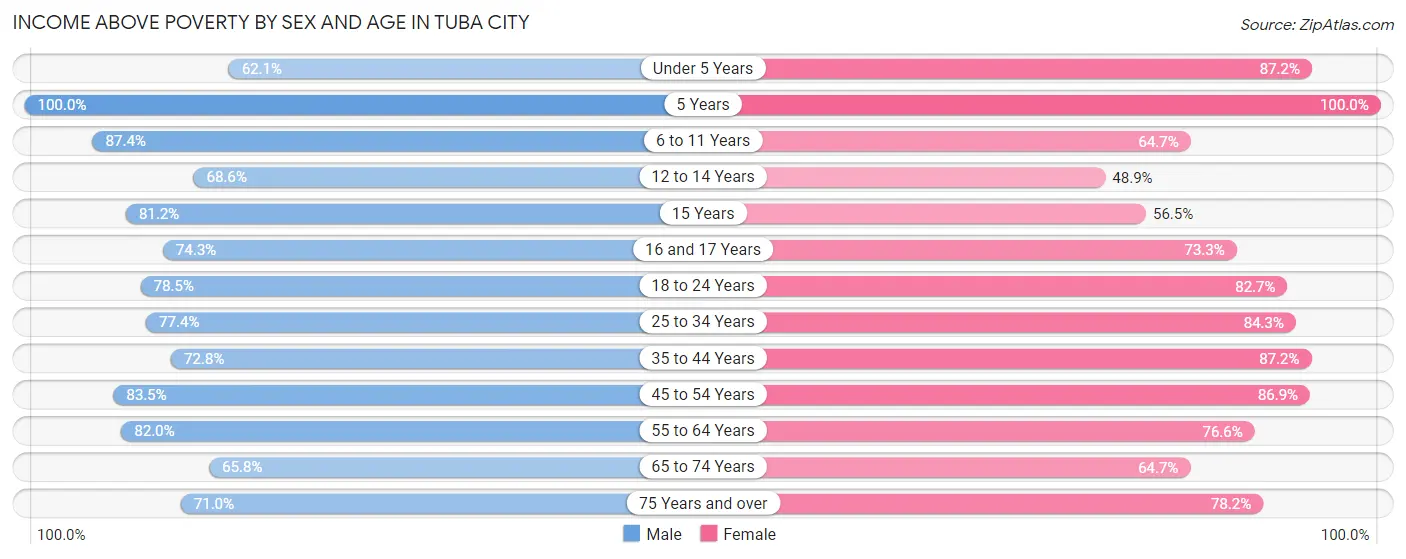
| Age Bracket | Male | Female |
| Under 5 Years | 141 (62.1%) | 239 (87.2%) |
| 5 Years | 37 (100.0%) | 67 (100.0%) |
| 6 to 11 Years | 311 (87.4%) | 222 (64.7%) |
| 12 to 14 Years | 197 (68.6%) | 160 (48.9%) |
| 15 Years | 82 (81.2%) | 48 (56.5%) |
| 16 and 17 Years | 55 (74.3%) | 85 (73.3%) |
| 18 to 24 Years | 383 (78.5%) | 435 (82.7%) |
| 25 to 34 Years | 374 (77.4%) | 487 (84.3%) |
| 35 to 44 Years | 367 (72.8%) | 563 (87.2%) |
| 45 to 54 Years | 299 (83.5%) | 484 (86.9%) |
| 55 to 64 Years | 347 (82.0%) | 419 (76.6%) |
| 65 to 74 Years | 169 (65.8%) | 236 (64.7%) |
| 75 Years and over | 115 (71.0%) | 129 (78.2%) |
| Total | 2,877 (76.6%) | 3,574 (77.8%) |
Income Below Poverty Among Married-Couple Families in Tuba City
The poverty statistics for married-couple families in Tuba City show that 12.4% or 99 of the total 797 families live below the poverty line. Families with 5 or more children have the highest poverty rate of 64.1%, comprising of 41 families. On the other hand, families with no children have the lowest poverty rate of 2.9%, which includes 10 families.
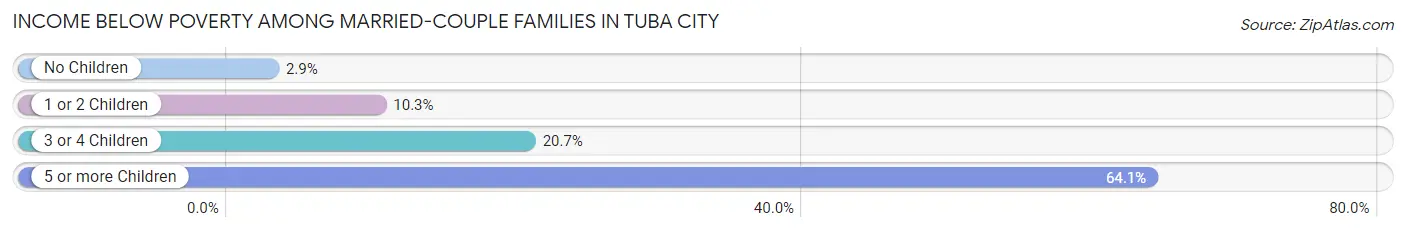
| Children | Above Poverty | Below Poverty |
| No Children | 341 (97.2%) | 10 (2.9%) |
| 1 or 2 Children | 269 (89.7%) | 31 (10.3%) |
| 3 or 4 Children | 65 (79.3%) | 17 (20.7%) |
| 5 or more Children | 23 (35.9%) | 41 (64.1%) |
| Total | 698 (87.6%) | 99 (12.4%) |
Income Below Poverty Among Single-Parent Households in Tuba City
According to the poverty data in Tuba City, 41.1% or 60 single-father households and 25.3% or 193 single-mother households are living below the poverty line. Among single-father households, those with no children have the highest poverty rate, with 30 households (47.6%) experiencing poverty. Likewise, among single-mother households, those with 5 or more children have the highest poverty rate, with 36 households (53.7%) falling below the poverty line.
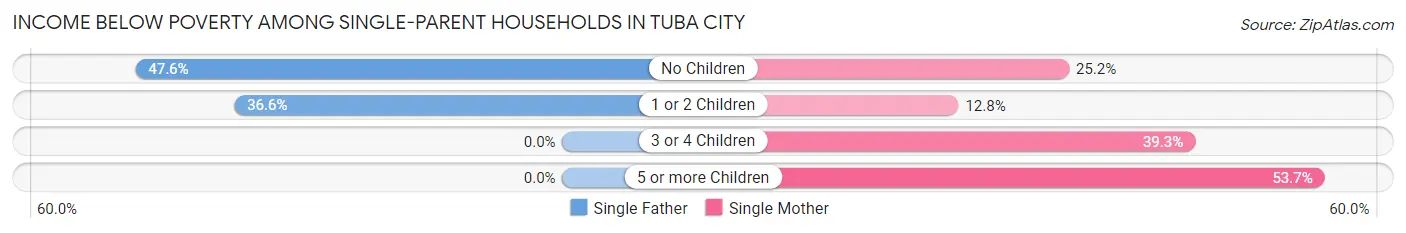
| Children | Single Father | Single Mother |
| No Children | 30 (47.6%) | 65 (25.2%) |
| 1 or 2 Children | 30 (36.6%) | 39 (12.8%) |
| 3 or 4 Children | 0 (0.0%) | 53 (39.3%) |
| 5 or more Children | 0 (0.0%) | 36 (53.7%) |
| Total | 60 (41.1%) | 193 (25.3%) |
Income Below Poverty Among Married-Couple vs Single-Parent Households in Tuba City
The poverty data for Tuba City shows that 99 of the married-couple family households (12.4%) and 253 of the single-parent households (27.8%) are living below the poverty level. Within the married-couple family households, those with 5 or more children have the highest poverty rate, with 41 households (64.1%) falling below the poverty line. Among the single-parent households, those with 5 or more children have the highest poverty rate, with 36 household (53.7%) living below poverty.
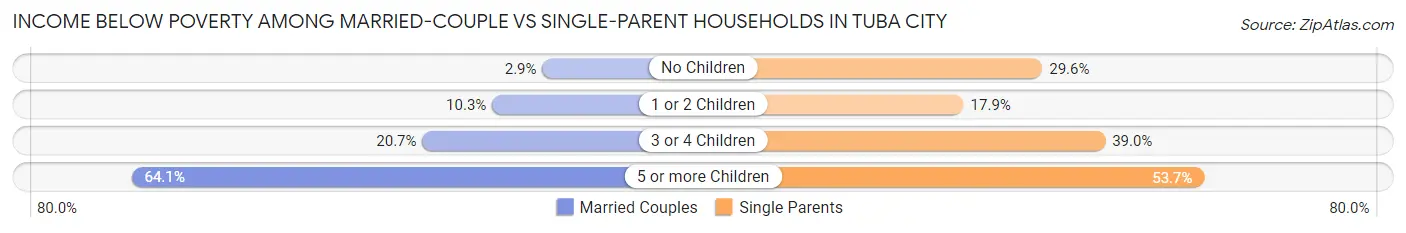
| Children | Married-Couple Families | Single-Parent Households |
| No Children | 10 (2.9%) | 95 (29.6%) |
| 1 or 2 Children | 31 (10.3%) | 69 (17.9%) |
| 3 or 4 Children | 17 (20.7%) | 53 (39.0%) |
| 5 or more Children | 41 (64.1%) | 36 (53.7%) |
| Total | 99 (12.4%) | 253 (27.8%) |
Race in Tuba City
The most populous races in Tuba City are Native / Alaskan (7,732 | 92.4%), Hispanic or Latino (475 | 5.7%), and White / Caucasian (427 | 5.1%).
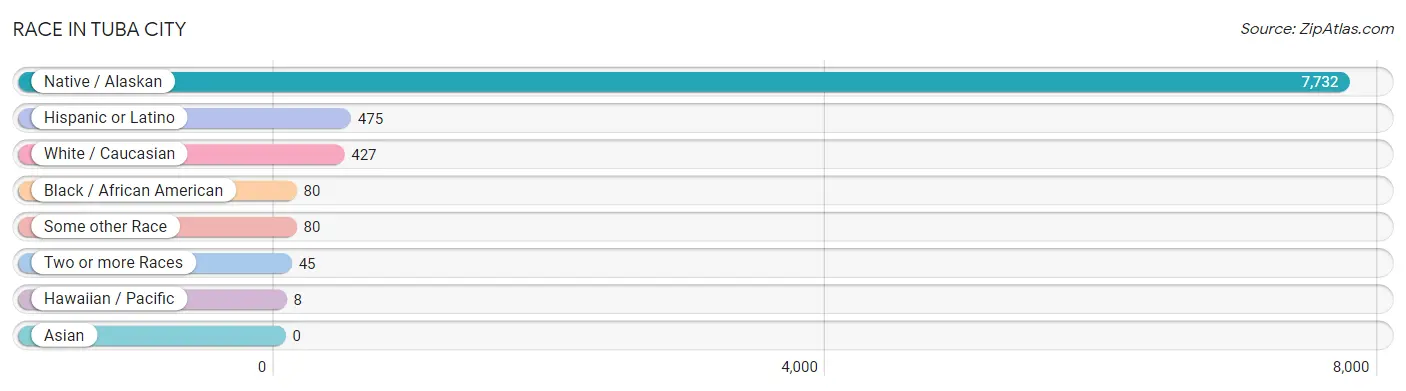
| Race | # Population | % Population |
| Asian | 0 | 0.0% |
| Black / African American | 80 | 1.0% |
| Hawaiian / Pacific | 8 | 0.1% |
| Hispanic or Latino | 475 | 5.7% |
| Native / Alaskan | 7,732 | 92.4% |
| White / Caucasian | 427 | 5.1% |
| Two or more Races | 45 | 0.5% |
| Some other Race | 80 | 1.0% |
| Total | 8,372 | 100.0% |
Ancestry in Tuba City
The most populous ancestries reported in Tuba City are Navajo (7,058 | 84.3%), Hopi (471 | 5.6%), Mexican (359 | 4.3%), Spanish (80 | 1.0%), and Pima (69 | 0.8%), together accounting for 96.0% of all Tuba City residents.
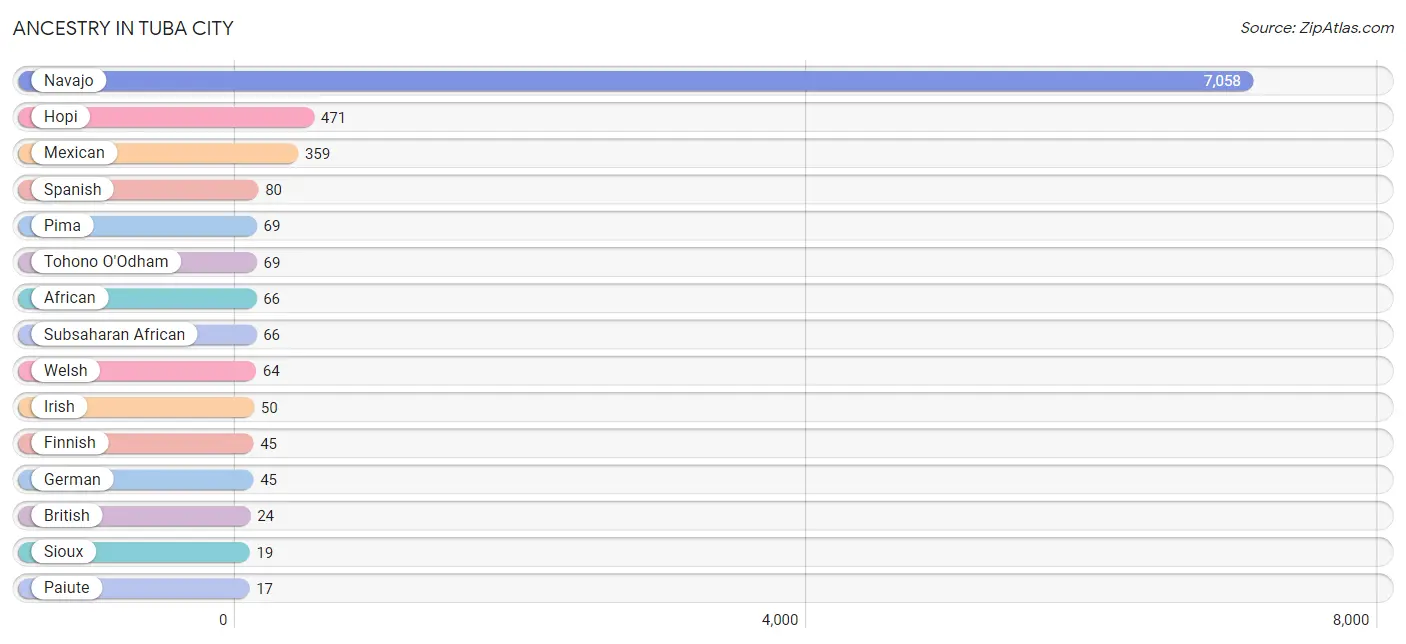
| Ancestry | # Population | % Population |
| African | 66 | 0.8% |
| British | 24 | 0.3% |
| Canadian | 14 | 0.2% |
| English | 10 | 0.1% |
| Finnish | 45 | 0.5% |
| German | 45 | 0.5% |
| Hopi | 471 | 5.6% |
| Irish | 50 | 0.6% |
| Mexican | 359 | 4.3% |
| Mexican American Indian | 13 | 0.2% |
| Navajo | 7,058 | 84.3% |
| Paiute | 17 | 0.2% |
| Pima | 69 | 0.8% |
| Pueblo | 1 | 0.0% |
| Puerto Rican | 17 | 0.2% |
| Samoan | 8 | 0.1% |
| Scotch-Irish | 9 | 0.1% |
| Scottish | 5 | 0.1% |
| Sioux | 19 | 0.2% |
| Spanish | 80 | 1.0% |
| Subsaharan African | 66 | 0.8% |
| Swedish | 12 | 0.1% |
| Tohono O'Odham | 69 | 0.8% |
| Welsh | 64 | 0.8% | View All 24 Rows |
Immigrants in Tuba City
The most numerous immigrant groups reported in Tuba City came from Africa (66 | 0.8%), Asia (31 | 0.4%), Iraq (31 | 0.4%), Western Asia (31 | 0.4%), and Central America (1 | 0.0%), together accounting for 1.9% of all Tuba City residents.
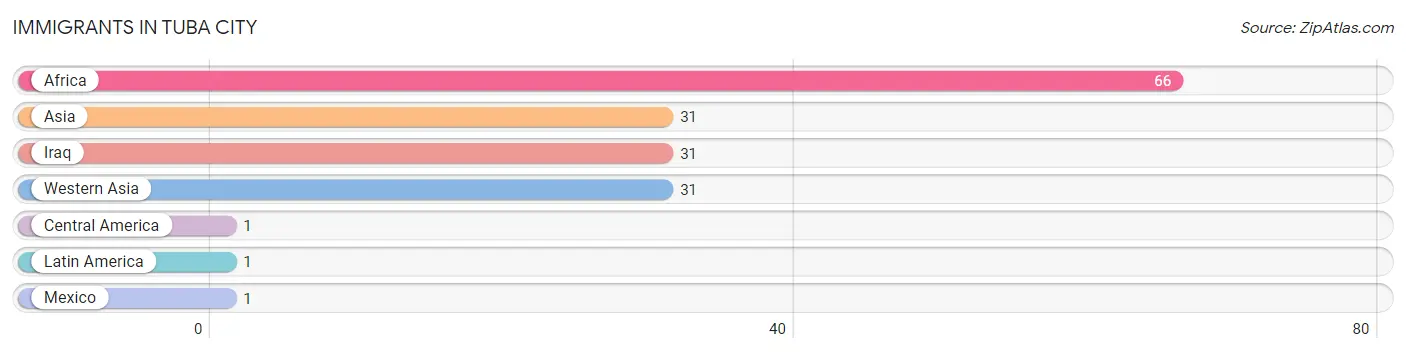
| Immigration Origin | # Population | % Population |
| Africa | 66 | 0.8% |
| Asia | 31 | 0.4% |
| Central America | 1 | 0.0% |
| Iraq | 31 | 0.4% |
| Latin America | 1 | 0.0% |
| Mexico | 1 | 0.0% |
| Western Asia | 31 | 0.4% | View All 7 Rows |
Sex and Age in Tuba City
Sex and Age in Tuba City
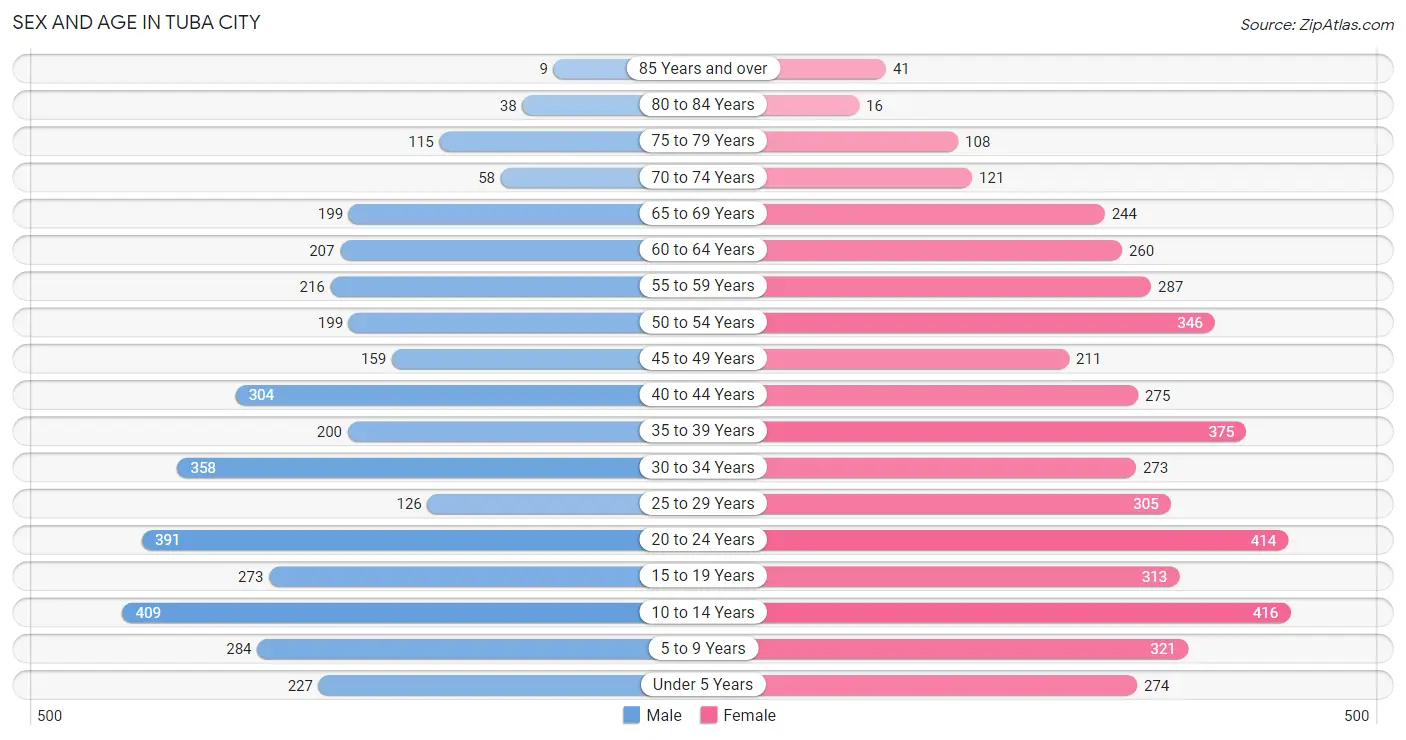
The most populous age groups in Tuba City are 10 to 14 Years (409 | 10.8%) for men and 10 to 14 Years (416 | 9.0%) for women.
| Age Bracket | Male | Female |
| Under 5 Years | 227 (6.0%) | 274 (6.0%) |
| 5 to 9 Years | 284 (7.5%) | 321 (7.0%) |
| 10 to 14 Years | 409 (10.8%) | 416 (9.0%) |
| 15 to 19 Years | 273 (7.2%) | 313 (6.8%) |
| 20 to 24 Years | 391 (10.4%) | 414 (9.0%) |
| 25 to 29 Years | 126 (3.3%) | 305 (6.6%) |
| 30 to 34 Years | 358 (9.5%) | 273 (5.9%) |
| 35 to 39 Years | 200 (5.3%) | 375 (8.2%) |
| 40 to 44 Years | 304 (8.1%) | 275 (6.0%) |
| 45 to 49 Years | 159 (4.2%) | 211 (4.6%) |
| 50 to 54 Years | 199 (5.3%) | 346 (7.5%) |
| 55 to 59 Years | 216 (5.7%) | 287 (6.2%) |
| 60 to 64 Years | 207 (5.5%) | 260 (5.7%) |
| 65 to 69 Years | 199 (5.3%) | 244 (5.3%) |
| 70 to 74 Years | 58 (1.5%) | 121 (2.6%) |
| 75 to 79 Years | 115 (3.0%) | 108 (2.4%) |
| 80 to 84 Years | 38 (1.0%) | 16 (0.4%) |
| 85 Years and over | 9 (0.2%) | 41 (0.9%) |
| Total | 3,772 (100.0%) | 4,600 (100.0%) |
Families and Households in Tuba City
Median Family Size in Tuba City
The median family size in Tuba City is 4.32 persons per family, with married-couple families (797 | 46.7%) accounting for the largest median family size of 4.53 persons per family. On the other hand, single male/father families (146 | 8.6%) represent the smallest median family size with 3.66 persons per family.
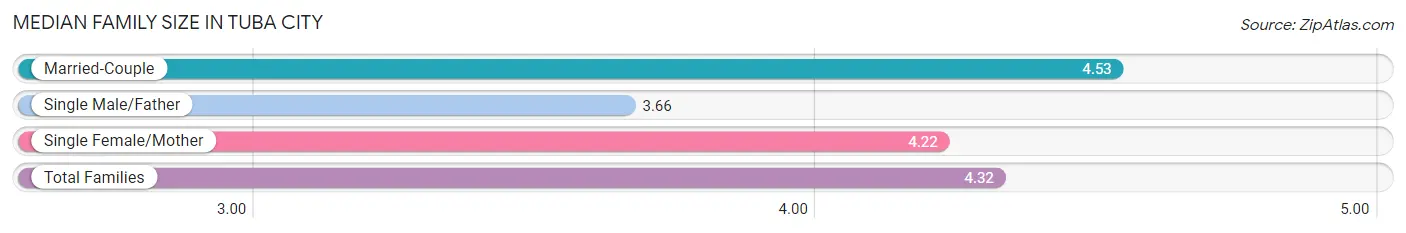
| Family Type | # Families | Family Size |
| Married-Couple | 797 (46.7%) | 4.53 |
| Single Male/Father | 146 (8.6%) | 3.66 |
| Single Female/Mother | 764 (44.8%) | 4.22 |
| Total Families | 1,707 (100.0%) | 4.32 |
Median Household Size in Tuba City
The median household size in Tuba City is 3.66 persons per household, with married-couple households (797 | 35.1%) accounting for the largest median household size of 4.56 persons per household. non-family households (566 | 24.9%) represent the smallest median household size with 1.20 persons per household.
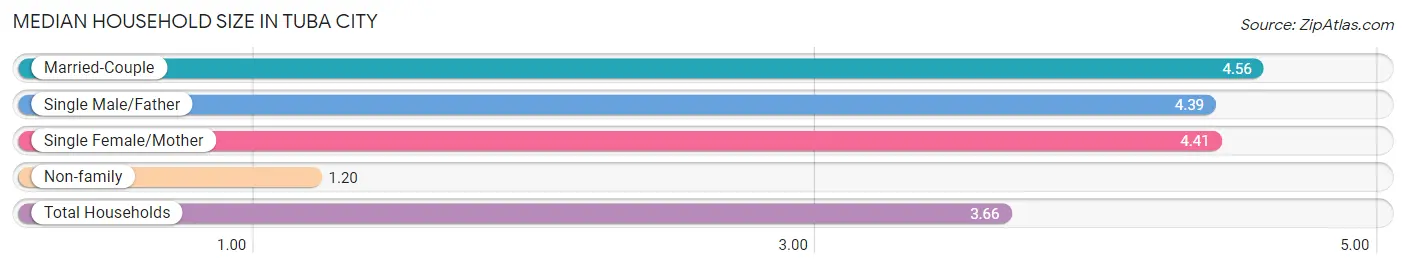
| Household Type | # Households | Household Size |
| Married-Couple | 797 (35.1%) | 4.56 |
| Single Male/Father | 146 (6.4%) | 4.39 |
| Single Female/Mother | 764 (33.6%) | 4.41 |
| Non-family | 566 (24.9%) | 1.20 |
| Total Households | 2,273 (100.0%) | 3.66 |
Household Size by Marriage Status in Tuba City
Out of a total of 2,273 households in Tuba City, 1,707 (75.1%) are family households, while 566 (24.9%) are nonfamily households. The most numerous type of family households are 3-person households, comprising 453, and the most common type of nonfamily households are 1-person households, comprising 444.
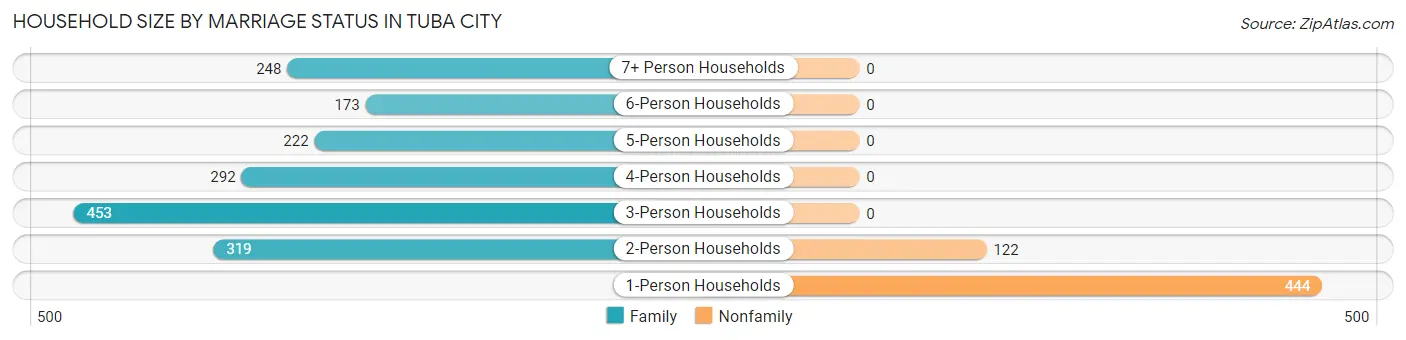
| Household Size | Family Households | Nonfamily Households |
| 1-Person Households | - | 444 (19.5%) |
| 2-Person Households | 319 (14.0%) | 122 (5.4%) |
| 3-Person Households | 453 (19.9%) | 0 (0.0%) |
| 4-Person Households | 292 (12.9%) | 0 (0.0%) |
| 5-Person Households | 222 (9.8%) | 0 (0.0%) |
| 6-Person Households | 173 (7.6%) | 0 (0.0%) |
| 7+ Person Households | 248 (10.9%) | 0 (0.0%) |
| Total | 1,707 (75.1%) | 566 (24.9%) |
Female Fertility in Tuba City
Fertility by Age in Tuba City
Average fertility rate in Tuba City is 68.0 births per 1,000 women. Women in the age bracket of 20 to 34 years have the highest fertility rate with 117.0 births per 1,000 women. Women in the age bracket of 20 to 34 years acount for 76.3% of all women with births.
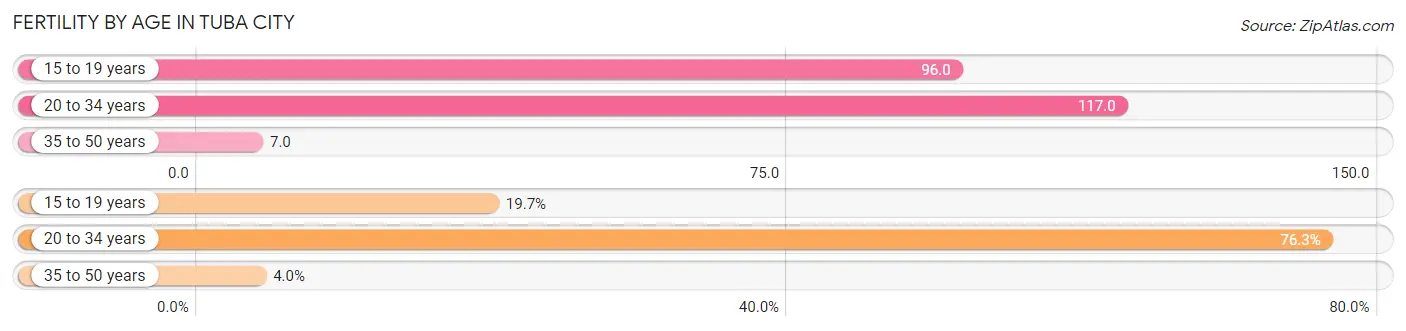
| Age Bracket | Women with Births | Births / 1,000 Women |
| 15 to 19 years | 30 (19.7%) | 96.0 |
| 20 to 34 years | 116 (76.3%) | 117.0 |
| 35 to 50 years | 6 (4.0%) | 7.0 |
| Total | 152 (100.0%) | 68.0 |
Fertility by Age by Marriage Status in Tuba City
10.5% of women with births (152) in Tuba City are married. The highest percentage of unmarried women with births falls into 15 to 19 years age bracket with 100.0% of them unmarried at the time of birth, while the lowest percentage of unmarried women with births belong to 35 to 50 years age bracket with 33.3% of them unmarried.
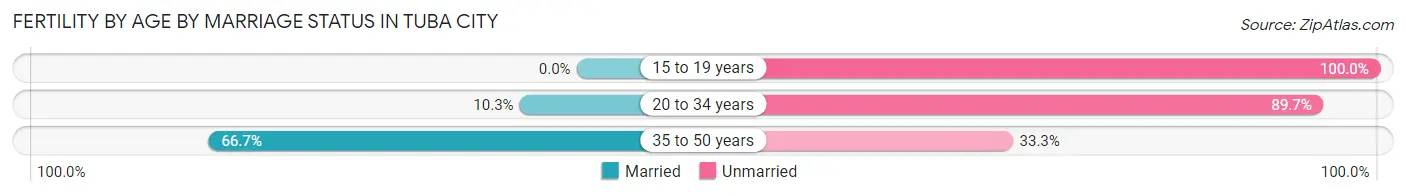
| Age Bracket | Married | Unmarried |
| 15 to 19 years | 0 (0.0%) | 30 (100.0%) |
| 20 to 34 years | 12 (10.3%) | 104 (89.7%) |
| 35 to 50 years | 4 (66.7%) | 2 (33.3%) |
| Total | 16 (10.5%) | 136 (89.5%) |
Fertility by Education in Tuba City
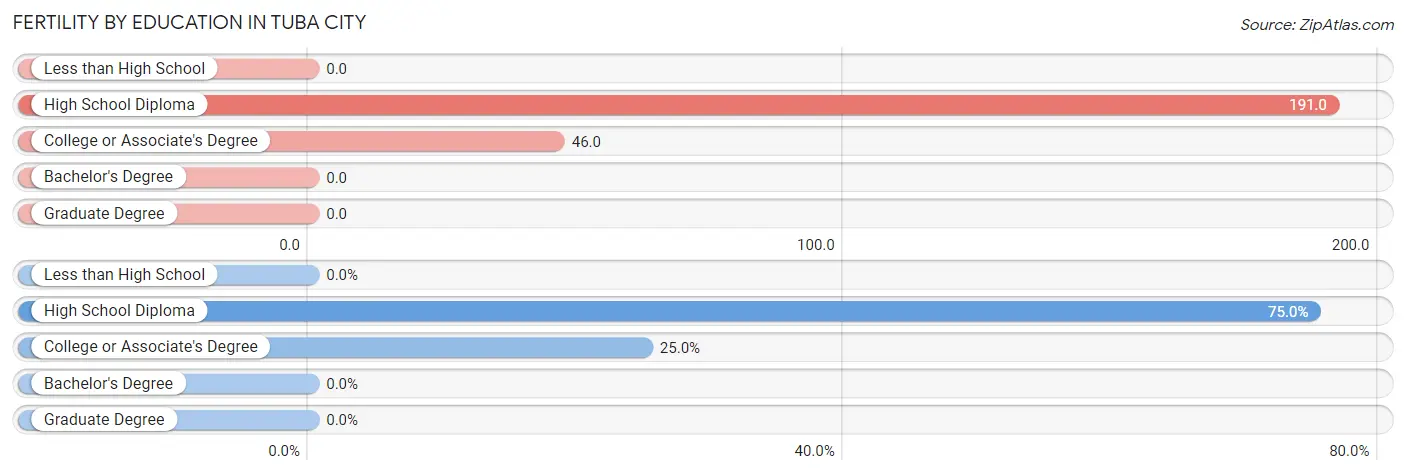
| Educational Attainment | Women with Births | Births / 1,000 Women |
| Less than High School | 0 (0.0%) | 0.0 |
| High School Diploma | 114 (75.0%) | 191.0 |
| College or Associate's Degree | 38 (25.0%) | 46.0 |
| Bachelor's Degree | 0 (0.0%) | 0.0 |
| Graduate Degree | 0 (0.0%) | 0.0 |
| Total | 152 (100.0%) | 68.0 |
Fertility by Education by Marriage Status in Tuba City
89.5% of women with births in Tuba City are unmarried. Women with the educational attainment of high school diploma are most likely to be married with 10.5% of them married at childbirth, while women with the educational attainment of high school diploma are least likely to be married with 89.5% of them unmarried at childbirth.
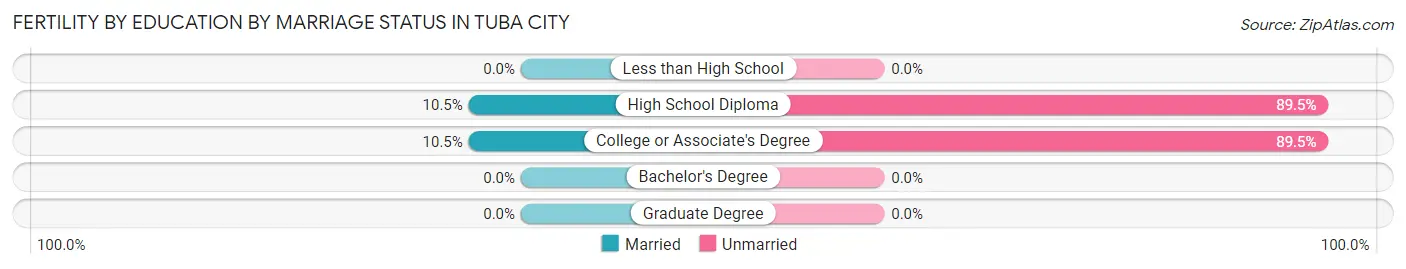
| Educational Attainment | Married | Unmarried |
| Less than High School | 0 (0.0%) | 0 (0.0%) |
| High School Diploma | 12 (10.5%) | 102 (89.5%) |
| College or Associate's Degree | 4 (10.5%) | 34 (89.5%) |
| Bachelor's Degree | 0 (0.0%) | 0 (0.0%) |
| Graduate Degree | 0 (0.0%) | 0 (0.0%) |
| Total | 16 (10.5%) | 136 (89.5%) |
Employment Characteristics in Tuba City
Employment by Class of Employer in Tuba City
Among the 2,893 employed individuals in Tuba City, local government employees (944 | 32.6%), private company employees (636 | 22.0%), and federal government employees (519 | 17.9%) make up the most common classes of employment.
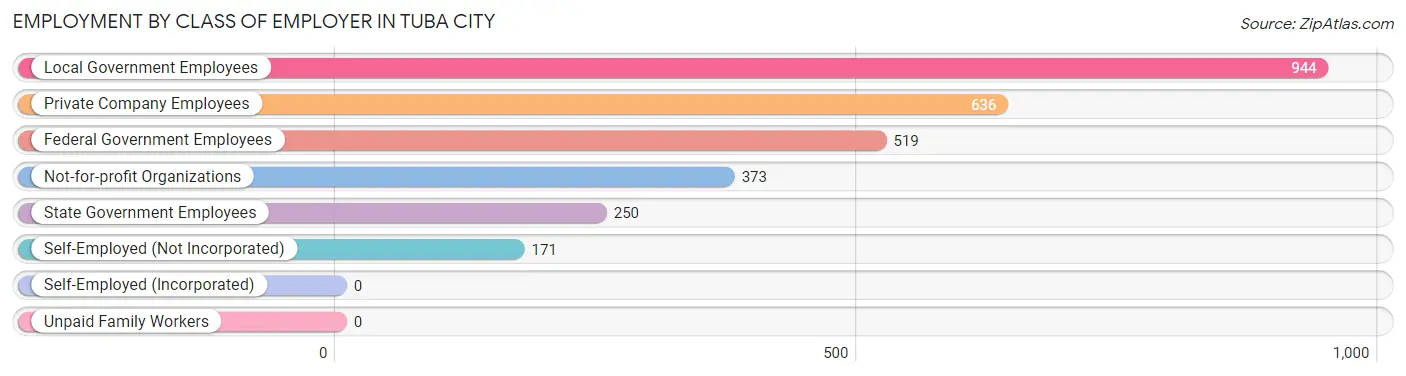
| Employer Class | # Employees | % Employees |
| Private Company Employees | 636 | 22.0% |
| Self-Employed (Incorporated) | 0 | 0.0% |
| Self-Employed (Not Incorporated) | 171 | 5.9% |
| Not-for-profit Organizations | 373 | 12.9% |
| Local Government Employees | 944 | 32.6% |
| State Government Employees | 250 | 8.6% |
| Federal Government Employees | 519 | 17.9% |
| Unpaid Family Workers | 0 | 0.0% |
| Total | 2,893 | 100.0% |
Employment Status by Age in Tuba City
According to the labor force statistics for Tuba City, out of the total population over 16 years of age (6,255), 51.6% or 3,228 individuals are in the labor force, with 10.4% or 336 of them unemployed. The age group with the highest labor force participation rate is 55 to 59 years, with 75.0% or 377 individuals in the labor force. Within the labor force, the 20 to 24 years age range has the highest percentage of unemployed individuals, with 34.6% or 133 of them being unemployed.
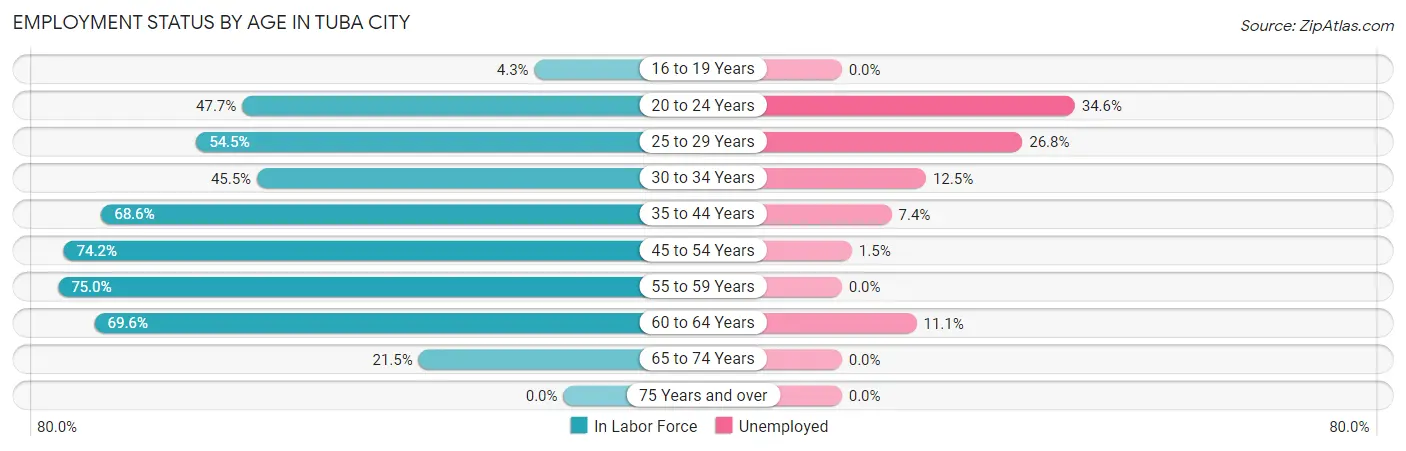
| Age Bracket | In Labor Force | Unemployed |
| 16 to 19 Years | 17 (4.3%) | 0 (0.0%) |
| 20 to 24 Years | 384 (47.7%) | 133 (34.6%) |
| 25 to 29 Years | 235 (54.5%) | 63 (26.8%) |
| 30 to 34 Years | 287 (45.5%) | 36 (12.5%) |
| 35 to 44 Years | 792 (68.6%) | 59 (7.4%) |
| 45 to 54 Years | 679 (74.2%) | 10 (1.5%) |
| 55 to 59 Years | 377 (75.0%) | 0 (0.0%) |
| 60 to 64 Years | 325 (69.6%) | 36 (11.1%) |
| 65 to 74 Years | 134 (21.5%) | 0 (0.0%) |
| 75 Years and over | 0 (0.0%) | 0 (0.0%) |
| Total | 3,228 (51.6%) | 336 (10.4%) |
Employment Status by Educational Attainment in Tuba City
According to labor force statistics for Tuba City, 65.7% of individuals (2,694) out of the total population between 25 and 64 years of age (4,101) are in the labor force, with 7.6% or 205 of them being unemployed. The group with the highest labor force participation rate are those with the educational attainment of bachelor's degree or higher, with 88.2% or 811 individuals in the labor force. Within the labor force, individuals with less than high school education have the highest percentage of unemployment, with 31.3% or 51 of them being unemployed.
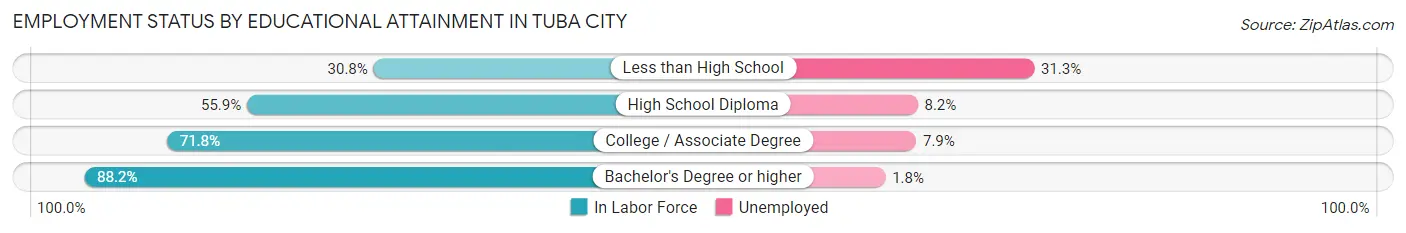
| Educational Attainment | In Labor Force | Unemployed |
| Less than High School | 163 (30.8%) | 166 (31.3%) |
| High School Diploma | 643 (55.9%) | 94 (8.2%) |
| College / Associate Degree | 1,078 (71.8%) | 119 (7.9%) |
| Bachelor's Degree or higher | 811 (88.2%) | 17 (1.8%) |
| Total | 2,694 (65.7%) | 312 (7.6%) |
Employment Occupations by Sex in Tuba City
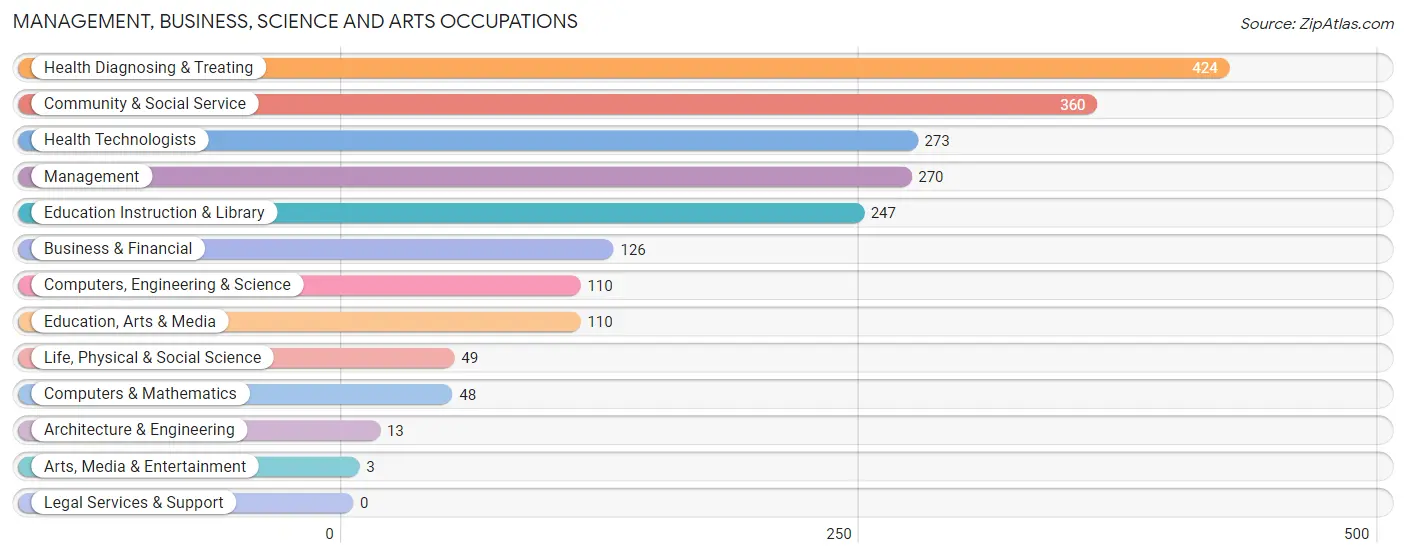
Management, Business, Science and Arts Occupations
The most common Management, Business, Science and Arts occupations in Tuba City are Health Diagnosing & Treating (424 | 14.7%), Community & Social Service (360 | 12.4%), Health Technologists (273 | 9.4%), Management (270 | 9.3%), and Education Instruction & Library (247 | 8.5%).
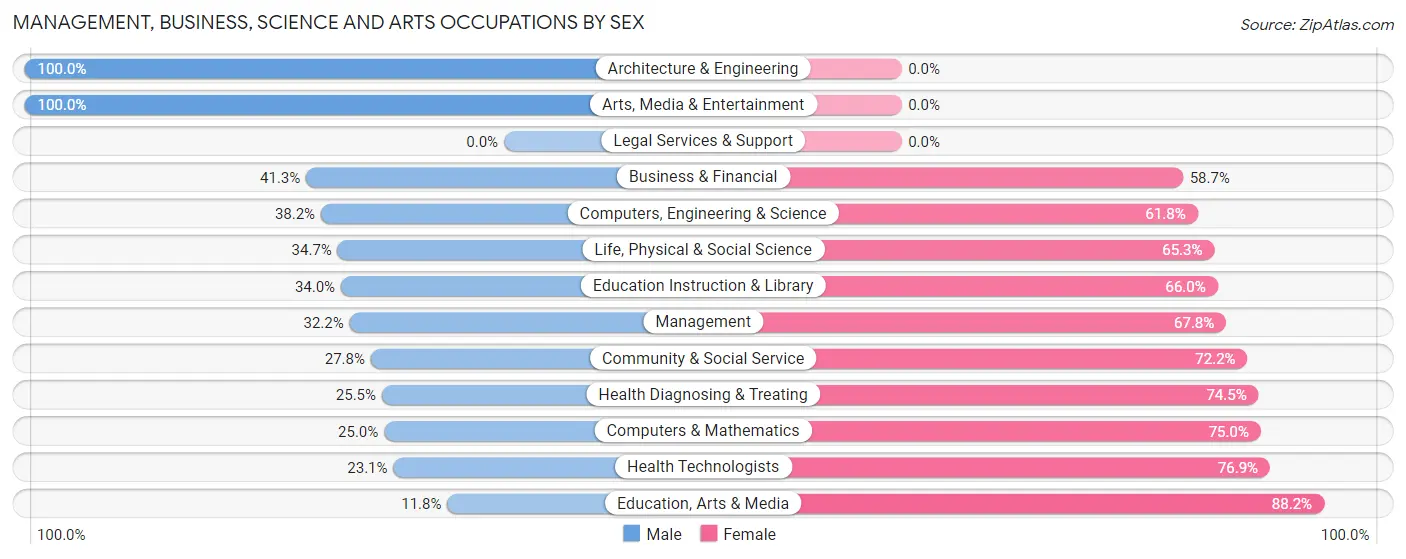
Management, Business, Science and Arts Occupations by Sex
Within the Management, Business, Science and Arts occupations in Tuba City, the most male-oriented occupations are Architecture & Engineering (100.0%), Arts, Media & Entertainment (100.0%), and Business & Financial (41.3%), while the most female-oriented occupations are Education, Arts & Media (88.2%), Health Technologists (76.9%), and Computers & Mathematics (75.0%).
| Occupation | Male | Female |
| Management | 87 (32.2%) | 183 (67.8%) |
| Business & Financial | 52 (41.3%) | 74 (58.7%) |
| Computers, Engineering & Science | 42 (38.2%) | 68 (61.8%) |
| Computers & Mathematics | 12 (25.0%) | 36 (75.0%) |
| Architecture & Engineering | 13 (100.0%) | 0 (0.0%) |
| Life, Physical & Social Science | 17 (34.7%) | 32 (65.3%) |
| Community & Social Service | 100 (27.8%) | 260 (72.2%) |
| Education, Arts & Media | 13 (11.8%) | 97 (88.2%) |
| Legal Services & Support | 0 (0.0%) | 0 (0.0%) |
| Education Instruction & Library | 84 (34.0%) | 163 (66.0%) |
| Arts, Media & Entertainment | 3 (100.0%) | 0 (0.0%) |
| Health Diagnosing & Treating | 108 (25.5%) | 316 (74.5%) |
| Health Technologists | 63 (23.1%) | 210 (76.9%) |
| Total (Category) | 389 (30.2%) | 901 (69.8%) |
| Total (Overall) | 1,174 (40.6%) | 1,719 (59.4%) |
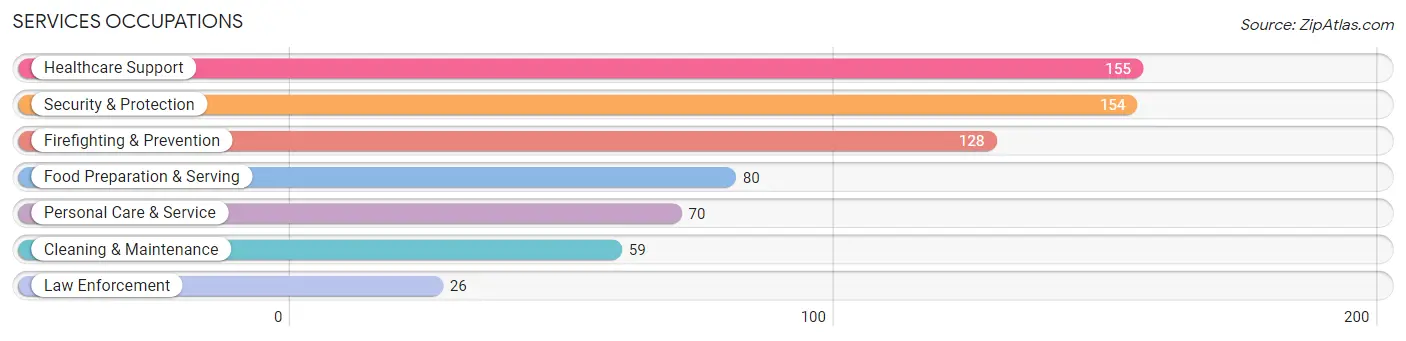
Services Occupations
The most common Services occupations in Tuba City are Healthcare Support (155 | 5.4%), Security & Protection (154 | 5.3%), Firefighting & Prevention (128 | 4.4%), Food Preparation & Serving (80 | 2.8%), and Personal Care & Service (70 | 2.4%).
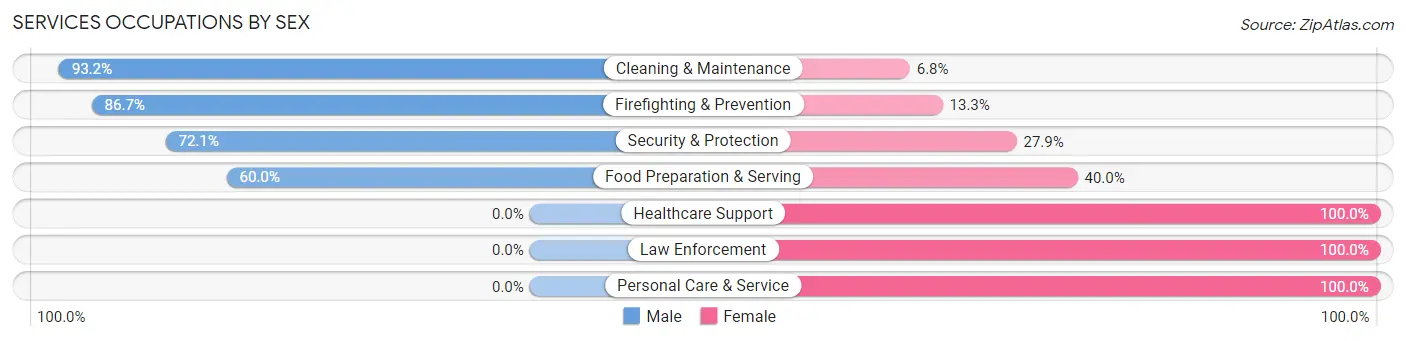
Services Occupations by Sex
Within the Services occupations in Tuba City, the most male-oriented occupations are Cleaning & Maintenance (93.2%), Firefighting & Prevention (86.7%), and Security & Protection (72.1%), while the most female-oriented occupations are Healthcare Support (100.0%), Law Enforcement (100.0%), and Personal Care & Service (100.0%).
| Occupation | Male | Female |
| Healthcare Support | 0 (0.0%) | 155 (100.0%) |
| Security & Protection | 111 (72.1%) | 43 (27.9%) |
| Firefighting & Prevention | 111 (86.7%) | 17 (13.3%) |
| Law Enforcement | 0 (0.0%) | 26 (100.0%) |
| Food Preparation & Serving | 48 (60.0%) | 32 (40.0%) |
| Cleaning & Maintenance | 55 (93.2%) | 4 (6.8%) |
| Personal Care & Service | 0 (0.0%) | 70 (100.0%) |
| Total (Category) | 214 (41.3%) | 304 (58.7%) |
| Total (Overall) | 1,174 (40.6%) | 1,719 (59.4%) |
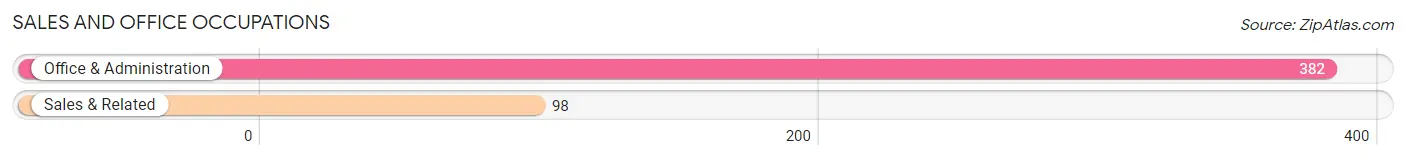
Sales and Office Occupations
The most common Sales and Office occupations in Tuba City are Office & Administration (382 | 13.2%), and Sales & Related (98 | 3.4%).
Sales and Office Occupations by Sex
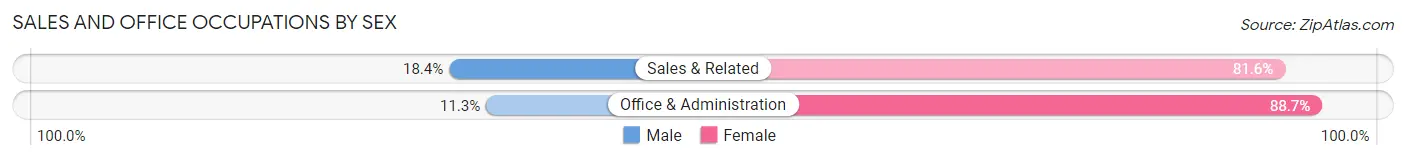
| Occupation | Male | Female |
| Sales & Related | 18 (18.4%) | 80 (81.6%) |
| Office & Administration | 43 (11.3%) | 339 (88.7%) |
| Total (Category) | 61 (12.7%) | 419 (87.3%) |
| Total (Overall) | 1,174 (40.6%) | 1,719 (59.4%) |
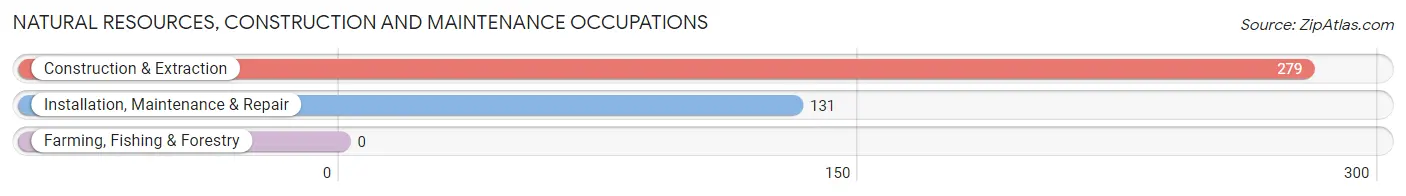
Natural Resources, Construction and Maintenance Occupations
The most common Natural Resources, Construction and Maintenance occupations in Tuba City are Construction & Extraction (279 | 9.6%), and Installation, Maintenance & Repair (131 | 4.5%).
Natural Resources, Construction and Maintenance Occupations by Sex
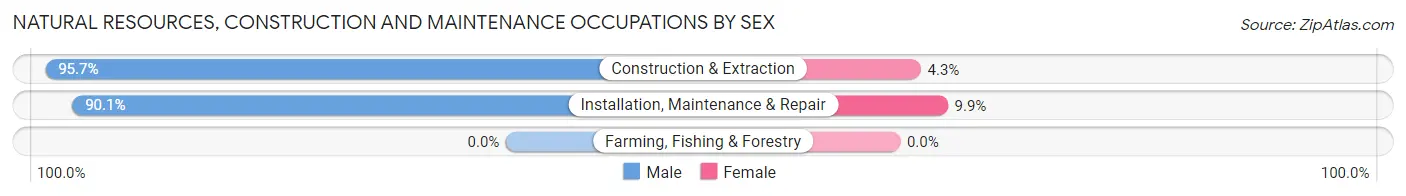
| Occupation | Male | Female |
| Farming, Fishing & Forestry | 0 (0.0%) | 0 (0.0%) |
| Construction & Extraction | 267 (95.7%) | 12 (4.3%) |
| Installation, Maintenance & Repair | 118 (90.1%) | 13 (9.9%) |
| Total (Category) | 385 (93.9%) | 25 (6.1%) |
| Total (Overall) | 1,174 (40.6%) | 1,719 (59.4%) |
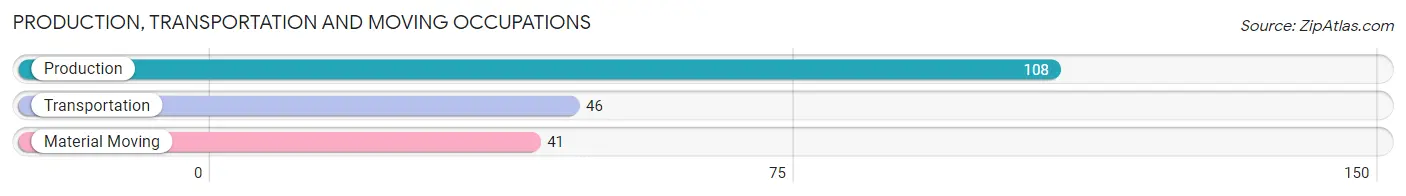
Production, Transportation and Moving Occupations
The most common Production, Transportation and Moving occupations in Tuba City are Production (108 | 3.7%), Transportation (46 | 1.6%), and Material Moving (41 | 1.4%).
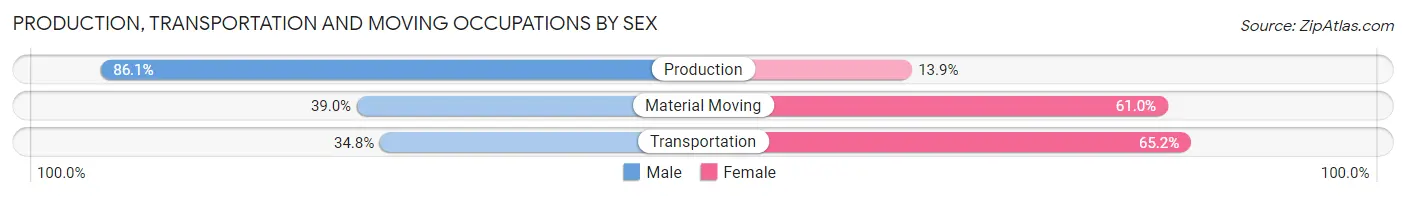
Production, Transportation and Moving Occupations by Sex
| Occupation | Male | Female |
| Production | 93 (86.1%) | 15 (13.9%) |
| Transportation | 16 (34.8%) | 30 (65.2%) |
| Material Moving | 16 (39.0%) | 25 (61.0%) |
| Total (Category) | 125 (64.1%) | 70 (35.9%) |
| Total (Overall) | 1,174 (40.6%) | 1,719 (59.4%) |
Employment Industries by Sex in Tuba City
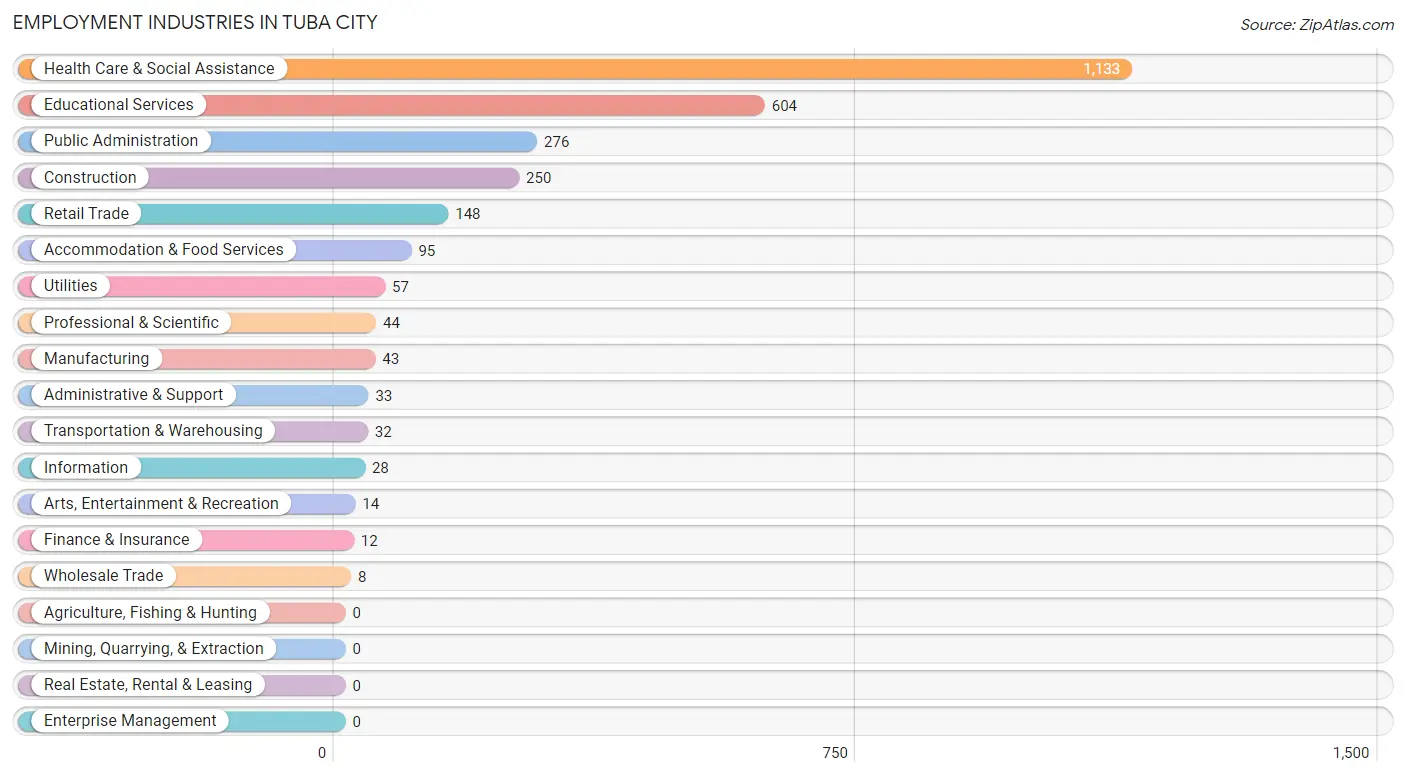
Employment Industries in Tuba City
The major employment industries in Tuba City include Health Care & Social Assistance (1,133 | 39.2%), Educational Services (604 | 20.9%), Public Administration (276 | 9.5%), Construction (250 | 8.6%), and Retail Trade (148 | 5.1%).
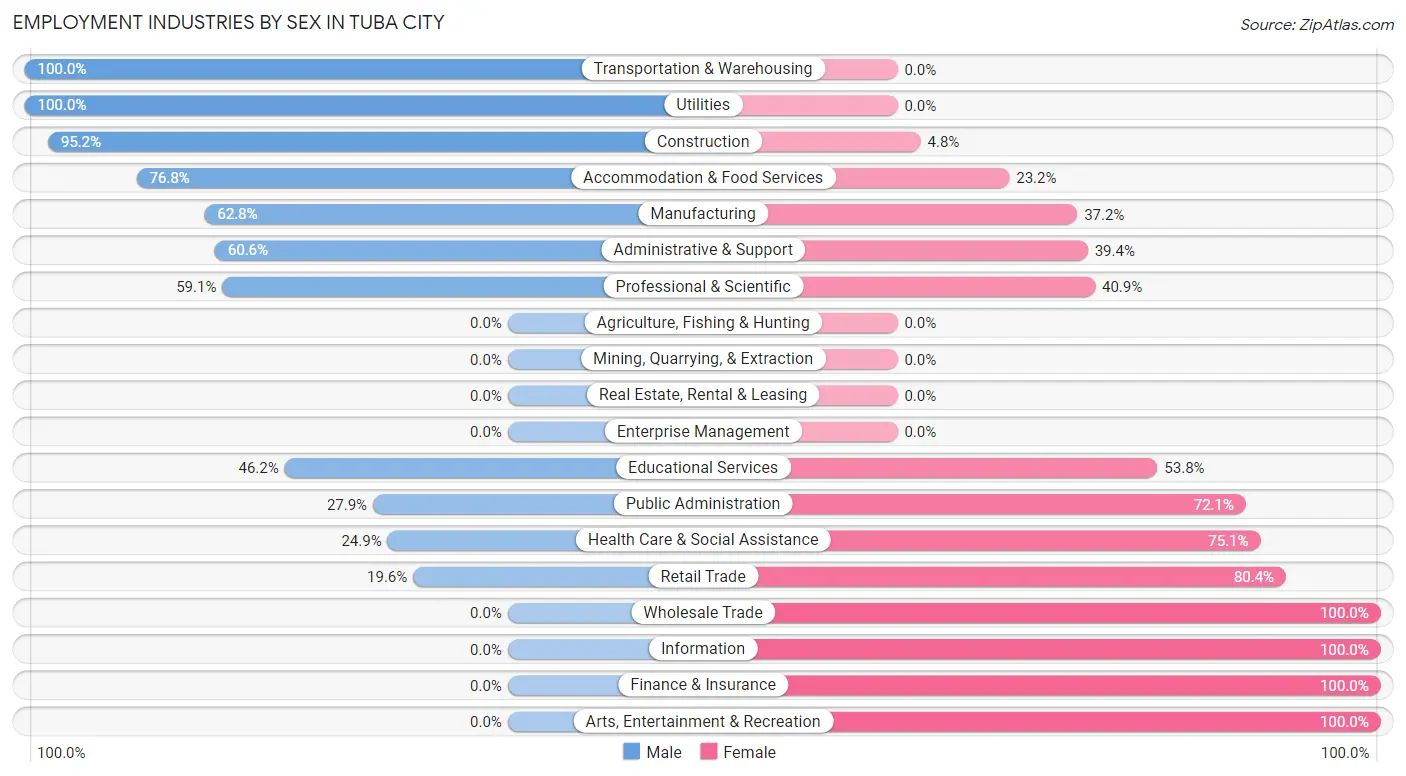
Employment Industries by Sex in Tuba City
The Tuba City industries that see more men than women are Transportation & Warehousing (100.0%), Utilities (100.0%), and Construction (95.2%), whereas the industries that tend to have a higher number of women are Wholesale Trade (100.0%), Information (100.0%), and Finance & Insurance (100.0%).
| Industry | Male | Female |
| Agriculture, Fishing & Hunting | 0 (0.0%) | 0 (0.0%) |
| Mining, Quarrying, & Extraction | 0 (0.0%) | 0 (0.0%) |
| Construction | 238 (95.2%) | 12 (4.8%) |
| Manufacturing | 27 (62.8%) | 16 (37.2%) |
| Wholesale Trade | 0 (0.0%) | 8 (100.0%) |
| Retail Trade | 29 (19.6%) | 119 (80.4%) |
| Transportation & Warehousing | 32 (100.0%) | 0 (0.0%) |
| Utilities | 57 (100.0%) | 0 (0.0%) |
| Information | 0 (0.0%) | 28 (100.0%) |
| Finance & Insurance | 0 (0.0%) | 12 (100.0%) |
| Real Estate, Rental & Leasing | 0 (0.0%) | 0 (0.0%) |
| Professional & Scientific | 26 (59.1%) | 18 (40.9%) |
| Enterprise Management | 0 (0.0%) | 0 (0.0%) |
| Administrative & Support | 20 (60.6%) | 13 (39.4%) |
| Educational Services | 279 (46.2%) | 325 (53.8%) |
| Health Care & Social Assistance | 282 (24.9%) | 851 (75.1%) |
| Arts, Entertainment & Recreation | 0 (0.0%) | 14 (100.0%) |
| Accommodation & Food Services | 73 (76.8%) | 22 (23.2%) |
| Public Administration | 77 (27.9%) | 199 (72.1%) |
| Total | 1,174 (40.6%) | 1,719 (59.4%) |
Education in Tuba City
School Enrollment in Tuba City
The most common levels of schooling among the 2,247 students in Tuba City are middle school (675 | 30.0%), elementary school (504 | 22.4%), and high school (491 | 21.8%).
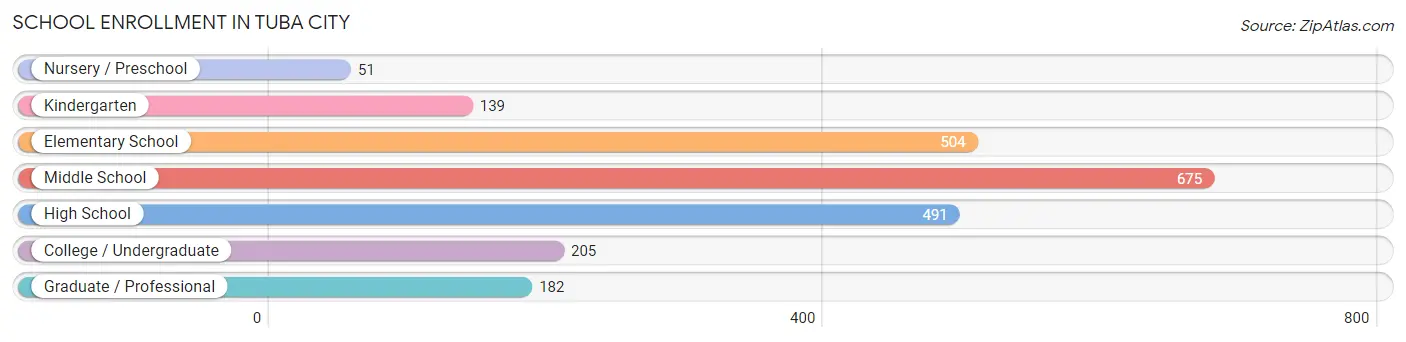
| School Level | # Students | % Students |
| Nursery / Preschool | 51 | 2.3% |
| Kindergarten | 139 | 6.2% |
| Elementary School | 504 | 22.4% |
| Middle School | 675 | 30.0% |
| High School | 491 | 21.8% |
| College / Undergraduate | 205 | 9.1% |
| Graduate / Professional | 182 | 8.1% |
| Total | 2,247 | 100.0% |
School Enrollment by Age by Funding Source in Tuba City
Out of a total of 2,247 students who are enrolled in schools in Tuba City, 142 (6.3%) attend a private institution, while the remaining 2,105 (93.7%) are enrolled in public schools. The age group of 20 to 24 year olds has the highest likelihood of being enrolled in private schools, with 22 (100.0% in the age bracket) enrolled. Conversely, the age group of 3 to 4 year olds has the lowest likelihood of being enrolled in a private school, with 63 (100.0% in the age bracket) attending a public institution.
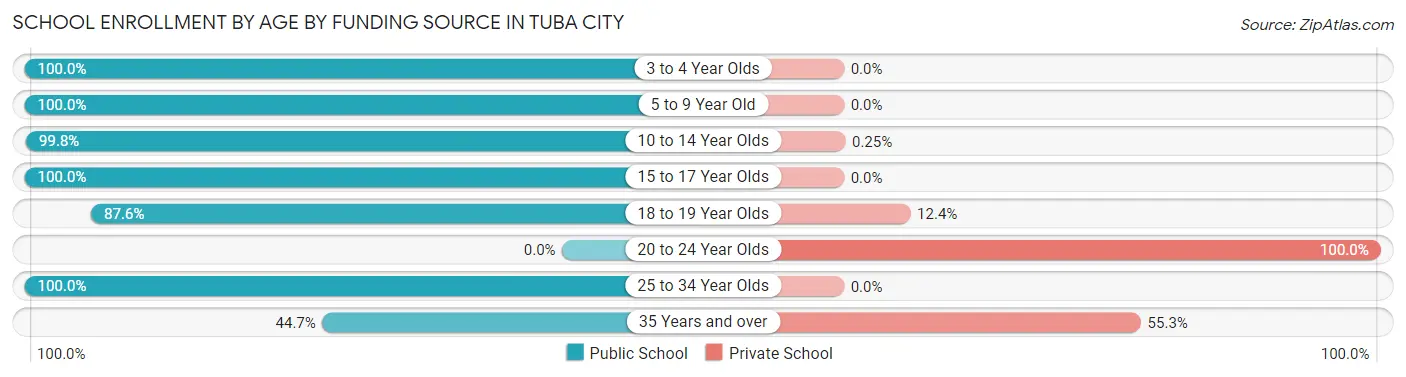
| Age Bracket | Public School | Private School |
| 3 to 4 Year Olds | 63 (100.0%) | 0 (0.0%) |
| 5 to 9 Year Old | 566 (100.0%) | 0 (0.0%) |
| 10 to 14 Year Olds | 812 (99.8%) | 2 (0.3%) |
| 15 to 17 Year Olds | 342 (100.0%) | 0 (0.0%) |
| 18 to 19 Year Olds | 92 (87.6%) | 13 (12.4%) |
| 20 to 24 Year Olds | 0 (0.0%) | 22 (100.0%) |
| 25 to 34 Year Olds | 147 (100.0%) | 0 (0.0%) |
| 35 Years and over | 84 (44.7%) | 104 (55.3%) |
| Total | 2,105 (93.7%) | 142 (6.3%) |
Educational Attainment by Field of Study in Tuba City
Science & technology (367 | 29.5%), education (246 | 19.8%), arts & humanities (165 | 13.3%), bio, nature & agricultural (89 | 7.1%), and social sciences (86 | 6.9%) are the most common fields of study among 1,245 individuals in Tuba City who have obtained a bachelor's degree or higher.
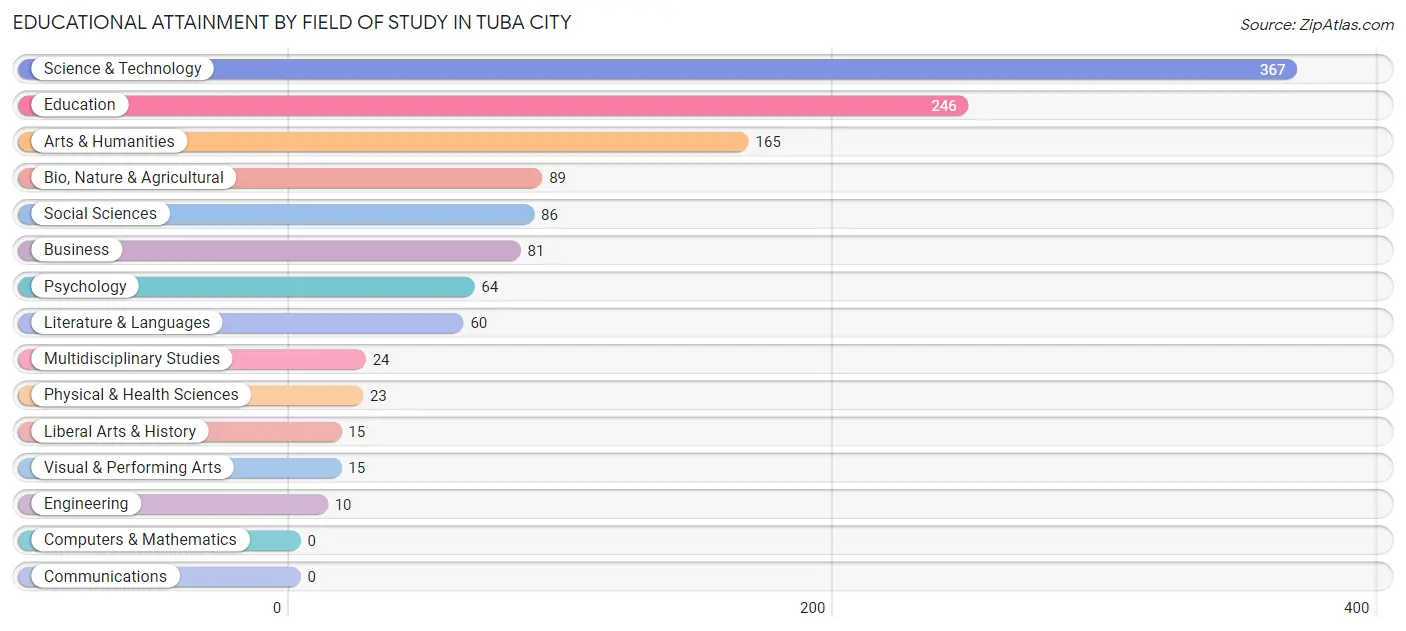
| Field of Study | # Graduates | % Graduates |
| Computers & Mathematics | 0 | 0.0% |
| Bio, Nature & Agricultural | 89 | 7.1% |
| Physical & Health Sciences | 23 | 1.8% |
| Psychology | 64 | 5.1% |
| Social Sciences | 86 | 6.9% |
| Engineering | 10 | 0.8% |
| Multidisciplinary Studies | 24 | 1.9% |
| Science & Technology | 367 | 29.5% |
| Business | 81 | 6.5% |
| Education | 246 | 19.8% |
| Literature & Languages | 60 | 4.8% |
| Liberal Arts & History | 15 | 1.2% |
| Visual & Performing Arts | 15 | 1.2% |
| Communications | 0 | 0.0% |
| Arts & Humanities | 165 | 13.3% |
| Total | 1,245 | 100.0% |
Transportation & Commute in Tuba City
Vehicle Availability by Sex in Tuba City
The most prevalent vehicle ownership categories in Tuba City are males with 2 vehicles (451, accounting for 38.4%) and females with 2 vehicles (586, making up 26.3%).
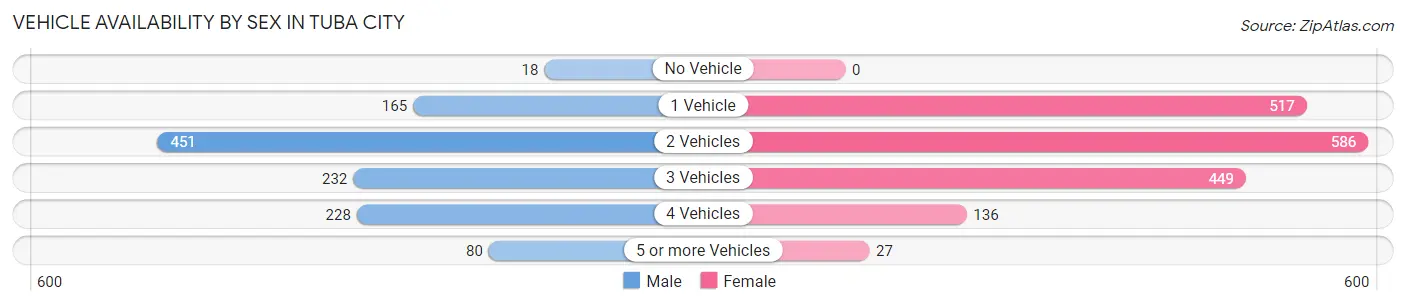
| Vehicles Available | Male | Female |
| No Vehicle | 18 (1.5%) | 0 (0.0%) |
| 1 Vehicle | 165 (14.1%) | 517 (30.1%) |
| 2 Vehicles | 451 (38.4%) | 586 (34.2%) |
| 3 Vehicles | 232 (19.8%) | 449 (26.2%) |
| 4 Vehicles | 228 (19.4%) | 136 (7.9%) |
| 5 or more Vehicles | 80 (6.8%) | 27 (1.6%) |
| Total | 1,174 (100.0%) | 1,715 (100.0%) |
Commute Time in Tuba City
The most frequently occuring commute durations in Tuba City are 5 to 9 minutes (1,051 commuters, 39.1%), less than 5 minutes (683 commuters, 25.4%), and 10 to 14 minutes (367 commuters, 13.7%).
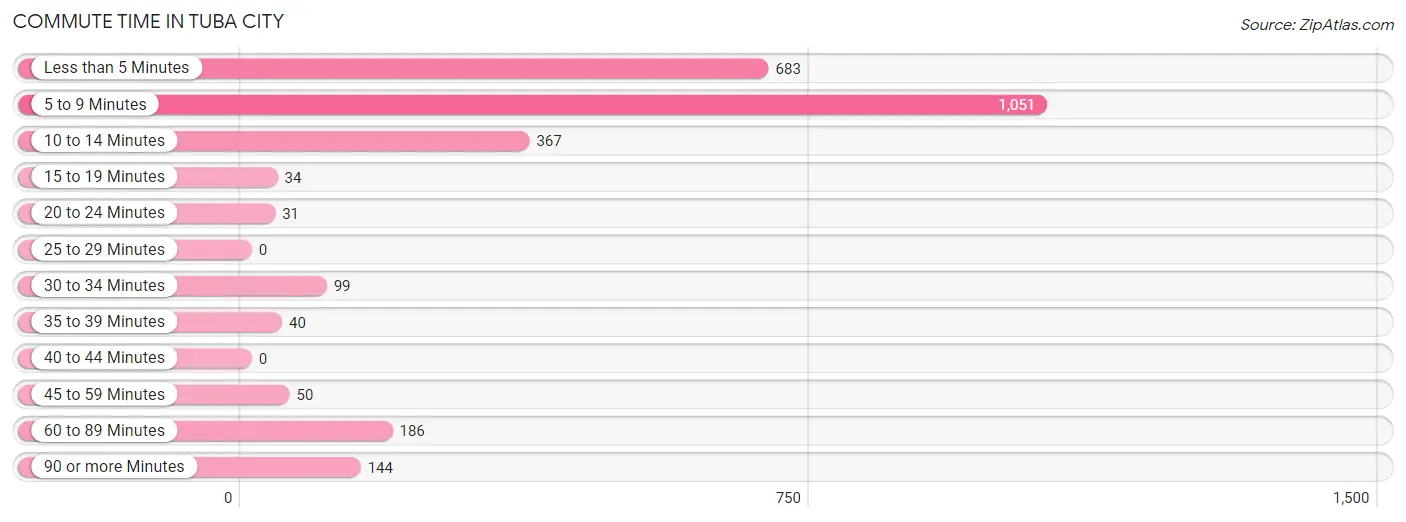
| Commute Time | # Commuters | % Commuters |
| Less than 5 Minutes | 683 | 25.4% |
| 5 to 9 Minutes | 1,051 | 39.1% |
| 10 to 14 Minutes | 367 | 13.7% |
| 15 to 19 Minutes | 34 | 1.3% |
| 20 to 24 Minutes | 31 | 1.1% |
| 25 to 29 Minutes | 0 | 0.0% |
| 30 to 34 Minutes | 99 | 3.7% |
| 35 to 39 Minutes | 40 | 1.5% |
| 40 to 44 Minutes | 0 | 0.0% |
| 45 to 59 Minutes | 50 | 1.9% |
| 60 to 89 Minutes | 186 | 6.9% |
| 90 or more Minutes | 144 | 5.4% |
Commute Time by Sex in Tuba City
The most common commute times in Tuba City are less than 5 minutes (318 commuters, 28.7%) for males and 5 to 9 minutes (742 commuters, 47.0%) for females.
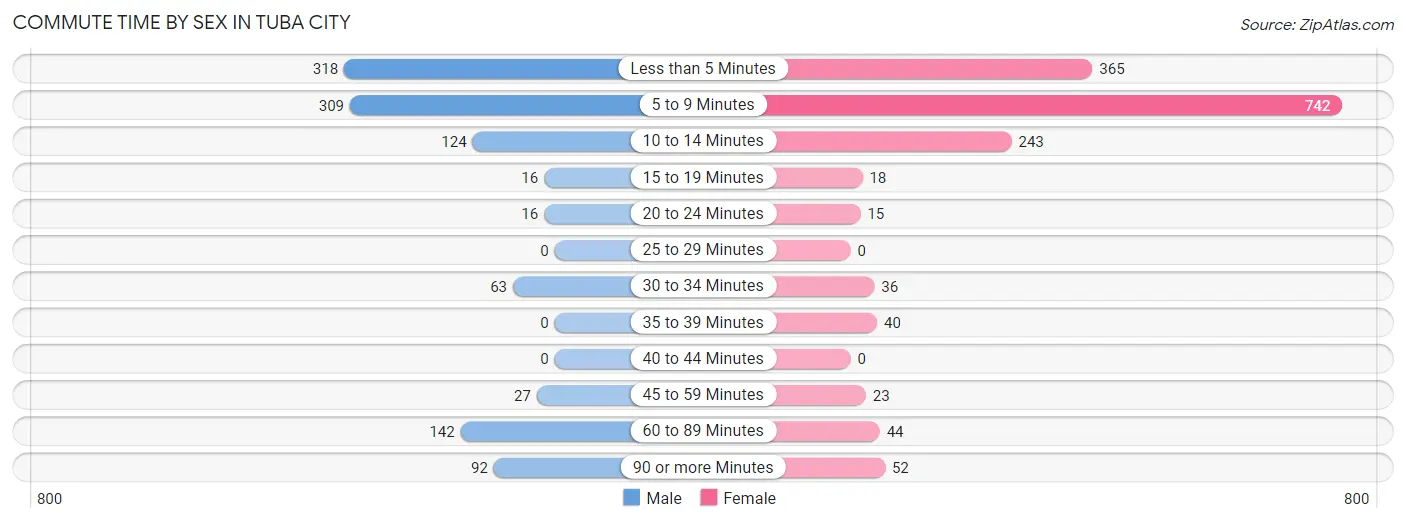
| Commute Time | Male | Female |
| Less than 5 Minutes | 318 (28.7%) | 365 (23.1%) |
| 5 to 9 Minutes | 309 (27.9%) | 742 (47.0%) |
| 10 to 14 Minutes | 124 (11.2%) | 243 (15.4%) |
| 15 to 19 Minutes | 16 (1.5%) | 18 (1.1%) |
| 20 to 24 Minutes | 16 (1.5%) | 15 (0.9%) |
| 25 to 29 Minutes | 0 (0.0%) | 0 (0.0%) |
| 30 to 34 Minutes | 63 (5.7%) | 36 (2.3%) |
| 35 to 39 Minutes | 0 (0.0%) | 40 (2.5%) |
| 40 to 44 Minutes | 0 (0.0%) | 0 (0.0%) |
| 45 to 59 Minutes | 27 (2.4%) | 23 (1.5%) |
| 60 to 89 Minutes | 142 (12.8%) | 44 (2.8%) |
| 90 or more Minutes | 92 (8.3%) | 52 (3.3%) |
Time of Departure to Work by Sex in Tuba City
The most frequent times of departure to work in Tuba City are 7:00 AM to 7:29 AM (262, 23.7%) for males and 7:30 AM to 7:59 AM (432, 27.4%) for females.
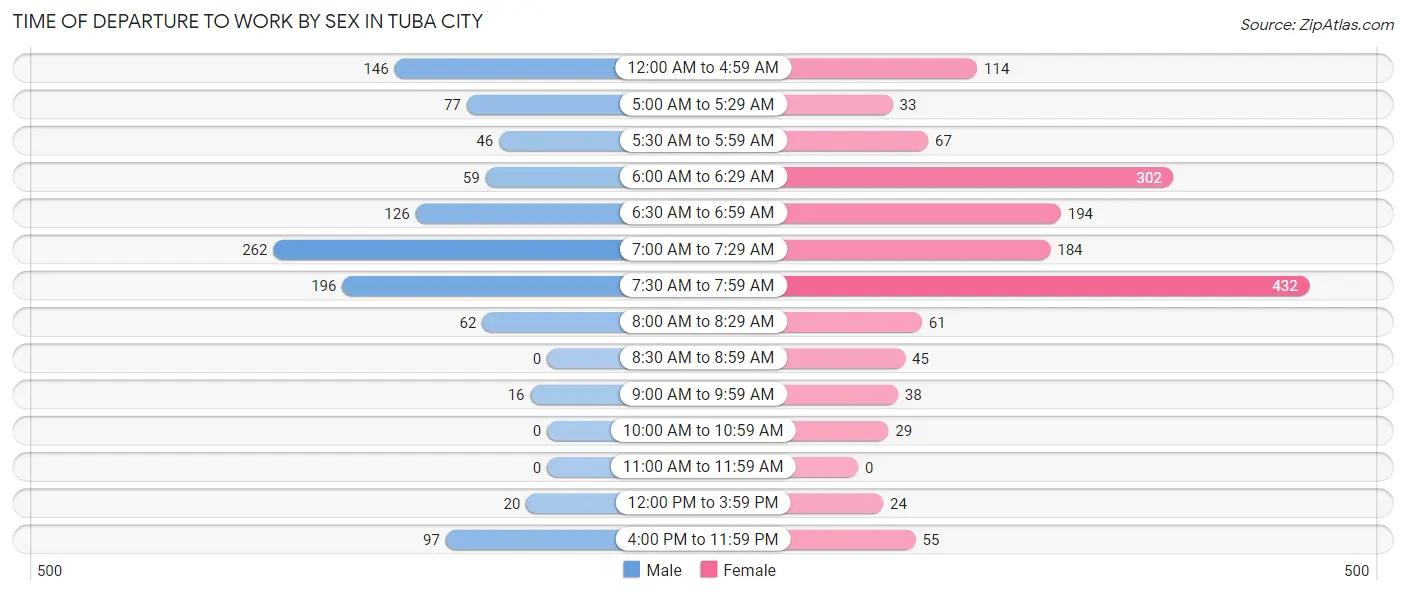
| Time of Departure | Male | Female |
| 12:00 AM to 4:59 AM | 146 (13.2%) | 114 (7.2%) |
| 5:00 AM to 5:29 AM | 77 (7.0%) | 33 (2.1%) |
| 5:30 AM to 5:59 AM | 46 (4.2%) | 67 (4.3%) |
| 6:00 AM to 6:29 AM | 59 (5.3%) | 302 (19.1%) |
| 6:30 AM to 6:59 AM | 126 (11.4%) | 194 (12.3%) |
| 7:00 AM to 7:29 AM | 262 (23.7%) | 184 (11.7%) |
| 7:30 AM to 7:59 AM | 196 (17.7%) | 432 (27.4%) |
| 8:00 AM to 8:29 AM | 62 (5.6%) | 61 (3.9%) |
| 8:30 AM to 8:59 AM | 0 (0.0%) | 45 (2.9%) |
| 9:00 AM to 9:59 AM | 16 (1.5%) | 38 (2.4%) |
| 10:00 AM to 10:59 AM | 0 (0.0%) | 29 (1.8%) |
| 11:00 AM to 11:59 AM | 0 (0.0%) | 0 (0.0%) |
| 12:00 PM to 3:59 PM | 20 (1.8%) | 24 (1.5%) |
| 4:00 PM to 11:59 PM | 97 (8.8%) | 55 (3.5%) |
| Total | 1,107 (100.0%) | 1,578 (100.0%) |
Housing Occupancy in Tuba City
Occupancy by Ownership in Tuba City
Of the total 2,273 dwellings in Tuba City, owner-occupied units account for 1,263 (55.6%), while renter-occupied units make up 1,010 (44.4%).
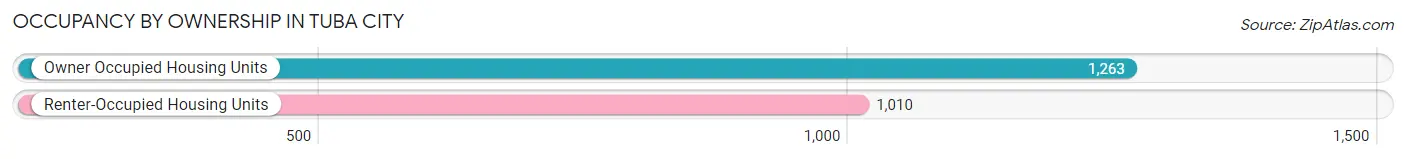
| Occupancy | # Housing Units | % Housing Units |
| Owner Occupied Housing Units | 1,263 | 55.6% |
| Renter-Occupied Housing Units | 1,010 | 44.4% |
| Total Occupied Housing Units | 2,273 | 100.0% |
Occupancy by Household Size in Tuba City
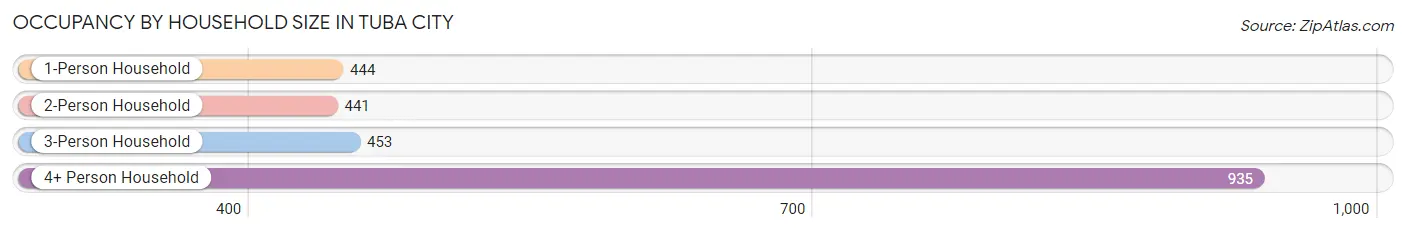
| Household Size | # Housing Units | % Housing Units |
| 1-Person Household | 444 | 19.5% |
| 2-Person Household | 441 | 19.4% |
| 3-Person Household | 453 | 19.9% |
| 4+ Person Household | 935 | 41.1% |
| Total Housing Units | 2,273 | 100.0% |
Occupancy by Ownership by Household Size in Tuba City
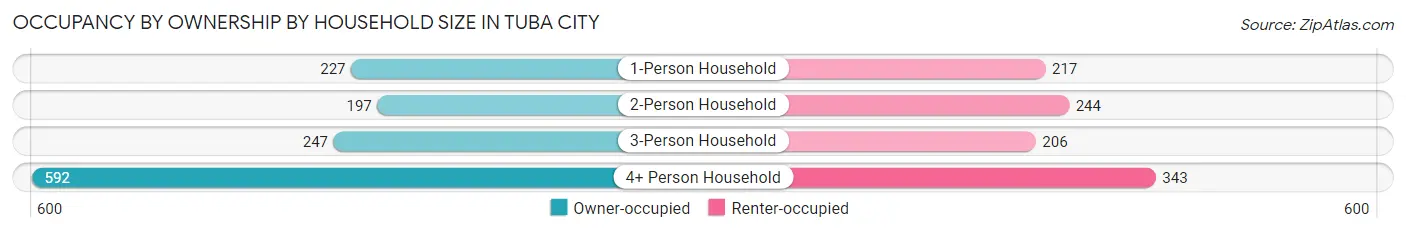
| Household Size | Owner-occupied | Renter-occupied |
| 1-Person Household | 227 (51.1%) | 217 (48.9%) |
| 2-Person Household | 197 (44.7%) | 244 (55.3%) |
| 3-Person Household | 247 (54.5%) | 206 (45.5%) |
| 4+ Person Household | 592 (63.3%) | 343 (36.7%) |
| Total Housing Units | 1,263 (55.6%) | 1,010 (44.4%) |
Occupancy by Educational Attainment in Tuba City
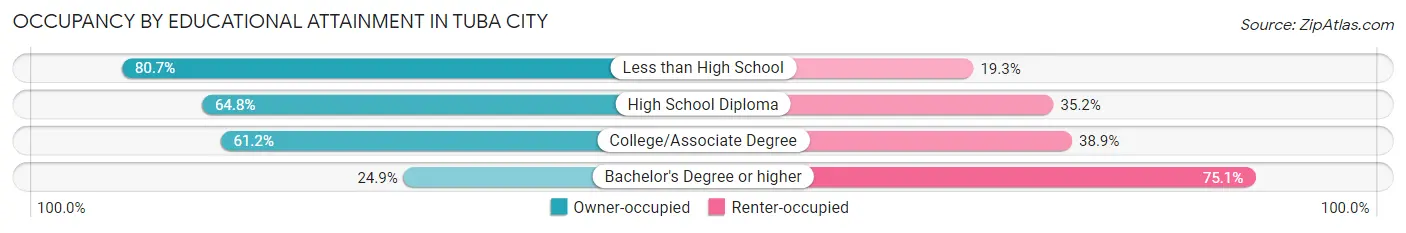
| Household Size | Owner-occupied | Renter-occupied |
| Less than High School | 364 (80.7%) | 87 (19.3%) |
| High School Diploma | 293 (64.8%) | 159 (35.2%) |
| College/Associate Degree | 447 (61.2%) | 284 (38.9%) |
| Bachelor's Degree or higher | 159 (24.9%) | 480 (75.1%) |
Occupancy by Age of Householder in Tuba City
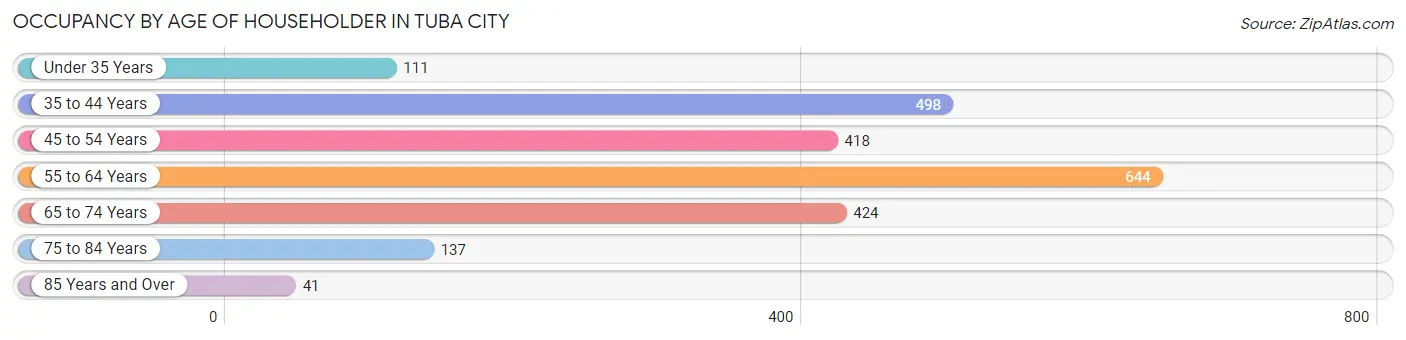
| Age Bracket | # Households | % Households |
| Under 35 Years | 111 | 4.9% |
| 35 to 44 Years | 498 | 21.9% |
| 45 to 54 Years | 418 | 18.4% |
| 55 to 64 Years | 644 | 28.3% |
| 65 to 74 Years | 424 | 18.6% |
| 75 to 84 Years | 137 | 6.0% |
| 85 Years and Over | 41 | 1.8% |
| Total | 2,273 | 100.0% |
Housing Finances in Tuba City
Median Income by Occupancy in Tuba City
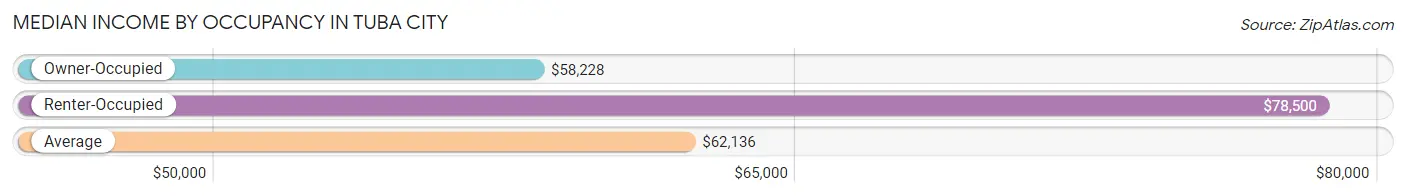
| Occupancy Type | # Households | Median Income |
| Owner-Occupied | 1,263 (55.6%) | $58,228 |
| Renter-Occupied | 1,010 (44.4%) | $78,500 |
| Average | 2,273 (100.0%) | $62,136 |
Occupancy by Householder Income Bracket in Tuba City
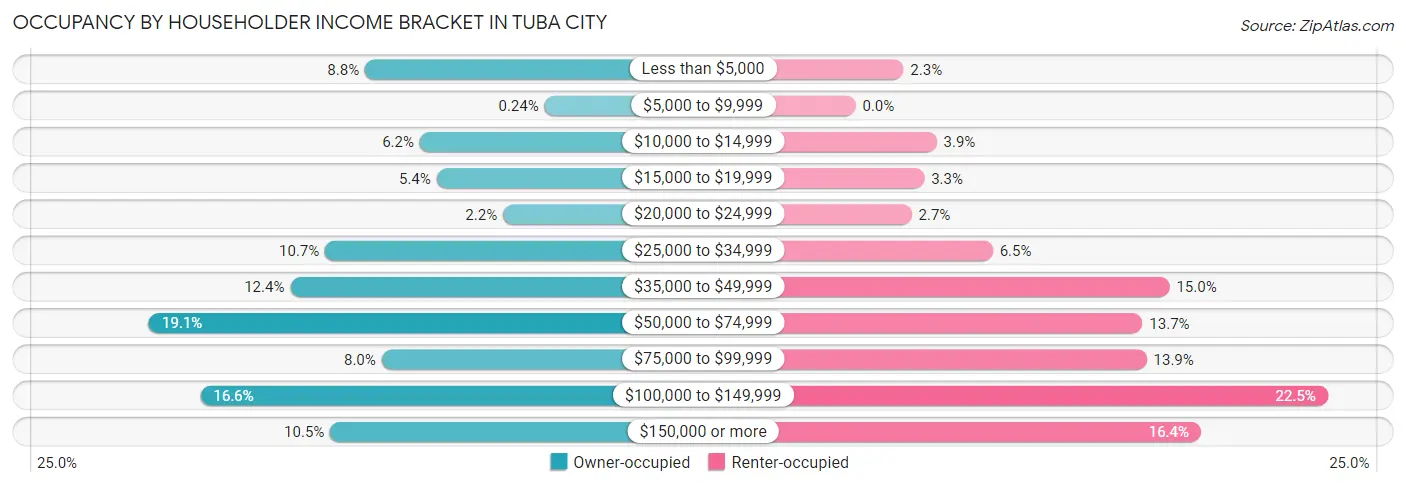
| Income Bracket | Owner-occupied | Renter-occupied |
| Less than $5,000 | 111 (8.8%) | 23 (2.3%) |
| $5,000 to $9,999 | 3 (0.2%) | 0 (0.0%) |
| $10,000 to $14,999 | 78 (6.2%) | 39 (3.9%) |
| $15,000 to $19,999 | 68 (5.4%) | 33 (3.3%) |
| $20,000 to $24,999 | 28 (2.2%) | 27 (2.7%) |
| $25,000 to $34,999 | 135 (10.7%) | 66 (6.5%) |
| $35,000 to $49,999 | 156 (12.3%) | 151 (14.9%) |
| $50,000 to $74,999 | 241 (19.1%) | 138 (13.7%) |
| $75,000 to $99,999 | 101 (8.0%) | 140 (13.9%) |
| $100,000 to $149,999 | 210 (16.6%) | 227 (22.5%) |
| $150,000 or more | 132 (10.4%) | 166 (16.4%) |
| Total | 1,263 (100.0%) | 1,010 (100.0%) |
Monthly Housing Cost Tiers in Tuba City
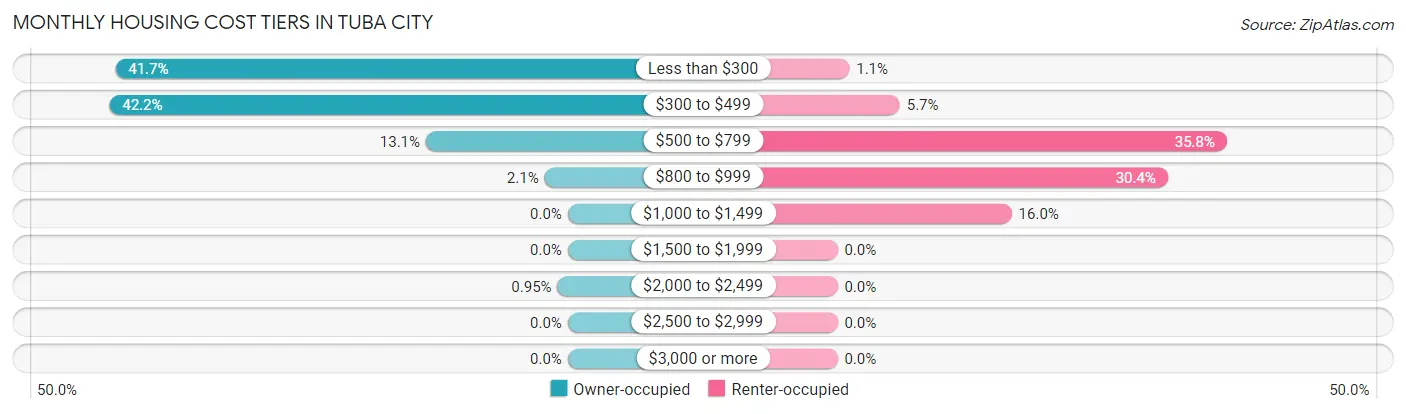
| Monthly Cost | Owner-occupied | Renter-occupied |
| Less than $300 | 526 (41.6%) | 11 (1.1%) |
| $300 to $499 | 533 (42.2%) | 58 (5.7%) |
| $500 to $799 | 165 (13.1%) | 362 (35.8%) |
| $800 to $999 | 27 (2.1%) | 307 (30.4%) |
| $1,000 to $1,499 | 0 (0.0%) | 162 (16.0%) |
| $1,500 to $1,999 | 0 (0.0%) | 0 (0.0%) |
| $2,000 to $2,499 | 12 (0.9%) | 0 (0.0%) |
| $2,500 to $2,999 | 0 (0.0%) | 0 (0.0%) |
| $3,000 or more | 0 (0.0%) | 0 (0.0%) |
| Total | 1,263 (100.0%) | 1,010 (100.0%) |
Physical Housing Characteristics in Tuba City
Housing Structures in Tuba City
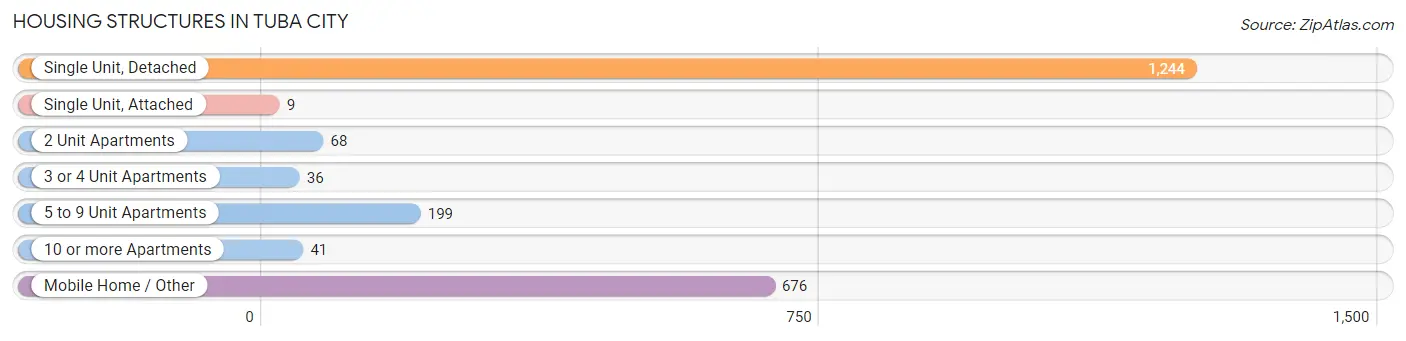
| Structure Type | # Housing Units | % Housing Units |
| Single Unit, Detached | 1,244 | 54.7% |
| Single Unit, Attached | 9 | 0.4% |
| 2 Unit Apartments | 68 | 3.0% |
| 3 or 4 Unit Apartments | 36 | 1.6% |
| 5 to 9 Unit Apartments | 199 | 8.7% |
| 10 or more Apartments | 41 | 1.8% |
| Mobile Home / Other | 676 | 29.7% |
| Total | 2,273 | 100.0% |
Housing Structures by Occupancy in Tuba City
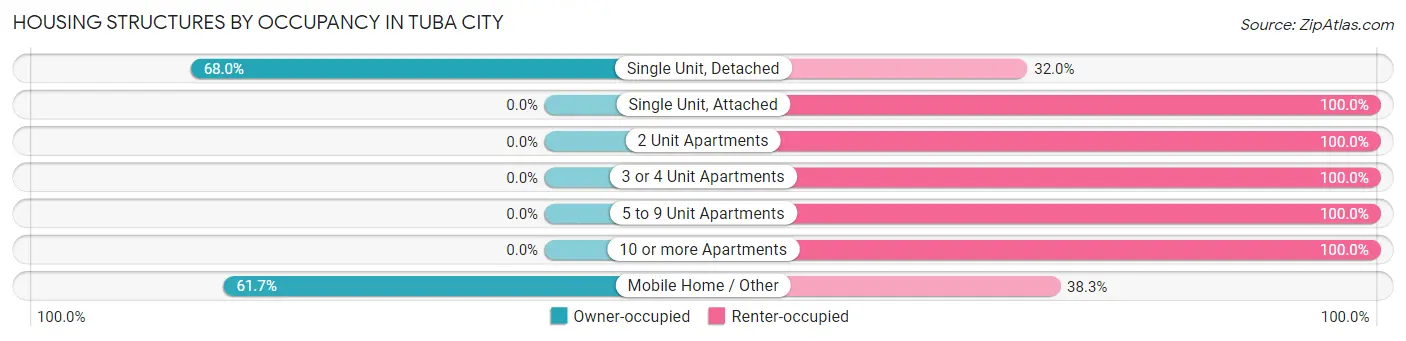
| Structure Type | Owner-occupied | Renter-occupied |
| Single Unit, Detached | 846 (68.0%) | 398 (32.0%) |
| Single Unit, Attached | 0 (0.0%) | 9 (100.0%) |
| 2 Unit Apartments | 0 (0.0%) | 68 (100.0%) |
| 3 or 4 Unit Apartments | 0 (0.0%) | 36 (100.0%) |
| 5 to 9 Unit Apartments | 0 (0.0%) | 199 (100.0%) |
| 10 or more Apartments | 0 (0.0%) | 41 (100.0%) |
| Mobile Home / Other | 417 (61.7%) | 259 (38.3%) |
| Total | 1,263 (55.6%) | 1,010 (44.4%) |
Housing Structures by Number of Rooms in Tuba City
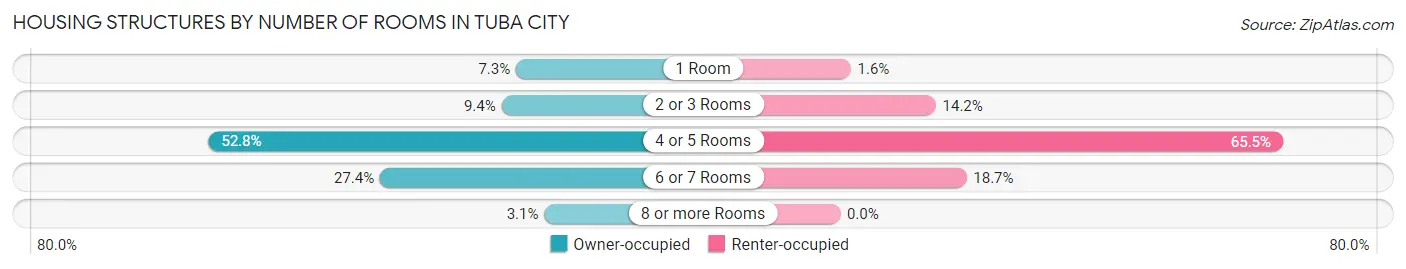
| Number of Rooms | Owner-occupied | Renter-occupied |
| 1 Room | 92 (7.3%) | 16 (1.6%) |
| 2 or 3 Rooms | 119 (9.4%) | 143 (14.2%) |
| 4 or 5 Rooms | 667 (52.8%) | 662 (65.5%) |
| 6 or 7 Rooms | 346 (27.4%) | 189 (18.7%) |
| 8 or more Rooms | 39 (3.1%) | 0 (0.0%) |
| Total | 1,263 (100.0%) | 1,010 (100.0%) |
Housing Structure by Heating Type in Tuba City
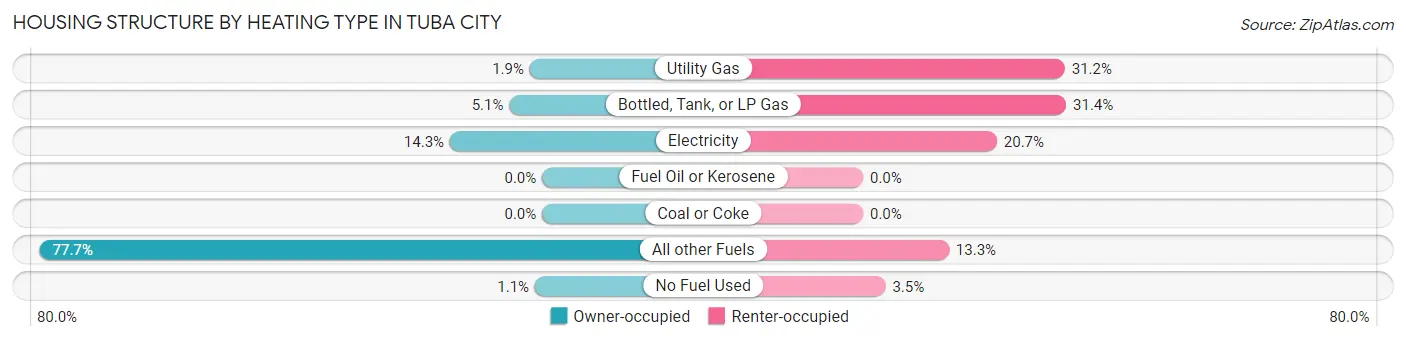
| Heating Type | Owner-occupied | Renter-occupied |
| Utility Gas | 24 (1.9%) | 315 (31.2%) |
| Bottled, Tank, or LP Gas | 64 (5.1%) | 317 (31.4%) |
| Electricity | 180 (14.2%) | 209 (20.7%) |
| Fuel Oil or Kerosene | 0 (0.0%) | 0 (0.0%) |
| Coal or Coke | 0 (0.0%) | 0 (0.0%) |
| All other Fuels | 981 (77.7%) | 134 (13.3%) |
| No Fuel Used | 14 (1.1%) | 35 (3.5%) |
| Total | 1,263 (100.0%) | 1,010 (100.0%) |
Household Vehicle Usage in Tuba City
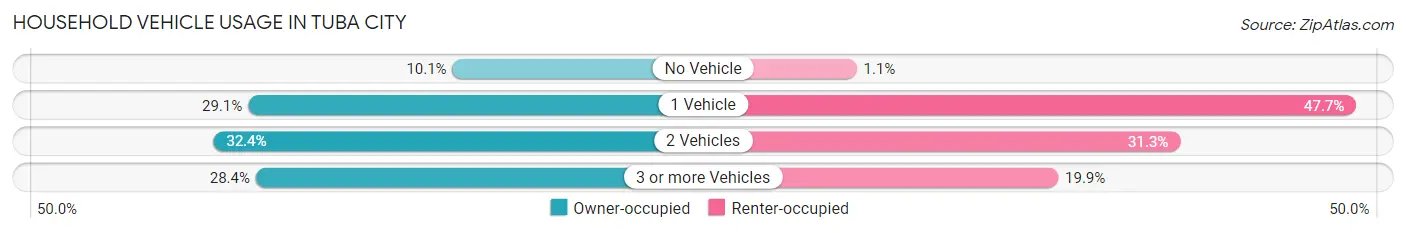
| Vehicles per Household | Owner-occupied | Renter-occupied |
| No Vehicle | 127 (10.1%) | 11 (1.1%) |
| 1 Vehicle | 368 (29.1%) | 482 (47.7%) |
| 2 Vehicles | 409 (32.4%) | 316 (31.3%) |
| 3 or more Vehicles | 359 (28.4%) | 201 (19.9%) |
| Total | 1,263 (100.0%) | 1,010 (100.0%) |
Real Estate & Mortgages in Tuba City
Real Estate and Mortgage Overview in Tuba City
| Characteristic | Without Mortgage | With Mortgage |
| Housing Units | 1,210 | 53 |
| Median Property Value | $63,800 | $0 |
| Median Household Income | $58,209 | $0 |
| Monthly Housing Costs | $330 | $0 |
| Real Estate Taxes | - | - |
Property Value by Mortgage Status in Tuba City
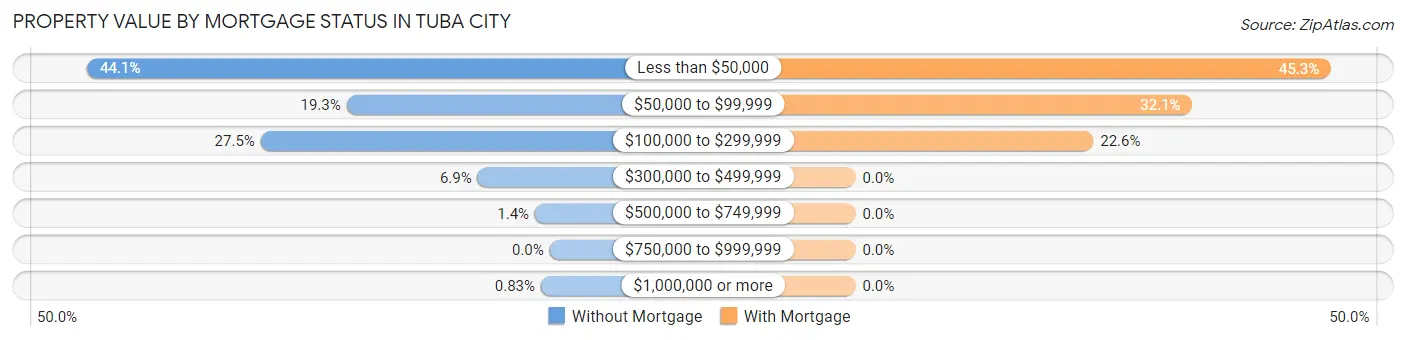
| Property Value | Without Mortgage | With Mortgage |
| Less than $50,000 | 533 (44.1%) | 24 (45.3%) |
| $50,000 to $99,999 | 234 (19.3%) | 17 (32.1%) |
| $100,000 to $299,999 | 333 (27.5%) | 12 (22.6%) |
| $300,000 to $499,999 | 83 (6.9%) | 0 (0.0%) |
| $500,000 to $749,999 | 17 (1.4%) | 0 (0.0%) |
| $750,000 to $999,999 | 0 (0.0%) | 0 (0.0%) |
| $1,000,000 or more | 10 (0.8%) | 0 (0.0%) |
| Total | 1,210 (100.0%) | 53 (100.0%) |
Household Income by Mortgage Status in Tuba City
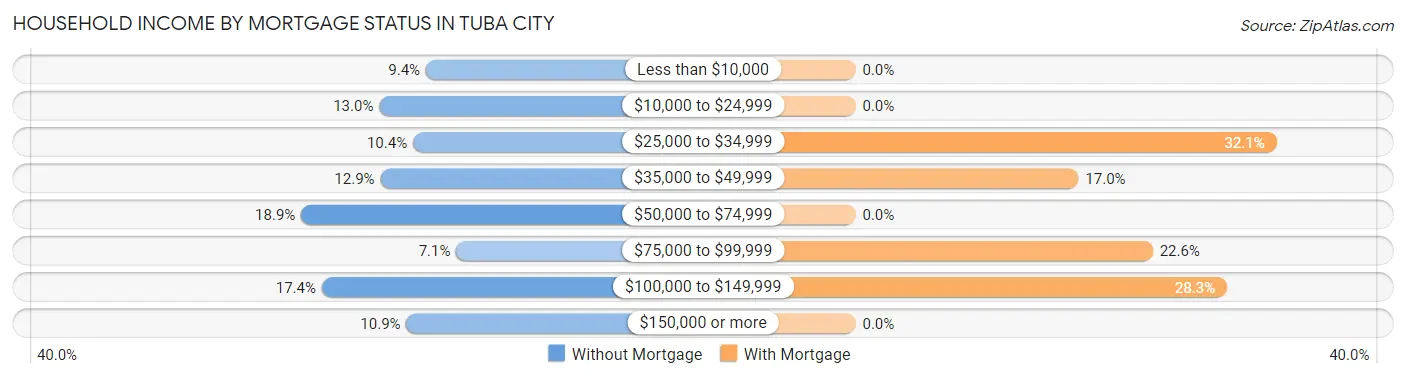
| Household Income | Without Mortgage | With Mortgage |
| Less than $10,000 | 114 (9.4%) | 0 (0.0%) |
| $10,000 to $24,999 | 157 (13.0%) | 0 (0.0%) |
| $25,000 to $34,999 | 126 (10.4%) | 17 (32.1%) |
| $35,000 to $49,999 | 156 (12.9%) | 9 (17.0%) |
| $50,000 to $74,999 | 229 (18.9%) | 0 (0.0%) |
| $75,000 to $99,999 | 86 (7.1%) | 12 (22.6%) |
| $100,000 to $149,999 | 210 (17.4%) | 15 (28.3%) |
| $150,000 or more | 132 (10.9%) | 0 (0.0%) |
| Total | 1,210 (100.0%) | 53 (100.0%) |
Property Value to Household Income Ratio in Tuba City
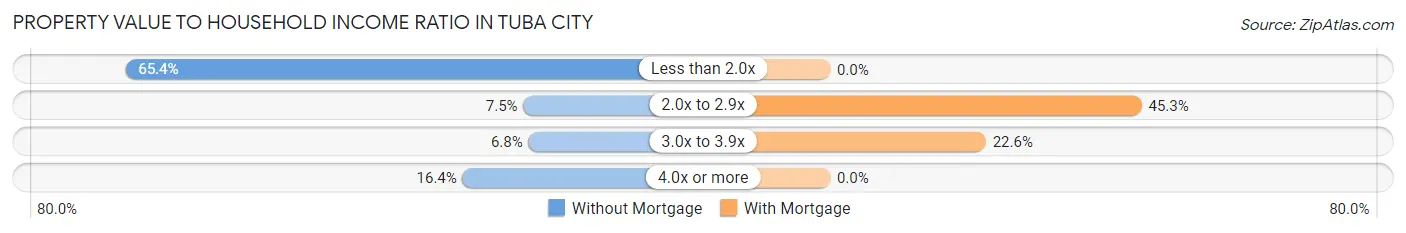
| Value-to-Income Ratio | Without Mortgage | With Mortgage |
| Less than 2.0x | 791 (65.4%) | 0 (0.0%) |
| 2.0x to 2.9x | 91 (7.5%) | 24 (45.3%) |
| 3.0x to 3.9x | 82 (6.8%) | 12 (22.6%) |
| 4.0x or more | 198 (16.4%) | 0 (0.0%) |
| Total | 1,210 (100.0%) | 53 (100.0%) |
Real Estate Taxes by Mortgage Status in Tuba City
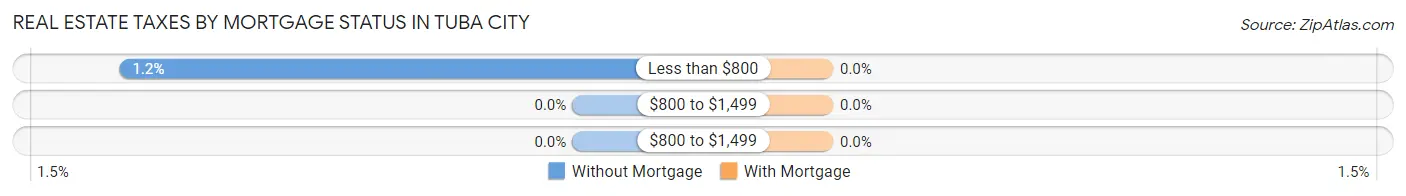
| Property Taxes | Without Mortgage | With Mortgage |
| Less than $800 | 15 (1.2%) | 0 (0.0%) |
| $800 to $1,499 | 0 (0.0%) | 0 (0.0%) |
| $800 to $1,499 | 0 (0.0%) | 0 (0.0%) |
| Total | 1,210 (100.0%) | 53 (100.0%) |
Health & Disability in Tuba City
Health Insurance Coverage by Age in Tuba City
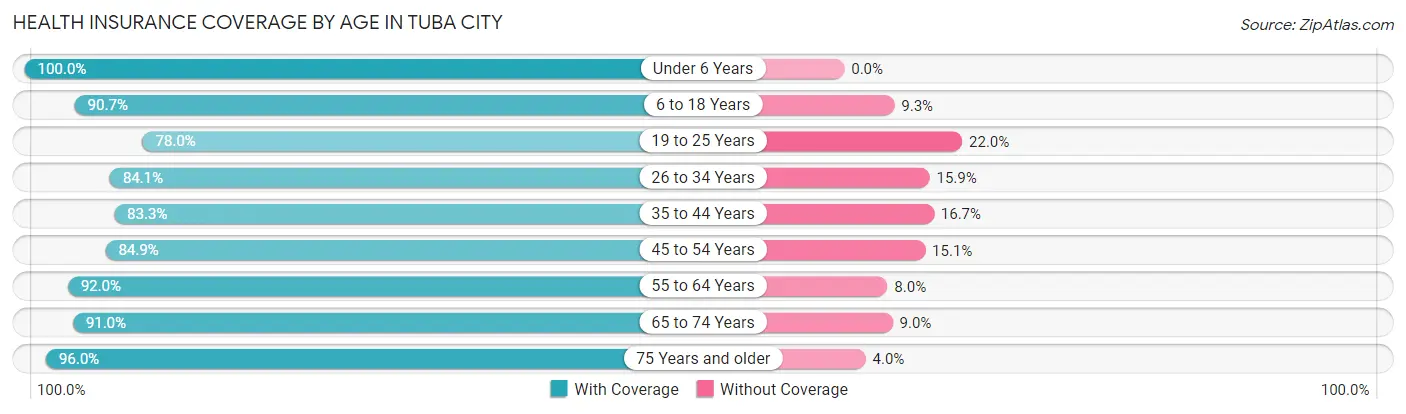
| Age Bracket | With Coverage | Without Coverage |
| Under 6 Years | 605 (100.0%) | 0 (0.0%) |
| 6 to 18 Years | 1,660 (90.7%) | 171 (9.3%) |
| 19 to 25 Years | 753 (78.0%) | 212 (22.0%) |
| 26 to 34 Years | 825 (84.1%) | 156 (15.9%) |
| 35 to 44 Years | 958 (83.3%) | 192 (16.7%) |
| 45 to 54 Years | 777 (84.9%) | 138 (15.1%) |
| 55 to 64 Years | 892 (92.0%) | 78 (8.0%) |
| 65 to 74 Years | 566 (91.0%) | 56 (9.0%) |
| 75 Years and older | 314 (96.0%) | 13 (4.0%) |
| Total | 7,350 (87.9%) | 1,016 (12.1%) |
Health Insurance Coverage by Citizenship Status in Tuba City
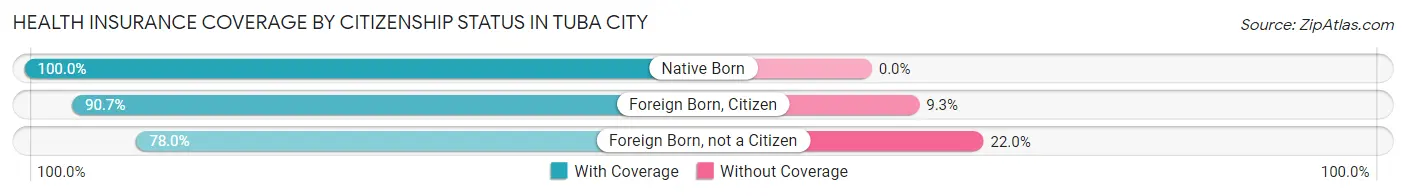
| Citizenship Status | With Coverage | Without Coverage |
| Native Born | 605 (100.0%) | 0 (0.0%) |
| Foreign Born, Citizen | 1,660 (90.7%) | 171 (9.3%) |
| Foreign Born, not a Citizen | 753 (78.0%) | 212 (22.0%) |
Health Insurance Coverage by Household Income in Tuba City
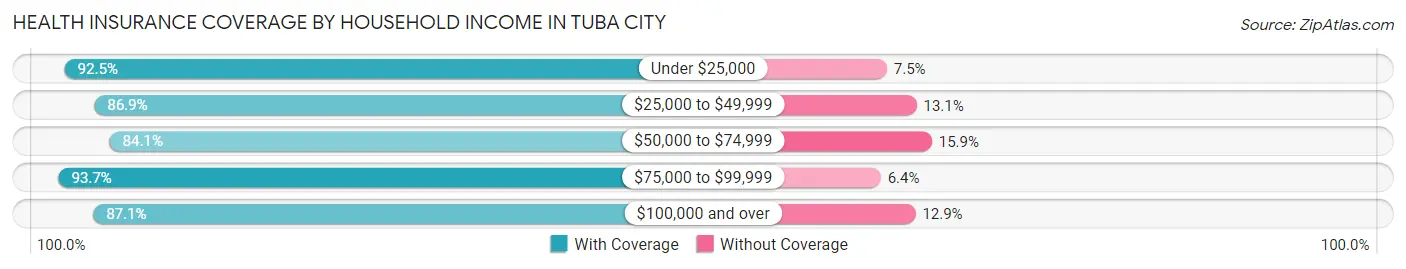
| Household Income | With Coverage | Without Coverage |
| Under $25,000 | 973 (92.5%) | 79 (7.5%) |
| $25,000 to $49,999 | 1,556 (86.9%) | 234 (13.1%) |
| $50,000 to $74,999 | 1,156 (84.1%) | 219 (15.9%) |
| $75,000 to $99,999 | 634 (93.6%) | 43 (6.4%) |
| $100,000 and over | 2,987 (87.1%) | 441 (12.9%) |
Public vs Private Health Insurance Coverage by Age in Tuba City
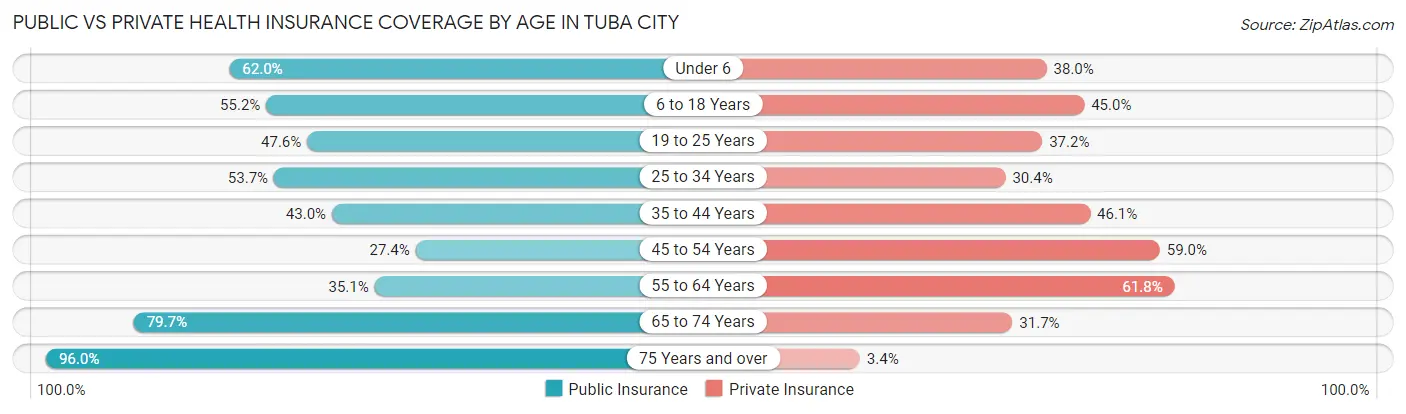
| Age Bracket | Public Insurance | Private Insurance |
| Under 6 | 375 (62.0%) | 230 (38.0%) |
| 6 to 18 Years | 1,010 (55.2%) | 824 (45.0%) |
| 19 to 25 Years | 459 (47.6%) | 359 (37.2%) |
| 25 to 34 Years | 527 (53.7%) | 298 (30.4%) |
| 35 to 44 Years | 494 (43.0%) | 530 (46.1%) |
| 45 to 54 Years | 251 (27.4%) | 540 (59.0%) |
| 55 to 64 Years | 340 (35.0%) | 599 (61.8%) |
| 65 to 74 Years | 496 (79.7%) | 197 (31.7%) |
| 75 Years and over | 314 (96.0%) | 11 (3.4%) |
| Total | 4,266 (51.0%) | 3,588 (42.9%) |
Disability Status by Sex by Age in Tuba City
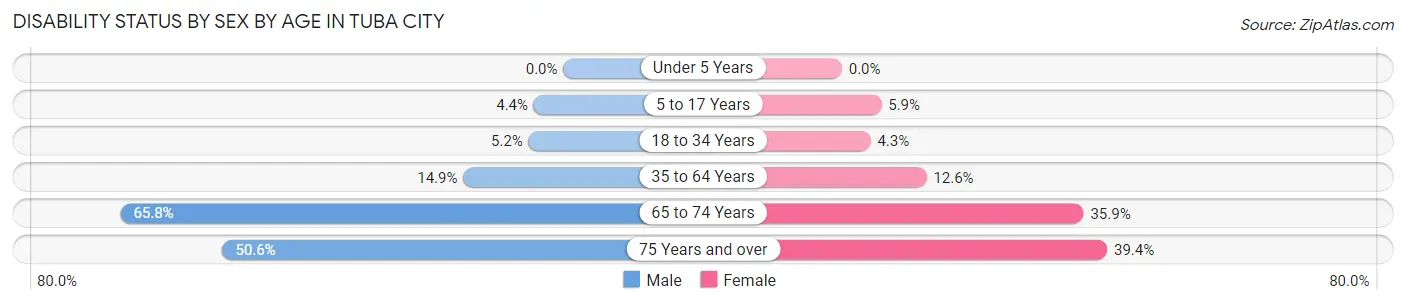
| Age Bracket | Male | Female |
| Under 5 Years | 0 (0.0%) | 0 (0.0%) |
| 5 to 17 Years | 38 (4.4%) | 55 (5.9%) |
| 18 to 34 Years | 50 (5.1%) | 47 (4.3%) |
| 35 to 64 Years | 191 (14.9%) | 220 (12.6%) |
| 65 to 74 Years | 169 (65.8%) | 131 (35.9%) |
| 75 Years and over | 82 (50.6%) | 65 (39.4%) |
Disability Class by Sex by Age in Tuba City
Disability Class: Hearing Difficulty
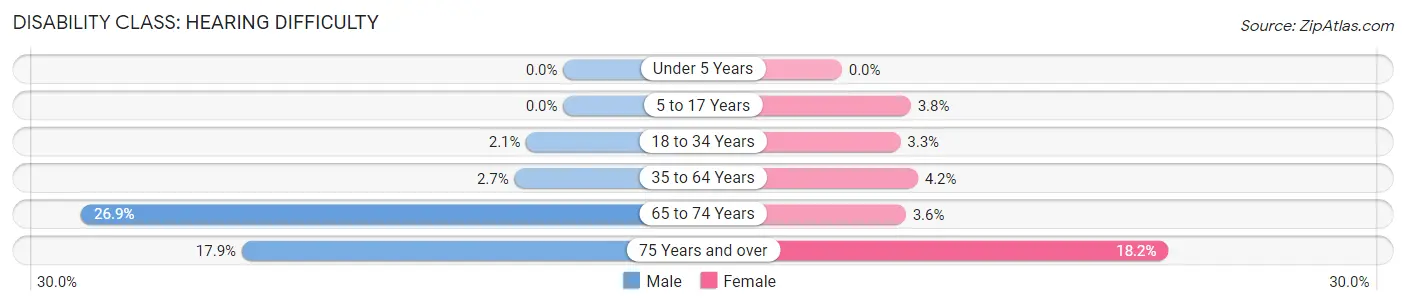
| Age Bracket | Male | Female |
| Under 5 Years | 0 (0.0%) | 0 (0.0%) |
| 5 to 17 Years | 0 (0.0%) | 36 (3.8%) |
| 18 to 34 Years | 20 (2.1%) | 36 (3.3%) |
| 35 to 64 Years | 35 (2.7%) | 74 (4.2%) |
| 65 to 74 Years | 69 (26.9%) | 13 (3.6%) |
| 75 Years and over | 29 (17.9%) | 30 (18.2%) |
Disability Class: Vision Difficulty
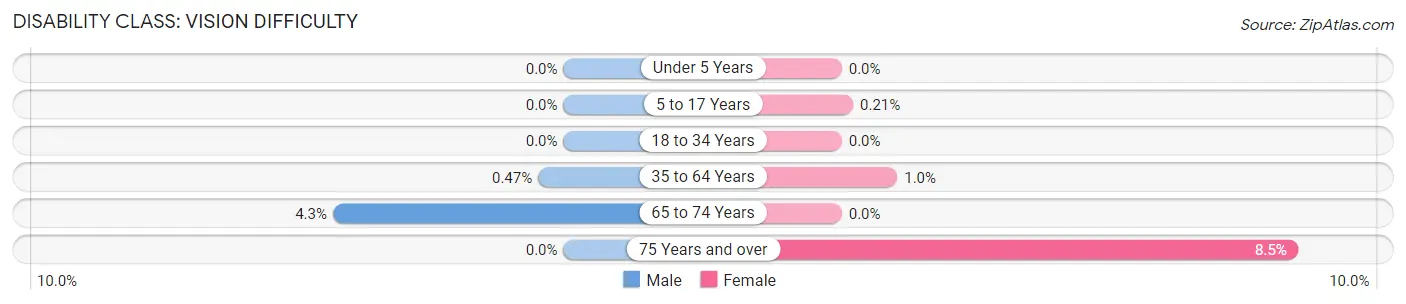
| Age Bracket | Male | Female |
| Under 5 Years | 0 (0.0%) | 0 (0.0%) |
| 5 to 17 Years | 0 (0.0%) | 2 (0.2%) |
| 18 to 34 Years | 0 (0.0%) | 0 (0.0%) |
| 35 to 64 Years | 6 (0.5%) | 18 (1.0%) |
| 65 to 74 Years | 11 (4.3%) | 0 (0.0%) |
| 75 Years and over | 0 (0.0%) | 14 (8.5%) |
Disability Class: Cognitive Difficulty
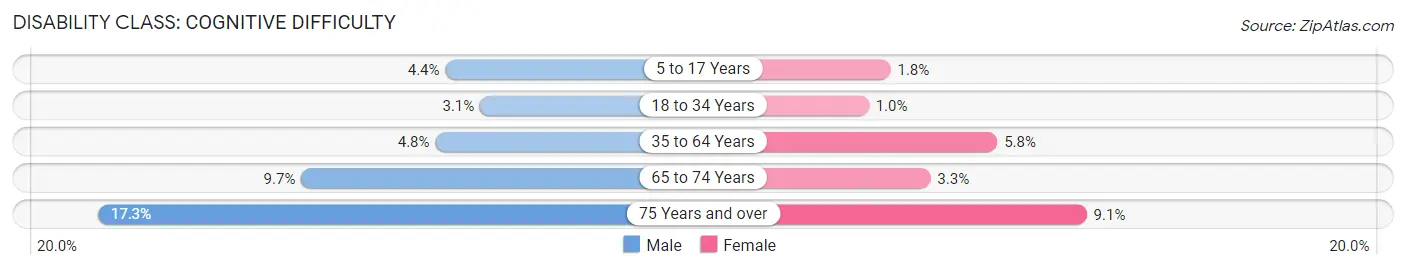
| Age Bracket | Male | Female |
| 5 to 17 Years | 38 (4.4%) | 17 (1.8%) |
| 18 to 34 Years | 30 (3.1%) | 11 (1.0%) |
| 35 to 64 Years | 61 (4.8%) | 101 (5.8%) |
| 65 to 74 Years | 25 (9.7%) | 12 (3.3%) |
| 75 Years and over | 28 (17.3%) | 15 (9.1%) |
Disability Class: Ambulatory Difficulty
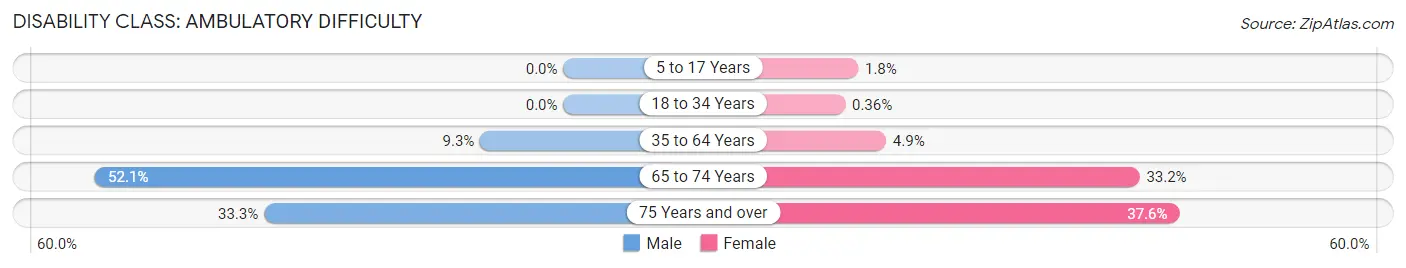
| Age Bracket | Male | Female |
| 5 to 17 Years | 0 (0.0%) | 17 (1.8%) |
| 18 to 34 Years | 0 (0.0%) | 4 (0.4%) |
| 35 to 64 Years | 119 (9.3%) | 86 (4.9%) |
| 65 to 74 Years | 134 (52.1%) | 121 (33.2%) |
| 75 Years and over | 54 (33.3%) | 62 (37.6%) |
Disability Class: Self-Care Difficulty
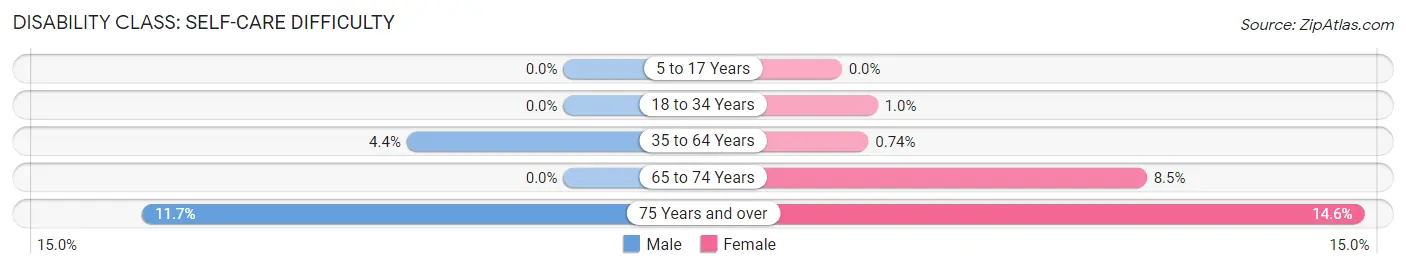
| Age Bracket | Male | Female |
| 5 to 17 Years | 0 (0.0%) | 0 (0.0%) |
| 18 to 34 Years | 0 (0.0%) | 11 (1.0%) |
| 35 to 64 Years | 56 (4.4%) | 13 (0.7%) |
| 65 to 74 Years | 0 (0.0%) | 31 (8.5%) |
| 75 Years and over | 19 (11.7%) | 24 (14.5%) |
Technology Access in Tuba City
Computing Device Access in Tuba City
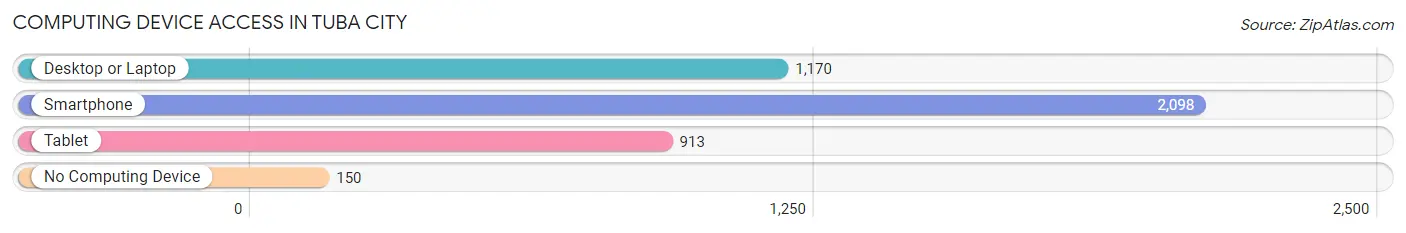
| Device Type | # Households | % Households |
| Desktop or Laptop | 1,170 | 51.5% |
| Smartphone | 2,098 | 92.3% |
| Tablet | 913 | 40.2% |
| No Computing Device | 150 | 6.6% |
| Total | 2,273 | 100.0% |
Internet Access in Tuba City
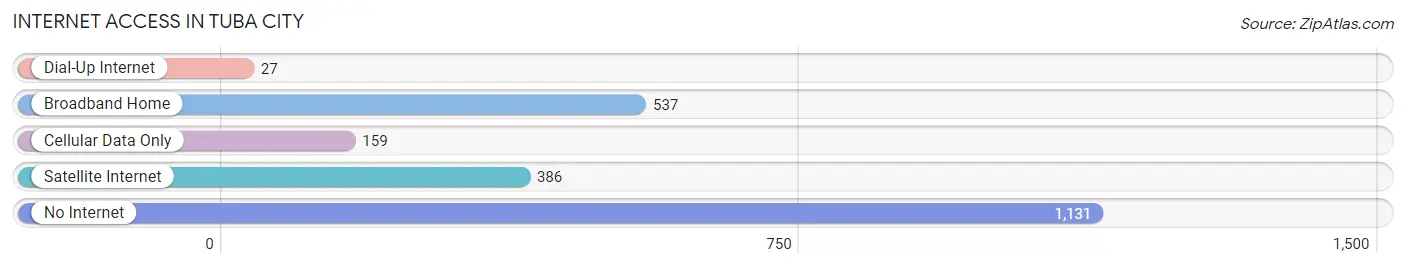
| Internet Type | # Households | % Households |
| Dial-Up Internet | 27 | 1.2% |
| Broadband Home | 537 | 23.6% |
| Cellular Data Only | 159 | 7.0% |
| Satellite Internet | 386 | 17.0% |
| No Internet | 1,131 | 49.8% |
| Total | 2,273 | 100.0% |
Tuba City Summary
Tuba City is a small town located in Coconino County, Arizona, United States. It is situated on the western edge of the Navajo Nation, near the Arizona-Utah border. The town is the largest community in the area and serves as the county seat of Coconino County. The population of Tuba City was 8,611 at the 2010 census.
History
Tuba City was established in 1872 as a trading post by the Mormon missionary Jacob Hamblin. The town was named after a Hopi chief, Tuuvi, who had befriended Hamblin. The town was originally located on the Navajo Reservation, but was moved to its current location in 1882.
Tuba City was an important stop on the historic Navajo Trail, which connected the Navajo Nation to the rest of the United States. The town was also a major stop on the Santa Fe Railroad, which ran through the area from 1882 to the early 1900s.
Geography
Tuba City is located in Coconino County, Arizona, at an elevation of 5,890 feet (1,795 m). The town is situated on the western edge of the Navajo Nation, near the Arizona-Utah border. The town is located in the Colorado Plateau region of the southwestern United States.
The town is located in a semi-arid desert climate, with hot summers and cold winters. The average annual precipitation is 8.5 inches (216 mm).
Economy
Tuba City is the largest community in the area and serves as the county seat of Coconino County. The town is home to a number of businesses, including a hospital, a grocery store, a bank, and a post office.
The town is also home to a number of tourist attractions, including the Navajo National Monument, the Tuba City Trading Post, and the Tuba City Dinosaur Tracks.
Demographics
As of the 2010 census, the population of Tuba City was 8,611. The racial makeup of the town was 57.3% Native American, 37.2% White, 0.7% Asian, 0.3% African American, 0.1% Pacific Islander, and 4.4% from other races.
The median household income in Tuba City was $30,938, and the median family income was $35,938. The per capita income was $14,938. About 24.3% of the population was below the poverty line.
Conclusion
Tuba City is a small town located in Coconino County, Arizona, United States. It is situated on the western edge of the Navajo Nation, near the Arizona-Utah border. The town is the largest community in the area and serves as the county seat of Coconino County. The population of Tuba City was 8,611 at the 2010 census. The town is home to a number of businesses, including a hospital, a grocery store, a bank, and a post office. The town is also home to a number of tourist attractions, including the Navajo National Monument, the Tuba City Trading Post, and the Tuba City Dinosaur Tracks. The racial makeup of the town was 57.3% Native American, 37.2% White, 0.7% Asian, 0.3% African American, 0.1% Pacific Islander, and 4.4% from other races. The median household income in Tuba City was $30,938, and the median family income was $35,938. The per capita income was $14,938. About 24.3% of the population was below the poverty line.
Common Questions
What is Per Capita Income in Tuba City?
Per Capita income in Tuba City is $22,240.
What is the Median Family Income in Tuba City?
Median Family Income in Tuba City is $69,093.
What is the Median Household income in Tuba City?
Median Household Income in Tuba City is $62,136.
What is Income or Wage Gap in Tuba City?
Income or Wage Gap in Tuba City is 0.7%.
Women in Tuba City earn 99.3 cents for every dollar earned by a man.
What is Family Income Deficit in Tuba City?
Family Income Deficit in Tuba City is $13,960.
Families that are below poverty line in Tuba City earn $13,960 less on average than the poverty threshold level.
What is Inequality or Gini Index in Tuba City?
Inequality or Gini Index in Tuba City is 0.42.
What is the Total Population of Tuba City?
Total Population of Tuba City is 8,372.
What is the Total Male Population of Tuba City?
Total Male Population of Tuba City is 3,772.
What is the Total Female Population of Tuba City?
Total Female Population of Tuba City is 4,600.
What is the Ratio of Males per 100 Females in Tuba City?
There are 82.00 Males per 100 Females in Tuba City.
What is the Ratio of Females per 100 Males in Tuba City?
There are 121.95 Females per 100 Males in Tuba City.
What is the Median Population Age in Tuba City?
Median Population Age in Tuba City is 34.2 Years.
What is the Average Family Size in Tuba City
Average Family Size in Tuba City is 4.3 People.
What is the Average Household Size in Tuba City
Average Household Size in Tuba City is 3.7 People.
How Large is the Labor Force in Tuba City?
There are 3,228 People in the Labor Forcein in Tuba City.
What is the Percentage of People in the Labor Force in Tuba City?
51.6% of People are in the Labor Force in Tuba City.
What is the Unemployment Rate in Tuba City?
Unemployment Rate in Tuba City is 10.4%.