Mazeppa, MN Map & Demographics
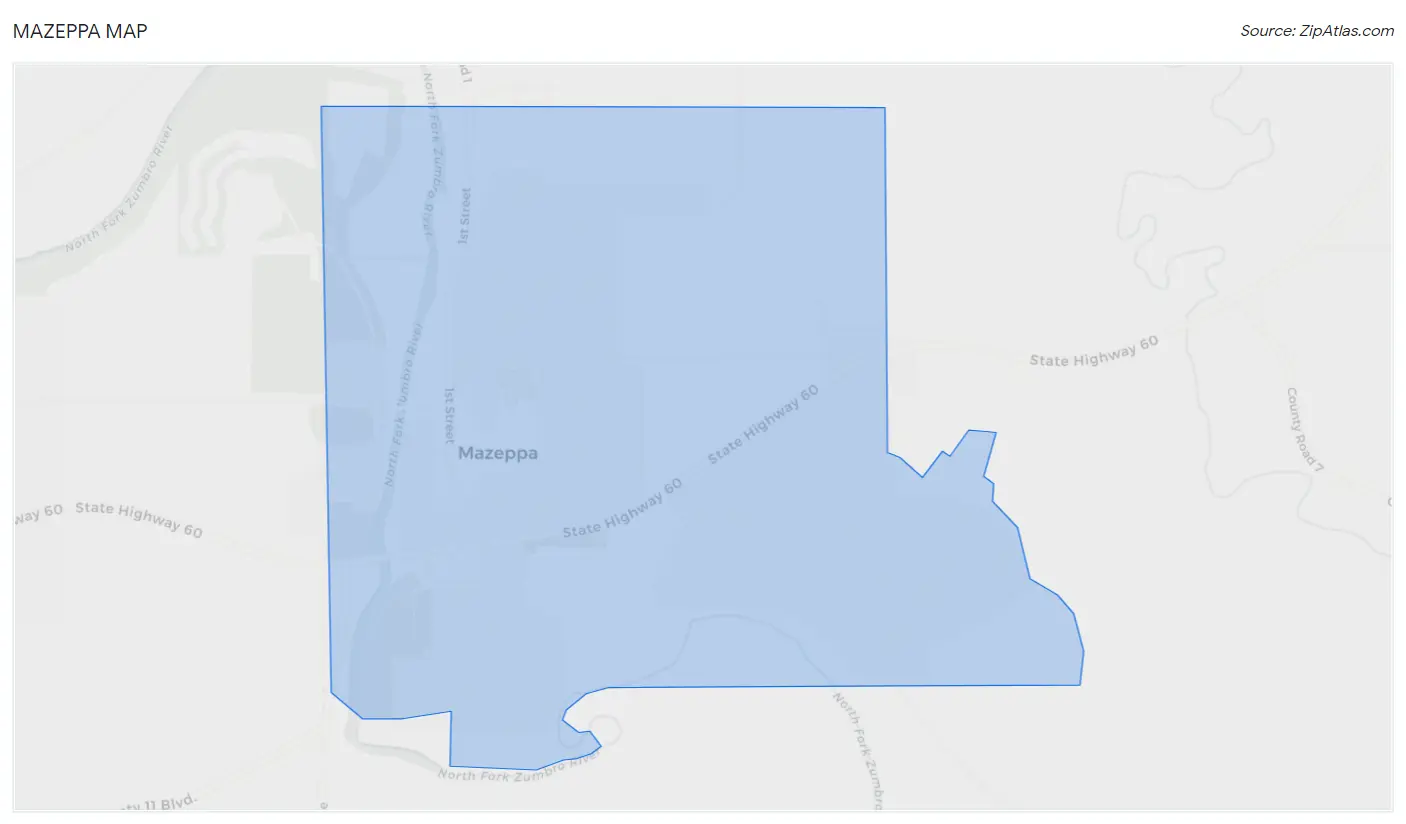
Mazeppa Map
Mazeppa Overview
$41,988
PER CAPITA INCOME
$91,875
AVG FAMILY INCOME
$84,917
AVG HOUSEHOLD INCOME
30.1%
WAGE / INCOME GAP [ % ]
69.9¢/ $1
WAGE / INCOME GAP [ $ ]
0.39
INEQUALITY / GINI INDEX
901
TOTAL POPULATION
475
MALE POPULATION
426
FEMALE POPULATION
111.50
MALES / 100 FEMALES
89.68
FEMALES / 100 MALES
44.8
MEDIAN AGE
2.7
AVG FAMILY SIZE
2.3
AVG HOUSEHOLD SIZE
485
LABOR FORCE [ PEOPLE ]
68.9%
PERCENT IN LABOR FORCE
3.7%
UNEMPLOYMENT RATE
Mazeppa Zip Codes
Mazeppa Area Codes
Income in Mazeppa
Income Overview in Mazeppa
Per Capita Income in Mazeppa is $41,988, while median incomes of families and households are $91,875 and $84,917 respectively.
| Characteristic | Number | Measure |
| Per Capita Income | 901 | $41,988 |
| Median Family Income | 254 | $91,875 |
| Mean Family Income | 254 | $114,907 |
| Median Household Income | 395 | $84,917 |
| Mean Household Income | 395 | $97,708 |
| Income Deficit | 254 | $0 |
| Wage / Income Gap (%) | 901 | 30.07% |
| Wage / Income Gap ($) | 901 | 69.93¢ per $1 |
| Gini / Inequality Index | 901 | 0.39 |
Earnings by Sex in Mazeppa
Average Earnings in Mazeppa are $51,406, $58,988 for men and $41,250 for women, a difference of 30.1%.
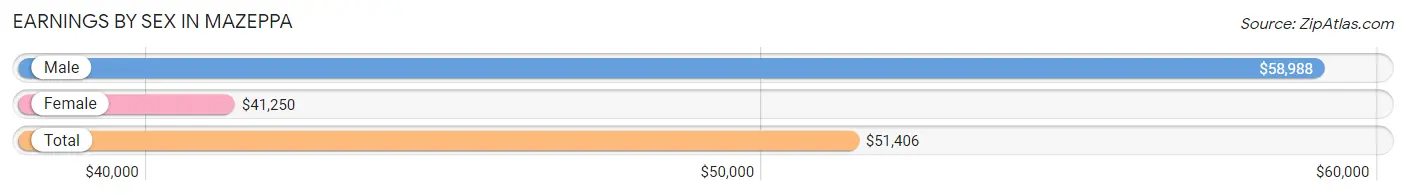
| Sex | Number | Average Earnings |
| Male | 285 (55.4%) | $58,988 |
| Female | 229 (44.6%) | $41,250 |
| Total | 514 (100.0%) | $51,406 |
Earnings by Sex by Income Bracket in Mazeppa
The most common earnings brackets in Mazeppa are $75,000 to $99,999 for men (56 | 19.7%) and $45,000 to $49,999 for women (31 | 13.5%).
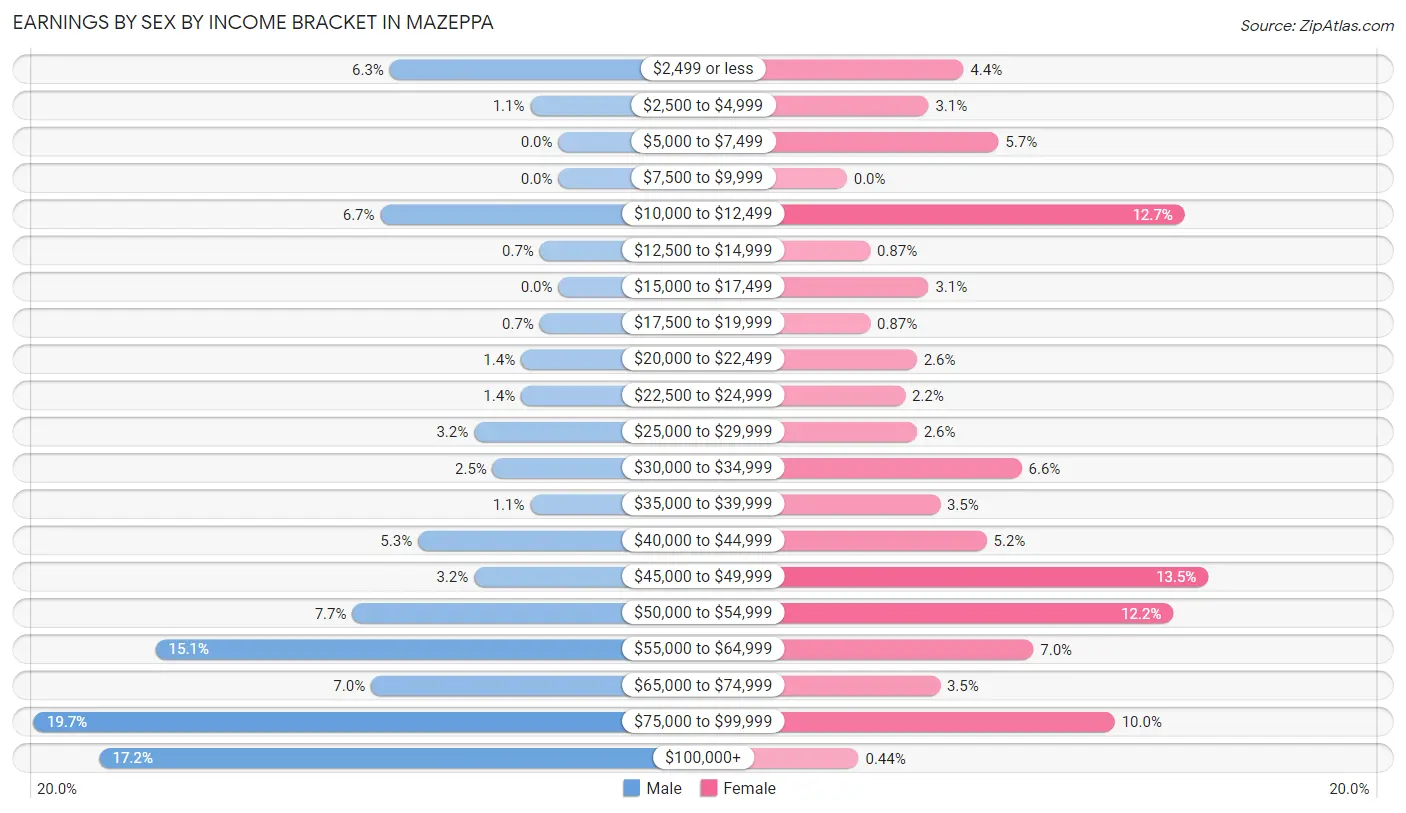
| Income | Male | Female |
| $2,499 or less | 18 (6.3%) | 10 (4.4%) |
| $2,500 to $4,999 | 3 (1.1%) | 7 (3.1%) |
| $5,000 to $7,499 | 0 (0.0%) | 13 (5.7%) |
| $7,500 to $9,999 | 0 (0.0%) | 0 (0.0%) |
| $10,000 to $12,499 | 19 (6.7%) | 29 (12.7%) |
| $12,500 to $14,999 | 2 (0.7%) | 2 (0.9%) |
| $15,000 to $17,499 | 0 (0.0%) | 7 (3.1%) |
| $17,500 to $19,999 | 2 (0.7%) | 2 (0.9%) |
| $20,000 to $22,499 | 4 (1.4%) | 6 (2.6%) |
| $22,500 to $24,999 | 4 (1.4%) | 5 (2.2%) |
| $25,000 to $29,999 | 9 (3.2%) | 6 (2.6%) |
| $30,000 to $34,999 | 7 (2.5%) | 15 (6.6%) |
| $35,000 to $39,999 | 3 (1.1%) | 8 (3.5%) |
| $40,000 to $44,999 | 15 (5.3%) | 12 (5.2%) |
| $45,000 to $49,999 | 9 (3.2%) | 31 (13.5%) |
| $50,000 to $54,999 | 22 (7.7%) | 28 (12.2%) |
| $55,000 to $64,999 | 43 (15.1%) | 16 (7.0%) |
| $65,000 to $74,999 | 20 (7.0%) | 8 (3.5%) |
| $75,000 to $99,999 | 56 (19.7%) | 23 (10.0%) |
| $100,000+ | 49 (17.2%) | 1 (0.4%) |
| Total | 285 (100.0%) | 229 (100.0%) |
Earnings by Sex by Educational Attainment in Mazeppa
Average earnings in Mazeppa are $59,706 for men and $42,083 for women, a difference of 29.5%. Men with an educational attainment of graduate degree enjoy the highest average annual earnings of $80,938, while those with bachelor's degree education earn the least with $55,833. Women with an educational attainment of bachelor's degree earn the most with the average annual earnings of $50,694, while those with less than high school education have the smallest earnings of $11,953.
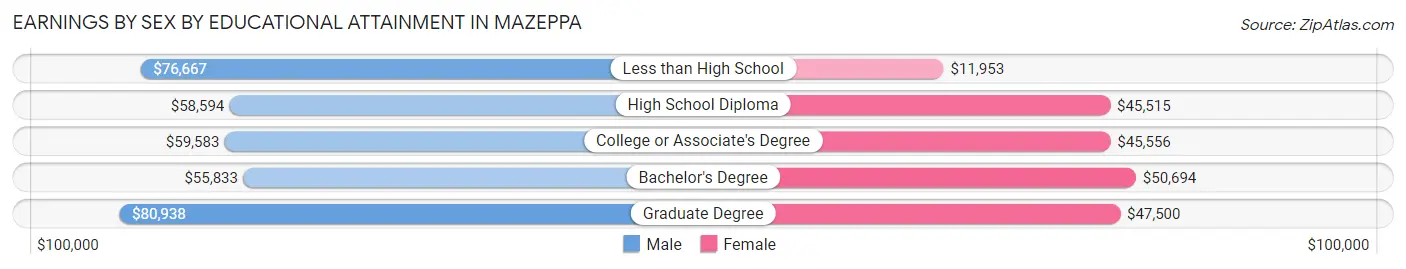
| Educational Attainment | Male Income | Female Income |
| Less than High School | $76,667 | $11,953 |
| High School Diploma | $58,594 | $45,515 |
| College or Associate's Degree | $59,583 | $45,556 |
| Bachelor's Degree | $55,833 | $50,694 |
| Graduate Degree | $80,938 | $47,500 |
| Total | $59,706 | $42,083 |
Family Income in Mazeppa
Family Income Brackets in Mazeppa
According to the Mazeppa family income data, there are 73 families falling into the $100,000 to $149,999 income range, which is the most common income bracket and makes up 28.7% of all families.
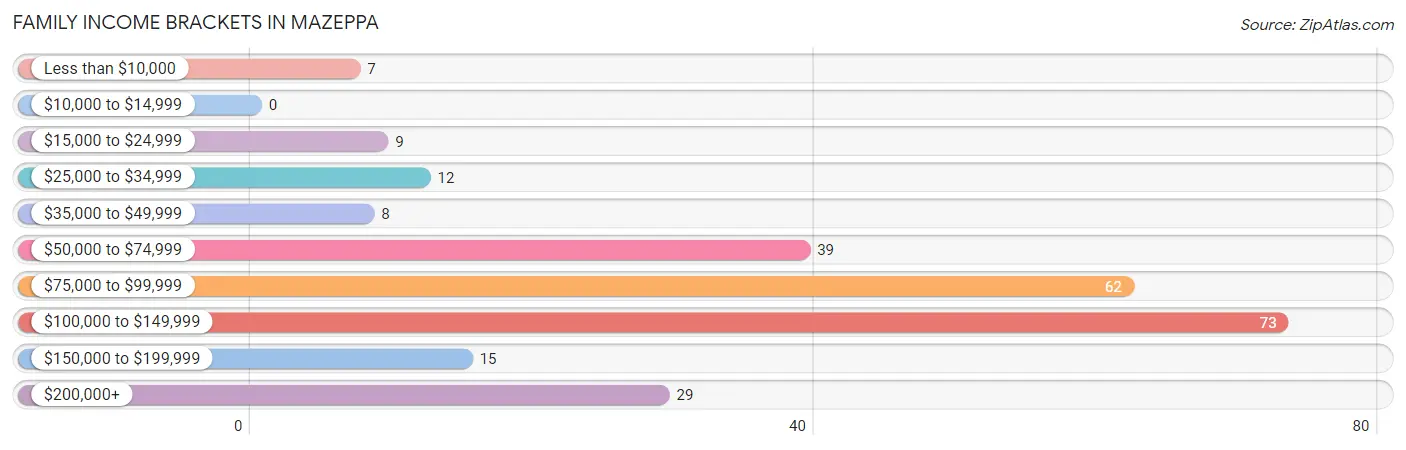
| Income Bracket | # Families | % Families |
| Less than $10,000 | 7 | 2.8% |
| $10,000 to $14,999 | 0 | 0.0% |
| $15,000 to $24,999 | 9 | 3.5% |
| $25,000 to $34,999 | 12 | 4.7% |
| $35,000 to $49,999 | 8 | 3.1% |
| $50,000 to $74,999 | 39 | 15.4% |
| $75,000 to $99,999 | 62 | 24.4% |
| $100,000 to $149,999 | 73 | 28.7% |
| $150,000 to $199,999 | 15 | 5.9% |
| $200,000+ | 29 | 11.4% |
Family Income by Famaliy Size in Mazeppa
3-person families (41 | 16.1%) account for the highest median family income in Mazeppa with $145,938 per family, while 3-person families (41 | 16.1%) have the highest median income of $48,646 per family member.
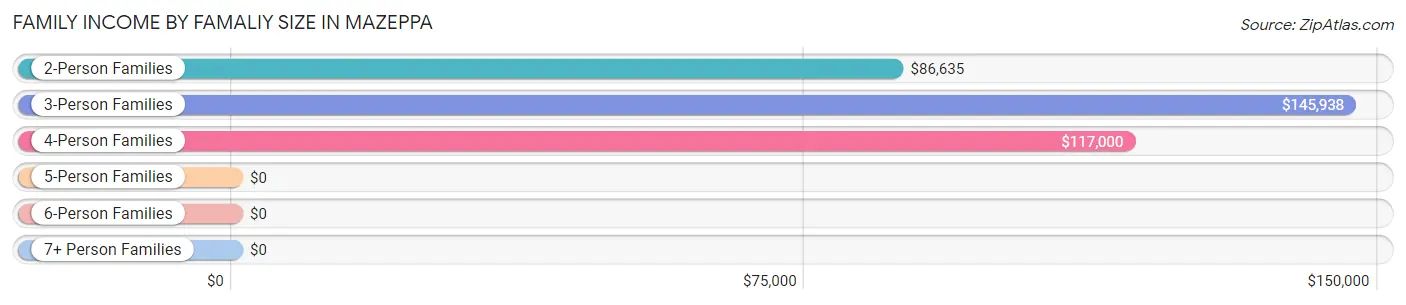
| Income Bracket | # Families | Median Income |
| 2-Person Families | 134 (52.8%) | $86,635 |
| 3-Person Families | 41 (16.1%) | $145,938 |
| 4-Person Families | 58 (22.8%) | $117,000 |
| 5-Person Families | 17 (6.7%) | $0 |
| 6-Person Families | 4 (1.6%) | $0 |
| 7+ Person Families | 0 (0.0%) | $0 |
| Total | 254 (100.0%) | $91,875 |
Family Income by Number of Earners in Mazeppa
The median family income in Mazeppa is $91,875, with families comprising 2 earners (112) having the highest median family income of $141,250, while families with no earners (33) have the lowest median family income of $60,417, accounting for 44.1% and 13.0% of families, respectively.
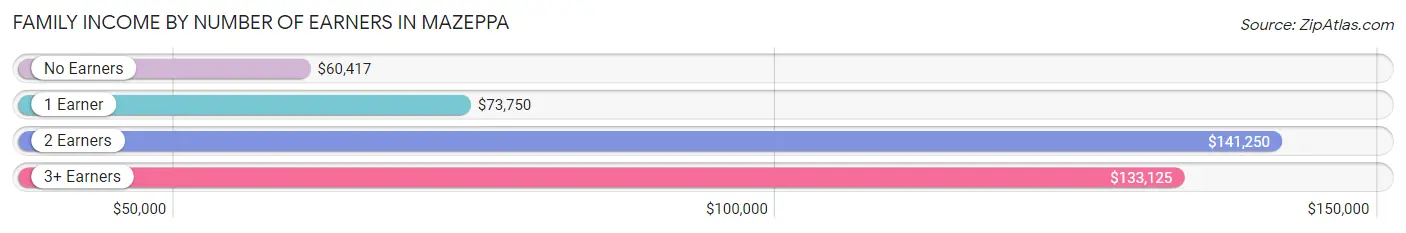
| Number of Earners | # Families | Median Income |
| No Earners | 33 (13.0%) | $60,417 |
| 1 Earner | 92 (36.2%) | $73,750 |
| 2 Earners | 112 (44.1%) | $141,250 |
| 3+ Earners | 17 (6.7%) | $133,125 |
| Total | 254 (100.0%) | $91,875 |
Household Income in Mazeppa
Household Income Brackets in Mazeppa
With 94 households falling in the category, the $75,000 to $99,999 income range is the most frequent in Mazeppa, accounting for 23.8% of all households. In contrast, only 9 households (2.3%) fall into the less than $10,000 income bracket, making it the least populous group.
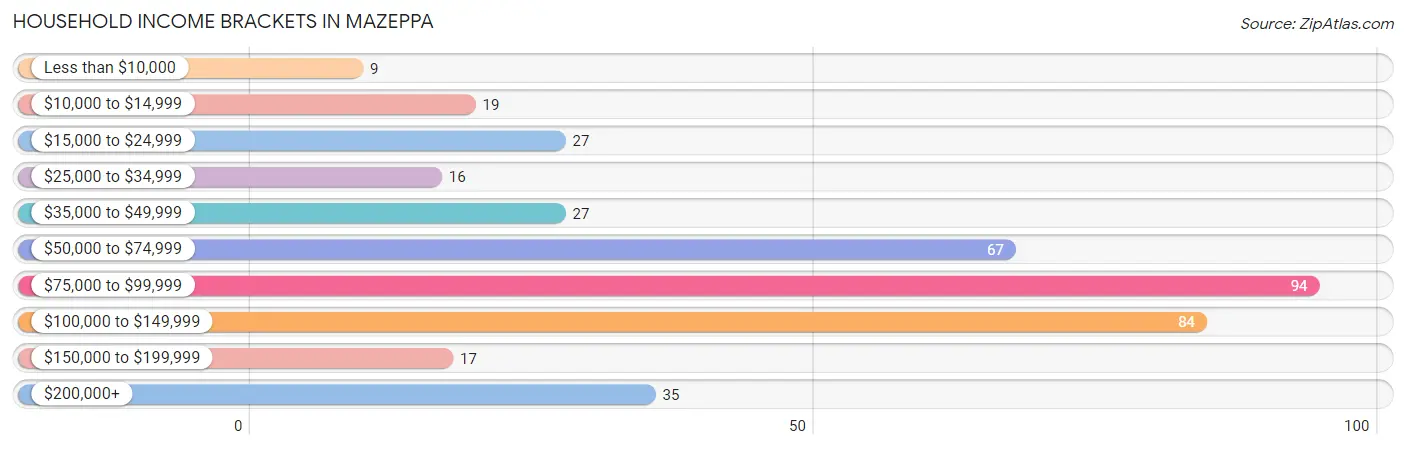
| Income Bracket | # Households | % Households |
| Less than $10,000 | 9 | 2.3% |
| $10,000 to $14,999 | 19 | 4.8% |
| $15,000 to $24,999 | 27 | 6.8% |
| $25,000 to $34,999 | 16 | 4.1% |
| $35,000 to $49,999 | 27 | 6.8% |
| $50,000 to $74,999 | 67 | 17.0% |
| $75,000 to $99,999 | 94 | 23.8% |
| $100,000 to $149,999 | 84 | 21.3% |
| $150,000 to $199,999 | 17 | 4.3% |
| $200,000+ | 35 | 8.9% |
Household Income by Householder Age in Mazeppa
The median household income in Mazeppa is $84,917, with the highest median household income of $103,214 found in the 25 to 44 years age bracket for the primary householder. A total of 120 households (30.4%) fall into this category. Meanwhile, the 15 to 24 years age bracket for the primary householder has the lowest median household income of $0, with 9 households (2.3%) in this group.
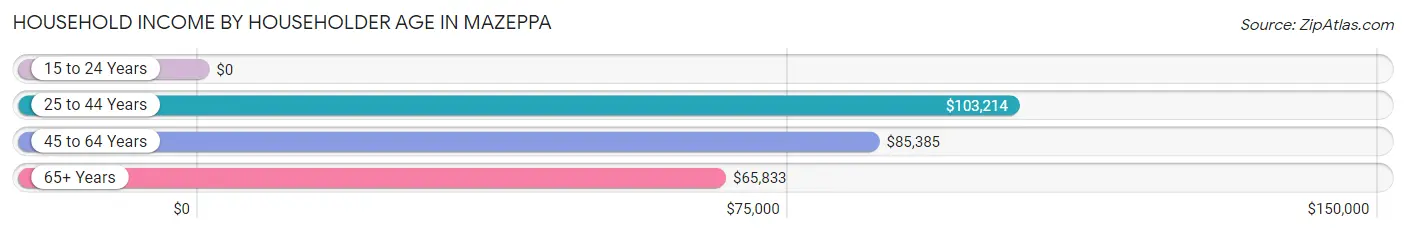
| Income Bracket | # Households | Median Income |
| 15 to 24 Years | 9 (2.3%) | $0 |
| 25 to 44 Years | 120 (30.4%) | $103,214 |
| 45 to 64 Years | 178 (45.1%) | $85,385 |
| 65+ Years | 88 (22.3%) | $65,833 |
| Total | 395 (100.0%) | $84,917 |
Poverty in Mazeppa
Income Below Poverty by Sex and Age in Mazeppa
With 11.2% poverty level for males and 18.3% for females among the residents of Mazeppa, 12 to 14 year old males and 18 to 24 year old females are the most vulnerable to poverty, with 9 males (40.9%) and 7 females (46.7%) in their respective age groups living below the poverty level.
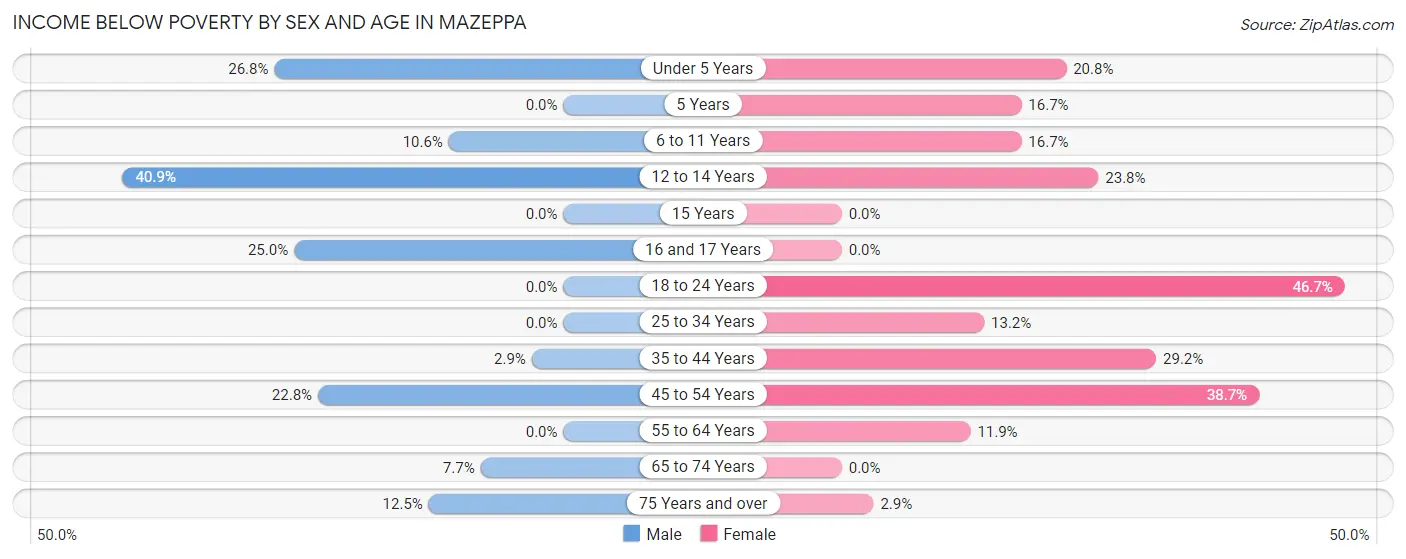
| Age Bracket | Male | Female |
| Under 5 Years | 11 (26.8%) | 5 (20.8%) |
| 5 Years | 0 (0.0%) | 2 (16.7%) |
| 6 to 11 Years | 5 (10.6%) | 5 (16.7%) |
| 12 to 14 Years | 9 (40.9%) | 5 (23.8%) |
| 15 Years | 0 (0.0%) | 0 (0.0%) |
| 16 and 17 Years | 2 (25.0%) | 0 (0.0%) |
| 18 to 24 Years | 0 (0.0%) | 7 (46.7%) |
| 25 to 34 Years | 0 (0.0%) | 7 (13.2%) |
| 35 to 44 Years | 2 (2.9%) | 14 (29.2%) |
| 45 to 54 Years | 18 (22.8%) | 24 (38.7%) |
| 55 to 64 Years | 0 (0.0%) | 8 (11.9%) |
| 65 to 74 Years | 2 (7.7%) | 0 (0.0%) |
| 75 Years and over | 4 (12.5%) | 1 (2.9%) |
| Total | 53 (11.2%) | 78 (18.3%) |
Income Above Poverty by Sex and Age in Mazeppa
According to the poverty statistics in Mazeppa, males aged 18 to 24 years and females aged 16 and 17 years are the age groups that are most secure financially, with 100.0% of males and 100.0% of females in these age groups living above the poverty line.
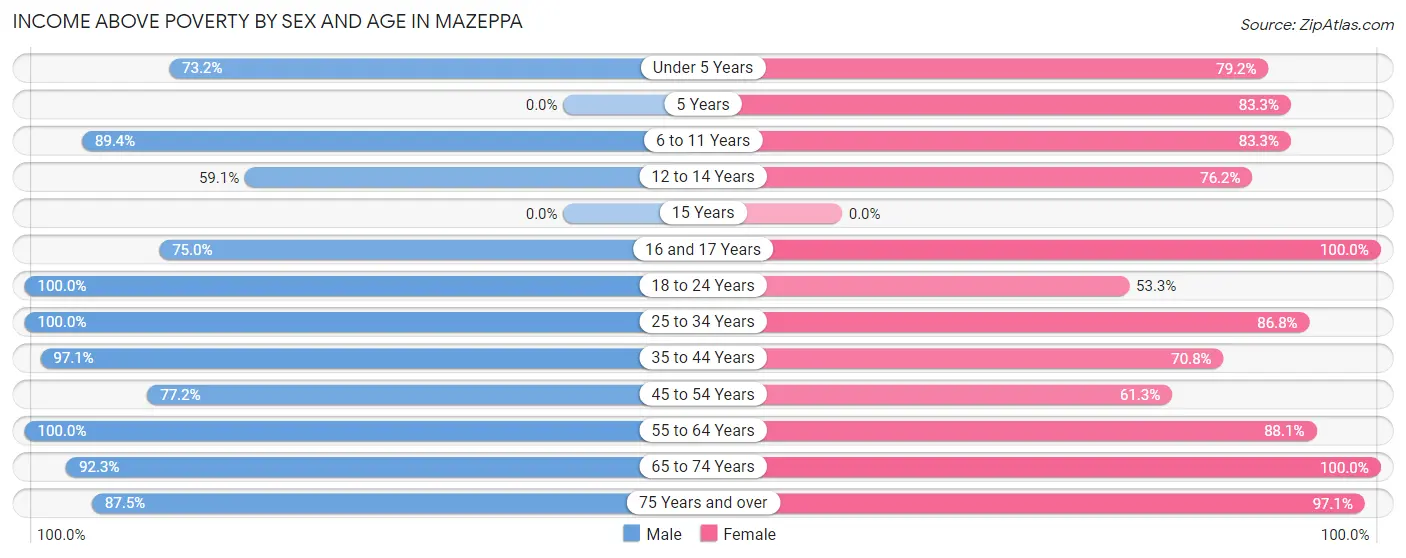
| Age Bracket | Male | Female |
| Under 5 Years | 30 (73.2%) | 19 (79.2%) |
| 5 Years | 0 (0.0%) | 10 (83.3%) |
| 6 to 11 Years | 42 (89.4%) | 25 (83.3%) |
| 12 to 14 Years | 13 (59.1%) | 16 (76.2%) |
| 15 Years | 0 (0.0%) | 0 (0.0%) |
| 16 and 17 Years | 6 (75.0%) | 7 (100.0%) |
| 18 to 24 Years | 17 (100.0%) | 8 (53.3%) |
| 25 to 34 Years | 41 (100.0%) | 46 (86.8%) |
| 35 to 44 Years | 66 (97.1%) | 34 (70.8%) |
| 45 to 54 Years | 61 (77.2%) | 38 (61.3%) |
| 55 to 64 Years | 94 (100.0%) | 59 (88.1%) |
| 65 to 74 Years | 24 (92.3%) | 53 (100.0%) |
| 75 Years and over | 28 (87.5%) | 33 (97.1%) |
| Total | 422 (88.8%) | 348 (81.7%) |
Income Below Poverty Among Married-Couple Families in Mazeppa
The poverty statistics for married-couple families in Mazeppa show that 1.0% or 2 of the total 202 families live below the poverty line. Families with 3 or 4 children have the highest poverty rate of 25.0%, comprising of 2 families. On the other hand, families with no children have the lowest poverty rate of 0.0%, which includes 0 families.
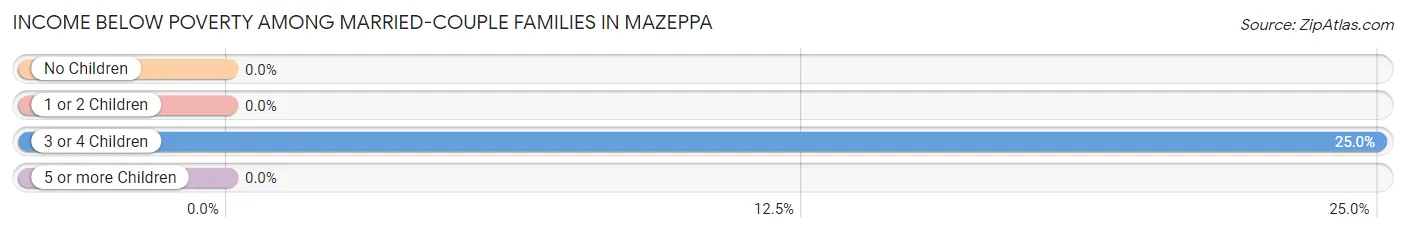
| Children | Above Poverty | Below Poverty |
| No Children | 127 (100.0%) | 0 (0.0%) |
| 1 or 2 Children | 67 (100.0%) | 0 (0.0%) |
| 3 or 4 Children | 6 (75.0%) | 2 (25.0%) |
| 5 or more Children | 0 (0.0%) | 0 (0.0%) |
| Total | 200 (99.0%) | 2 (1.0%) |
Income Below Poverty Among Single-Parent Households in Mazeppa
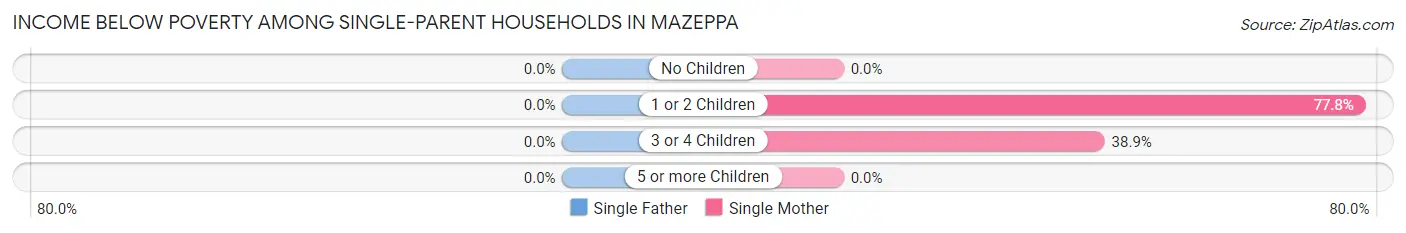
| Children | Single Father | Single Mother |
| No Children | 0 (0.0%) | 0 (0.0%) |
| 1 or 2 Children | 0 (0.0%) | 7 (77.8%) |
| 3 or 4 Children | 0 (0.0%) | 7 (38.9%) |
| 5 or more Children | 0 (0.0%) | 0 (0.0%) |
| Total | 0 (0.0%) | 14 (43.8%) |
Income Below Poverty Among Married-Couple vs Single-Parent Households in Mazeppa
The poverty data for Mazeppa shows that 2 of the married-couple family households (1.0%) and 14 of the single-parent households (26.9%) are living below the poverty level. Within the married-couple family households, those with 3 or 4 children have the highest poverty rate, with 2 households (25.0%) falling below the poverty line. Among the single-parent households, those with 3 or 4 children have the highest poverty rate, with 7 household (38.9%) living below poverty.
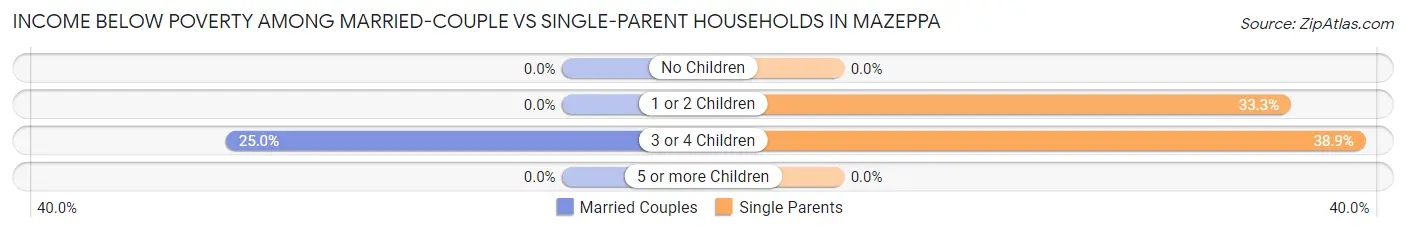
| Children | Married-Couple Families | Single-Parent Households |
| No Children | 0 (0.0%) | 0 (0.0%) |
| 1 or 2 Children | 0 (0.0%) | 7 (33.3%) |
| 3 or 4 Children | 2 (25.0%) | 7 (38.9%) |
| 5 or more Children | 0 (0.0%) | 0 (0.0%) |
| Total | 2 (1.0%) | 14 (26.9%) |
Race in Mazeppa
The most populous races in Mazeppa are White / Caucasian (858 | 95.2%), Hispanic or Latino (29 | 3.2%), and Two or more Races (17 | 1.9%).
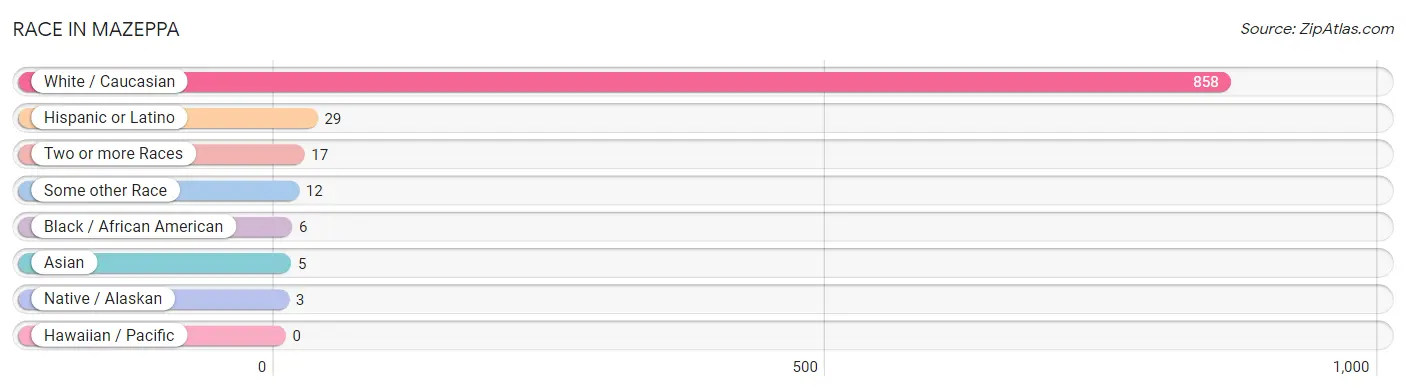
| Race | # Population | % Population |
| Asian | 5 | 0.5% |
| Black / African American | 6 | 0.7% |
| Hawaiian / Pacific | 0 | 0.0% |
| Hispanic or Latino | 29 | 3.2% |
| Native / Alaskan | 3 | 0.3% |
| White / Caucasian | 858 | 95.2% |
| Two or more Races | 17 | 1.9% |
| Some other Race | 12 | 1.3% |
| Total | 901 | 100.0% |
Ancestry in Mazeppa
The most populous ancestries reported in Mazeppa are German (336 | 37.3%), Norwegian (129 | 14.3%), Irish (99 | 11.0%), Swedish (58 | 6.4%), and Italian (35 | 3.9%), together accounting for 72.9% of all Mazeppa residents.
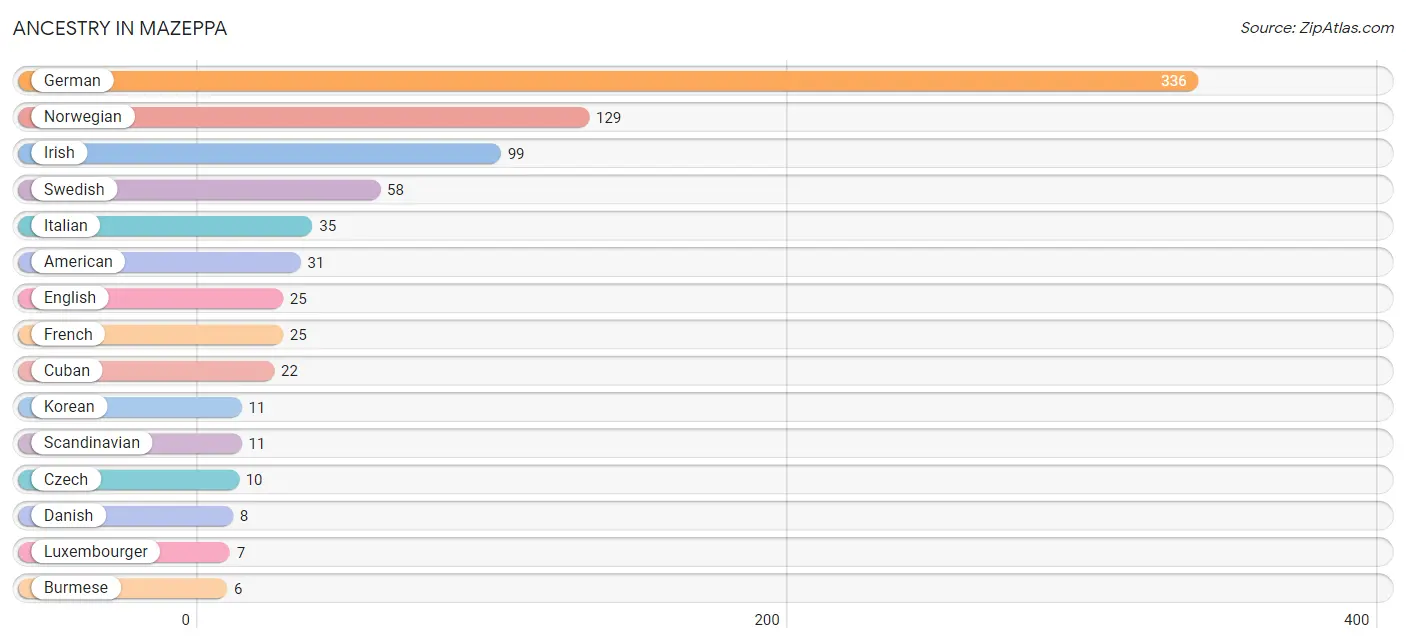
| Ancestry | # Population | % Population |
| American | 31 | 3.4% |
| Arab | 5 | 0.5% |
| Bhutanese | 5 | 0.5% |
| Burmese | 6 | 0.7% |
| Colombian | 1 | 0.1% |
| Cuban | 22 | 2.4% |
| Czech | 10 | 1.1% |
| Danish | 8 | 0.9% |
| Dutch | 6 | 0.7% |
| Egyptian | 5 | 0.5% |
| English | 25 | 2.8% |
| Finnish | 2 | 0.2% |
| French | 25 | 2.8% |
| German | 336 | 37.3% |
| Guamanian / Chamorro | 6 | 0.7% |
| Inupiat | 5 | 0.5% |
| Irish | 99 | 11.0% |
| Italian | 35 | 3.9% |
| Korean | 11 | 1.2% |
| Luxembourger | 7 | 0.8% |
| Nigerian | 5 | 0.5% |
| Norwegian | 129 | 14.3% |
| Peruvian | 3 | 0.3% |
| Polish | 5 | 0.5% |
| Scandinavian | 11 | 1.2% |
| Scotch-Irish | 2 | 0.2% |
| Scottish | 2 | 0.2% |
| South American | 4 | 0.4% |
| Spaniard | 3 | 0.3% |
| Subsaharan African | 5 | 0.5% |
| Swedish | 58 | 6.4% |
| Swiss | 4 | 0.4% |
| Tohono O'Odham | 3 | 0.3% |
| Ukrainian | 2 | 0.2% |
| Welsh | 3 | 0.3% | View All 35 Rows |
Immigrants in Mazeppa
The most numerous immigrant groups reported in Mazeppa came from Europe (11 | 1.2%), Netherlands (11 | 1.2%), Western Europe (11 | 1.2%), Africa (6 | 0.7%), and Eastern Africa (6 | 0.7%), together accounting for 5.0% of all Mazeppa residents.
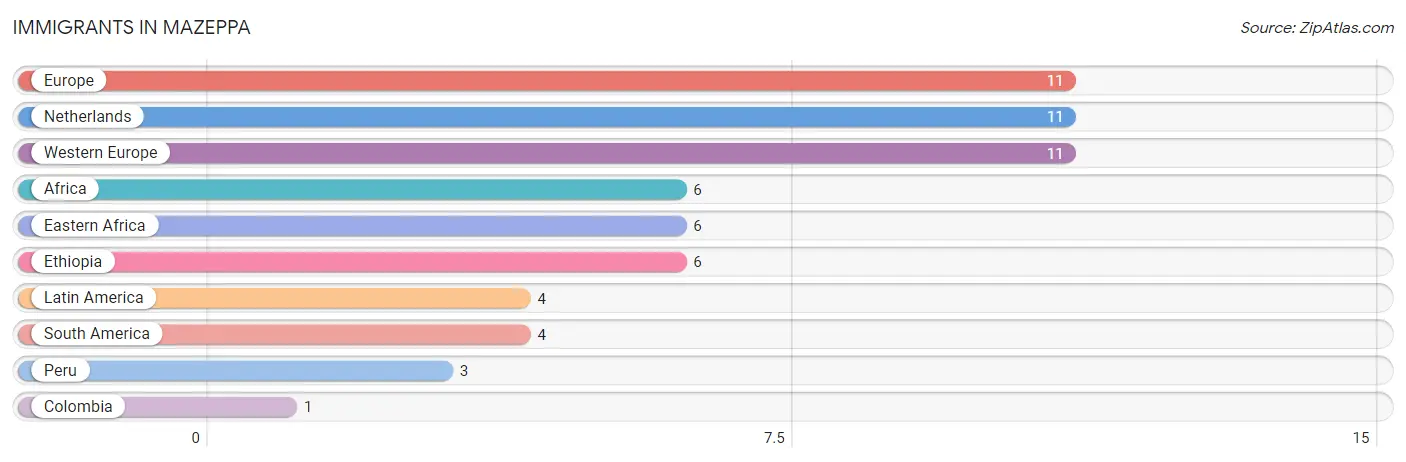
| Immigration Origin | # Population | % Population |
| Africa | 6 | 0.7% |
| Colombia | 1 | 0.1% |
| Eastern Africa | 6 | 0.7% |
| Ethiopia | 6 | 0.7% |
| Europe | 11 | 1.2% |
| Latin America | 4 | 0.4% |
| Netherlands | 11 | 1.2% |
| Peru | 3 | 0.3% |
| South America | 4 | 0.4% |
| Western Europe | 11 | 1.2% | View All 10 Rows |
Sex and Age in Mazeppa
Sex and Age in Mazeppa
The most populous age groups in Mazeppa are 60 to 64 Years (68 | 14.3%) for men and 10 to 14 Years (37 | 8.7%) for women.
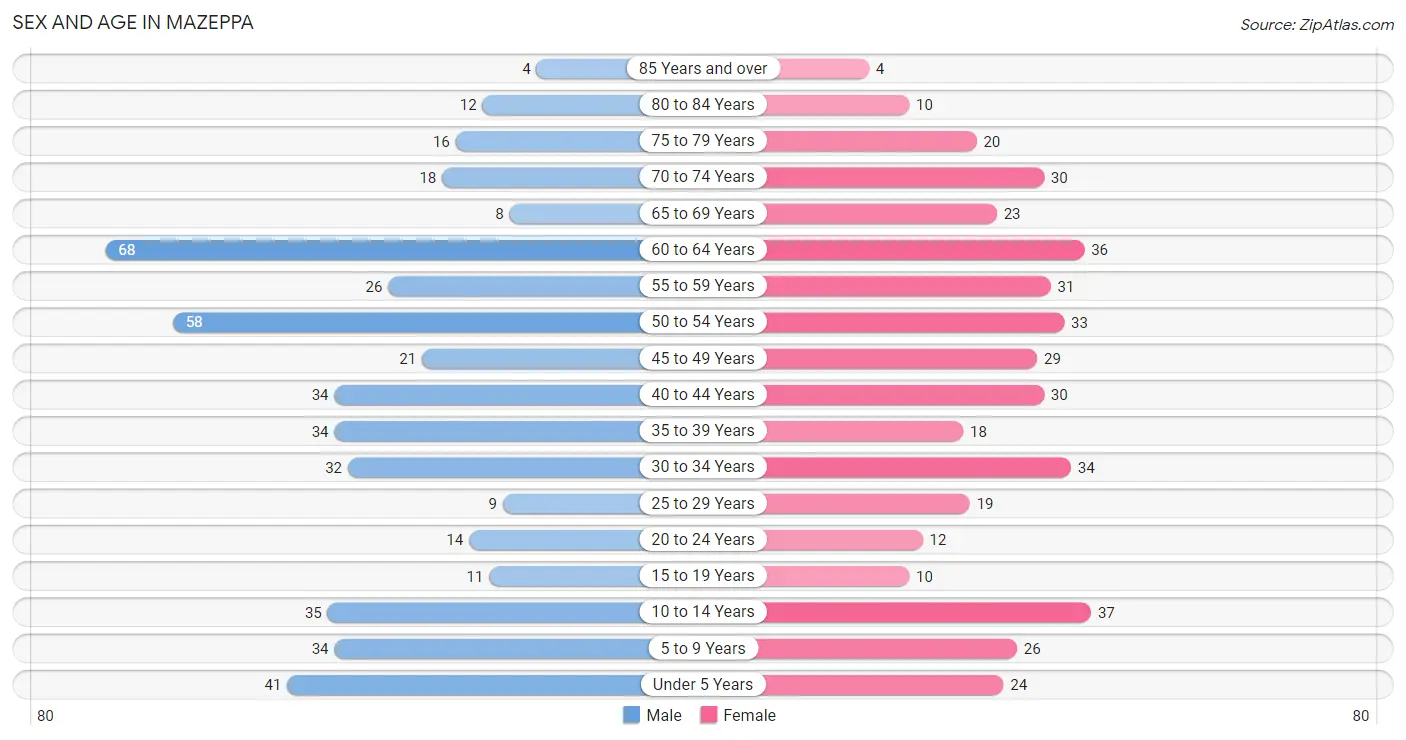
| Age Bracket | Male | Female |
| Under 5 Years | 41 (8.6%) | 24 (5.6%) |
| 5 to 9 Years | 34 (7.2%) | 26 (6.1%) |
| 10 to 14 Years | 35 (7.4%) | 37 (8.7%) |
| 15 to 19 Years | 11 (2.3%) | 10 (2.4%) |
| 20 to 24 Years | 14 (2.9%) | 12 (2.8%) |
| 25 to 29 Years | 9 (1.9%) | 19 (4.5%) |
| 30 to 34 Years | 32 (6.7%) | 34 (8.0%) |
| 35 to 39 Years | 34 (7.2%) | 18 (4.2%) |
| 40 to 44 Years | 34 (7.2%) | 30 (7.0%) |
| 45 to 49 Years | 21 (4.4%) | 29 (6.8%) |
| 50 to 54 Years | 58 (12.2%) | 33 (7.7%) |
| 55 to 59 Years | 26 (5.5%) | 31 (7.3%) |
| 60 to 64 Years | 68 (14.3%) | 36 (8.5%) |
| 65 to 69 Years | 8 (1.7%) | 23 (5.4%) |
| 70 to 74 Years | 18 (3.8%) | 30 (7.0%) |
| 75 to 79 Years | 16 (3.4%) | 20 (4.7%) |
| 80 to 84 Years | 12 (2.5%) | 10 (2.4%) |
| 85 Years and over | 4 (0.8%) | 4 (0.9%) |
| Total | 475 (100.0%) | 426 (100.0%) |
Families and Households in Mazeppa
Median Family Size in Mazeppa
The median family size in Mazeppa is 2.74 persons per family, with single female/mother families (32 | 12.6%) accounting for the largest median family size of 3.34 persons per family. On the other hand, single male/father families (20 | 7.9%) represent the smallest median family size with 2.30 persons per family.
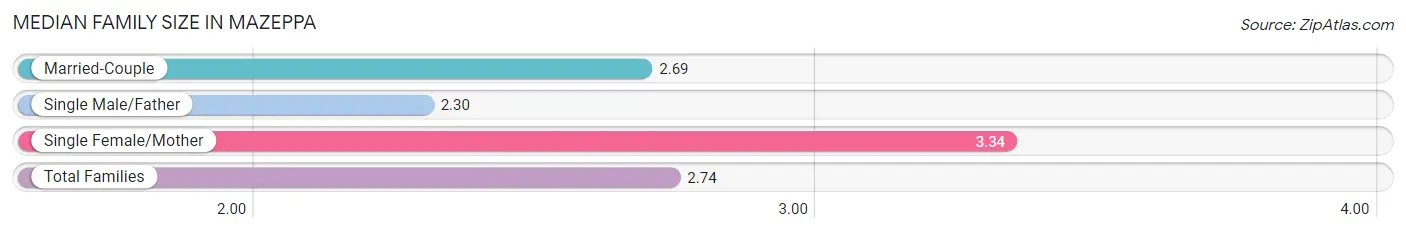
| Family Type | # Families | Family Size |
| Married-Couple | 202 (79.5%) | 2.69 |
| Single Male/Father | 20 (7.9%) | 2.30 |
| Single Female/Mother | 32 (12.6%) | 3.34 |
| Total Families | 254 (100.0%) | 2.74 |
Median Household Size in Mazeppa
The median household size in Mazeppa is 2.28 persons per household, with single female/mother households (32 | 8.1%) accounting for the largest median household size of 3.59 persons per household. non-family households (141 | 35.7%) represent the smallest median household size with 1.31 persons per household.
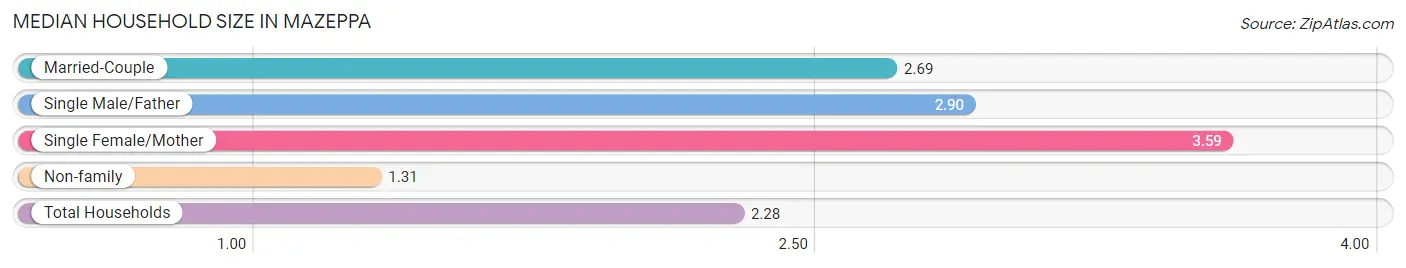
| Household Type | # Households | Household Size |
| Married-Couple | 202 (51.1%) | 2.69 |
| Single Male/Father | 20 (5.1%) | 2.90 |
| Single Female/Mother | 32 (8.1%) | 3.59 |
| Non-family | 141 (35.7%) | 1.31 |
| Total Households | 395 (100.0%) | 2.28 |
Household Size by Marriage Status in Mazeppa
Out of a total of 395 households in Mazeppa, 254 (64.3%) are family households, while 141 (35.7%) are nonfamily households. The most numerous type of family households are 2-person households, comprising 130, and the most common type of nonfamily households are 1-person households, comprising 96.
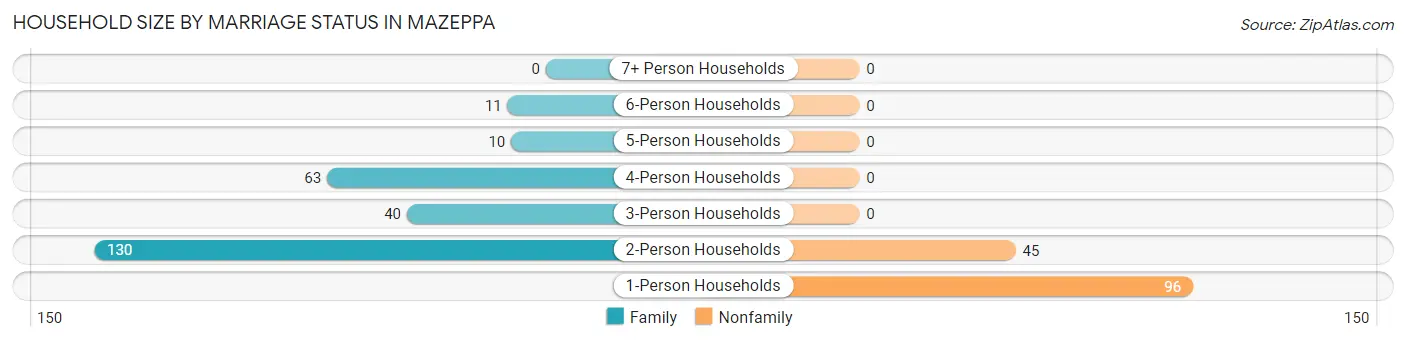
| Household Size | Family Households | Nonfamily Households |
| 1-Person Households | - | 96 (24.3%) |
| 2-Person Households | 130 (32.9%) | 45 (11.4%) |
| 3-Person Households | 40 (10.1%) | 0 (0.0%) |
| 4-Person Households | 63 (16.0%) | 0 (0.0%) |
| 5-Person Households | 10 (2.5%) | 0 (0.0%) |
| 6-Person Households | 11 (2.8%) | 0 (0.0%) |
| 7+ Person Households | 0 (0.0%) | 0 (0.0%) |
| Total | 254 (64.3%) | 141 (35.7%) |
Female Fertility in Mazeppa
Fertility by Age in Mazeppa
Average fertility rate in Mazeppa is 18.0 births per 1,000 women. Women in the age bracket of 20 to 34 years have the highest fertility rate with 46.0 births per 1,000 women. Women in the age bracket of 20 to 34 years acount for 100.0% of all women with births.
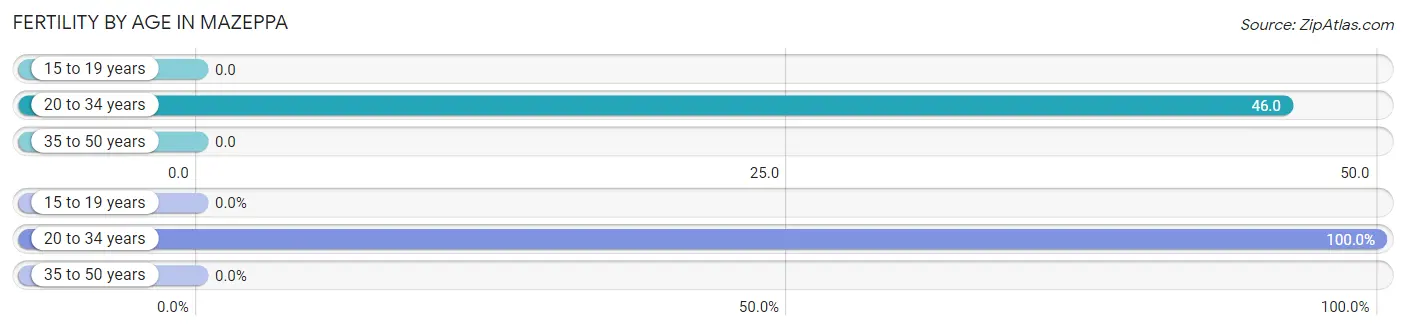
| Age Bracket | Women with Births | Births / 1,000 Women |
| 15 to 19 years | 0 (0.0%) | 0.0 |
| 20 to 34 years | 3 (100.0%) | 46.0 |
| 35 to 50 years | 0 (0.0%) | 0.0 |
| Total | 3 (100.0%) | 18.0 |
Fertility by Age by Marriage Status in Mazeppa
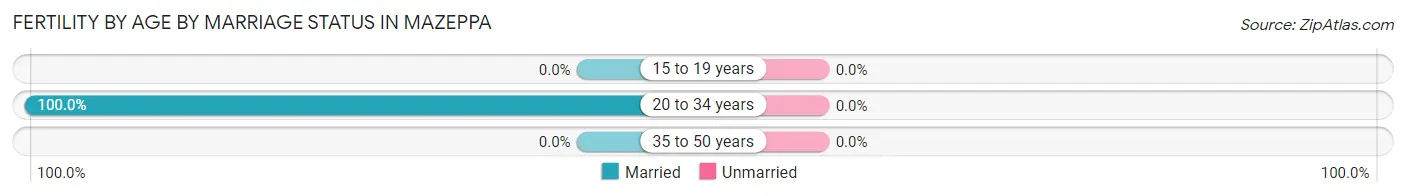
| Age Bracket | Married | Unmarried |
| 15 to 19 years | 0 (0.0%) | 0 (0.0%) |
| 20 to 34 years | 3 (100.0%) | 0 (0.0%) |
| 35 to 50 years | 0 (0.0%) | 0 (0.0%) |
| Total | 3 (100.0%) | 0 (0.0%) |
Fertility by Education in Mazeppa
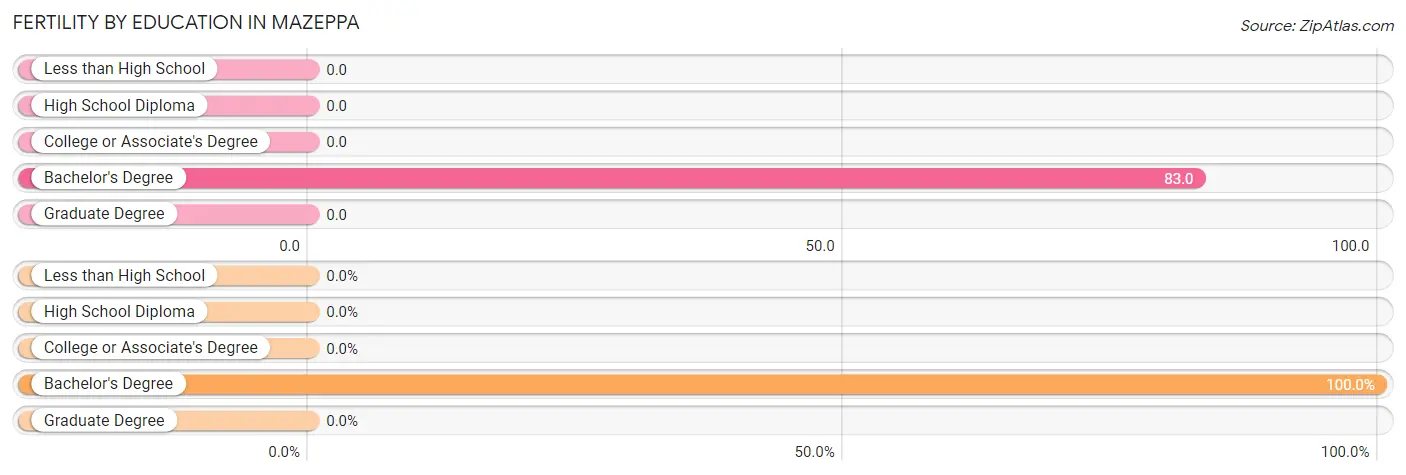
| Educational Attainment | Women with Births | Births / 1,000 Women |
| Less than High School | 0 (0.0%) | 0.0 |
| High School Diploma | 0 (0.0%) | 0.0 |
| College or Associate's Degree | 0 (0.0%) | 0.0 |
| Bachelor's Degree | 3 (100.0%) | 83.0 |
| Graduate Degree | 0 (0.0%) | 0.0 |
| Total | 3 (100.0%) | 18.0 |
Fertility by Education by Marriage Status in Mazeppa
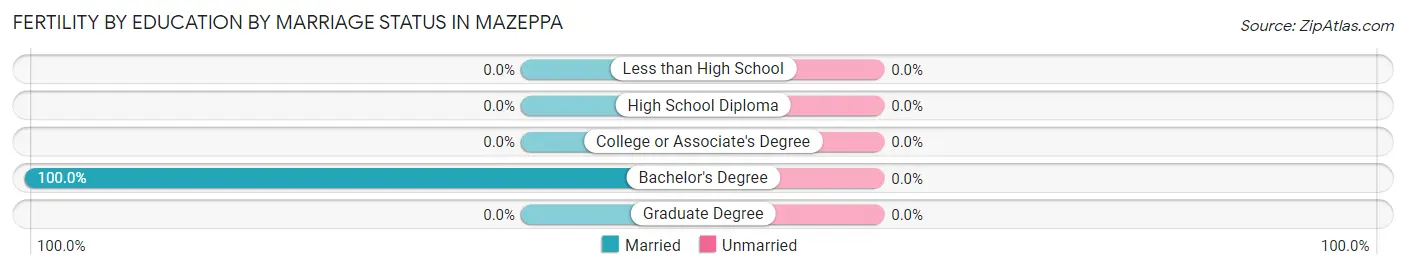
| Educational Attainment | Married | Unmarried |
| Less than High School | 0 (0.0%) | 0 (0.0%) |
| High School Diploma | 0 (0.0%) | 0 (0.0%) |
| College or Associate's Degree | 0 (0.0%) | 0 (0.0%) |
| Bachelor's Degree | 3 (100.0%) | 0 (0.0%) |
| Graduate Degree | 0 (0.0%) | 0 (0.0%) |
| Total | 3 (100.0%) | 0 (0.0%) |
Employment Characteristics in Mazeppa
Employment by Class of Employer in Mazeppa
Among the 465 employed individuals in Mazeppa, private company employees (299 | 64.3%), not-for-profit organizations (84 | 18.1%), and local government employees (39 | 8.4%) make up the most common classes of employment.
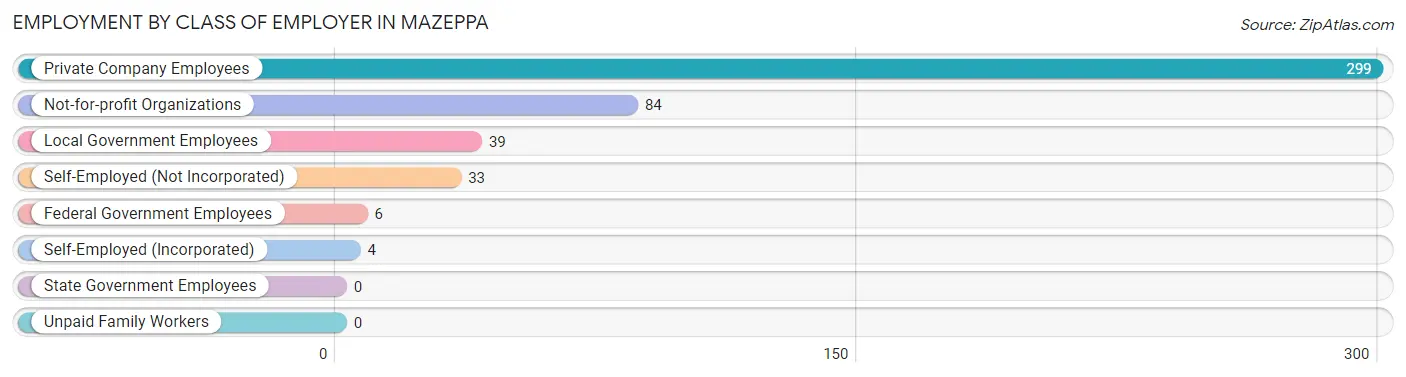
| Employer Class | # Employees | % Employees |
| Private Company Employees | 299 | 64.3% |
| Self-Employed (Incorporated) | 4 | 0.9% |
| Self-Employed (Not Incorporated) | 33 | 7.1% |
| Not-for-profit Organizations | 84 | 18.1% |
| Local Government Employees | 39 | 8.4% |
| State Government Employees | 0 | 0.0% |
| Federal Government Employees | 6 | 1.3% |
| Unpaid Family Workers | 0 | 0.0% |
| Total | 465 | 100.0% |
Employment Status by Age in Mazeppa
According to the labor force statistics for Mazeppa, out of the total population over 16 years of age (704), 68.9% or 485 individuals are in the labor force, with 3.7% or 18 of them unemployed. The age group with the highest labor force participation rate is 25 to 29 years, with 100.0% or 28 individuals in the labor force. Within the labor force, the 65 to 74 years age range has the highest percentage of unemployed individuals, with 20.0% or 4 of them being unemployed.
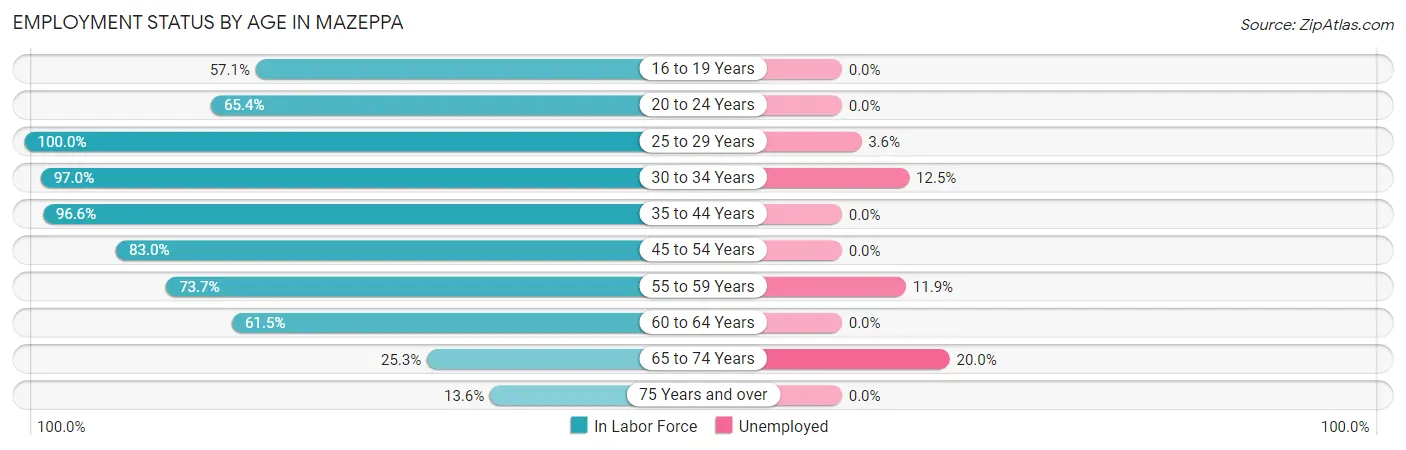
| Age Bracket | In Labor Force | Unemployed |
| 16 to 19 Years | 12 (57.1%) | 0 (0.0%) |
| 20 to 24 Years | 17 (65.4%) | 0 (0.0%) |
| 25 to 29 Years | 28 (100.0%) | 1 (3.6%) |
| 30 to 34 Years | 64 (97.0%) | 8 (12.5%) |
| 35 to 44 Years | 112 (96.6%) | 0 (0.0%) |
| 45 to 54 Years | 117 (83.0%) | 0 (0.0%) |
| 55 to 59 Years | 42 (73.7%) | 5 (11.9%) |
| 60 to 64 Years | 64 (61.5%) | 0 (0.0%) |
| 65 to 74 Years | 20 (25.3%) | 4 (20.0%) |
| 75 Years and over | 9 (13.6%) | 0 (0.0%) |
| Total | 485 (68.9%) | 18 (3.7%) |
Employment Status by Educational Attainment in Mazeppa
According to labor force statistics for Mazeppa, 83.4% of individuals (427) out of the total population between 25 and 64 years of age (512) are in the labor force, with 3.3% or 14 of them being unemployed. The group with the highest labor force participation rate are those with the educational attainment of bachelor's degree or higher, with 95.8% or 92 individuals in the labor force. Within the labor force, individuals with less than high school education have the highest percentage of unemployment, with 9.3% or 5 of them being unemployed.
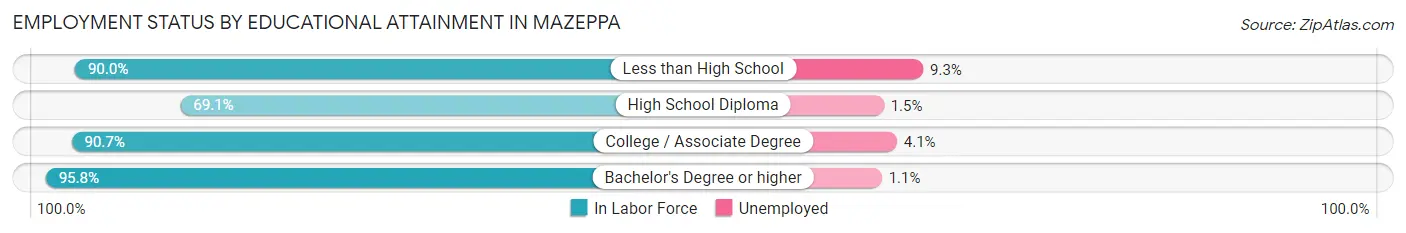
| Educational Attainment | In Labor Force | Unemployed |
| Less than High School | 54 (90.0%) | 6 (9.3%) |
| High School Diploma | 134 (69.1%) | 3 (1.5%) |
| College / Associate Degree | 147 (90.7%) | 7 (4.1%) |
| Bachelor's Degree or higher | 92 (95.8%) | 1 (1.1%) |
| Total | 427 (83.4%) | 17 (3.3%) |
Employment Occupations by Sex in Mazeppa
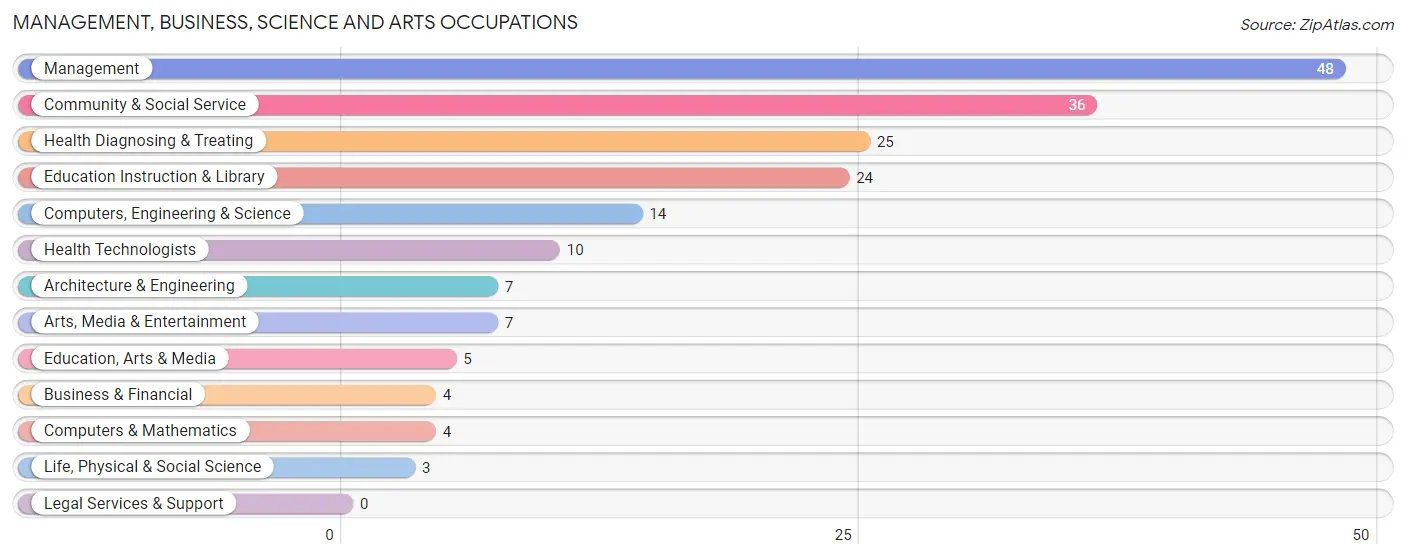
Management, Business, Science and Arts Occupations
The most common Management, Business, Science and Arts occupations in Mazeppa are Management (48 | 10.3%), Community & Social Service (36 | 7.7%), Health Diagnosing & Treating (25 | 5.4%), Education Instruction & Library (24 | 5.2%), and Computers, Engineering & Science (14 | 3.0%).
Management, Business, Science and Arts Occupations by Sex
Within the Management, Business, Science and Arts occupations in Mazeppa, the most male-oriented occupations are Architecture & Engineering (100.0%), Life, Physical & Social Science (100.0%), and Computers, Engineering & Science (92.9%), while the most female-oriented occupations are Health Technologists (100.0%), Education Instruction & Library (87.5%), and Health Diagnosing & Treating (84.0%).
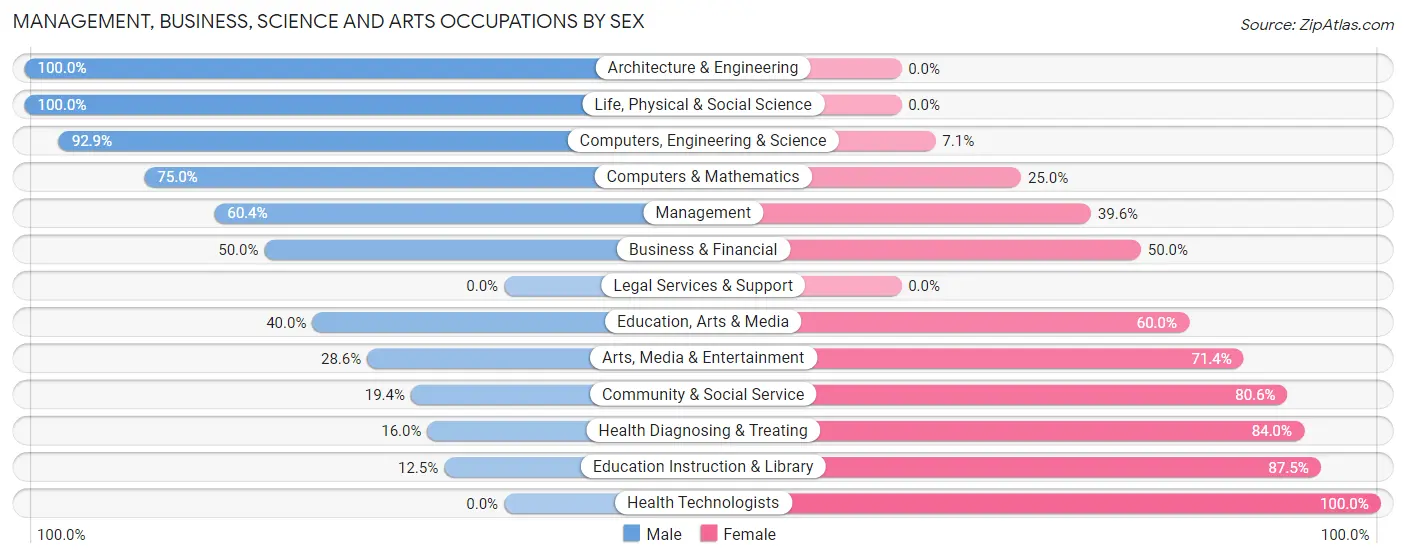
| Occupation | Male | Female |
| Management | 29 (60.4%) | 19 (39.6%) |
| Business & Financial | 2 (50.0%) | 2 (50.0%) |
| Computers, Engineering & Science | 13 (92.9%) | 1 (7.1%) |
| Computers & Mathematics | 3 (75.0%) | 1 (25.0%) |
| Architecture & Engineering | 7 (100.0%) | 0 (0.0%) |
| Life, Physical & Social Science | 3 (100.0%) | 0 (0.0%) |
| Community & Social Service | 7 (19.4%) | 29 (80.6%) |
| Education, Arts & Media | 2 (40.0%) | 3 (60.0%) |
| Legal Services & Support | 0 (0.0%) | 0 (0.0%) |
| Education Instruction & Library | 3 (12.5%) | 21 (87.5%) |
| Arts, Media & Entertainment | 2 (28.6%) | 5 (71.4%) |
| Health Diagnosing & Treating | 4 (16.0%) | 21 (84.0%) |
| Health Technologists | 0 (0.0%) | 10 (100.0%) |
| Total (Category) | 55 (43.3%) | 72 (56.7%) |
| Total (Overall) | 249 (53.5%) | 216 (46.5%) |
Services Occupations
The most common Services occupations in Mazeppa are Food Preparation & Serving (34 | 7.3%), Cleaning & Maintenance (32 | 6.9%), Personal Care & Service (10 | 2.1%), Healthcare Support (8 | 1.7%), and Security & Protection (5 | 1.1%).
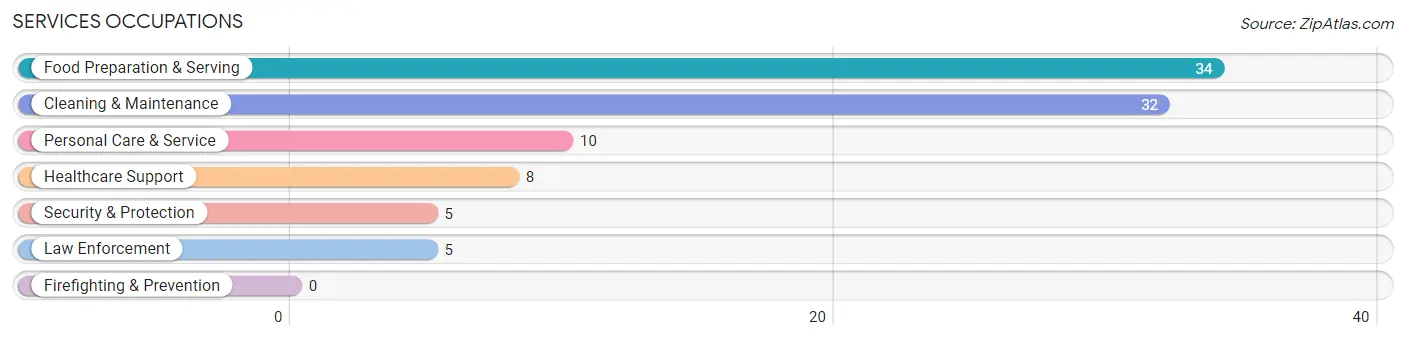
Services Occupations by Sex
Within the Services occupations in Mazeppa, the most male-oriented occupations are Security & Protection (100.0%), Law Enforcement (100.0%), and Healthcare Support (75.0%), while the most female-oriented occupations are Food Preparation & Serving (100.0%), Personal Care & Service (100.0%), and Cleaning & Maintenance (46.9%).
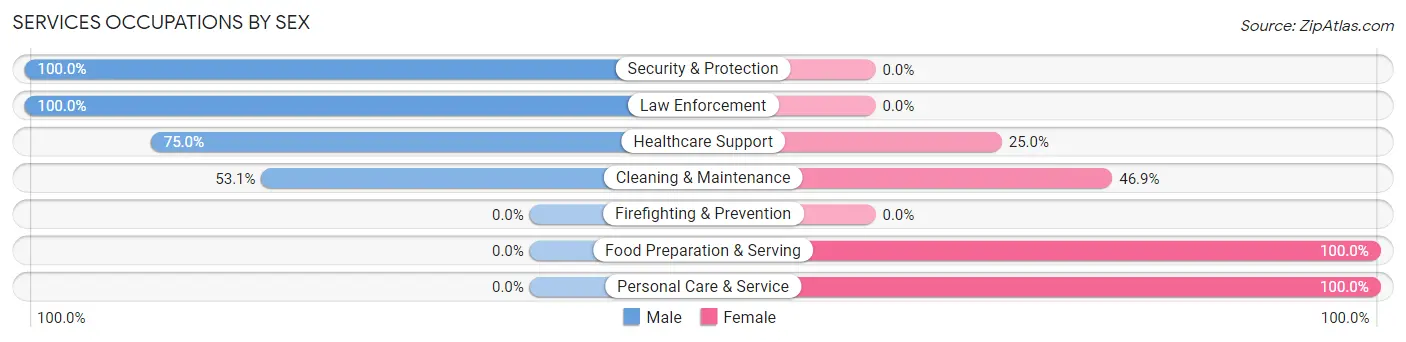
| Occupation | Male | Female |
| Healthcare Support | 6 (75.0%) | 2 (25.0%) |
| Security & Protection | 5 (100.0%) | 0 (0.0%) |
| Firefighting & Prevention | 0 (0.0%) | 0 (0.0%) |
| Law Enforcement | 5 (100.0%) | 0 (0.0%) |
| Food Preparation & Serving | 0 (0.0%) | 34 (100.0%) |
| Cleaning & Maintenance | 17 (53.1%) | 15 (46.9%) |
| Personal Care & Service | 0 (0.0%) | 10 (100.0%) |
| Total (Category) | 28 (31.5%) | 61 (68.5%) |
| Total (Overall) | 249 (53.5%) | 216 (46.5%) |
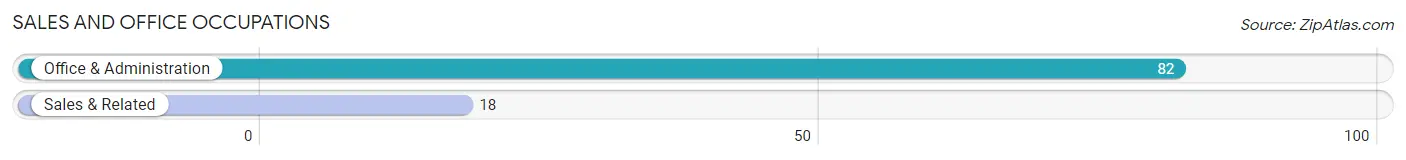
Sales and Office Occupations
The most common Sales and Office occupations in Mazeppa are Office & Administration (82 | 17.6%), and Sales & Related (18 | 3.9%).
Sales and Office Occupations by Sex
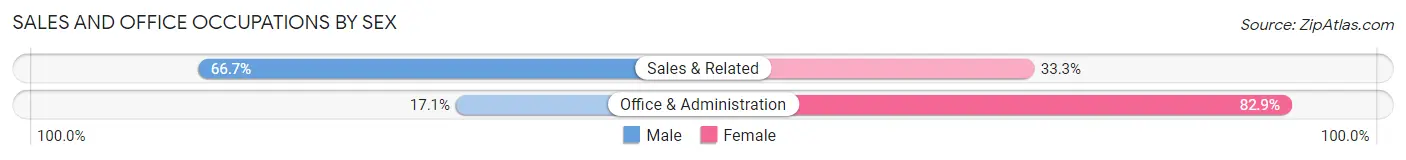
| Occupation | Male | Female |
| Sales & Related | 12 (66.7%) | 6 (33.3%) |
| Office & Administration | 14 (17.1%) | 68 (82.9%) |
| Total (Category) | 26 (26.0%) | 74 (74.0%) |
| Total (Overall) | 249 (53.5%) | 216 (46.5%) |
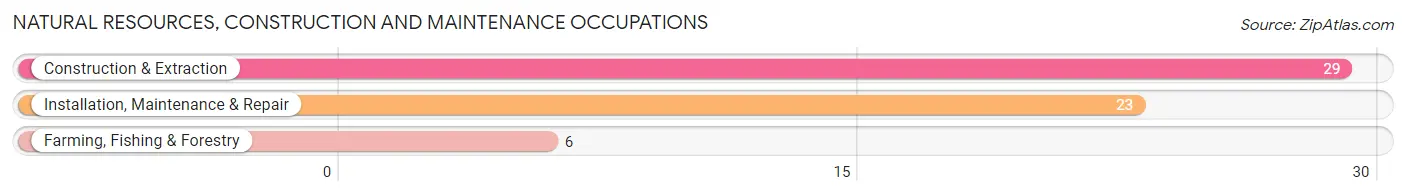
Natural Resources, Construction and Maintenance Occupations
The most common Natural Resources, Construction and Maintenance occupations in Mazeppa are Construction & Extraction (29 | 6.2%), Installation, Maintenance & Repair (23 | 5.0%), and Farming, Fishing & Forestry (6 | 1.3%).
Natural Resources, Construction and Maintenance Occupations by Sex
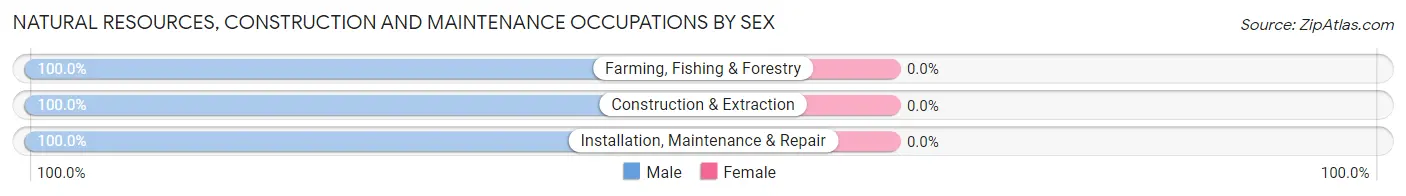
| Occupation | Male | Female |
| Farming, Fishing & Forestry | 6 (100.0%) | 0 (0.0%) |
| Construction & Extraction | 29 (100.0%) | 0 (0.0%) |
| Installation, Maintenance & Repair | 23 (100.0%) | 0 (0.0%) |
| Total (Category) | 58 (100.0%) | 0 (0.0%) |
| Total (Overall) | 249 (53.5%) | 216 (46.5%) |
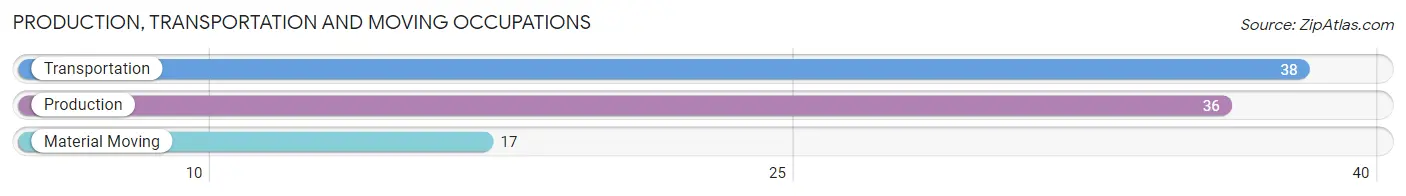
Production, Transportation and Moving Occupations
The most common Production, Transportation and Moving occupations in Mazeppa are Transportation (38 | 8.2%), Production (36 | 7.7%), and Material Moving (17 | 3.7%).
Production, Transportation and Moving Occupations by Sex
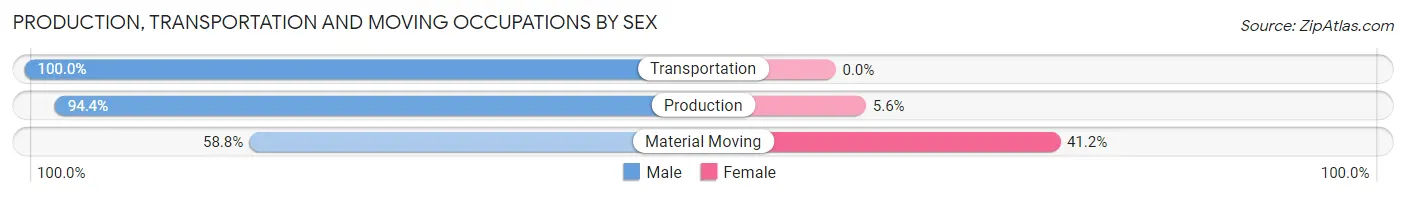
| Occupation | Male | Female |
| Production | 34 (94.4%) | 2 (5.6%) |
| Transportation | 38 (100.0%) | 0 (0.0%) |
| Material Moving | 10 (58.8%) | 7 (41.2%) |
| Total (Category) | 82 (90.1%) | 9 (9.9%) |
| Total (Overall) | 249 (53.5%) | 216 (46.5%) |
Employment Industries by Sex in Mazeppa
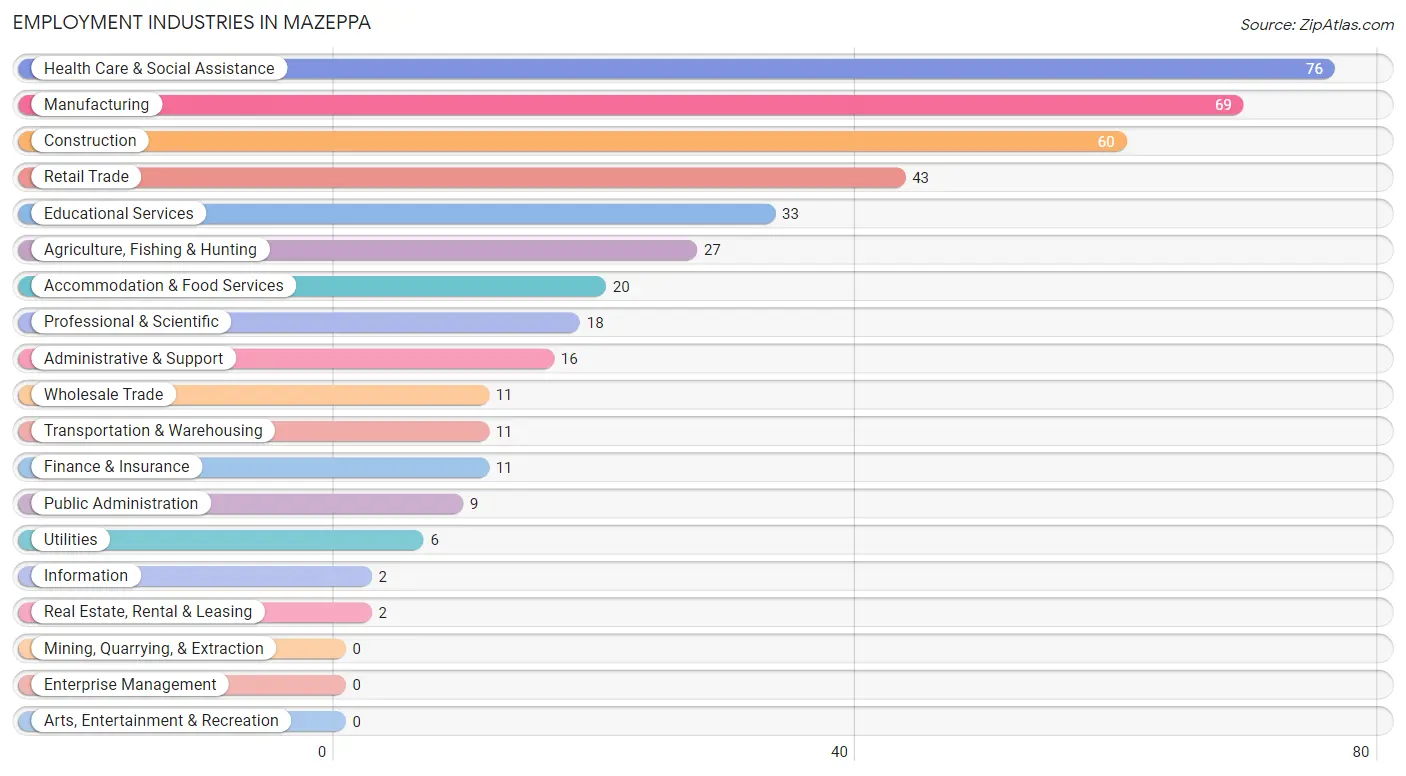
Employment Industries in Mazeppa
The major employment industries in Mazeppa include Health Care & Social Assistance (76 | 16.3%), Manufacturing (69 | 14.8%), Construction (60 | 12.9%), Retail Trade (43 | 9.2%), and Educational Services (33 | 7.1%).
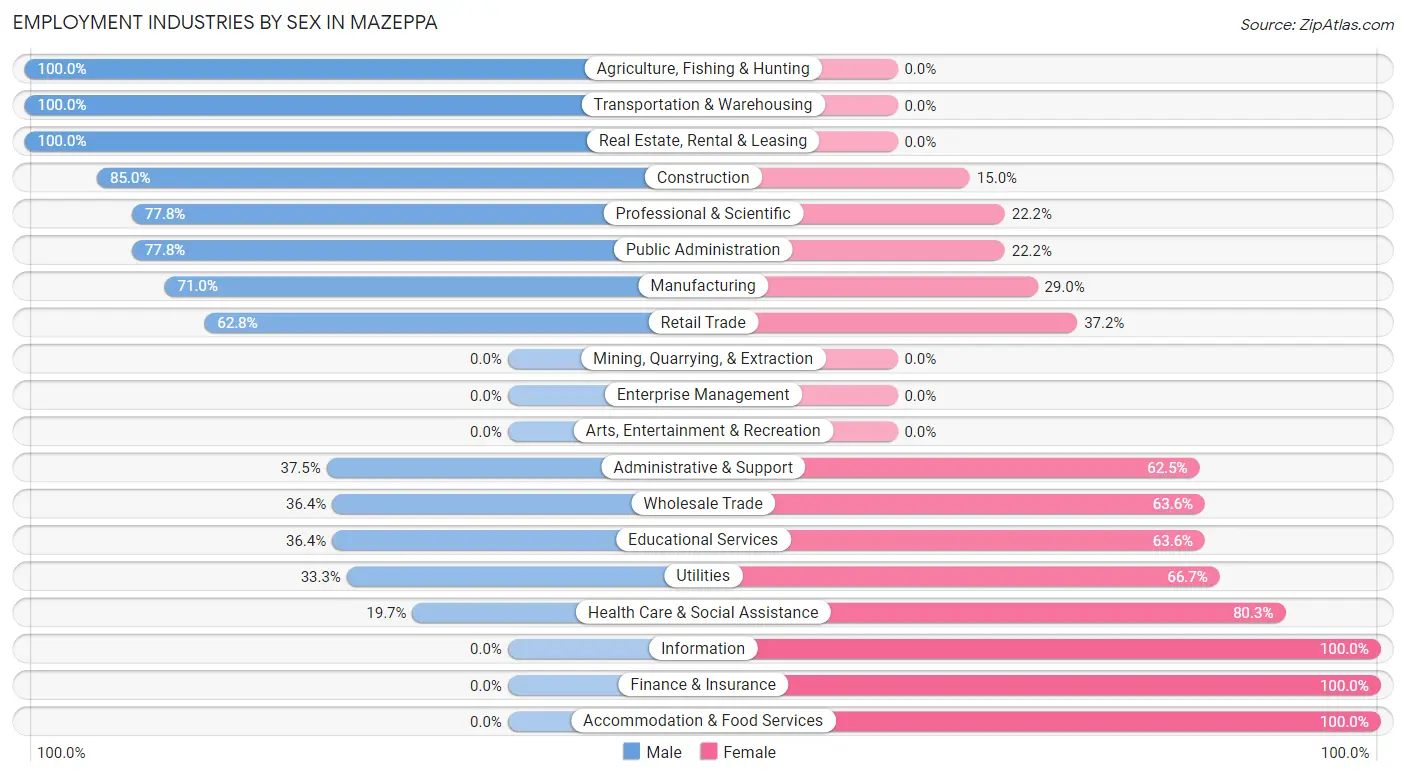
Employment Industries by Sex in Mazeppa
The Mazeppa industries that see more men than women are Agriculture, Fishing & Hunting (100.0%), Transportation & Warehousing (100.0%), and Real Estate, Rental & Leasing (100.0%), whereas the industries that tend to have a higher number of women are Information (100.0%), Finance & Insurance (100.0%), and Accommodation & Food Services (100.0%).
| Industry | Male | Female |
| Agriculture, Fishing & Hunting | 27 (100.0%) | 0 (0.0%) |
| Mining, Quarrying, & Extraction | 0 (0.0%) | 0 (0.0%) |
| Construction | 51 (85.0%) | 9 (15.0%) |
| Manufacturing | 49 (71.0%) | 20 (29.0%) |
| Wholesale Trade | 4 (36.4%) | 7 (63.6%) |
| Retail Trade | 27 (62.8%) | 16 (37.2%) |
| Transportation & Warehousing | 11 (100.0%) | 0 (0.0%) |
| Utilities | 2 (33.3%) | 4 (66.7%) |
| Information | 0 (0.0%) | 2 (100.0%) |
| Finance & Insurance | 0 (0.0%) | 11 (100.0%) |
| Real Estate, Rental & Leasing | 2 (100.0%) | 0 (0.0%) |
| Professional & Scientific | 14 (77.8%) | 4 (22.2%) |
| Enterprise Management | 0 (0.0%) | 0 (0.0%) |
| Administrative & Support | 6 (37.5%) | 10 (62.5%) |
| Educational Services | 12 (36.4%) | 21 (63.6%) |
| Health Care & Social Assistance | 15 (19.7%) | 61 (80.3%) |
| Arts, Entertainment & Recreation | 0 (0.0%) | 0 (0.0%) |
| Accommodation & Food Services | 0 (0.0%) | 20 (100.0%) |
| Public Administration | 7 (77.8%) | 2 (22.2%) |
| Total | 249 (53.5%) | 216 (46.5%) |
Education in Mazeppa
School Enrollment in Mazeppa
The most common levels of schooling among the 159 students in Mazeppa are middle school (48 | 30.2%), elementary school (44 | 27.7%), and high school (32 | 20.1%).
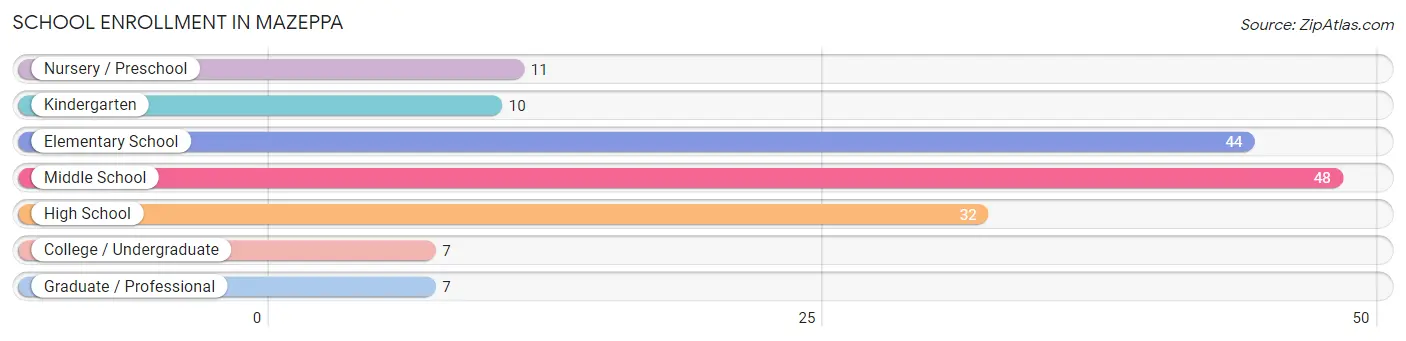
| School Level | # Students | % Students |
| Nursery / Preschool | 11 | 6.9% |
| Kindergarten | 10 | 6.3% |
| Elementary School | 44 | 27.7% |
| Middle School | 48 | 30.2% |
| High School | 32 | 20.1% |
| College / Undergraduate | 7 | 4.4% |
| Graduate / Professional | 7 | 4.4% |
| Total | 159 | 100.0% |
School Enrollment by Age by Funding Source in Mazeppa
Out of a total of 159 students who are enrolled in schools in Mazeppa, 12 (7.5%) attend a private institution, while the remaining 147 (92.5%) are enrolled in public schools. The age group of 3 to 4 year olds has the highest likelihood of being enrolled in private schools, with 7 (63.6% in the age bracket) enrolled. Conversely, the age group of 5 to 9 year old has the lowest likelihood of being enrolled in a private school, with 52 (100.0% in the age bracket) attending a public institution.
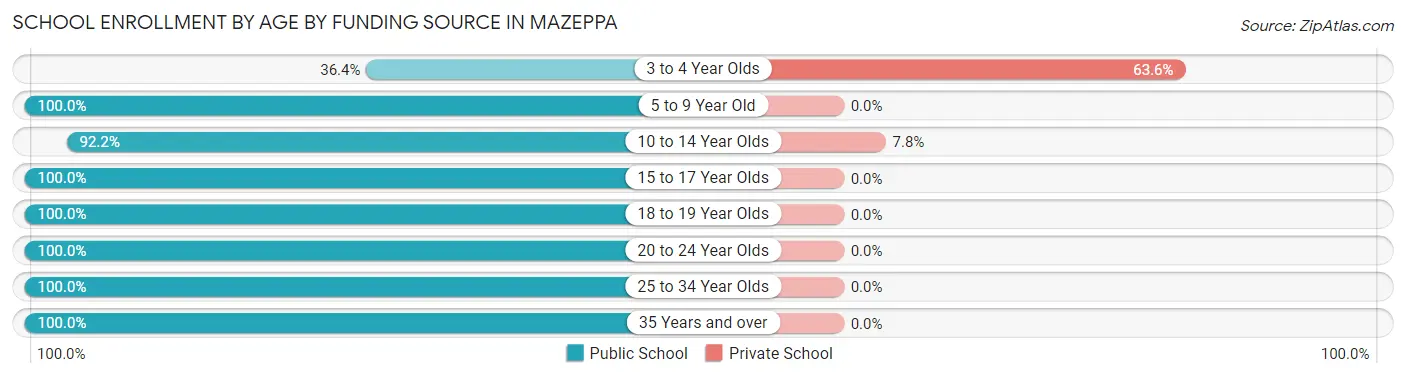
| Age Bracket | Public School | Private School |
| 3 to 4 Year Olds | 4 (36.4%) | 7 (63.6%) |
| 5 to 9 Year Old | 52 (100.0%) | 0 (0.0%) |
| 10 to 14 Year Olds | 59 (92.2%) | 5 (7.8%) |
| 15 to 17 Year Olds | 15 (100.0%) | 0 (0.0%) |
| 18 to 19 Year Olds | 3 (100.0%) | 0 (0.0%) |
| 20 to 24 Year Olds | 1 (100.0%) | 0 (0.0%) |
| 25 to 34 Year Olds | 7 (100.0%) | 0 (0.0%) |
| 35 Years and over | 6 (100.0%) | 0 (0.0%) |
| Total | 147 (92.5%) | 12 (7.5%) |
Educational Attainment by Field of Study in Mazeppa
Business (27 | 21.4%), education (25 | 19.8%), arts & humanities (17 | 13.5%), communications (12 | 9.5%), and social sciences (11 | 8.7%) are the most common fields of study among 126 individuals in Mazeppa who have obtained a bachelor's degree or higher.
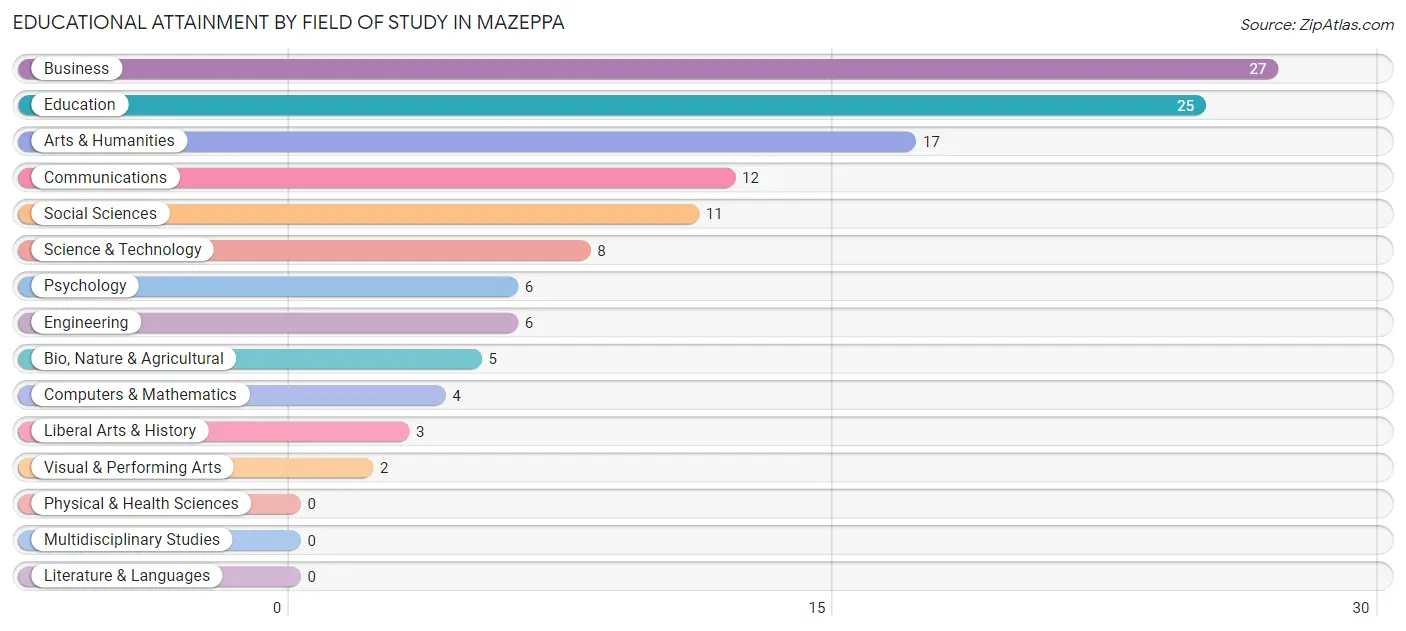
| Field of Study | # Graduates | % Graduates |
| Computers & Mathematics | 4 | 3.2% |
| Bio, Nature & Agricultural | 5 | 4.0% |
| Physical & Health Sciences | 0 | 0.0% |
| Psychology | 6 | 4.8% |
| Social Sciences | 11 | 8.7% |
| Engineering | 6 | 4.8% |
| Multidisciplinary Studies | 0 | 0.0% |
| Science & Technology | 8 | 6.4% |
| Business | 27 | 21.4% |
| Education | 25 | 19.8% |
| Literature & Languages | 0 | 0.0% |
| Liberal Arts & History | 3 | 2.4% |
| Visual & Performing Arts | 2 | 1.6% |
| Communications | 12 | 9.5% |
| Arts & Humanities | 17 | 13.5% |
| Total | 126 | 100.0% |
Transportation & Commute in Mazeppa
Vehicle Availability by Sex in Mazeppa
The most prevalent vehicle ownership categories in Mazeppa are males with 2 vehicles (100, accounting for 39.8%) and females with 2 vehicles (98, making up 46.7%).
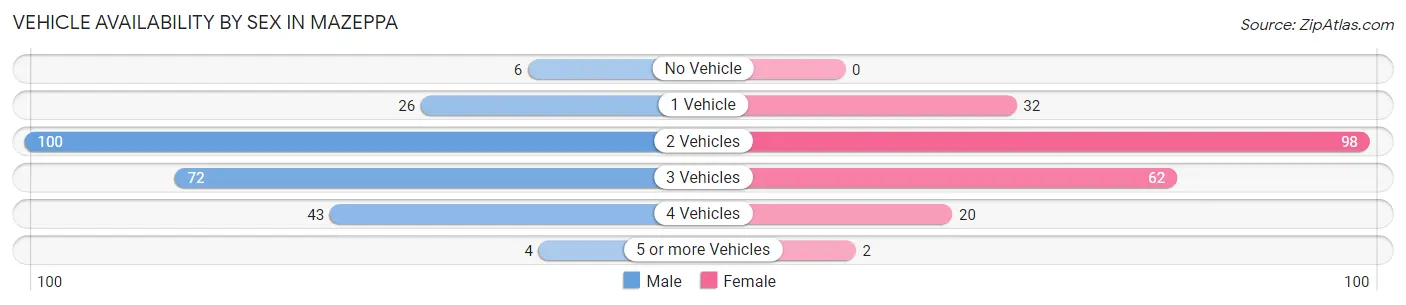
| Vehicles Available | Male | Female |
| No Vehicle | 6 (2.4%) | 0 (0.0%) |
| 1 Vehicle | 26 (10.4%) | 32 (14.9%) |
| 2 Vehicles | 100 (39.8%) | 98 (45.8%) |
| 3 Vehicles | 72 (28.7%) | 62 (29.0%) |
| 4 Vehicles | 43 (17.1%) | 20 (9.3%) |
| 5 or more Vehicles | 4 (1.6%) | 2 (0.9%) |
| Total | 251 (100.0%) | 214 (100.0%) |
Commute Time in Mazeppa
The most frequently occuring commute durations in Mazeppa are 25 to 29 minutes (56 commuters, 13.2%), 15 to 19 minutes (55 commuters, 13.0%), and 20 to 24 minutes (54 commuters, 12.7%).
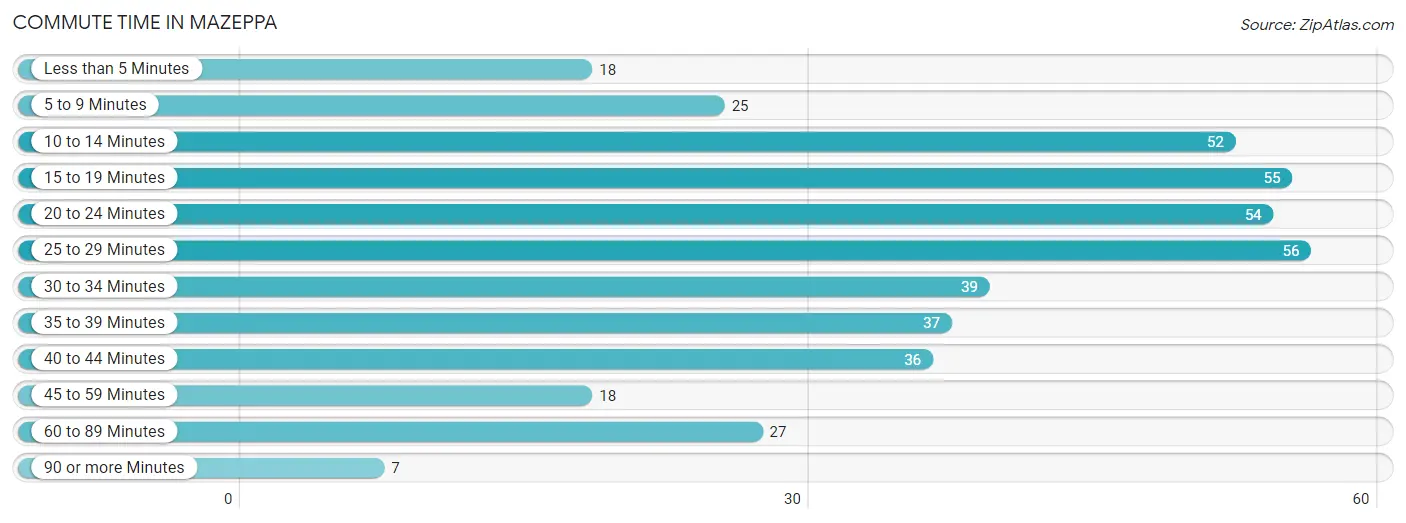
| Commute Time | # Commuters | % Commuters |
| Less than 5 Minutes | 18 | 4.3% |
| 5 to 9 Minutes | 25 | 5.9% |
| 10 to 14 Minutes | 52 | 12.3% |
| 15 to 19 Minutes | 55 | 13.0% |
| 20 to 24 Minutes | 54 | 12.7% |
| 25 to 29 Minutes | 56 | 13.2% |
| 30 to 34 Minutes | 39 | 9.2% |
| 35 to 39 Minutes | 37 | 8.7% |
| 40 to 44 Minutes | 36 | 8.5% |
| 45 to 59 Minutes | 18 | 4.3% |
| 60 to 89 Minutes | 27 | 6.4% |
| 90 or more Minutes | 7 | 1.7% |
Commute Time by Sex in Mazeppa
The most common commute times in Mazeppa are 20 to 24 minutes (40 commuters, 16.8%) for males and 15 to 19 minutes (40 commuters, 21.5%) for females.
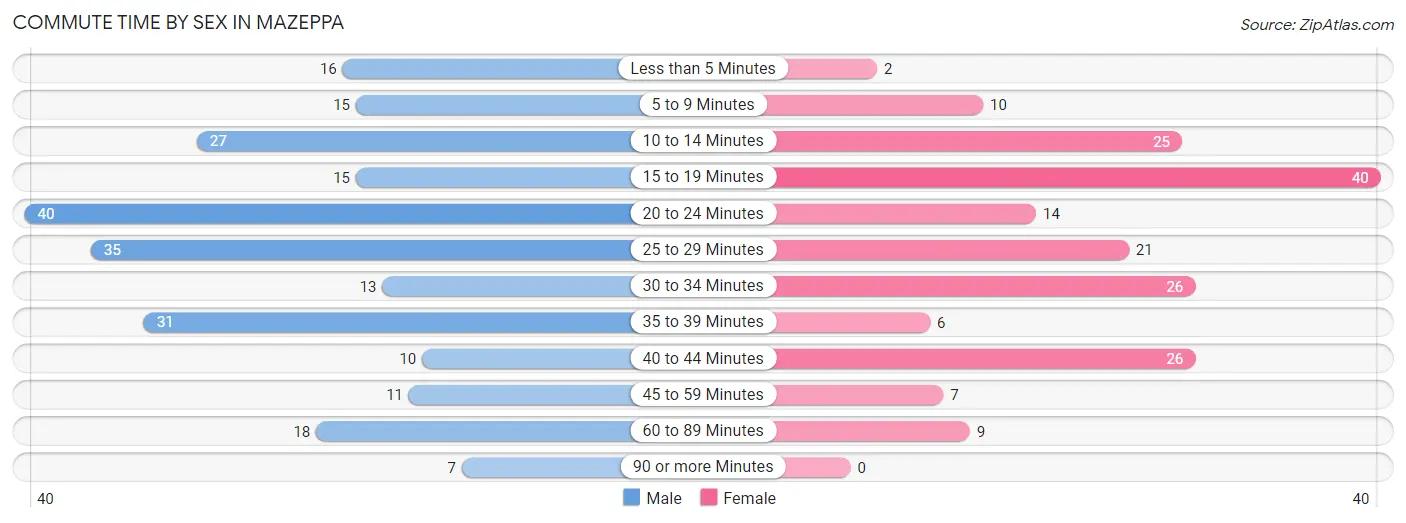
| Commute Time | Male | Female |
| Less than 5 Minutes | 16 (6.7%) | 2 (1.1%) |
| 5 to 9 Minutes | 15 (6.3%) | 10 (5.4%) |
| 10 to 14 Minutes | 27 (11.3%) | 25 (13.4%) |
| 15 to 19 Minutes | 15 (6.3%) | 40 (21.5%) |
| 20 to 24 Minutes | 40 (16.8%) | 14 (7.5%) |
| 25 to 29 Minutes | 35 (14.7%) | 21 (11.3%) |
| 30 to 34 Minutes | 13 (5.5%) | 26 (14.0%) |
| 35 to 39 Minutes | 31 (13.0%) | 6 (3.2%) |
| 40 to 44 Minutes | 10 (4.2%) | 26 (14.0%) |
| 45 to 59 Minutes | 11 (4.6%) | 7 (3.8%) |
| 60 to 89 Minutes | 18 (7.6%) | 9 (4.8%) |
| 90 or more Minutes | 7 (2.9%) | 0 (0.0%) |
Time of Departure to Work by Sex in Mazeppa
The most frequent times of departure to work in Mazeppa are 7:00 AM to 7:29 AM (51, 21.4%) for males and 7:30 AM to 7:59 AM (35, 18.8%) for females.
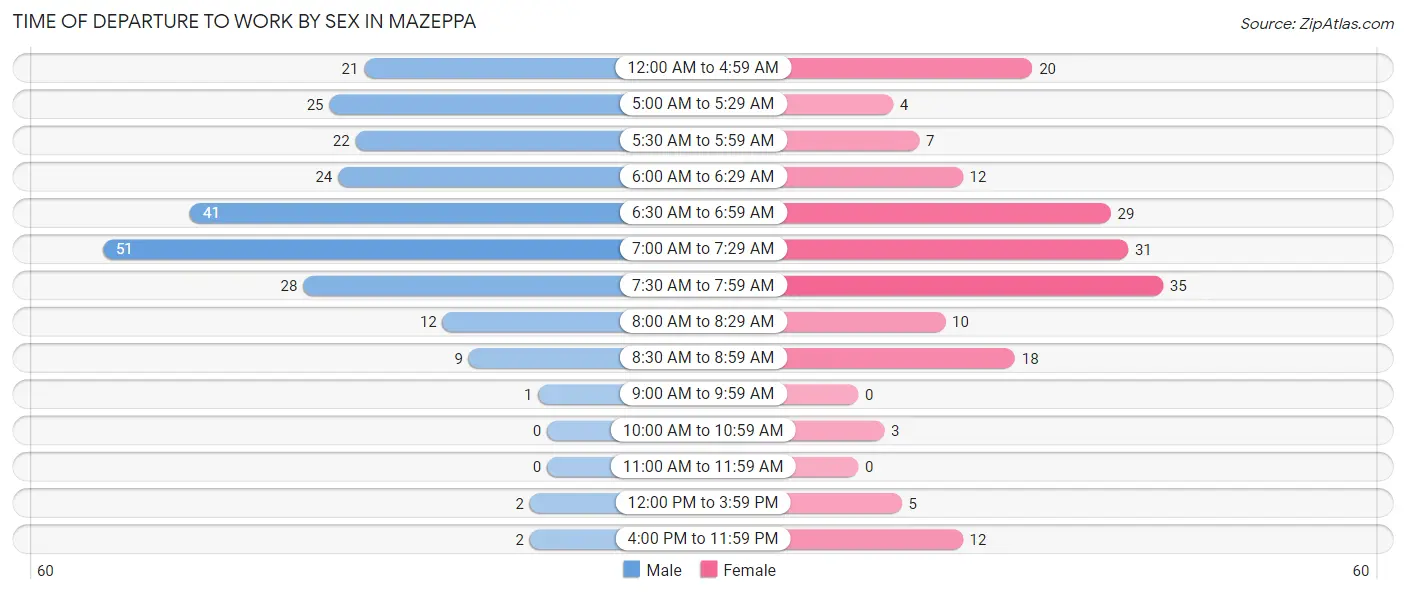
| Time of Departure | Male | Female |
| 12:00 AM to 4:59 AM | 21 (8.8%) | 20 (10.7%) |
| 5:00 AM to 5:29 AM | 25 (10.5%) | 4 (2.1%) |
| 5:30 AM to 5:59 AM | 22 (9.2%) | 7 (3.8%) |
| 6:00 AM to 6:29 AM | 24 (10.1%) | 12 (6.5%) |
| 6:30 AM to 6:59 AM | 41 (17.2%) | 29 (15.6%) |
| 7:00 AM to 7:29 AM | 51 (21.4%) | 31 (16.7%) |
| 7:30 AM to 7:59 AM | 28 (11.8%) | 35 (18.8%) |
| 8:00 AM to 8:29 AM | 12 (5.0%) | 10 (5.4%) |
| 8:30 AM to 8:59 AM | 9 (3.8%) | 18 (9.7%) |
| 9:00 AM to 9:59 AM | 1 (0.4%) | 0 (0.0%) |
| 10:00 AM to 10:59 AM | 0 (0.0%) | 3 (1.6%) |
| 11:00 AM to 11:59 AM | 0 (0.0%) | 0 (0.0%) |
| 12:00 PM to 3:59 PM | 2 (0.8%) | 5 (2.7%) |
| 4:00 PM to 11:59 PM | 2 (0.8%) | 12 (6.5%) |
| Total | 238 (100.0%) | 186 (100.0%) |
Housing Occupancy in Mazeppa
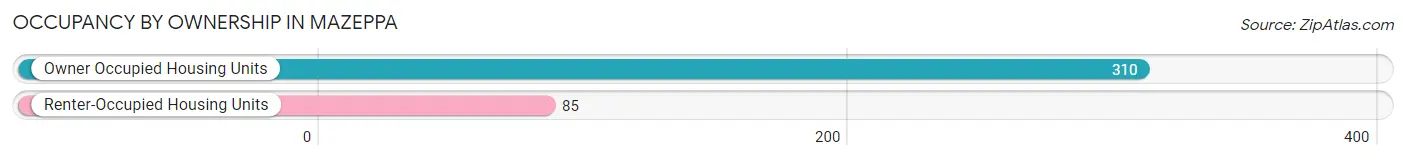
Occupancy by Ownership in Mazeppa
Of the total 395 dwellings in Mazeppa, owner-occupied units account for 310 (78.5%), while renter-occupied units make up 85 (21.5%).
| Occupancy | # Housing Units | % Housing Units |
| Owner Occupied Housing Units | 310 | 78.5% |
| Renter-Occupied Housing Units | 85 | 21.5% |
| Total Occupied Housing Units | 395 | 100.0% |
Occupancy by Household Size in Mazeppa
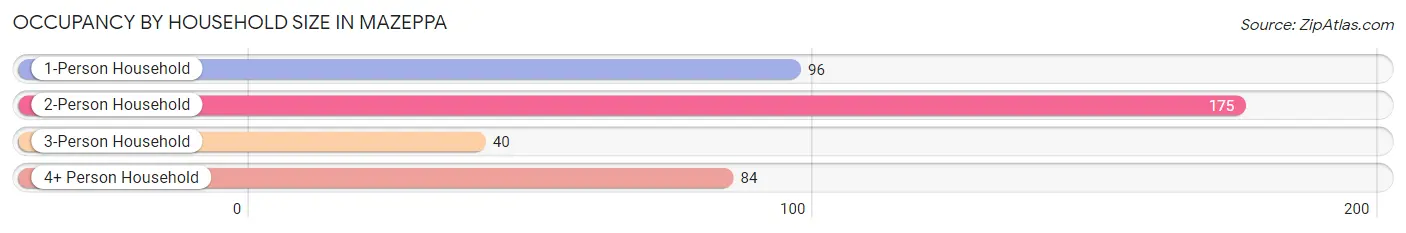
| Household Size | # Housing Units | % Housing Units |
| 1-Person Household | 96 | 24.3% |
| 2-Person Household | 175 | 44.3% |
| 3-Person Household | 40 | 10.1% |
| 4+ Person Household | 84 | 21.3% |
| Total Housing Units | 395 | 100.0% |
Occupancy by Ownership by Household Size in Mazeppa
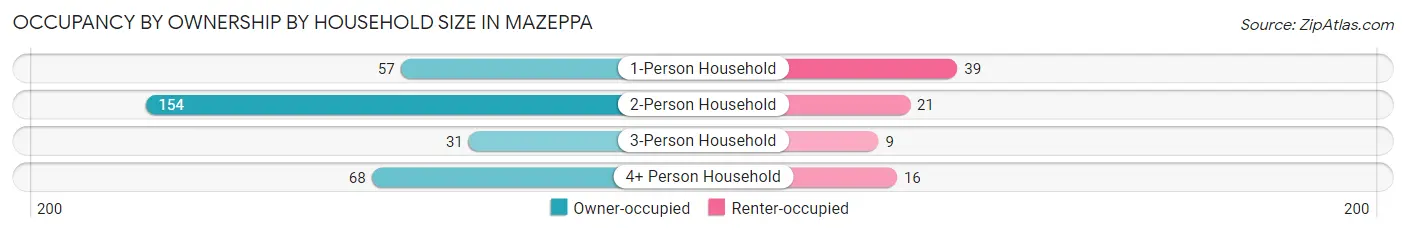
| Household Size | Owner-occupied | Renter-occupied |
| 1-Person Household | 57 (59.4%) | 39 (40.6%) |
| 2-Person Household | 154 (88.0%) | 21 (12.0%) |
| 3-Person Household | 31 (77.5%) | 9 (22.5%) |
| 4+ Person Household | 68 (80.9%) | 16 (19.1%) |
| Total Housing Units | 310 (78.5%) | 85 (21.5%) |
Occupancy by Educational Attainment in Mazeppa
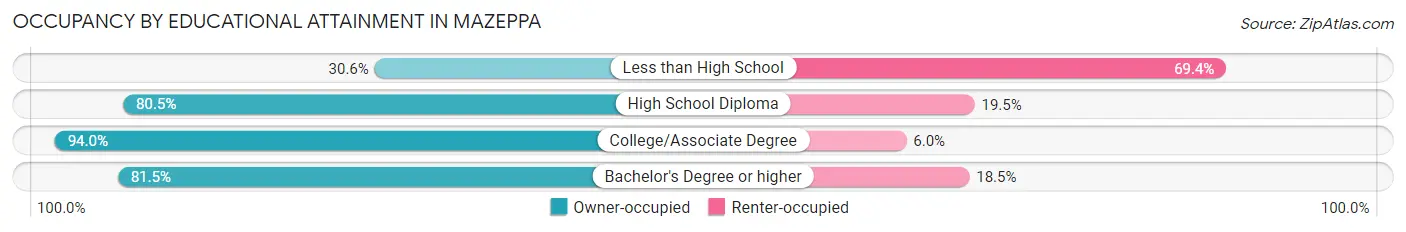
| Household Size | Owner-occupied | Renter-occupied |
| Less than High School | 15 (30.6%) | 34 (69.4%) |
| High School Diploma | 132 (80.5%) | 32 (19.5%) |
| College/Associate Degree | 110 (94.0%) | 7 (6.0%) |
| Bachelor's Degree or higher | 53 (81.5%) | 12 (18.5%) |
Occupancy by Age of Householder in Mazeppa
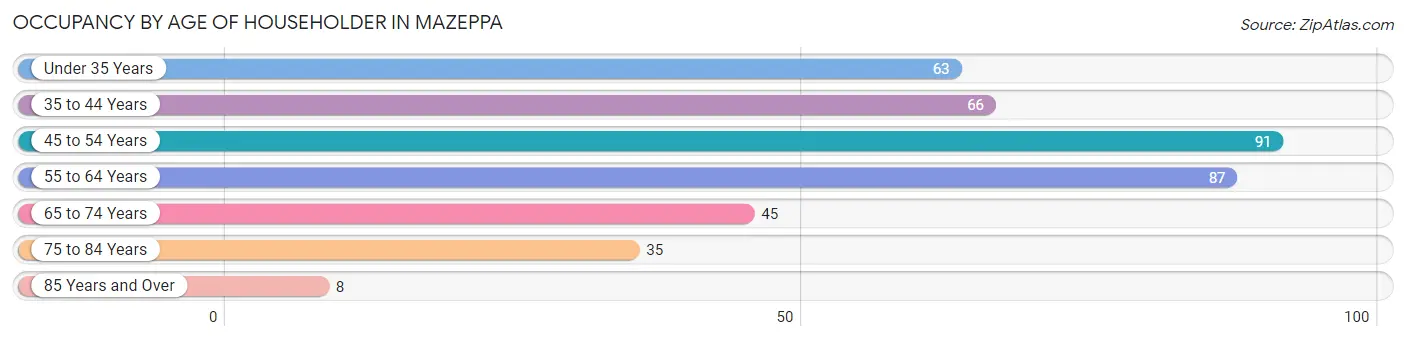
| Age Bracket | # Households | % Households |
| Under 35 Years | 63 | 16.0% |
| 35 to 44 Years | 66 | 16.7% |
| 45 to 54 Years | 91 | 23.0% |
| 55 to 64 Years | 87 | 22.0% |
| 65 to 74 Years | 45 | 11.4% |
| 75 to 84 Years | 35 | 8.9% |
| 85 Years and Over | 8 | 2.0% |
| Total | 395 | 100.0% |
Housing Finances in Mazeppa
Median Income by Occupancy in Mazeppa
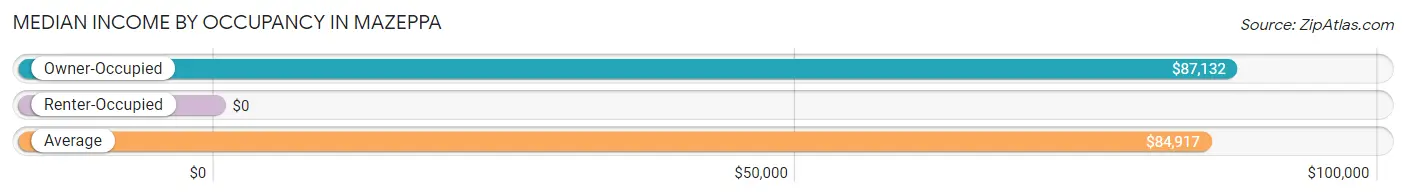
| Occupancy Type | # Households | Median Income |
| Owner-Occupied | 310 (78.5%) | $87,132 |
| Renter-Occupied | 85 (21.5%) | $0 |
| Average | 395 (100.0%) | $84,917 |
Occupancy by Householder Income Bracket in Mazeppa
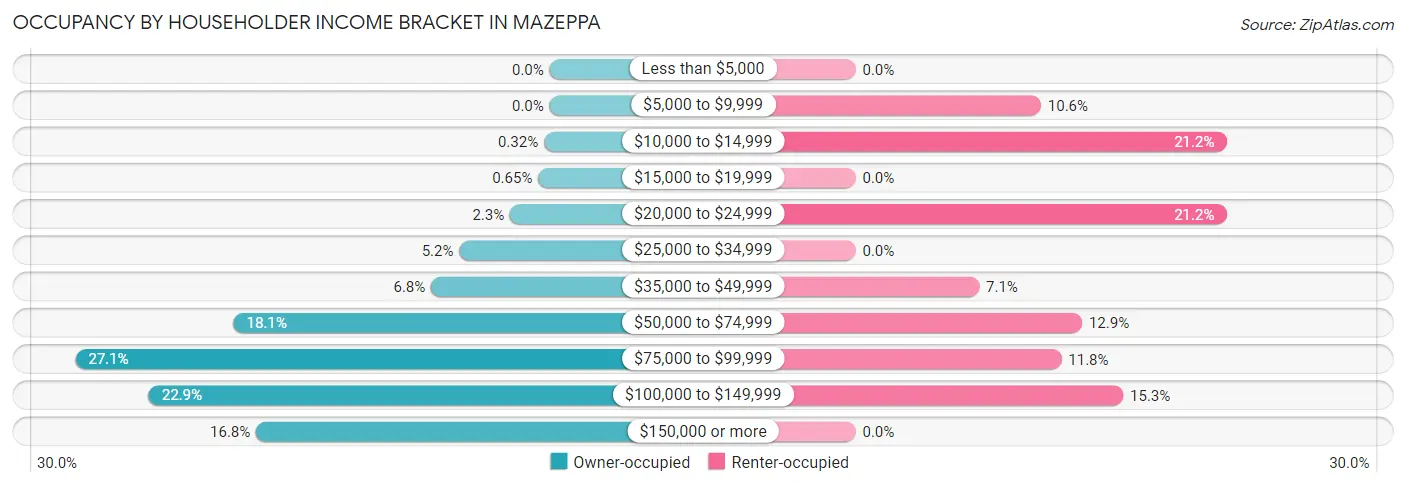
| Income Bracket | Owner-occupied | Renter-occupied |
| Less than $5,000 | 0 (0.0%) | 0 (0.0%) |
| $5,000 to $9,999 | 0 (0.0%) | 9 (10.6%) |
| $10,000 to $14,999 | 1 (0.3%) | 18 (21.2%) |
| $15,000 to $19,999 | 2 (0.6%) | 0 (0.0%) |
| $20,000 to $24,999 | 7 (2.3%) | 18 (21.2%) |
| $25,000 to $34,999 | 16 (5.2%) | 0 (0.0%) |
| $35,000 to $49,999 | 21 (6.8%) | 6 (7.1%) |
| $50,000 to $74,999 | 56 (18.1%) | 11 (12.9%) |
| $75,000 to $99,999 | 84 (27.1%) | 10 (11.8%) |
| $100,000 to $149,999 | 71 (22.9%) | 13 (15.3%) |
| $150,000 or more | 52 (16.8%) | 0 (0.0%) |
| Total | 310 (100.0%) | 85 (100.0%) |
Monthly Housing Cost Tiers in Mazeppa
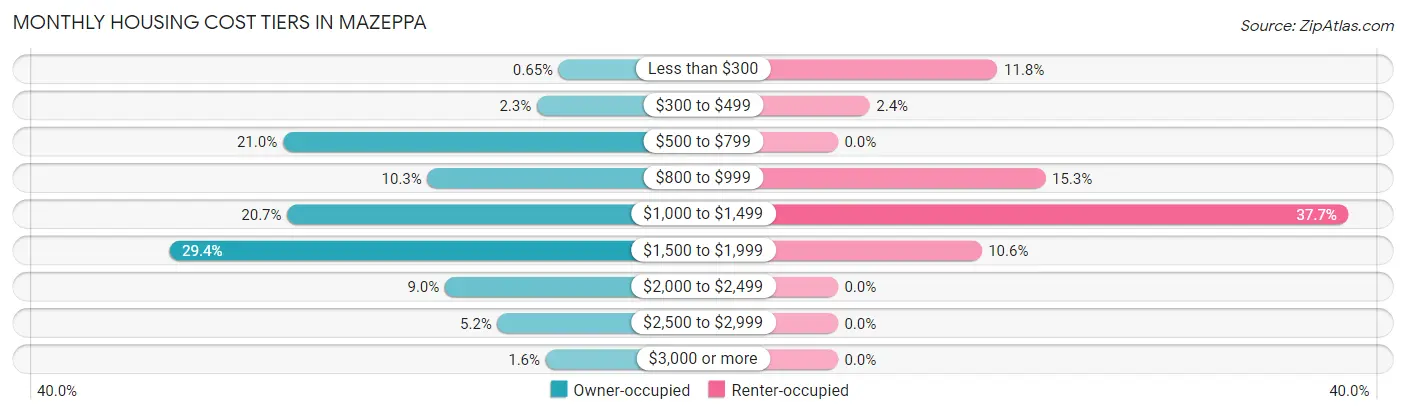
| Monthly Cost | Owner-occupied | Renter-occupied |
| Less than $300 | 2 (0.6%) | 10 (11.8%) |
| $300 to $499 | 7 (2.3%) | 2 (2.4%) |
| $500 to $799 | 65 (21.0%) | 0 (0.0%) |
| $800 to $999 | 32 (10.3%) | 13 (15.3%) |
| $1,000 to $1,499 | 64 (20.6%) | 32 (37.7%) |
| $1,500 to $1,999 | 91 (29.3%) | 9 (10.6%) |
| $2,000 to $2,499 | 28 (9.0%) | 0 (0.0%) |
| $2,500 to $2,999 | 16 (5.2%) | 0 (0.0%) |
| $3,000 or more | 5 (1.6%) | 0 (0.0%) |
| Total | 310 (100.0%) | 85 (100.0%) |
Physical Housing Characteristics in Mazeppa
Housing Structures in Mazeppa
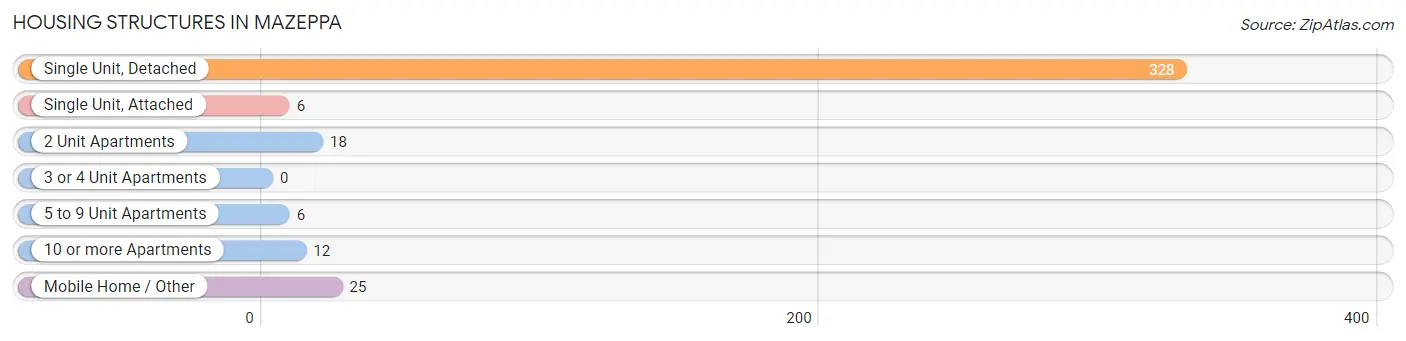
| Structure Type | # Housing Units | % Housing Units |
| Single Unit, Detached | 328 | 83.0% |
| Single Unit, Attached | 6 | 1.5% |
| 2 Unit Apartments | 18 | 4.6% |
| 3 or 4 Unit Apartments | 0 | 0.0% |
| 5 to 9 Unit Apartments | 6 | 1.5% |
| 10 or more Apartments | 12 | 3.0% |
| Mobile Home / Other | 25 | 6.3% |
| Total | 395 | 100.0% |
Housing Structures by Occupancy in Mazeppa
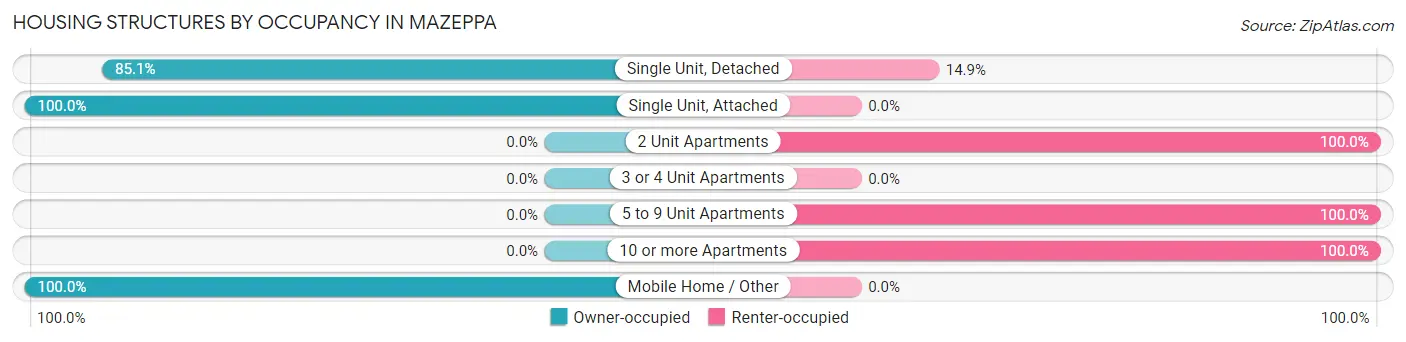
| Structure Type | Owner-occupied | Renter-occupied |
| Single Unit, Detached | 279 (85.1%) | 49 (14.9%) |
| Single Unit, Attached | 6 (100.0%) | 0 (0.0%) |
| 2 Unit Apartments | 0 (0.0%) | 18 (100.0%) |
| 3 or 4 Unit Apartments | 0 (0.0%) | 0 (0.0%) |
| 5 to 9 Unit Apartments | 0 (0.0%) | 6 (100.0%) |
| 10 or more Apartments | 0 (0.0%) | 12 (100.0%) |
| Mobile Home / Other | 25 (100.0%) | 0 (0.0%) |
| Total | 310 (78.5%) | 85 (21.5%) |
Housing Structures by Number of Rooms in Mazeppa
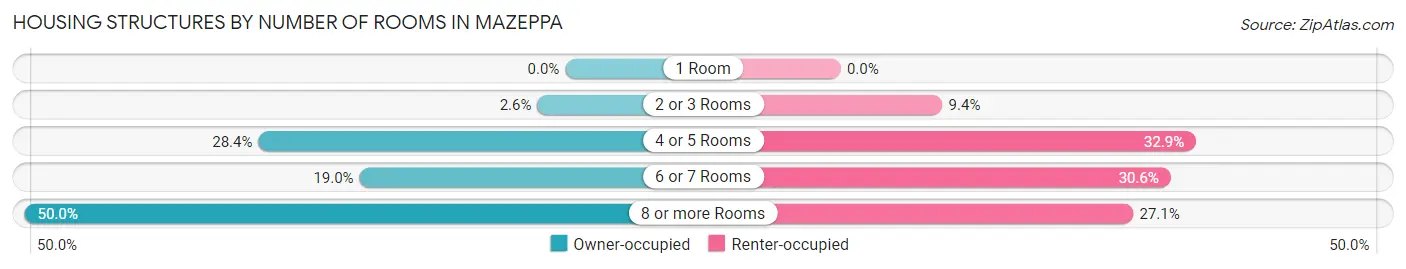
| Number of Rooms | Owner-occupied | Renter-occupied |
| 1 Room | 0 (0.0%) | 0 (0.0%) |
| 2 or 3 Rooms | 8 (2.6%) | 8 (9.4%) |
| 4 or 5 Rooms | 88 (28.4%) | 28 (32.9%) |
| 6 or 7 Rooms | 59 (19.0%) | 26 (30.6%) |
| 8 or more Rooms | 155 (50.0%) | 23 (27.1%) |
| Total | 310 (100.0%) | 85 (100.0%) |
Housing Structure by Heating Type in Mazeppa
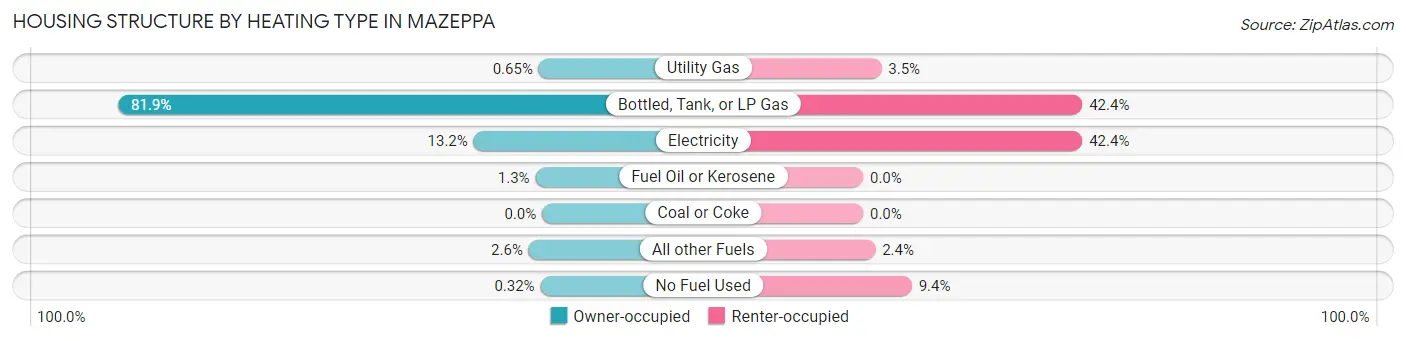
| Heating Type | Owner-occupied | Renter-occupied |
| Utility Gas | 2 (0.6%) | 3 (3.5%) |
| Bottled, Tank, or LP Gas | 254 (81.9%) | 36 (42.3%) |
| Electricity | 41 (13.2%) | 36 (42.3%) |
| Fuel Oil or Kerosene | 4 (1.3%) | 0 (0.0%) |
| Coal or Coke | 0 (0.0%) | 0 (0.0%) |
| All other Fuels | 8 (2.6%) | 2 (2.4%) |
| No Fuel Used | 1 (0.3%) | 8 (9.4%) |
| Total | 310 (100.0%) | 85 (100.0%) |
Household Vehicle Usage in Mazeppa
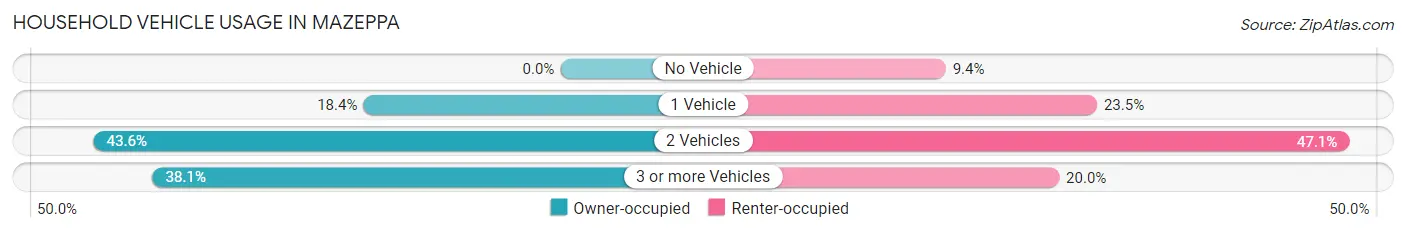
| Vehicles per Household | Owner-occupied | Renter-occupied |
| No Vehicle | 0 (0.0%) | 8 (9.4%) |
| 1 Vehicle | 57 (18.4%) | 20 (23.5%) |
| 2 Vehicles | 135 (43.5%) | 40 (47.1%) |
| 3 or more Vehicles | 118 (38.1%) | 17 (20.0%) |
| Total | 310 (100.0%) | 85 (100.0%) |
Real Estate & Mortgages in Mazeppa
Real Estate and Mortgage Overview in Mazeppa
| Characteristic | Without Mortgage | With Mortgage |
| Housing Units | 102 | 208 |
| Median Property Value | $175,000 | $223,000 |
| Median Household Income | $82,500 | $37 |
| Monthly Housing Costs | $696 | $5 |
| Real Estate Taxes | $2,093 | $0 |
Property Value by Mortgage Status in Mazeppa
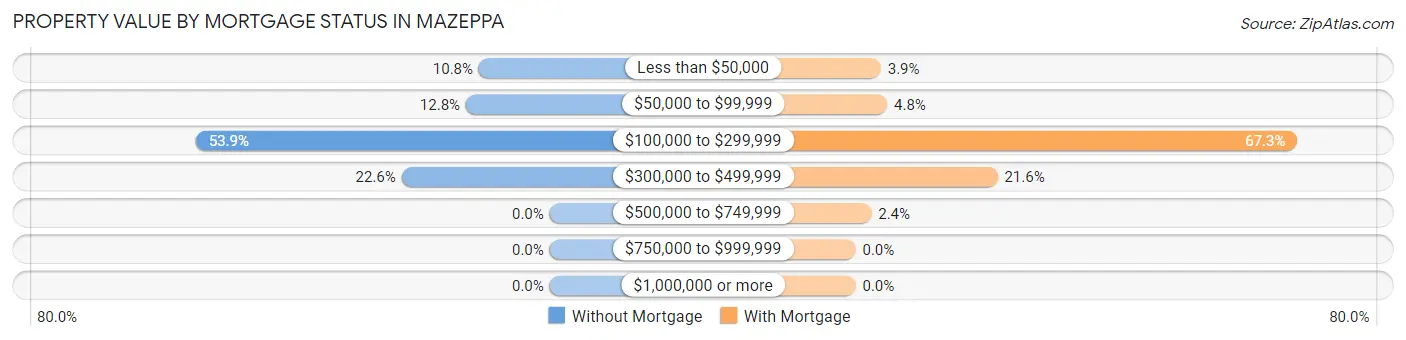
| Property Value | Without Mortgage | With Mortgage |
| Less than $50,000 | 11 (10.8%) | 8 (3.8%) |
| $50,000 to $99,999 | 13 (12.8%) | 10 (4.8%) |
| $100,000 to $299,999 | 55 (53.9%) | 140 (67.3%) |
| $300,000 to $499,999 | 23 (22.6%) | 45 (21.6%) |
| $500,000 to $749,999 | 0 (0.0%) | 5 (2.4%) |
| $750,000 to $999,999 | 0 (0.0%) | 0 (0.0%) |
| $1,000,000 or more | 0 (0.0%) | 0 (0.0%) |
| Total | 102 (100.0%) | 208 (100.0%) |
Household Income by Mortgage Status in Mazeppa
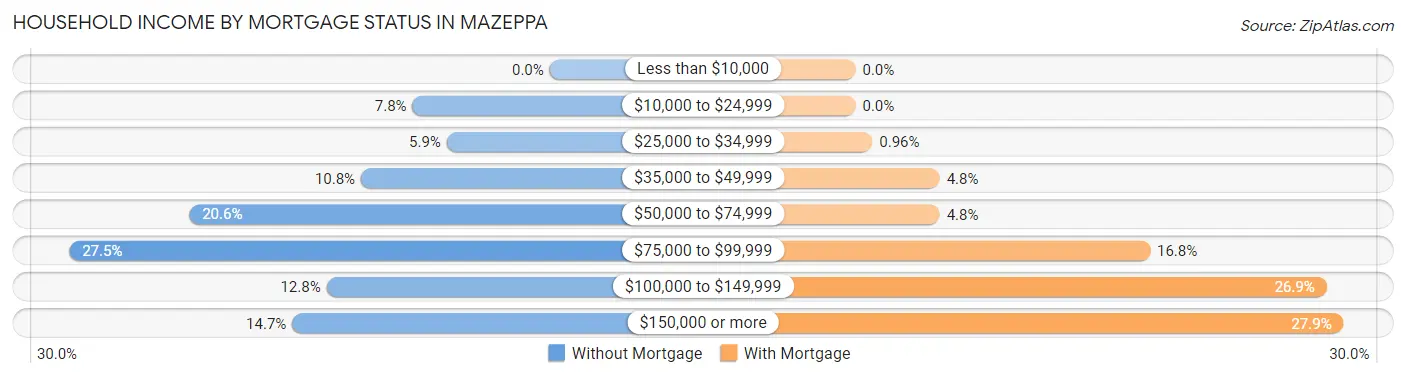
| Household Income | Without Mortgage | With Mortgage |
| Less than $10,000 | 0 (0.0%) | 0 (0.0%) |
| $10,000 to $24,999 | 8 (7.8%) | 0 (0.0%) |
| $25,000 to $34,999 | 6 (5.9%) | 2 (1.0%) |
| $35,000 to $49,999 | 11 (10.8%) | 10 (4.8%) |
| $50,000 to $74,999 | 21 (20.6%) | 10 (4.8%) |
| $75,000 to $99,999 | 28 (27.5%) | 35 (16.8%) |
| $100,000 to $149,999 | 13 (12.8%) | 56 (26.9%) |
| $150,000 or more | 15 (14.7%) | 58 (27.9%) |
| Total | 102 (100.0%) | 208 (100.0%) |
Property Value to Household Income Ratio in Mazeppa
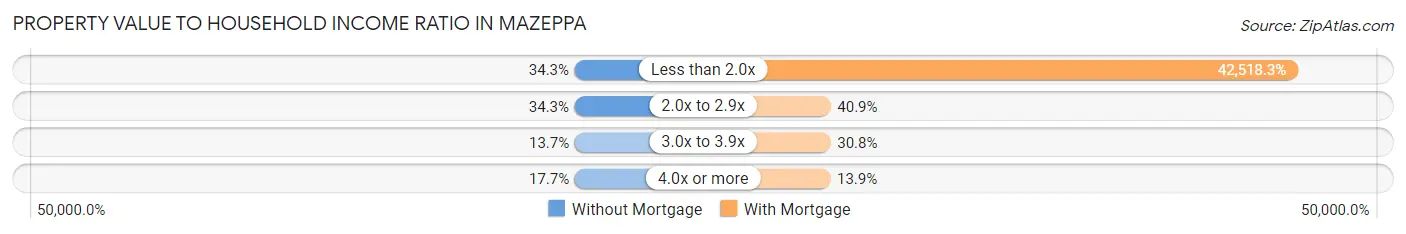
| Value-to-Income Ratio | Without Mortgage | With Mortgage |
| Less than 2.0x | 35 (34.3%) | 88,438 (42,518.3%) |
| 2.0x to 2.9x | 35 (34.3%) | 85 (40.9%) |
| 3.0x to 3.9x | 14 (13.7%) | 64 (30.8%) |
| 4.0x or more | 18 (17.6%) | 29 (13.9%) |
| Total | 102 (100.0%) | 208 (100.0%) |
Real Estate Taxes by Mortgage Status in Mazeppa
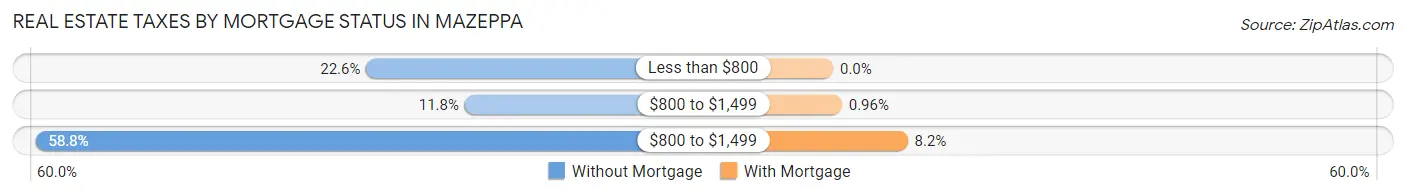
| Property Taxes | Without Mortgage | With Mortgage |
| Less than $800 | 23 (22.6%) | 0 (0.0%) |
| $800 to $1,499 | 12 (11.8%) | 2 (1.0%) |
| $800 to $1,499 | 60 (58.8%) | 17 (8.2%) |
| Total | 102 (100.0%) | 208 (100.0%) |
Health & Disability in Mazeppa
Health Insurance Coverage by Age in Mazeppa
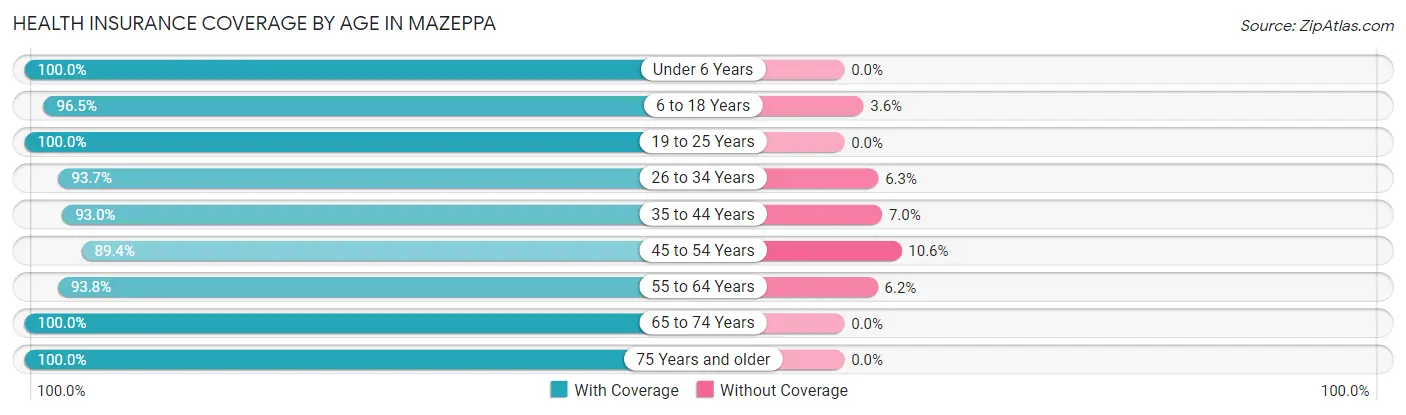
| Age Bracket | With Coverage | Without Coverage |
| Under 6 Years | 77 (100.0%) | 0 (0.0%) |
| 6 to 18 Years | 136 (96.5%) | 5 (3.5%) |
| 19 to 25 Years | 41 (100.0%) | 0 (0.0%) |
| 26 to 34 Years | 74 (93.7%) | 5 (6.3%) |
| 35 to 44 Years | 106 (93.0%) | 8 (7.0%) |
| 45 to 54 Years | 126 (89.4%) | 15 (10.6%) |
| 55 to 64 Years | 151 (93.8%) | 10 (6.2%) |
| 65 to 74 Years | 79 (100.0%) | 0 (0.0%) |
| 75 Years and older | 66 (100.0%) | 0 (0.0%) |
| Total | 856 (95.2%) | 43 (4.8%) |
Health Insurance Coverage by Citizenship Status in Mazeppa
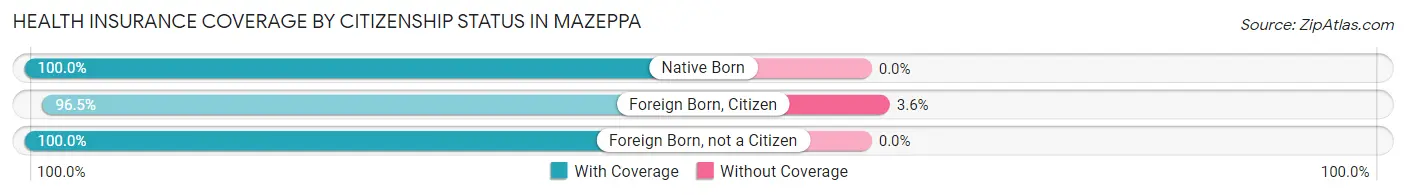
| Citizenship Status | With Coverage | Without Coverage |
| Native Born | 77 (100.0%) | 0 (0.0%) |
| Foreign Born, Citizen | 136 (96.5%) | 5 (3.5%) |
| Foreign Born, not a Citizen | 41 (100.0%) | 0 (0.0%) |
Health Insurance Coverage by Household Income in Mazeppa
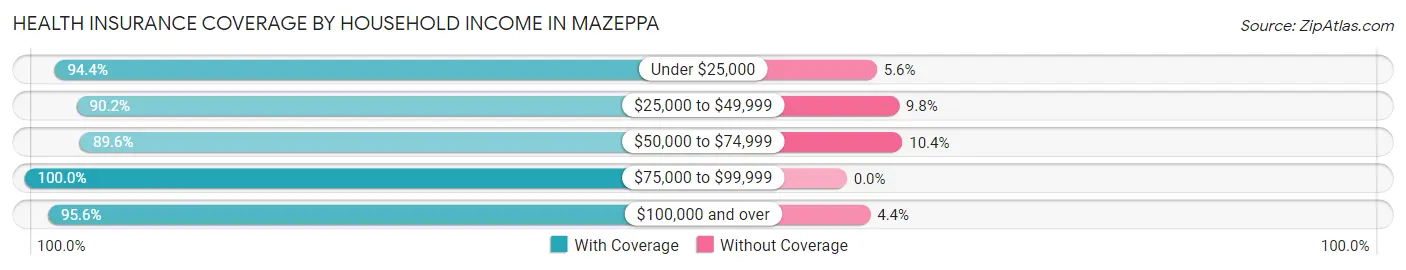
| Household Income | With Coverage | Without Coverage |
| Under $25,000 | 84 (94.4%) | 5 (5.6%) |
| $25,000 to $49,999 | 74 (90.2%) | 8 (9.8%) |
| $50,000 to $74,999 | 112 (89.6%) | 13 (10.4%) |
| $75,000 to $99,999 | 217 (100.0%) | 0 (0.0%) |
| $100,000 and over | 369 (95.6%) | 17 (4.4%) |
Public vs Private Health Insurance Coverage by Age in Mazeppa
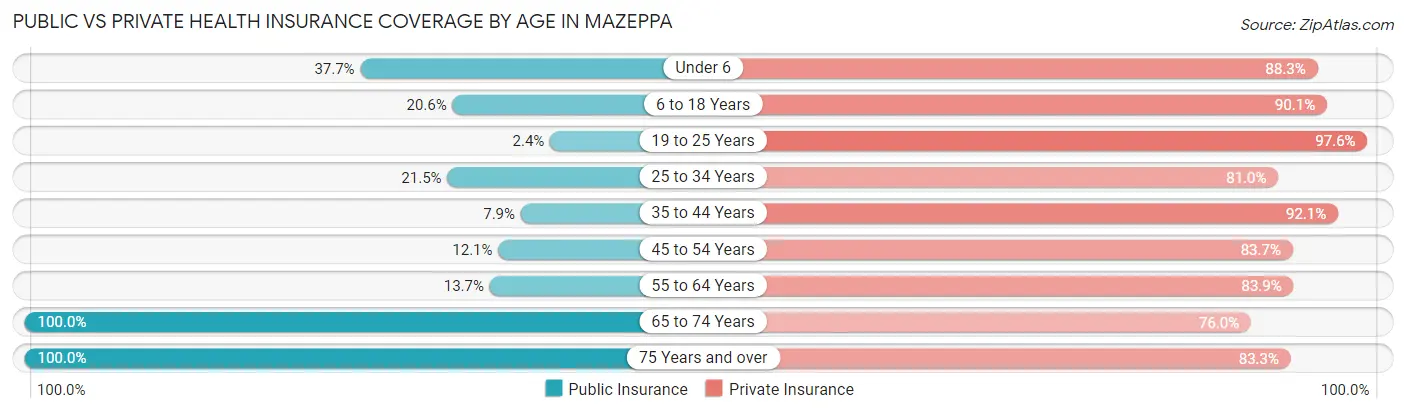
| Age Bracket | Public Insurance | Private Insurance |
| Under 6 | 29 (37.7%) | 68 (88.3%) |
| 6 to 18 Years | 29 (20.6%) | 127 (90.1%) |
| 19 to 25 Years | 1 (2.4%) | 40 (97.6%) |
| 25 to 34 Years | 17 (21.5%) | 64 (81.0%) |
| 35 to 44 Years | 9 (7.9%) | 105 (92.1%) |
| 45 to 54 Years | 17 (12.1%) | 118 (83.7%) |
| 55 to 64 Years | 22 (13.7%) | 135 (83.9%) |
| 65 to 74 Years | 79 (100.0%) | 60 (75.9%) |
| 75 Years and over | 66 (100.0%) | 55 (83.3%) |
| Total | 269 (29.9%) | 772 (85.9%) |
Disability Status by Sex by Age in Mazeppa
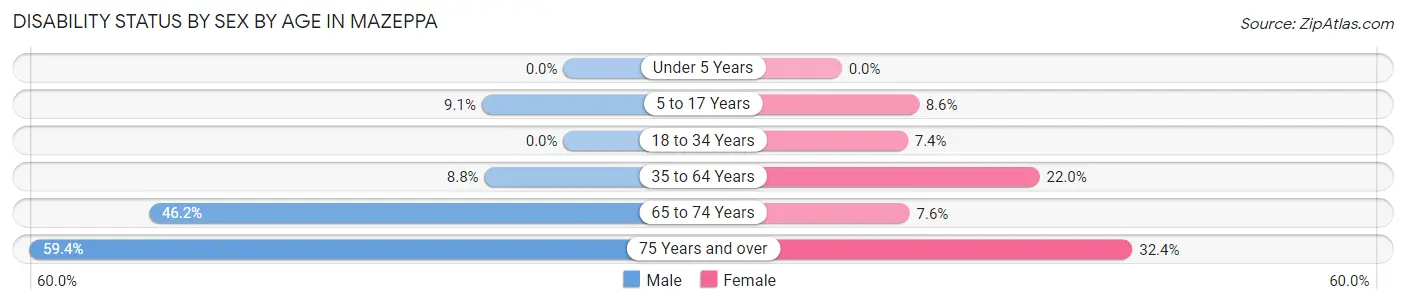
| Age Bracket | Male | Female |
| Under 5 Years | 0 (0.0%) | 0 (0.0%) |
| 5 to 17 Years | 7 (9.1%) | 6 (8.6%) |
| 18 to 34 Years | 0 (0.0%) | 5 (7.3%) |
| 35 to 64 Years | 21 (8.8%) | 39 (22.0%) |
| 65 to 74 Years | 12 (46.2%) | 4 (7.5%) |
| 75 Years and over | 19 (59.4%) | 11 (32.4%) |
Disability Class by Sex by Age in Mazeppa
Disability Class: Hearing Difficulty
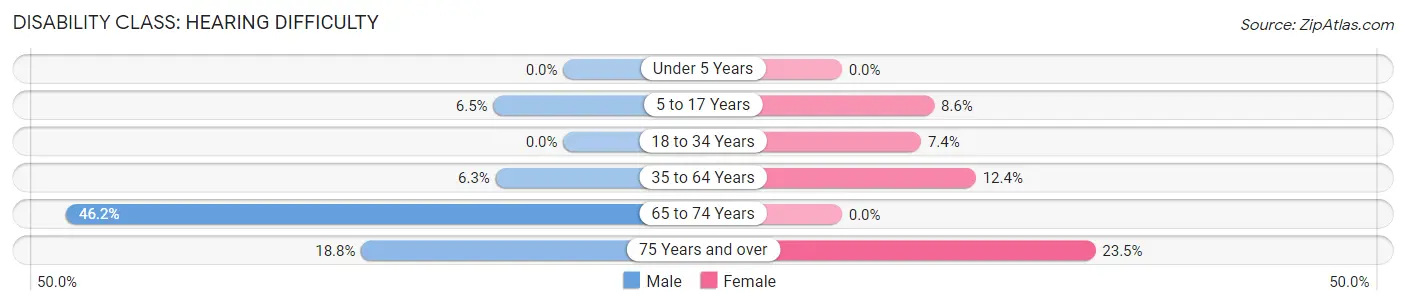
| Age Bracket | Male | Female |
| Under 5 Years | 0 (0.0%) | 0 (0.0%) |
| 5 to 17 Years | 5 (6.5%) | 6 (8.6%) |
| 18 to 34 Years | 0 (0.0%) | 5 (7.3%) |
| 35 to 64 Years | 15 (6.3%) | 22 (12.4%) |
| 65 to 74 Years | 12 (46.2%) | 0 (0.0%) |
| 75 Years and over | 6 (18.8%) | 8 (23.5%) |
Disability Class: Vision Difficulty
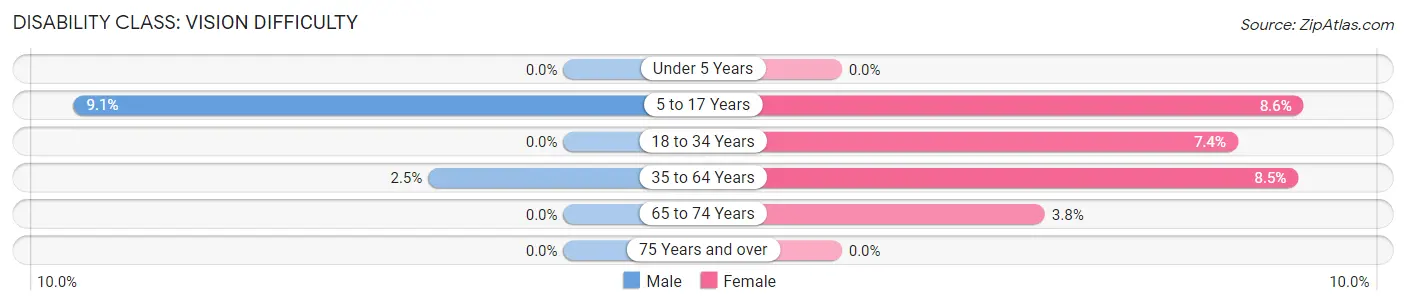
| Age Bracket | Male | Female |
| Under 5 Years | 0 (0.0%) | 0 (0.0%) |
| 5 to 17 Years | 7 (9.1%) | 6 (8.6%) |
| 18 to 34 Years | 0 (0.0%) | 5 (7.3%) |
| 35 to 64 Years | 6 (2.5%) | 15 (8.5%) |
| 65 to 74 Years | 0 (0.0%) | 2 (3.8%) |
| 75 Years and over | 0 (0.0%) | 0 (0.0%) |
Disability Class: Cognitive Difficulty
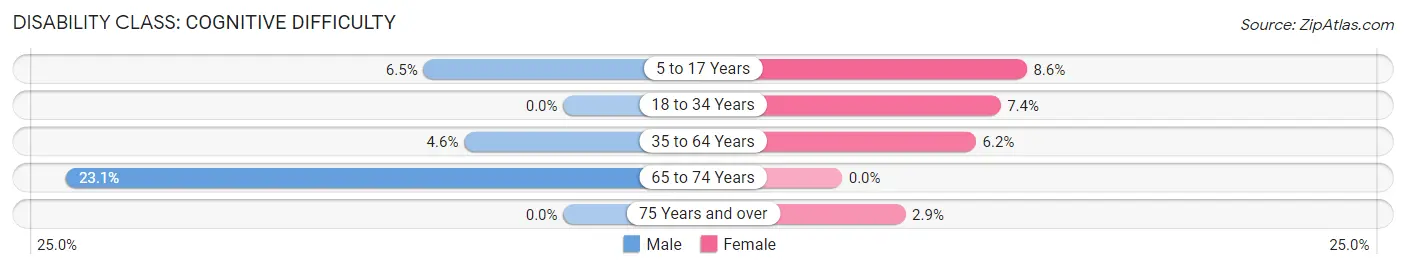
| Age Bracket | Male | Female |
| 5 to 17 Years | 5 (6.5%) | 6 (8.6%) |
| 18 to 34 Years | 0 (0.0%) | 5 (7.3%) |
| 35 to 64 Years | 11 (4.6%) | 11 (6.2%) |
| 65 to 74 Years | 6 (23.1%) | 0 (0.0%) |
| 75 Years and over | 0 (0.0%) | 1 (2.9%) |
Disability Class: Ambulatory Difficulty
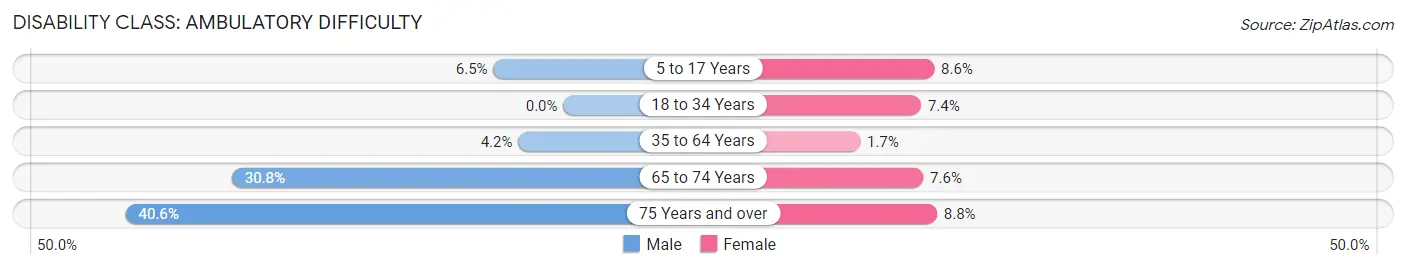
| Age Bracket | Male | Female |
| 5 to 17 Years | 5 (6.5%) | 6 (8.6%) |
| 18 to 34 Years | 0 (0.0%) | 5 (7.3%) |
| 35 to 64 Years | 10 (4.2%) | 3 (1.7%) |
| 65 to 74 Years | 8 (30.8%) | 4 (7.5%) |
| 75 Years and over | 13 (40.6%) | 3 (8.8%) |
Disability Class: Self-Care Difficulty
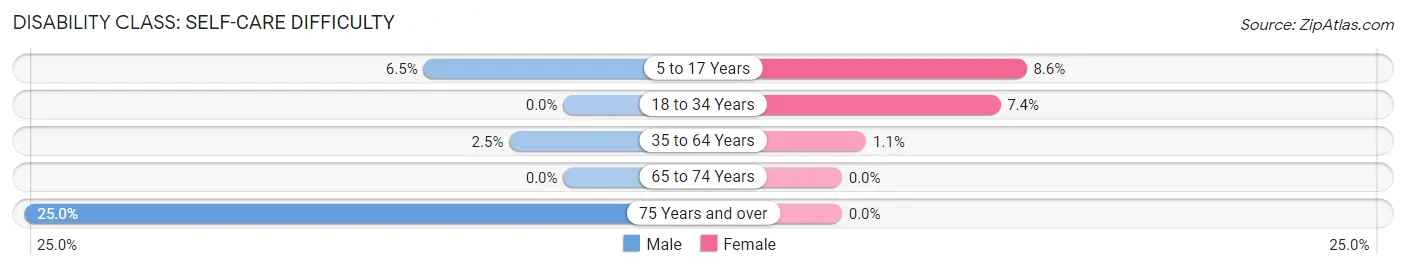
| Age Bracket | Male | Female |
| 5 to 17 Years | 5 (6.5%) | 6 (8.6%) |
| 18 to 34 Years | 0 (0.0%) | 5 (7.3%) |
| 35 to 64 Years | 6 (2.5%) | 2 (1.1%) |
| 65 to 74 Years | 0 (0.0%) | 0 (0.0%) |
| 75 Years and over | 8 (25.0%) | 0 (0.0%) |
Technology Access in Mazeppa
Computing Device Access in Mazeppa
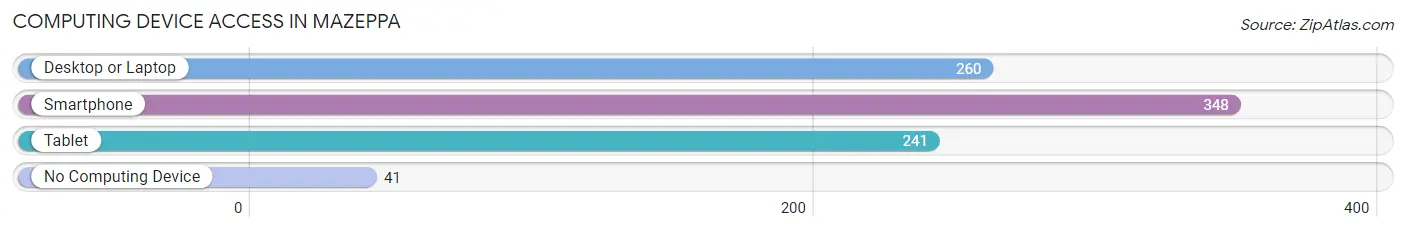
| Device Type | # Households | % Households |
| Desktop or Laptop | 260 | 65.8% |
| Smartphone | 348 | 88.1% |
| Tablet | 241 | 61.0% |
| No Computing Device | 41 | 10.4% |
| Total | 395 | 100.0% |
Internet Access in Mazeppa
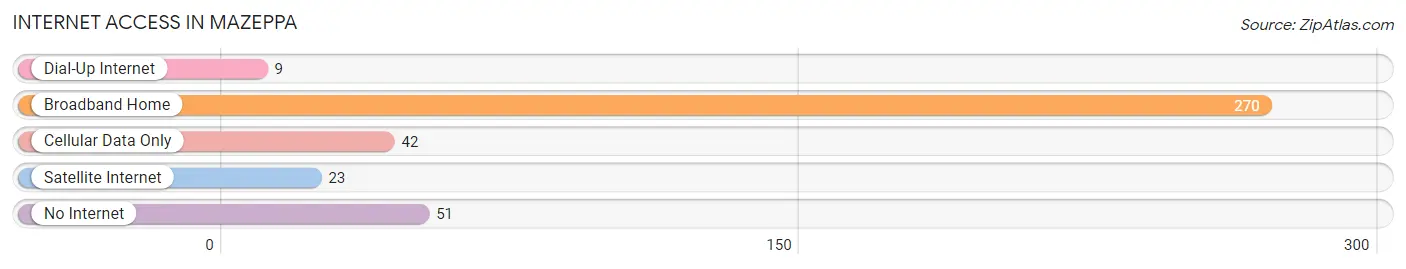
| Internet Type | # Households | % Households |
| Dial-Up Internet | 9 | 2.3% |
| Broadband Home | 270 | 68.3% |
| Cellular Data Only | 42 | 10.6% |
| Satellite Internet | 23 | 5.8% |
| No Internet | 51 | 12.9% |
| Total | 395 | 100.0% |
Mazeppa Summary
Mazeppa, Minnesota is a small city located in Wabasha County, in the southeastern corner of the state. The city is situated on the banks of the Zumbro River, and is surrounded by rolling hills and farmland. Mazeppa has a population of 1,717 people, according to the 2010 census.
Mazeppa was founded in 1854 by a group of settlers from New York. The city was named after the Polish nobleman, Jan Matejko's painting, "Mazeppa." The city was incorporated in 1858, and the first post office was established in 1859.
Geographically, Mazeppa is located in the Driftless Area of Minnesota, which is characterized by its rugged terrain and rolling hills. The city is located in the Zumbro River Valley, and is surrounded by the Zumbro River, the Mississippi River, and the Root River. The city is located approximately 30 miles from Rochester, Minnesota, and is about an hour and a half drive from the Twin Cities.
The economy of Mazeppa is largely based on agriculture. The city is home to several farms, including dairy, beef, and poultry farms. Mazeppa is also home to several small businesses, including a grocery store, a hardware store, and a few restaurants. The city is also home to a few manufacturing companies, including a plastics manufacturer and a metal fabrication company.
Demographically, Mazeppa is a predominantly white city, with a population that is 97.2% white, according to the 2010 census. The city has a median household income of $45,813, and a poverty rate of 11.2%. The city has a high school graduation rate of 87.3%, and a college graduation rate of 28.2%.
Mazeppa is a small city with a rich history and a strong sense of community. The city is home to a variety of businesses, and is surrounded by beautiful scenery. The city is a great place to live, work, and raise a family.
Common Questions
What is Per Capita Income in Mazeppa?
Per Capita income in Mazeppa is $41,988.
What is the Median Family Income in Mazeppa?
Median Family Income in Mazeppa is $91,875.
What is the Median Household income in Mazeppa?
Median Household Income in Mazeppa is $84,917.
What is Income or Wage Gap in Mazeppa?
Income or Wage Gap in Mazeppa is 30.1%.
Women in Mazeppa earn 69.9 cents for every dollar earned by a man.
What is Inequality or Gini Index in Mazeppa?
Inequality or Gini Index in Mazeppa is 0.39.
What is the Total Population of Mazeppa?
Total Population of Mazeppa is 901.
What is the Total Male Population of Mazeppa?
Total Male Population of Mazeppa is 475.
What is the Total Female Population of Mazeppa?
Total Female Population of Mazeppa is 426.
What is the Ratio of Males per 100 Females in Mazeppa?
There are 111.50 Males per 100 Females in Mazeppa.
What is the Ratio of Females per 100 Males in Mazeppa?
There are 89.68 Females per 100 Males in Mazeppa.
What is the Median Population Age in Mazeppa?
Median Population Age in Mazeppa is 44.8 Years.
What is the Average Family Size in Mazeppa
Average Family Size in Mazeppa is 2.7 People.
What is the Average Household Size in Mazeppa
Average Household Size in Mazeppa is 2.3 People.
How Large is the Labor Force in Mazeppa?
There are 485 People in the Labor Forcein in Mazeppa.
What is the Percentage of People in the Labor Force in Mazeppa?
68.9% of People are in the Labor Force in Mazeppa.
What is the Unemployment Rate in Mazeppa?
Unemployment Rate in Mazeppa is 3.7%.