Eldred borough, PA Map & Demographics
Eldred borough Overview
$32,499
PER CAPITA INCOME
$80,833
AVG FAMILY INCOME
$38,345
AVG HOUSEHOLD INCOME
24.1%
WAGE / INCOME GAP [ % ]
75.9¢/ $1
WAGE / INCOME GAP [ $ ]
0.48
INEQUALITY / GINI INDEX
414
TOTAL POPULATION
187
MALE POPULATION
227
FEMALE POPULATION
82.38
MALES / 100 FEMALES
121.39
FEMALES / 100 MALES
58.3
MEDIAN AGE
3.0
AVG FAMILY SIZE
1.8
AVG HOUSEHOLD SIZE
132
LABOR FORCE [ PEOPLE ]
36.4%
PERCENT IN LABOR FORCE
12.9%
UNEMPLOYMENT RATE
Income in Eldred borough
Income Overview in Eldred borough
Per Capita Income in Eldred borough is $32,499, while median incomes of families and households are $80,833 and $38,345 respectively.
| Characteristic | Number | Measure |
| Per Capita Income | 414 | $32,499 |
| Median Family Income | 90 | $80,833 |
| Mean Family Income | 90 | $86,118 |
| Median Household Income | 227 | $38,345 |
| Mean Household Income | 227 | $55,341 |
| Income Deficit | 90 | $0 |
| Wage / Income Gap (%) | 414 | 24.09% |
| Wage / Income Gap ($) | 414 | 75.91¢ per $1 |
| Gini / Inequality Index | 414 | 0.48 |
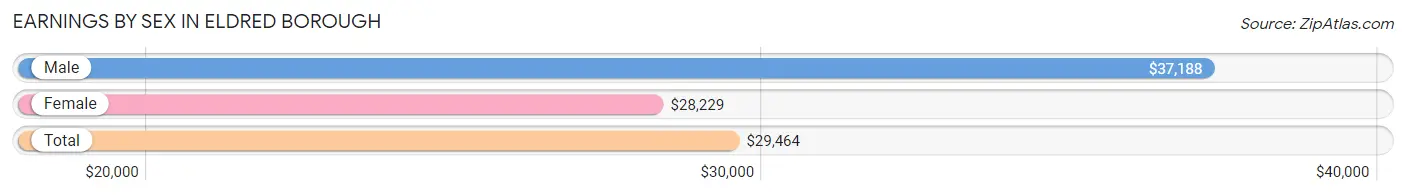
Earnings by Sex in Eldred borough
Average Earnings in Eldred borough are $29,464, $37,188 for men and $28,229 for women, a difference of 24.1%.
| Sex | Number | Average Earnings |
| Male | 73 (50.7%) | $37,188 |
| Female | 71 (49.3%) | $28,229 |
| Total | 144 (100.0%) | $29,464 |
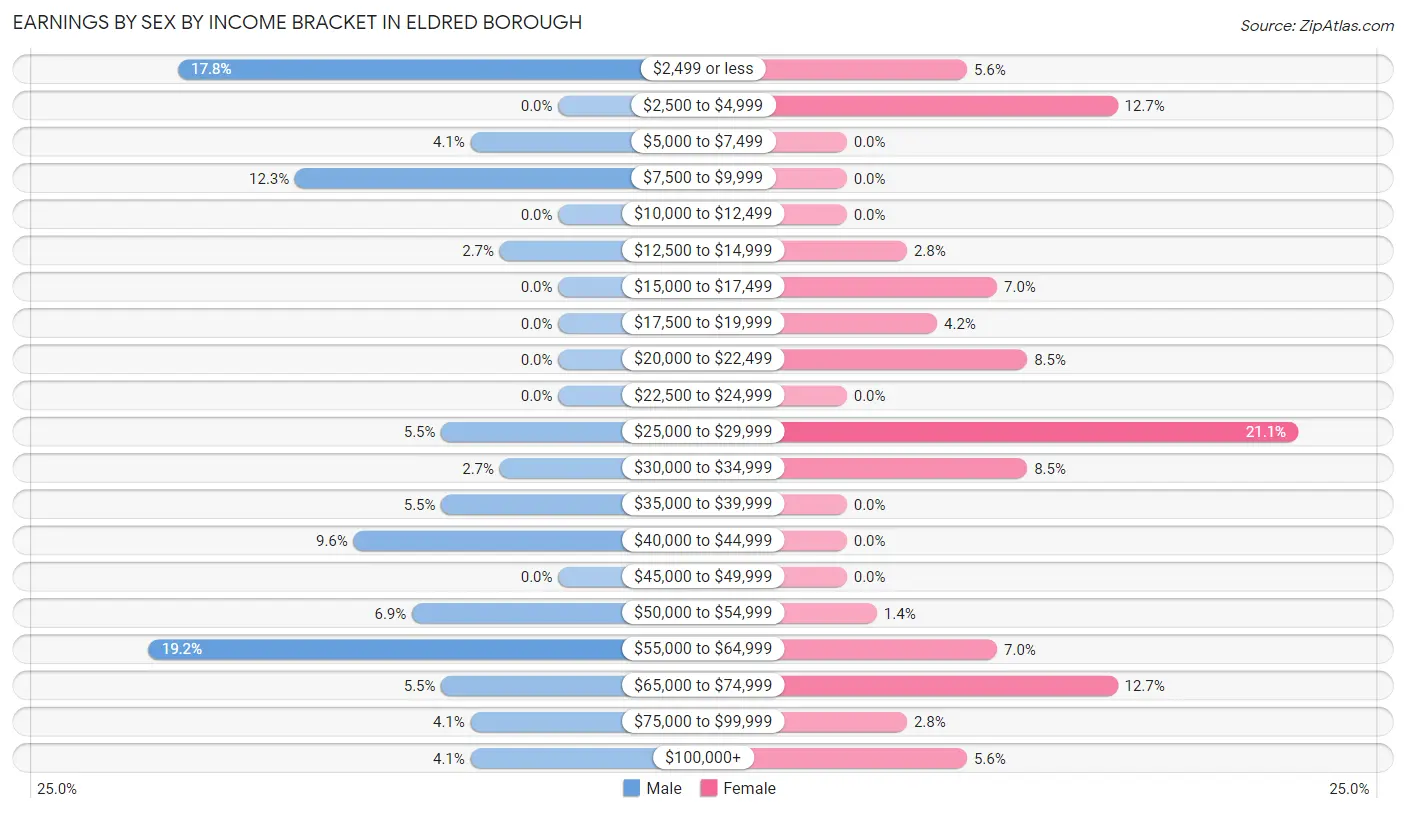
Earnings by Sex by Income Bracket in Eldred borough
The most common earnings brackets in Eldred borough are $55,000 to $64,999 for men (14 | 19.2%) and $25,000 to $29,999 for women (15 | 21.1%).
| Income | Male | Female |
| $2,499 or less | 13 (17.8%) | 4 (5.6%) |
| $2,500 to $4,999 | 0 (0.0%) | 9 (12.7%) |
| $5,000 to $7,499 | 3 (4.1%) | 0 (0.0%) |
| $7,500 to $9,999 | 9 (12.3%) | 0 (0.0%) |
| $10,000 to $12,499 | 0 (0.0%) | 0 (0.0%) |
| $12,500 to $14,999 | 2 (2.7%) | 2 (2.8%) |
| $15,000 to $17,499 | 0 (0.0%) | 5 (7.0%) |
| $17,500 to $19,999 | 0 (0.0%) | 3 (4.2%) |
| $20,000 to $22,499 | 0 (0.0%) | 6 (8.5%) |
| $22,500 to $24,999 | 0 (0.0%) | 0 (0.0%) |
| $25,000 to $29,999 | 4 (5.5%) | 15 (21.1%) |
| $30,000 to $34,999 | 2 (2.7%) | 6 (8.5%) |
| $35,000 to $39,999 | 4 (5.5%) | 0 (0.0%) |
| $40,000 to $44,999 | 7 (9.6%) | 0 (0.0%) |
| $45,000 to $49,999 | 0 (0.0%) | 0 (0.0%) |
| $50,000 to $54,999 | 5 (6.9%) | 1 (1.4%) |
| $55,000 to $64,999 | 14 (19.2%) | 5 (7.0%) |
| $65,000 to $74,999 | 4 (5.5%) | 9 (12.7%) |
| $75,000 to $99,999 | 3 (4.1%) | 2 (2.8%) |
| $100,000+ | 3 (4.1%) | 4 (5.6%) |
| Total | 73 (100.0%) | 71 (100.0%) |
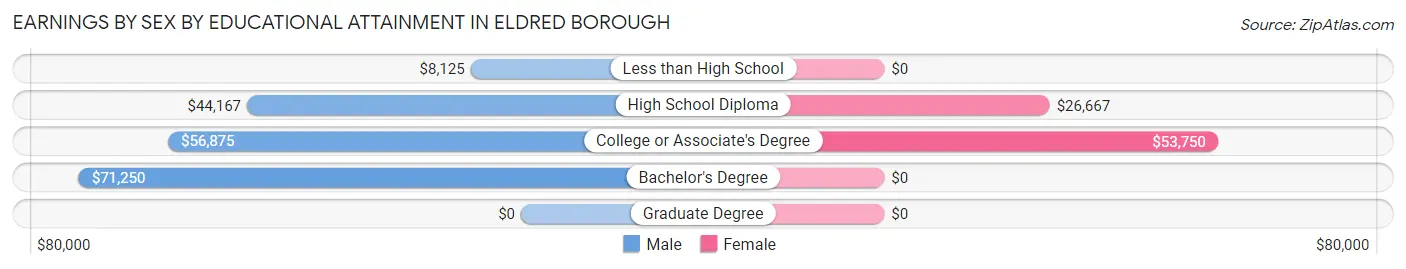
Earnings by Sex by Educational Attainment in Eldred borough
Average earnings in Eldred borough are $44,821 for men and $26,667 for women, a difference of 40.5%. Men with an educational attainment of bachelor's degree enjoy the highest average annual earnings of $71,250, while those with less than high school education earn the least with $8,125. Women with an educational attainment of college or associate's degree earn the most with the average annual earnings of $53,750, while those with high school diploma education have the smallest earnings of $26,667.
| Educational Attainment | Male Income | Female Income |
| Less than High School | $8,125 | $0 |
| High School Diploma | $44,167 | $26,667 |
| College or Associate's Degree | $56,875 | $53,750 |
| Bachelor's Degree | $71,250 | $0 |
| Graduate Degree | - | - |
| Total | $44,821 | $26,667 |
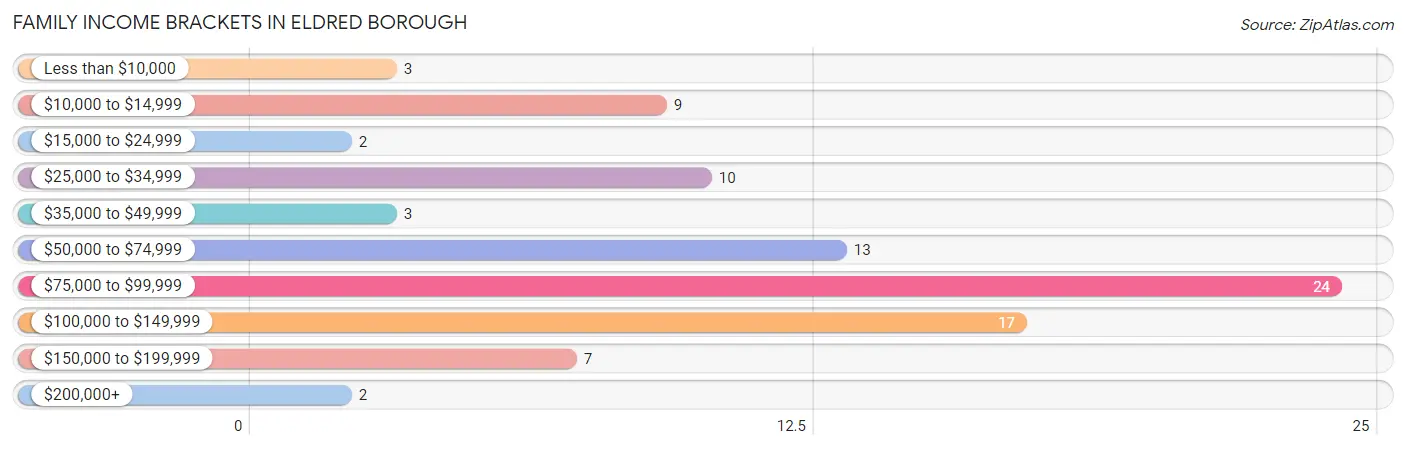
Family Income in Eldred borough
Family Income Brackets in Eldred borough
According to the Eldred borough family income data, there are 24 families falling into the $75,000 to $99,999 income range, which is the most common income bracket and makes up 26.7% of all families. Conversely, the $15,000 to $24,999 income bracket is the least frequent group with only 2 families (2.2%) belonging to this category.
| Income Bracket | # Families | % Families |
| Less than $10,000 | 3 | 3.3% |
| $10,000 to $14,999 | 9 | 10.0% |
| $15,000 to $24,999 | 2 | 2.2% |
| $25,000 to $34,999 | 10 | 11.1% |
| $35,000 to $49,999 | 3 | 3.3% |
| $50,000 to $74,999 | 13 | 14.4% |
| $75,000 to $99,999 | 24 | 26.7% |
| $100,000 to $149,999 | 17 | 18.9% |
| $150,000 to $199,999 | 7 | 7.8% |
| $200,000+ | 2 | 2.2% |
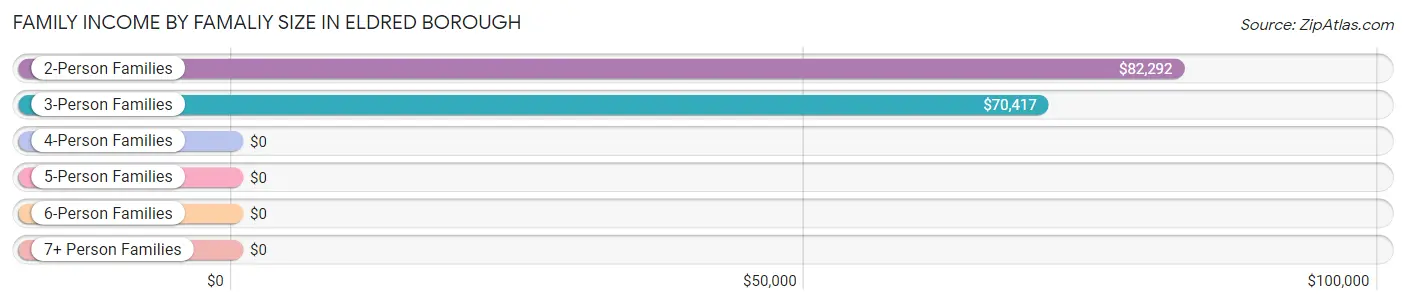
Family Income by Famaliy Size in Eldred borough
2-person families (53 | 58.9%) account for the highest median family income in Eldred borough with $82,292 per family, while 2-person families (53 | 58.9%) have the highest median income of $41,146 per family member.
| Income Bracket | # Families | Median Income |
| 2-Person Families | 53 (58.9%) | $82,292 |
| 3-Person Families | 19 (21.1%) | $70,417 |
| 4-Person Families | 9 (10.0%) | $0 |
| 5-Person Families | 1 (1.1%) | $0 |
| 6-Person Families | 0 (0.0%) | $0 |
| 7+ Person Families | 8 (8.9%) | $0 |
| Total | 90 (100.0%) | $80,833 |
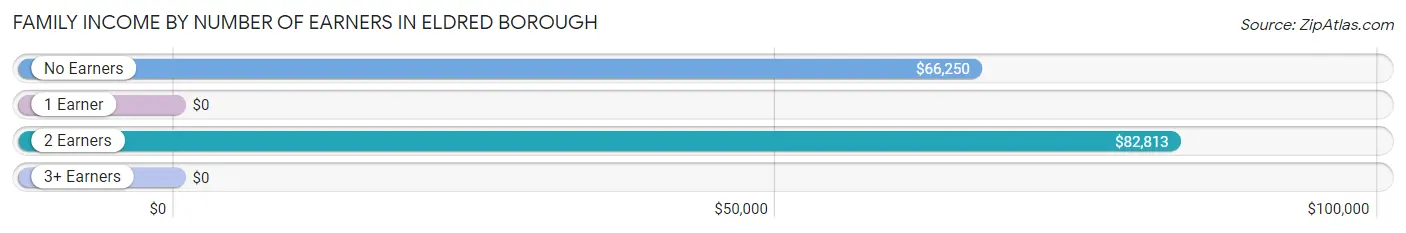
Family Income by Number of Earners in Eldred borough
| Number of Earners | # Families | Median Income |
| No Earners | 26 (28.9%) | $66,250 |
| 1 Earner | 22 (24.4%) | $0 |
| 2 Earners | 38 (42.2%) | $82,813 |
| 3+ Earners | 4 (4.4%) | $0 |
| Total | 90 (100.0%) | $80,833 |
Household Income in Eldred borough
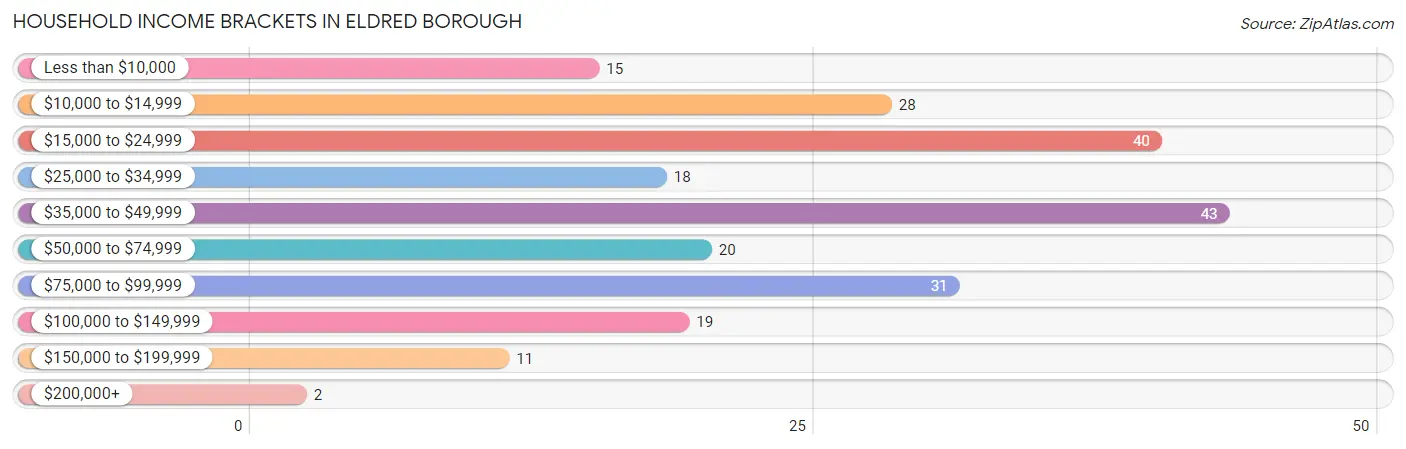
Household Income Brackets in Eldred borough
With 43 households falling in the category, the $35,000 to $49,999 income range is the most frequent in Eldred borough, accounting for 18.9% of all households. In contrast, only 2 households (0.9%) fall into the $200,000+ income bracket, making it the least populous group.
| Income Bracket | # Households | % Households |
| Less than $10,000 | 15 | 6.6% |
| $10,000 to $14,999 | 28 | 12.3% |
| $15,000 to $24,999 | 40 | 17.6% |
| $25,000 to $34,999 | 18 | 7.9% |
| $35,000 to $49,999 | 43 | 18.9% |
| $50,000 to $74,999 | 20 | 8.8% |
| $75,000 to $99,999 | 31 | 13.7% |
| $100,000 to $149,999 | 19 | 8.4% |
| $150,000 to $199,999 | 11 | 4.8% |
| $200,000+ | 2 | 0.9% |
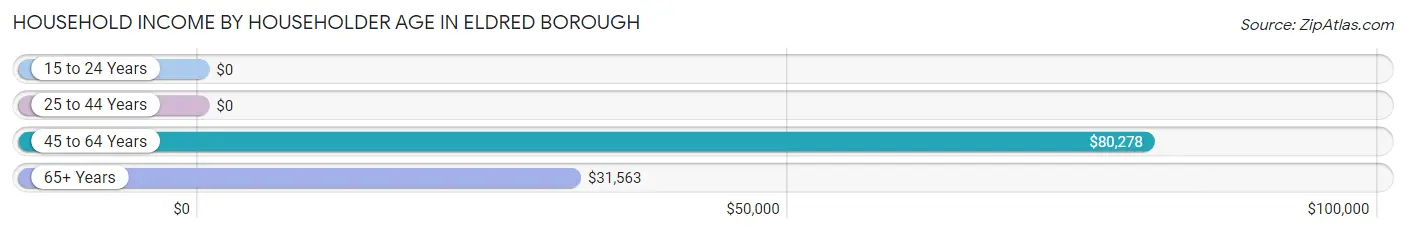
Household Income by Householder Age in Eldred borough
The median household income in Eldred borough is $38,345, with the highest median household income of $80,278 found in the 45 to 64 years age bracket for the primary householder. A total of 72 households (31.7%) fall into this category. Meanwhile, the 15 to 24 years age bracket for the primary householder has the lowest median household income of $0, with 3 households (1.3%) in this group.
| Income Bracket | # Households | Median Income |
| 15 to 24 Years | 3 (1.3%) | $0 |
| 25 to 44 Years | 34 (15.0%) | $0 |
| 45 to 64 Years | 72 (31.7%) | $80,278 |
| 65+ Years | 118 (52.0%) | $31,563 |
| Total | 227 (100.0%) | $38,345 |
Poverty in Eldred borough
Income Below Poverty by Sex and Age in Eldred borough
With 16.6% poverty level for males and 22.5% for females among the residents of Eldred borough, 6 to 11 year old males and 5 year old females are the most vulnerable to poverty, with 10 males (58.8%) and 3 females (100.0%) in their respective age groups living below the poverty level.
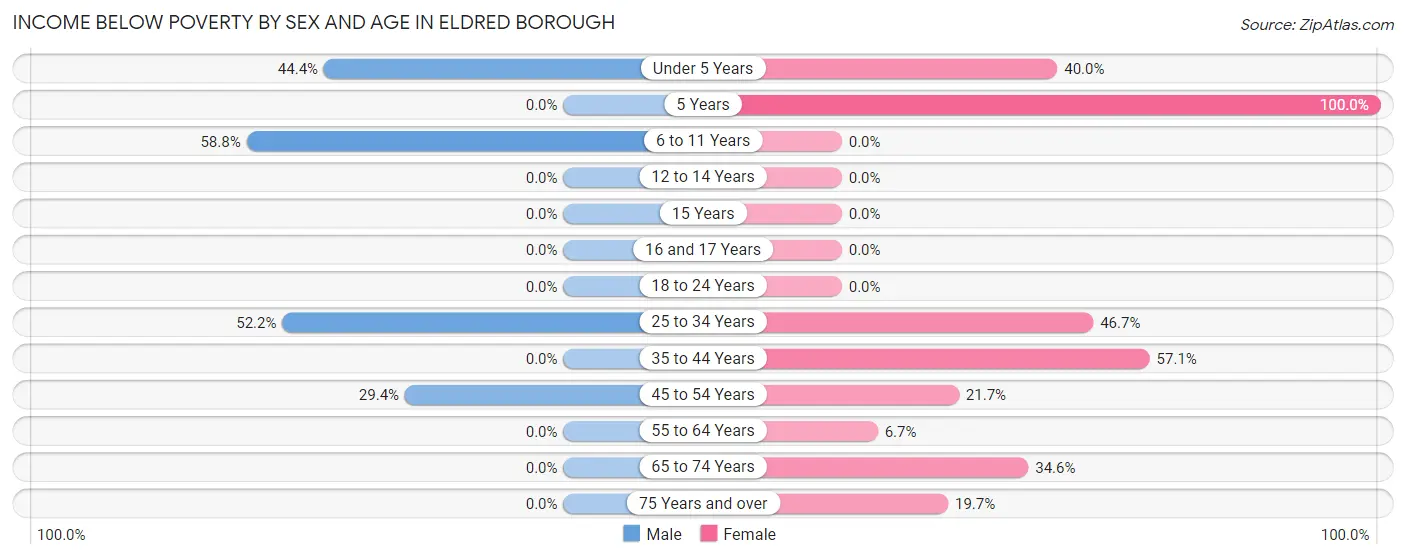
| Age Bracket | Male | Female |
| Under 5 Years | 4 (44.4%) | 2 (40.0%) |
| 5 Years | 0 (0.0%) | 3 (100.0%) |
| 6 to 11 Years | 10 (58.8%) | 0 (0.0%) |
| 12 to 14 Years | 0 (0.0%) | 0 (0.0%) |
| 15 Years | 0 (0.0%) | 0 (0.0%) |
| 16 and 17 Years | 0 (0.0%) | 0 (0.0%) |
| 18 to 24 Years | 0 (0.0%) | 0 (0.0%) |
| 25 to 34 Years | 12 (52.2%) | 7 (46.7%) |
| 35 to 44 Years | 0 (0.0%) | 8 (57.1%) |
| 45 to 54 Years | 5 (29.4%) | 5 (21.7%) |
| 55 to 64 Years | 0 (0.0%) | 3 (6.7%) |
| 65 to 74 Years | 0 (0.0%) | 9 (34.6%) |
| 75 Years and over | 0 (0.0%) | 14 (19.7%) |
| Total | 31 (16.6%) | 51 (22.5%) |
Income Above Poverty by Sex and Age in Eldred borough
According to the poverty statistics in Eldred borough, males aged 5 years and females aged 6 to 11 years are the age groups that are most secure financially, with 100.0% of males and 100.0% of females in these age groups living above the poverty line.
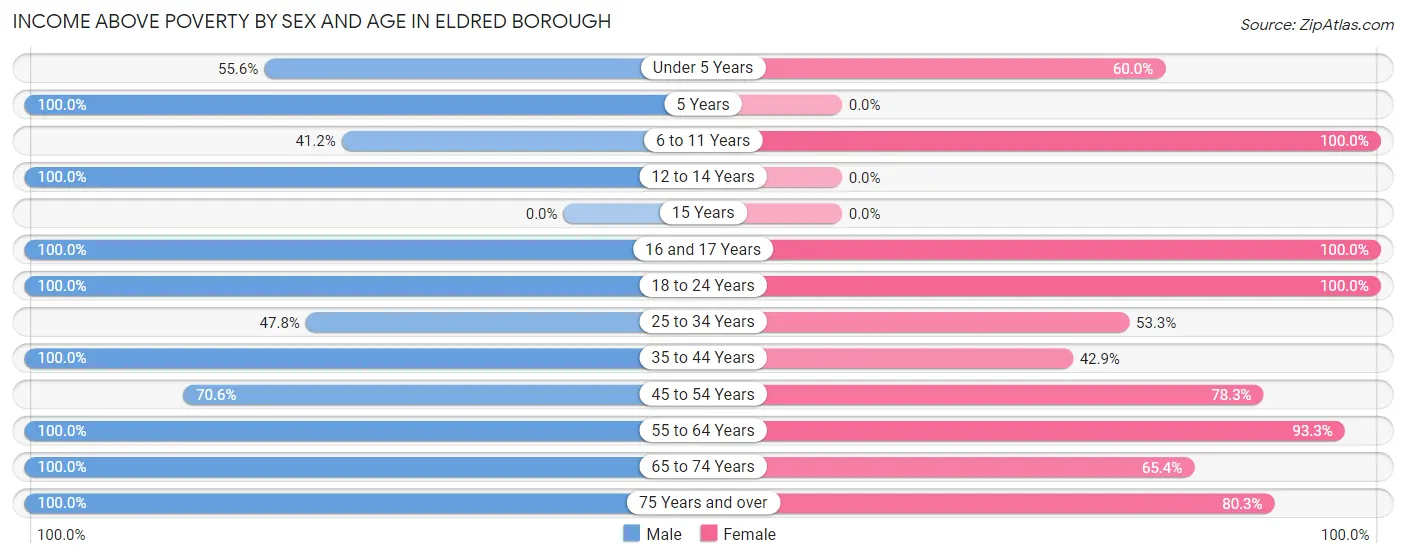
| Age Bracket | Male | Female |
| Under 5 Years | 5 (55.6%) | 3 (60.0%) |
| 5 Years | 2 (100.0%) | 0 (0.0%) |
| 6 to 11 Years | 7 (41.2%) | 6 (100.0%) |
| 12 to 14 Years | 9 (100.0%) | 0 (0.0%) |
| 15 Years | 0 (0.0%) | 0 (0.0%) |
| 16 and 17 Years | 7 (100.0%) | 4 (100.0%) |
| 18 to 24 Years | 10 (100.0%) | 15 (100.0%) |
| 25 to 34 Years | 11 (47.8%) | 8 (53.3%) |
| 35 to 44 Years | 5 (100.0%) | 6 (42.9%) |
| 45 to 54 Years | 12 (70.6%) | 18 (78.3%) |
| 55 to 64 Years | 37 (100.0%) | 42 (93.3%) |
| 65 to 74 Years | 40 (100.0%) | 17 (65.4%) |
| 75 Years and over | 11 (100.0%) | 57 (80.3%) |
| Total | 156 (83.4%) | 176 (77.5%) |
Income Below Poverty Among Married-Couple Families in Eldred borough
The poverty statistics for married-couple families in Eldred borough show that 9.1% or 6 of the total 66 families live below the poverty line. Families with 1 or 2 children have the highest poverty rate of 37.5%, comprising of 6 families. On the other hand, families with no children have the lowest poverty rate of 0.0%, which includes 0 families.
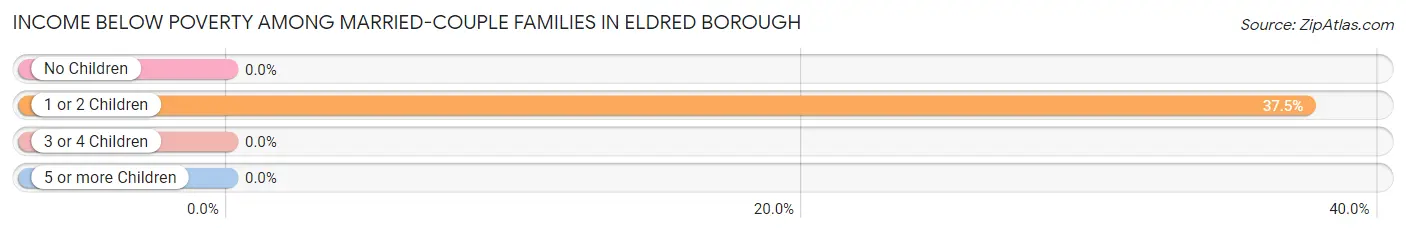
| Children | Above Poverty | Below Poverty |
| No Children | 42 (100.0%) | 0 (0.0%) |
| 1 or 2 Children | 10 (62.5%) | 6 (37.5%) |
| 3 or 4 Children | 8 (100.0%) | 0 (0.0%) |
| 5 or more Children | 0 (0.0%) | 0 (0.0%) |
| Total | 60 (90.9%) | 6 (9.1%) |
Income Below Poverty Among Single-Parent Households in Eldred borough
According to the poverty data in Eldred borough, 30.0% or 3 single-father households and 35.7% or 5 single-mother households are living below the poverty line. Among single-father households, those with 1 or 2 children have the highest poverty rate, with 3 households (100.0%) experiencing poverty. Likewise, among single-mother households, those with 3 or 4 children have the highest poverty rate, with 2 households (100.0%) falling below the poverty line.
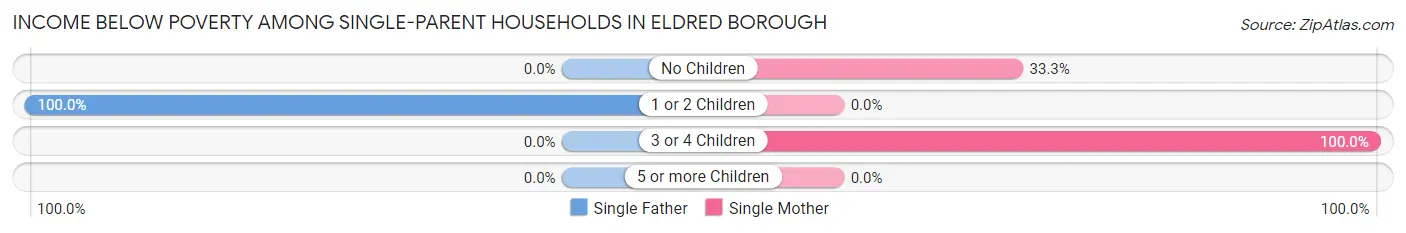
| Children | Single Father | Single Mother |
| No Children | 0 (0.0%) | 3 (33.3%) |
| 1 or 2 Children | 3 (100.0%) | 0 (0.0%) |
| 3 or 4 Children | 0 (0.0%) | 2 (100.0%) |
| 5 or more Children | 0 (0.0%) | 0 (0.0%) |
| Total | 3 (30.0%) | 5 (35.7%) |
Income Below Poverty Among Married-Couple vs Single-Parent Households in Eldred borough
The poverty data for Eldred borough shows that 6 of the married-couple family households (9.1%) and 8 of the single-parent households (33.3%) are living below the poverty level. Within the married-couple family households, those with 1 or 2 children have the highest poverty rate, with 6 households (37.5%) falling below the poverty line. Among the single-parent households, those with 3 or 4 children have the highest poverty rate, with 2 household (100.0%) living below poverty.
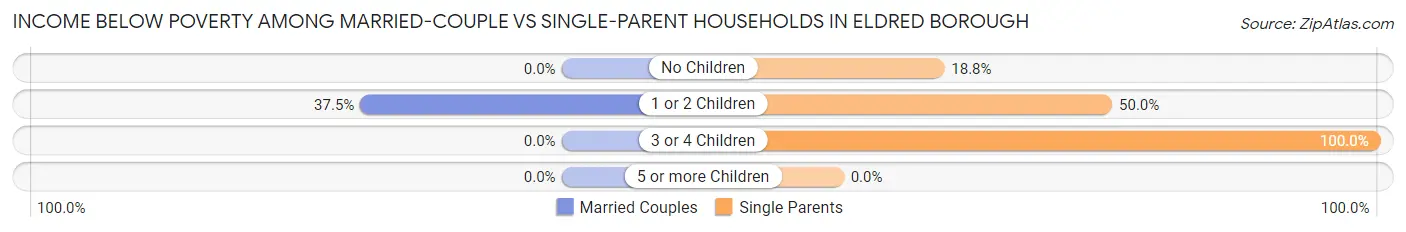
| Children | Married-Couple Families | Single-Parent Households |
| No Children | 0 (0.0%) | 3 (18.8%) |
| 1 or 2 Children | 6 (37.5%) | 3 (50.0%) |
| 3 or 4 Children | 0 (0.0%) | 2 (100.0%) |
| 5 or more Children | 0 (0.0%) | 0 (0.0%) |
| Total | 6 (9.1%) | 8 (33.3%) |
Race in Eldred borough
The most populous races in Eldred borough are White / Caucasian (410 | 99.0%), and Asian (4 | 1.0%).
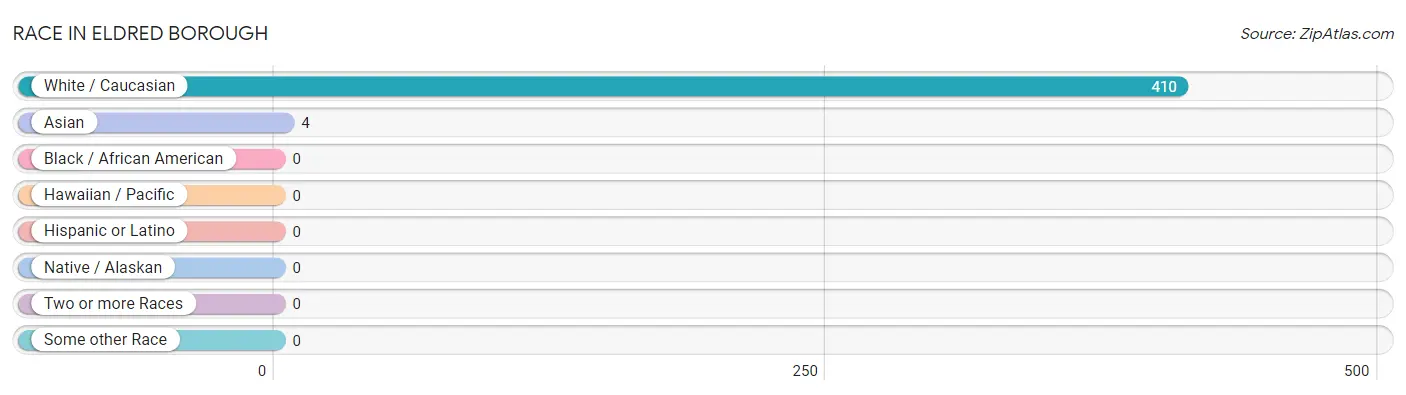
| Race | # Population | % Population |
| Asian | 4 | 1.0% |
| Black / African American | 0 | 0.0% |
| Hawaiian / Pacific | 0 | 0.0% |
| Hispanic or Latino | 0 | 0.0% |
| Native / Alaskan | 0 | 0.0% |
| White / Caucasian | 410 | 99.0% |
| Two or more Races | 0 | 0.0% |
| Some other Race | 0 | 0.0% |
| Total | 414 | 100.0% |
Ancestry in Eldred borough
The most populous ancestries reported in Eldred borough are German (122 | 29.5%), Irish (116 | 28.0%), English (55 | 13.3%), American (45 | 10.9%), and French (25 | 6.0%), together accounting for 87.7% of all Eldred borough residents.
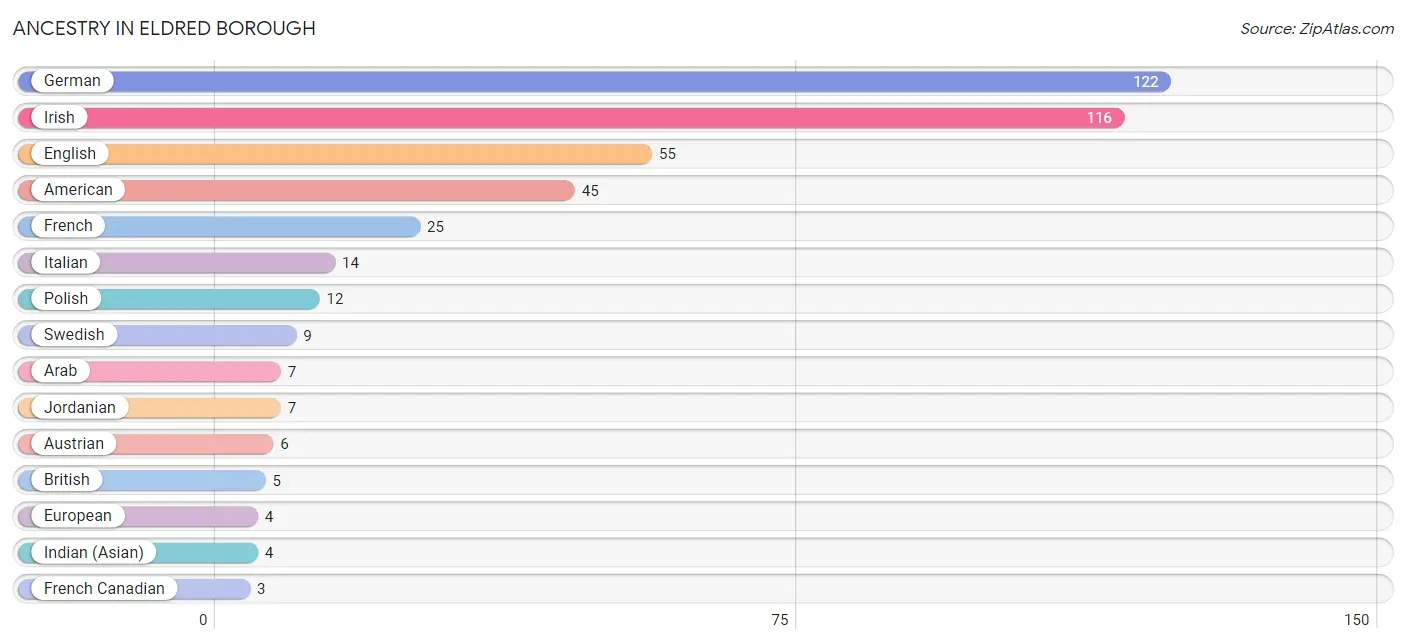
| Ancestry | # Population | % Population |
| American | 45 | 10.9% |
| Arab | 7 | 1.7% |
| Austrian | 6 | 1.5% |
| British | 5 | 1.2% |
| English | 55 | 13.3% |
| European | 4 | 1.0% |
| French | 25 | 6.0% |
| French Canadian | 3 | 0.7% |
| German | 122 | 29.5% |
| Indian (Asian) | 4 | 1.0% |
| Irish | 116 | 28.0% |
| Italian | 14 | 3.4% |
| Jordanian | 7 | 1.7% |
| Polish | 12 | 2.9% |
| Swedish | 9 | 2.2% |
| Swiss | 3 | 0.7% |
| Welsh | 2 | 0.5% | View All 17 Rows |
Immigrants in Eldred borough
The most numerous immigrant groups reported in Eldred borough came from Asia (4 | 1.0%), China (4 | 1.0%), Eastern Asia (4 | 1.0%), and Canada (3 | 0.7%), together accounting for 3.6% of all Eldred borough residents.
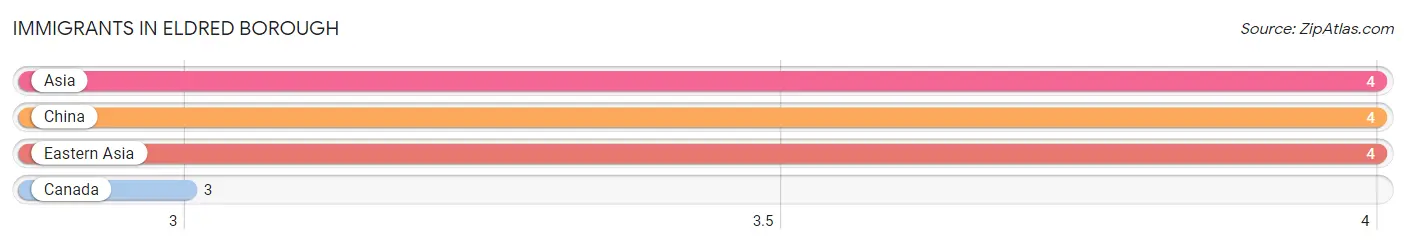
| Immigration Origin | # Population | % Population |
| Asia | 4 | 1.0% |
| Canada | 3 | 0.7% |
| China | 4 | 1.0% |
| Eastern Asia | 4 | 1.0% | View All 4 Rows |
Sex and Age in Eldred borough
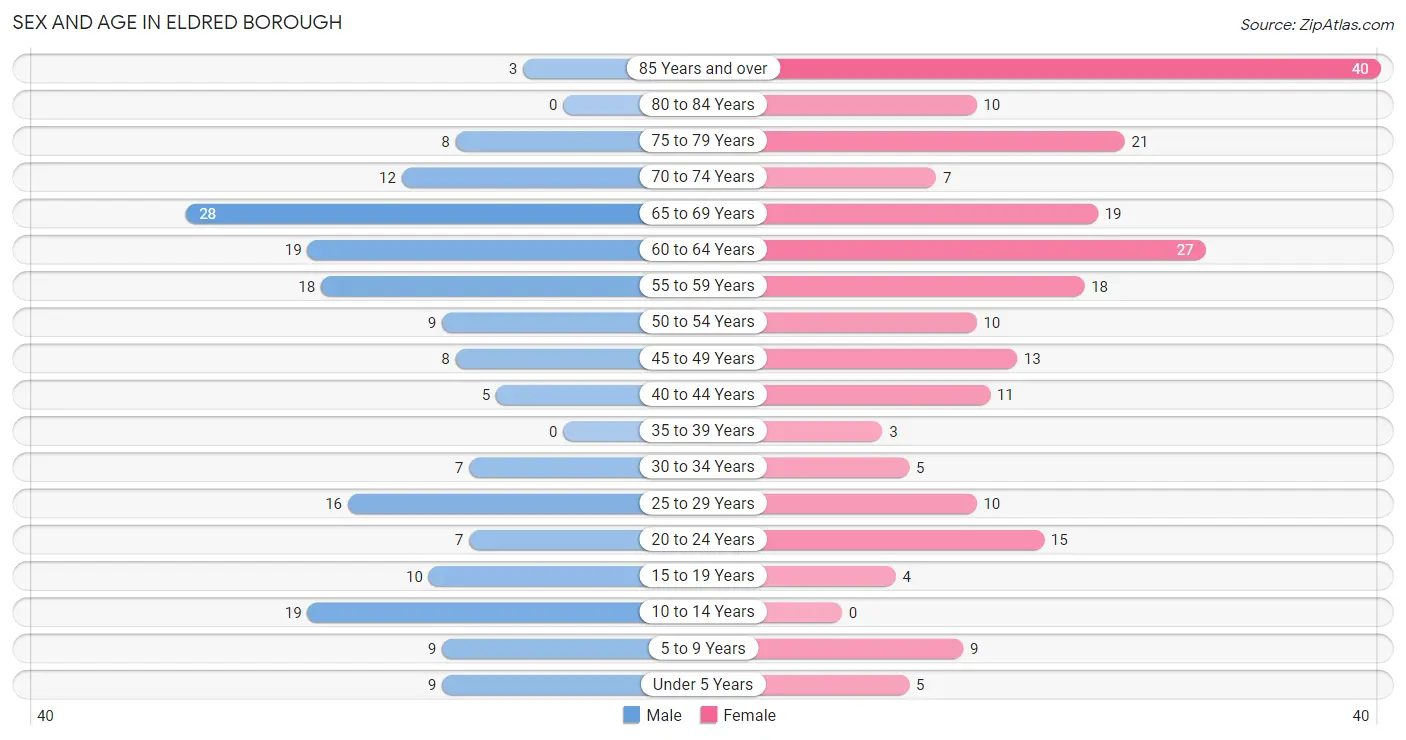
Sex and Age in Eldred borough
The most populous age groups in Eldred borough are 65 to 69 Years (28 | 15.0%) for men and 85 Years and over (40 | 17.6%) for women.
| Age Bracket | Male | Female |
| Under 5 Years | 9 (4.8%) | 5 (2.2%) |
| 5 to 9 Years | 9 (4.8%) | 9 (4.0%) |
| 10 to 14 Years | 19 (10.2%) | 0 (0.0%) |
| 15 to 19 Years | 10 (5.3%) | 4 (1.8%) |
| 20 to 24 Years | 7 (3.7%) | 15 (6.6%) |
| 25 to 29 Years | 16 (8.6%) | 10 (4.4%) |
| 30 to 34 Years | 7 (3.7%) | 5 (2.2%) |
| 35 to 39 Years | 0 (0.0%) | 3 (1.3%) |
| 40 to 44 Years | 5 (2.7%) | 11 (4.9%) |
| 45 to 49 Years | 8 (4.3%) | 13 (5.7%) |
| 50 to 54 Years | 9 (4.8%) | 10 (4.4%) |
| 55 to 59 Years | 18 (9.6%) | 18 (7.9%) |
| 60 to 64 Years | 19 (10.2%) | 27 (11.9%) |
| 65 to 69 Years | 28 (15.0%) | 19 (8.4%) |
| 70 to 74 Years | 12 (6.4%) | 7 (3.1%) |
| 75 to 79 Years | 8 (4.3%) | 21 (9.2%) |
| 80 to 84 Years | 0 (0.0%) | 10 (4.4%) |
| 85 Years and over | 3 (1.6%) | 40 (17.6%) |
| Total | 187 (100.0%) | 227 (100.0%) |
Families and Households in Eldred borough
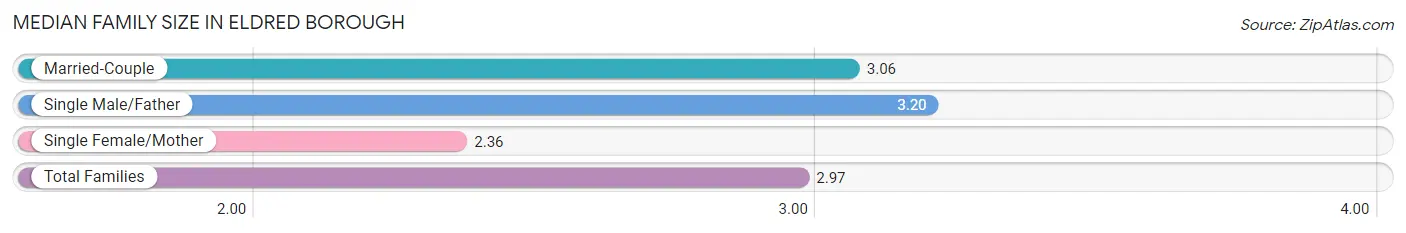
Median Family Size in Eldred borough
The median family size in Eldred borough is 2.97 persons per family, with single male/father families (10 | 11.1%) accounting for the largest median family size of 3.2 persons per family. On the other hand, single female/mother families (14 | 15.6%) represent the smallest median family size with 2.36 persons per family.
| Family Type | # Families | Family Size |
| Married-Couple | 66 (73.3%) | 3.06 |
| Single Male/Father | 10 (11.1%) | 3.20 |
| Single Female/Mother | 14 (15.6%) | 2.36 |
| Total Families | 90 (100.0%) | 2.97 |
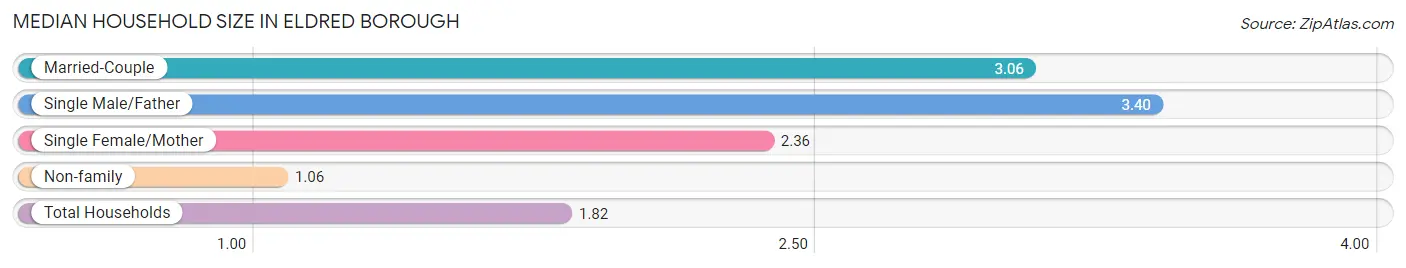
Median Household Size in Eldred borough
The median household size in Eldred borough is 1.82 persons per household, with single male/father households (10 | 4.4%) accounting for the largest median household size of 3.4 persons per household. non-family households (137 | 60.4%) represent the smallest median household size with 1.06 persons per household.
| Household Type | # Households | Household Size |
| Married-Couple | 66 (29.1%) | 3.06 |
| Single Male/Father | 10 (4.4%) | 3.40 |
| Single Female/Mother | 14 (6.2%) | 2.36 |
| Non-family | 137 (60.4%) | 1.06 |
| Total Households | 227 (100.0%) | 1.82 |
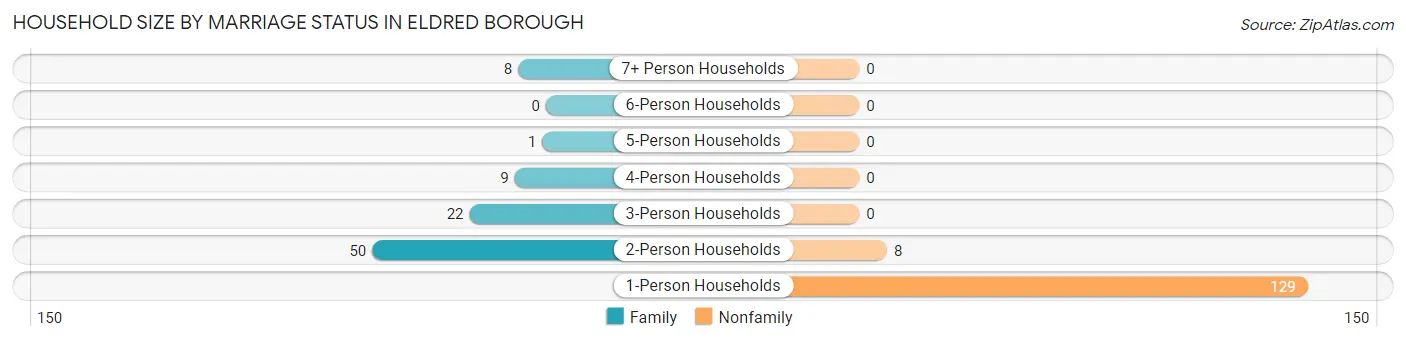
Household Size by Marriage Status in Eldred borough
Out of a total of 227 households in Eldred borough, 90 (39.7%) are family households, while 137 (60.4%) are nonfamily households. The most numerous type of family households are 2-person households, comprising 50, and the most common type of nonfamily households are 1-person households, comprising 129.
| Household Size | Family Households | Nonfamily Households |
| 1-Person Households | - | 129 (56.8%) |
| 2-Person Households | 50 (22.0%) | 8 (3.5%) |
| 3-Person Households | 22 (9.7%) | 0 (0.0%) |
| 4-Person Households | 9 (4.0%) | 0 (0.0%) |
| 5-Person Households | 1 (0.4%) | 0 (0.0%) |
| 6-Person Households | 0 (0.0%) | 0 (0.0%) |
| 7+ Person Households | 8 (3.5%) | 0 (0.0%) |
| Total | 90 (39.7%) | 137 (60.4%) |
Female Fertility in Eldred borough
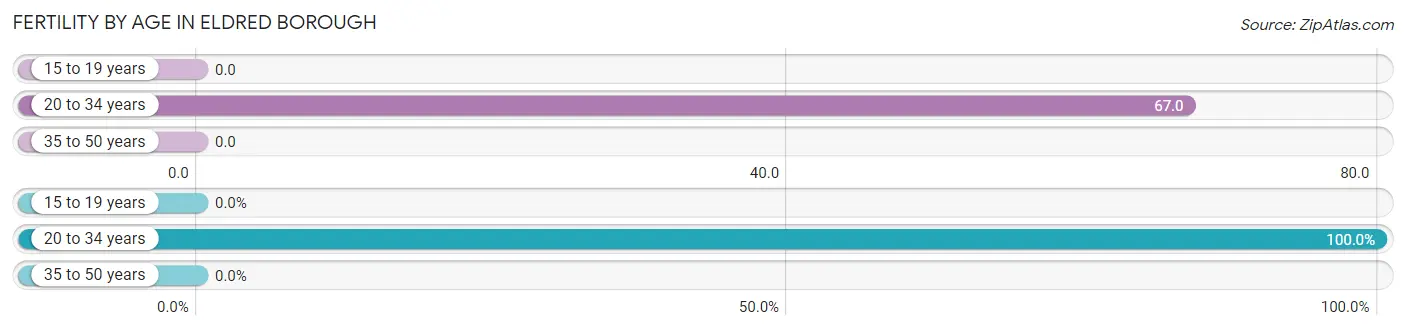
Fertility by Age in Eldred borough
Average fertility rate in Eldred borough is 33.0 births per 1,000 women. Women in the age bracket of 20 to 34 years have the highest fertility rate with 67.0 births per 1,000 women. Women in the age bracket of 20 to 34 years acount for 100.0% of all women with births.
| Age Bracket | Women with Births | Births / 1,000 Women |
| 15 to 19 years | 0 (0.0%) | 0.0 |
| 20 to 34 years | 2 (100.0%) | 67.0 |
| 35 to 50 years | 0 (0.0%) | 0.0 |
| Total | 2 (100.0%) | 33.0 |
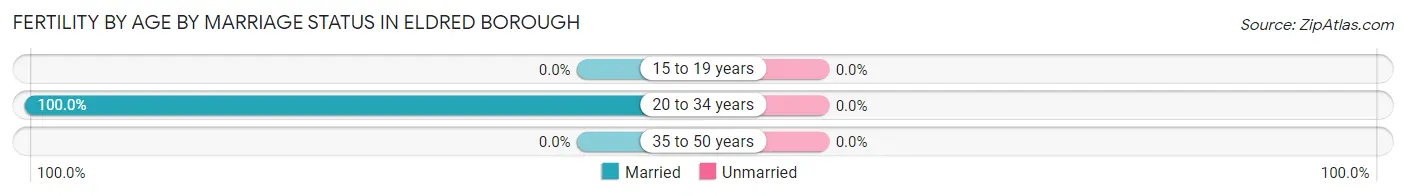
Fertility by Age by Marriage Status in Eldred borough
| Age Bracket | Married | Unmarried |
| 15 to 19 years | 0 (0.0%) | 0 (0.0%) |
| 20 to 34 years | 2 (100.0%) | 0 (0.0%) |
| 35 to 50 years | 0 (0.0%) | 0 (0.0%) |
| Total | 2 (100.0%) | 0 (0.0%) |
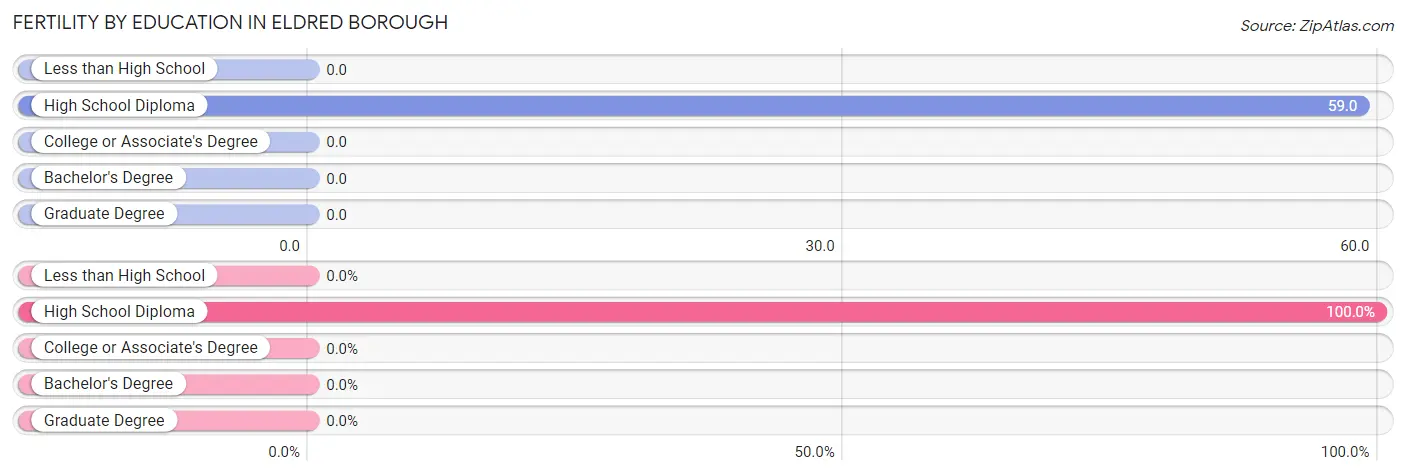
Fertility by Education in Eldred borough
| Educational Attainment | Women with Births | Births / 1,000 Women |
| Less than High School | 0 (0.0%) | 0.0 |
| High School Diploma | 2 (100.0%) | 59.0 |
| College or Associate's Degree | 0 (0.0%) | 0.0 |
| Bachelor's Degree | 0 (0.0%) | 0.0 |
| Graduate Degree | 0 (0.0%) | 0.0 |
| Total | 2 (100.0%) | 33.0 |
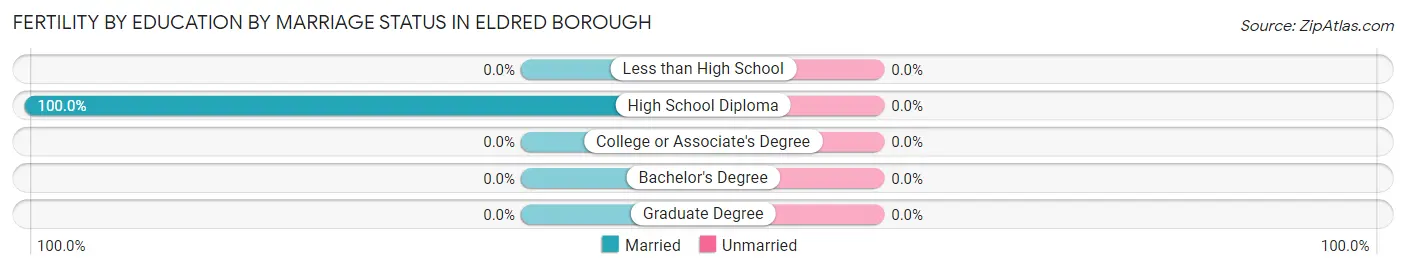
Fertility by Education by Marriage Status in Eldred borough
| Educational Attainment | Married | Unmarried |
| Less than High School | 0 (0.0%) | 0 (0.0%) |
| High School Diploma | 2 (100.0%) | 0 (0.0%) |
| College or Associate's Degree | 0 (0.0%) | 0 (0.0%) |
| Bachelor's Degree | 0 (0.0%) | 0 (0.0%) |
| Graduate Degree | 0 (0.0%) | 0 (0.0%) |
| Total | 2 (100.0%) | 0 (0.0%) |
Employment Characteristics in Eldred borough
Employment by Class of Employer in Eldred borough
Among the 109 employed individuals in Eldred borough, private company employees (63 | 57.8%), not-for-profit organizations (20 | 18.3%), and local government employees (11 | 10.1%) make up the most common classes of employment.
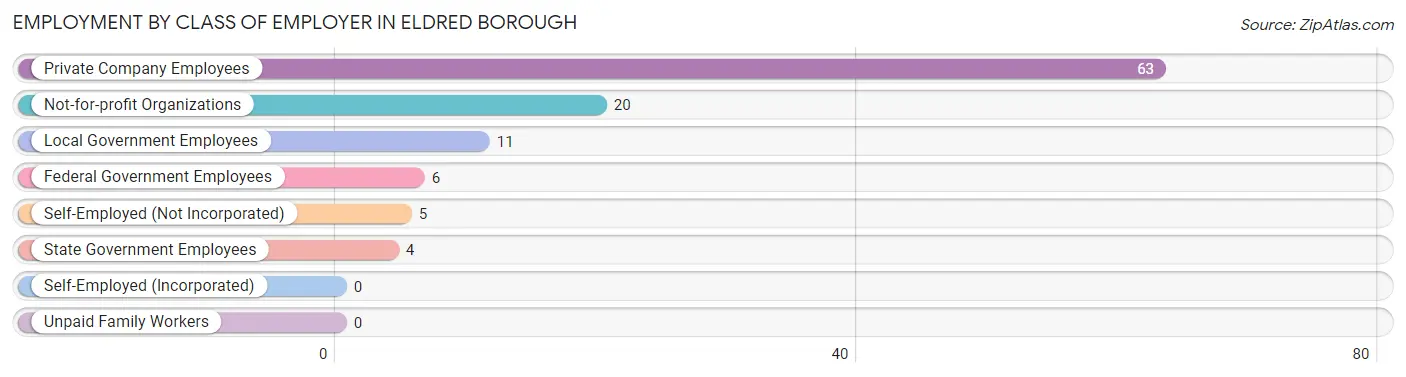
| Employer Class | # Employees | % Employees |
| Private Company Employees | 63 | 57.8% |
| Self-Employed (Incorporated) | 0 | 0.0% |
| Self-Employed (Not Incorporated) | 5 | 4.6% |
| Not-for-profit Organizations | 20 | 18.3% |
| Local Government Employees | 11 | 10.1% |
| State Government Employees | 4 | 3.7% |
| Federal Government Employees | 6 | 5.5% |
| Unpaid Family Workers | 0 | 0.0% |
| Total | 109 | 100.0% |
Employment Status by Age in Eldred borough
According to the labor force statistics for Eldred borough, out of the total population over 16 years of age (363), 36.4% or 132 individuals are in the labor force, with 12.9% or 17 of them unemployed. The age group with the highest labor force participation rate is 20 to 24 years, with 86.4% or 19 individuals in the labor force. Within the labor force, the 25 to 29 years age range has the highest percentage of unemployed individuals, with 47.6% or 10 of them being unemployed.
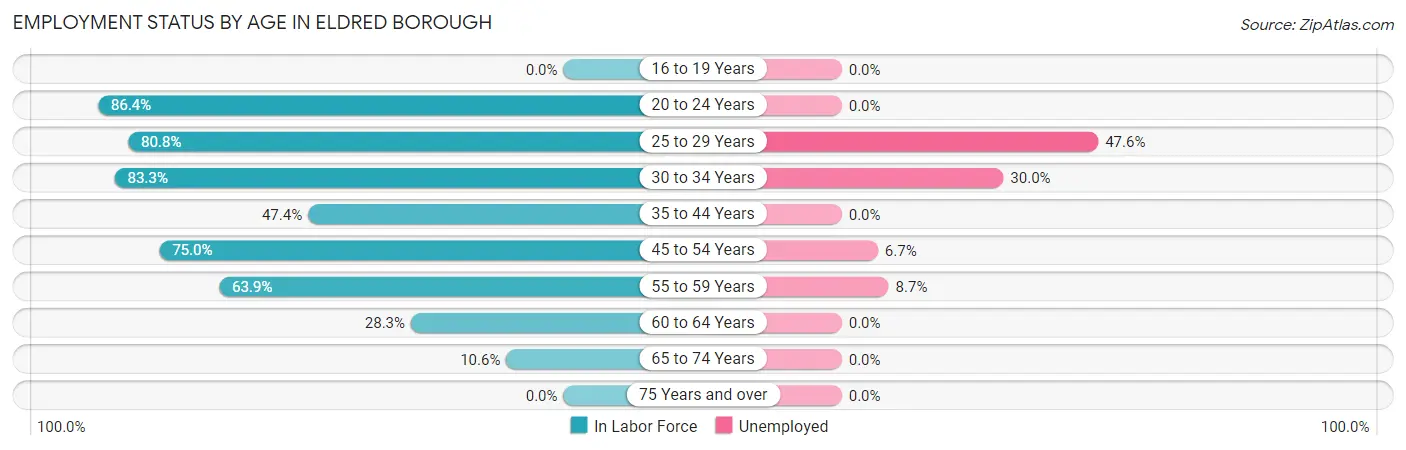
| Age Bracket | In Labor Force | Unemployed |
| 16 to 19 Years | 0 (0.0%) | 0 (0.0%) |
| 20 to 24 Years | 19 (86.4%) | 0 (0.0%) |
| 25 to 29 Years | 21 (80.8%) | 10 (47.6%) |
| 30 to 34 Years | 10 (83.3%) | 3 (30.0%) |
| 35 to 44 Years | 9 (47.4%) | 0 (0.0%) |
| 45 to 54 Years | 30 (75.0%) | 2 (6.7%) |
| 55 to 59 Years | 23 (63.9%) | 2 (8.7%) |
| 60 to 64 Years | 13 (28.3%) | 0 (0.0%) |
| 65 to 74 Years | 7 (10.6%) | 0 (0.0%) |
| 75 Years and over | 0 (0.0%) | 0 (0.0%) |
| Total | 132 (36.4%) | 17 (12.9%) |
Employment Status by Educational Attainment in Eldred borough
According to labor force statistics for Eldred borough, 59.2% of individuals (106) out of the total population between 25 and 64 years of age (179) are in the labor force, with 16.0% or 17 of them being unemployed. The group with the highest labor force participation rate are those with the educational attainment of less than high school, with 85.7% or 12 individuals in the labor force. Within the labor force, individuals with less than high school education have the highest percentage of unemployment, with 50.0% or 6 of them being unemployed.
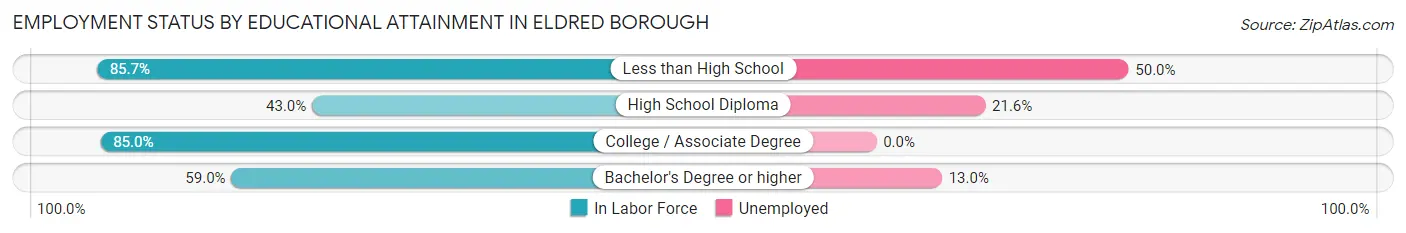
| Educational Attainment | In Labor Force | Unemployed |
| Less than High School | 12 (85.7%) | 7 (50.0%) |
| High School Diploma | 37 (43.0%) | 19 (21.6%) |
| College / Associate Degree | 34 (85.0%) | 0 (0.0%) |
| Bachelor's Degree or higher | 23 (59.0%) | 5 (13.0%) |
| Total | 106 (59.2%) | 29 (16.0%) |
Employment Occupations by Sex in Eldred borough
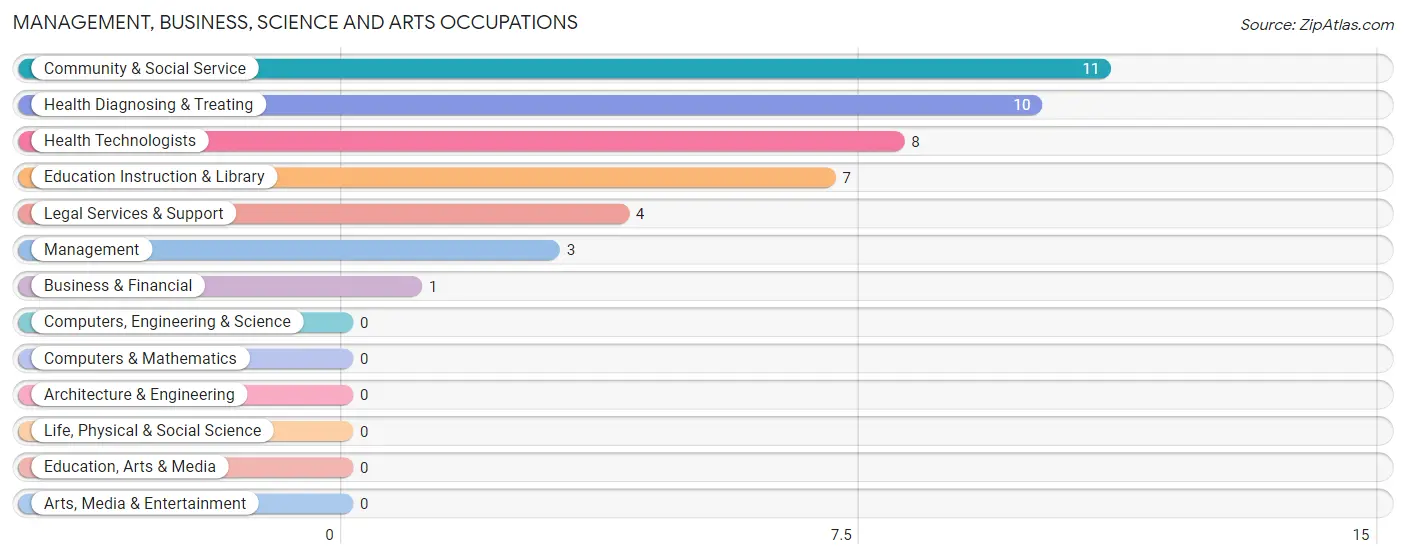
Management, Business, Science and Arts Occupations
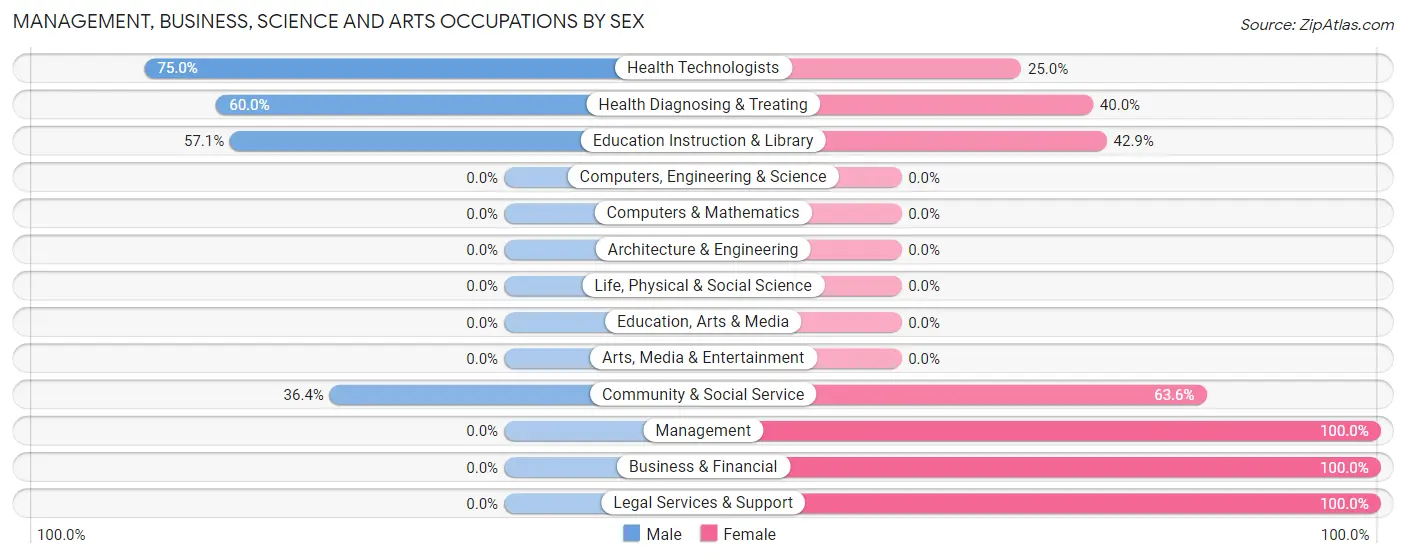
The most common Management, Business, Science and Arts occupations in Eldred borough are Community & Social Service (11 | 9.6%), Health Diagnosing & Treating (10 | 8.7%), Health Technologists (8 | 7.0%), Education Instruction & Library (7 | 6.1%), and Legal Services & Support (4 | 3.5%).
Management, Business, Science and Arts Occupations by Sex
Within the Management, Business, Science and Arts occupations in Eldred borough, the most male-oriented occupations are Health Technologists (75.0%), Health Diagnosing & Treating (60.0%), and Education Instruction & Library (57.1%), while the most female-oriented occupations are Management (100.0%), Business & Financial (100.0%), and Legal Services & Support (100.0%).
| Occupation | Male | Female |
| Management | 0 (0.0%) | 3 (100.0%) |
| Business & Financial | 0 (0.0%) | 1 (100.0%) |
| Computers, Engineering & Science | 0 (0.0%) | 0 (0.0%) |
| Computers & Mathematics | 0 (0.0%) | 0 (0.0%) |
| Architecture & Engineering | 0 (0.0%) | 0 (0.0%) |
| Life, Physical & Social Science | 0 (0.0%) | 0 (0.0%) |
| Community & Social Service | 4 (36.4%) | 7 (63.6%) |
| Education, Arts & Media | 0 (0.0%) | 0 (0.0%) |
| Legal Services & Support | 0 (0.0%) | 4 (100.0%) |
| Education Instruction & Library | 4 (57.1%) | 3 (42.9%) |
| Arts, Media & Entertainment | 0 (0.0%) | 0 (0.0%) |
| Health Diagnosing & Treating | 6 (60.0%) | 4 (40.0%) |
| Health Technologists | 6 (75.0%) | 2 (25.0%) |
| Total (Category) | 10 (40.0%) | 15 (60.0%) |
| Total (Overall) | 50 (43.5%) | 65 (56.5%) |
Services Occupations
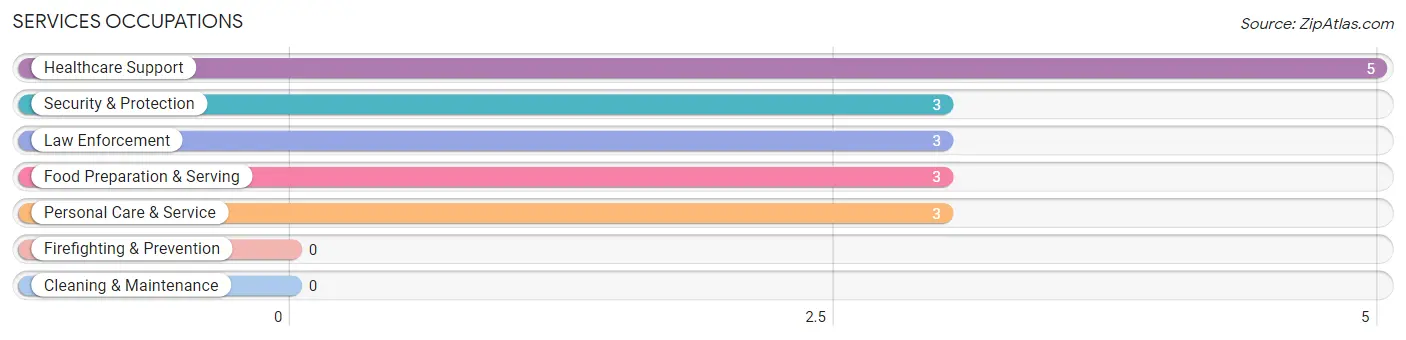
The most common Services occupations in Eldred borough are Healthcare Support (5 | 4.3%), Security & Protection (3 | 2.6%), Law Enforcement (3 | 2.6%), Food Preparation & Serving (3 | 2.6%), and Personal Care & Service (3 | 2.6%).
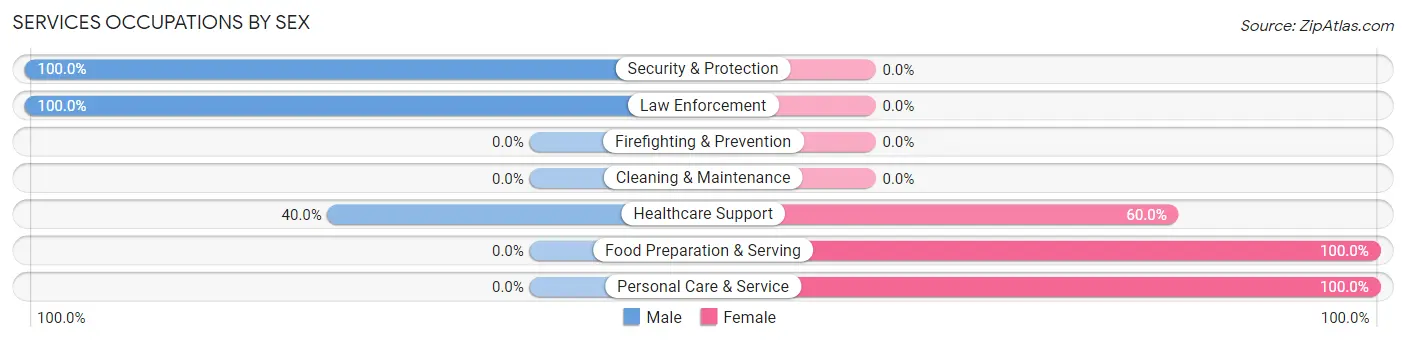
Services Occupations by Sex
Within the Services occupations in Eldred borough, the most male-oriented occupations are Security & Protection (100.0%), Law Enforcement (100.0%), and Healthcare Support (40.0%), while the most female-oriented occupations are Food Preparation & Serving (100.0%), Personal Care & Service (100.0%), and Healthcare Support (60.0%).
| Occupation | Male | Female |
| Healthcare Support | 2 (40.0%) | 3 (60.0%) |
| Security & Protection | 3 (100.0%) | 0 (0.0%) |
| Firefighting & Prevention | 0 (0.0%) | 0 (0.0%) |
| Law Enforcement | 3 (100.0%) | 0 (0.0%) |
| Food Preparation & Serving | 0 (0.0%) | 3 (100.0%) |
| Cleaning & Maintenance | 0 (0.0%) | 0 (0.0%) |
| Personal Care & Service | 0 (0.0%) | 3 (100.0%) |
| Total (Category) | 5 (35.7%) | 9 (64.3%) |
| Total (Overall) | 50 (43.5%) | 65 (56.5%) |
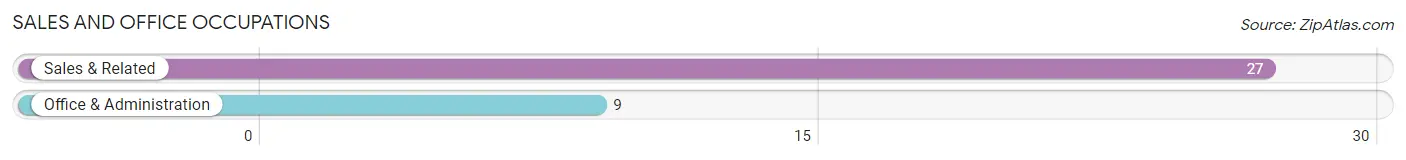
Sales and Office Occupations
The most common Sales and Office occupations in Eldred borough are Sales & Related (27 | 23.5%), and Office & Administration (9 | 7.8%).
Sales and Office Occupations by Sex
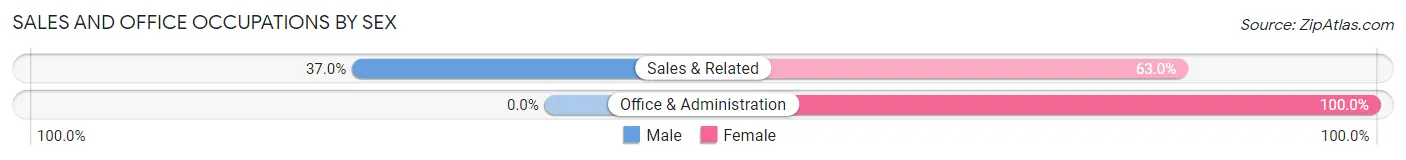
| Occupation | Male | Female |
| Sales & Related | 10 (37.0%) | 17 (63.0%) |
| Office & Administration | 0 (0.0%) | 9 (100.0%) |
| Total (Category) | 10 (27.8%) | 26 (72.2%) |
| Total (Overall) | 50 (43.5%) | 65 (56.5%) |
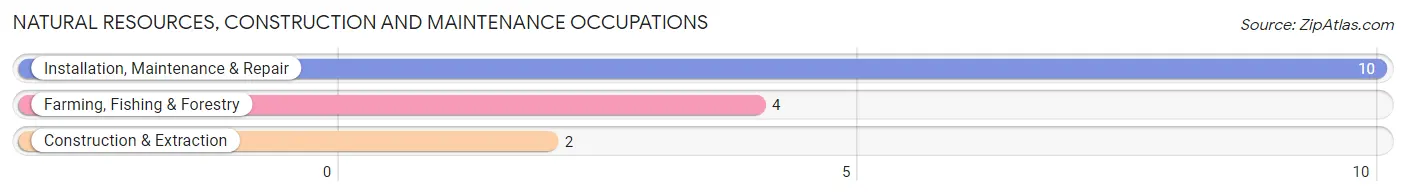
Natural Resources, Construction and Maintenance Occupations
The most common Natural Resources, Construction and Maintenance occupations in Eldred borough are Installation, Maintenance & Repair (10 | 8.7%), Farming, Fishing & Forestry (4 | 3.5%), and Construction & Extraction (2 | 1.7%).
Natural Resources, Construction and Maintenance Occupations by Sex
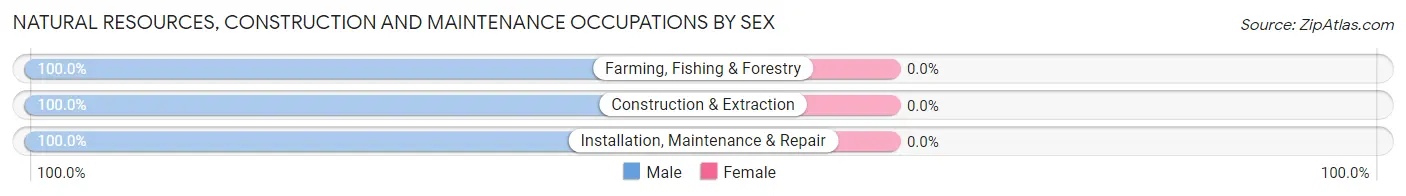
| Occupation | Male | Female |
| Farming, Fishing & Forestry | 4 (100.0%) | 0 (0.0%) |
| Construction & Extraction | 2 (100.0%) | 0 (0.0%) |
| Installation, Maintenance & Repair | 10 (100.0%) | 0 (0.0%) |
| Total (Category) | 16 (100.0%) | 0 (0.0%) |
| Total (Overall) | 50 (43.5%) | 65 (56.5%) |
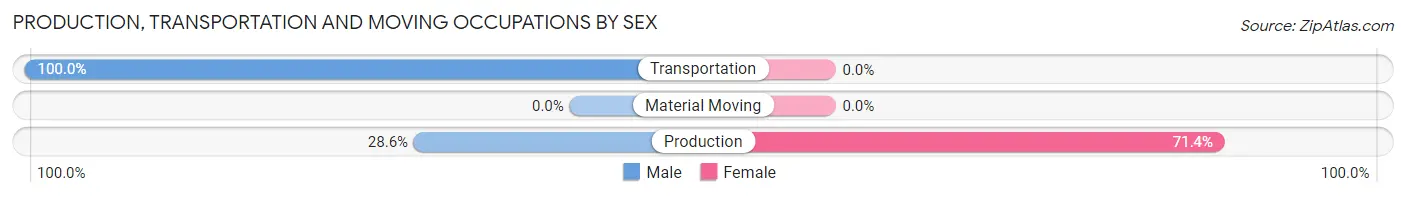
Production, Transportation and Moving Occupations
The most common Production, Transportation and Moving occupations in Eldred borough are Production (21 | 18.3%), and Transportation (3 | 2.6%).
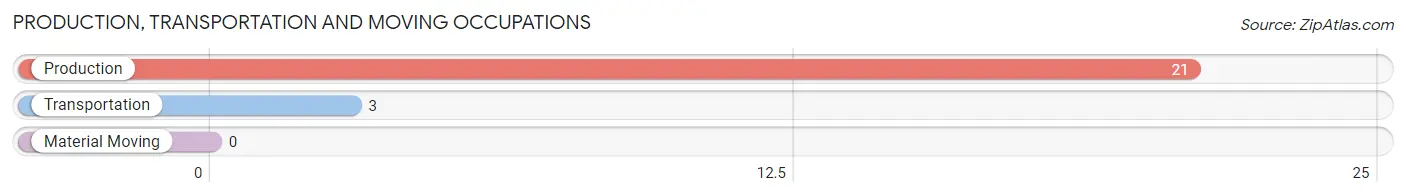
Production, Transportation and Moving Occupations by Sex
| Occupation | Male | Female |
| Production | 6 (28.6%) | 15 (71.4%) |
| Transportation | 3 (100.0%) | 0 (0.0%) |
| Material Moving | 0 (0.0%) | 0 (0.0%) |
| Total (Category) | 9 (37.5%) | 15 (62.5%) |
| Total (Overall) | 50 (43.5%) | 65 (56.5%) |
Employment Industries by Sex in Eldred borough
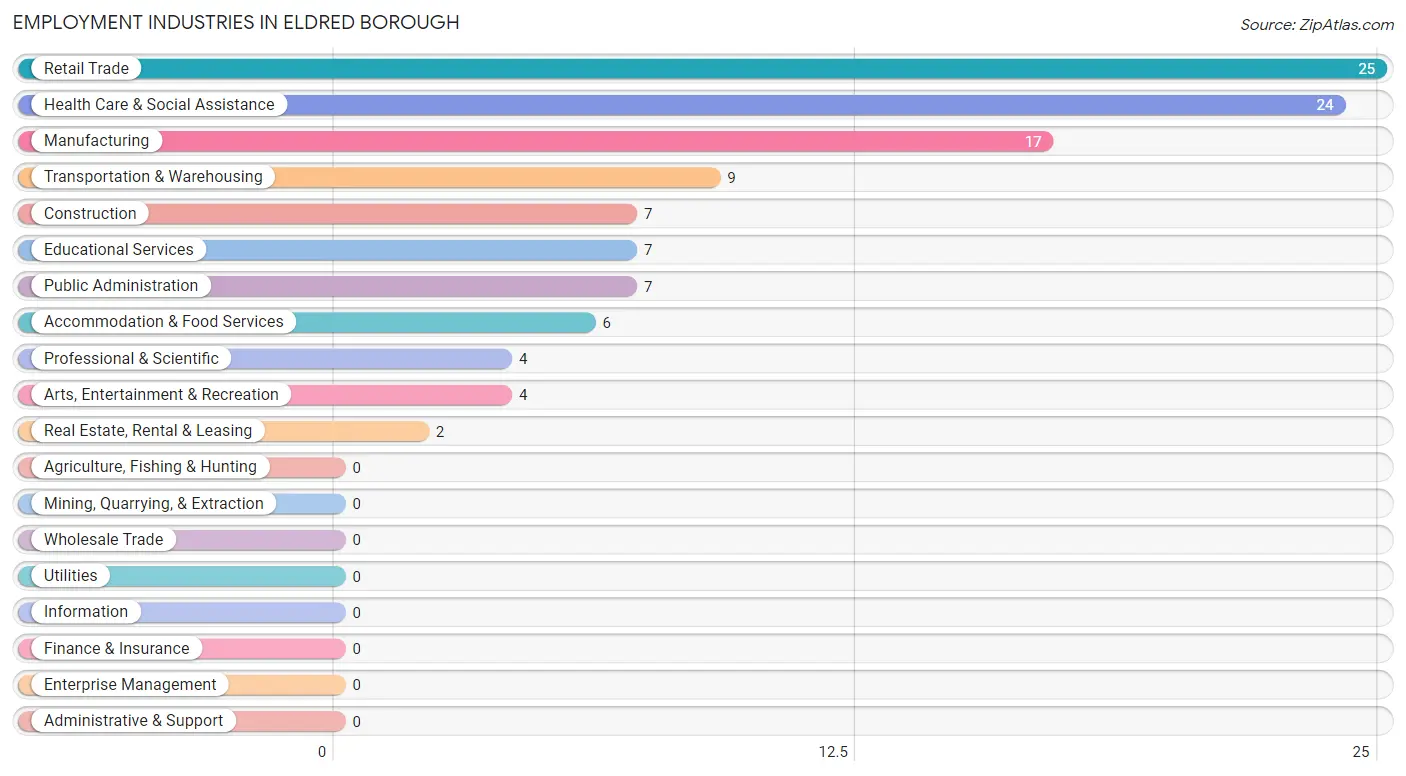
Employment Industries in Eldred borough
The major employment industries in Eldred borough include Retail Trade (25 | 21.7%), Health Care & Social Assistance (24 | 20.9%), Manufacturing (17 | 14.8%), Transportation & Warehousing (9 | 7.8%), and Construction (7 | 6.1%).
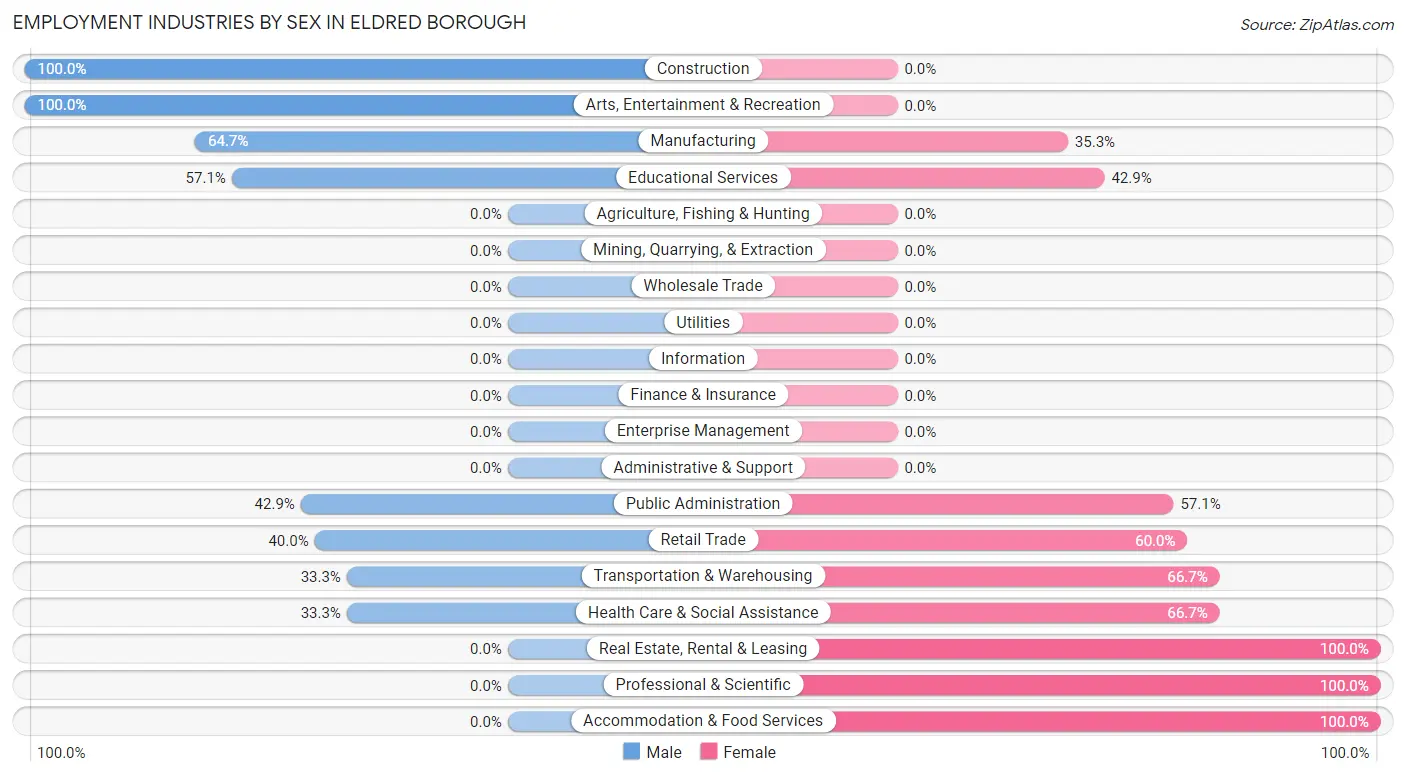
Employment Industries by Sex in Eldred borough
The Eldred borough industries that see more men than women are Construction (100.0%), Arts, Entertainment & Recreation (100.0%), and Manufacturing (64.7%), whereas the industries that tend to have a higher number of women are Real Estate, Rental & Leasing (100.0%), Professional & Scientific (100.0%), and Accommodation & Food Services (100.0%).
| Industry | Male | Female |
| Agriculture, Fishing & Hunting | 0 (0.0%) | 0 (0.0%) |
| Mining, Quarrying, & Extraction | 0 (0.0%) | 0 (0.0%) |
| Construction | 7 (100.0%) | 0 (0.0%) |
| Manufacturing | 11 (64.7%) | 6 (35.3%) |
| Wholesale Trade | 0 (0.0%) | 0 (0.0%) |
| Retail Trade | 10 (40.0%) | 15 (60.0%) |
| Transportation & Warehousing | 3 (33.3%) | 6 (66.7%) |
| Utilities | 0 (0.0%) | 0 (0.0%) |
| Information | 0 (0.0%) | 0 (0.0%) |
| Finance & Insurance | 0 (0.0%) | 0 (0.0%) |
| Real Estate, Rental & Leasing | 0 (0.0%) | 2 (100.0%) |
| Professional & Scientific | 0 (0.0%) | 4 (100.0%) |
| Enterprise Management | 0 (0.0%) | 0 (0.0%) |
| Administrative & Support | 0 (0.0%) | 0 (0.0%) |
| Educational Services | 4 (57.1%) | 3 (42.9%) |
| Health Care & Social Assistance | 8 (33.3%) | 16 (66.7%) |
| Arts, Entertainment & Recreation | 4 (100.0%) | 0 (0.0%) |
| Accommodation & Food Services | 0 (0.0%) | 6 (100.0%) |
| Public Administration | 3 (42.9%) | 4 (57.1%) |
| Total | 50 (43.5%) | 65 (56.5%) |
Education in Eldred borough
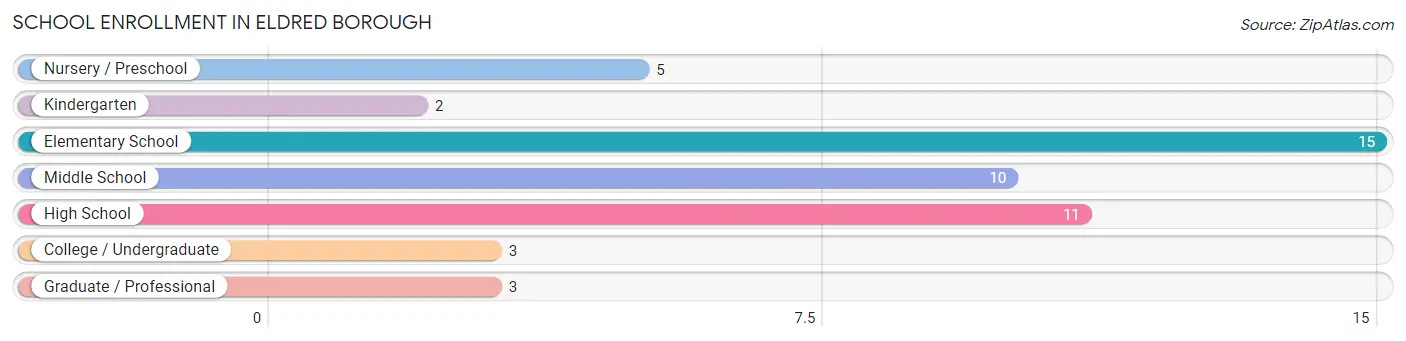
School Enrollment in Eldred borough
The most common levels of schooling among the 49 students in Eldred borough are elementary school (15 | 30.6%), high school (11 | 22.5%), and middle school (10 | 20.4%).
| School Level | # Students | % Students |
| Nursery / Preschool | 5 | 10.2% |
| Kindergarten | 2 | 4.1% |
| Elementary School | 15 | 30.6% |
| Middle School | 10 | 20.4% |
| High School | 11 | 22.5% |
| College / Undergraduate | 3 | 6.1% |
| Graduate / Professional | 3 | 6.1% |
| Total | 49 | 100.0% |
School Enrollment by Age by Funding Source in Eldred borough
Out of a total of 49 students who are enrolled in schools in Eldred borough, 5 (10.2%) attend a private institution, while the remaining 44 (89.8%) are enrolled in public schools. The age group of 18 to 19 year olds has the highest likelihood of being enrolled in private schools, with 3 (100.0% in the age bracket) enrolled. Conversely, the age group of 3 to 4 year olds has the lowest likelihood of being enrolled in a private school, with 2 (100.0% in the age bracket) attending a public institution.
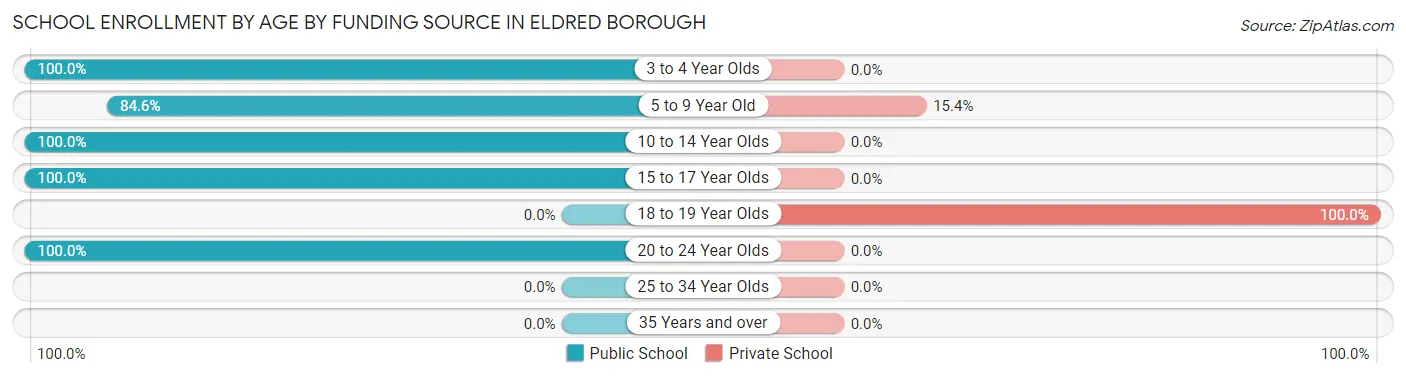
| Age Bracket | Public School | Private School |
| 3 to 4 Year Olds | 2 (100.0%) | 0 (0.0%) |
| 5 to 9 Year Old | 11 (84.6%) | 2 (15.4%) |
| 10 to 14 Year Olds | 17 (100.0%) | 0 (0.0%) |
| 15 to 17 Year Olds | 11 (100.0%) | 0 (0.0%) |
| 18 to 19 Year Olds | 0 (0.0%) | 3 (100.0%) |
| 20 to 24 Year Olds | 3 (100.0%) | 0 (0.0%) |
| 25 to 34 Year Olds | 0 (0.0%) | 0 (0.0%) |
| 35 Years and over | 0 (0.0%) | 0 (0.0%) |
| Total | 44 (89.8%) | 5 (10.2%) |
Educational Attainment by Field of Study in Eldred borough
Science & technology (12 | 25.0%), physical & health sciences (7 | 14.6%), business (6 | 12.5%), literature & languages (6 | 12.5%), and arts & humanities (6 | 12.5%) are the most common fields of study among 48 individuals in Eldred borough who have obtained a bachelor's degree or higher.
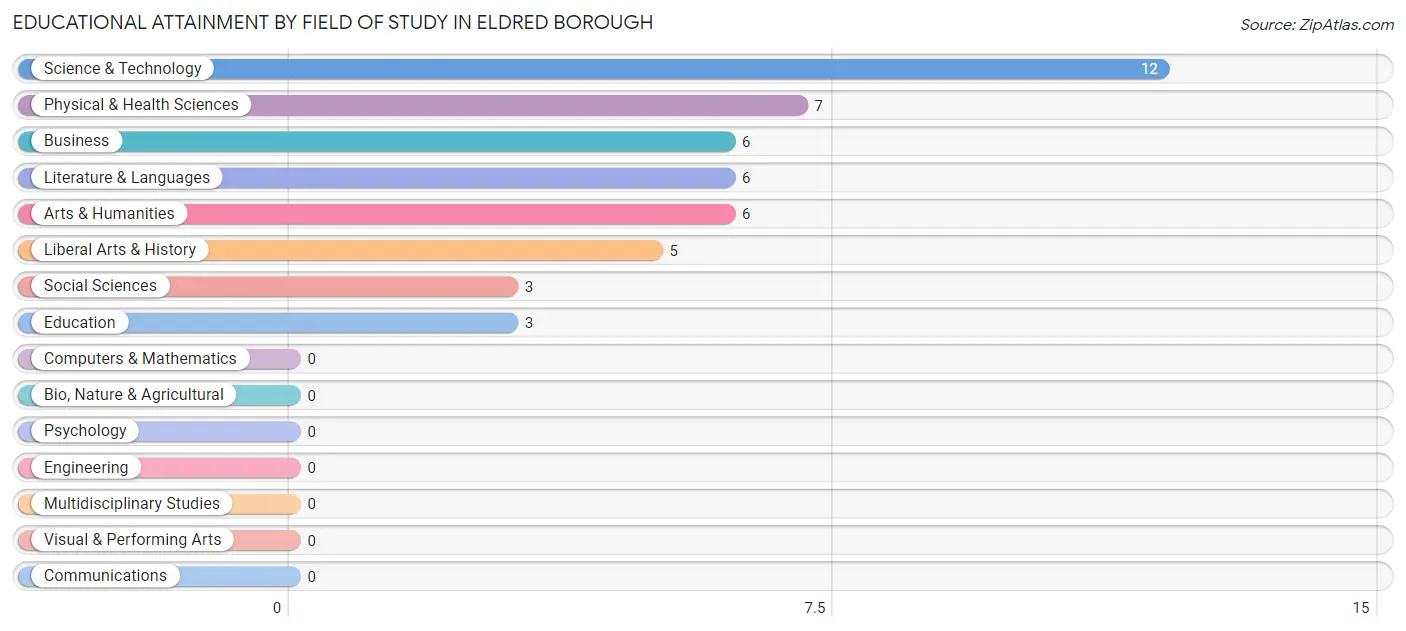
| Field of Study | # Graduates | % Graduates |
| Computers & Mathematics | 0 | 0.0% |
| Bio, Nature & Agricultural | 0 | 0.0% |
| Physical & Health Sciences | 7 | 14.6% |
| Psychology | 0 | 0.0% |
| Social Sciences | 3 | 6.2% |
| Engineering | 0 | 0.0% |
| Multidisciplinary Studies | 0 | 0.0% |
| Science & Technology | 12 | 25.0% |
| Business | 6 | 12.5% |
| Education | 3 | 6.2% |
| Literature & Languages | 6 | 12.5% |
| Liberal Arts & History | 5 | 10.4% |
| Visual & Performing Arts | 0 | 0.0% |
| Communications | 0 | 0.0% |
| Arts & Humanities | 6 | 12.5% |
| Total | 48 | 100.0% |
Transportation & Commute in Eldred borough
Vehicle Availability by Sex in Eldred borough
The most prevalent vehicle ownership categories in Eldred borough are males with 2 vehicles (27, accounting for 61.4%) and females with 2 vehicles (35, making up 41.5%).
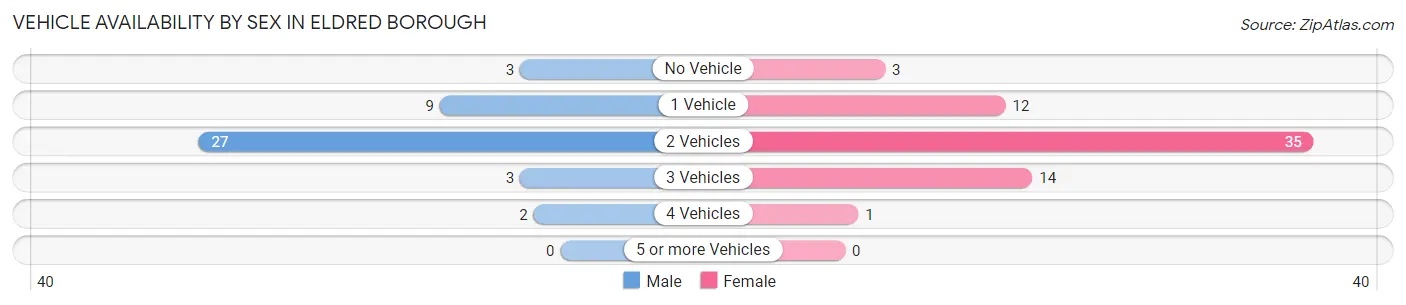
| Vehicles Available | Male | Female |
| No Vehicle | 3 (6.8%) | 3 (4.6%) |
| 1 Vehicle | 9 (20.4%) | 12 (18.5%) |
| 2 Vehicles | 27 (61.4%) | 35 (53.8%) |
| 3 Vehicles | 3 (6.8%) | 14 (21.5%) |
| 4 Vehicles | 2 (4.5%) | 1 (1.5%) |
| 5 or more Vehicles | 0 (0.0%) | 0 (0.0%) |
| Total | 44 (100.0%) | 65 (100.0%) |
Commute Time in Eldred borough
The most frequently occuring commute durations in Eldred borough are 30 to 34 minutes (21 commuters, 19.3%), 20 to 24 minutes (20 commuters, 18.3%), and 45 to 59 minutes (16 commuters, 14.7%).
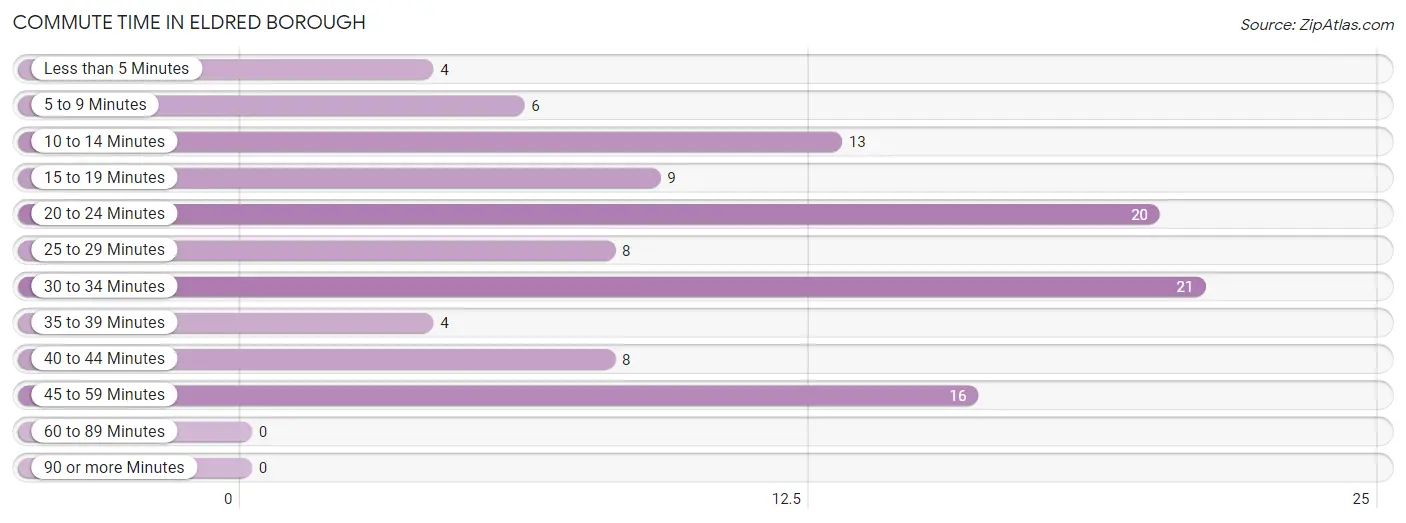
| Commute Time | # Commuters | % Commuters |
| Less than 5 Minutes | 4 | 3.7% |
| 5 to 9 Minutes | 6 | 5.5% |
| 10 to 14 Minutes | 13 | 11.9% |
| 15 to 19 Minutes | 9 | 8.3% |
| 20 to 24 Minutes | 20 | 18.3% |
| 25 to 29 Minutes | 8 | 7.3% |
| 30 to 34 Minutes | 21 | 19.3% |
| 35 to 39 Minutes | 4 | 3.7% |
| 40 to 44 Minutes | 8 | 7.3% |
| 45 to 59 Minutes | 16 | 14.7% |
| 60 to 89 Minutes | 0 | 0.0% |
| 90 or more Minutes | 0 | 0.0% |
Commute Time by Sex in Eldred borough
The most common commute times in Eldred borough are 30 to 34 minutes (10 commuters, 22.7%) for males and 20 to 24 minutes (15 commuters, 23.1%) for females.
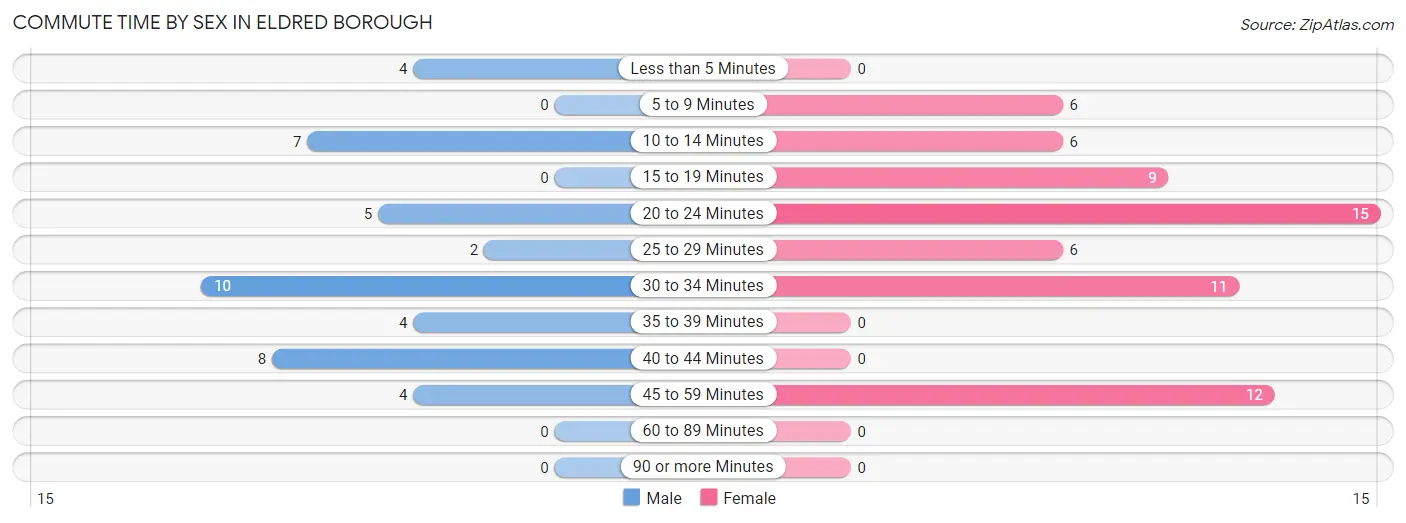
| Commute Time | Male | Female |
| Less than 5 Minutes | 4 (9.1%) | 0 (0.0%) |
| 5 to 9 Minutes | 0 (0.0%) | 6 (9.2%) |
| 10 to 14 Minutes | 7 (15.9%) | 6 (9.2%) |
| 15 to 19 Minutes | 0 (0.0%) | 9 (13.9%) |
| 20 to 24 Minutes | 5 (11.4%) | 15 (23.1%) |
| 25 to 29 Minutes | 2 (4.5%) | 6 (9.2%) |
| 30 to 34 Minutes | 10 (22.7%) | 11 (16.9%) |
| 35 to 39 Minutes | 4 (9.1%) | 0 (0.0%) |
| 40 to 44 Minutes | 8 (18.2%) | 0 (0.0%) |
| 45 to 59 Minutes | 4 (9.1%) | 12 (18.5%) |
| 60 to 89 Minutes | 0 (0.0%) | 0 (0.0%) |
| 90 or more Minutes | 0 (0.0%) | 0 (0.0%) |
Time of Departure to Work by Sex in Eldred borough
The most frequent times of departure to work in Eldred borough are 12:00 PM to 3:59 PM (11, 25.0%) for males and 7:00 AM to 7:29 AM (15, 23.1%) for females.
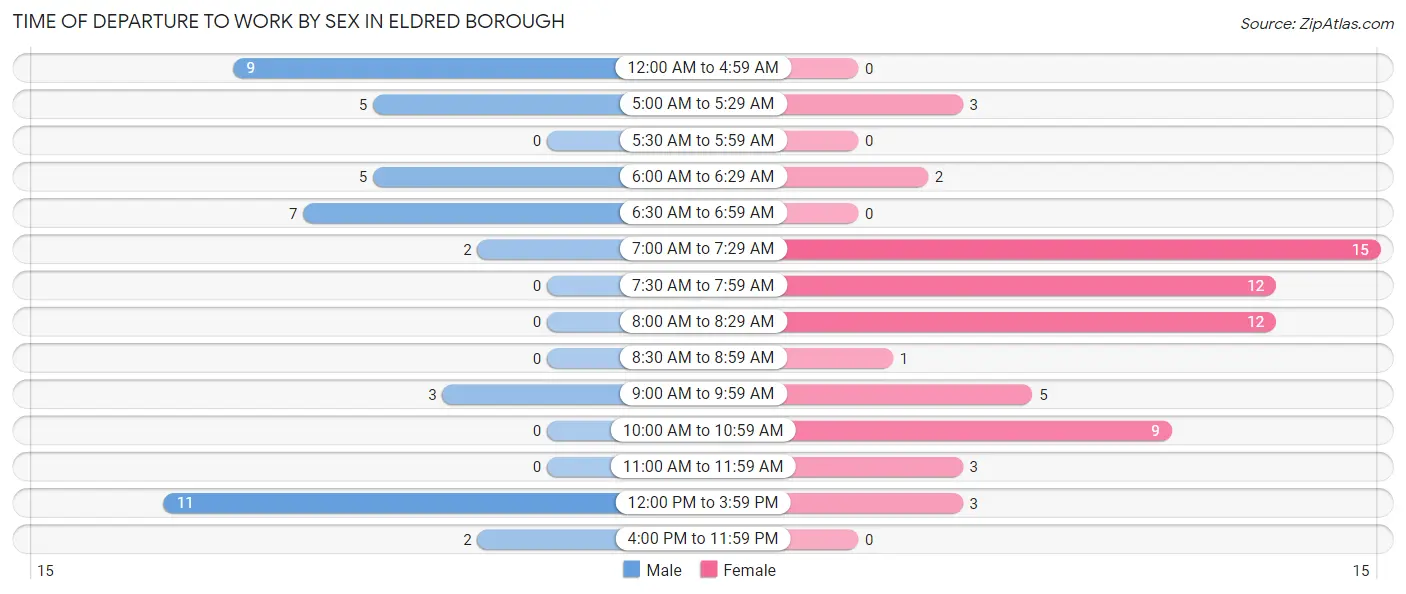
| Time of Departure | Male | Female |
| 12:00 AM to 4:59 AM | 9 (20.4%) | 0 (0.0%) |
| 5:00 AM to 5:29 AM | 5 (11.4%) | 3 (4.6%) |
| 5:30 AM to 5:59 AM | 0 (0.0%) | 0 (0.0%) |
| 6:00 AM to 6:29 AM | 5 (11.4%) | 2 (3.1%) |
| 6:30 AM to 6:59 AM | 7 (15.9%) | 0 (0.0%) |
| 7:00 AM to 7:29 AM | 2 (4.5%) | 15 (23.1%) |
| 7:30 AM to 7:59 AM | 0 (0.0%) | 12 (18.5%) |
| 8:00 AM to 8:29 AM | 0 (0.0%) | 12 (18.5%) |
| 8:30 AM to 8:59 AM | 0 (0.0%) | 1 (1.5%) |
| 9:00 AM to 9:59 AM | 3 (6.8%) | 5 (7.7%) |
| 10:00 AM to 10:59 AM | 0 (0.0%) | 9 (13.9%) |
| 11:00 AM to 11:59 AM | 0 (0.0%) | 3 (4.6%) |
| 12:00 PM to 3:59 PM | 11 (25.0%) | 3 (4.6%) |
| 4:00 PM to 11:59 PM | 2 (4.5%) | 0 (0.0%) |
| Total | 44 (100.0%) | 65 (100.0%) |
Housing Occupancy in Eldred borough
Occupancy by Ownership in Eldred borough
Of the total 227 dwellings in Eldred borough, owner-occupied units account for 155 (68.3%), while renter-occupied units make up 72 (31.7%).
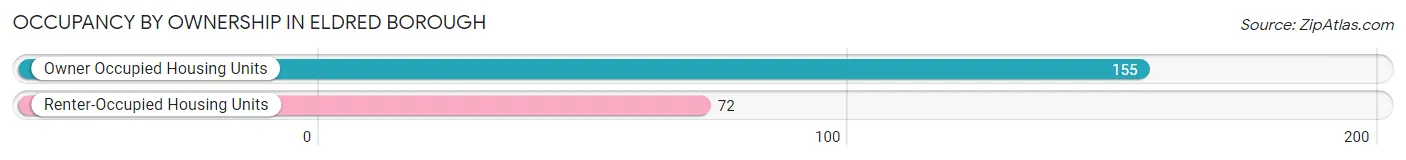
| Occupancy | # Housing Units | % Housing Units |
| Owner Occupied Housing Units | 155 | 68.3% |
| Renter-Occupied Housing Units | 72 | 31.7% |
| Total Occupied Housing Units | 227 | 100.0% |
Occupancy by Household Size in Eldred borough
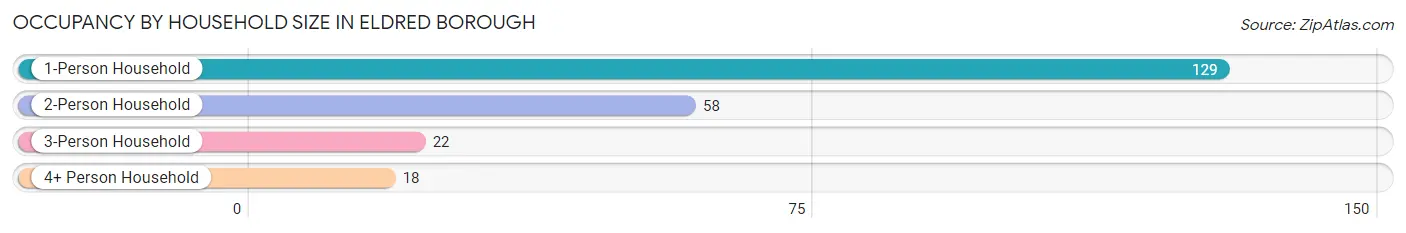
| Household Size | # Housing Units | % Housing Units |
| 1-Person Household | 129 | 56.8% |
| 2-Person Household | 58 | 25.6% |
| 3-Person Household | 22 | 9.7% |
| 4+ Person Household | 18 | 7.9% |
| Total Housing Units | 227 | 100.0% |
Occupancy by Ownership by Household Size in Eldred borough
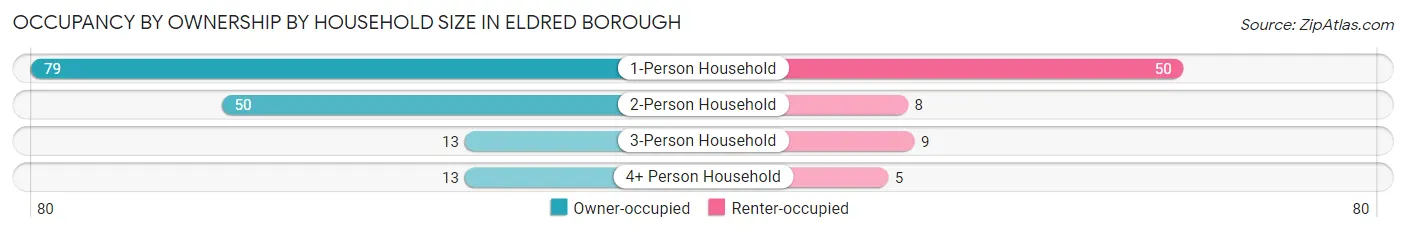
| Household Size | Owner-occupied | Renter-occupied |
| 1-Person Household | 79 (61.2%) | 50 (38.8%) |
| 2-Person Household | 50 (86.2%) | 8 (13.8%) |
| 3-Person Household | 13 (59.1%) | 9 (40.9%) |
| 4+ Person Household | 13 (72.2%) | 5 (27.8%) |
| Total Housing Units | 155 (68.3%) | 72 (31.7%) |
Occupancy by Educational Attainment in Eldred borough
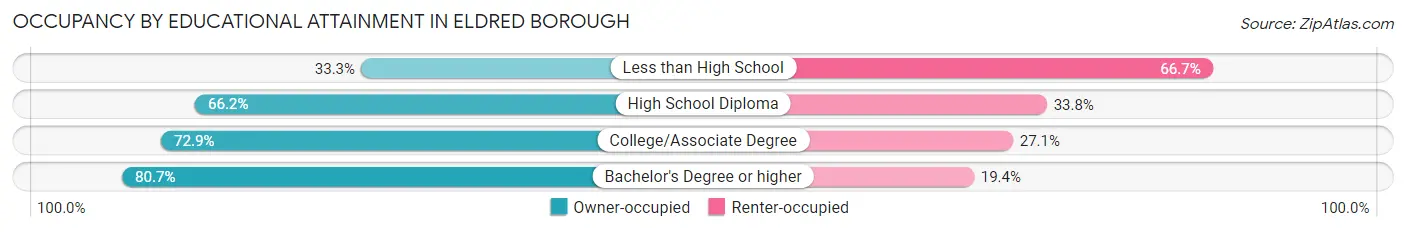
| Household Size | Owner-occupied | Renter-occupied |
| Less than High School | 3 (33.3%) | 6 (66.7%) |
| High School Diploma | 92 (66.2%) | 47 (33.8%) |
| College/Associate Degree | 35 (72.9%) | 13 (27.1%) |
| Bachelor's Degree or higher | 25 (80.6%) | 6 (19.4%) |
Occupancy by Age of Householder in Eldred borough
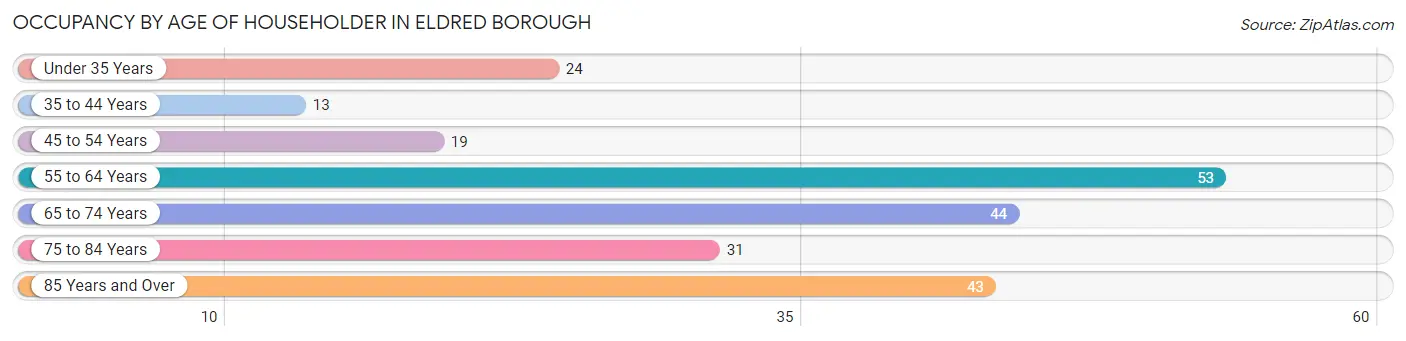
| Age Bracket | # Households | % Households |
| Under 35 Years | 24 | 10.6% |
| 35 to 44 Years | 13 | 5.7% |
| 45 to 54 Years | 19 | 8.4% |
| 55 to 64 Years | 53 | 23.4% |
| 65 to 74 Years | 44 | 19.4% |
| 75 to 84 Years | 31 | 13.7% |
| 85 Years and Over | 43 | 18.9% |
| Total | 227 | 100.0% |
Housing Finances in Eldred borough
Median Income by Occupancy in Eldred borough
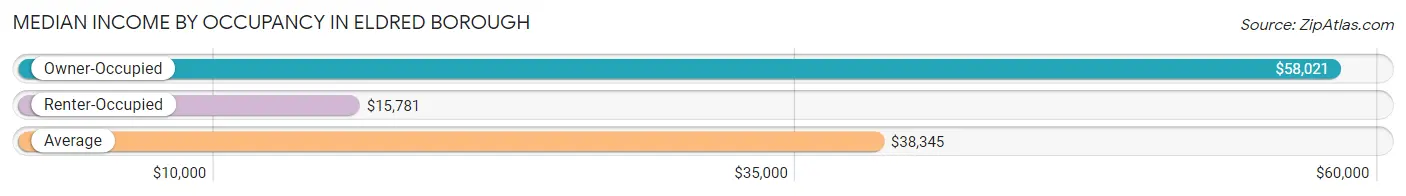
| Occupancy Type | # Households | Median Income |
| Owner-Occupied | 155 (68.3%) | $58,021 |
| Renter-Occupied | 72 (31.7%) | $15,781 |
| Average | 227 (100.0%) | $38,345 |
Occupancy by Householder Income Bracket in Eldred borough
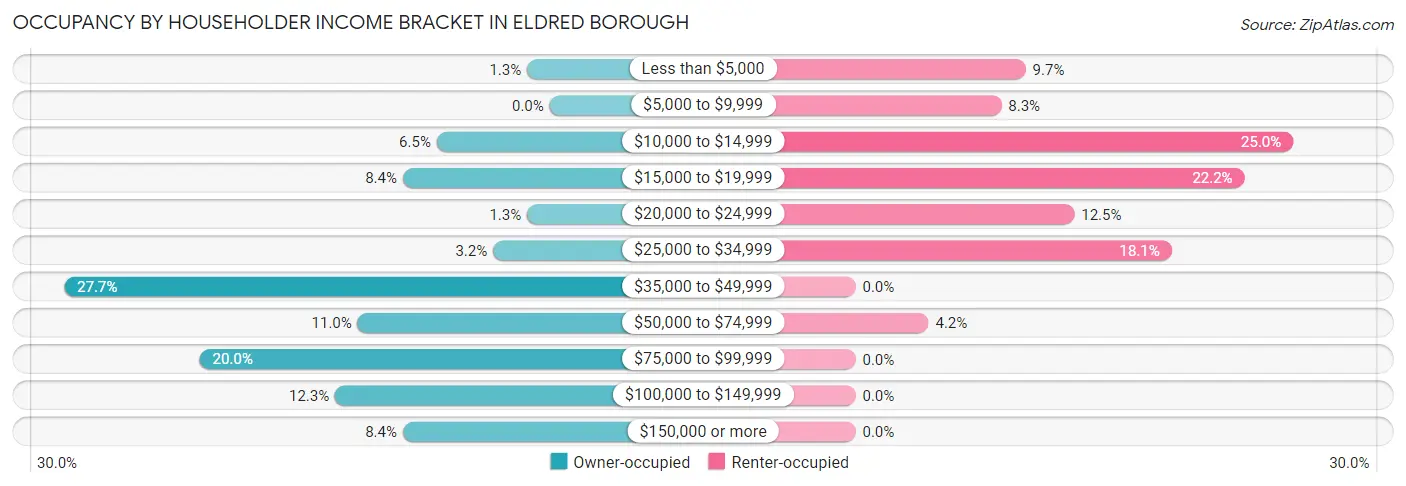
| Income Bracket | Owner-occupied | Renter-occupied |
| Less than $5,000 | 2 (1.3%) | 7 (9.7%) |
| $5,000 to $9,999 | 0 (0.0%) | 6 (8.3%) |
| $10,000 to $14,999 | 10 (6.5%) | 18 (25.0%) |
| $15,000 to $19,999 | 13 (8.4%) | 16 (22.2%) |
| $20,000 to $24,999 | 2 (1.3%) | 9 (12.5%) |
| $25,000 to $34,999 | 5 (3.2%) | 13 (18.1%) |
| $35,000 to $49,999 | 43 (27.7%) | 0 (0.0%) |
| $50,000 to $74,999 | 17 (11.0%) | 3 (4.2%) |
| $75,000 to $99,999 | 31 (20.0%) | 0 (0.0%) |
| $100,000 to $149,999 | 19 (12.3%) | 0 (0.0%) |
| $150,000 or more | 13 (8.4%) | 0 (0.0%) |
| Total | 155 (100.0%) | 72 (100.0%) |
Monthly Housing Cost Tiers in Eldred borough
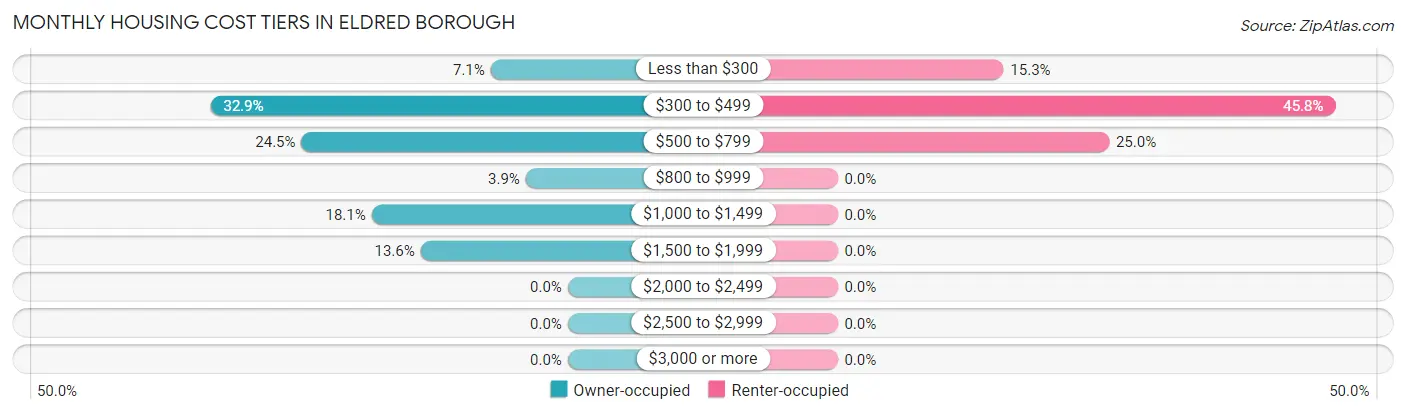
| Monthly Cost | Owner-occupied | Renter-occupied |
| Less than $300 | 11 (7.1%) | 11 (15.3%) |
| $300 to $499 | 51 (32.9%) | 33 (45.8%) |
| $500 to $799 | 38 (24.5%) | 18 (25.0%) |
| $800 to $999 | 6 (3.9%) | 0 (0.0%) |
| $1,000 to $1,499 | 28 (18.1%) | 0 (0.0%) |
| $1,500 to $1,999 | 21 (13.6%) | 0 (0.0%) |
| $2,000 to $2,499 | 0 (0.0%) | 0 (0.0%) |
| $2,500 to $2,999 | 0 (0.0%) | 0 (0.0%) |
| $3,000 or more | 0 (0.0%) | 0 (0.0%) |
| Total | 155 (100.0%) | 72 (100.0%) |
Physical Housing Characteristics in Eldred borough
Housing Structures in Eldred borough
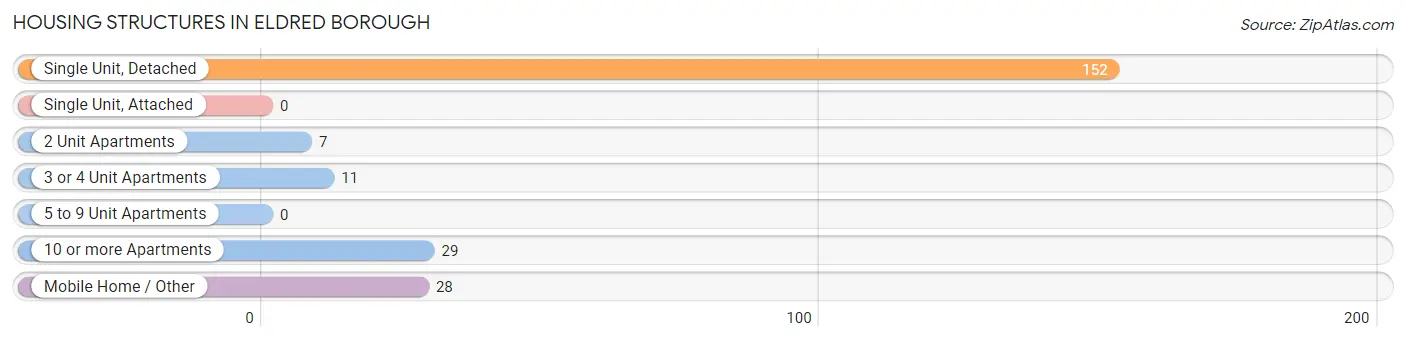
| Structure Type | # Housing Units | % Housing Units |
| Single Unit, Detached | 152 | 67.0% |
| Single Unit, Attached | 0 | 0.0% |
| 2 Unit Apartments | 7 | 3.1% |
| 3 or 4 Unit Apartments | 11 | 4.9% |
| 5 to 9 Unit Apartments | 0 | 0.0% |
| 10 or more Apartments | 29 | 12.8% |
| Mobile Home / Other | 28 | 12.3% |
| Total | 227 | 100.0% |
Housing Structures by Occupancy in Eldred borough
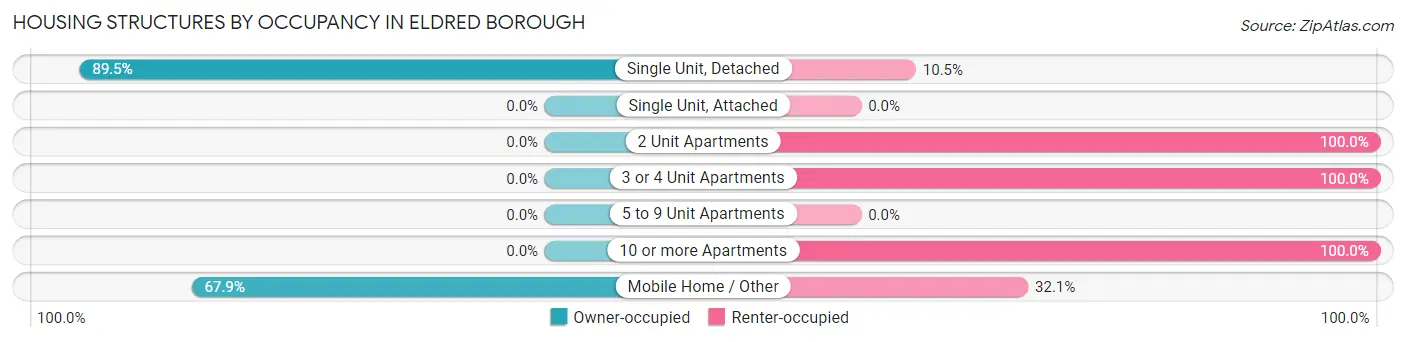
| Structure Type | Owner-occupied | Renter-occupied |
| Single Unit, Detached | 136 (89.5%) | 16 (10.5%) |
| Single Unit, Attached | 0 (0.0%) | 0 (0.0%) |
| 2 Unit Apartments | 0 (0.0%) | 7 (100.0%) |
| 3 or 4 Unit Apartments | 0 (0.0%) | 11 (100.0%) |
| 5 to 9 Unit Apartments | 0 (0.0%) | 0 (0.0%) |
| 10 or more Apartments | 0 (0.0%) | 29 (100.0%) |
| Mobile Home / Other | 19 (67.9%) | 9 (32.1%) |
| Total | 155 (68.3%) | 72 (31.7%) |
Housing Structures by Number of Rooms in Eldred borough
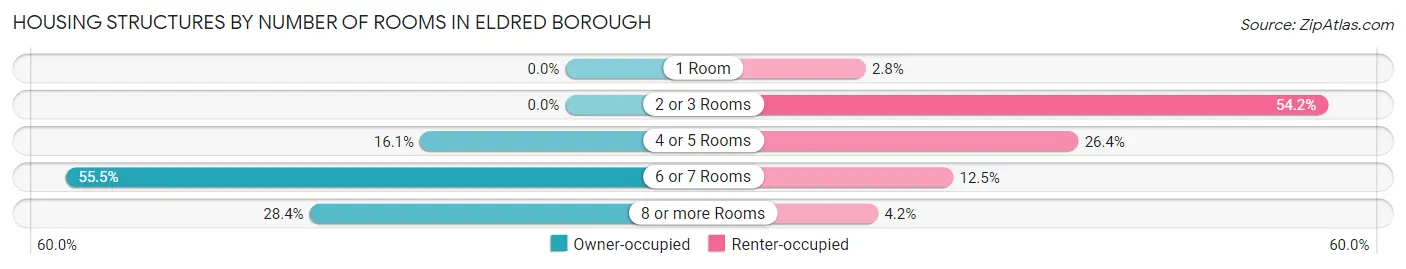
| Number of Rooms | Owner-occupied | Renter-occupied |
| 1 Room | 0 (0.0%) | 2 (2.8%) |
| 2 or 3 Rooms | 0 (0.0%) | 39 (54.2%) |
| 4 or 5 Rooms | 25 (16.1%) | 19 (26.4%) |
| 6 or 7 Rooms | 86 (55.5%) | 9 (12.5%) |
| 8 or more Rooms | 44 (28.4%) | 3 (4.2%) |
| Total | 155 (100.0%) | 72 (100.0%) |
Housing Structure by Heating Type in Eldred borough
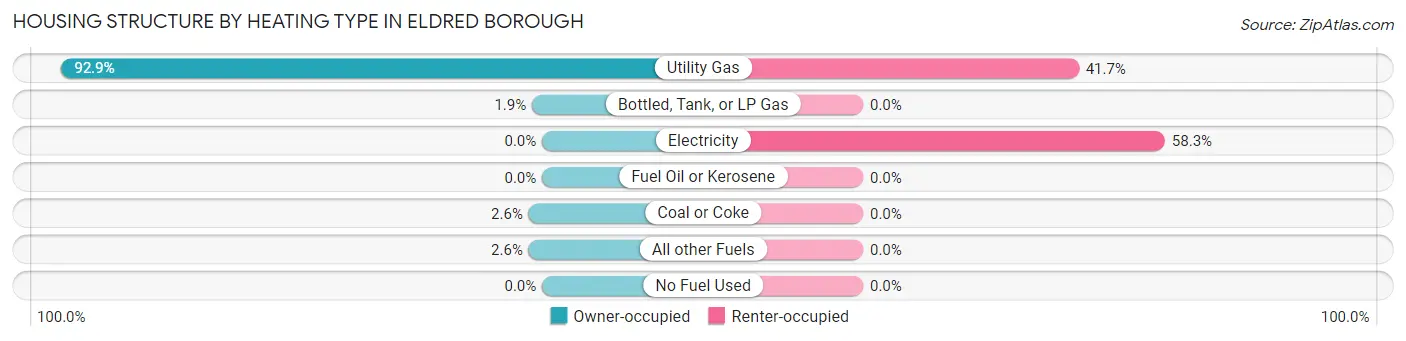
| Heating Type | Owner-occupied | Renter-occupied |
| Utility Gas | 144 (92.9%) | 30 (41.7%) |
| Bottled, Tank, or LP Gas | 3 (1.9%) | 0 (0.0%) |
| Electricity | 0 (0.0%) | 42 (58.3%) |
| Fuel Oil or Kerosene | 0 (0.0%) | 0 (0.0%) |
| Coal or Coke | 4 (2.6%) | 0 (0.0%) |
| All other Fuels | 4 (2.6%) | 0 (0.0%) |
| No Fuel Used | 0 (0.0%) | 0 (0.0%) |
| Total | 155 (100.0%) | 72 (100.0%) |
Household Vehicle Usage in Eldred borough
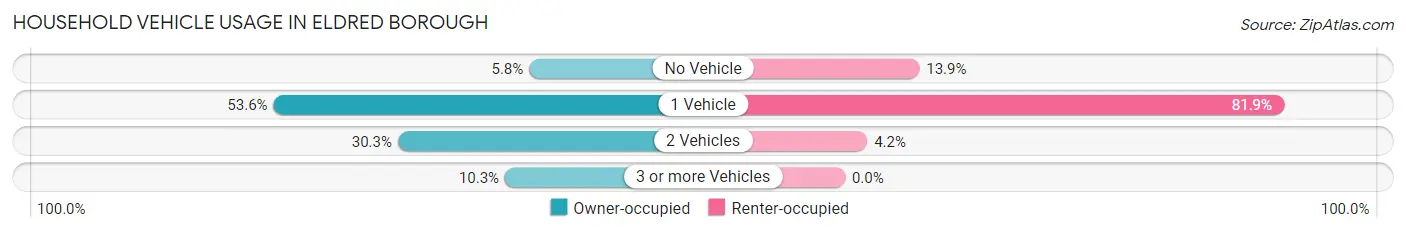
| Vehicles per Household | Owner-occupied | Renter-occupied |
| No Vehicle | 9 (5.8%) | 10 (13.9%) |
| 1 Vehicle | 83 (53.5%) | 59 (81.9%) |
| 2 Vehicles | 47 (30.3%) | 3 (4.2%) |
| 3 or more Vehicles | 16 (10.3%) | 0 (0.0%) |
| Total | 155 (100.0%) | 72 (100.0%) |
Real Estate & Mortgages in Eldred borough
Real Estate and Mortgage Overview in Eldred borough
| Characteristic | Without Mortgage | With Mortgage |
| Housing Units | 90 | 65 |
| Median Property Value | $131,000 | $99,700 |
| Median Household Income | $39,324 | $0 |
| Monthly Housing Costs | $465 | $0 |
| Real Estate Taxes | $1,471 | $2 |
Property Value by Mortgage Status in Eldred borough
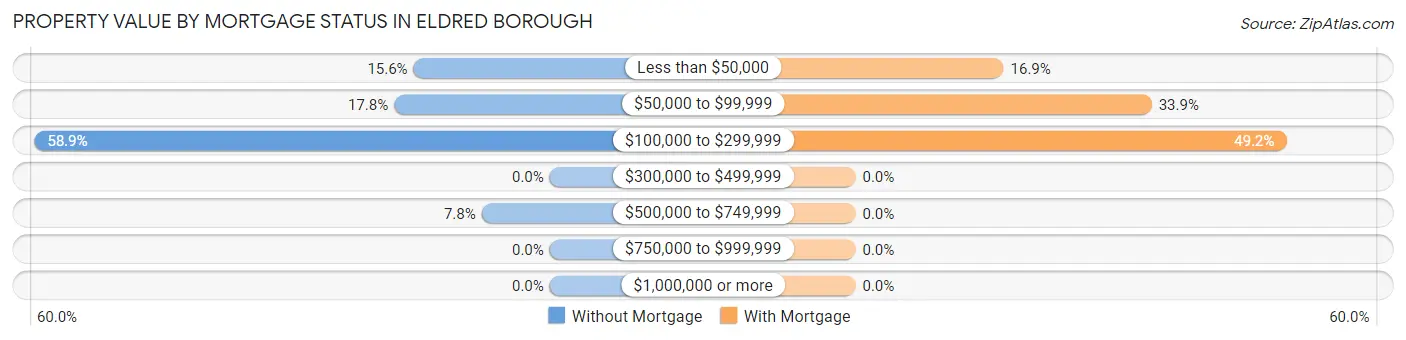
| Property Value | Without Mortgage | With Mortgage |
| Less than $50,000 | 14 (15.6%) | 11 (16.9%) |
| $50,000 to $99,999 | 16 (17.8%) | 22 (33.9%) |
| $100,000 to $299,999 | 53 (58.9%) | 32 (49.2%) |
| $300,000 to $499,999 | 0 (0.0%) | 0 (0.0%) |
| $500,000 to $749,999 | 7 (7.8%) | 0 (0.0%) |
| $750,000 to $999,999 | 0 (0.0%) | 0 (0.0%) |
| $1,000,000 or more | 0 (0.0%) | 0 (0.0%) |
| Total | 90 (100.0%) | 65 (100.0%) |
Household Income by Mortgage Status in Eldred borough
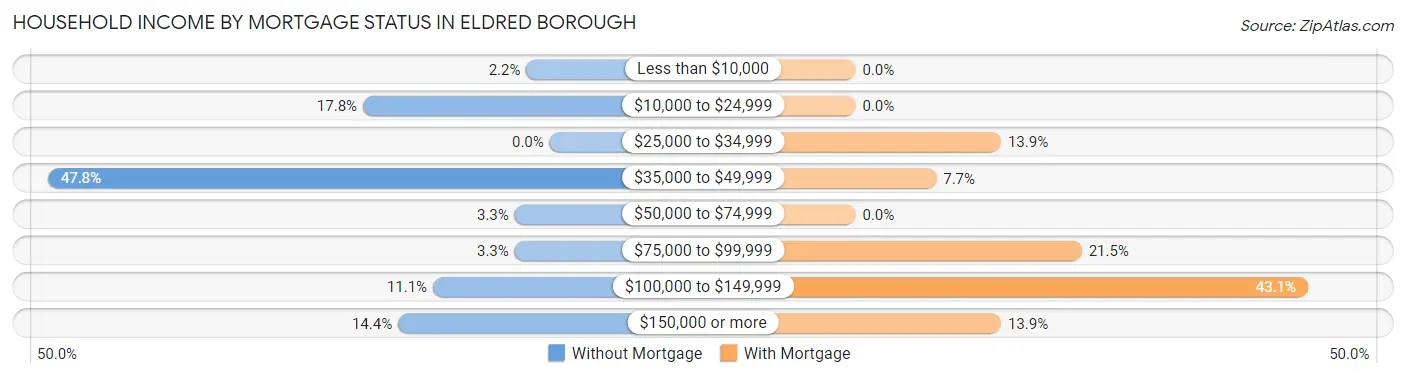
| Household Income | Without Mortgage | With Mortgage |
| Less than $10,000 | 2 (2.2%) | 0 (0.0%) |
| $10,000 to $24,999 | 16 (17.8%) | 0 (0.0%) |
| $25,000 to $34,999 | 0 (0.0%) | 9 (13.9%) |
| $35,000 to $49,999 | 43 (47.8%) | 5 (7.7%) |
| $50,000 to $74,999 | 3 (3.3%) | 0 (0.0%) |
| $75,000 to $99,999 | 3 (3.3%) | 14 (21.5%) |
| $100,000 to $149,999 | 10 (11.1%) | 28 (43.1%) |
| $150,000 or more | 13 (14.4%) | 9 (13.9%) |
| Total | 90 (100.0%) | 65 (100.0%) |
Property Value to Household Income Ratio in Eldred borough
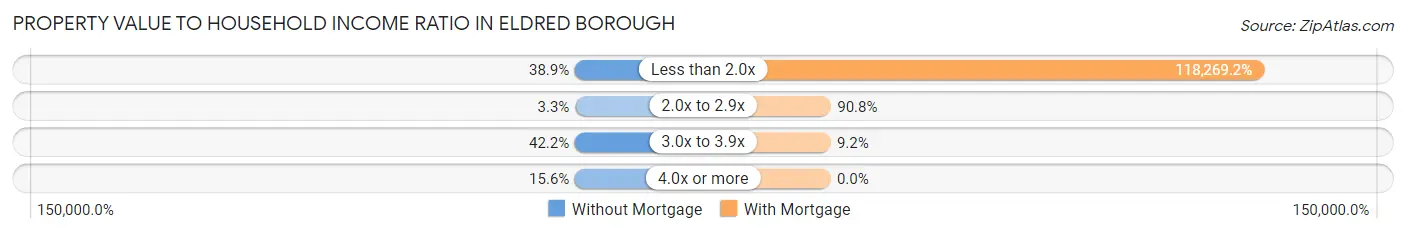
| Value-to-Income Ratio | Without Mortgage | With Mortgage |
| Less than 2.0x | 35 (38.9%) | 76,875 (118,269.2%) |
| 2.0x to 2.9x | 3 (3.3%) | 59 (90.8%) |
| 3.0x to 3.9x | 38 (42.2%) | 6 (9.2%) |
| 4.0x or more | 14 (15.6%) | 0 (0.0%) |
| Total | 90 (100.0%) | 65 (100.0%) |
Real Estate Taxes by Mortgage Status in Eldred borough
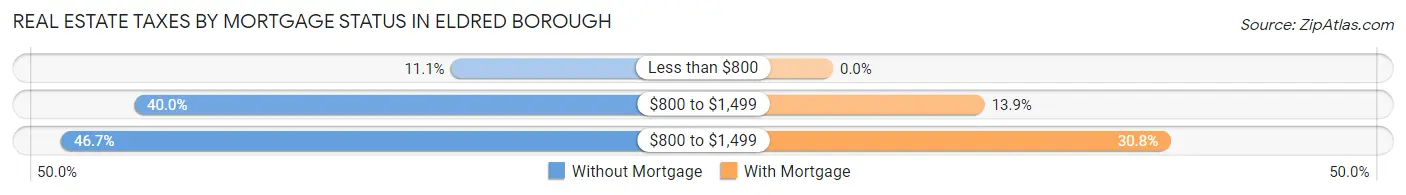
| Property Taxes | Without Mortgage | With Mortgage |
| Less than $800 | 10 (11.1%) | 0 (0.0%) |
| $800 to $1,499 | 36 (40.0%) | 9 (13.9%) |
| $800 to $1,499 | 42 (46.7%) | 20 (30.8%) |
| Total | 90 (100.0%) | 65 (100.0%) |
Health & Disability in Eldred borough
Health Insurance Coverage by Age in Eldred borough
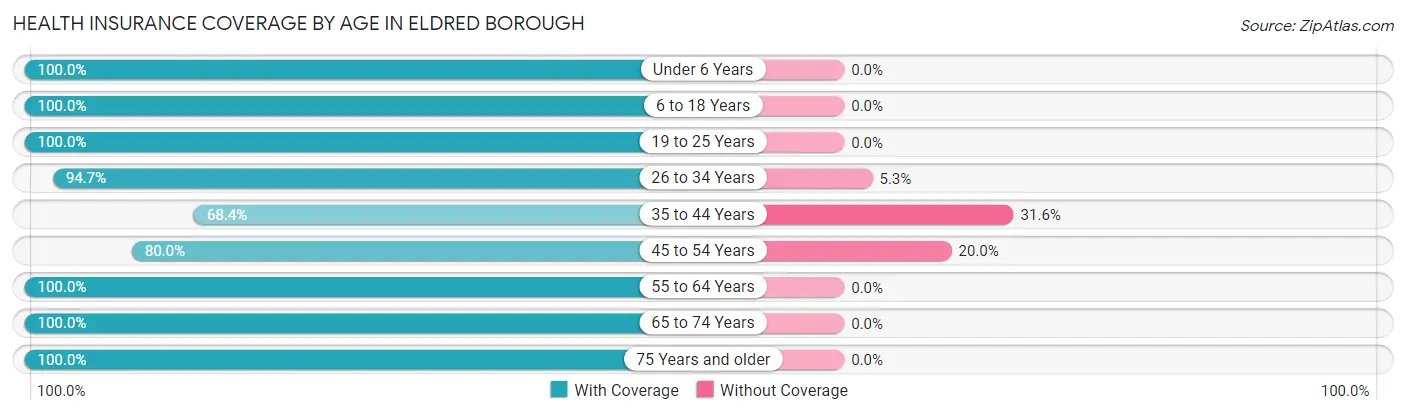
| Age Bracket | With Coverage | Without Coverage |
| Under 6 Years | 19 (100.0%) | 0 (0.0%) |
| 6 to 18 Years | 46 (100.0%) | 0 (0.0%) |
| 19 to 25 Years | 22 (100.0%) | 0 (0.0%) |
| 26 to 34 Years | 36 (94.7%) | 2 (5.3%) |
| 35 to 44 Years | 13 (68.4%) | 6 (31.6%) |
| 45 to 54 Years | 32 (80.0%) | 8 (20.0%) |
| 55 to 64 Years | 82 (100.0%) | 0 (0.0%) |
| 65 to 74 Years | 66 (100.0%) | 0 (0.0%) |
| 75 Years and older | 82 (100.0%) | 0 (0.0%) |
| Total | 398 (96.1%) | 16 (3.9%) |
Health Insurance Coverage by Citizenship Status in Eldred borough
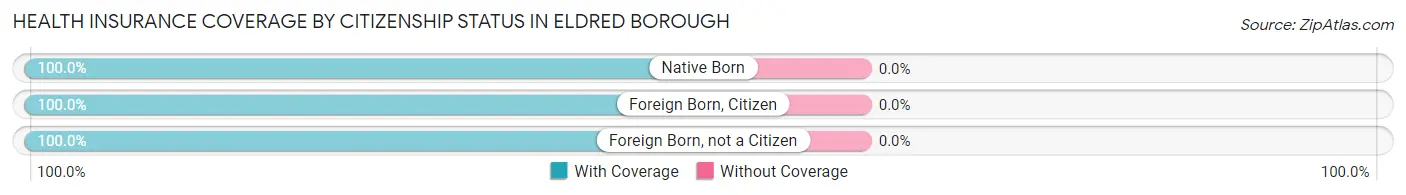
| Citizenship Status | With Coverage | Without Coverage |
| Native Born | 19 (100.0%) | 0 (0.0%) |
| Foreign Born, Citizen | 46 (100.0%) | 0 (0.0%) |
| Foreign Born, not a Citizen | 22 (100.0%) | 0 (0.0%) |
Health Insurance Coverage by Household Income in Eldred borough
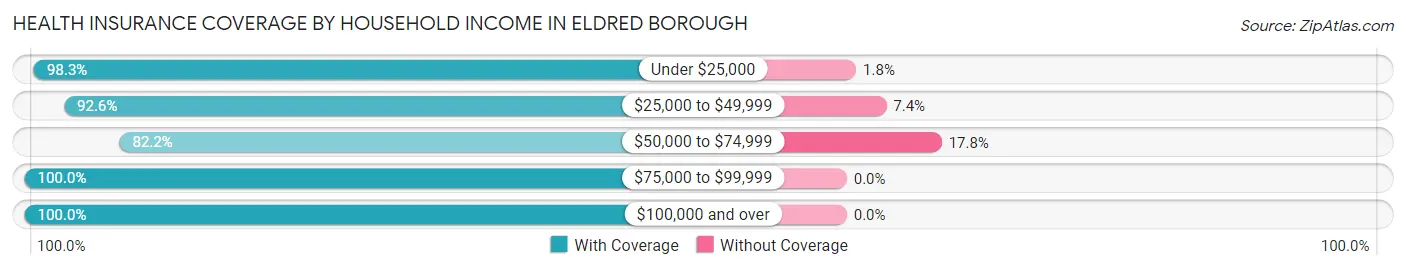
| Household Income | With Coverage | Without Coverage |
| Under $25,000 | 112 (98.3%) | 2 (1.8%) |
| $25,000 to $49,999 | 75 (92.6%) | 6 (7.4%) |
| $50,000 to $74,999 | 37 (82.2%) | 8 (17.8%) |
| $75,000 to $99,999 | 103 (100.0%) | 0 (0.0%) |
| $100,000 and over | 71 (100.0%) | 0 (0.0%) |
Public vs Private Health Insurance Coverage by Age in Eldred borough
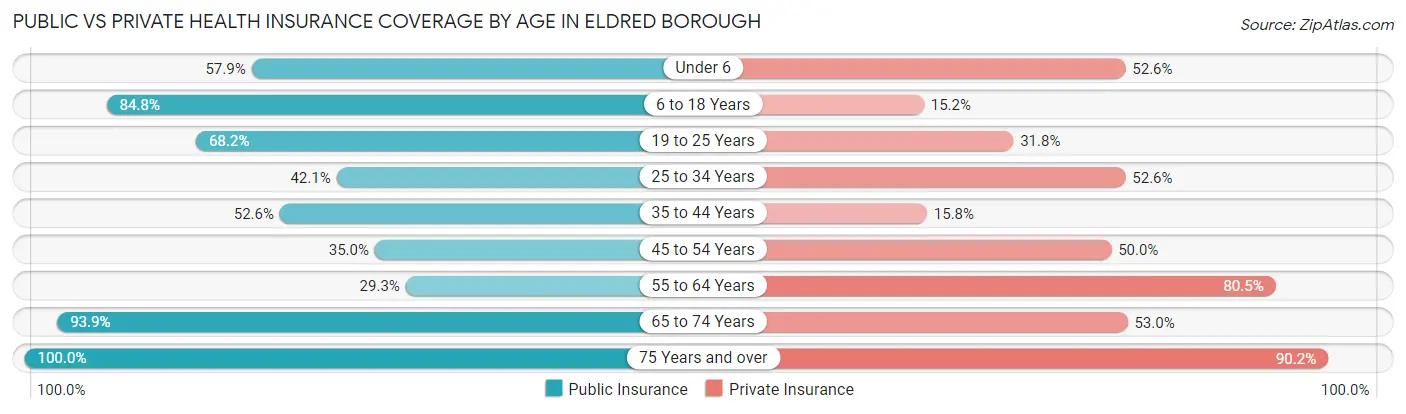
| Age Bracket | Public Insurance | Private Insurance |
| Under 6 | 11 (57.9%) | 10 (52.6%) |
| 6 to 18 Years | 39 (84.8%) | 7 (15.2%) |
| 19 to 25 Years | 15 (68.2%) | 7 (31.8%) |
| 25 to 34 Years | 16 (42.1%) | 20 (52.6%) |
| 35 to 44 Years | 10 (52.6%) | 3 (15.8%) |
| 45 to 54 Years | 14 (35.0%) | 20 (50.0%) |
| 55 to 64 Years | 24 (29.3%) | 66 (80.5%) |
| 65 to 74 Years | 62 (93.9%) | 35 (53.0%) |
| 75 Years and over | 82 (100.0%) | 74 (90.2%) |
| Total | 273 (65.9%) | 242 (58.5%) |
Disability Status by Sex by Age in Eldred borough
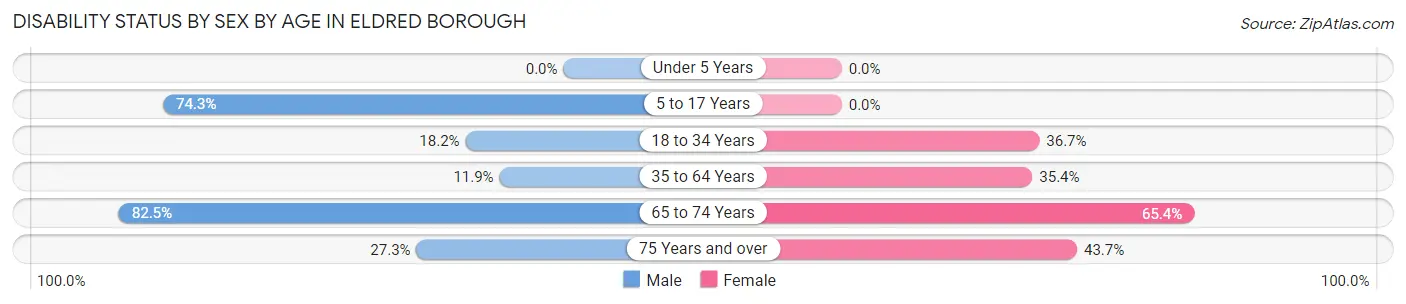
| Age Bracket | Male | Female |
| Under 5 Years | 0 (0.0%) | 0 (0.0%) |
| 5 to 17 Years | 26 (74.3%) | 0 (0.0%) |
| 18 to 34 Years | 6 (18.2%) | 11 (36.7%) |
| 35 to 64 Years | 7 (11.9%) | 29 (35.4%) |
| 65 to 74 Years | 33 (82.5%) | 17 (65.4%) |
| 75 Years and over | 3 (27.3%) | 31 (43.7%) |
Disability Class by Sex by Age in Eldred borough
Disability Class: Hearing Difficulty
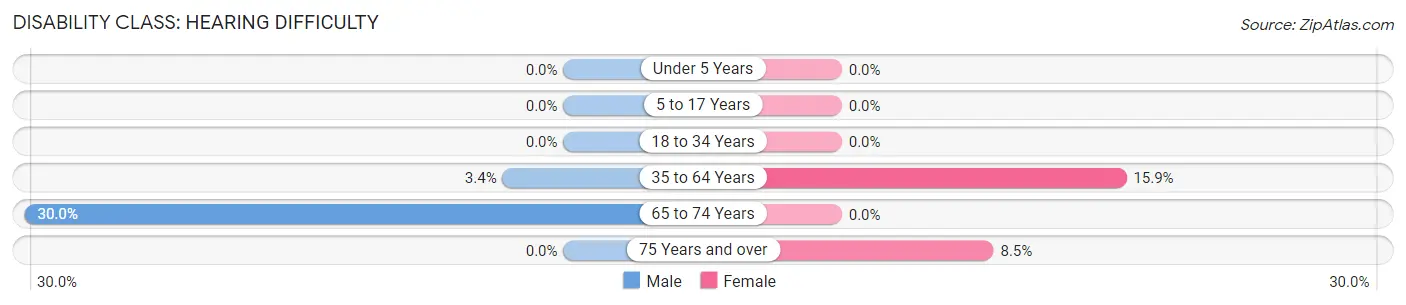
| Age Bracket | Male | Female |
| Under 5 Years | 0 (0.0%) | 0 (0.0%) |
| 5 to 17 Years | 0 (0.0%) | 0 (0.0%) |
| 18 to 34 Years | 0 (0.0%) | 0 (0.0%) |
| 35 to 64 Years | 2 (3.4%) | 13 (15.9%) |
| 65 to 74 Years | 12 (30.0%) | 0 (0.0%) |
| 75 Years and over | 0 (0.0%) | 6 (8.5%) |
Disability Class: Vision Difficulty
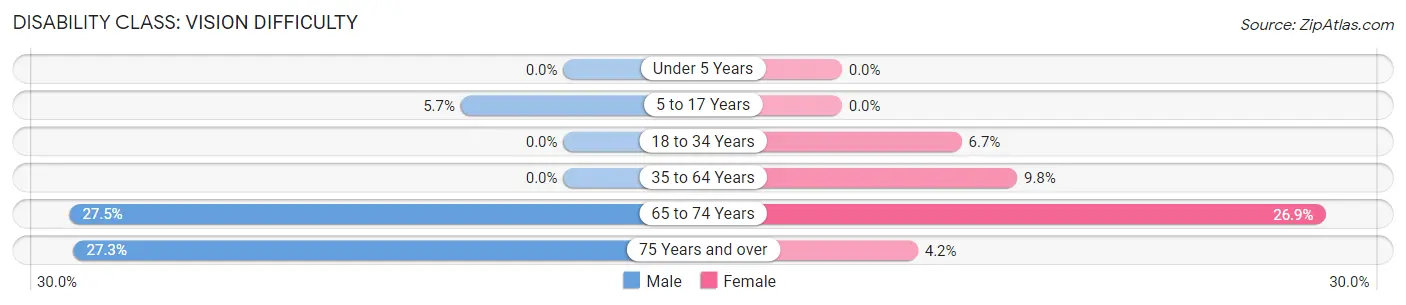
| Age Bracket | Male | Female |
| Under 5 Years | 0 (0.0%) | 0 (0.0%) |
| 5 to 17 Years | 2 (5.7%) | 0 (0.0%) |
| 18 to 34 Years | 0 (0.0%) | 2 (6.7%) |
| 35 to 64 Years | 0 (0.0%) | 8 (9.8%) |
| 65 to 74 Years | 11 (27.5%) | 7 (26.9%) |
| 75 Years and over | 3 (27.3%) | 3 (4.2%) |
Disability Class: Cognitive Difficulty
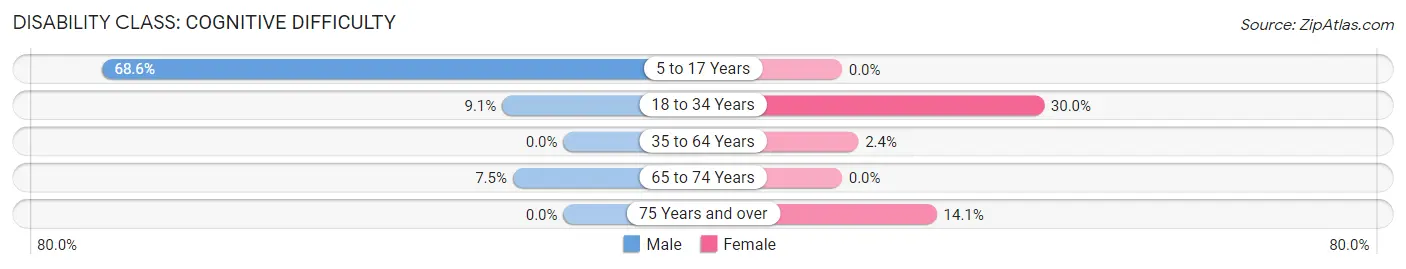
| Age Bracket | Male | Female |
| 5 to 17 Years | 24 (68.6%) | 0 (0.0%) |
| 18 to 34 Years | 3 (9.1%) | 9 (30.0%) |
| 35 to 64 Years | 0 (0.0%) | 2 (2.4%) |
| 65 to 74 Years | 3 (7.5%) | 0 (0.0%) |
| 75 Years and over | 0 (0.0%) | 10 (14.1%) |
Disability Class: Ambulatory Difficulty
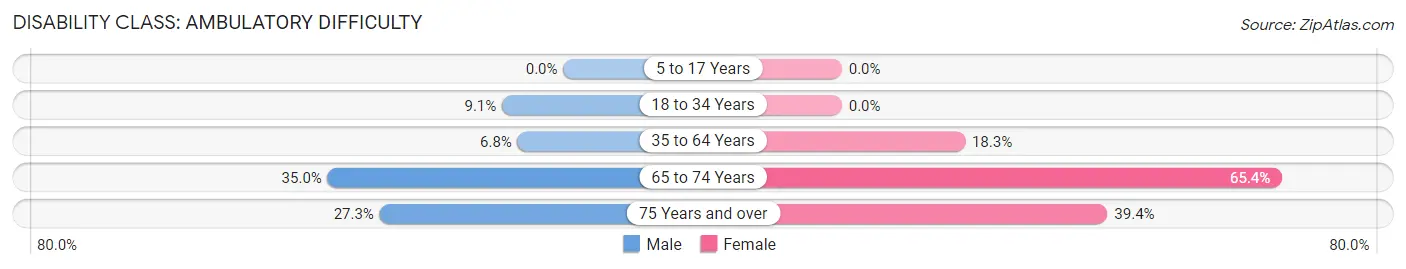
| Age Bracket | Male | Female |
| 5 to 17 Years | 0 (0.0%) | 0 (0.0%) |
| 18 to 34 Years | 3 (9.1%) | 0 (0.0%) |
| 35 to 64 Years | 4 (6.8%) | 15 (18.3%) |
| 65 to 74 Years | 14 (35.0%) | 17 (65.4%) |
| 75 Years and over | 3 (27.3%) | 28 (39.4%) |
Disability Class: Self-Care Difficulty
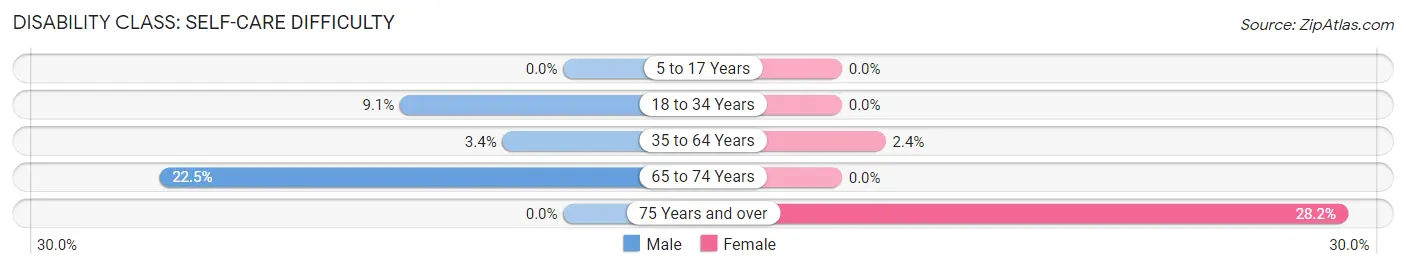
| Age Bracket | Male | Female |
| 5 to 17 Years | 0 (0.0%) | 0 (0.0%) |
| 18 to 34 Years | 3 (9.1%) | 0 (0.0%) |
| 35 to 64 Years | 2 (3.4%) | 2 (2.4%) |
| 65 to 74 Years | 9 (22.5%) | 0 (0.0%) |
| 75 Years and over | 0 (0.0%) | 20 (28.2%) |
Technology Access in Eldred borough
Computing Device Access in Eldred borough
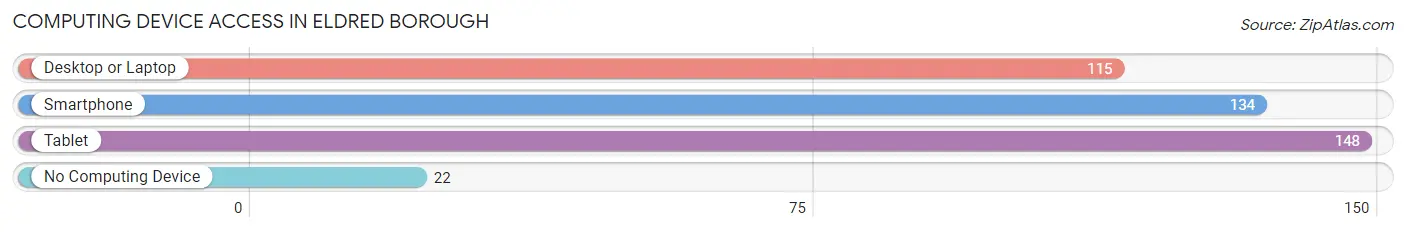
| Device Type | # Households | % Households |
| Desktop or Laptop | 115 | 50.7% |
| Smartphone | 134 | 59.0% |
| Tablet | 148 | 65.2% |
| No Computing Device | 22 | 9.7% |
| Total | 227 | 100.0% |
Internet Access in Eldred borough
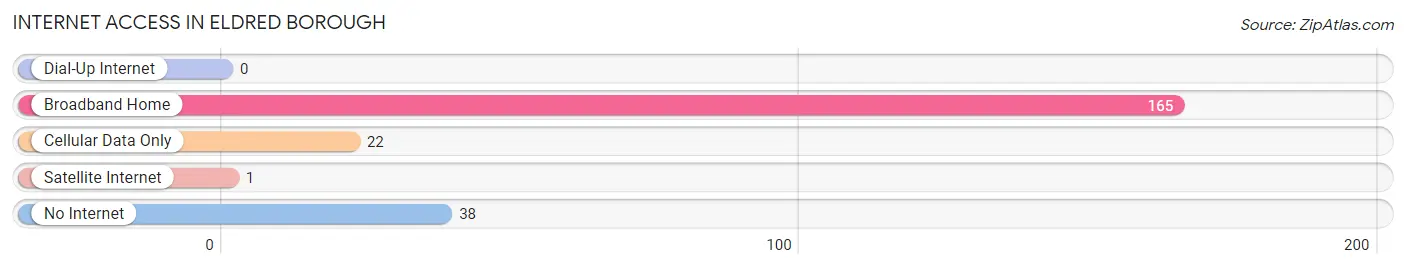
| Internet Type | # Households | % Households |
| Dial-Up Internet | 0 | 0.0% |
| Broadband Home | 165 | 72.7% |
| Cellular Data Only | 22 | 9.7% |
| Satellite Internet | 1 | 0.4% |
| No Internet | 38 | 16.7% |
| Total | 227 | 100.0% |
Eldred borough Summary
Eldred Borough is a small borough located in Jefferson County, Pennsylvania. It is situated in the foothills of the Allegheny Mountains and is part of the larger Punxsutawney Micropolitan Statistical Area. The borough has a population of approximately 1,000 people and covers an area of 0.6 square miles.
History
Eldred Borough was founded in 1845 by a group of settlers from the nearby town of Punxsutawney. The settlers were looking for a place to settle and start a new life. The area was originally known as "Eldred's Settlement" and was named after the first settler, John Eldred. The settlement was officially incorporated as a borough in 1876.
In the late 19th century, Eldred Borough was a thriving community with a variety of businesses and industries. The borough was home to a number of sawmills, gristmills, and tanneries. It also had a number of stores, hotels, and churches.
Geography
Eldred Borough is located in the foothills of the Allegheny Mountains in Jefferson County, Pennsylvania. The borough is situated at an elevation of 1,400 feet above sea level. The borough is bordered by the towns of Punxsutawney, Big Run, and Rossiter.
The borough is located in a rural area and is surrounded by forests and rolling hills. The climate in the area is generally mild, with temperatures ranging from the low 30s in the winter to the mid-80s in the summer.
Economy
Eldred Borough has a small but diverse economy. The borough is home to a number of small businesses, including a grocery store, a hardware store, a pharmacy, and a few restaurants. The borough also has a number of manufacturing and industrial businesses, including a sawmill, a gristmill, and a tannery.
The borough is also home to a number of tourist attractions, including the Eldred World War II Museum, the Eldred Railroad Museum, and the Eldred Historical Society. The borough also hosts a number of annual events, including the Eldred Fall Festival and the Eldred Christmas Parade.
Demographics
As of the 2010 census, the population of Eldred Borough was 1,000 people. The racial makeup of the borough was 97.2% White, 0.7% African American, 0.2% Native American, 0.2% Asian, and 1.7% from other races. The median household income in the borough was $37,500, and the median family income was $45,000.
The population of Eldred Borough is largely rural and is composed of a mix of families and individuals. The borough has a number of churches, including the First United Methodist Church, the First Presbyterian Church, and the St. John's Lutheran Church. The borough also has a number of schools, including the Eldred Elementary School and the Eldred Junior/Senior High School.
Common Questions
What is Per Capita Income in Eldred borough?
Per Capita income in Eldred borough is $32,499.
What is the Median Family Income in Eldred borough?
Median Family Income in Eldred borough is $80,833.
What is the Median Household income in Eldred borough?
Median Household Income in Eldred borough is $38,345.
What is Income or Wage Gap in Eldred borough?
Income or Wage Gap in Eldred borough is 24.1%.
Women in Eldred borough earn 75.9 cents for every dollar earned by a man.
What is Inequality or Gini Index in Eldred borough?
Inequality or Gini Index in Eldred borough is 0.48.
What is the Total Population of Eldred borough?
Total Population of Eldred borough is 414.
What is the Total Male Population of Eldred borough?
Total Male Population of Eldred borough is 187.
What is the Total Female Population of Eldred borough?
Total Female Population of Eldred borough is 227.
What is the Ratio of Males per 100 Females in Eldred borough?
There are 82.38 Males per 100 Females in Eldred borough.
What is the Ratio of Females per 100 Males in Eldred borough?
There are 121.39 Females per 100 Males in Eldred borough.
What is the Median Population Age in Eldred borough?
Median Population Age in Eldred borough is 58.3 Years.
What is the Average Family Size in Eldred borough
Average Family Size in Eldred borough is 3.0 People.
What is the Average Household Size in Eldred borough
Average Household Size in Eldred borough is 1.8 People.
How Large is the Labor Force in Eldred borough?
There are 132 People in the Labor Forcein in Eldred borough.
What is the Percentage of People in the Labor Force in Eldred borough?
36.4% of People are in the Labor Force in Eldred borough.
What is the Unemployment Rate in Eldred borough?
Unemployment Rate in Eldred borough is 12.9%.