Trappe, MD Map & Demographics
Trappe Map
Trappe Overview
$32,174
PER CAPITA INCOME
$78,125
AVG FAMILY INCOME
$65,139
AVG HOUSEHOLD INCOME
3.1%
WAGE / INCOME GAP [ % ]
96.9¢/ $1
WAGE / INCOME GAP [ $ ]
0.36
INEQUALITY / GINI INDEX
1,019
TOTAL POPULATION
551
MALE POPULATION
468
FEMALE POPULATION
117.74
MALES / 100 FEMALES
84.94
FEMALES / 100 MALES
40.8
MEDIAN AGE
3.2
AVG FAMILY SIZE
2.4
AVG HOUSEHOLD SIZE
600
LABOR FORCE [ PEOPLE ]
71.1%
PERCENT IN LABOR FORCE
8.8%
UNEMPLOYMENT RATE
Trappe Zip Codes
Income in Trappe
Income Overview in Trappe
Per Capita Income in Trappe is $32,174, while median incomes of families and households are $78,125 and $65,139 respectively.
| Characteristic | Number | Measure |
| Per Capita Income | 1,019 | $32,174 |
| Median Family Income | 254 | $78,125 |
| Mean Family Income | 254 | $87,457 |
| Median Household Income | 423 | $65,139 |
| Mean Household Income | 423 | $75,030 |
| Income Deficit | 254 | $0 |
| Wage / Income Gap (%) | 1,019 | 3.05% |
| Wage / Income Gap ($) | 1,019 | 96.95¢ per $1 |
| Gini / Inequality Index | 1,019 | 0.36 |
Earnings by Sex in Trappe
Average Earnings in Trappe are $36,543, $36,806 for men and $35,682 for women, a difference of 3.0%.
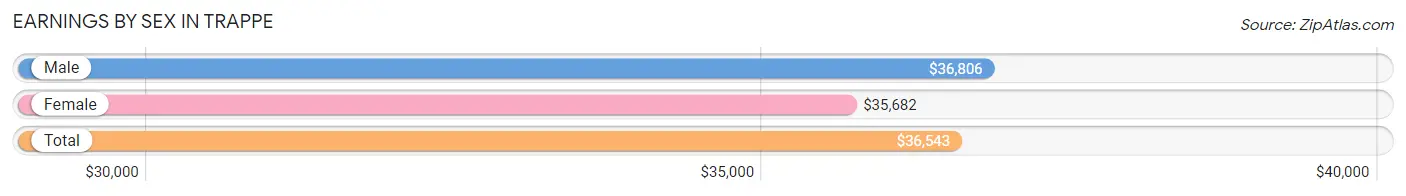
| Sex | Number | Average Earnings |
| Male | 312 (53.1%) | $36,806 |
| Female | 276 (46.9%) | $35,682 |
| Total | 588 (100.0%) | $36,543 |
Earnings by Sex by Income Bracket in Trappe
The most common earnings brackets in Trappe are $35,000 to $39,999 for men (51 | 16.4%) and $55,000 to $64,999 for women (45 | 16.3%).
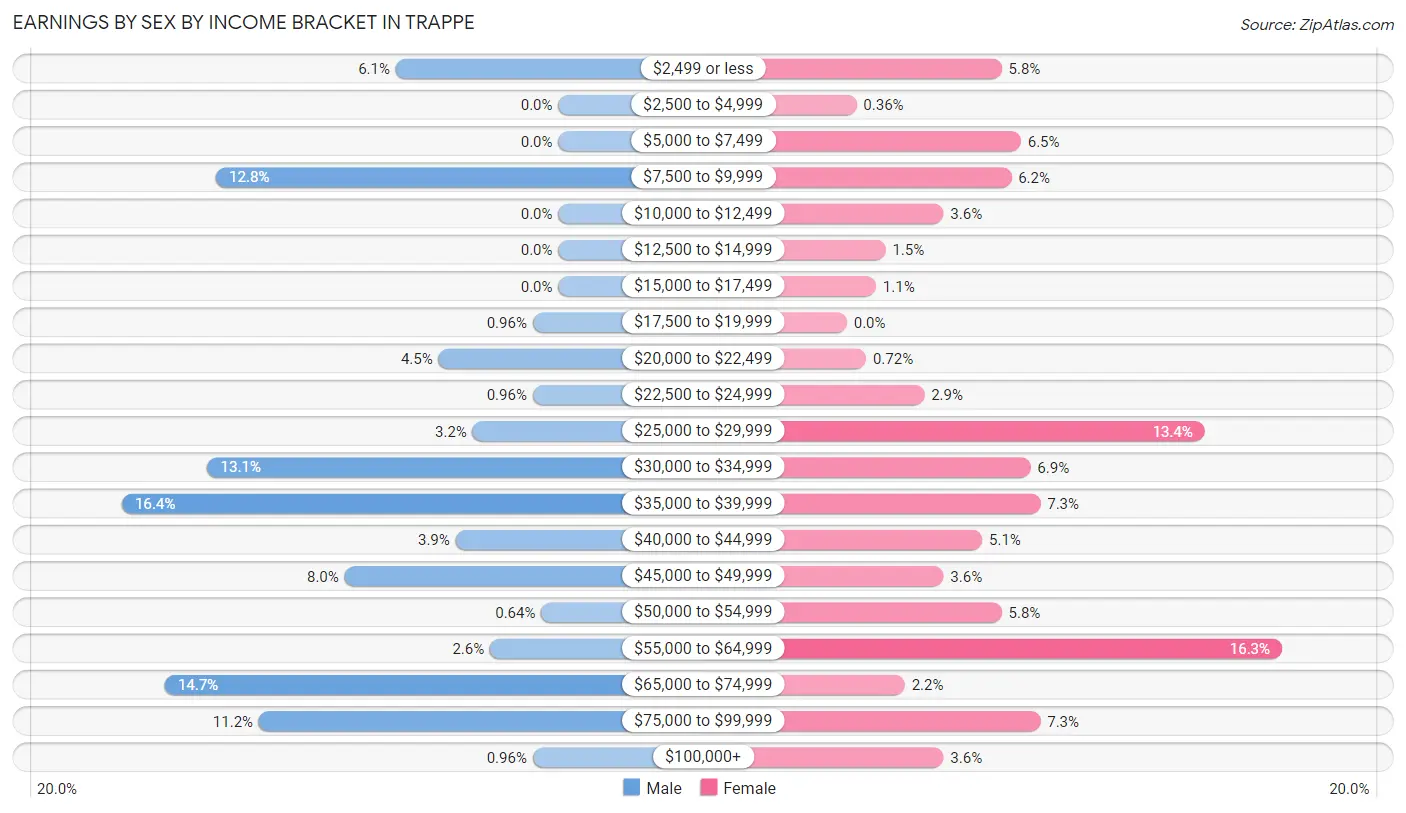
| Income | Male | Female |
| $2,499 or less | 19 (6.1%) | 16 (5.8%) |
| $2,500 to $4,999 | 0 (0.0%) | 1 (0.4%) |
| $5,000 to $7,499 | 0 (0.0%) | 18 (6.5%) |
| $7,500 to $9,999 | 40 (12.8%) | 17 (6.2%) |
| $10,000 to $12,499 | 0 (0.0%) | 10 (3.6%) |
| $12,500 to $14,999 | 0 (0.0%) | 4 (1.5%) |
| $15,000 to $17,499 | 0 (0.0%) | 3 (1.1%) |
| $17,500 to $19,999 | 3 (1.0%) | 0 (0.0%) |
| $20,000 to $22,499 | 14 (4.5%) | 2 (0.7%) |
| $22,500 to $24,999 | 3 (1.0%) | 8 (2.9%) |
| $25,000 to $29,999 | 10 (3.2%) | 37 (13.4%) |
| $30,000 to $34,999 | 41 (13.1%) | 19 (6.9%) |
| $35,000 to $39,999 | 51 (16.4%) | 20 (7.2%) |
| $40,000 to $44,999 | 12 (3.8%) | 14 (5.1%) |
| $45,000 to $49,999 | 25 (8.0%) | 10 (3.6%) |
| $50,000 to $54,999 | 2 (0.6%) | 16 (5.8%) |
| $55,000 to $64,999 | 8 (2.6%) | 45 (16.3%) |
| $65,000 to $74,999 | 46 (14.7%) | 6 (2.2%) |
| $75,000 to $99,999 | 35 (11.2%) | 20 (7.2%) |
| $100,000+ | 3 (1.0%) | 10 (3.6%) |
| Total | 312 (100.0%) | 276 (100.0%) |
Earnings by Sex by Educational Attainment in Trappe
Average earnings in Trappe are $37,014 for men and $37,273 for women, a difference of 0.7%. Men with an educational attainment of college or associate's degree enjoy the highest average annual earnings of $58,750, while those with bachelor's degree education earn the least with $21,563. Women with an educational attainment of college or associate's degree earn the most with the average annual earnings of $43,750, while those with graduate degree education have the smallest earnings of $26,458.
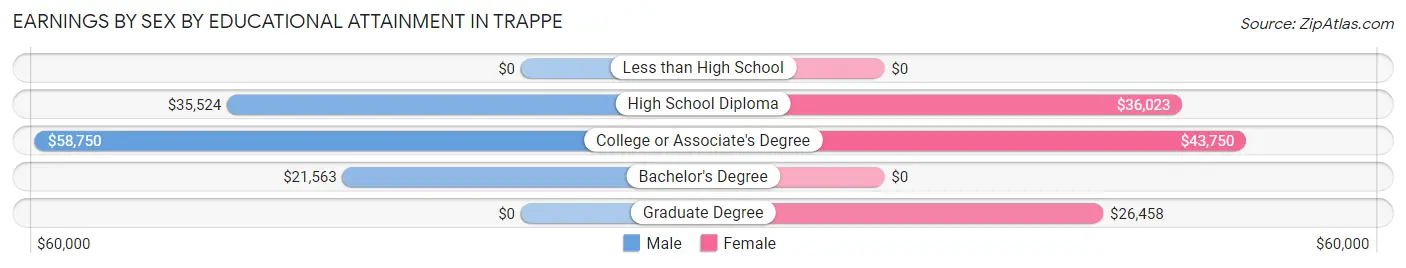
| Educational Attainment | Male Income | Female Income |
| Less than High School | - | - |
| High School Diploma | $35,524 | $36,023 |
| College or Associate's Degree | $58,750 | $43,750 |
| Bachelor's Degree | $21,563 | $0 |
| Graduate Degree | - | - |
| Total | $37,014 | $37,273 |
Family Income in Trappe
Family Income Brackets in Trappe
According to the Trappe family income data, there are 65 families falling into the $50,000 to $74,999 income range, which is the most common income bracket and makes up 25.6% of all families.
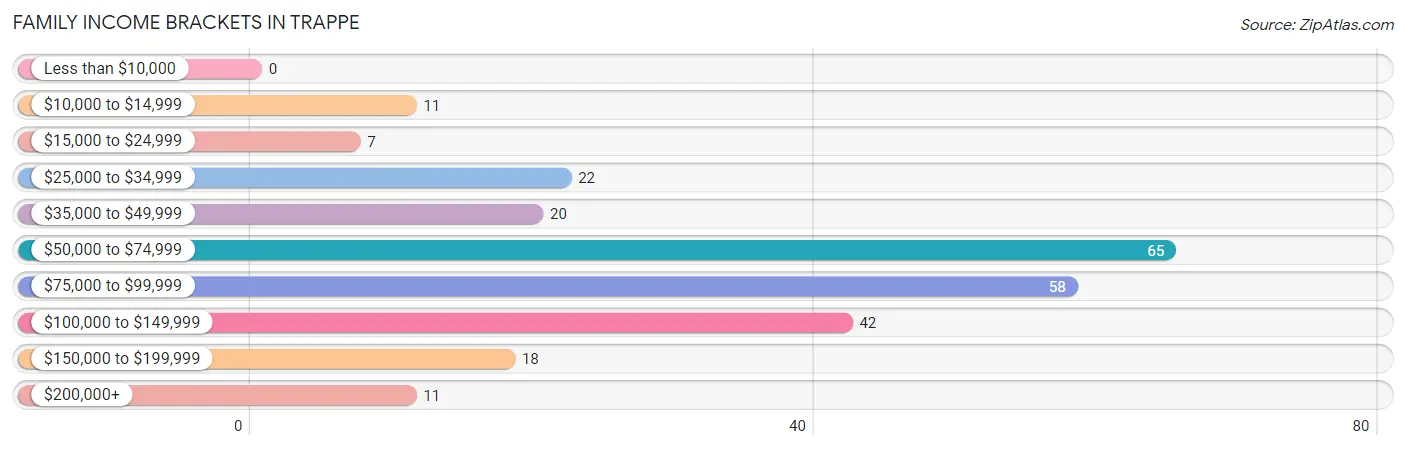
| Income Bracket | # Families | % Families |
| Less than $10,000 | 0 | 0.0% |
| $10,000 to $14,999 | 11 | 4.3% |
| $15,000 to $24,999 | 7 | 2.8% |
| $25,000 to $34,999 | 22 | 8.7% |
| $35,000 to $49,999 | 20 | 7.9% |
| $50,000 to $74,999 | 65 | 25.6% |
| $75,000 to $99,999 | 58 | 22.8% |
| $100,000 to $149,999 | 42 | 16.5% |
| $150,000 to $199,999 | 18 | 7.1% |
| $200,000+ | 11 | 4.3% |
Family Income by Famaliy Size in Trappe
4-person families (42 | 16.5%) account for the highest median family income in Trappe with $101,111 per family, while 2-person families (140 | 55.1%) have the highest median income of $36,027 per family member.
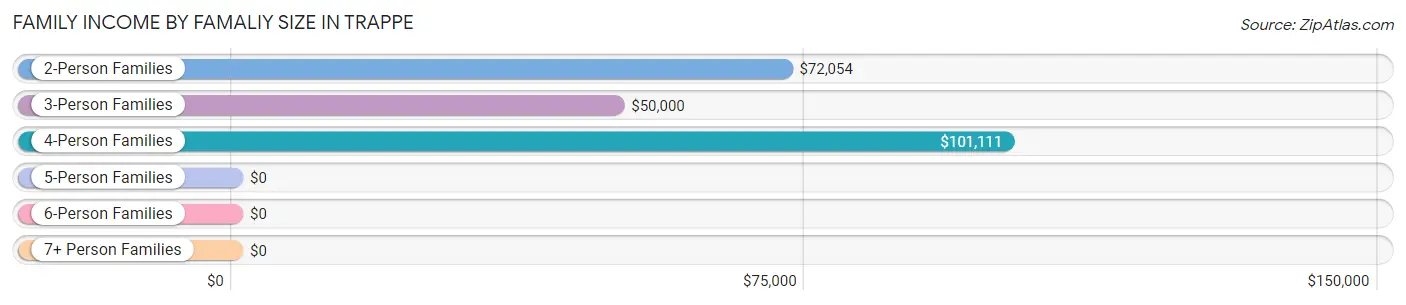
| Income Bracket | # Families | Median Income |
| 2-Person Families | 140 (55.1%) | $72,054 |
| 3-Person Families | 50 (19.7%) | $50,000 |
| 4-Person Families | 42 (16.5%) | $101,111 |
| 5-Person Families | 20 (7.9%) | $0 |
| 6-Person Families | 2 (0.8%) | $0 |
| 7+ Person Families | 0 (0.0%) | $0 |
| Total | 254 (100.0%) | $78,125 |
Family Income by Number of Earners in Trappe
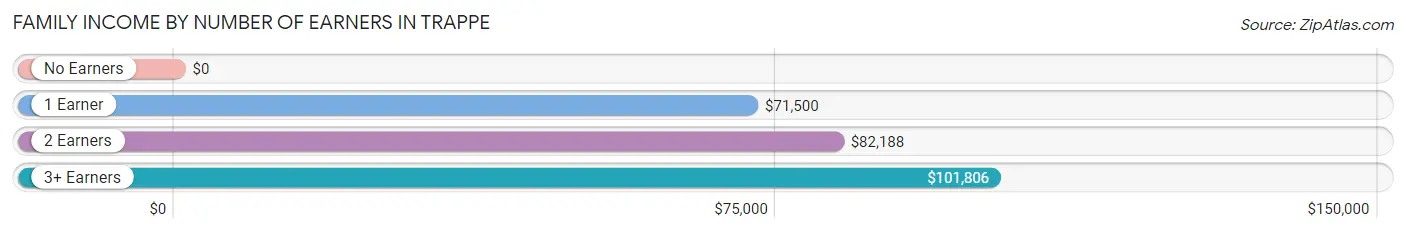
| Number of Earners | # Families | Median Income |
| No Earners | 35 (13.8%) | $0 |
| 1 Earner | 94 (37.0%) | $71,500 |
| 2 Earners | 90 (35.4%) | $82,188 |
| 3+ Earners | 35 (13.8%) | $101,806 |
| Total | 254 (100.0%) | $78,125 |
Household Income in Trappe
Household Income Brackets in Trappe
With 98 households falling in the category, the $50,000 to $74,999 income range is the most frequent in Trappe, accounting for 23.2% of all households. In contrast, only 4 households (0.9%) fall into the less than $10,000 income bracket, making it the least populous group.
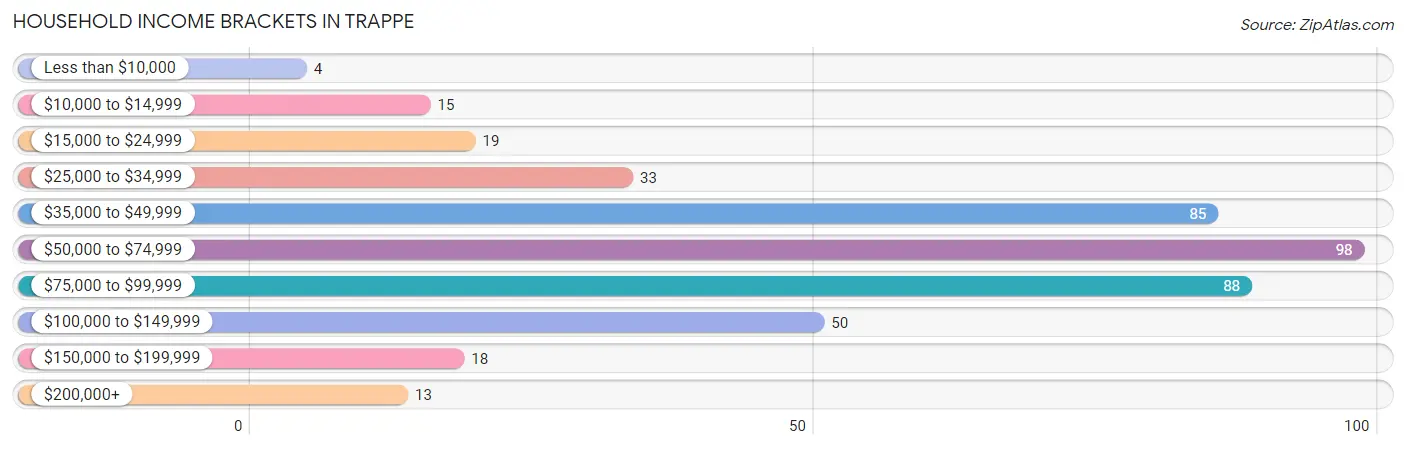
| Income Bracket | # Households | % Households |
| Less than $10,000 | 4 | 0.9% |
| $10,000 to $14,999 | 15 | 3.5% |
| $15,000 to $24,999 | 19 | 4.5% |
| $25,000 to $34,999 | 33 | 7.8% |
| $35,000 to $49,999 | 85 | 20.1% |
| $50,000 to $74,999 | 98 | 23.2% |
| $75,000 to $99,999 | 88 | 20.8% |
| $100,000 to $149,999 | 50 | 11.8% |
| $150,000 to $199,999 | 18 | 4.3% |
| $200,000+ | 13 | 3.1% |
Household Income by Householder Age in Trappe
The median household income in Trappe is $65,139, with the highest median household income of $95,054 found in the 25 to 44 years age bracket for the primary householder. A total of 107 households (25.3%) fall into this category. Meanwhile, the 45 to 64 years age bracket for the primary householder has the lowest median household income of $51,719, with 193 households (45.6%) in this group.
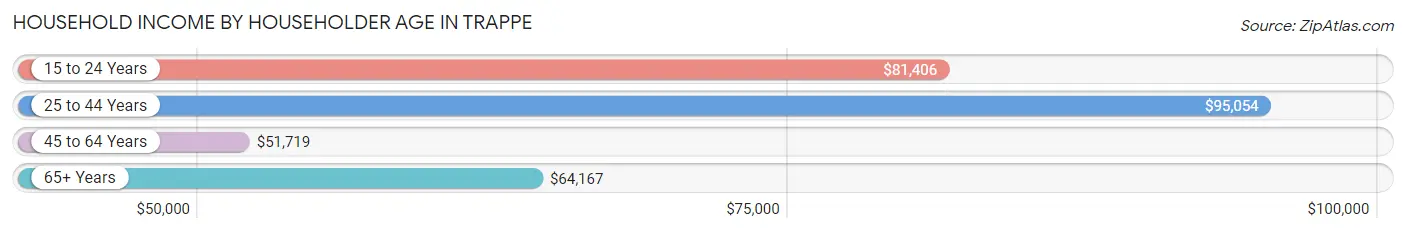
| Income Bracket | # Households | Median Income |
| 15 to 24 Years | 17 (4.0%) | $81,406 |
| 25 to 44 Years | 107 (25.3%) | $95,054 |
| 45 to 64 Years | 193 (45.6%) | $51,719 |
| 65+ Years | 106 (25.1%) | $64,167 |
| Total | 423 (100.0%) | $65,139 |
Poverty in Trappe
Income Below Poverty by Sex and Age in Trappe
With 11.6% poverty level for males and 10.9% for females among the residents of Trappe, 16 and 17 year old males and 35 to 44 year old females are the most vulnerable to poverty, with 14 males (30.4%) and 19 females (25.7%) in their respective age groups living below the poverty level.
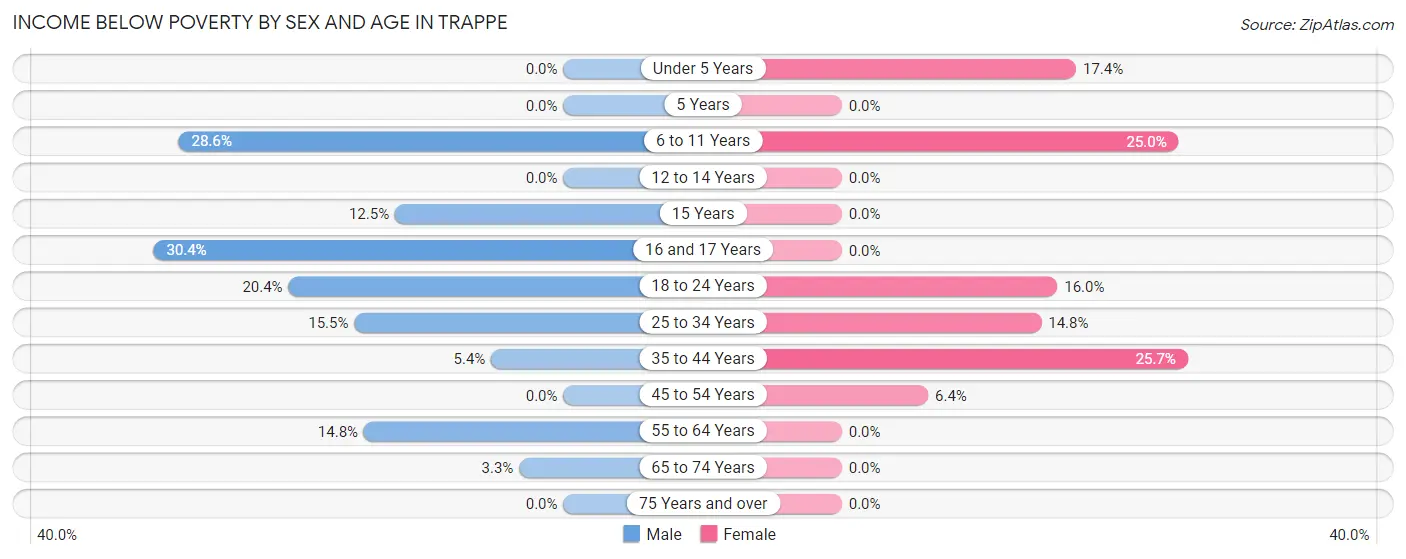
| Age Bracket | Male | Female |
| Under 5 Years | 0 (0.0%) | 4 (17.4%) |
| 5 Years | 0 (0.0%) | 0 (0.0%) |
| 6 to 11 Years | 14 (28.6%) | 7 (25.0%) |
| 12 to 14 Years | 0 (0.0%) | 0 (0.0%) |
| 15 Years | 4 (12.5%) | 0 (0.0%) |
| 16 and 17 Years | 14 (30.4%) | 0 (0.0%) |
| 18 to 24 Years | 10 (20.4%) | 8 (16.0%) |
| 25 to 34 Years | 9 (15.5%) | 8 (14.8%) |
| 35 to 44 Years | 3 (5.4%) | 19 (25.7%) |
| 45 to 54 Years | 0 (0.0%) | 5 (6.4%) |
| 55 to 64 Years | 8 (14.8%) | 0 (0.0%) |
| 65 to 74 Years | 2 (3.3%) | 0 (0.0%) |
| 75 Years and over | 0 (0.0%) | 0 (0.0%) |
| Total | 64 (11.6%) | 51 (10.9%) |
Income Above Poverty by Sex and Age in Trappe
According to the poverty statistics in Trappe, males aged under 5 years and females aged 5 years are the age groups that are most secure financially, with 100.0% of males and 100.0% of females in these age groups living above the poverty line.
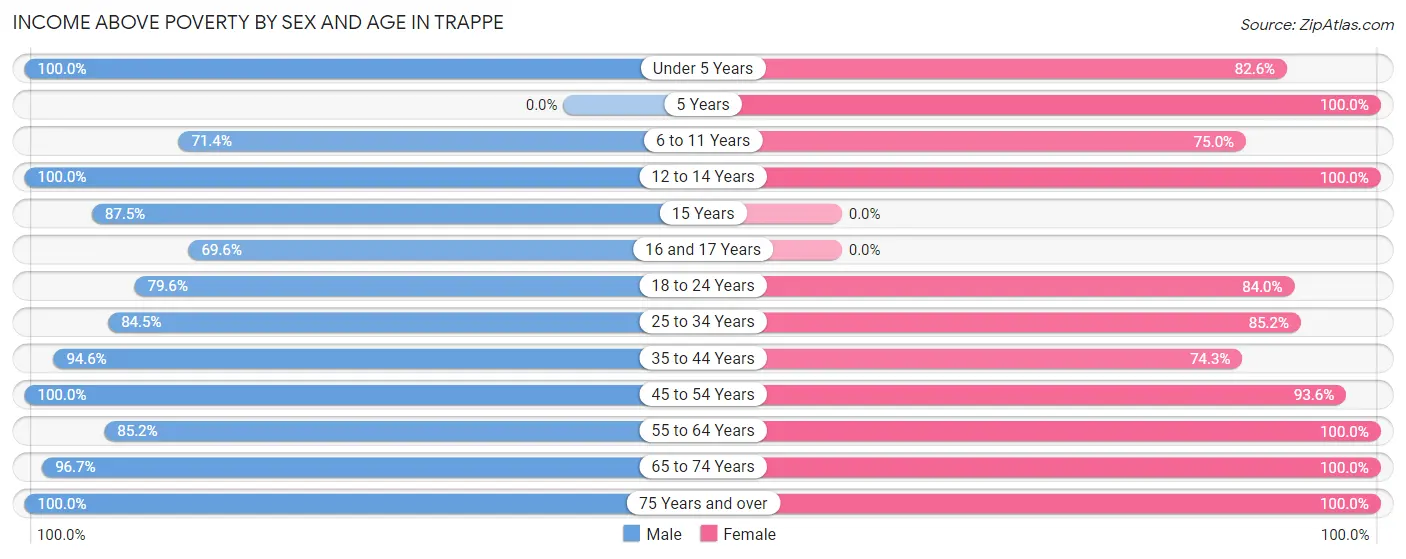
| Age Bracket | Male | Female |
| Under 5 Years | 21 (100.0%) | 19 (82.6%) |
| 5 Years | 0 (0.0%) | 5 (100.0%) |
| 6 to 11 Years | 35 (71.4%) | 21 (75.0%) |
| 12 to 14 Years | 9 (100.0%) | 8 (100.0%) |
| 15 Years | 28 (87.5%) | 0 (0.0%) |
| 16 and 17 Years | 32 (69.6%) | 0 (0.0%) |
| 18 to 24 Years | 39 (79.6%) | 42 (84.0%) |
| 25 to 34 Years | 49 (84.5%) | 46 (85.2%) |
| 35 to 44 Years | 53 (94.6%) | 55 (74.3%) |
| 45 to 54 Years | 88 (100.0%) | 73 (93.6%) |
| 55 to 64 Years | 46 (85.2%) | 69 (100.0%) |
| 65 to 74 Years | 59 (96.7%) | 60 (100.0%) |
| 75 Years and over | 28 (100.0%) | 19 (100.0%) |
| Total | 487 (88.4%) | 417 (89.1%) |
Income Below Poverty Among Married-Couple Families in Trappe
The poverty statistics for married-couple families in Trappe show that 2.6% or 5 of the total 195 families live below the poverty line. Families with 1 or 2 children have the highest poverty rate of 9.4%, comprising of 5 families. On the other hand, families with no children have the lowest poverty rate of 0.0%, which includes 0 families.
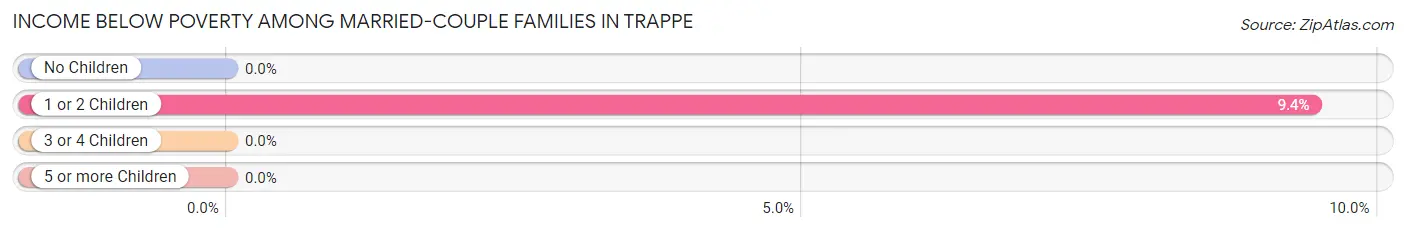
| Children | Above Poverty | Below Poverty |
| No Children | 142 (100.0%) | 0 (0.0%) |
| 1 or 2 Children | 48 (90.6%) | 5 (9.4%) |
| 3 or 4 Children | 0 (0.0%) | 0 (0.0%) |
| 5 or more Children | 0 (0.0%) | 0 (0.0%) |
| Total | 190 (97.4%) | 5 (2.6%) |
Income Below Poverty Among Single-Parent Households in Trappe
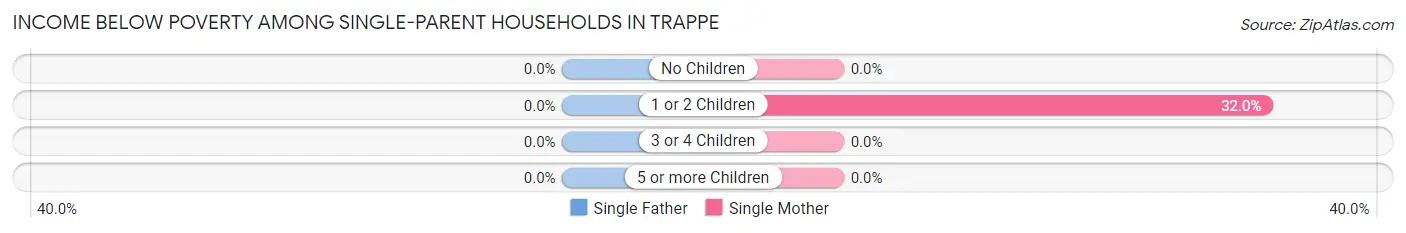
| Children | Single Father | Single Mother |
| No Children | 0 (0.0%) | 0 (0.0%) |
| 1 or 2 Children | 0 (0.0%) | 16 (32.0%) |
| 3 or 4 Children | 0 (0.0%) | 0 (0.0%) |
| 5 or more Children | 0 (0.0%) | 0 (0.0%) |
| Total | 0 (0.0%) | 16 (29.1%) |
Income Below Poverty Among Married-Couple vs Single-Parent Households in Trappe
The poverty data for Trappe shows that 5 of the married-couple family households (2.6%) and 16 of the single-parent households (27.1%) are living below the poverty level. Within the married-couple family households, those with 1 or 2 children have the highest poverty rate, with 5 households (9.4%) falling below the poverty line. Among the single-parent households, those with 1 or 2 children have the highest poverty rate, with 16 household (31.4%) living below poverty.
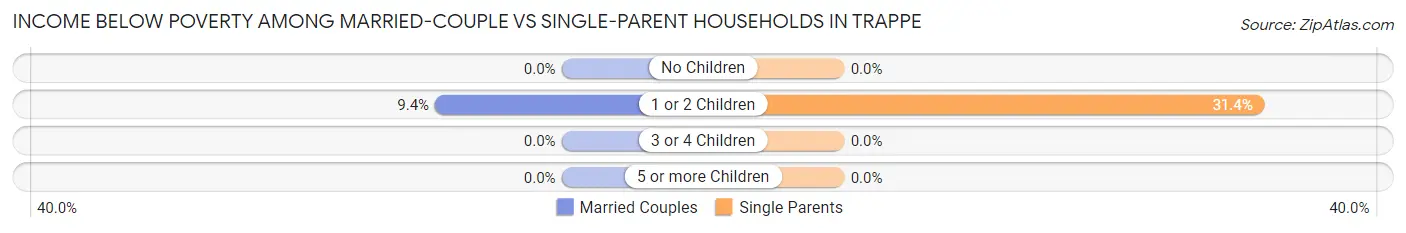
| Children | Married-Couple Families | Single-Parent Households |
| No Children | 0 (0.0%) | 0 (0.0%) |
| 1 or 2 Children | 5 (9.4%) | 16 (31.4%) |
| 3 or 4 Children | 0 (0.0%) | 0 (0.0%) |
| 5 or more Children | 0 (0.0%) | 0 (0.0%) |
| Total | 5 (2.6%) | 16 (27.1%) |
Race in Trappe
The most populous races in Trappe are White / Caucasian (766 | 75.2%), Black / African American (179 | 17.6%), and Hispanic or Latino (124 | 12.2%).
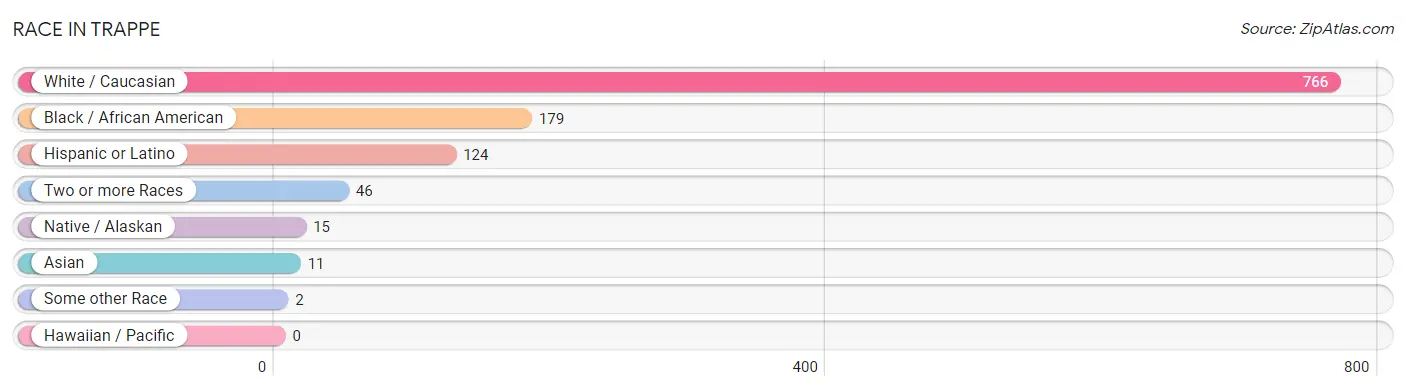
| Race | # Population | % Population |
| Asian | 11 | 1.1% |
| Black / African American | 179 | 17.6% |
| Hawaiian / Pacific | 0 | 0.0% |
| Hispanic or Latino | 124 | 12.2% |
| Native / Alaskan | 15 | 1.5% |
| White / Caucasian | 766 | 75.2% |
| Two or more Races | 46 | 4.5% |
| Some other Race | 2 | 0.2% |
| Total | 1,019 | 100.0% |
Ancestry in Trappe
The most populous ancestries reported in Trappe are Irish (128 | 12.6%), English (118 | 11.6%), German (95 | 9.3%), American (80 | 7.9%), and Central American (65 | 6.4%), together accounting for 47.7% of all Trappe residents.
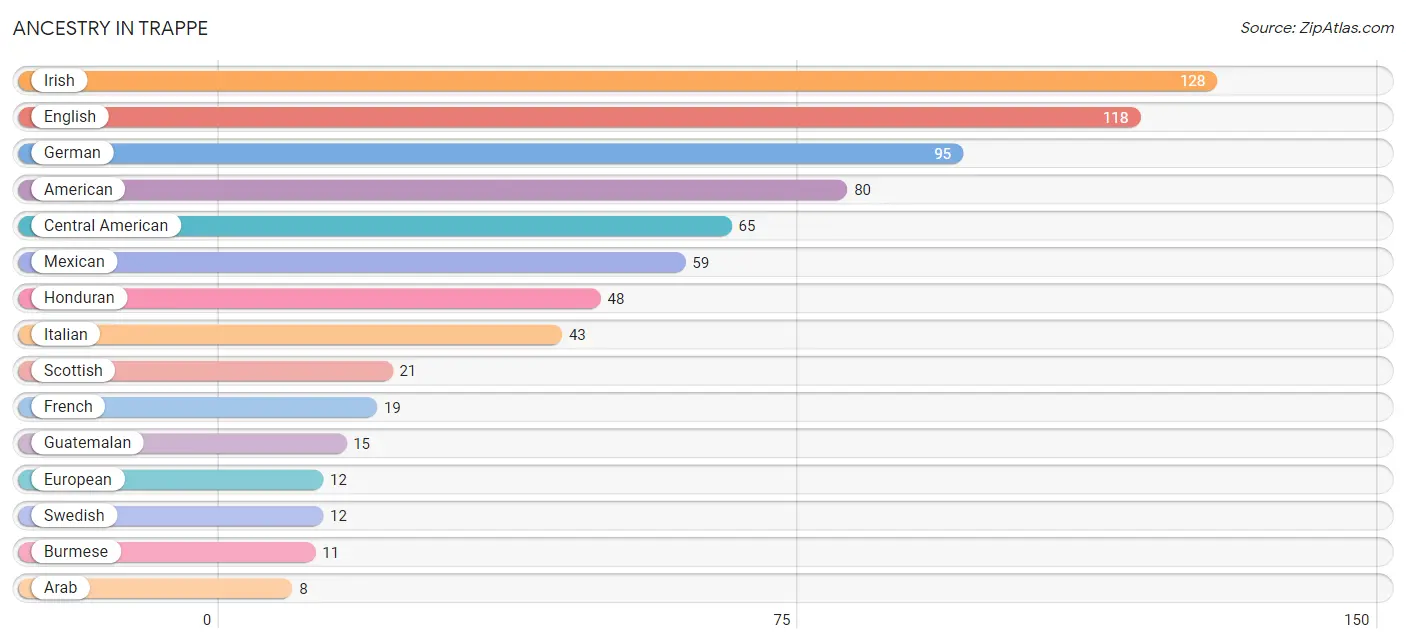
| Ancestry | # Population | % Population |
| African | 5 | 0.5% |
| American | 80 | 7.9% |
| Arab | 8 | 0.8% |
| Burmese | 11 | 1.1% |
| Central American | 65 | 6.4% |
| Dutch | 7 | 0.7% |
| English | 118 | 11.6% |
| European | 12 | 1.2% |
| French | 19 | 1.9% |
| German | 95 | 9.3% |
| Guatemalan | 15 | 1.5% |
| Honduran | 48 | 4.7% |
| Irish | 128 | 12.6% |
| Italian | 43 | 4.2% |
| Jordanian | 8 | 0.8% |
| Mexican | 59 | 5.8% |
| Pennsylvania German | 3 | 0.3% |
| Polish | 3 | 0.3% |
| Portuguese | 4 | 0.4% |
| Russian | 3 | 0.3% |
| Salvadoran | 2 | 0.2% |
| Scotch-Irish | 8 | 0.8% |
| Scottish | 21 | 2.1% |
| Subsaharan African | 5 | 0.5% |
| Swedish | 12 | 1.2% |
| Ukrainian | 4 | 0.4% |
| Welsh | 7 | 0.7% | View All 27 Rows |
Immigrants in Trappe
The most numerous immigrant groups reported in Trappe came from Central America (76 | 7.5%), Latin America (76 | 7.5%), Honduras (34 | 3.3%), Mexico (32 | 3.1%), and Asia (19 | 1.9%), together accounting for 23.3% of all Trappe residents.
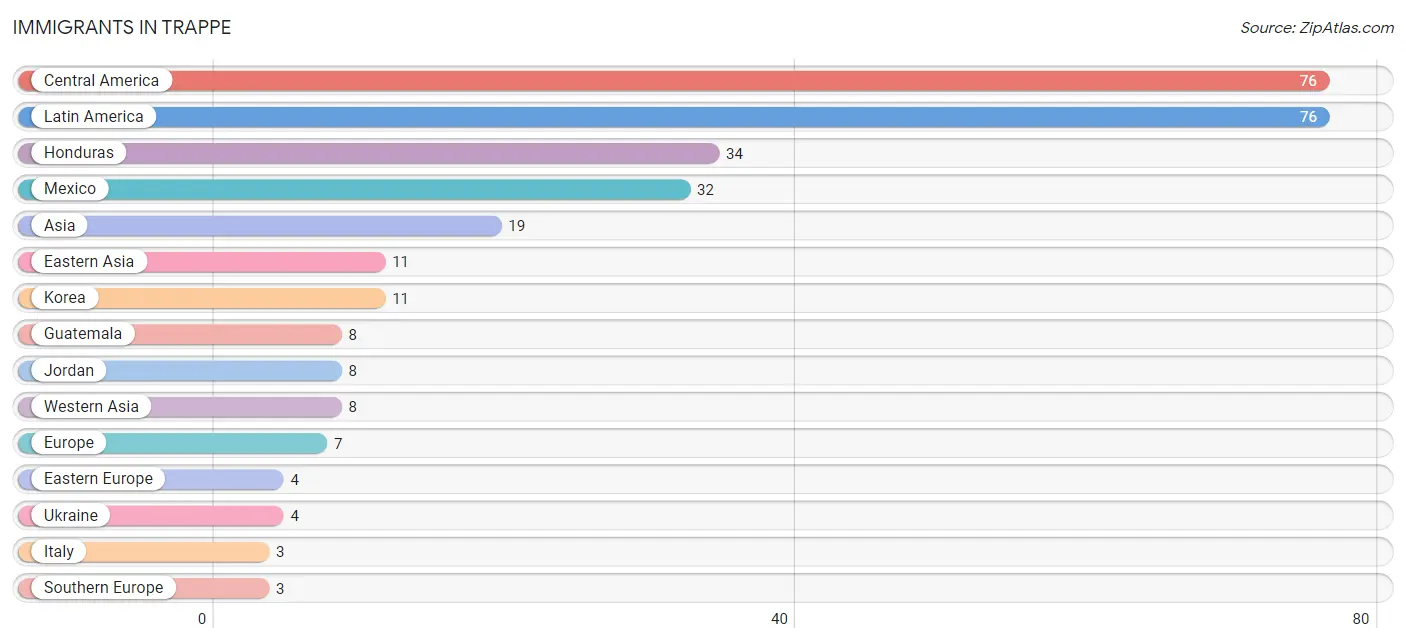
| Immigration Origin | # Population | % Population |
| Asia | 19 | 1.9% |
| Central America | 76 | 7.5% |
| Eastern Asia | 11 | 1.1% |
| Eastern Europe | 4 | 0.4% |
| El Salvador | 2 | 0.2% |
| Europe | 7 | 0.7% |
| Guatemala | 8 | 0.8% |
| Honduras | 34 | 3.3% |
| Italy | 3 | 0.3% |
| Jordan | 8 | 0.8% |
| Korea | 11 | 1.1% |
| Latin America | 76 | 7.5% |
| Mexico | 32 | 3.1% |
| Southern Europe | 3 | 0.3% |
| Ukraine | 4 | 0.4% |
| Western Asia | 8 | 0.8% | View All 16 Rows |
Sex and Age in Trappe
Sex and Age in Trappe
The most populous age groups in Trappe are 15 to 19 Years (82 | 14.9%) for men and 50 to 54 Years (67 | 14.3%) for women.
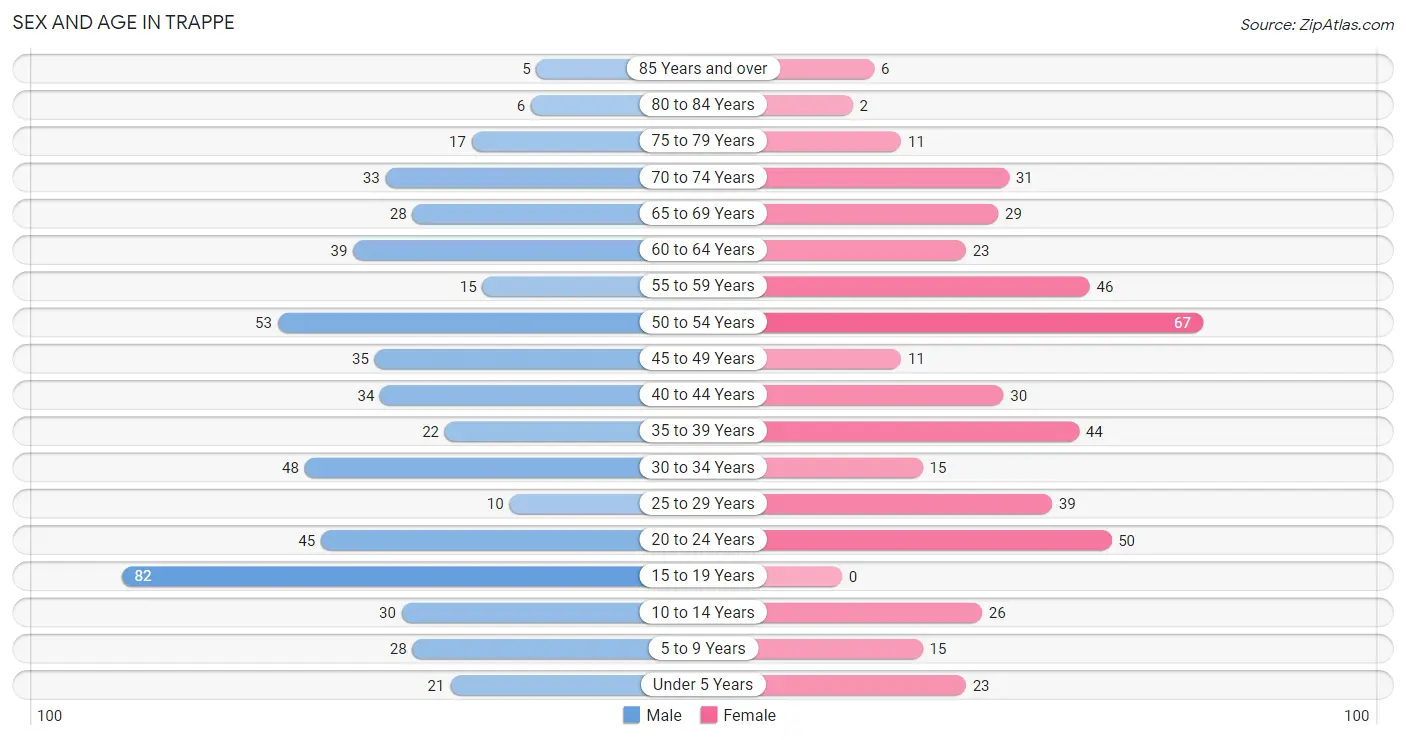
| Age Bracket | Male | Female |
| Under 5 Years | 21 (3.8%) | 23 (4.9%) |
| 5 to 9 Years | 28 (5.1%) | 15 (3.2%) |
| 10 to 14 Years | 30 (5.4%) | 26 (5.6%) |
| 15 to 19 Years | 82 (14.9%) | 0 (0.0%) |
| 20 to 24 Years | 45 (8.2%) | 50 (10.7%) |
| 25 to 29 Years | 10 (1.8%) | 39 (8.3%) |
| 30 to 34 Years | 48 (8.7%) | 15 (3.2%) |
| 35 to 39 Years | 22 (4.0%) | 44 (9.4%) |
| 40 to 44 Years | 34 (6.2%) | 30 (6.4%) |
| 45 to 49 Years | 35 (6.4%) | 11 (2.4%) |
| 50 to 54 Years | 53 (9.6%) | 67 (14.3%) |
| 55 to 59 Years | 15 (2.7%) | 46 (9.8%) |
| 60 to 64 Years | 39 (7.1%) | 23 (4.9%) |
| 65 to 69 Years | 28 (5.1%) | 29 (6.2%) |
| 70 to 74 Years | 33 (6.0%) | 31 (6.6%) |
| 75 to 79 Years | 17 (3.1%) | 11 (2.4%) |
| 80 to 84 Years | 6 (1.1%) | 2 (0.4%) |
| 85 Years and over | 5 (0.9%) | 6 (1.3%) |
| Total | 551 (100.0%) | 468 (100.0%) |
Families and Households in Trappe
Median Family Size in Trappe
The median family size in Trappe is 3.20 persons per family, with single male/father families (4 | 1.6%) accounting for the largest median family size of 5.75 persons per family. On the other hand, married-couple families (195 | 76.8%) represent the smallest median family size with 3.14 persons per family.
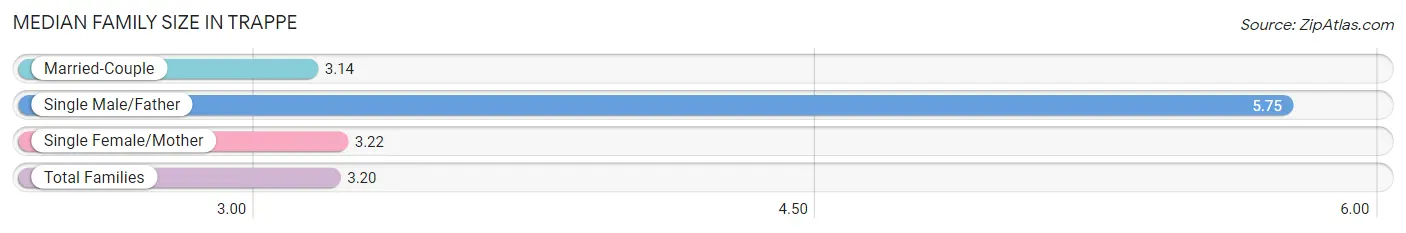
| Family Type | # Families | Family Size |
| Married-Couple | 195 (76.8%) | 3.14 |
| Single Male/Father | 4 (1.6%) | 5.75 |
| Single Female/Mother | 55 (21.6%) | 3.22 |
| Total Families | 254 (100.0%) | 3.20 |
Median Household Size in Trappe
The median household size in Trappe is 2.41 persons per household, with single male/father households (4 | 0.9%) accounting for the largest median household size of 6.75 persons per household. non-family households (169 | 40.0%) represent the smallest median household size with 1.07 persons per household.
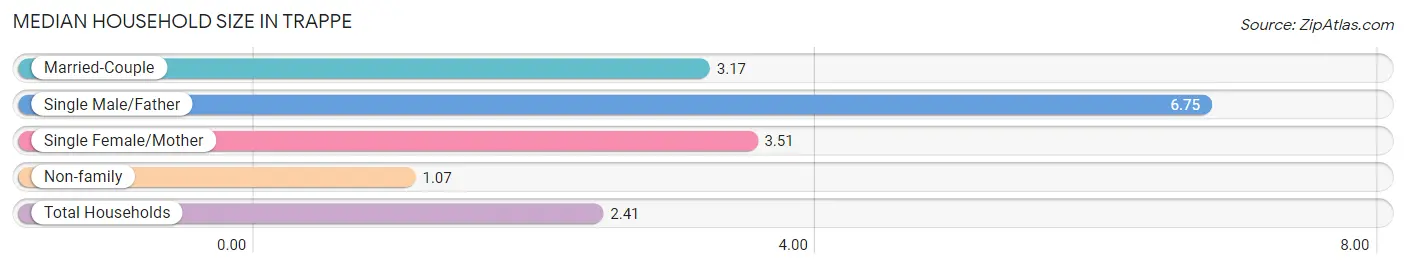
| Household Type | # Households | Household Size |
| Married-Couple | 195 (46.1%) | 3.17 |
| Single Male/Father | 4 (0.9%) | 6.75 |
| Single Female/Mother | 55 (13.0%) | 3.51 |
| Non-family | 169 (40.0%) | 1.07 |
| Total Households | 423 (100.0%) | 2.41 |
Household Size by Marriage Status in Trappe
Out of a total of 423 households in Trappe, 254 (60.1%) are family households, while 169 (40.0%) are nonfamily households. The most numerous type of family households are 2-person households, comprising 133, and the most common type of nonfamily households are 1-person households, comprising 157.
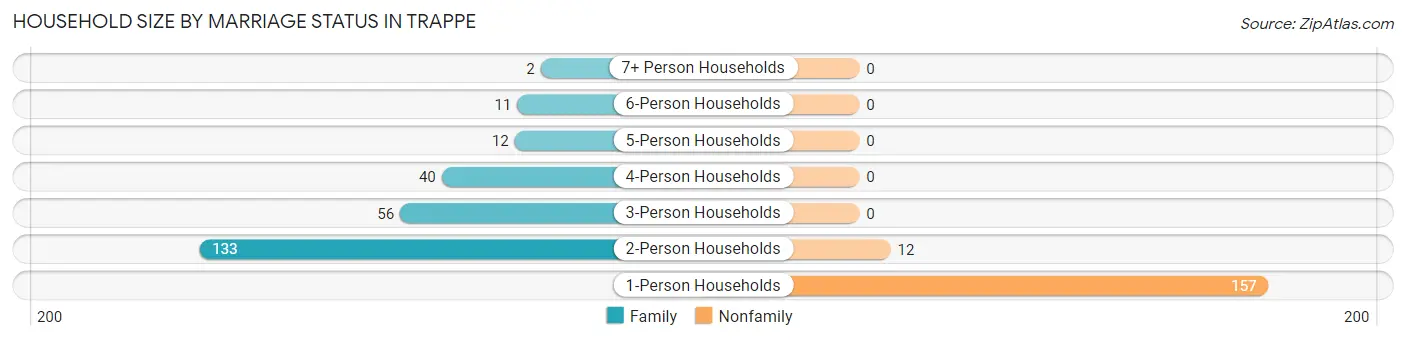
| Household Size | Family Households | Nonfamily Households |
| 1-Person Households | - | 157 (37.1%) |
| 2-Person Households | 133 (31.4%) | 12 (2.8%) |
| 3-Person Households | 56 (13.2%) | 0 (0.0%) |
| 4-Person Households | 40 (9.5%) | 0 (0.0%) |
| 5-Person Households | 12 (2.8%) | 0 (0.0%) |
| 6-Person Households | 11 (2.6%) | 0 (0.0%) |
| 7+ Person Households | 2 (0.5%) | 0 (0.0%) |
| Total | 254 (60.1%) | 169 (40.0%) |
Female Fertility in Trappe
Fertility by Age in Trappe
Average fertility rate in Trappe is 41.0 births per 1,000 women. Women in the age bracket of 20 to 34 years have the highest fertility rate with 77.0 births per 1,000 women. Women in the age bracket of 20 to 34 years acount for 100.0% of all women with births.
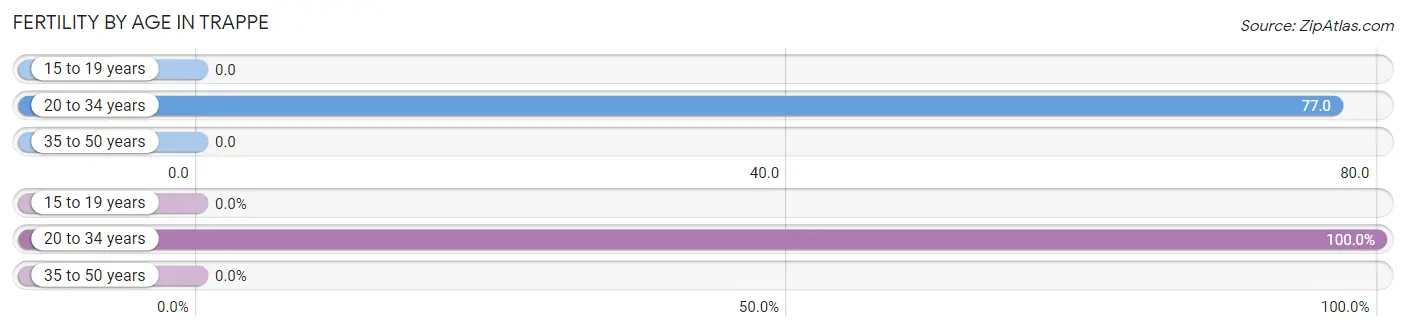
| Age Bracket | Women with Births | Births / 1,000 Women |
| 15 to 19 years | 0 (0.0%) | 0.0 |
| 20 to 34 years | 8 (100.0%) | 77.0 |
| 35 to 50 years | 0 (0.0%) | 0.0 |
| Total | 8 (100.0%) | 41.0 |
Fertility by Age by Marriage Status in Trappe
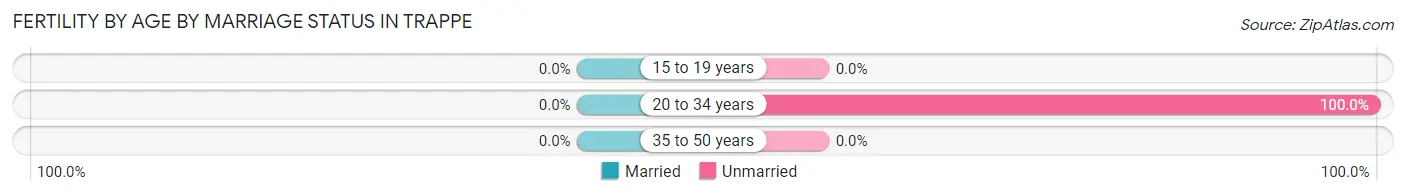
| Age Bracket | Married | Unmarried |
| 15 to 19 years | 0 (0.0%) | 0 (0.0%) |
| 20 to 34 years | 0 (0.0%) | 8 (100.0%) |
| 35 to 50 years | 0 (0.0%) | 0 (0.0%) |
| Total | 0 (0.0%) | 8 (100.0%) |
Fertility by Education in Trappe
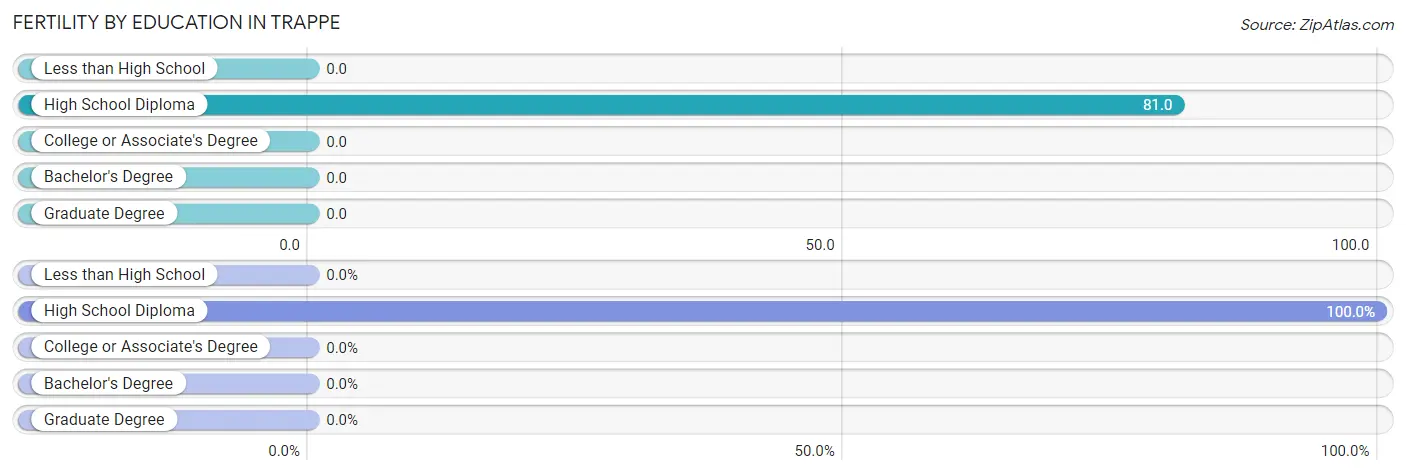
| Educational Attainment | Women with Births | Births / 1,000 Women |
| Less than High School | 0 (0.0%) | 0.0 |
| High School Diploma | 8 (100.0%) | 81.0 |
| College or Associate's Degree | 0 (0.0%) | 0.0 |
| Bachelor's Degree | 0 (0.0%) | 0.0 |
| Graduate Degree | 0 (0.0%) | 0.0 |
| Total | 8 (100.0%) | 41.0 |
Fertility by Education by Marriage Status in Trappe
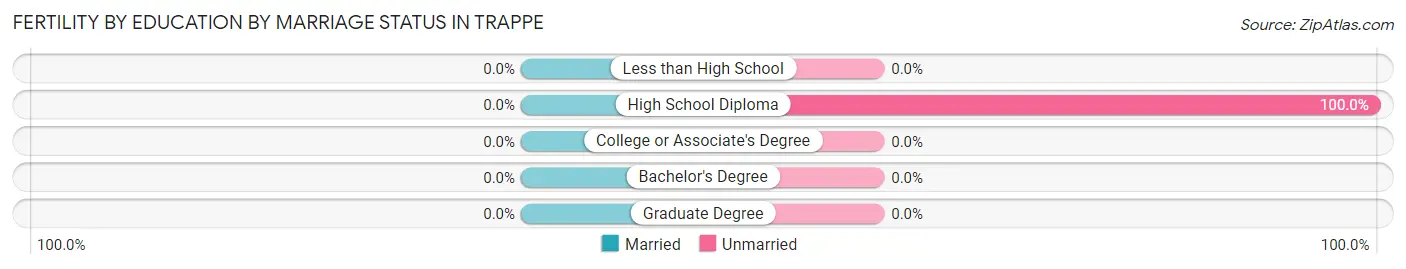
| Educational Attainment | Married | Unmarried |
| Less than High School | 0 (0.0%) | 0 (0.0%) |
| High School Diploma | 0 (0.0%) | 8 (100.0%) |
| College or Associate's Degree | 0 (0.0%) | 0 (0.0%) |
| Bachelor's Degree | 0 (0.0%) | 0 (0.0%) |
| Graduate Degree | 0 (0.0%) | 0 (0.0%) |
| Total | 0 (0.0%) | 8 (100.0%) |
Employment Characteristics in Trappe
Employment by Class of Employer in Trappe
Among the 539 employed individuals in Trappe, private company employees (346 | 64.2%), self-employed (incorporated) (48 | 8.9%), and not-for-profit organizations (42 | 7.8%) make up the most common classes of employment.
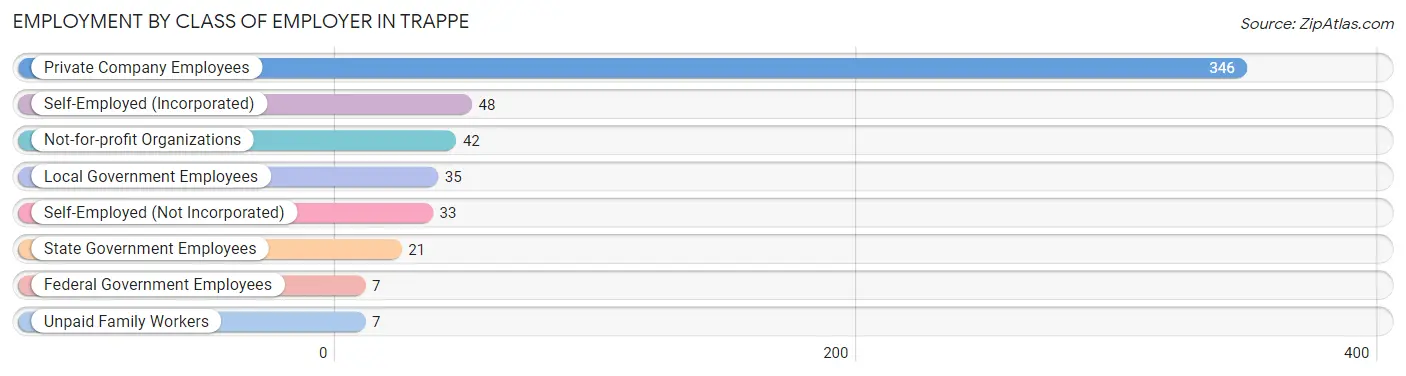
| Employer Class | # Employees | % Employees |
| Private Company Employees | 346 | 64.2% |
| Self-Employed (Incorporated) | 48 | 8.9% |
| Self-Employed (Not Incorporated) | 33 | 6.1% |
| Not-for-profit Organizations | 42 | 7.8% |
| Local Government Employees | 35 | 6.5% |
| State Government Employees | 21 | 3.9% |
| Federal Government Employees | 7 | 1.3% |
| Unpaid Family Workers | 7 | 1.3% |
| Total | 539 | 100.0% |
Employment Status by Age in Trappe
According to the labor force statistics for Trappe, out of the total population over 16 years of age (844), 71.1% or 600 individuals are in the labor force, with 8.8% or 53 of them unemployed. The age group with the highest labor force participation rate is 20 to 24 years, with 100.0% or 95 individuals in the labor force. Within the labor force, the 30 to 34 years age range has the highest percentage of unemployed individuals, with 60.3% or 38 of them being unemployed.
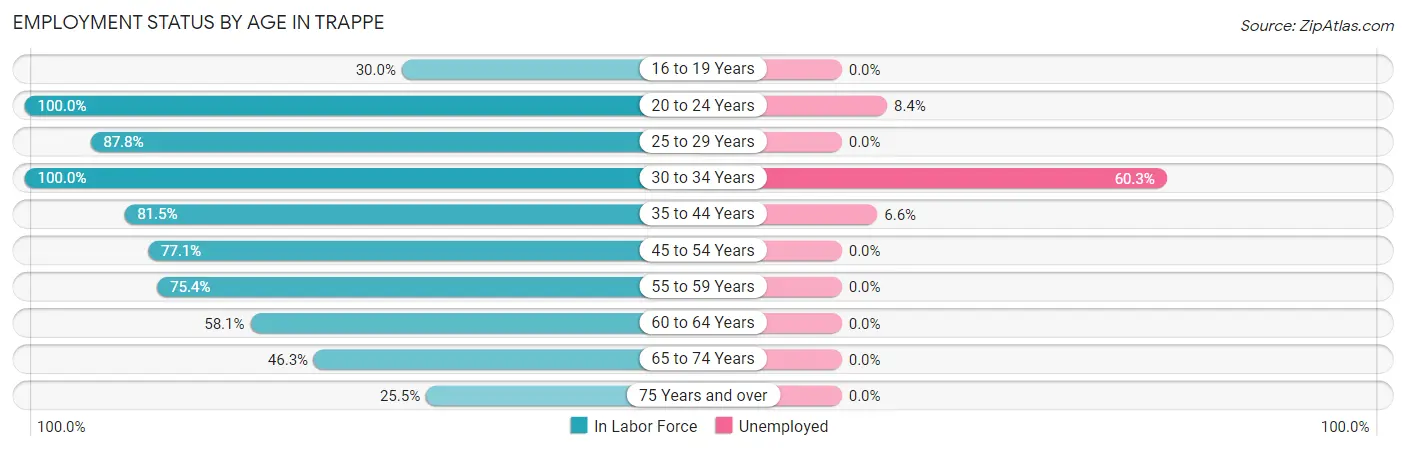
| Age Bracket | In Labor Force | Unemployed |
| 16 to 19 Years | 15 (30.0%) | 0 (0.0%) |
| 20 to 24 Years | 95 (100.0%) | 8 (8.4%) |
| 25 to 29 Years | 43 (87.8%) | 0 (0.0%) |
| 30 to 34 Years | 63 (100.0%) | 38 (60.3%) |
| 35 to 44 Years | 106 (81.5%) | 7 (6.6%) |
| 45 to 54 Years | 128 (77.1%) | 0 (0.0%) |
| 55 to 59 Years | 46 (75.4%) | 0 (0.0%) |
| 60 to 64 Years | 36 (58.1%) | 0 (0.0%) |
| 65 to 74 Years | 56 (46.3%) | 0 (0.0%) |
| 75 Years and over | 12 (25.5%) | 0 (0.0%) |
| Total | 600 (71.1%) | 53 (8.8%) |
Employment Status by Educational Attainment in Trappe
According to labor force statistics for Trappe, 79.5% of individuals (422) out of the total population between 25 and 64 years of age (531) are in the labor force, with 10.7% or 45 of them being unemployed. The group with the highest labor force participation rate are those with the educational attainment of bachelor's degree or higher, with 90.5% or 57 individuals in the labor force. Within the labor force, individuals with high school diploma education have the highest percentage of unemployment, with 20.5% or 42 of them being unemployed.
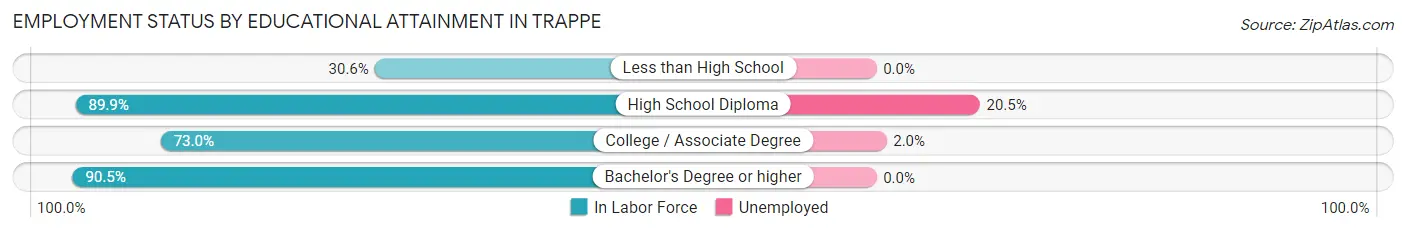
| Educational Attainment | In Labor Force | Unemployed |
| Less than High School | 11 (30.6%) | 0 (0.0%) |
| High School Diploma | 205 (89.9%) | 47 (20.5%) |
| College / Associate Degree | 149 (73.0%) | 4 (2.0%) |
| Bachelor's Degree or higher | 57 (90.5%) | 0 (0.0%) |
| Total | 422 (79.5%) | 57 (10.7%) |
Employment Occupations by Sex in Trappe
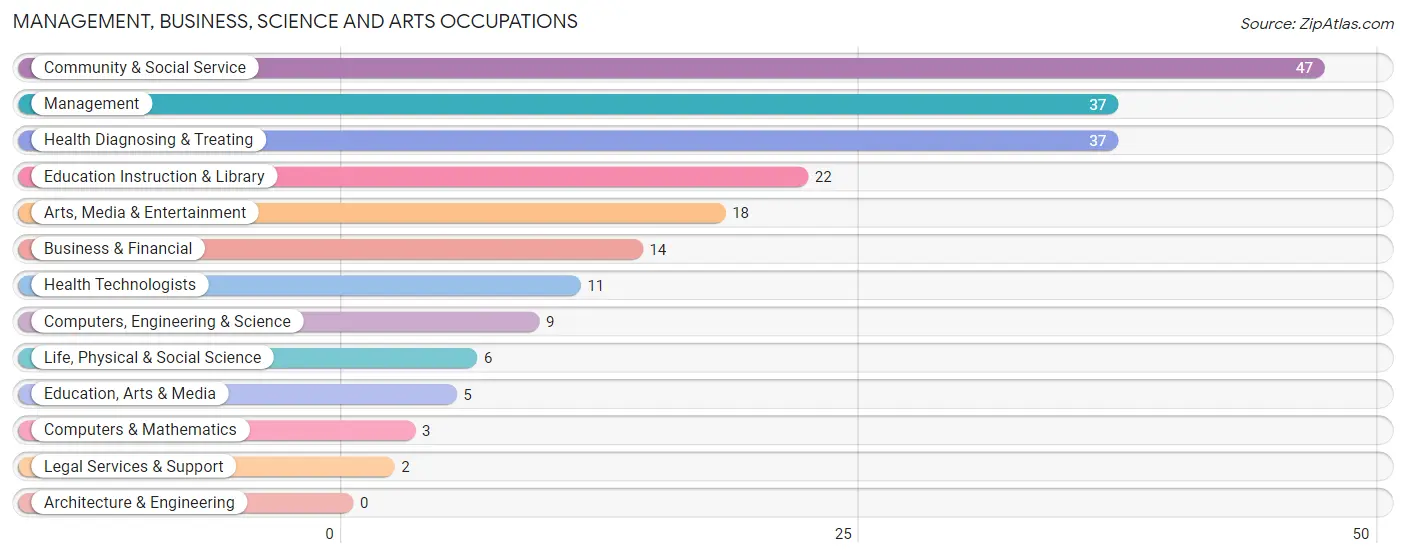
Management, Business, Science and Arts Occupations
The most common Management, Business, Science and Arts occupations in Trappe are Community & Social Service (47 | 8.6%), Management (37 | 6.8%), Health Diagnosing & Treating (37 | 6.8%), Education Instruction & Library (22 | 4.0%), and Arts, Media & Entertainment (18 | 3.3%).
Management, Business, Science and Arts Occupations by Sex
Within the Management, Business, Science and Arts occupations in Trappe, the most male-oriented occupations are Computers, Engineering & Science (100.0%), Computers & Mathematics (100.0%), and Life, Physical & Social Science (100.0%), while the most female-oriented occupations are Education, Arts & Media (100.0%), Legal Services & Support (100.0%), and Arts, Media & Entertainment (100.0%).
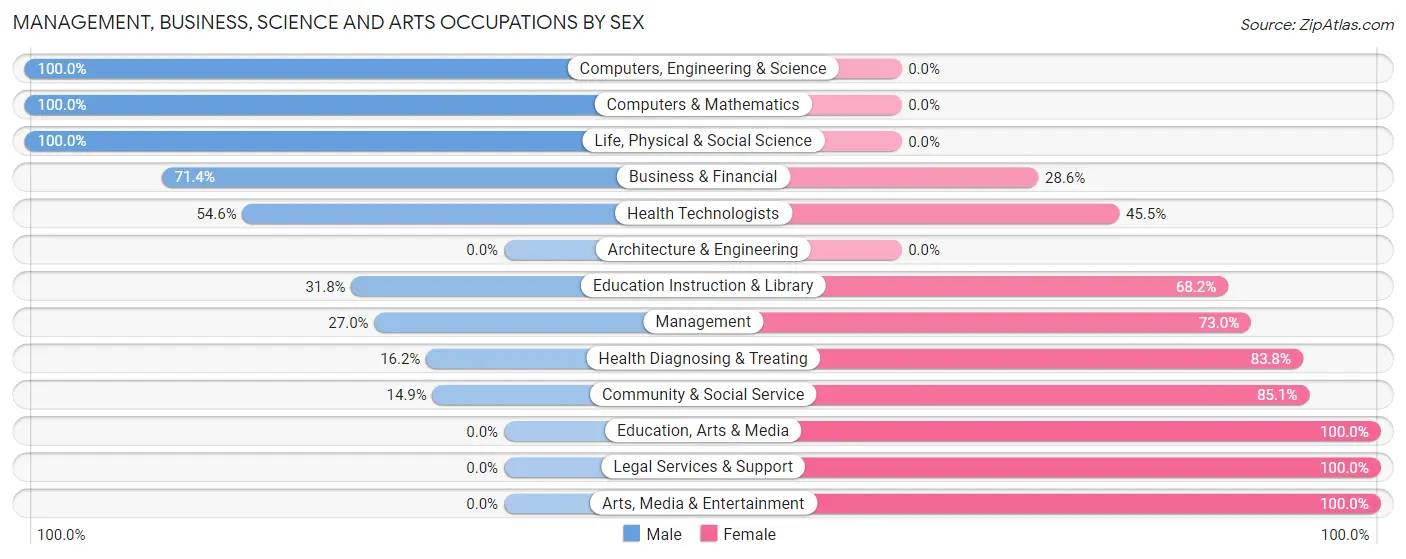
| Occupation | Male | Female |
| Management | 10 (27.0%) | 27 (73.0%) |
| Business & Financial | 10 (71.4%) | 4 (28.6%) |
| Computers, Engineering & Science | 9 (100.0%) | 0 (0.0%) |
| Computers & Mathematics | 3 (100.0%) | 0 (0.0%) |
| Architecture & Engineering | 0 (0.0%) | 0 (0.0%) |
| Life, Physical & Social Science | 6 (100.0%) | 0 (0.0%) |
| Community & Social Service | 7 (14.9%) | 40 (85.1%) |
| Education, Arts & Media | 0 (0.0%) | 5 (100.0%) |
| Legal Services & Support | 0 (0.0%) | 2 (100.0%) |
| Education Instruction & Library | 7 (31.8%) | 15 (68.2%) |
| Arts, Media & Entertainment | 0 (0.0%) | 18 (100.0%) |
| Health Diagnosing & Treating | 6 (16.2%) | 31 (83.8%) |
| Health Technologists | 6 (54.5%) | 5 (45.5%) |
| Total (Category) | 42 (29.2%) | 102 (70.8%) |
| Total (Overall) | 283 (51.7%) | 264 (48.3%) |
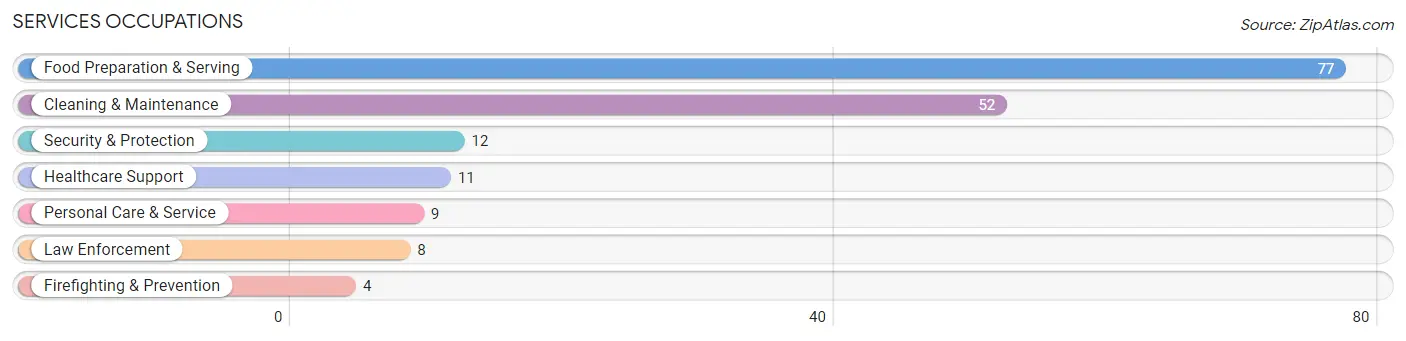
Services Occupations
The most common Services occupations in Trappe are Food Preparation & Serving (77 | 14.1%), Cleaning & Maintenance (52 | 9.5%), Security & Protection (12 | 2.2%), Healthcare Support (11 | 2.0%), and Personal Care & Service (9 | 1.7%).
Services Occupations by Sex
Within the Services occupations in Trappe, the most male-oriented occupations are Security & Protection (100.0%), Firefighting & Prevention (100.0%), and Law Enforcement (100.0%), while the most female-oriented occupations are Healthcare Support (100.0%), Personal Care & Service (100.0%), and Cleaning & Maintenance (40.4%).
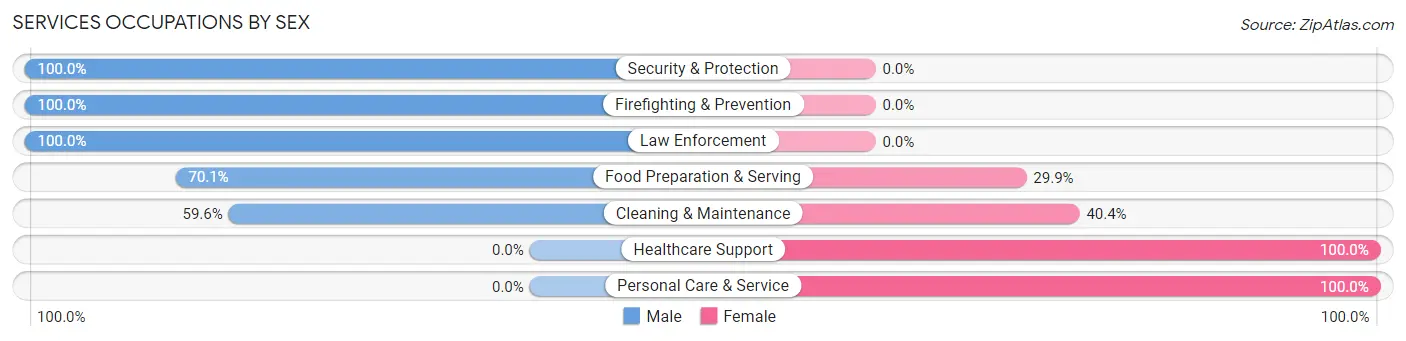
| Occupation | Male | Female |
| Healthcare Support | 0 (0.0%) | 11 (100.0%) |
| Security & Protection | 12 (100.0%) | 0 (0.0%) |
| Firefighting & Prevention | 4 (100.0%) | 0 (0.0%) |
| Law Enforcement | 8 (100.0%) | 0 (0.0%) |
| Food Preparation & Serving | 54 (70.1%) | 23 (29.9%) |
| Cleaning & Maintenance | 31 (59.6%) | 21 (40.4%) |
| Personal Care & Service | 0 (0.0%) | 9 (100.0%) |
| Total (Category) | 97 (60.3%) | 64 (39.8%) |
| Total (Overall) | 283 (51.7%) | 264 (48.3%) |
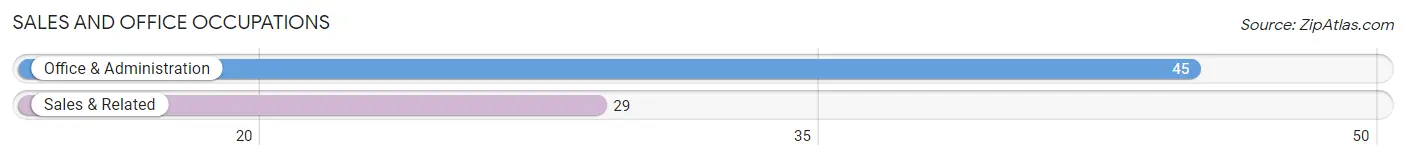
Sales and Office Occupations
The most common Sales and Office occupations in Trappe are Office & Administration (45 | 8.2%), and Sales & Related (29 | 5.3%).
Sales and Office Occupations by Sex
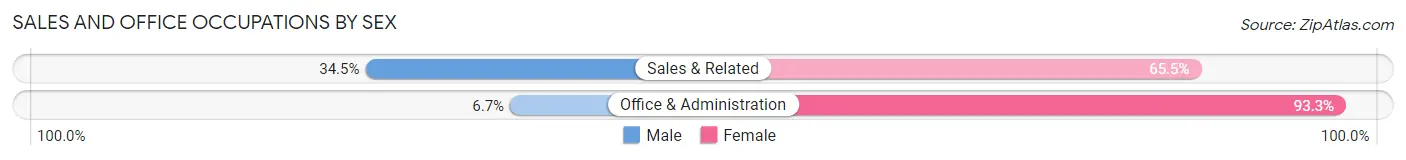
| Occupation | Male | Female |
| Sales & Related | 10 (34.5%) | 19 (65.5%) |
| Office & Administration | 3 (6.7%) | 42 (93.3%) |
| Total (Category) | 13 (17.6%) | 61 (82.4%) |
| Total (Overall) | 283 (51.7%) | 264 (48.3%) |
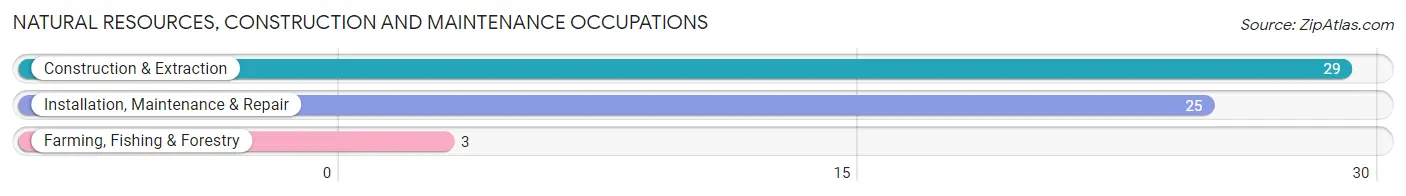
Natural Resources, Construction and Maintenance Occupations
The most common Natural Resources, Construction and Maintenance occupations in Trappe are Construction & Extraction (29 | 5.3%), Installation, Maintenance & Repair (25 | 4.6%), and Farming, Fishing & Forestry (3 | 0.5%).
Natural Resources, Construction and Maintenance Occupations by Sex
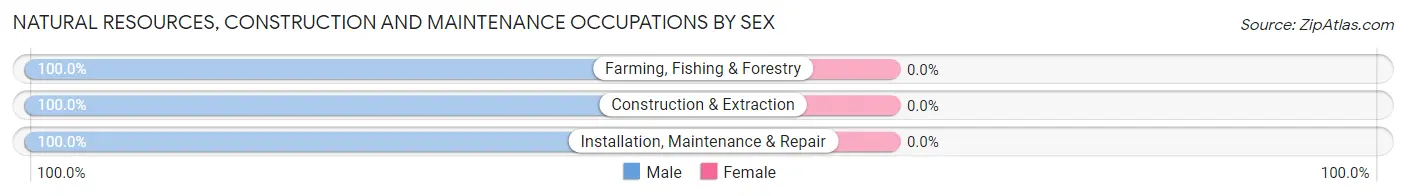
| Occupation | Male | Female |
| Farming, Fishing & Forestry | 3 (100.0%) | 0 (0.0%) |
| Construction & Extraction | 29 (100.0%) | 0 (0.0%) |
| Installation, Maintenance & Repair | 25 (100.0%) | 0 (0.0%) |
| Total (Category) | 57 (100.0%) | 0 (0.0%) |
| Total (Overall) | 283 (51.7%) | 264 (48.3%) |
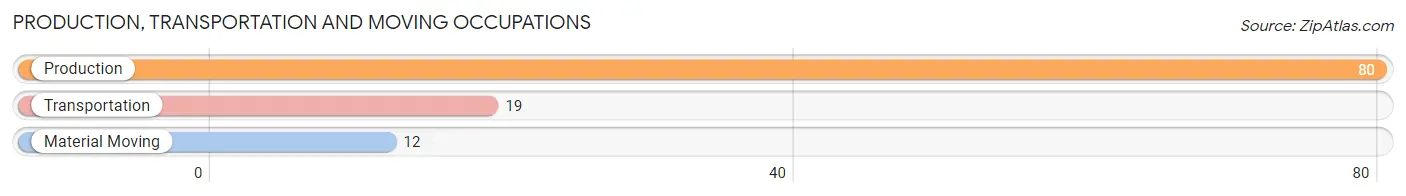
Production, Transportation and Moving Occupations
The most common Production, Transportation and Moving occupations in Trappe are Production (80 | 14.6%), Transportation (19 | 3.5%), and Material Moving (12 | 2.2%).
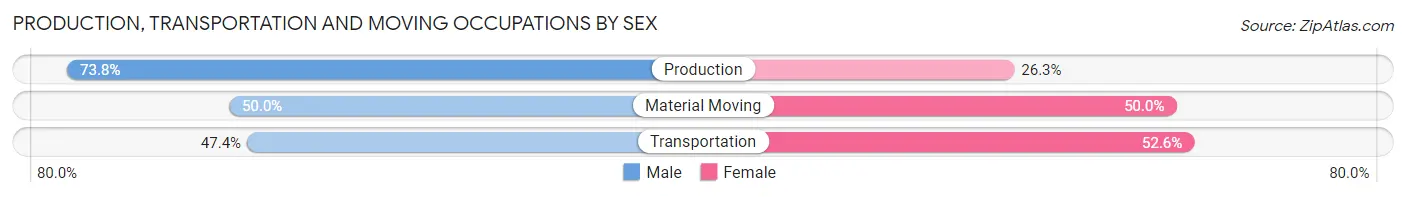
Production, Transportation and Moving Occupations by Sex
| Occupation | Male | Female |
| Production | 59 (73.8%) | 21 (26.3%) |
| Transportation | 9 (47.4%) | 10 (52.6%) |
| Material Moving | 6 (50.0%) | 6 (50.0%) |
| Total (Category) | 74 (66.7%) | 37 (33.3%) |
| Total (Overall) | 283 (51.7%) | 264 (48.3%) |
Employment Industries by Sex in Trappe
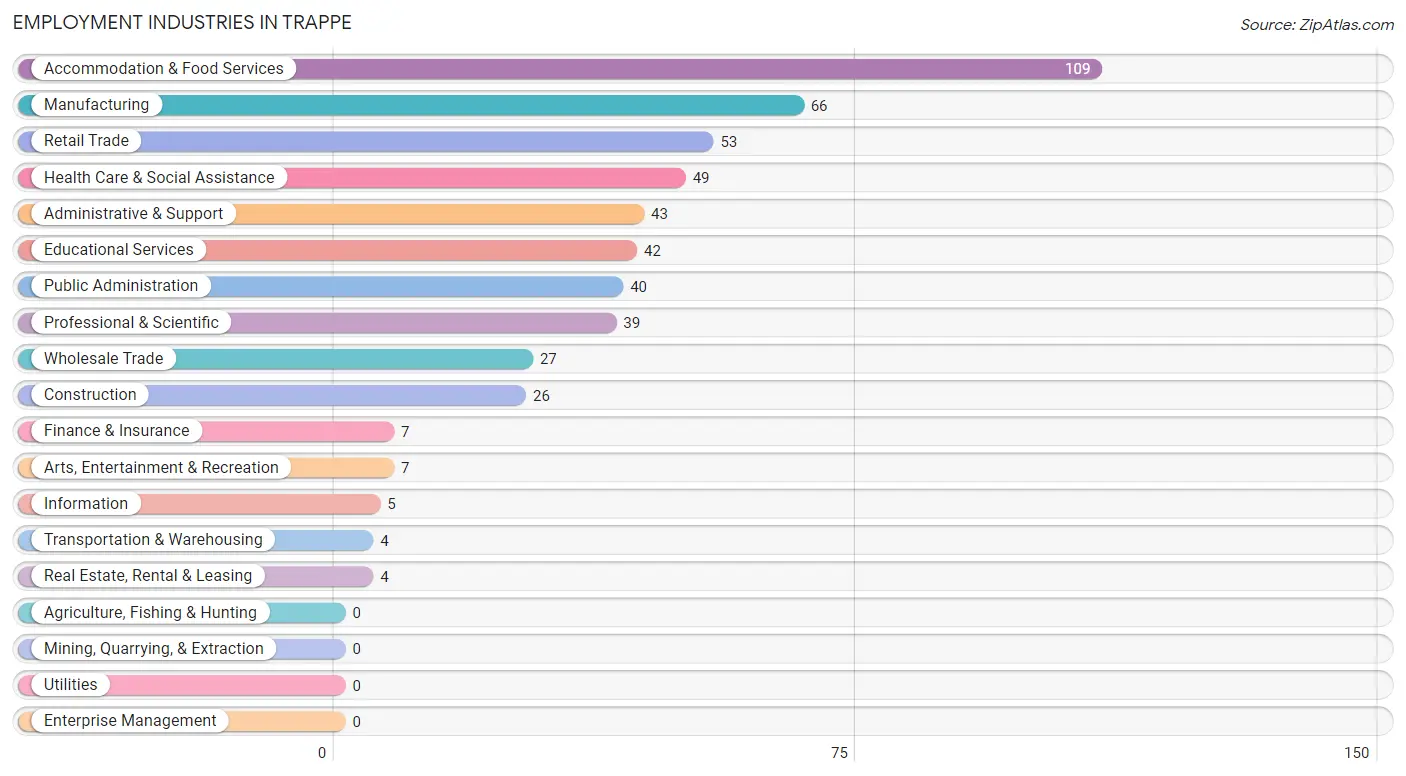
Employment Industries in Trappe
The major employment industries in Trappe include Accommodation & Food Services (109 | 19.9%), Manufacturing (66 | 12.1%), Retail Trade (53 | 9.7%), Health Care & Social Assistance (49 | 9.0%), and Administrative & Support (43 | 7.9%).
Employment Industries by Sex in Trappe
The Trappe industries that see more men than women are Construction (100.0%), Information (100.0%), and Real Estate, Rental & Leasing (100.0%), whereas the industries that tend to have a higher number of women are Transportation & Warehousing (100.0%), Finance & Insurance (100.0%), and Health Care & Social Assistance (85.7%).
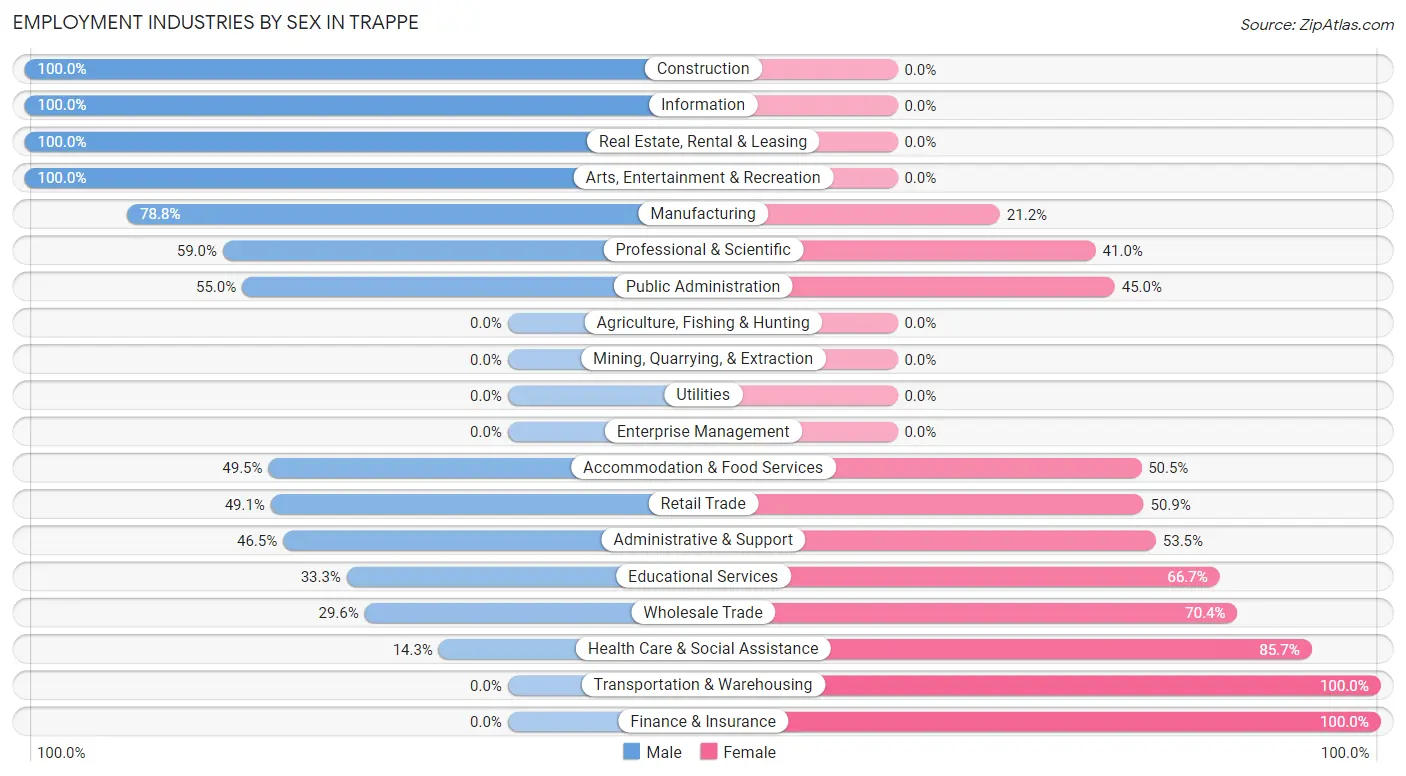
| Industry | Male | Female |
| Agriculture, Fishing & Hunting | 0 (0.0%) | 0 (0.0%) |
| Mining, Quarrying, & Extraction | 0 (0.0%) | 0 (0.0%) |
| Construction | 26 (100.0%) | 0 (0.0%) |
| Manufacturing | 52 (78.8%) | 14 (21.2%) |
| Wholesale Trade | 8 (29.6%) | 19 (70.4%) |
| Retail Trade | 26 (49.1%) | 27 (50.9%) |
| Transportation & Warehousing | 0 (0.0%) | 4 (100.0%) |
| Utilities | 0 (0.0%) | 0 (0.0%) |
| Information | 5 (100.0%) | 0 (0.0%) |
| Finance & Insurance | 0 (0.0%) | 7 (100.0%) |
| Real Estate, Rental & Leasing | 4 (100.0%) | 0 (0.0%) |
| Professional & Scientific | 23 (59.0%) | 16 (41.0%) |
| Enterprise Management | 0 (0.0%) | 0 (0.0%) |
| Administrative & Support | 20 (46.5%) | 23 (53.5%) |
| Educational Services | 14 (33.3%) | 28 (66.7%) |
| Health Care & Social Assistance | 7 (14.3%) | 42 (85.7%) |
| Arts, Entertainment & Recreation | 7 (100.0%) | 0 (0.0%) |
| Accommodation & Food Services | 54 (49.5%) | 55 (50.5%) |
| Public Administration | 22 (55.0%) | 18 (45.0%) |
| Total | 283 (51.7%) | 264 (48.3%) |
Education in Trappe
School Enrollment in Trappe
The most common levels of schooling among the 206 students in Trappe are high school (89 | 43.2%), elementary school (61 | 29.6%), and middle school (26 | 12.6%).
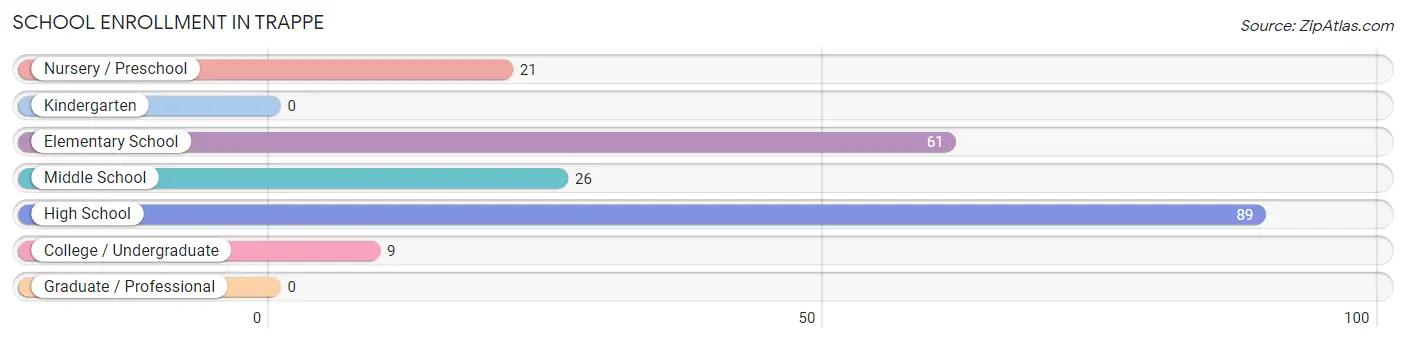
| School Level | # Students | % Students |
| Nursery / Preschool | 21 | 10.2% |
| Kindergarten | 0 | 0.0% |
| Elementary School | 61 | 29.6% |
| Middle School | 26 | 12.6% |
| High School | 89 | 43.2% |
| College / Undergraduate | 9 | 4.4% |
| Graduate / Professional | 0 | 0.0% |
| Total | 206 | 100.0% |
School Enrollment by Age by Funding Source in Trappe
Out of a total of 206 students who are enrolled in schools in Trappe, 17 (8.3%) attend a private institution, while the remaining 189 (91.7%) are enrolled in public schools. The age group of 20 to 24 year olds has the highest likelihood of being enrolled in private schools, with 8 (100.0% in the age bracket) enrolled. Conversely, the age group of 15 to 17 year olds has the lowest likelihood of being enrolled in a private school, with 78 (100.0% in the age bracket) attending a public institution.
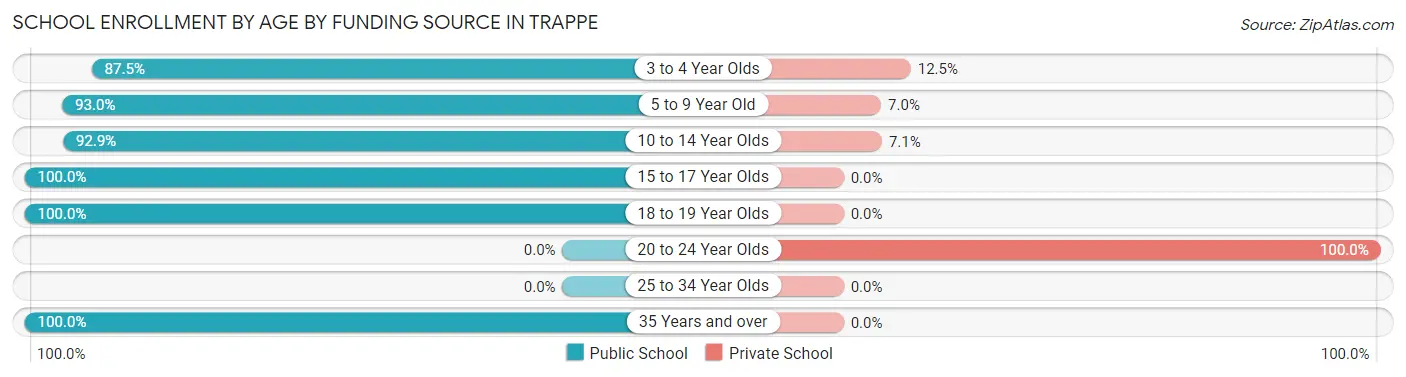
| Age Bracket | Public School | Private School |
| 3 to 4 Year Olds | 14 (87.5%) | 2 (12.5%) |
| 5 to 9 Year Old | 40 (93.0%) | 3 (7.0%) |
| 10 to 14 Year Olds | 52 (92.9%) | 4 (7.1%) |
| 15 to 17 Year Olds | 78 (100.0%) | 0 (0.0%) |
| 18 to 19 Year Olds | 4 (100.0%) | 0 (0.0%) |
| 20 to 24 Year Olds | 0 (0.0%) | 8 (100.0%) |
| 25 to 34 Year Olds | 0 (0.0%) | 0 (0.0%) |
| 35 Years and over | 1 (100.0%) | 0 (0.0%) |
| Total | 189 (91.7%) | 17 (8.3%) |
Educational Attainment by Field of Study in Trappe
Education (32 | 26.5%), engineering (13 | 10.7%), science & technology (12 | 9.9%), arts & humanities (11 | 9.1%), and bio, nature & agricultural (10 | 8.3%) are the most common fields of study among 121 individuals in Trappe who have obtained a bachelor's degree or higher.
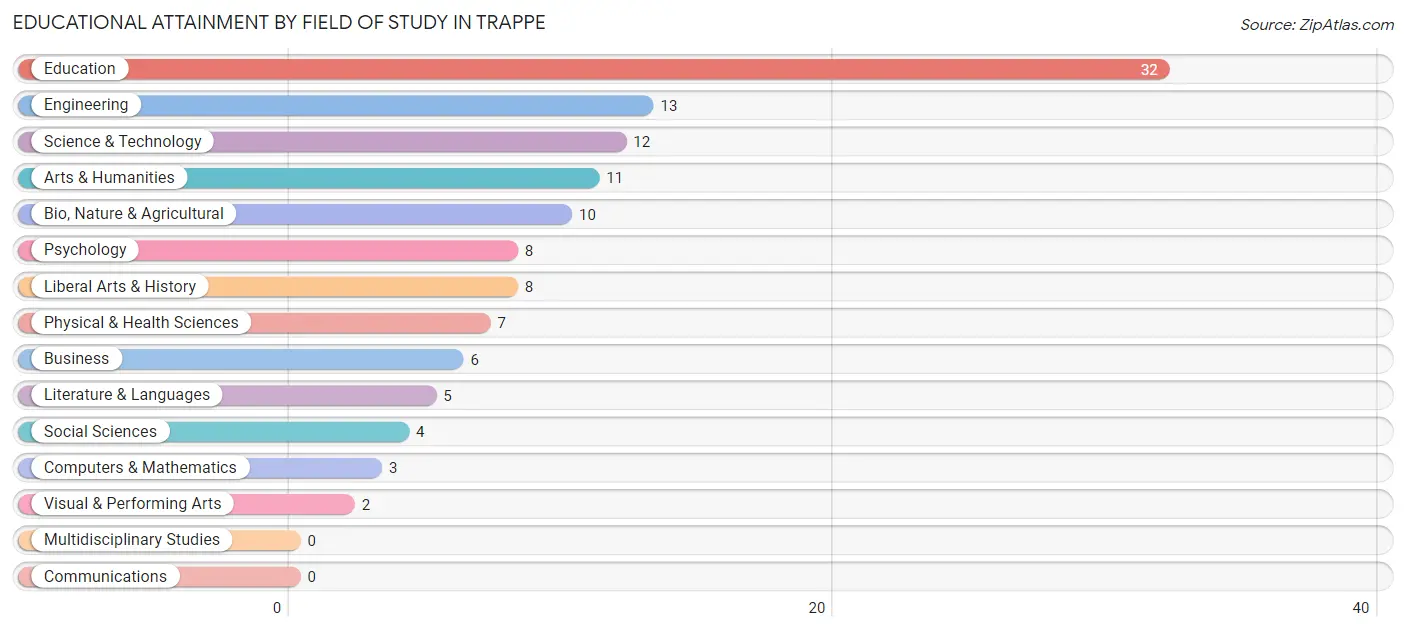
| Field of Study | # Graduates | % Graduates |
| Computers & Mathematics | 3 | 2.5% |
| Bio, Nature & Agricultural | 10 | 8.3% |
| Physical & Health Sciences | 7 | 5.8% |
| Psychology | 8 | 6.6% |
| Social Sciences | 4 | 3.3% |
| Engineering | 13 | 10.7% |
| Multidisciplinary Studies | 0 | 0.0% |
| Science & Technology | 12 | 9.9% |
| Business | 6 | 5.0% |
| Education | 32 | 26.5% |
| Literature & Languages | 5 | 4.1% |
| Liberal Arts & History | 8 | 6.6% |
| Visual & Performing Arts | 2 | 1.7% |
| Communications | 0 | 0.0% |
| Arts & Humanities | 11 | 9.1% |
| Total | 121 | 100.0% |
Transportation & Commute in Trappe
Vehicle Availability by Sex in Trappe
The most prevalent vehicle ownership categories in Trappe are males with 2 vehicles (153, accounting for 55.6%) and females with 2 vehicles (145, making up 58.0%).
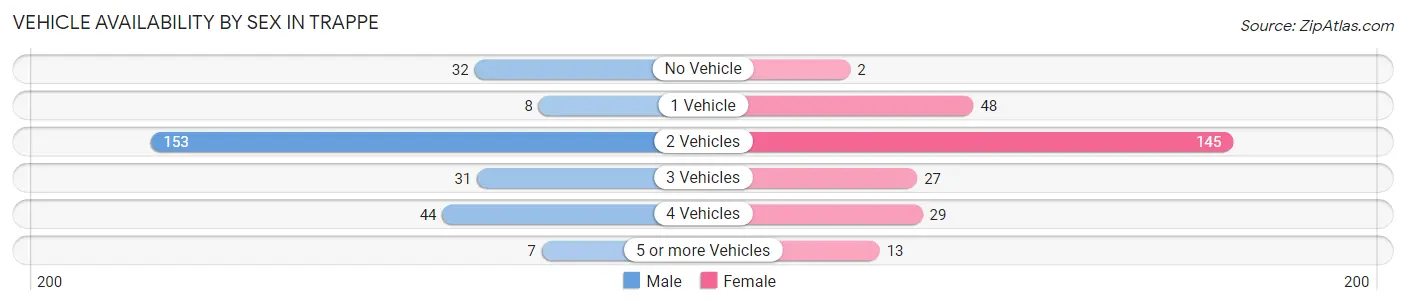
| Vehicles Available | Male | Female |
| No Vehicle | 32 (11.6%) | 2 (0.8%) |
| 1 Vehicle | 8 (2.9%) | 48 (18.2%) |
| 2 Vehicles | 153 (55.6%) | 145 (54.9%) |
| 3 Vehicles | 31 (11.3%) | 27 (10.2%) |
| 4 Vehicles | 44 (16.0%) | 29 (11.0%) |
| 5 or more Vehicles | 7 (2.5%) | 13 (4.9%) |
| Total | 275 (100.0%) | 264 (100.0%) |
Commute Time in Trappe
The most frequently occuring commute durations in Trappe are 15 to 19 minutes (158 commuters, 31.5%), 10 to 14 minutes (82 commuters, 16.3%), and 30 to 34 minutes (48 commuters, 9.6%).
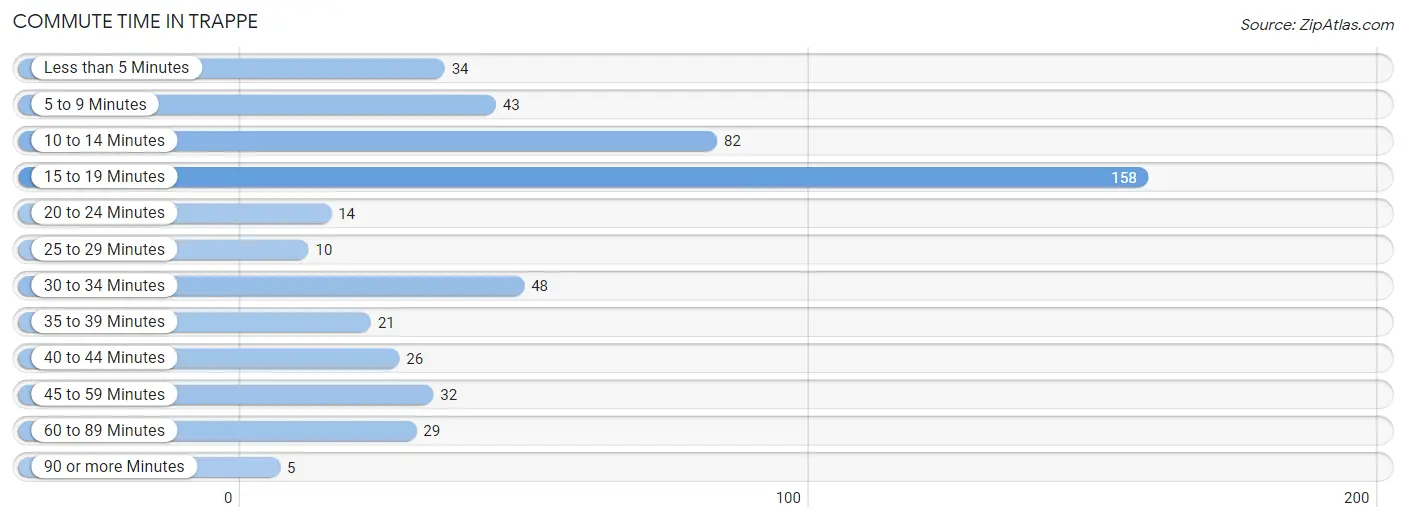
| Commute Time | # Commuters | % Commuters |
| Less than 5 Minutes | 34 | 6.8% |
| 5 to 9 Minutes | 43 | 8.6% |
| 10 to 14 Minutes | 82 | 16.3% |
| 15 to 19 Minutes | 158 | 31.5% |
| 20 to 24 Minutes | 14 | 2.8% |
| 25 to 29 Minutes | 10 | 2.0% |
| 30 to 34 Minutes | 48 | 9.6% |
| 35 to 39 Minutes | 21 | 4.2% |
| 40 to 44 Minutes | 26 | 5.2% |
| 45 to 59 Minutes | 32 | 6.4% |
| 60 to 89 Minutes | 29 | 5.8% |
| 90 or more Minutes | 5 | 1.0% |
Commute Time by Sex in Trappe
The most common commute times in Trappe are 10 to 14 minutes (45 commuters, 17.2%) for males and 15 to 19 minutes (113 commuters, 46.9%) for females.
| Commute Time | Male | Female |
| Less than 5 Minutes | 21 (8.1%) | 13 (5.4%) |
| 5 to 9 Minutes | 33 (12.6%) | 10 (4.2%) |
| 10 to 14 Minutes | 45 (17.2%) | 37 (15.3%) |
| 15 to 19 Minutes | 45 (17.2%) | 113 (46.9%) |
| 20 to 24 Minutes | 9 (3.5%) | 5 (2.1%) |
| 25 to 29 Minutes | 4 (1.5%) | 6 (2.5%) |
| 30 to 34 Minutes | 13 (5.0%) | 35 (14.5%) |
| 35 to 39 Minutes | 6 (2.3%) | 15 (6.2%) |
| 40 to 44 Minutes | 26 (10.0%) | 0 (0.0%) |
| 45 to 59 Minutes | 26 (10.0%) | 6 (2.5%) |
| 60 to 89 Minutes | 29 (11.1%) | 0 (0.0%) |
| 90 or more Minutes | 4 (1.5%) | 1 (0.4%) |
Time of Departure to Work by Sex in Trappe
The most frequent times of departure to work in Trappe are 6:00 AM to 6:29 AM (62, 23.7%) for males and 4:00 PM to 11:59 PM (62, 25.7%) for females.
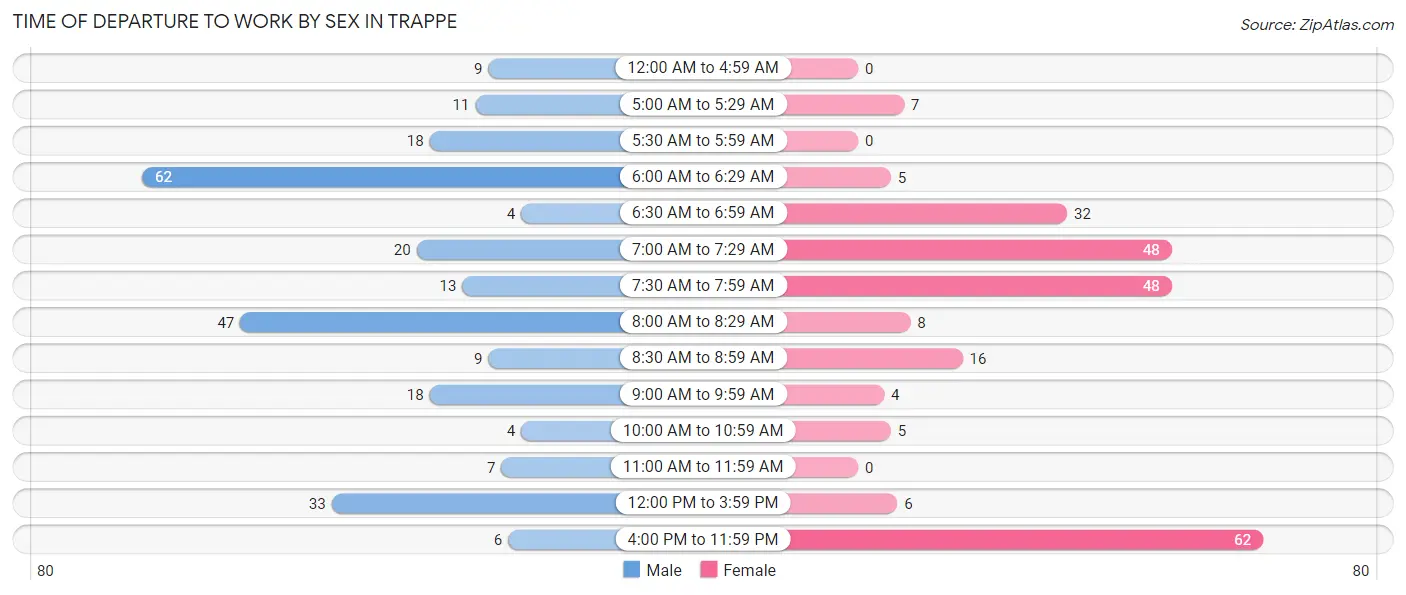
| Time of Departure | Male | Female |
| 12:00 AM to 4:59 AM | 9 (3.5%) | 0 (0.0%) |
| 5:00 AM to 5:29 AM | 11 (4.2%) | 7 (2.9%) |
| 5:30 AM to 5:59 AM | 18 (6.9%) | 0 (0.0%) |
| 6:00 AM to 6:29 AM | 62 (23.7%) | 5 (2.1%) |
| 6:30 AM to 6:59 AM | 4 (1.5%) | 32 (13.3%) |
| 7:00 AM to 7:29 AM | 20 (7.7%) | 48 (19.9%) |
| 7:30 AM to 7:59 AM | 13 (5.0%) | 48 (19.9%) |
| 8:00 AM to 8:29 AM | 47 (18.0%) | 8 (3.3%) |
| 8:30 AM to 8:59 AM | 9 (3.5%) | 16 (6.6%) |
| 9:00 AM to 9:59 AM | 18 (6.9%) | 4 (1.7%) |
| 10:00 AM to 10:59 AM | 4 (1.5%) | 5 (2.1%) |
| 11:00 AM to 11:59 AM | 7 (2.7%) | 0 (0.0%) |
| 12:00 PM to 3:59 PM | 33 (12.6%) | 6 (2.5%) |
| 4:00 PM to 11:59 PM | 6 (2.3%) | 62 (25.7%) |
| Total | 261 (100.0%) | 241 (100.0%) |
Housing Occupancy in Trappe
Occupancy by Ownership in Trappe
Of the total 423 dwellings in Trappe, owner-occupied units account for 290 (68.6%), while renter-occupied units make up 133 (31.4%).
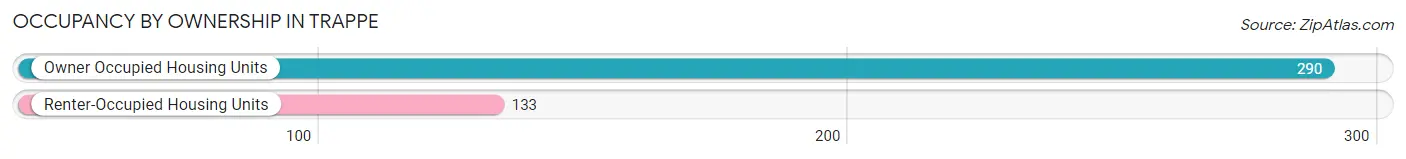
| Occupancy | # Housing Units | % Housing Units |
| Owner Occupied Housing Units | 290 | 68.6% |
| Renter-Occupied Housing Units | 133 | 31.4% |
| Total Occupied Housing Units | 423 | 100.0% |
Occupancy by Household Size in Trappe
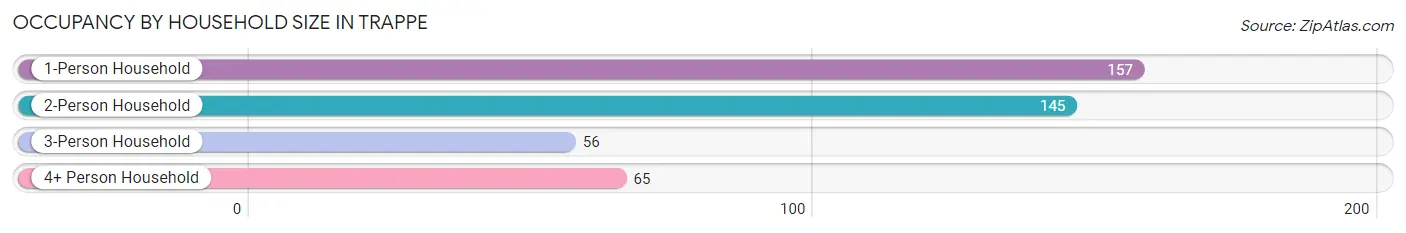
| Household Size | # Housing Units | % Housing Units |
| 1-Person Household | 157 | 37.1% |
| 2-Person Household | 145 | 34.3% |
| 3-Person Household | 56 | 13.2% |
| 4+ Person Household | 65 | 15.4% |
| Total Housing Units | 423 | 100.0% |
Occupancy by Ownership by Household Size in Trappe
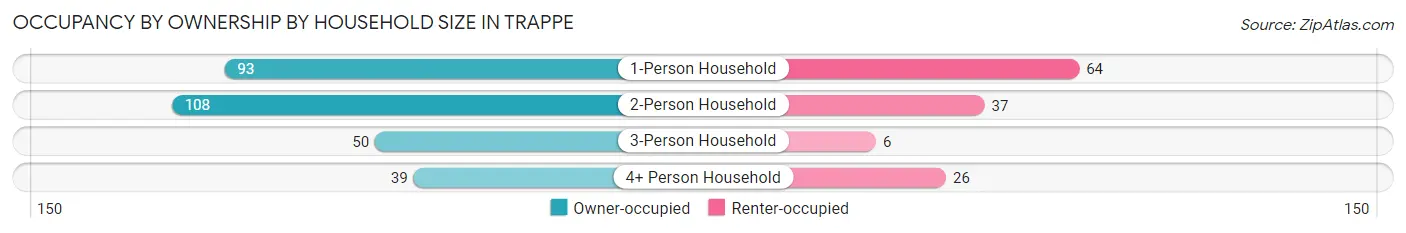
| Household Size | Owner-occupied | Renter-occupied |
| 1-Person Household | 93 (59.2%) | 64 (40.8%) |
| 2-Person Household | 108 (74.5%) | 37 (25.5%) |
| 3-Person Household | 50 (89.3%) | 6 (10.7%) |
| 4+ Person Household | 39 (60.0%) | 26 (40.0%) |
| Total Housing Units | 290 (68.6%) | 133 (31.4%) |
Occupancy by Educational Attainment in Trappe
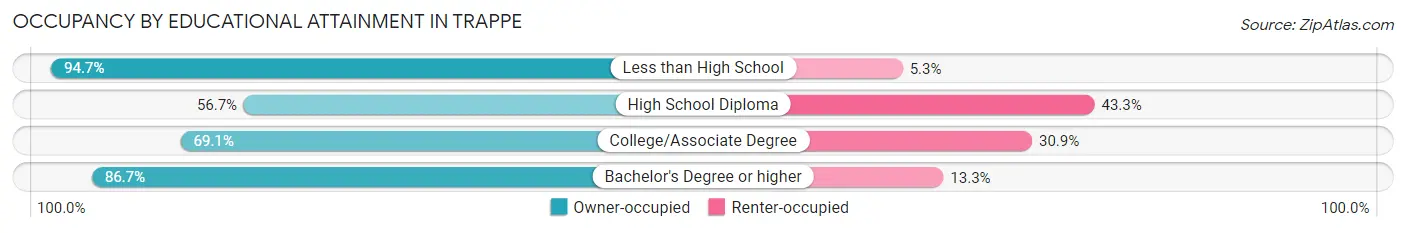
| Household Size | Owner-occupied | Renter-occupied |
| Less than High School | 18 (94.7%) | 1 (5.3%) |
| High School Diploma | 93 (56.7%) | 71 (43.3%) |
| College/Associate Degree | 114 (69.1%) | 51 (30.9%) |
| Bachelor's Degree or higher | 65 (86.7%) | 10 (13.3%) |
Occupancy by Age of Householder in Trappe
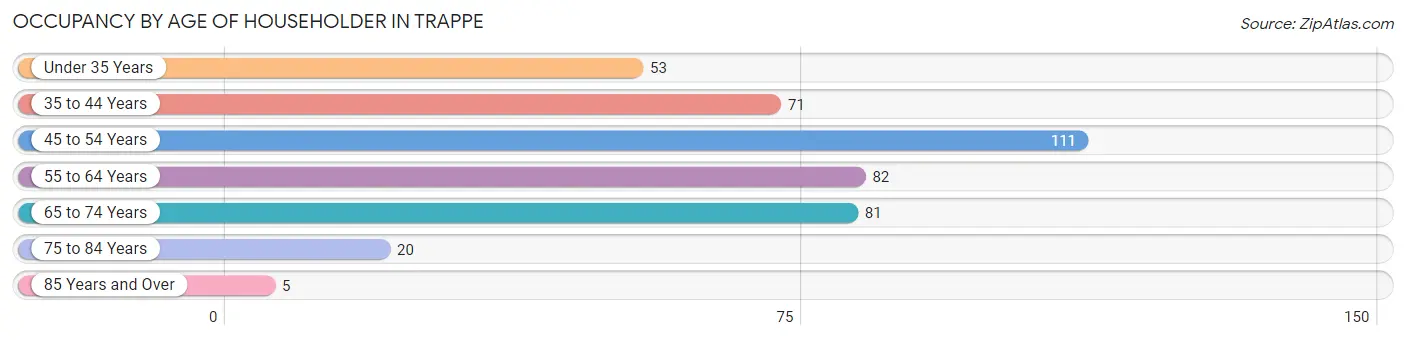
| Age Bracket | # Households | % Households |
| Under 35 Years | 53 | 12.5% |
| 35 to 44 Years | 71 | 16.8% |
| 45 to 54 Years | 111 | 26.2% |
| 55 to 64 Years | 82 | 19.4% |
| 65 to 74 Years | 81 | 19.2% |
| 75 to 84 Years | 20 | 4.7% |
| 85 Years and Over | 5 | 1.2% |
| Total | 423 | 100.0% |
Housing Finances in Trappe
Median Income by Occupancy in Trappe
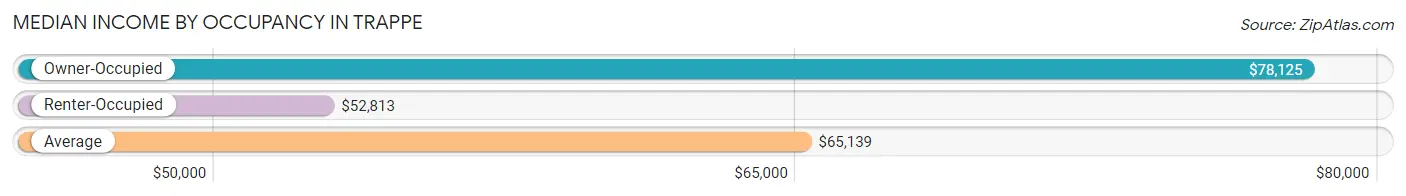
| Occupancy Type | # Households | Median Income |
| Owner-Occupied | 290 (68.6%) | $78,125 |
| Renter-Occupied | 133 (31.4%) | $52,813 |
| Average | 423 (100.0%) | $65,139 |
Occupancy by Householder Income Bracket in Trappe
| Income Bracket | Owner-occupied | Renter-occupied |
| Less than $5,000 | 3 (1.0%) | 1 (0.7%) |
| $5,000 to $9,999 | 0 (0.0%) | 0 (0.0%) |
| $10,000 to $14,999 | 11 (3.8%) | 4 (3.0%) |
| $15,000 to $19,999 | 13 (4.5%) | 0 (0.0%) |
| $20,000 to $24,999 | 3 (1.0%) | 3 (2.3%) |
| $25,000 to $34,999 | 22 (7.6%) | 11 (8.3%) |
| $35,000 to $49,999 | 39 (13.5%) | 46 (34.6%) |
| $50,000 to $74,999 | 52 (17.9%) | 46 (34.6%) |
| $75,000 to $99,999 | 84 (29.0%) | 4 (3.0%) |
| $100,000 to $149,999 | 41 (14.1%) | 9 (6.8%) |
| $150,000 or more | 22 (7.6%) | 9 (6.8%) |
| Total | 290 (100.0%) | 133 (100.0%) |
Monthly Housing Cost Tiers in Trappe
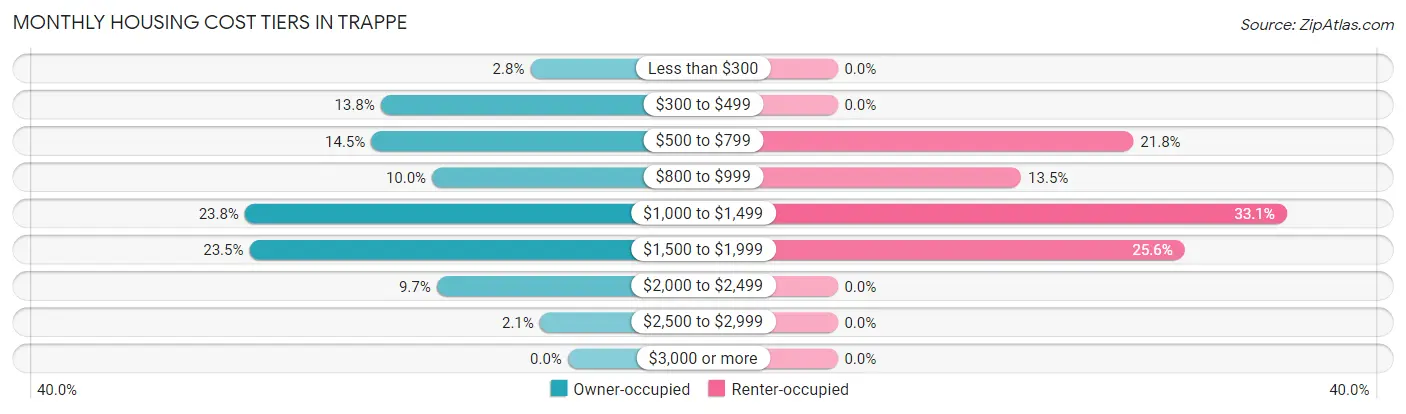
| Monthly Cost | Owner-occupied | Renter-occupied |
| Less than $300 | 8 (2.8%) | 0 (0.0%) |
| $300 to $499 | 40 (13.8%) | 0 (0.0%) |
| $500 to $799 | 42 (14.5%) | 29 (21.8%) |
| $800 to $999 | 29 (10.0%) | 18 (13.5%) |
| $1,000 to $1,499 | 69 (23.8%) | 44 (33.1%) |
| $1,500 to $1,999 | 68 (23.4%) | 34 (25.6%) |
| $2,000 to $2,499 | 28 (9.7%) | 0 (0.0%) |
| $2,500 to $2,999 | 6 (2.1%) | 0 (0.0%) |
| $3,000 or more | 0 (0.0%) | 0 (0.0%) |
| Total | 290 (100.0%) | 133 (100.0%) |
Physical Housing Characteristics in Trappe
Housing Structures in Trappe
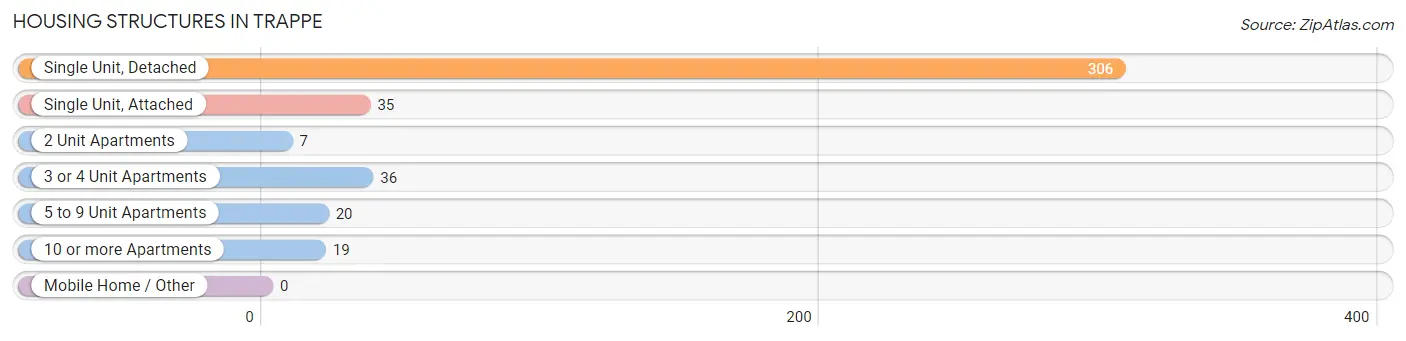
| Structure Type | # Housing Units | % Housing Units |
| Single Unit, Detached | 306 | 72.3% |
| Single Unit, Attached | 35 | 8.3% |
| 2 Unit Apartments | 7 | 1.7% |
| 3 or 4 Unit Apartments | 36 | 8.5% |
| 5 to 9 Unit Apartments | 20 | 4.7% |
| 10 or more Apartments | 19 | 4.5% |
| Mobile Home / Other | 0 | 0.0% |
| Total | 423 | 100.0% |
Housing Structures by Occupancy in Trappe
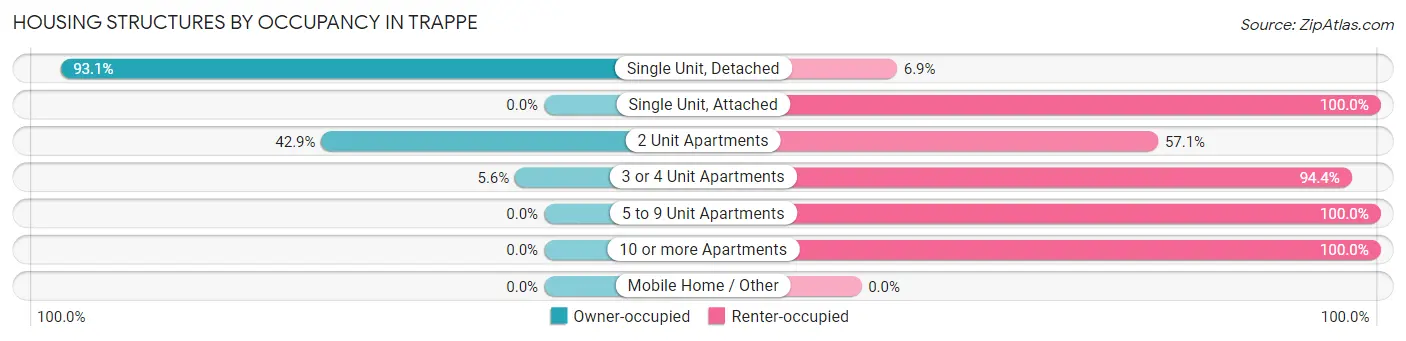
| Structure Type | Owner-occupied | Renter-occupied |
| Single Unit, Detached | 285 (93.1%) | 21 (6.9%) |
| Single Unit, Attached | 0 (0.0%) | 35 (100.0%) |
| 2 Unit Apartments | 3 (42.9%) | 4 (57.1%) |
| 3 or 4 Unit Apartments | 2 (5.6%) | 34 (94.4%) |
| 5 to 9 Unit Apartments | 0 (0.0%) | 20 (100.0%) |
| 10 or more Apartments | 0 (0.0%) | 19 (100.0%) |
| Mobile Home / Other | 0 (0.0%) | 0 (0.0%) |
| Total | 290 (68.6%) | 133 (31.4%) |
Housing Structures by Number of Rooms in Trappe
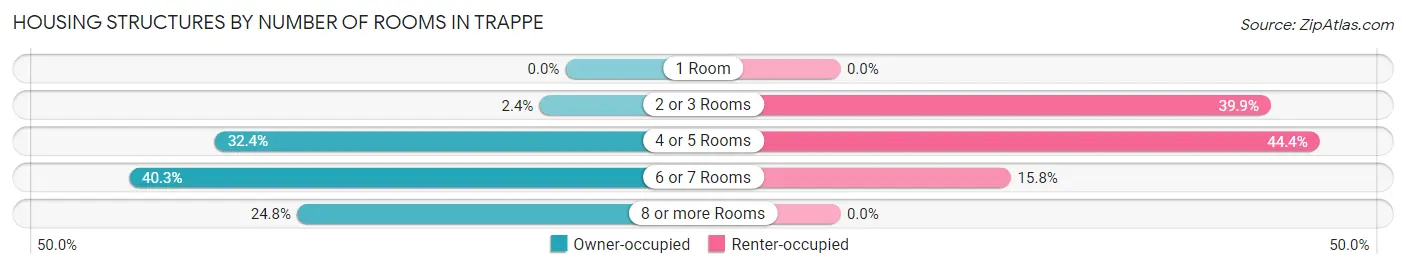
| Number of Rooms | Owner-occupied | Renter-occupied |
| 1 Room | 0 (0.0%) | 0 (0.0%) |
| 2 or 3 Rooms | 7 (2.4%) | 53 (39.9%) |
| 4 or 5 Rooms | 94 (32.4%) | 59 (44.4%) |
| 6 or 7 Rooms | 117 (40.3%) | 21 (15.8%) |
| 8 or more Rooms | 72 (24.8%) | 0 (0.0%) |
| Total | 290 (100.0%) | 133 (100.0%) |
Housing Structure by Heating Type in Trappe
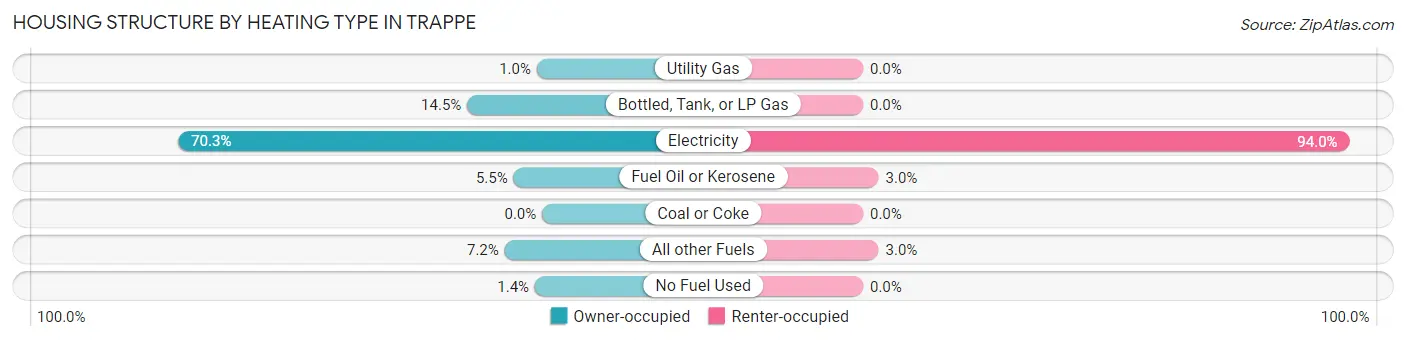
| Heating Type | Owner-occupied | Renter-occupied |
| Utility Gas | 3 (1.0%) | 0 (0.0%) |
| Bottled, Tank, or LP Gas | 42 (14.5%) | 0 (0.0%) |
| Electricity | 204 (70.3%) | 125 (94.0%) |
| Fuel Oil or Kerosene | 16 (5.5%) | 4 (3.0%) |
| Coal or Coke | 0 (0.0%) | 0 (0.0%) |
| All other Fuels | 21 (7.2%) | 4 (3.0%) |
| No Fuel Used | 4 (1.4%) | 0 (0.0%) |
| Total | 290 (100.0%) | 133 (100.0%) |
Household Vehicle Usage in Trappe
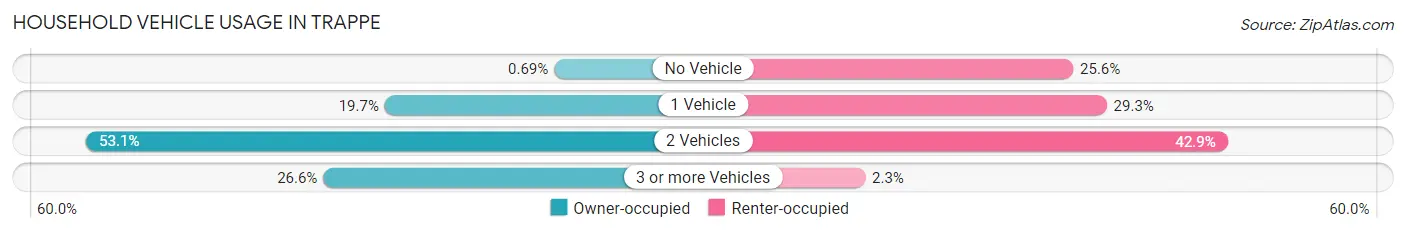
| Vehicles per Household | Owner-occupied | Renter-occupied |
| No Vehicle | 2 (0.7%) | 34 (25.6%) |
| 1 Vehicle | 57 (19.7%) | 39 (29.3%) |
| 2 Vehicles | 154 (53.1%) | 57 (42.9%) |
| 3 or more Vehicles | 77 (26.6%) | 3 (2.3%) |
| Total | 290 (100.0%) | 133 (100.0%) |
Real Estate & Mortgages in Trappe
Real Estate and Mortgage Overview in Trappe
| Characteristic | Without Mortgage | With Mortgage |
| Housing Units | 92 | 198 |
| Median Property Value | $239,300 | $239,100 |
| Median Household Income | $57,885 | $20 |
| Monthly Housing Costs | $495 | $0 |
| Real Estate Taxes | $1,797 | $25 |
Property Value by Mortgage Status in Trappe
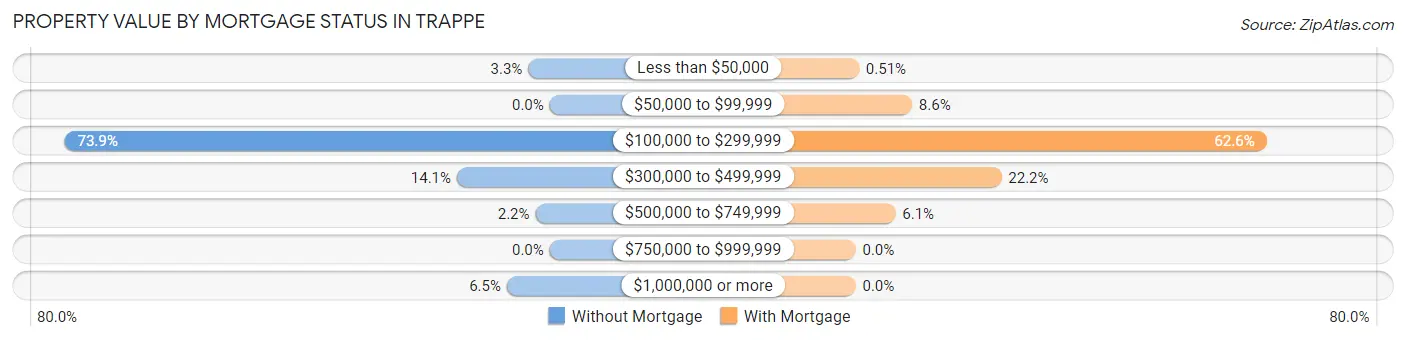
| Property Value | Without Mortgage | With Mortgage |
| Less than $50,000 | 3 (3.3%) | 1 (0.5%) |
| $50,000 to $99,999 | 0 (0.0%) | 17 (8.6%) |
| $100,000 to $299,999 | 68 (73.9%) | 124 (62.6%) |
| $300,000 to $499,999 | 13 (14.1%) | 44 (22.2%) |
| $500,000 to $749,999 | 2 (2.2%) | 12 (6.1%) |
| $750,000 to $999,999 | 0 (0.0%) | 0 (0.0%) |
| $1,000,000 or more | 6 (6.5%) | 0 (0.0%) |
| Total | 92 (100.0%) | 198 (100.0%) |
Household Income by Mortgage Status in Trappe
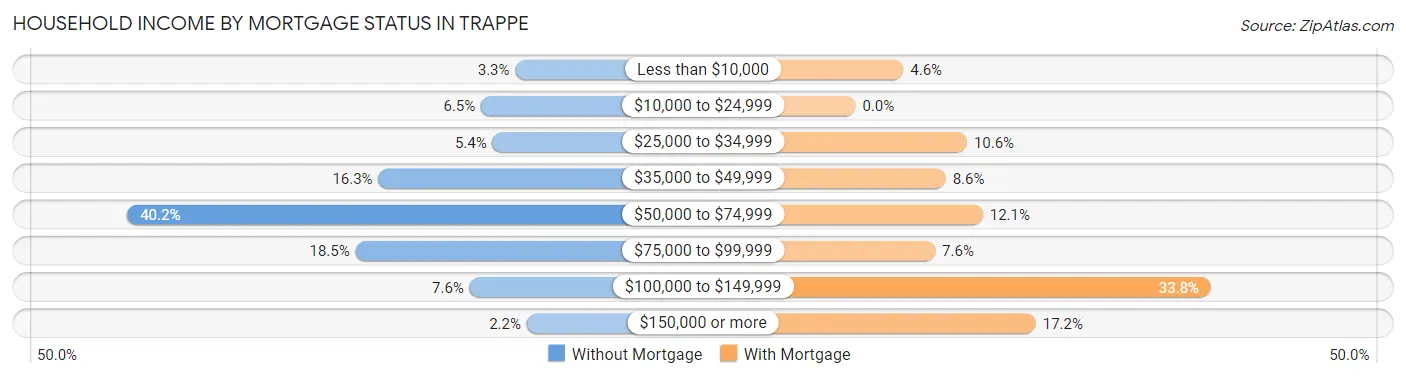
| Household Income | Without Mortgage | With Mortgage |
| Less than $10,000 | 3 (3.3%) | 9 (4.5%) |
| $10,000 to $24,999 | 6 (6.5%) | 0 (0.0%) |
| $25,000 to $34,999 | 5 (5.4%) | 21 (10.6%) |
| $35,000 to $49,999 | 15 (16.3%) | 17 (8.6%) |
| $50,000 to $74,999 | 37 (40.2%) | 24 (12.1%) |
| $75,000 to $99,999 | 17 (18.5%) | 15 (7.6%) |
| $100,000 to $149,999 | 7 (7.6%) | 67 (33.8%) |
| $150,000 or more | 2 (2.2%) | 34 (17.2%) |
| Total | 92 (100.0%) | 198 (100.0%) |
Property Value to Household Income Ratio in Trappe
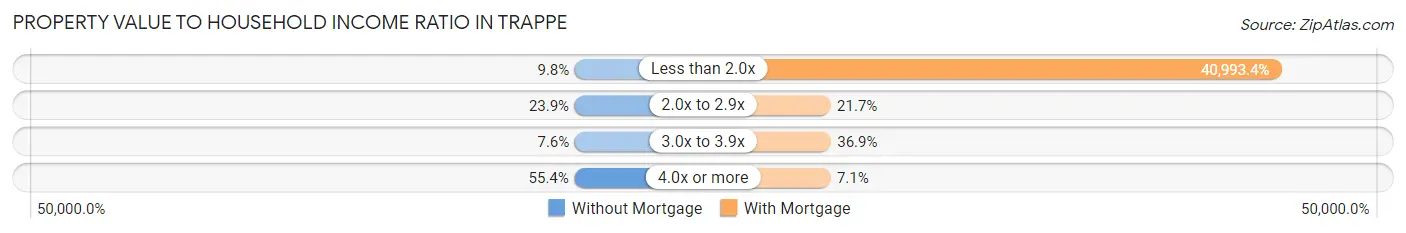
| Value-to-Income Ratio | Without Mortgage | With Mortgage |
| Less than 2.0x | 9 (9.8%) | 81,167 (40,993.4%) |
| 2.0x to 2.9x | 22 (23.9%) | 43 (21.7%) |
| 3.0x to 3.9x | 7 (7.6%) | 73 (36.9%) |
| 4.0x or more | 51 (55.4%) | 14 (7.1%) |
| Total | 92 (100.0%) | 198 (100.0%) |
Real Estate Taxes by Mortgage Status in Trappe
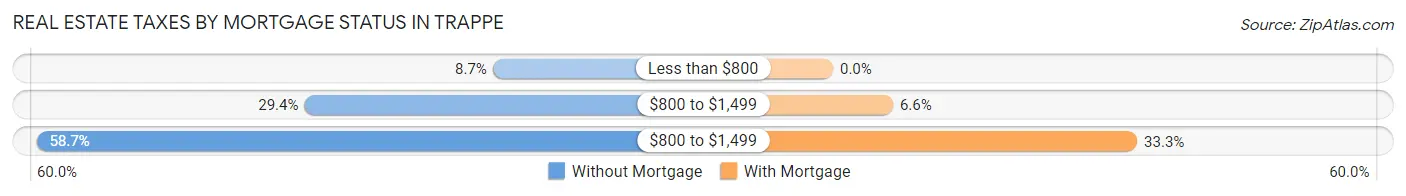
| Property Taxes | Without Mortgage | With Mortgage |
| Less than $800 | 8 (8.7%) | 0 (0.0%) |
| $800 to $1,499 | 27 (29.3%) | 13 (6.6%) |
| $800 to $1,499 | 54 (58.7%) | 66 (33.3%) |
| Total | 92 (100.0%) | 198 (100.0%) |
Health & Disability in Trappe
Health Insurance Coverage by Age in Trappe
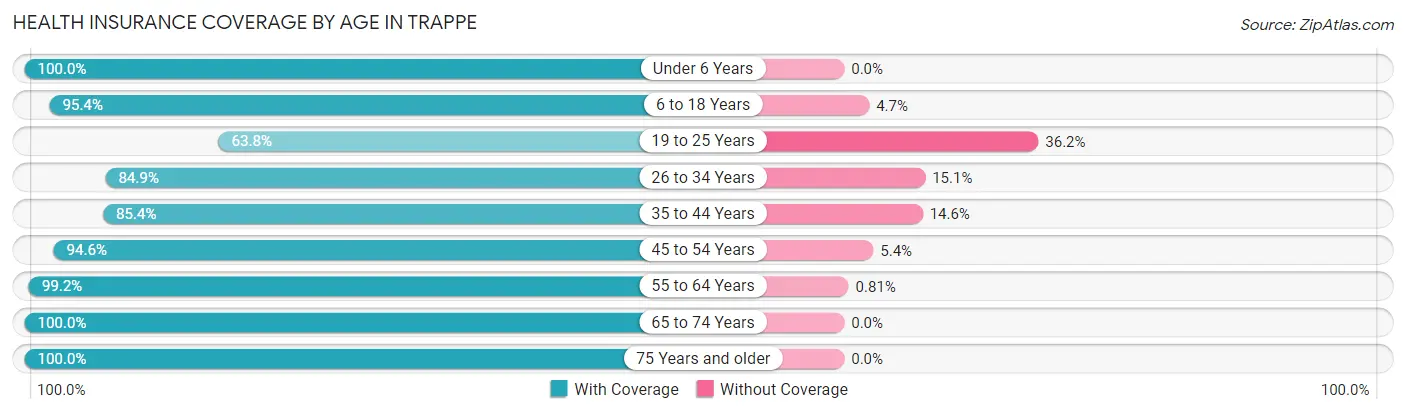
| Age Bracket | With Coverage | Without Coverage |
| Under 6 Years | 49 (100.0%) | 0 (0.0%) |
| 6 to 18 Years | 164 (95.4%) | 8 (4.6%) |
| 19 to 25 Years | 67 (63.8%) | 38 (36.2%) |
| 26 to 34 Years | 90 (84.9%) | 16 (15.1%) |
| 35 to 44 Years | 111 (85.4%) | 19 (14.6%) |
| 45 to 54 Years | 157 (94.6%) | 9 (5.4%) |
| 55 to 64 Years | 122 (99.2%) | 1 (0.8%) |
| 65 to 74 Years | 121 (100.0%) | 0 (0.0%) |
| 75 Years and older | 47 (100.0%) | 0 (0.0%) |
| Total | 928 (91.1%) | 91 (8.9%) |
Health Insurance Coverage by Citizenship Status in Trappe
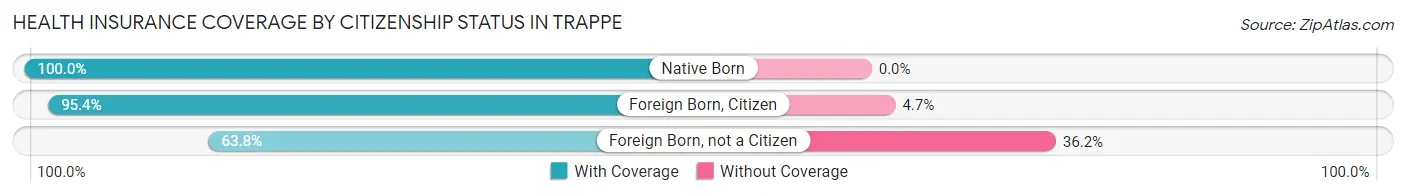
| Citizenship Status | With Coverage | Without Coverage |
| Native Born | 49 (100.0%) | 0 (0.0%) |
| Foreign Born, Citizen | 164 (95.4%) | 8 (4.6%) |
| Foreign Born, not a Citizen | 67 (63.8%) | 38 (36.2%) |
Health Insurance Coverage by Household Income in Trappe
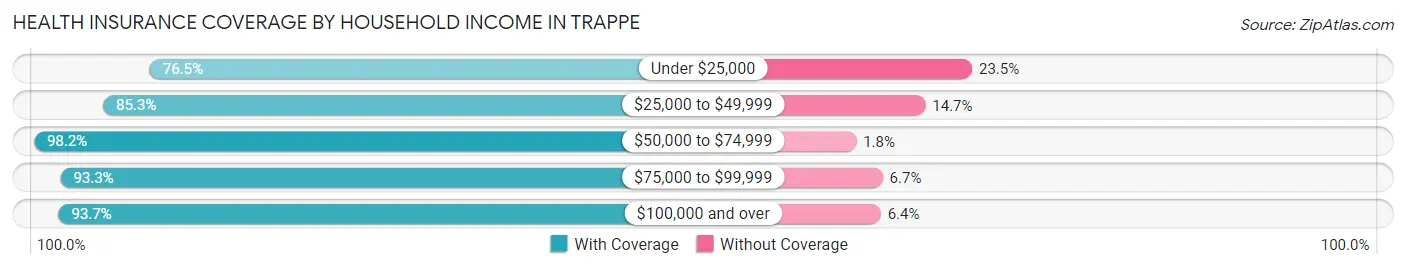
| Household Income | With Coverage | Without Coverage |
| Under $25,000 | 62 (76.5%) | 19 (23.5%) |
| $25,000 to $49,999 | 197 (85.3%) | 34 (14.7%) |
| $50,000 to $74,999 | 167 (98.2%) | 3 (1.8%) |
| $75,000 to $99,999 | 222 (93.3%) | 16 (6.7%) |
| $100,000 and over | 280 (93.6%) | 19 (6.4%) |
Public vs Private Health Insurance Coverage by Age in Trappe
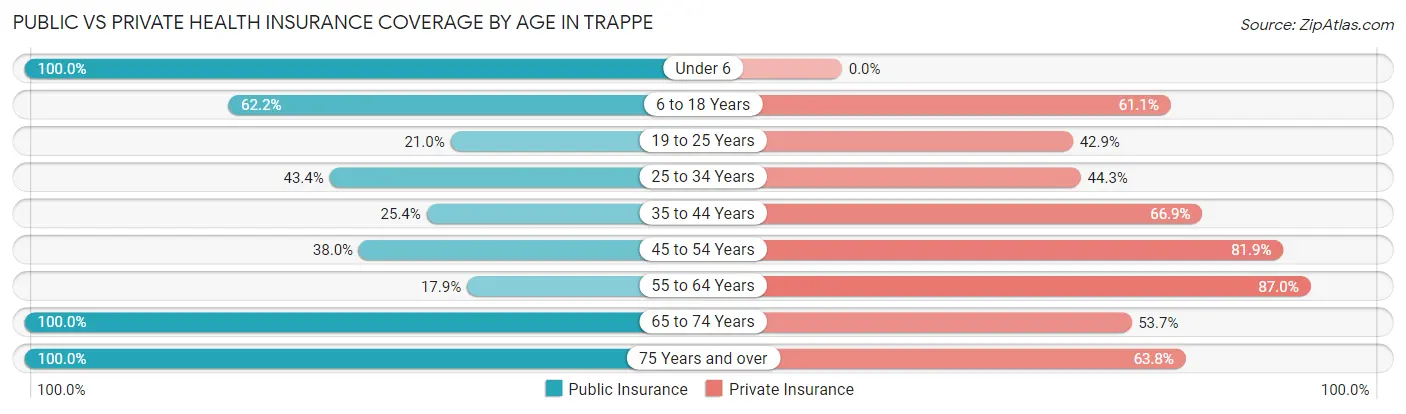
| Age Bracket | Public Insurance | Private Insurance |
| Under 6 | 49 (100.0%) | 0 (0.0%) |
| 6 to 18 Years | 107 (62.2%) | 105 (61.1%) |
| 19 to 25 Years | 22 (20.9%) | 45 (42.9%) |
| 25 to 34 Years | 46 (43.4%) | 47 (44.3%) |
| 35 to 44 Years | 33 (25.4%) | 87 (66.9%) |
| 45 to 54 Years | 63 (38.0%) | 136 (81.9%) |
| 55 to 64 Years | 22 (17.9%) | 107 (87.0%) |
| 65 to 74 Years | 121 (100.0%) | 65 (53.7%) |
| 75 Years and over | 47 (100.0%) | 30 (63.8%) |
| Total | 510 (50.0%) | 622 (61.0%) |
Disability Status by Sex by Age in Trappe
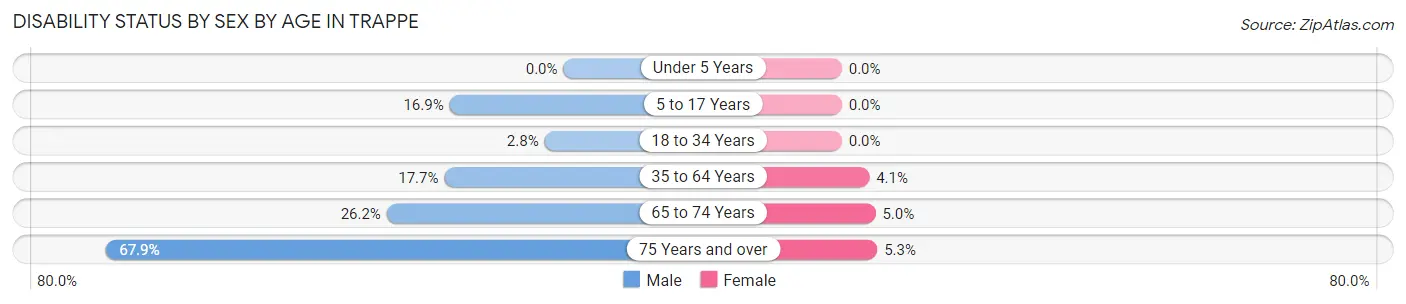
| Age Bracket | Male | Female |
| Under 5 Years | 0 (0.0%) | 0 (0.0%) |
| 5 to 17 Years | 23 (16.9%) | 0 (0.0%) |
| 18 to 34 Years | 3 (2.8%) | 0 (0.0%) |
| 35 to 64 Years | 35 (17.7%) | 9 (4.1%) |
| 65 to 74 Years | 16 (26.2%) | 3 (5.0%) |
| 75 Years and over | 19 (67.9%) | 1 (5.3%) |
Disability Class by Sex by Age in Trappe
Disability Class: Hearing Difficulty
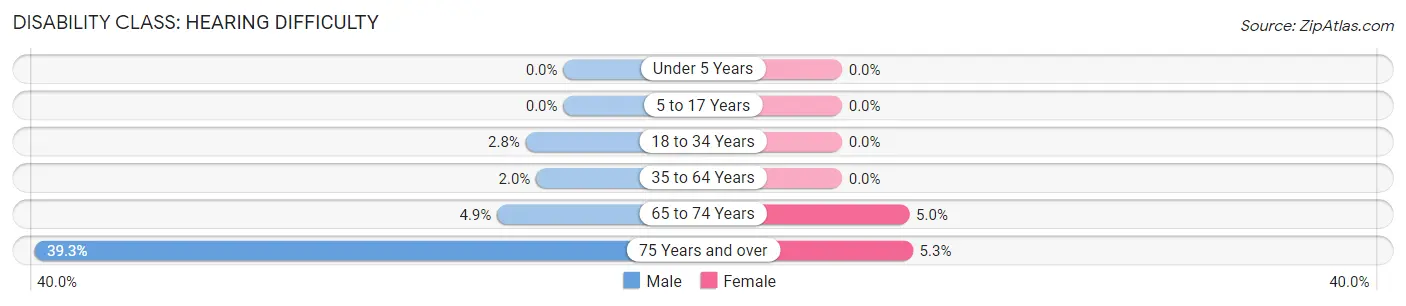
| Age Bracket | Male | Female |
| Under 5 Years | 0 (0.0%) | 0 (0.0%) |
| 5 to 17 Years | 0 (0.0%) | 0 (0.0%) |
| 18 to 34 Years | 3 (2.8%) | 0 (0.0%) |
| 35 to 64 Years | 4 (2.0%) | 0 (0.0%) |
| 65 to 74 Years | 3 (4.9%) | 3 (5.0%) |
| 75 Years and over | 11 (39.3%) | 1 (5.3%) |
Disability Class: Vision Difficulty
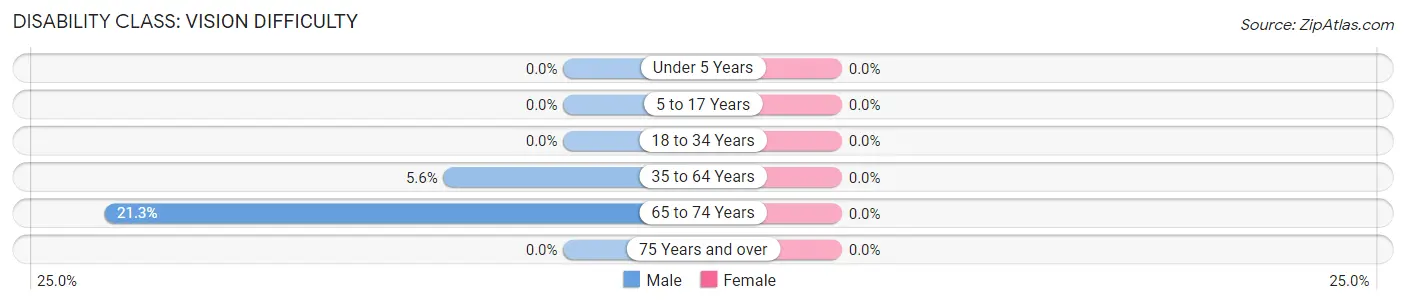
| Age Bracket | Male | Female |
| Under 5 Years | 0 (0.0%) | 0 (0.0%) |
| 5 to 17 Years | 0 (0.0%) | 0 (0.0%) |
| 18 to 34 Years | 0 (0.0%) | 0 (0.0%) |
| 35 to 64 Years | 11 (5.6%) | 0 (0.0%) |
| 65 to 74 Years | 13 (21.3%) | 0 (0.0%) |
| 75 Years and over | 0 (0.0%) | 0 (0.0%) |
Disability Class: Cognitive Difficulty
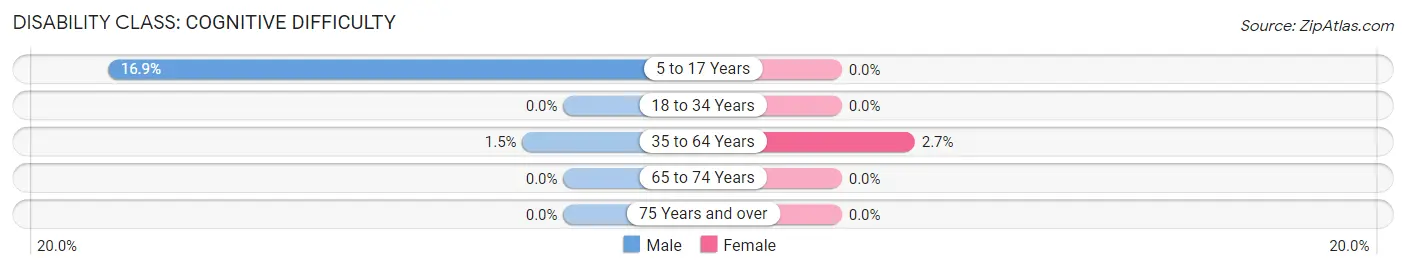
| Age Bracket | Male | Female |
| 5 to 17 Years | 23 (16.9%) | 0 (0.0%) |
| 18 to 34 Years | 0 (0.0%) | 0 (0.0%) |
| 35 to 64 Years | 3 (1.5%) | 6 (2.7%) |
| 65 to 74 Years | 0 (0.0%) | 0 (0.0%) |
| 75 Years and over | 0 (0.0%) | 0 (0.0%) |
Disability Class: Ambulatory Difficulty
| Age Bracket | Male | Female |
| 5 to 17 Years | 0 (0.0%) | 0 (0.0%) |
| 18 to 34 Years | 0 (0.0%) | 0 (0.0%) |
| 35 to 64 Years | 10 (5.1%) | 3 (1.4%) |
| 65 to 74 Years | 0 (0.0%) | 0 (0.0%) |
| 75 Years and over | 8 (28.6%) | 0 (0.0%) |
Disability Class: Self-Care Difficulty
| Age Bracket | Male | Female |
| 5 to 17 Years | 11 (8.1%) | 0 (0.0%) |
| 18 to 34 Years | 0 (0.0%) | 0 (0.0%) |
| 35 to 64 Years | 9 (4.5%) | 1 (0.4%) |
| 65 to 74 Years | 0 (0.0%) | 0 (0.0%) |
| 75 Years and over | 5 (17.9%) | 0 (0.0%) |
Technology Access in Trappe
Computing Device Access in Trappe
| Device Type | # Households | % Households |
| Desktop or Laptop | 298 | 70.5% |
| Smartphone | 366 | 86.5% |
| Tablet | 255 | 60.3% |
| No Computing Device | 15 | 3.5% |
| Total | 423 | 100.0% |
Internet Access in Trappe
| Internet Type | # Households | % Households |
| Dial-Up Internet | 1 | 0.2% |
| Broadband Home | 334 | 79.0% |
| Cellular Data Only | 24 | 5.7% |
| Satellite Internet | 9 | 2.1% |
| No Internet | 55 | 13.0% |
| Total | 423 | 100.0% |
Trappe Summary
Trappe, Maryland is a small town located in Talbot County on the Eastern Shore of Maryland. It is situated on the Choptank River, about 10 miles south of Easton, the county seat. The town has a population of 1,845 as of the 2010 census, and is part of the larger Salisbury, Maryland metropolitan area.
History
The area that is now Trappe was first settled in the early 1700s by English colonists. The town was originally known as “Trap”, after the Dutch word for “trap”, which was used to describe the area’s marshy terrain. The town was officially incorporated in 1867, and the name was changed to Trappe.
The town was an important port for the shipping of agricultural products, such as grain, tobacco, and seafood. It was also a major stop on the Underground Railroad, with many of the town’s residents helping to hide and transport escaped slaves.
Geography
Trappe is located at 38°47′N 75°48′W (38.78, -75.80). It is situated on the Choptank River, about 10 miles south of Easton, the county seat. The town has a total area of 1.2 square miles, all of which is land.
The town is located in the humid subtropical climate zone, with hot, humid summers and mild winters. The average annual temperature is around 60°F, and the average annual precipitation is around 45 inches.
Economy
The economy of Trappe is largely based on agriculture and tourism. The town is home to several farms, which produce a variety of crops, including corn, soybeans, wheat, and hay. The town is also home to several seafood processing plants, which process and package seafood for local and regional markets.
The town is also a popular tourist destination, with many visitors coming to enjoy the town’s historic sites, scenic views, and outdoor activities. The town is home to several bed and breakfasts, as well as a variety of restaurants, shops, and other attractions.
Demographics
As of the 2010 census, Trappe had a population of 1,845. The racial makeup of the town was 87.3% White, 8.2% African American, 0.7% Native American, 0.7% Asian, 0.1% Pacific Islander, 0.7% from other races, and 2.3% from two or more races. Hispanic or Latino of any race were 2.3% of the population.
The median income for a household in the town was $50,000, and the median income for a family was $60,000. The per capita income for the town was $25,000. About 8.2% of families and 10.2% of the population were below the poverty line, including 14.2% of those under age 18 and 8.2% of those age 65 or over.
Common Questions
What is Per Capita Income in Trappe?
Per Capita income in Trappe is $32,174.
What is the Median Family Income in Trappe?
Median Family Income in Trappe is $78,125.
What is the Median Household income in Trappe?
Median Household Income in Trappe is $65,139.
What is Income or Wage Gap in Trappe?
Income or Wage Gap in Trappe is 3.1%.
Women in Trappe earn 96.9 cents for every dollar earned by a man.
What is Inequality or Gini Index in Trappe?
Inequality or Gini Index in Trappe is 0.36.
What is the Total Population of Trappe?
Total Population of Trappe is 1,019.
What is the Total Male Population of Trappe?
Total Male Population of Trappe is 551.
What is the Total Female Population of Trappe?
Total Female Population of Trappe is 468.
What is the Ratio of Males per 100 Females in Trappe?
There are 117.74 Males per 100 Females in Trappe.
What is the Ratio of Females per 100 Males in Trappe?
There are 84.94 Females per 100 Males in Trappe.
What is the Median Population Age in Trappe?
Median Population Age in Trappe is 40.8 Years.
What is the Average Family Size in Trappe
Average Family Size in Trappe is 3.2 People.
What is the Average Household Size in Trappe
Average Household Size in Trappe is 2.4 People.
How Large is the Labor Force in Trappe?
There are 600 People in the Labor Forcein in Trappe.
What is the Percentage of People in the Labor Force in Trappe?
71.1% of People are in the Labor Force in Trappe.
What is the Unemployment Rate in Trappe?
Unemployment Rate in Trappe is 8.8%.