Marlboro, NY Map & Demographics
Marlboro Map
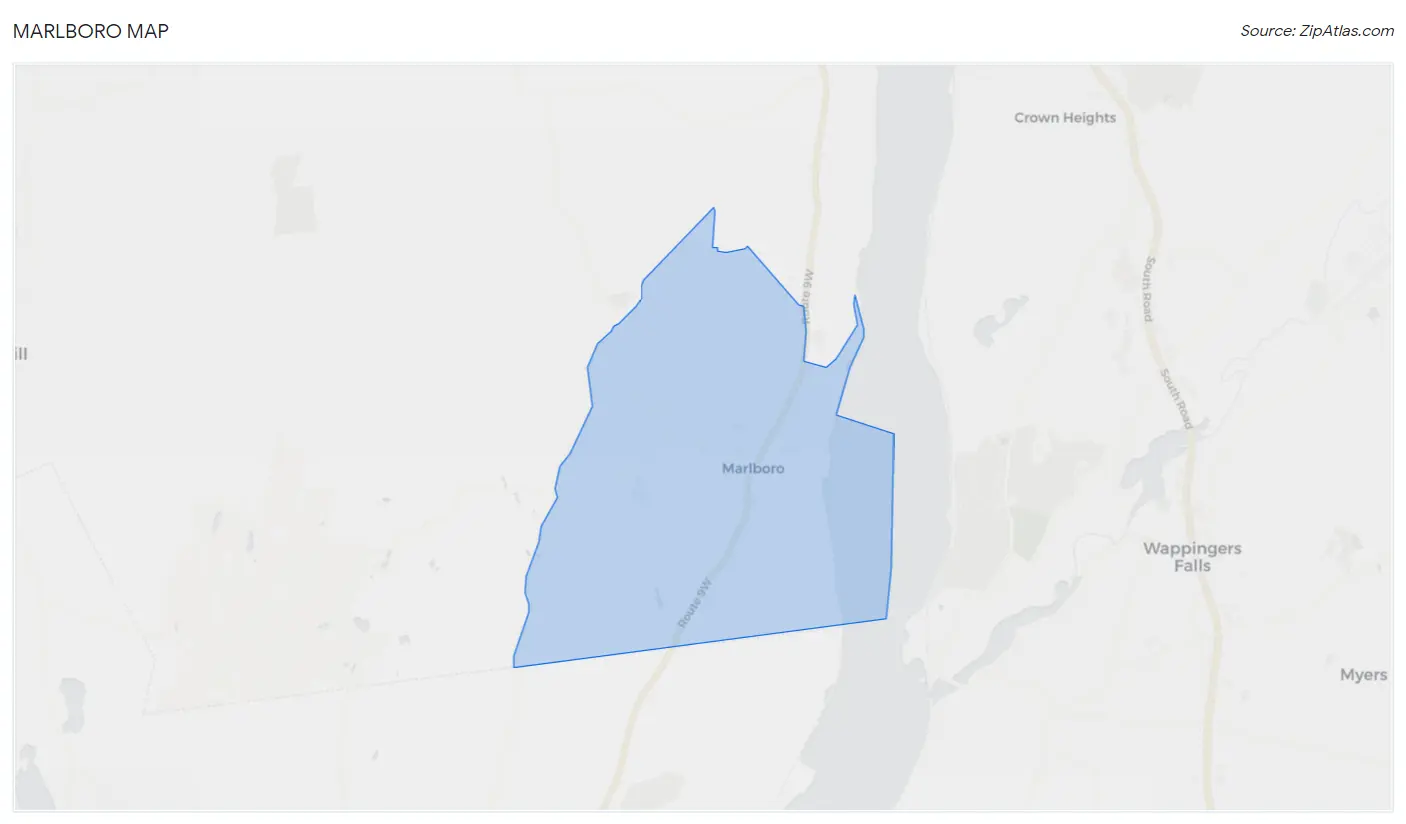
Marlboro Overview
$63,595
PER CAPITA INCOME
$163,750
AVG FAMILY INCOME
$110,547
AVG HOUSEHOLD INCOME
12.4%
WAGE / INCOME GAP [ % ]
87.6¢/ $1
WAGE / INCOME GAP [ $ ]
0.49
INEQUALITY / GINI INDEX
3,635
TOTAL POPULATION
1,715
MALE POPULATION
1,920
FEMALE POPULATION
89.32
MALES / 100 FEMALES
111.95
FEMALES / 100 MALES
49.3
MEDIAN AGE
2.9
AVG FAMILY SIZE
2.4
AVG HOUSEHOLD SIZE
1,752
LABOR FORCE [ PEOPLE ]
58.4%
PERCENT IN LABOR FORCE
Marlboro Zip Codes
Marlboro Area Codes
Income in Marlboro
Income Overview in Marlboro
Per Capita Income in Marlboro is $63,595, while median incomes of families and households are $163,750 and $110,547 respectively.
| Characteristic | Number | Measure |
| Per Capita Income | 3,635 | $63,595 |
| Median Family Income | 992 | $163,750 |
| Mean Family Income | 992 | $209,320 |
| Median Household Income | 1,517 | $110,547 |
| Mean Household Income | 1,517 | $162,405 |
| Income Deficit | 992 | $0 |
| Wage / Income Gap (%) | 3,635 | 12.39% |
| Wage / Income Gap ($) | 3,635 | 87.61¢ per $1 |
| Gini / Inequality Index | 3,635 | 0.49 |
Earnings by Sex in Marlboro
Average Earnings in Marlboro are $60,472, $61,958 for men and $54,281 for women, a difference of 12.4%.
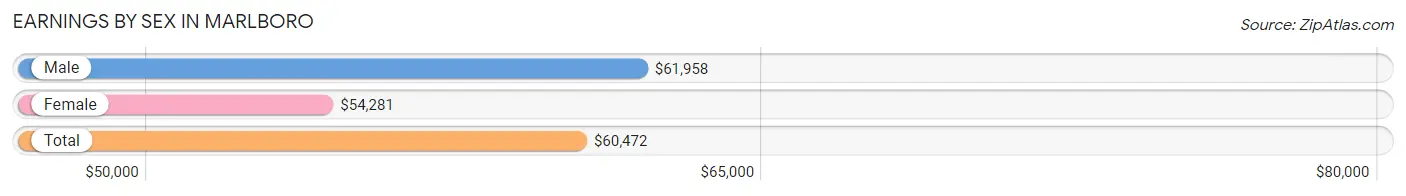
| Sex | Number | Average Earnings |
| Male | 963 (51.1%) | $61,958 |
| Female | 923 (48.9%) | $54,281 |
| Total | 1,886 (100.0%) | $60,472 |
Earnings by Sex by Income Bracket in Marlboro
The most common earnings brackets in Marlboro are $100,000+ for men (337 | 35.0%) and $100,000+ for women (280 | 30.3%).
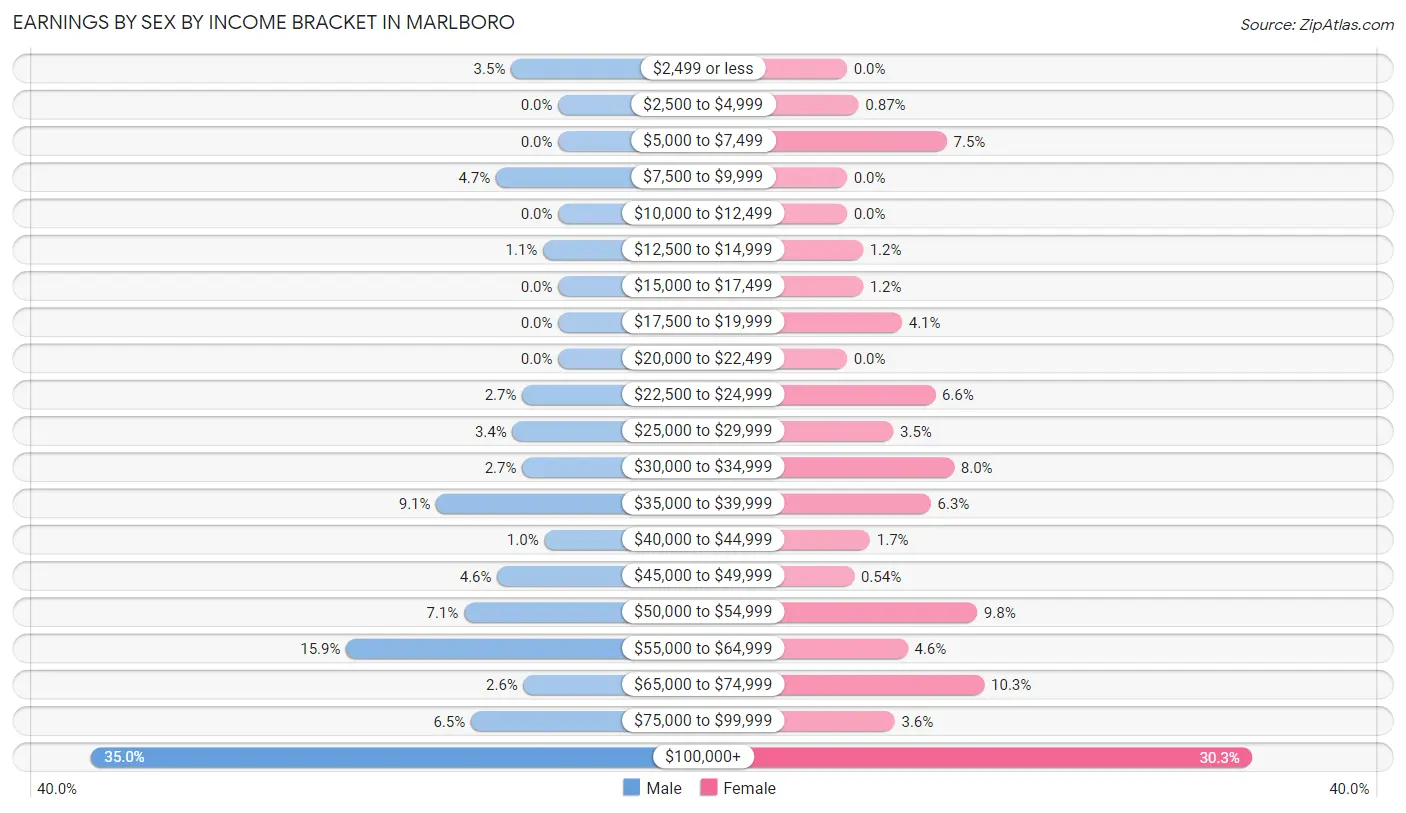
| Income | Male | Female |
| $2,499 or less | 34 (3.5%) | 0 (0.0%) |
| $2,500 to $4,999 | 0 (0.0%) | 8 (0.9%) |
| $5,000 to $7,499 | 0 (0.0%) | 69 (7.5%) |
| $7,500 to $9,999 | 45 (4.7%) | 0 (0.0%) |
| $10,000 to $12,499 | 0 (0.0%) | 0 (0.0%) |
| $12,500 to $14,999 | 11 (1.1%) | 11 (1.2%) |
| $15,000 to $17,499 | 0 (0.0%) | 11 (1.2%) |
| $17,500 to $19,999 | 0 (0.0%) | 38 (4.1%) |
| $20,000 to $22,499 | 0 (0.0%) | 0 (0.0%) |
| $22,500 to $24,999 | 26 (2.7%) | 61 (6.6%) |
| $25,000 to $29,999 | 33 (3.4%) | 32 (3.5%) |
| $30,000 to $34,999 | 26 (2.7%) | 74 (8.0%) |
| $35,000 to $39,999 | 88 (9.1%) | 58 (6.3%) |
| $40,000 to $44,999 | 10 (1.0%) | 16 (1.7%) |
| $45,000 to $49,999 | 44 (4.6%) | 5 (0.5%) |
| $50,000 to $54,999 | 68 (7.1%) | 90 (9.8%) |
| $55,000 to $64,999 | 153 (15.9%) | 42 (4.5%) |
| $65,000 to $74,999 | 25 (2.6%) | 95 (10.3%) |
| $75,000 to $99,999 | 63 (6.5%) | 33 (3.6%) |
| $100,000+ | 337 (35.0%) | 280 (30.3%) |
| Total | 963 (100.0%) | 923 (100.0%) |
Earnings by Sex by Educational Attainment in Marlboro
Average earnings in Marlboro are $64,291 for men and $58,095 for women, a difference of 9.6%. Men with an educational attainment of bachelor's degree enjoy the highest average annual earnings of $126,136, while those with high school diploma education earn the least with $51,272. Women with an educational attainment of bachelor's degree earn the most with the average annual earnings of $109,432, while those with high school diploma education have the smallest earnings of $31,429.
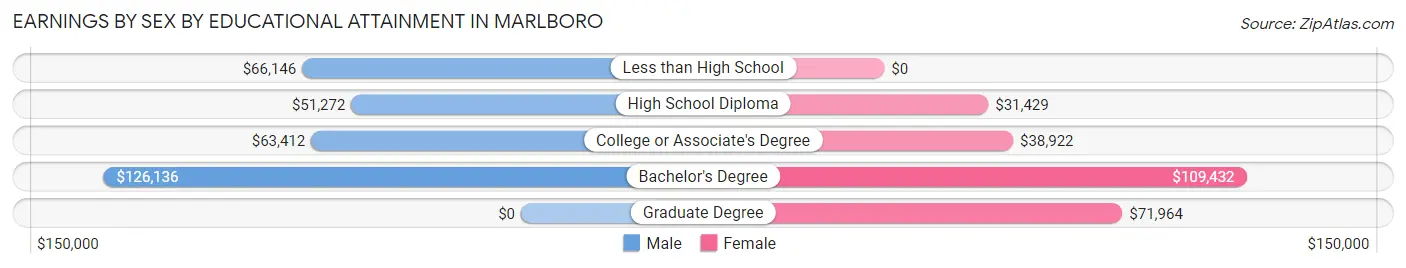
| Educational Attainment | Male Income | Female Income |
| Less than High School | $66,146 | $0 |
| High School Diploma | $51,272 | $31,429 |
| College or Associate's Degree | $63,412 | $38,922 |
| Bachelor's Degree | $126,136 | $109,432 |
| Graduate Degree | - | - |
| Total | $64,291 | $58,095 |
Family Income in Marlboro
Family Income Brackets in Marlboro
According to the Marlboro family income data, there are 439 families falling into the $200,000+ income range, which is the most common income bracket and makes up 44.3% of all families.
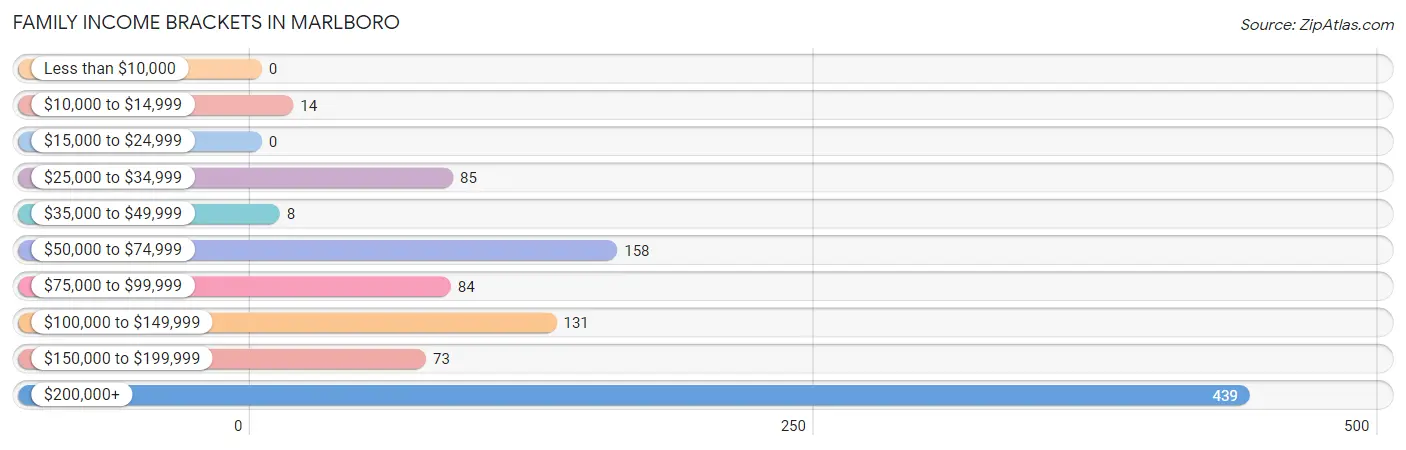
| Income Bracket | # Families | % Families |
| Less than $10,000 | 0 | 0.0% |
| $10,000 to $14,999 | 14 | 1.4% |
| $15,000 to $24,999 | 0 | 0.0% |
| $25,000 to $34,999 | 85 | 8.6% |
| $35,000 to $49,999 | 8 | 0.8% |
| $50,000 to $74,999 | 158 | 15.9% |
| $75,000 to $99,999 | 84 | 8.5% |
| $100,000 to $149,999 | 131 | 13.2% |
| $150,000 to $199,999 | 73 | 7.4% |
| $200,000+ | 439 | 44.3% |
Family Income by Famaliy Size in Marlboro
4-person families (93 | 9.4%) account for the highest median family income in Marlboro with $250,001 per family, while 2-person families (536 | 54.0%) have the highest median income of $92,084 per family member.
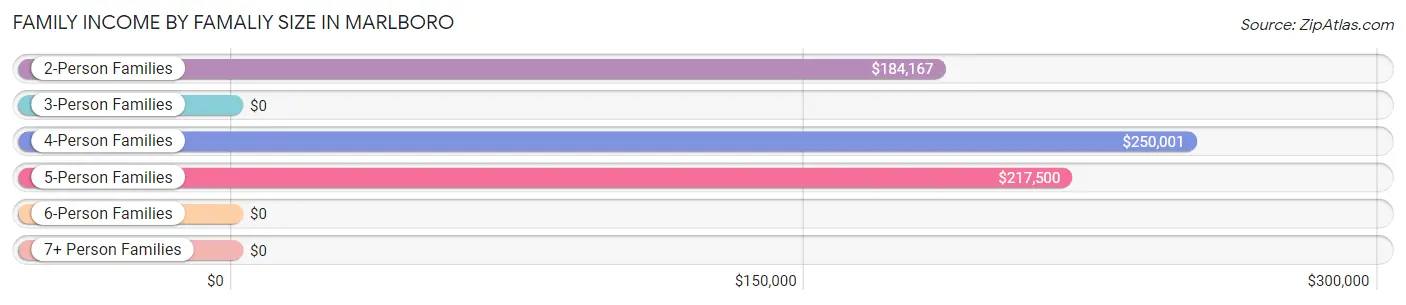
| Income Bracket | # Families | Median Income |
| 2-Person Families | 536 (54.0%) | $184,167 |
| 3-Person Families | 239 (24.1%) | $0 |
| 4-Person Families | 93 (9.4%) | $250,001 |
| 5-Person Families | 114 (11.5%) | $217,500 |
| 6-Person Families | 10 (1.0%) | $0 |
| 7+ Person Families | 0 (0.0%) | $0 |
| Total | 992 (100.0%) | $163,750 |
Family Income by Number of Earners in Marlboro
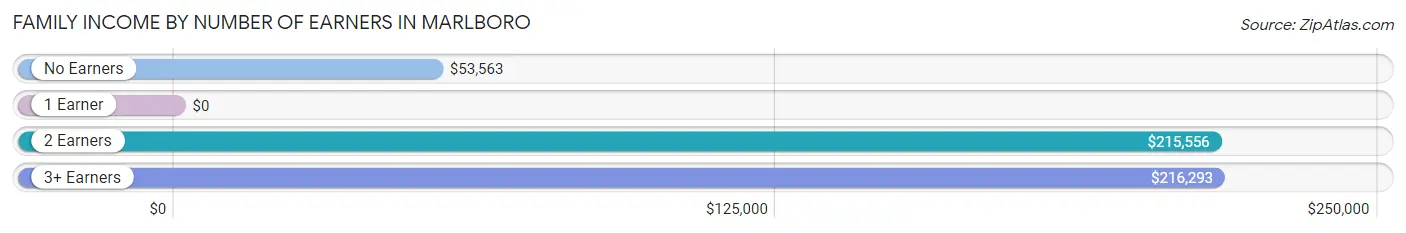
| Number of Earners | # Families | Median Income |
| No Earners | 128 (12.9%) | $53,563 |
| 1 Earner | 344 (34.7%) | $0 |
| 2 Earners | 406 (40.9%) | $215,556 |
| 3+ Earners | 114 (11.5%) | $216,293 |
| Total | 992 (100.0%) | $163,750 |
Household Income in Marlboro
Household Income Brackets in Marlboro
With 463 households falling in the category, the $200,000+ income range is the most frequent in Marlboro, accounting for 30.5% of all households.
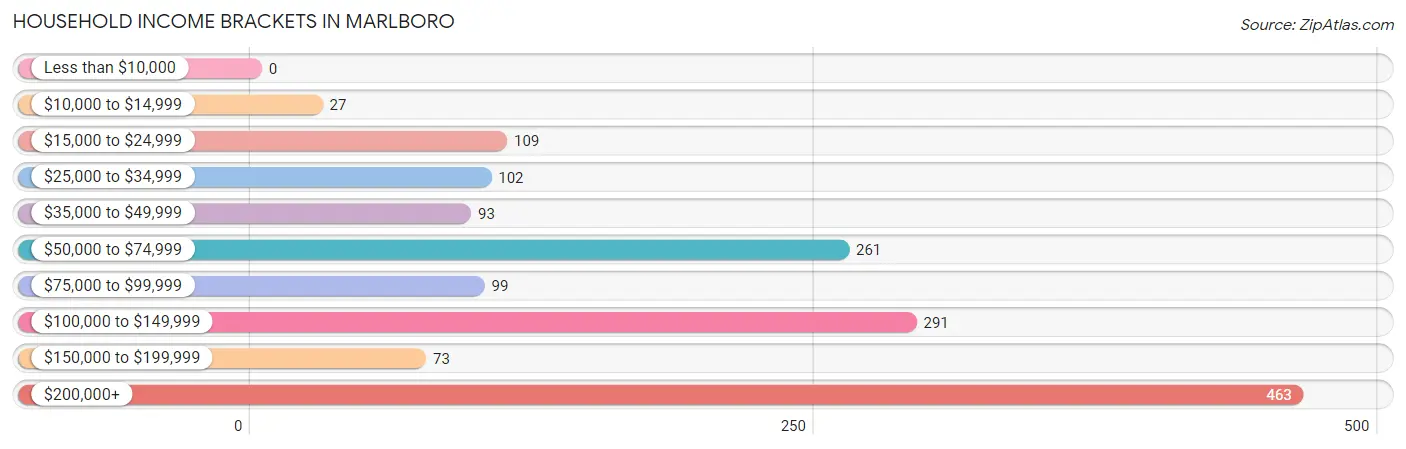
| Income Bracket | # Households | % Households |
| Less than $10,000 | 0 | 0.0% |
| $10,000 to $14,999 | 27 | 1.8% |
| $15,000 to $24,999 | 109 | 7.2% |
| $25,000 to $34,999 | 102 | 6.7% |
| $35,000 to $49,999 | 93 | 6.1% |
| $50,000 to $74,999 | 261 | 17.2% |
| $75,000 to $99,999 | 99 | 6.5% |
| $100,000 to $149,999 | 291 | 19.2% |
| $150,000 to $199,999 | 73 | 4.8% |
| $200,000+ | 463 | 30.5% |
Household Income by Householder Age in Marlboro
The median household income in Marlboro is $110,547, with the highest median household income of $121,792 found in the 25 to 44 years age bracket for the primary householder. A total of 390 households (25.7%) fall into this category.
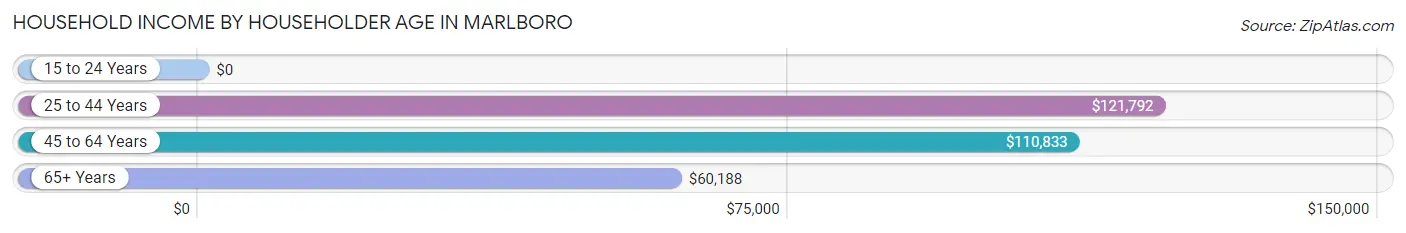
| Income Bracket | # Households | Median Income |
| 15 to 24 Years | 0 (0.0%) | $0 |
| 25 to 44 Years | 390 (25.7%) | $121,792 |
| 45 to 64 Years | 600 (39.6%) | $110,833 |
| 65+ Years | 527 (34.7%) | $60,188 |
| Total | 1,517 (100.0%) | $110,547 |
Poverty in Marlboro
Income Below Poverty by Sex and Age in Marlboro
With 3.2% poverty level for males and 4.4% for females among the residents of Marlboro, 12 to 14 year old males and 55 to 64 year old females are the most vulnerable to poverty, with 27 males (16.2%) and 47 females (13.5%) in their respective age groups living below the poverty level.
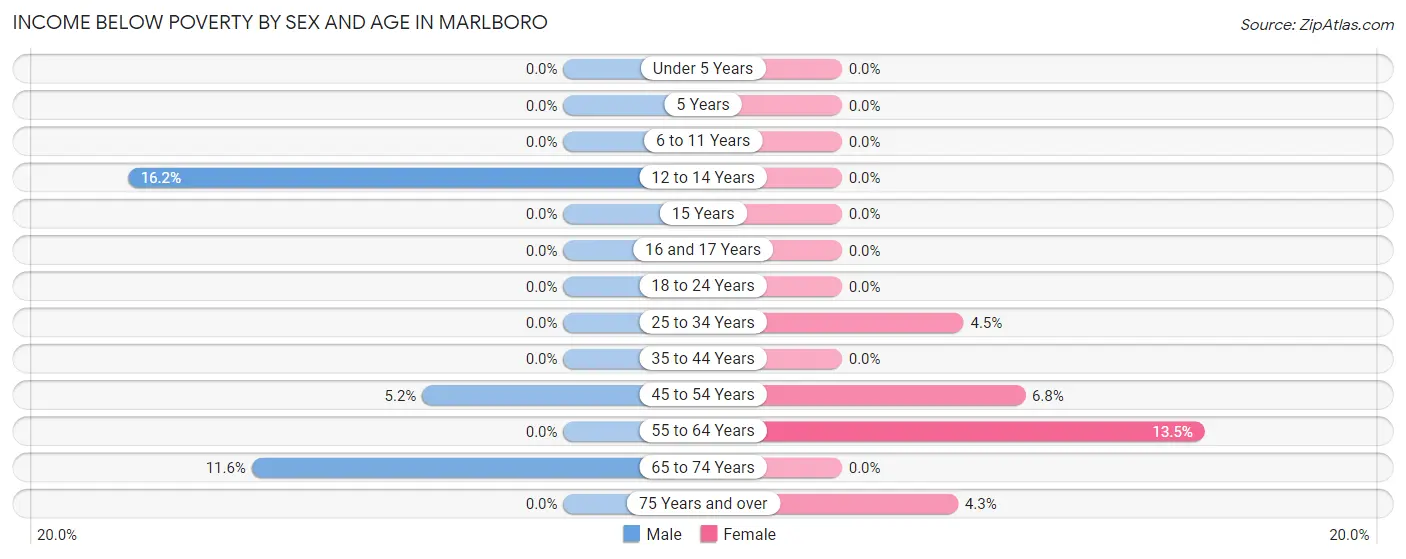
| Age Bracket | Male | Female |
| Under 5 Years | 0 (0.0%) | 0 (0.0%) |
| 5 Years | 0 (0.0%) | 0 (0.0%) |
| 6 to 11 Years | 0 (0.0%) | 0 (0.0%) |
| 12 to 14 Years | 27 (16.2%) | 0 (0.0%) |
| 15 Years | 0 (0.0%) | 0 (0.0%) |
| 16 and 17 Years | 0 (0.0%) | 0 (0.0%) |
| 18 to 24 Years | 0 (0.0%) | 0 (0.0%) |
| 25 to 34 Years | 0 (0.0%) | 10 (4.5%) |
| 35 to 44 Years | 0 (0.0%) | 0 (0.0%) |
| 45 to 54 Years | 13 (5.2%) | 14 (6.8%) |
| 55 to 64 Years | 0 (0.0%) | 47 (13.5%) |
| 65 to 74 Years | 14 (11.6%) | 0 (0.0%) |
| 75 Years and over | 0 (0.0%) | 14 (4.3%) |
| Total | 54 (3.2%) | 85 (4.4%) |
Income Above Poverty by Sex and Age in Marlboro
According to the poverty statistics in Marlboro, males aged under 5 years and females aged under 5 years are the age groups that are most secure financially, with 100.0% of males and 100.0% of females in these age groups living above the poverty line.
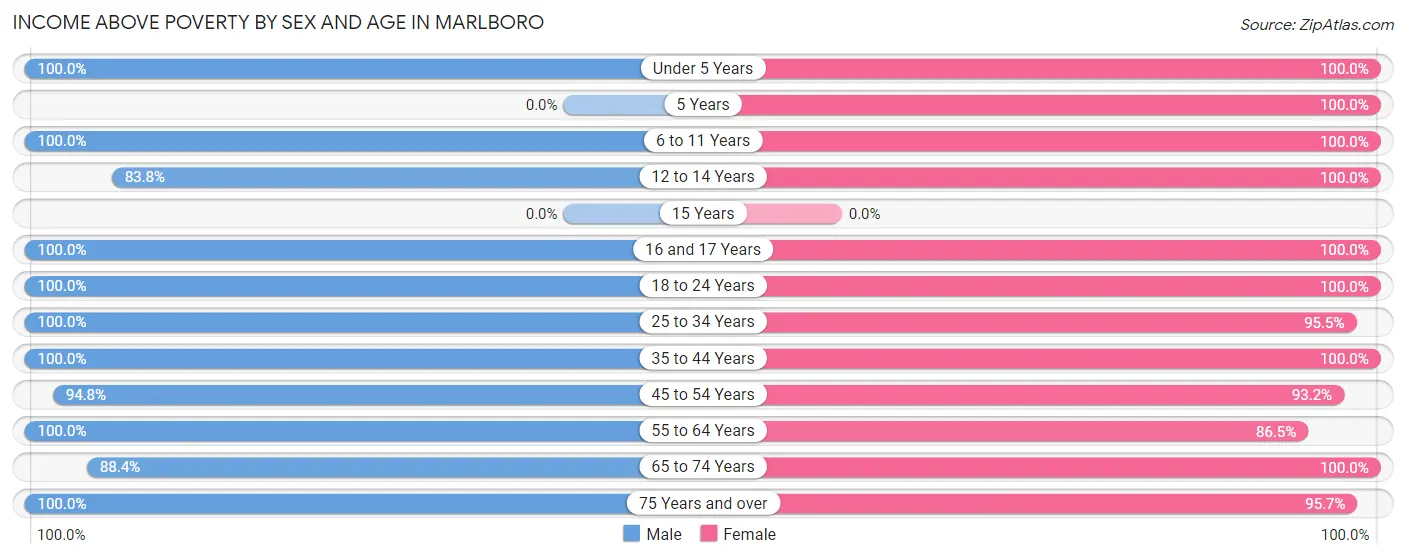
| Age Bracket | Male | Female |
| Under 5 Years | 77 (100.0%) | 118 (100.0%) |
| 5 Years | 0 (0.0%) | 16 (100.0%) |
| 6 to 11 Years | 85 (100.0%) | 88 (100.0%) |
| 12 to 14 Years | 140 (83.8%) | 49 (100.0%) |
| 15 Years | 0 (0.0%) | 0 (0.0%) |
| 16 and 17 Years | 39 (100.0%) | 58 (100.0%) |
| 18 to 24 Years | 116 (100.0%) | 22 (100.0%) |
| 25 to 34 Years | 117 (100.0%) | 211 (95.5%) |
| 35 to 44 Years | 259 (100.0%) | 241 (100.0%) |
| 45 to 54 Years | 235 (94.8%) | 192 (93.2%) |
| 55 to 64 Years | 227 (100.0%) | 302 (86.5%) |
| 65 to 74 Years | 107 (88.4%) | 226 (100.0%) |
| 75 Years and over | 224 (100.0%) | 311 (95.7%) |
| Total | 1,626 (96.8%) | 1,834 (95.6%) |
Income Below Poverty Among Married-Couple Families in Marlboro
The poverty statistics for married-couple families in Marlboro show that 1.9% or 14 of the total 742 families live below the poverty line. Families with no children have the highest poverty rate of 2.6%, comprising of 14 families. On the other hand, families with 1 or 2 children have the lowest poverty rate of 0.0%, which includes 0 families.
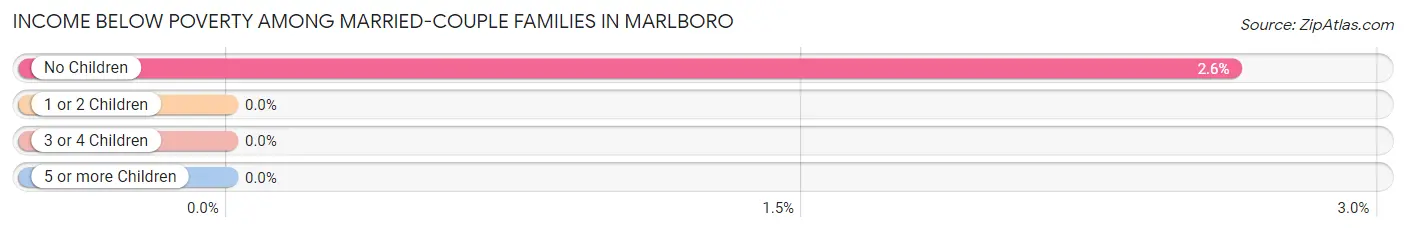
| Children | Above Poverty | Below Poverty |
| No Children | 521 (97.4%) | 14 (2.6%) |
| 1 or 2 Children | 153 (100.0%) | 0 (0.0%) |
| 3 or 4 Children | 54 (100.0%) | 0 (0.0%) |
| 5 or more Children | 0 (0.0%) | 0 (0.0%) |
| Total | 728 (98.1%) | 14 (1.9%) |
Income Below Poverty Among Single-Parent Households in Marlboro
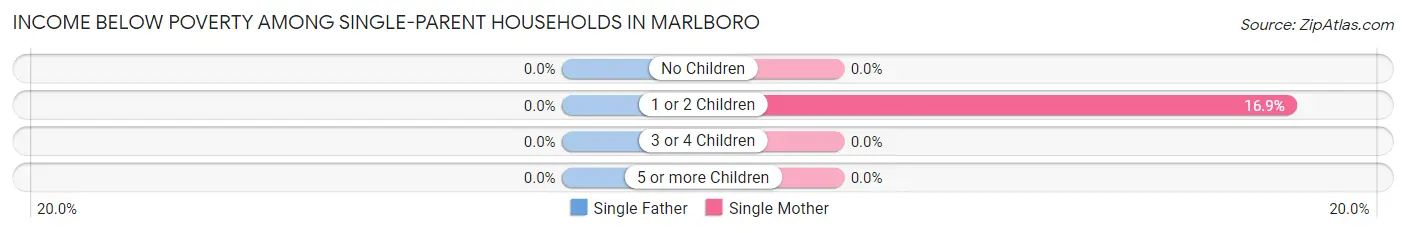
| Children | Single Father | Single Mother |
| No Children | 0 (0.0%) | 0 (0.0%) |
| 1 or 2 Children | 0 (0.0%) | 14 (16.9%) |
| 3 or 4 Children | 0 (0.0%) | 0 (0.0%) |
| 5 or more Children | 0 (0.0%) | 0 (0.0%) |
| Total | 0 (0.0%) | 14 (7.0%) |
Income Below Poverty Among Married-Couple vs Single-Parent Households in Marlboro
The poverty data for Marlboro shows that 14 of the married-couple family households (1.9%) and 14 of the single-parent households (5.6%) are living below the poverty level. Within the married-couple family households, those with no children have the highest poverty rate, with 14 households (2.6%) falling below the poverty line. Among the single-parent households, those with 1 or 2 children have the highest poverty rate, with 14 household (13.7%) living below poverty.
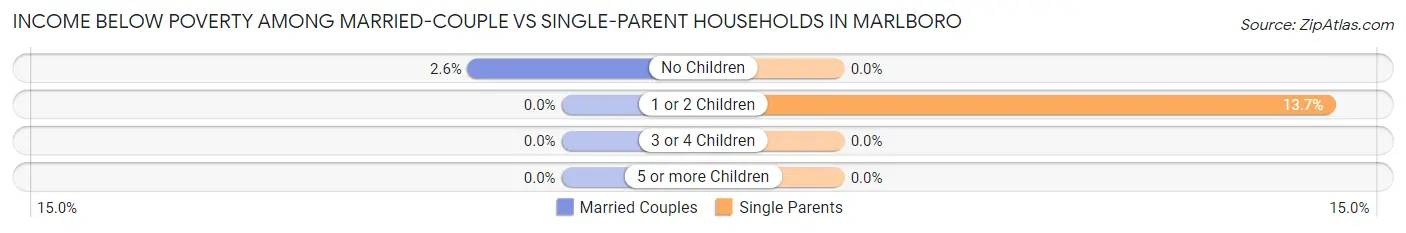
| Children | Married-Couple Families | Single-Parent Households |
| No Children | 14 (2.6%) | 0 (0.0%) |
| 1 or 2 Children | 0 (0.0%) | 14 (13.7%) |
| 3 or 4 Children | 0 (0.0%) | 0 (0.0%) |
| 5 or more Children | 0 (0.0%) | 0 (0.0%) |
| Total | 14 (1.9%) | 14 (5.6%) |
Race in Marlboro
The most populous races in Marlboro are White / Caucasian (3,275 | 90.1%), Hispanic or Latino (314 | 8.6%), and Two or more Races (310 | 8.5%).
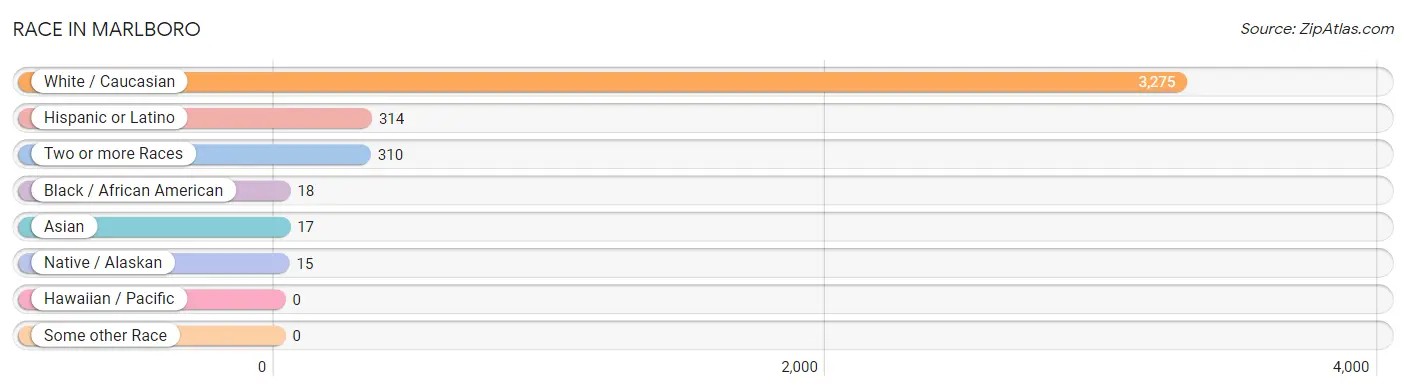
| Race | # Population | % Population |
| Asian | 17 | 0.5% |
| Black / African American | 18 | 0.5% |
| Hawaiian / Pacific | 0 | 0.0% |
| Hispanic or Latino | 314 | 8.6% |
| Native / Alaskan | 15 | 0.4% |
| White / Caucasian | 3,275 | 90.1% |
| Two or more Races | 310 | 8.5% |
| Some other Race | 0 | 0.0% |
| Total | 3,635 | 100.0% |
Ancestry in Marlboro
The most populous ancestries reported in Marlboro are Italian (1,389 | 38.2%), Irish (775 | 21.3%), English (317 | 8.7%), German (301 | 8.3%), and American (145 | 4.0%), together accounting for 80.5% of all Marlboro residents.
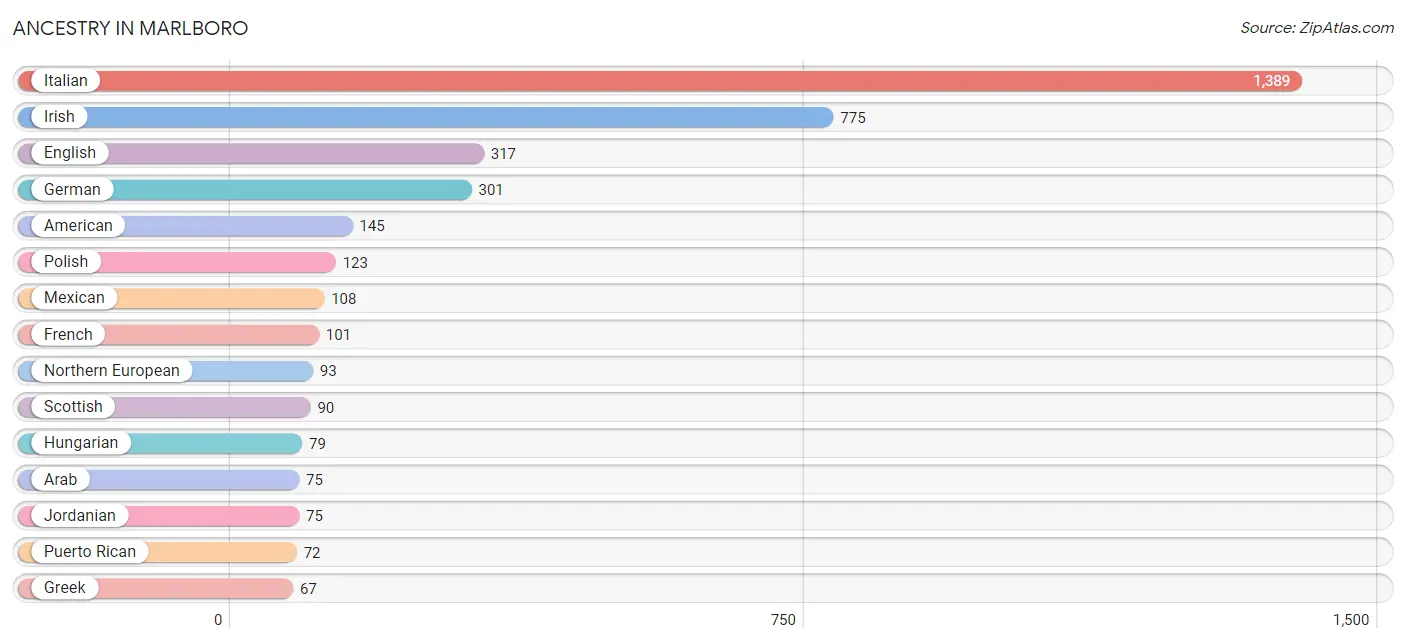
| Ancestry | # Population | % Population |
| American | 145 | 4.0% |
| Arab | 75 | 2.1% |
| Armenian | 14 | 0.4% |
| British | 30 | 0.8% |
| Central American | 23 | 0.6% |
| Colombian | 32 | 0.9% |
| Czech | 34 | 0.9% |
| Dominican | 32 | 0.9% |
| Dutch | 32 | 0.9% |
| English | 317 | 8.7% |
| European | 41 | 1.1% |
| French | 101 | 2.8% |
| French Canadian | 28 | 0.8% |
| German | 301 | 8.3% |
| Greek | 67 | 1.8% |
| Hungarian | 79 | 2.2% |
| Indian (Asian) | 16 | 0.4% |
| Irish | 775 | 21.3% |
| Italian | 1,389 | 38.2% |
| Jordanian | 75 | 2.1% |
| Korean | 1 | 0.0% |
| Mexican | 108 | 3.0% |
| Northern European | 93 | 2.6% |
| Norwegian | 19 | 0.5% |
| Peruvian | 34 | 0.9% |
| Polish | 123 | 3.4% |
| Puerto Rican | 72 | 2.0% |
| Russian | 40 | 1.1% |
| Salvadoran | 23 | 0.6% |
| Scandinavian | 30 | 0.8% |
| Scottish | 90 | 2.5% |
| Slovak | 34 | 0.9% |
| South American | 66 | 1.8% |
| South American Indian | 15 | 0.4% |
| Spanish | 13 | 0.4% |
| Ukrainian | 49 | 1.3% |
| Welsh | 9 | 0.3% | View All 37 Rows |
Immigrants in Marlboro
The most numerous immigrant groups reported in Marlboro came from Latin America (67 | 1.8%), Asia (45 | 1.2%), South America (44 | 1.2%), Colombia (32 | 0.9%), and Jordan (28 | 0.8%), together accounting for 5.9% of all Marlboro residents.
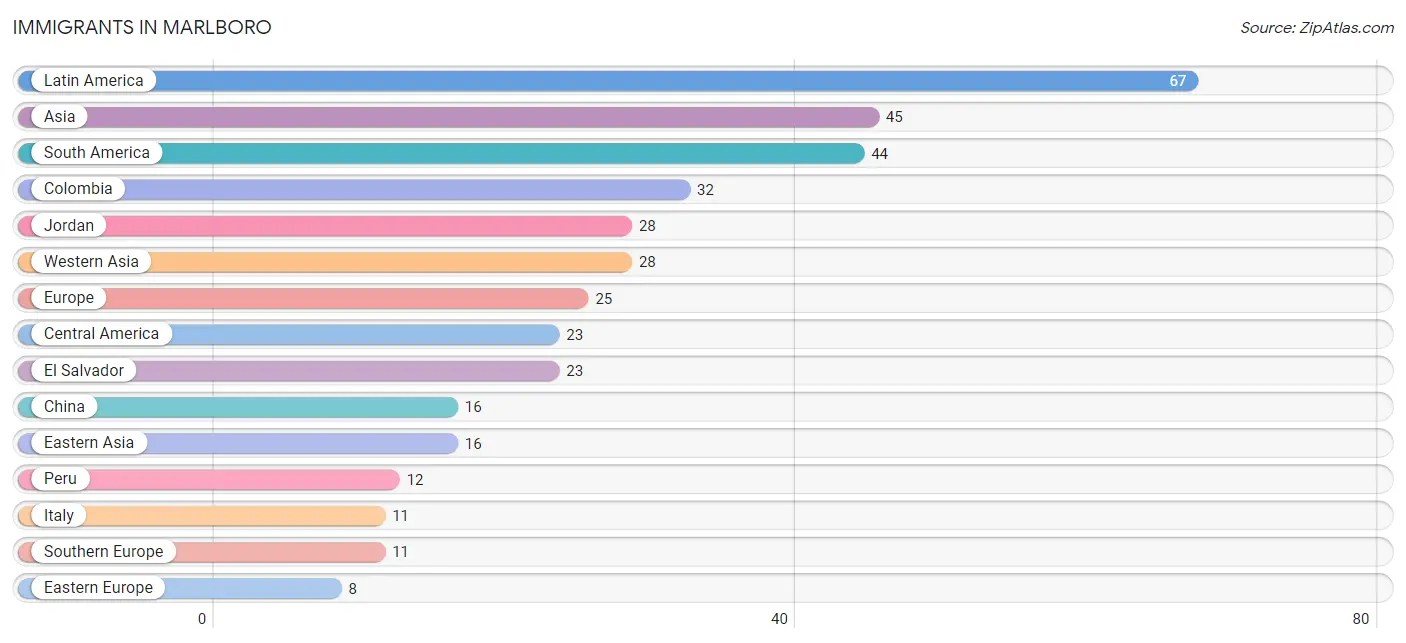
| Immigration Origin | # Population | % Population |
| Asia | 45 | 1.2% |
| Central America | 23 | 0.6% |
| China | 16 | 0.4% |
| Colombia | 32 | 0.9% |
| Eastern Asia | 16 | 0.4% |
| Eastern Europe | 8 | 0.2% |
| El Salvador | 23 | 0.6% |
| Europe | 25 | 0.7% |
| Italy | 11 | 0.3% |
| Jordan | 28 | 0.8% |
| Latin America | 67 | 1.8% |
| Northern Europe | 6 | 0.2% |
| Peru | 12 | 0.3% |
| Philippines | 1 | 0.0% |
| Poland | 8 | 0.2% |
| South America | 44 | 1.2% |
| South Eastern Asia | 1 | 0.0% |
| Southern Europe | 11 | 0.3% |
| Western Asia | 28 | 0.8% | View All 19 Rows |
Sex and Age in Marlboro
Sex and Age in Marlboro
The most populous age groups in Marlboro are 50 to 54 Years (193 | 11.3%) for men and 75 to 79 Years (195 | 10.2%) for women.
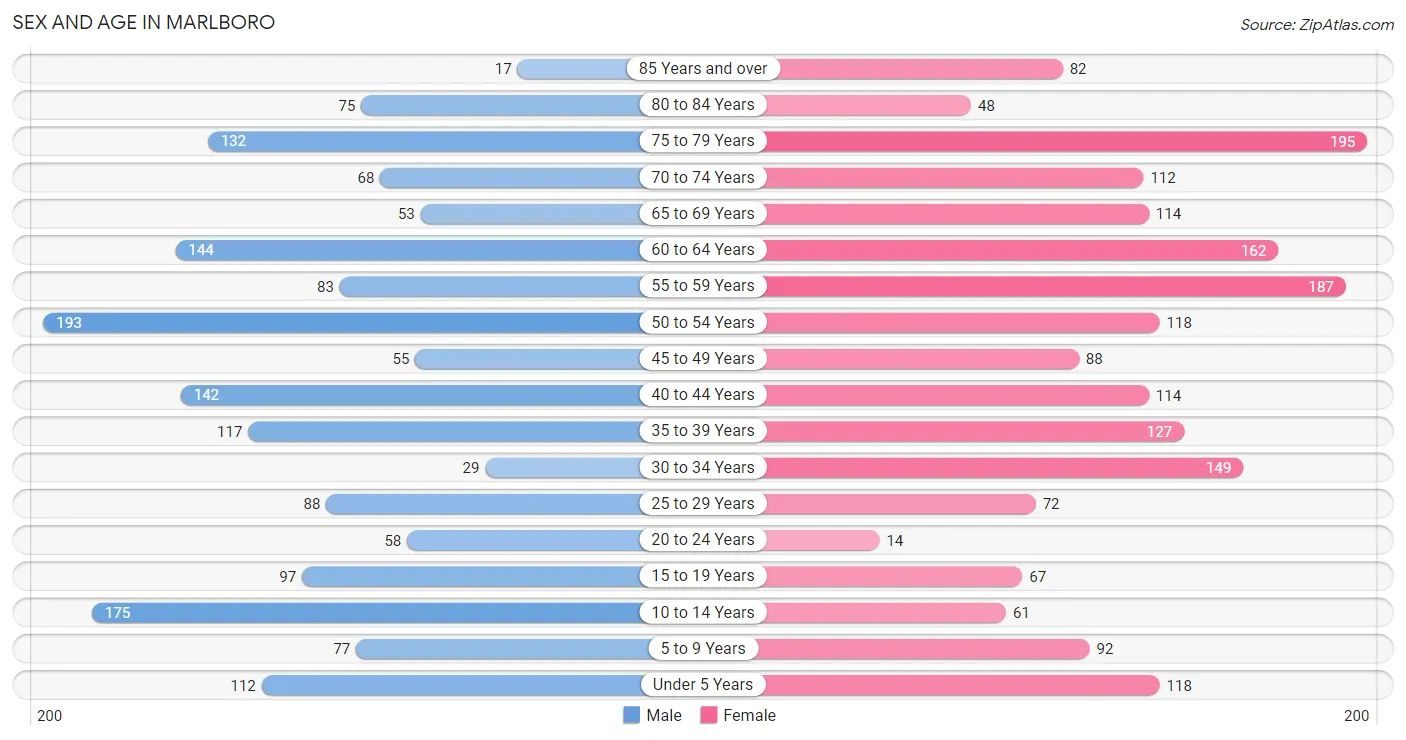
| Age Bracket | Male | Female |
| Under 5 Years | 112 (6.5%) | 118 (6.1%) |
| 5 to 9 Years | 77 (4.5%) | 92 (4.8%) |
| 10 to 14 Years | 175 (10.2%) | 61 (3.2%) |
| 15 to 19 Years | 97 (5.7%) | 67 (3.5%) |
| 20 to 24 Years | 58 (3.4%) | 14 (0.7%) |
| 25 to 29 Years | 88 (5.1%) | 72 (3.7%) |
| 30 to 34 Years | 29 (1.7%) | 149 (7.8%) |
| 35 to 39 Years | 117 (6.8%) | 127 (6.6%) |
| 40 to 44 Years | 142 (8.3%) | 114 (5.9%) |
| 45 to 49 Years | 55 (3.2%) | 88 (4.6%) |
| 50 to 54 Years | 193 (11.3%) | 118 (6.1%) |
| 55 to 59 Years | 83 (4.8%) | 187 (9.7%) |
| 60 to 64 Years | 144 (8.4%) | 162 (8.4%) |
| 65 to 69 Years | 53 (3.1%) | 114 (5.9%) |
| 70 to 74 Years | 68 (4.0%) | 112 (5.8%) |
| 75 to 79 Years | 132 (7.7%) | 195 (10.2%) |
| 80 to 84 Years | 75 (4.4%) | 48 (2.5%) |
| 85 Years and over | 17 (1.0%) | 82 (4.3%) |
| Total | 1,715 (100.0%) | 1,920 (100.0%) |
Families and Households in Marlboro
Median Family Size in Marlboro
The median family size in Marlboro is 2.93 persons per family, with single male/father families (49 | 4.9%) accounting for the largest median family size of 3 persons per family. On the other hand, single female/mother families (201 | 20.3%) represent the smallest median family size with 2.74 persons per family.
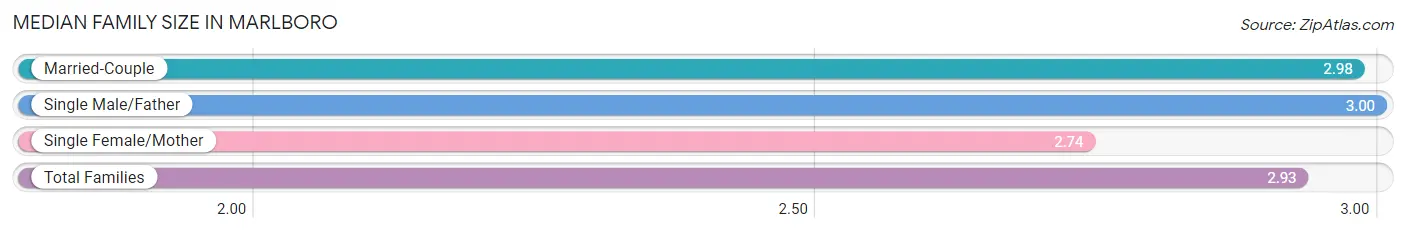
| Family Type | # Families | Family Size |
| Married-Couple | 742 (74.8%) | 2.98 |
| Single Male/Father | 49 (4.9%) | 3.00 |
| Single Female/Mother | 201 (20.3%) | 2.74 |
| Total Families | 992 (100.0%) | 2.93 |
Median Household Size in Marlboro
The median household size in Marlboro is 2.40 persons per household, with single male/father households (49 | 3.2%) accounting for the largest median household size of 3.2 persons per household. non-family households (525 | 34.6%) represent the smallest median household size with 1.18 persons per household.
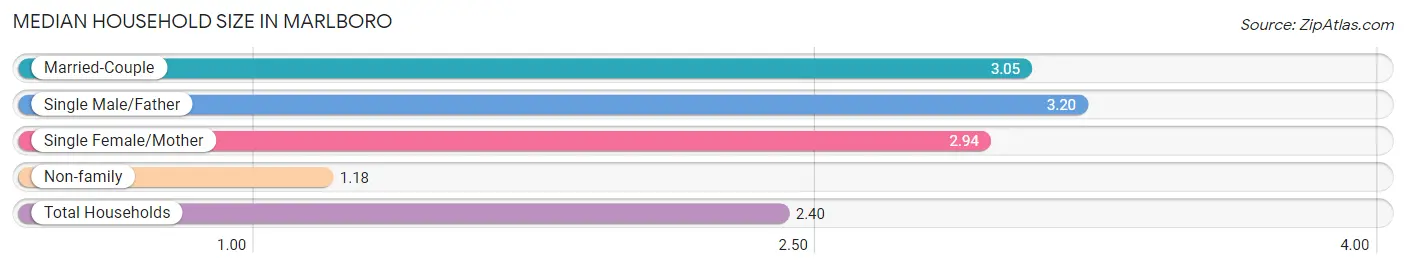
| Household Type | # Households | Household Size |
| Married-Couple | 742 (48.9%) | 3.05 |
| Single Male/Father | 49 (3.2%) | 3.20 |
| Single Female/Mother | 201 (13.3%) | 2.94 |
| Non-family | 525 (34.6%) | 1.18 |
| Total Households | 1,517 (100.0%) | 2.40 |
Household Size by Marriage Status in Marlboro
Out of a total of 1,517 households in Marlboro, 992 (65.4%) are family households, while 525 (34.6%) are nonfamily households. The most numerous type of family households are 2-person households, comprising 525, and the most common type of nonfamily households are 1-person households, comprising 426.
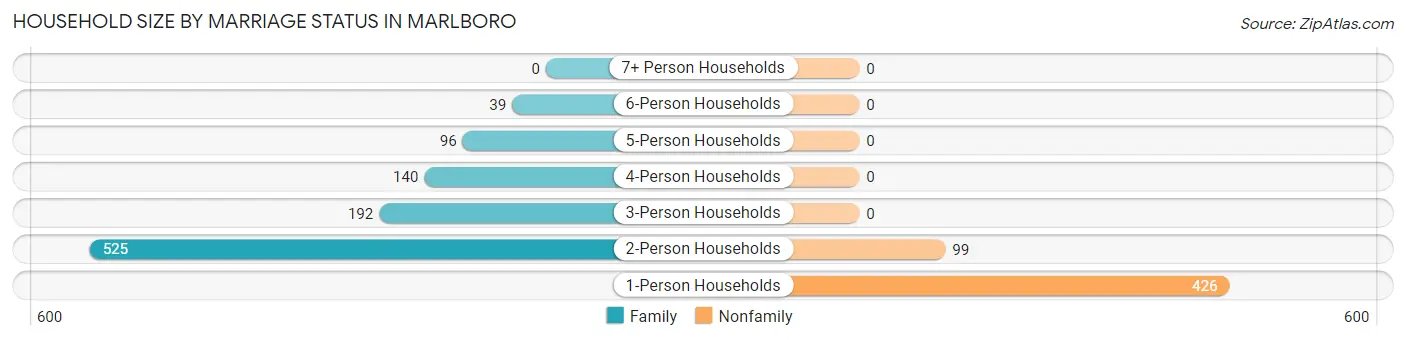
| Household Size | Family Households | Nonfamily Households |
| 1-Person Households | - | 426 (28.1%) |
| 2-Person Households | 525 (34.6%) | 99 (6.5%) |
| 3-Person Households | 192 (12.7%) | 0 (0.0%) |
| 4-Person Households | 140 (9.2%) | 0 (0.0%) |
| 5-Person Households | 96 (6.3%) | 0 (0.0%) |
| 6-Person Households | 39 (2.6%) | 0 (0.0%) |
| 7+ Person Households | 0 (0.0%) | 0 (0.0%) |
| Total | 992 (65.4%) | 525 (34.6%) |
Female Fertility in Marlboro
Fertility by Age in Marlboro
Average fertility rate in Marlboro is 52.0 births per 1,000 women. Women in the age bracket of 20 to 34 years have the highest fertility rate with 94.0 births per 1,000 women. Women in the age bracket of 20 to 34 years acount for 66.7% of all women with births.
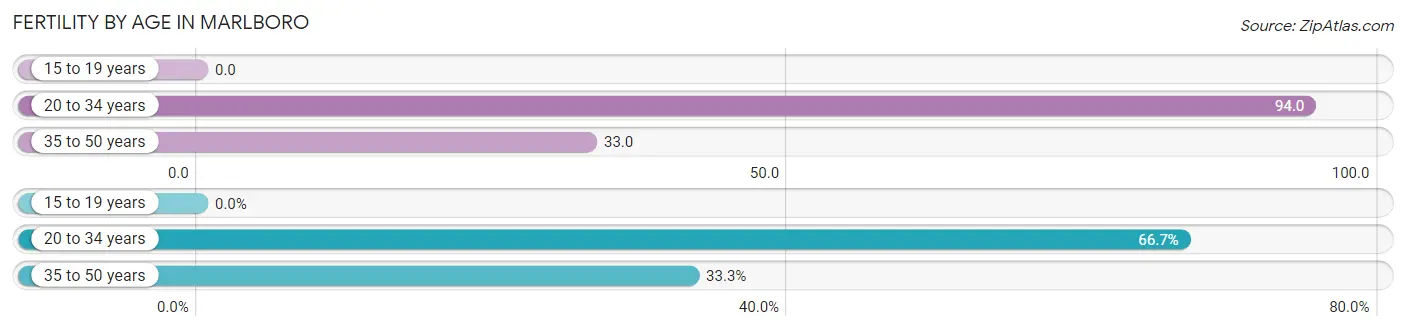
| Age Bracket | Women with Births | Births / 1,000 Women |
| 15 to 19 years | 0 (0.0%) | 0.0 |
| 20 to 34 years | 22 (66.7%) | 94.0 |
| 35 to 50 years | 11 (33.3%) | 33.0 |
| Total | 33 (100.0%) | 52.0 |
Fertility by Age by Marriage Status in Marlboro
69.7% of women with births (33) in Marlboro are married. The highest percentage of unmarried women with births falls into 20 to 34 years age bracket with 45.5% of them unmarried at the time of birth, while the lowest percentage of unmarried women with births belong to 35 to 50 years age bracket with 0.0% of them unmarried.
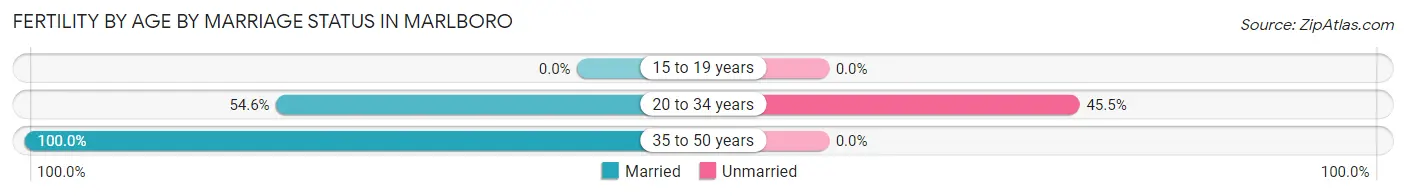
| Age Bracket | Married | Unmarried |
| 15 to 19 years | 0 (0.0%) | 0 (0.0%) |
| 20 to 34 years | 12 (54.5%) | 10 (45.5%) |
| 35 to 50 years | 11 (100.0%) | 0 (0.0%) |
| Total | 23 (69.7%) | 10 (30.3%) |
Fertility by Education in Marlboro

| Educational Attainment | Women with Births | Births / 1,000 Women |
| Less than High School | 0 (0.0%) | 0.0 |
| High School Diploma | 0 (0.0%) | 0.0 |
| College or Associate's Degree | 12 (36.4%) | 101.0 |
| Bachelor's Degree | 21 (63.6%) | 108.0 |
| Graduate Degree | 0 (0.0%) | 0.0 |
| Total | 33 (100.0%) | 52.0 |
Fertility by Education by Marriage Status in Marlboro
30.3% of women with births in Marlboro are unmarried. Women with the educational attainment of college or associate's degree are most likely to be married with 100.0% of them married at childbirth, while women with the educational attainment of bachelor's degree are least likely to be married with 47.6% of them unmarried at childbirth.
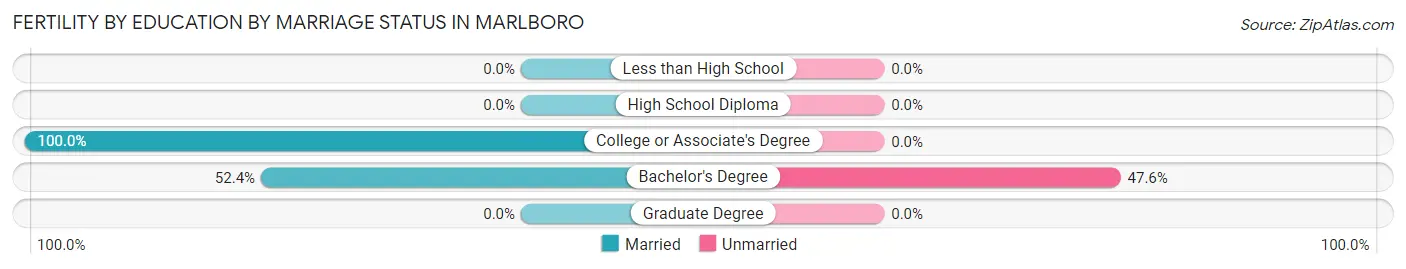
| Educational Attainment | Married | Unmarried |
| Less than High School | 0 (0.0%) | 0 (0.0%) |
| High School Diploma | 0 (0.0%) | 0 (0.0%) |
| College or Associate's Degree | 12 (100.0%) | 0 (0.0%) |
| Bachelor's Degree | 11 (52.4%) | 10 (47.6%) |
| Graduate Degree | 0 (0.0%) | 0 (0.0%) |
| Total | 23 (69.7%) | 10 (30.3%) |
Employment Characteristics in Marlboro
Employment by Class of Employer in Marlboro
Among the 1,752 employed individuals in Marlboro, private company employees (896 | 51.1%), not-for-profit organizations (276 | 15.8%), and local government employees (233 | 13.3%) make up the most common classes of employment.
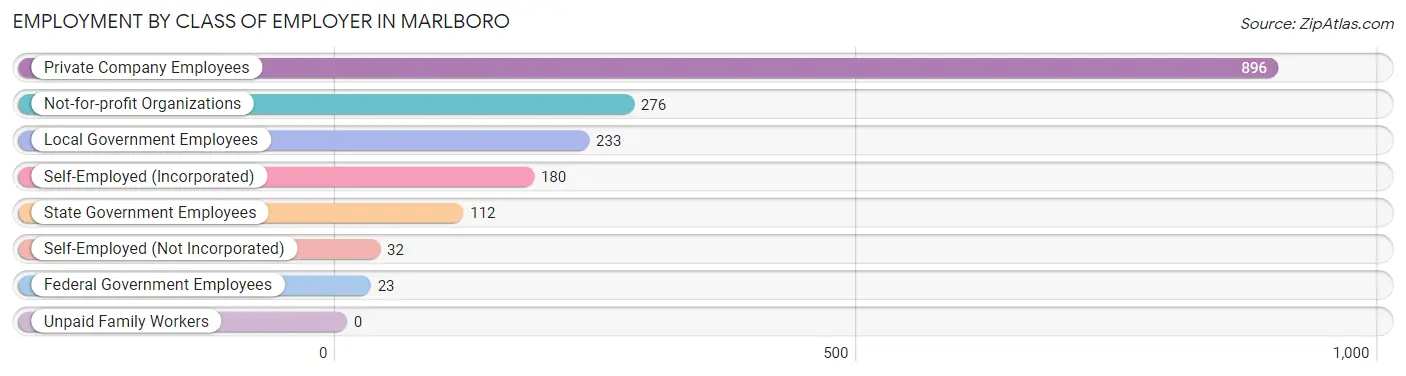
| Employer Class | # Employees | % Employees |
| Private Company Employees | 896 | 51.1% |
| Self-Employed (Incorporated) | 180 | 10.3% |
| Self-Employed (Not Incorporated) | 32 | 1.8% |
| Not-for-profit Organizations | 276 | 15.8% |
| Local Government Employees | 233 | 13.3% |
| State Government Employees | 112 | 6.4% |
| Federal Government Employees | 23 | 1.3% |
| Unpaid Family Workers | 0 | 0.0% |
| Total | 1,752 | 100.0% |
Employment Status by Age in Marlboro
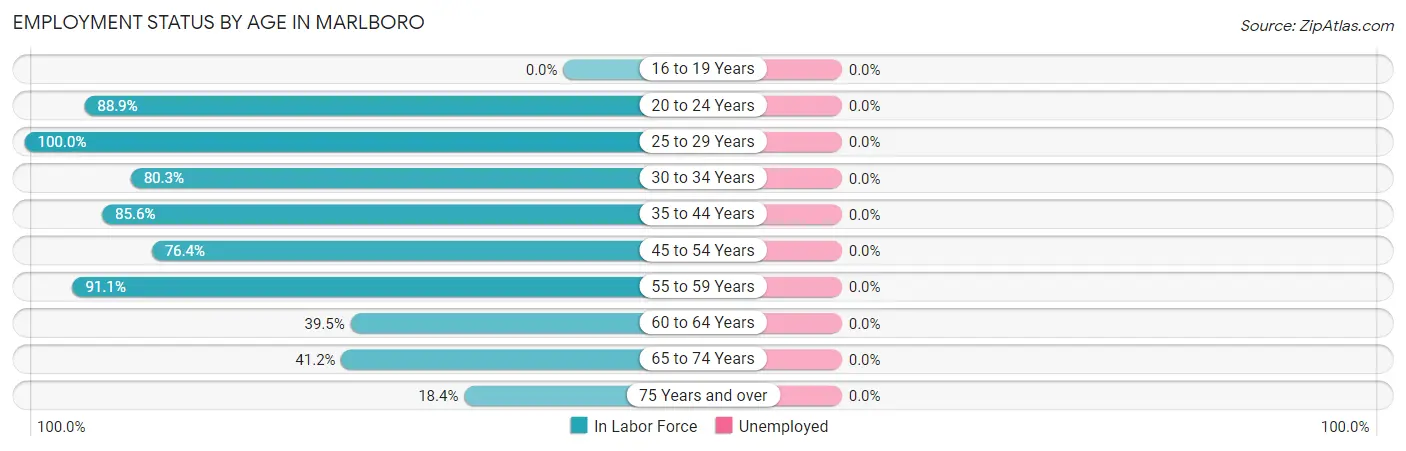
| Age Bracket | In Labor Force | Unemployed |
| 16 to 19 Years | 0 (0.0%) | 0 (0.0%) |
| 20 to 24 Years | 64 (88.9%) | 0 (0.0%) |
| 25 to 29 Years | 160 (100.0%) | 0 (0.0%) |
| 30 to 34 Years | 143 (80.3%) | 0 (0.0%) |
| 35 to 44 Years | 428 (85.6%) | 0 (0.0%) |
| 45 to 54 Years | 347 (76.4%) | 0 (0.0%) |
| 55 to 59 Years | 246 (91.1%) | 0 (0.0%) |
| 60 to 64 Years | 121 (39.5%) | 0 (0.0%) |
| 65 to 74 Years | 143 (41.2%) | 0 (0.0%) |
| 75 Years and over | 101 (18.4%) | 0 (0.0%) |
| Total | 1,752 (58.4%) | 0 (0.0%) |
Employment Status by Educational Attainment in Marlboro
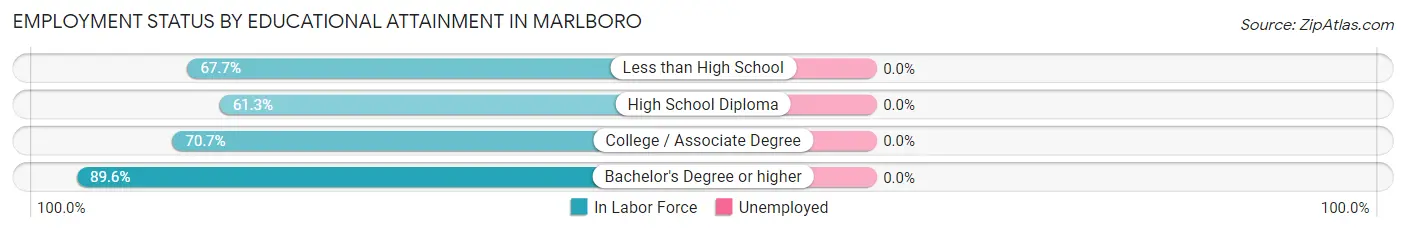
| Educational Attainment | In Labor Force | Unemployed |
| Less than High School | 44 (67.7%) | 0 (0.0%) |
| High School Diploma | 272 (61.3%) | 0 (0.0%) |
| College / Associate Degree | 331 (70.7%) | 0 (0.0%) |
| Bachelor's Degree or higher | 798 (89.6%) | 0 (0.0%) |
| Total | 1,446 (77.4%) | 0 (0.0%) |
Employment Occupations by Sex in Marlboro
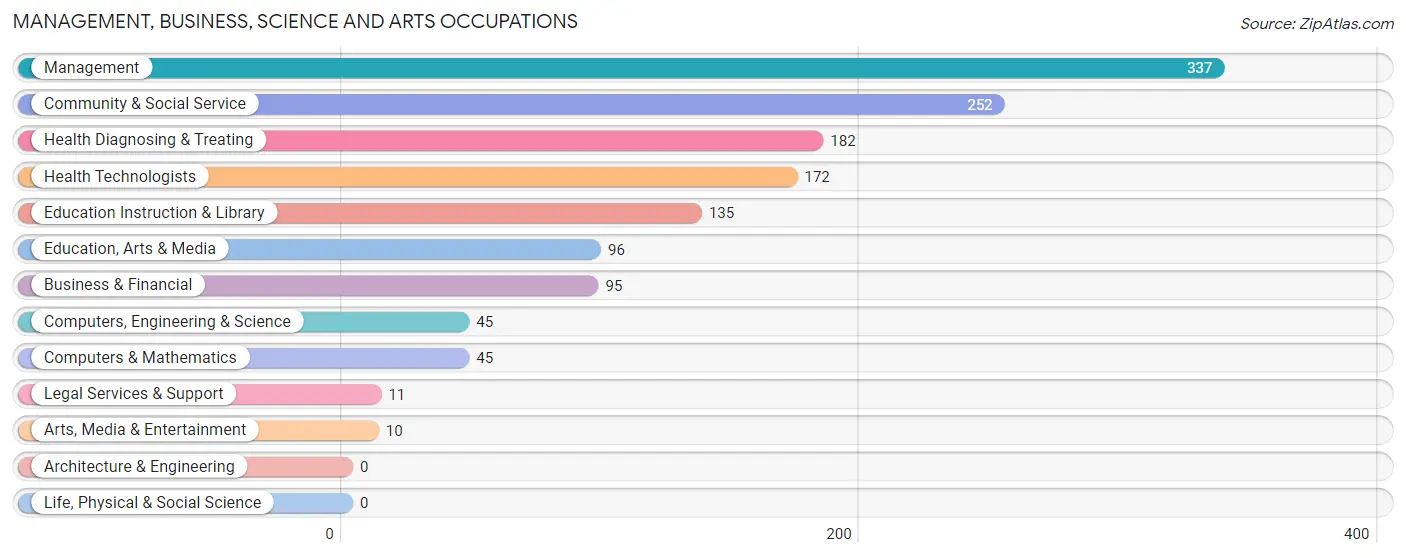
Management, Business, Science and Arts Occupations
The most common Management, Business, Science and Arts occupations in Marlboro are Management (337 | 19.2%), Community & Social Service (252 | 14.4%), Health Diagnosing & Treating (182 | 10.4%), Health Technologists (172 | 9.8%), and Education Instruction & Library (135 | 7.7%).
Management, Business, Science and Arts Occupations by Sex
Within the Management, Business, Science and Arts occupations in Marlboro, the most male-oriented occupations are Legal Services & Support (100.0%), Arts, Media & Entertainment (100.0%), and Management (61.7%), while the most female-oriented occupations are Health Technologists (92.4%), Education Instruction & Library (87.4%), and Health Diagnosing & Treating (87.4%).
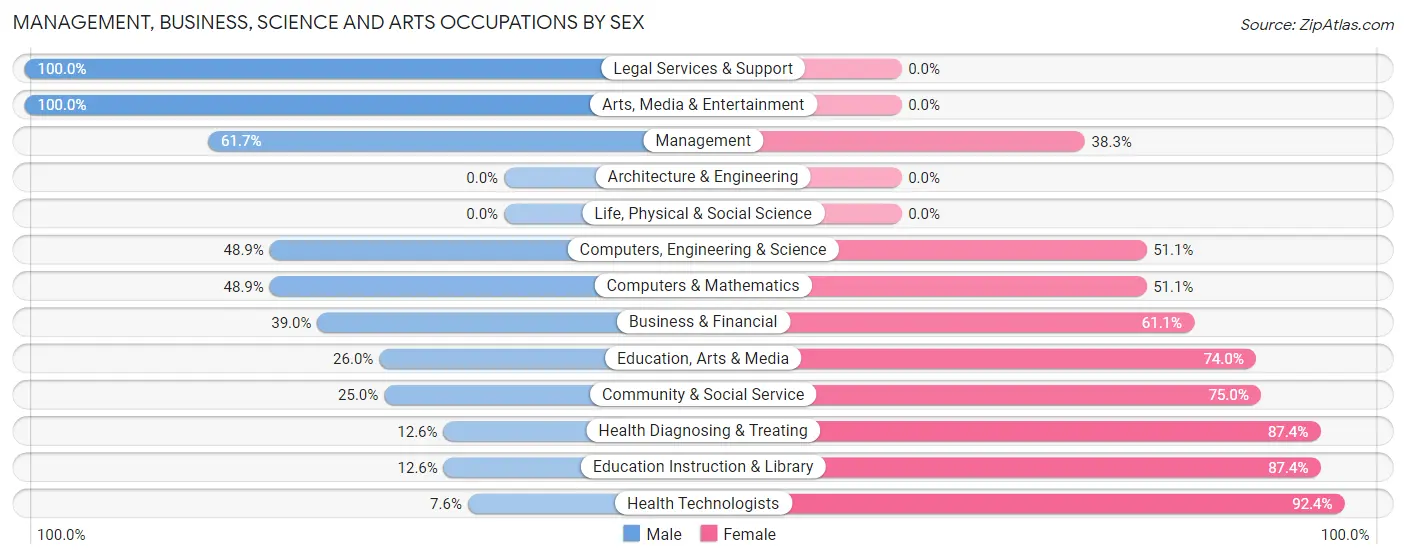
| Occupation | Male | Female |
| Management | 208 (61.7%) | 129 (38.3%) |
| Business & Financial | 37 (39.0%) | 58 (61.1%) |
| Computers, Engineering & Science | 22 (48.9%) | 23 (51.1%) |
| Computers & Mathematics | 22 (48.9%) | 23 (51.1%) |
| Architecture & Engineering | 0 (0.0%) | 0 (0.0%) |
| Life, Physical & Social Science | 0 (0.0%) | 0 (0.0%) |
| Community & Social Service | 63 (25.0%) | 189 (75.0%) |
| Education, Arts & Media | 25 (26.0%) | 71 (74.0%) |
| Legal Services & Support | 11 (100.0%) | 0 (0.0%) |
| Education Instruction & Library | 17 (12.6%) | 118 (87.4%) |
| Arts, Media & Entertainment | 10 (100.0%) | 0 (0.0%) |
| Health Diagnosing & Treating | 23 (12.6%) | 159 (87.4%) |
| Health Technologists | 13 (7.6%) | 159 (92.4%) |
| Total (Category) | 353 (38.8%) | 558 (61.3%) |
| Total (Overall) | 918 (52.4%) | 835 (47.6%) |
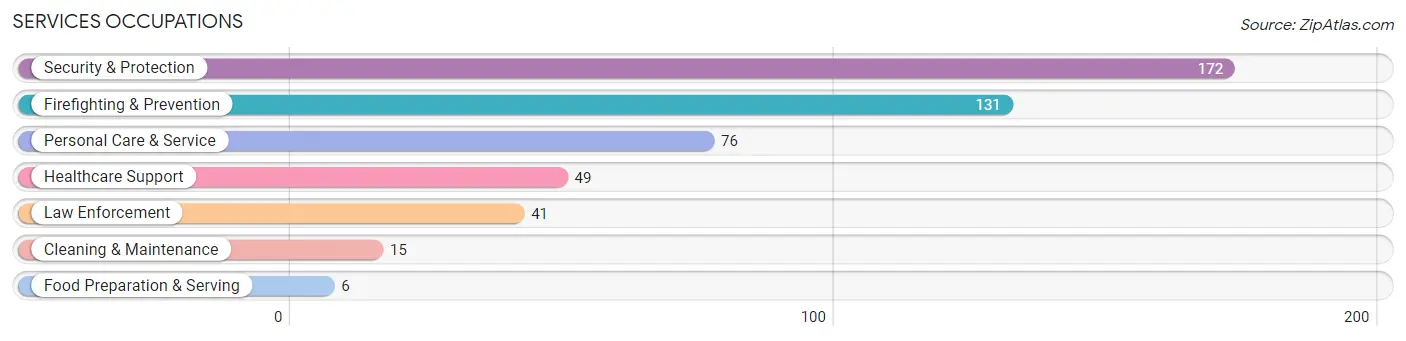
Services Occupations
The most common Services occupations in Marlboro are Security & Protection (172 | 9.8%), Firefighting & Prevention (131 | 7.5%), Personal Care & Service (76 | 4.3%), Healthcare Support (49 | 2.8%), and Law Enforcement (41 | 2.3%).
Services Occupations by Sex
Within the Services occupations in Marlboro, the most male-oriented occupations are Security & Protection (100.0%), Firefighting & Prevention (100.0%), and Law Enforcement (100.0%), while the most female-oriented occupations are Healthcare Support (100.0%), Food Preparation & Serving (100.0%), and Personal Care & Service (80.3%).
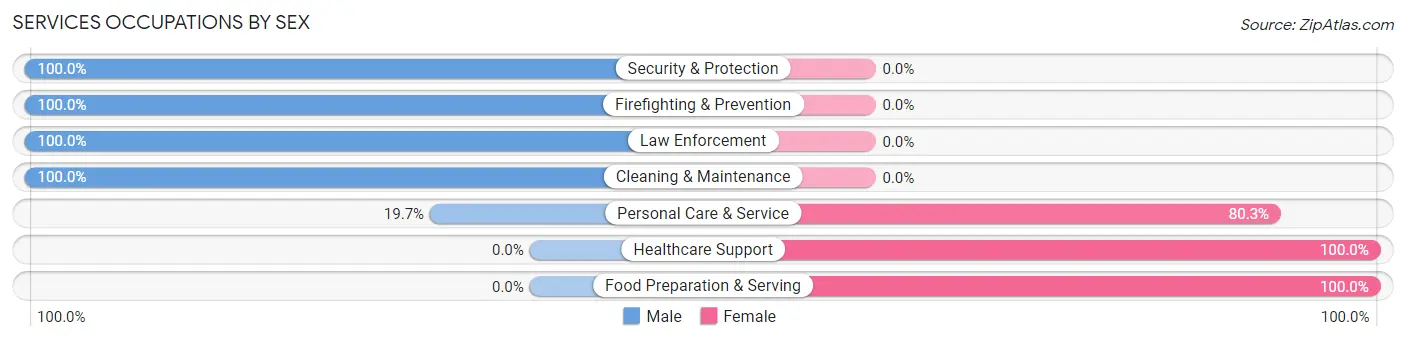
| Occupation | Male | Female |
| Healthcare Support | 0 (0.0%) | 49 (100.0%) |
| Security & Protection | 172 (100.0%) | 0 (0.0%) |
| Firefighting & Prevention | 131 (100.0%) | 0 (0.0%) |
| Law Enforcement | 41 (100.0%) | 0 (0.0%) |
| Food Preparation & Serving | 0 (0.0%) | 6 (100.0%) |
| Cleaning & Maintenance | 15 (100.0%) | 0 (0.0%) |
| Personal Care & Service | 15 (19.7%) | 61 (80.3%) |
| Total (Category) | 202 (63.5%) | 116 (36.5%) |
| Total (Overall) | 918 (52.4%) | 835 (47.6%) |
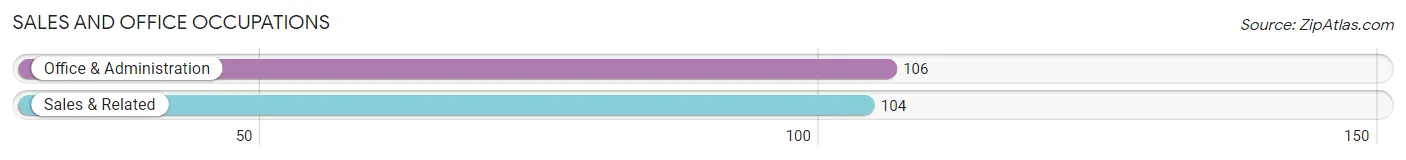
Sales and Office Occupations
The most common Sales and Office occupations in Marlboro are Office & Administration (106 | 6.0%), and Sales & Related (104 | 5.9%).
Sales and Office Occupations by Sex
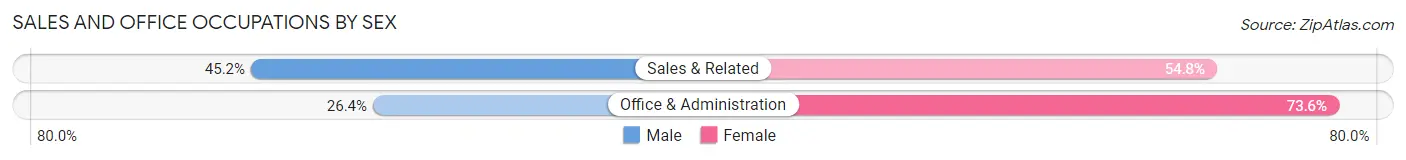
| Occupation | Male | Female |
| Sales & Related | 47 (45.2%) | 57 (54.8%) |
| Office & Administration | 28 (26.4%) | 78 (73.6%) |
| Total (Category) | 75 (35.7%) | 135 (64.3%) |
| Total (Overall) | 918 (52.4%) | 835 (47.6%) |
Natural Resources, Construction and Maintenance Occupations
The most common Natural Resources, Construction and Maintenance occupations in Marlboro are Construction & Extraction (101 | 5.8%), and Installation, Maintenance & Repair (90 | 5.1%).
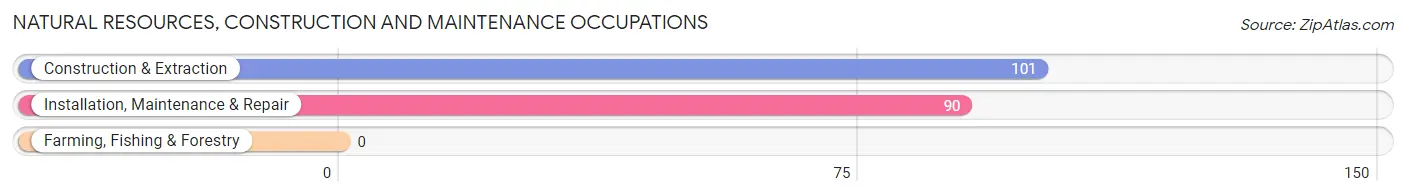
Natural Resources, Construction and Maintenance Occupations by Sex
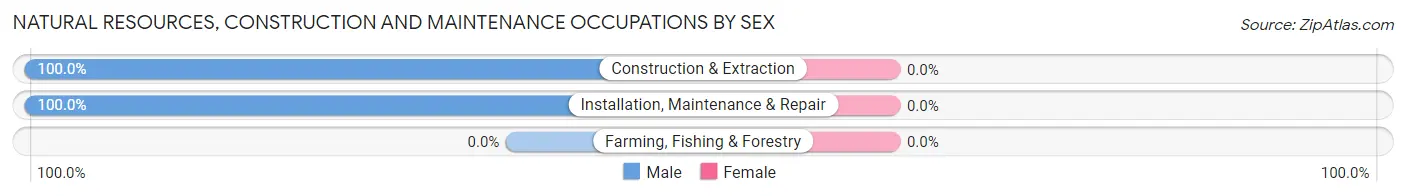
| Occupation | Male | Female |
| Farming, Fishing & Forestry | 0 (0.0%) | 0 (0.0%) |
| Construction & Extraction | 101 (100.0%) | 0 (0.0%) |
| Installation, Maintenance & Repair | 90 (100.0%) | 0 (0.0%) |
| Total (Category) | 191 (100.0%) | 0 (0.0%) |
| Total (Overall) | 918 (52.4%) | 835 (47.6%) |
Production, Transportation and Moving Occupations
The most common Production, Transportation and Moving occupations in Marlboro are Transportation (73 | 4.2%), Material Moving (35 | 2.0%), and Production (15 | 0.9%).
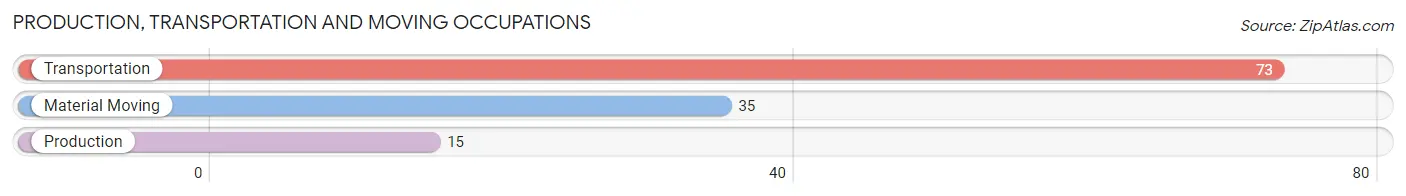
Production, Transportation and Moving Occupations by Sex
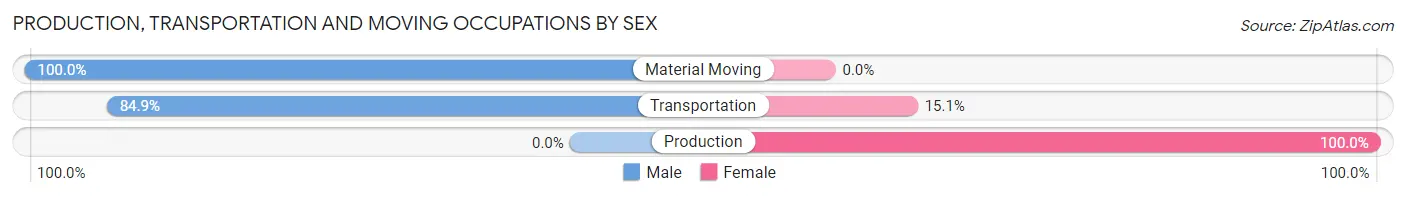
| Occupation | Male | Female |
| Production | 0 (0.0%) | 15 (100.0%) |
| Transportation | 62 (84.9%) | 11 (15.1%) |
| Material Moving | 35 (100.0%) | 0 (0.0%) |
| Total (Category) | 97 (78.9%) | 26 (21.1%) |
| Total (Overall) | 918 (52.4%) | 835 (47.6%) |
Employment Industries by Sex in Marlboro
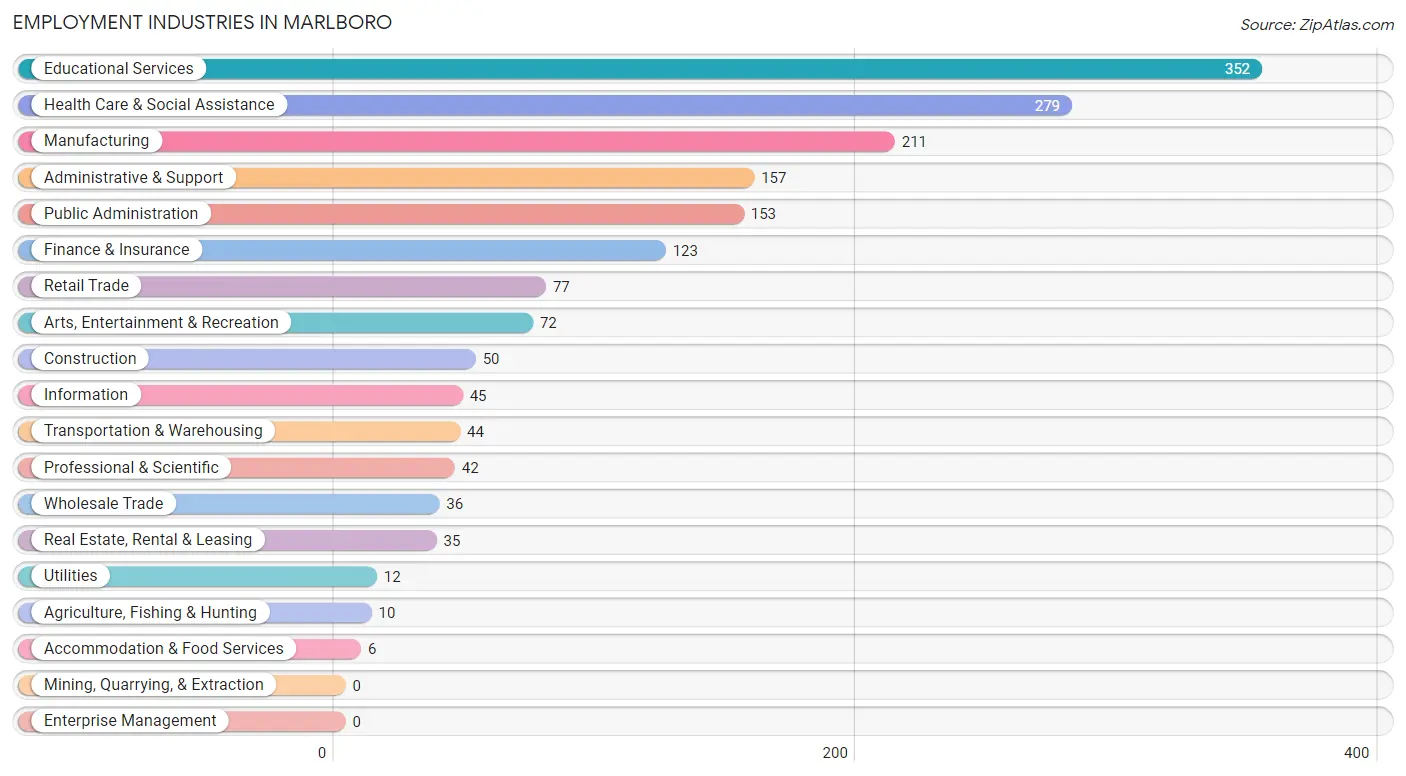
Employment Industries in Marlboro
The major employment industries in Marlboro include Educational Services (352 | 20.1%), Health Care & Social Assistance (279 | 15.9%), Manufacturing (211 | 12.0%), Administrative & Support (157 | 9.0%), and Public Administration (153 | 8.7%).
Employment Industries by Sex in Marlboro
The Marlboro industries that see more men than women are Construction (100.0%), Utilities (100.0%), and Professional & Scientific (100.0%), whereas the industries that tend to have a higher number of women are Agriculture, Fishing & Hunting (100.0%), Accommodation & Food Services (100.0%), and Health Care & Social Assistance (79.9%).
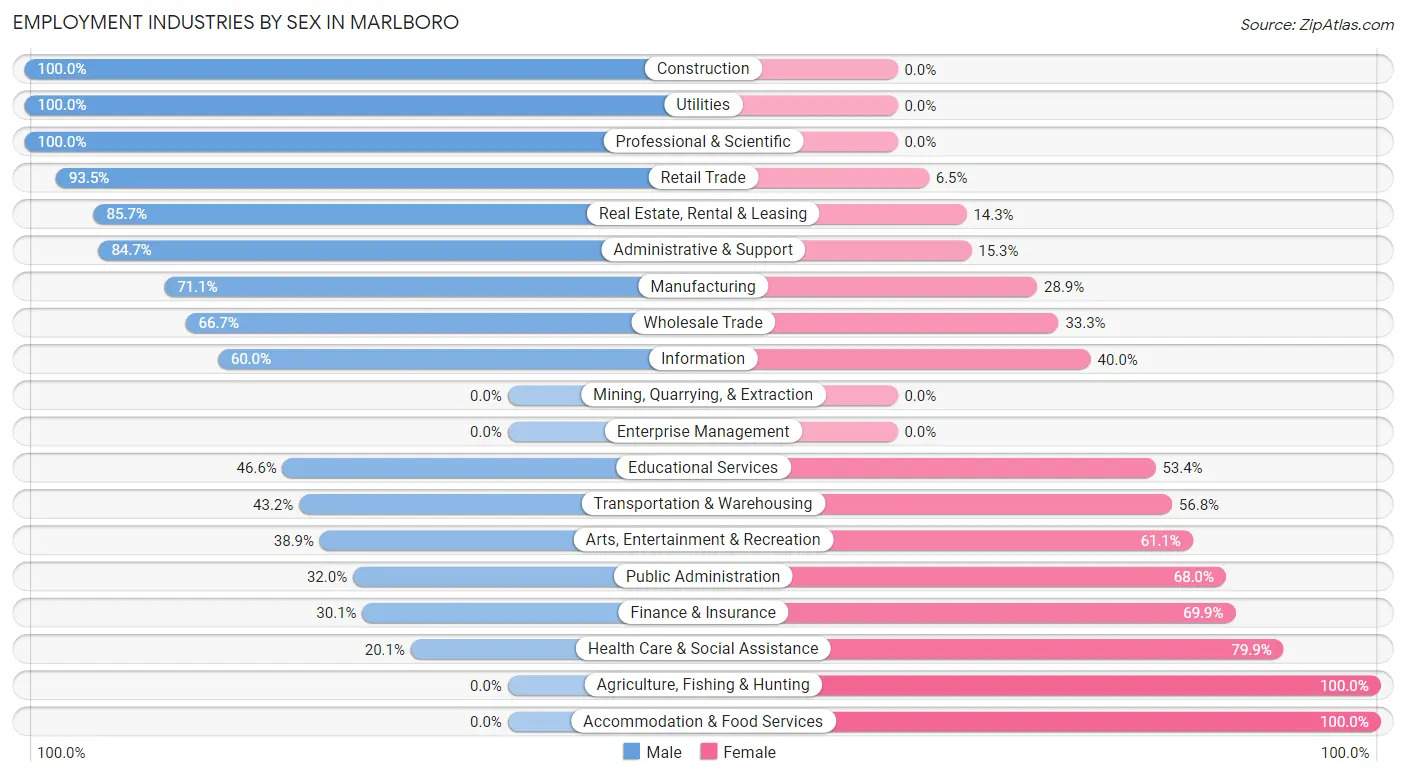
| Industry | Male | Female |
| Agriculture, Fishing & Hunting | 0 (0.0%) | 10 (100.0%) |
| Mining, Quarrying, & Extraction | 0 (0.0%) | 0 (0.0%) |
| Construction | 50 (100.0%) | 0 (0.0%) |
| Manufacturing | 150 (71.1%) | 61 (28.9%) |
| Wholesale Trade | 24 (66.7%) | 12 (33.3%) |
| Retail Trade | 72 (93.5%) | 5 (6.5%) |
| Transportation & Warehousing | 19 (43.2%) | 25 (56.8%) |
| Utilities | 12 (100.0%) | 0 (0.0%) |
| Information | 27 (60.0%) | 18 (40.0%) |
| Finance & Insurance | 37 (30.1%) | 86 (69.9%) |
| Real Estate, Rental & Leasing | 30 (85.7%) | 5 (14.3%) |
| Professional & Scientific | 42 (100.0%) | 0 (0.0%) |
| Enterprise Management | 0 (0.0%) | 0 (0.0%) |
| Administrative & Support | 133 (84.7%) | 24 (15.3%) |
| Educational Services | 164 (46.6%) | 188 (53.4%) |
| Health Care & Social Assistance | 56 (20.1%) | 223 (79.9%) |
| Arts, Entertainment & Recreation | 28 (38.9%) | 44 (61.1%) |
| Accommodation & Food Services | 0 (0.0%) | 6 (100.0%) |
| Public Administration | 49 (32.0%) | 104 (68.0%) |
| Total | 918 (52.4%) | 835 (47.6%) |
Education in Marlboro
School Enrollment in Marlboro
The most common levels of schooling among the 647 students in Marlboro are middle school (223 | 34.5%), high school (133 | 20.6%), and elementary school (123 | 19.0%).
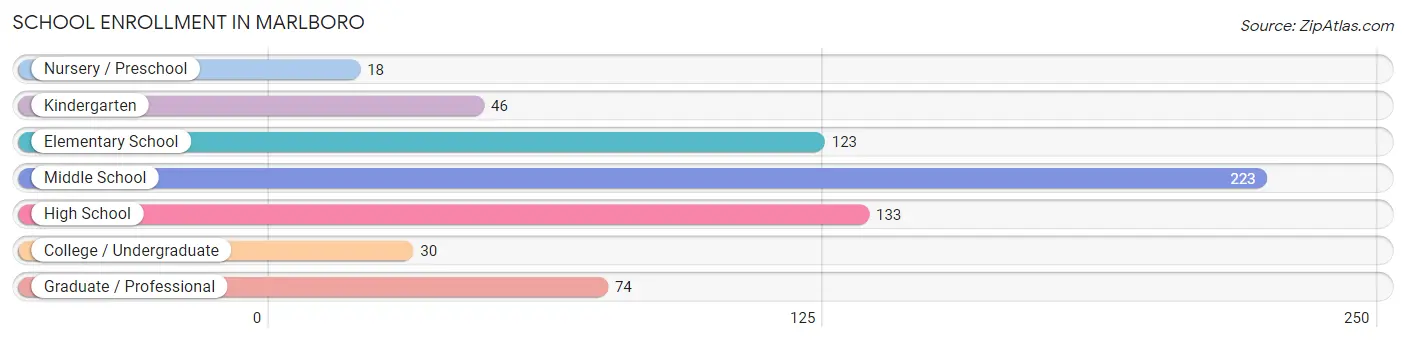
| School Level | # Students | % Students |
| Nursery / Preschool | 18 | 2.8% |
| Kindergarten | 46 | 7.1% |
| Elementary School | 123 | 19.0% |
| Middle School | 223 | 34.5% |
| High School | 133 | 20.6% |
| College / Undergraduate | 30 | 4.6% |
| Graduate / Professional | 74 | 11.4% |
| Total | 647 | 100.0% |
School Enrollment by Age by Funding Source in Marlboro
Out of a total of 647 students who are enrolled in schools in Marlboro, 18 (2.8%) attend a private institution, while the remaining 629 (97.2%) are enrolled in public schools. The age group of 3 to 4 year olds has the highest likelihood of being enrolled in private schools, with 18 (100.0% in the age bracket) enrolled. Conversely, the age group of 5 to 9 year old has the lowest likelihood of being enrolled in a private school, with 169 (100.0% in the age bracket) attending a public institution.
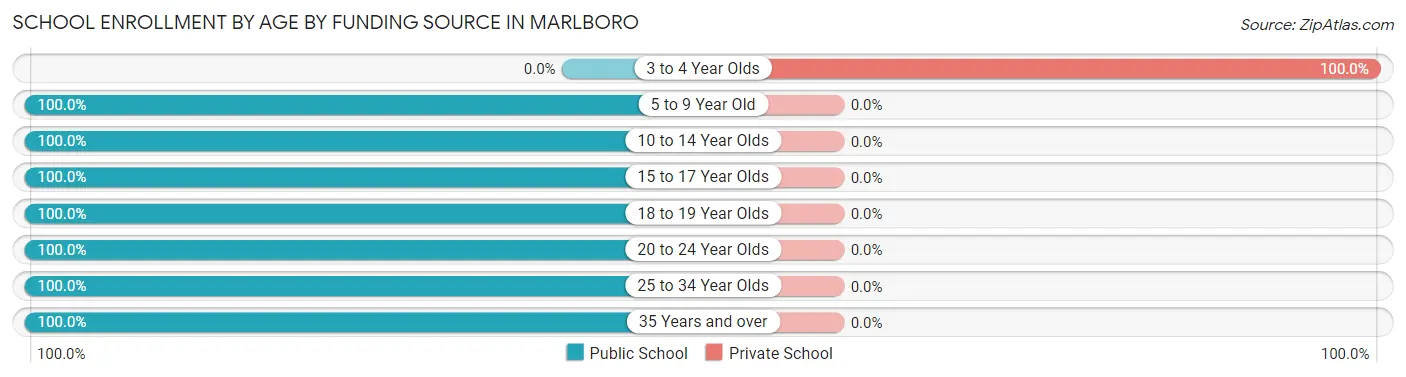
| Age Bracket | Public School | Private School |
| 3 to 4 Year Olds | 0 (0.0%) | 18 (100.0%) |
| 5 to 9 Year Old | 169 (100.0%) | 0 (0.0%) |
| 10 to 14 Year Olds | 236 (100.0%) | 0 (0.0%) |
| 15 to 17 Year Olds | 86 (100.0%) | 0 (0.0%) |
| 18 to 19 Year Olds | 53 (100.0%) | 0 (0.0%) |
| 20 to 24 Year Olds | 42 (100.0%) | 0 (0.0%) |
| 25 to 34 Year Olds | 33 (100.0%) | 0 (0.0%) |
| 35 Years and over | 10 (100.0%) | 0 (0.0%) |
| Total | 629 (97.2%) | 18 (2.8%) |
Educational Attainment by Field of Study in Marlboro
Business (256 | 17.9%), education (196 | 13.7%), physical & health sciences (131 | 9.1%), science & technology (122 | 8.5%), and bio, nature & agricultural (117 | 8.2%) are the most common fields of study among 1,433 individuals in Marlboro who have obtained a bachelor's degree or higher.
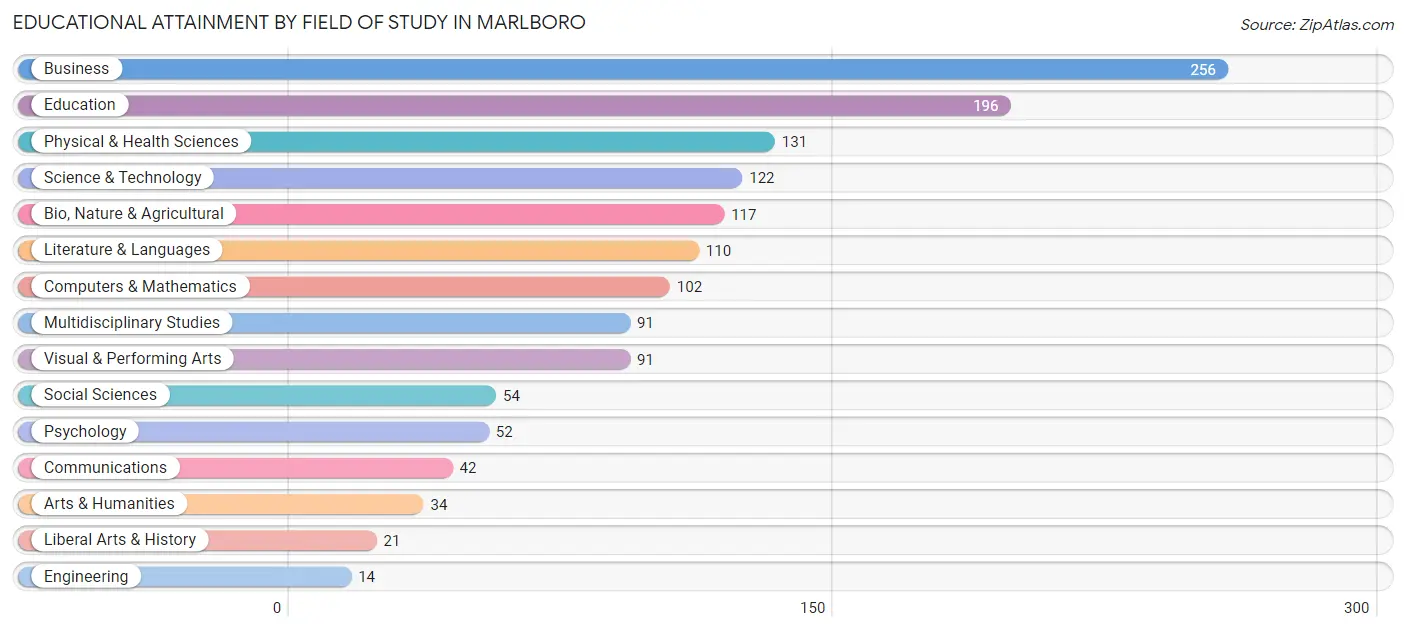
| Field of Study | # Graduates | % Graduates |
| Computers & Mathematics | 102 | 7.1% |
| Bio, Nature & Agricultural | 117 | 8.2% |
| Physical & Health Sciences | 131 | 9.1% |
| Psychology | 52 | 3.6% |
| Social Sciences | 54 | 3.8% |
| Engineering | 14 | 1.0% |
| Multidisciplinary Studies | 91 | 6.4% |
| Science & Technology | 122 | 8.5% |
| Business | 256 | 17.9% |
| Education | 196 | 13.7% |
| Literature & Languages | 110 | 7.7% |
| Liberal Arts & History | 21 | 1.5% |
| Visual & Performing Arts | 91 | 6.4% |
| Communications | 42 | 2.9% |
| Arts & Humanities | 34 | 2.4% |
| Total | 1,433 | 100.0% |
Transportation & Commute in Marlboro
Vehicle Availability by Sex in Marlboro
The most prevalent vehicle ownership categories in Marlboro are males with 2 vehicles (378, accounting for 41.2%) and females with 2 vehicles (281, making up 45.3%).
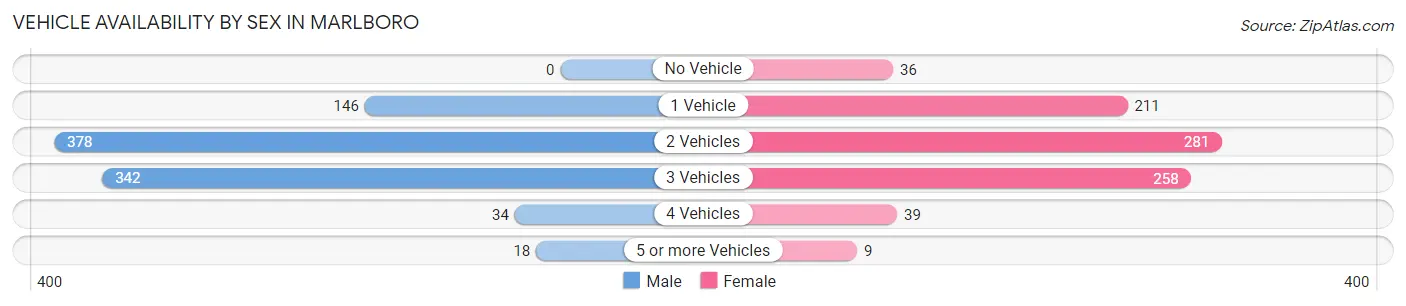
| Vehicles Available | Male | Female |
| No Vehicle | 0 (0.0%) | 36 (4.3%) |
| 1 Vehicle | 146 (15.9%) | 211 (25.3%) |
| 2 Vehicles | 378 (41.2%) | 281 (33.7%) |
| 3 Vehicles | 342 (37.2%) | 258 (30.9%) |
| 4 Vehicles | 34 (3.7%) | 39 (4.7%) |
| 5 or more Vehicles | 18 (2.0%) | 9 (1.1%) |
| Total | 918 (100.0%) | 834 (100.0%) |
Commute Time in Marlboro
The most frequently occuring commute durations in Marlboro are 30 to 34 minutes (262 commuters, 16.6%), 20 to 24 minutes (236 commuters, 15.0%), and 15 to 19 minutes (223 commuters, 14.2%).
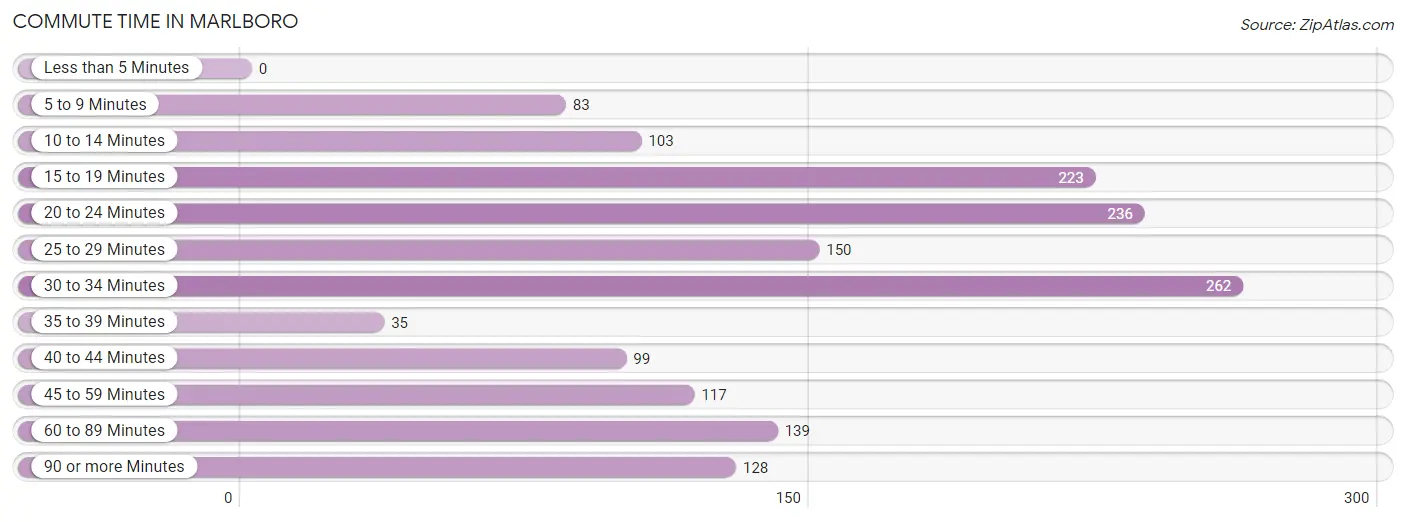
| Commute Time | # Commuters | % Commuters |
| Less than 5 Minutes | 0 | 0.0% |
| 5 to 9 Minutes | 83 | 5.3% |
| 10 to 14 Minutes | 103 | 6.5% |
| 15 to 19 Minutes | 223 | 14.2% |
| 20 to 24 Minutes | 236 | 15.0% |
| 25 to 29 Minutes | 150 | 9.5% |
| 30 to 34 Minutes | 262 | 16.6% |
| 35 to 39 Minutes | 35 | 2.2% |
| 40 to 44 Minutes | 99 | 6.3% |
| 45 to 59 Minutes | 117 | 7.4% |
| 60 to 89 Minutes | 139 | 8.8% |
| 90 or more Minutes | 128 | 8.1% |
Commute Time by Sex in Marlboro
The most common commute times in Marlboro are 30 to 34 minutes (173 commuters, 21.6%) for males and 15 to 19 minutes (133 commuters, 17.1%) for females.
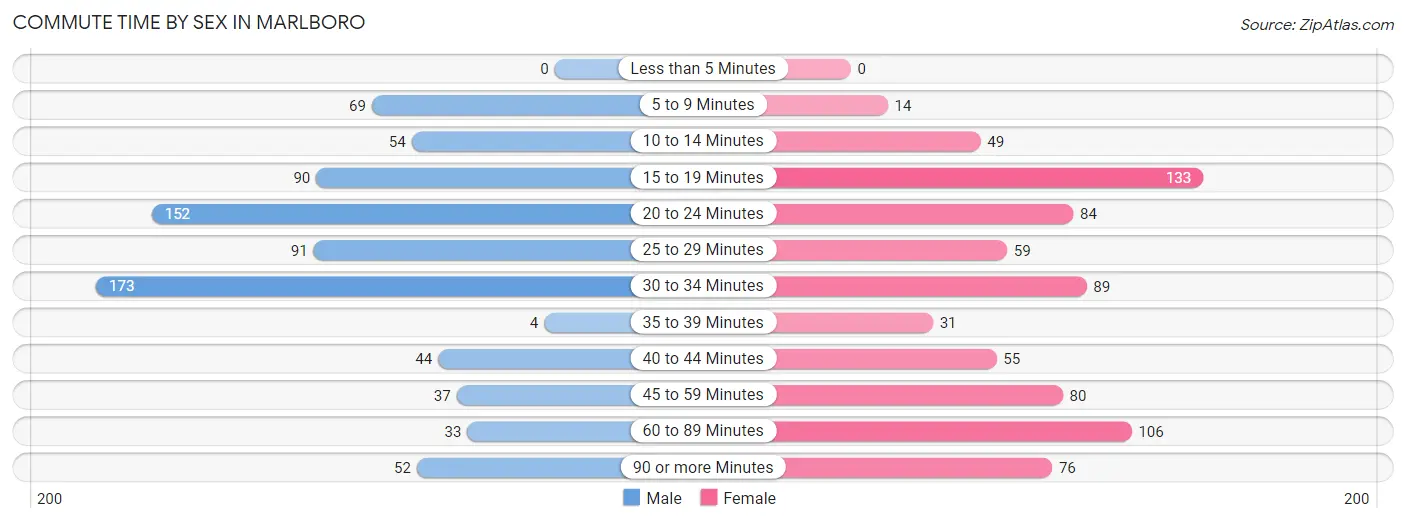
| Commute Time | Male | Female |
| Less than 5 Minutes | 0 (0.0%) | 0 (0.0%) |
| 5 to 9 Minutes | 69 (8.6%) | 14 (1.8%) |
| 10 to 14 Minutes | 54 (6.8%) | 49 (6.3%) |
| 15 to 19 Minutes | 90 (11.3%) | 133 (17.1%) |
| 20 to 24 Minutes | 152 (19.0%) | 84 (10.8%) |
| 25 to 29 Minutes | 91 (11.4%) | 59 (7.6%) |
| 30 to 34 Minutes | 173 (21.6%) | 89 (11.5%) |
| 35 to 39 Minutes | 4 (0.5%) | 31 (4.0%) |
| 40 to 44 Minutes | 44 (5.5%) | 55 (7.1%) |
| 45 to 59 Minutes | 37 (4.6%) | 80 (10.3%) |
| 60 to 89 Minutes | 33 (4.1%) | 106 (13.7%) |
| 90 or more Minutes | 52 (6.5%) | 76 (9.8%) |
Time of Departure to Work by Sex in Marlboro
The most frequent times of departure to work in Marlboro are 7:00 AM to 7:29 AM (177, 22.2%) for males and 7:00 AM to 7:29 AM (231, 29.8%) for females.
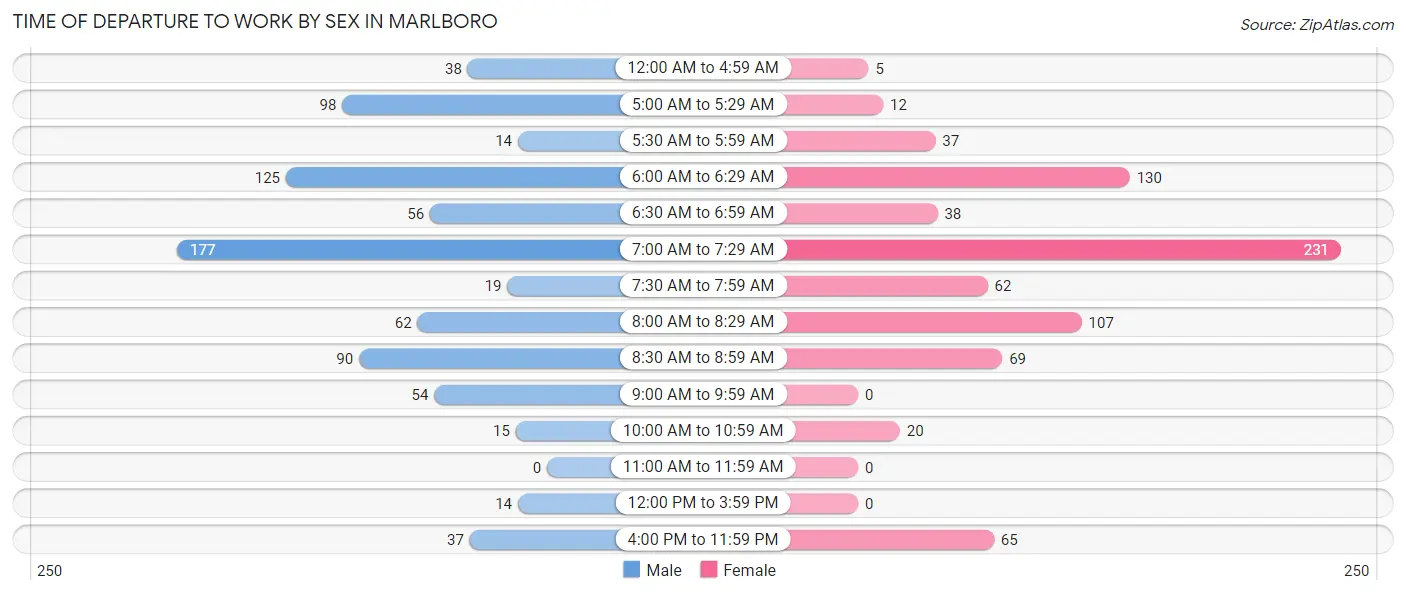
| Time of Departure | Male | Female |
| 12:00 AM to 4:59 AM | 38 (4.8%) | 5 (0.6%) |
| 5:00 AM to 5:29 AM | 98 (12.3%) | 12 (1.5%) |
| 5:30 AM to 5:59 AM | 14 (1.8%) | 37 (4.8%) |
| 6:00 AM to 6:29 AM | 125 (15.6%) | 130 (16.8%) |
| 6:30 AM to 6:59 AM | 56 (7.0%) | 38 (4.9%) |
| 7:00 AM to 7:29 AM | 177 (22.2%) | 231 (29.8%) |
| 7:30 AM to 7:59 AM | 19 (2.4%) | 62 (8.0%) |
| 8:00 AM to 8:29 AM | 62 (7.8%) | 107 (13.8%) |
| 8:30 AM to 8:59 AM | 90 (11.3%) | 69 (8.9%) |
| 9:00 AM to 9:59 AM | 54 (6.8%) | 0 (0.0%) |
| 10:00 AM to 10:59 AM | 15 (1.9%) | 20 (2.6%) |
| 11:00 AM to 11:59 AM | 0 (0.0%) | 0 (0.0%) |
| 12:00 PM to 3:59 PM | 14 (1.8%) | 0 (0.0%) |
| 4:00 PM to 11:59 PM | 37 (4.6%) | 65 (8.4%) |
| Total | 799 (100.0%) | 776 (100.0%) |
Housing Occupancy in Marlboro
Occupancy by Ownership in Marlboro
Of the total 1,517 dwellings in Marlboro, owner-occupied units account for 1,072 (70.7%), while renter-occupied units make up 445 (29.3%).
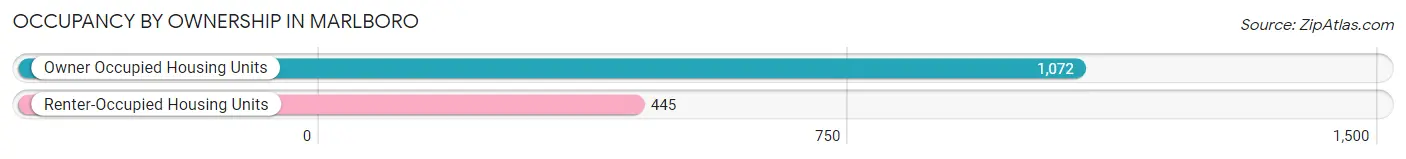
| Occupancy | # Housing Units | % Housing Units |
| Owner Occupied Housing Units | 1,072 | 70.7% |
| Renter-Occupied Housing Units | 445 | 29.3% |
| Total Occupied Housing Units | 1,517 | 100.0% |
Occupancy by Household Size in Marlboro
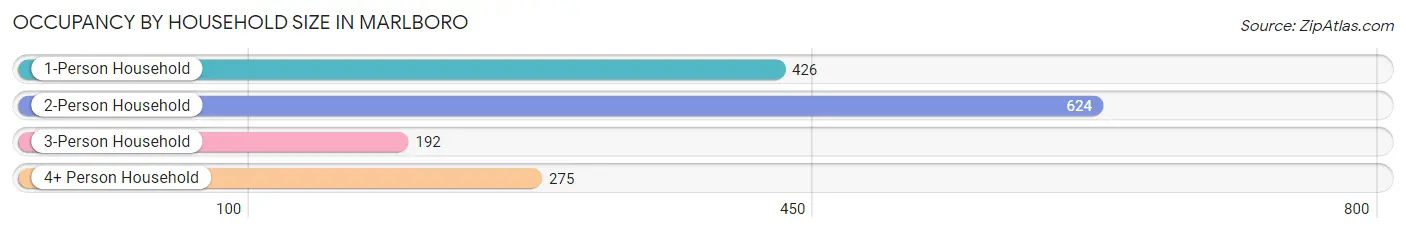
| Household Size | # Housing Units | % Housing Units |
| 1-Person Household | 426 | 28.1% |
| 2-Person Household | 624 | 41.1% |
| 3-Person Household | 192 | 12.7% |
| 4+ Person Household | 275 | 18.1% |
| Total Housing Units | 1,517 | 100.0% |
Occupancy by Ownership by Household Size in Marlboro
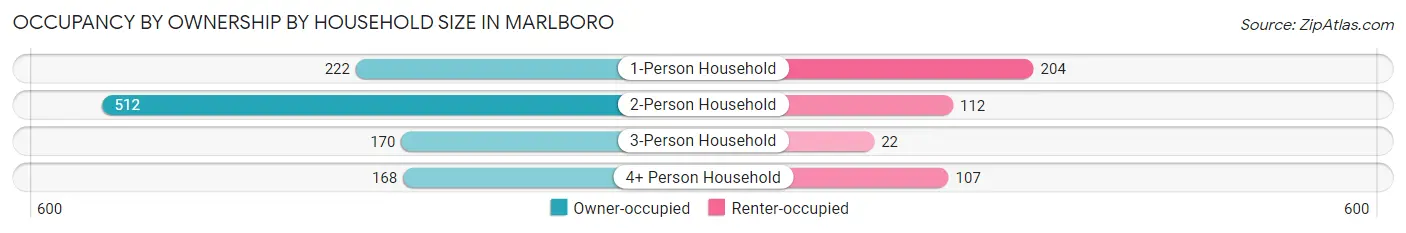
| Household Size | Owner-occupied | Renter-occupied |
| 1-Person Household | 222 (52.1%) | 204 (47.9%) |
| 2-Person Household | 512 (82.1%) | 112 (17.9%) |
| 3-Person Household | 170 (88.5%) | 22 (11.5%) |
| 4+ Person Household | 168 (61.1%) | 107 (38.9%) |
| Total Housing Units | 1,072 (70.7%) | 445 (29.3%) |
Occupancy by Educational Attainment in Marlboro
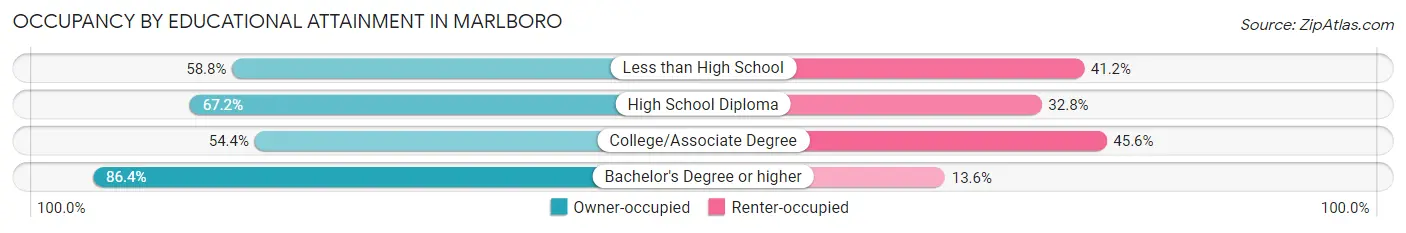
| Household Size | Owner-occupied | Renter-occupied |
| Less than High School | 30 (58.8%) | 21 (41.2%) |
| High School Diploma | 234 (67.2%) | 114 (32.8%) |
| College/Associate Degree | 268 (54.4%) | 225 (45.6%) |
| Bachelor's Degree or higher | 540 (86.4%) | 85 (13.6%) |
Occupancy by Age of Householder in Marlboro
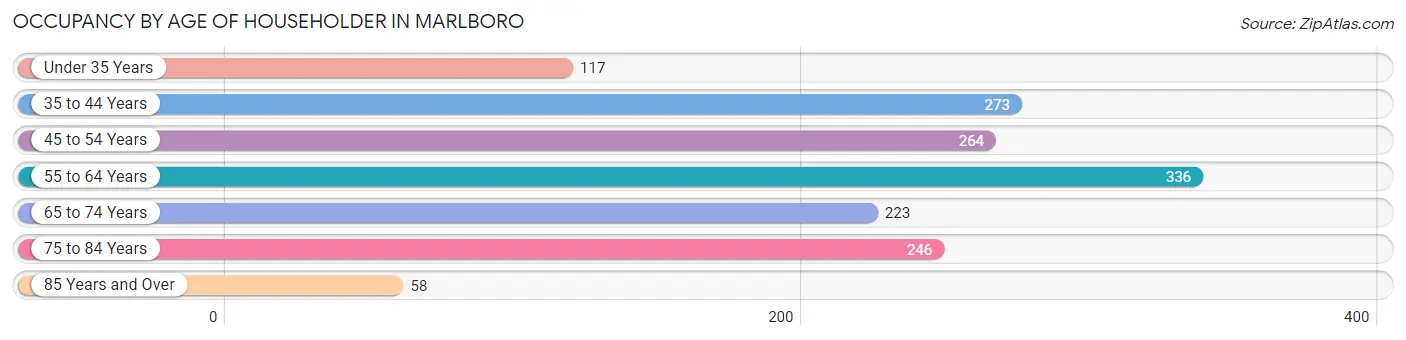
| Age Bracket | # Households | % Households |
| Under 35 Years | 117 | 7.7% |
| 35 to 44 Years | 273 | 18.0% |
| 45 to 54 Years | 264 | 17.4% |
| 55 to 64 Years | 336 | 22.2% |
| 65 to 74 Years | 223 | 14.7% |
| 75 to 84 Years | 246 | 16.2% |
| 85 Years and Over | 58 | 3.8% |
| Total | 1,517 | 100.0% |
Housing Finances in Marlboro
Median Income by Occupancy in Marlboro
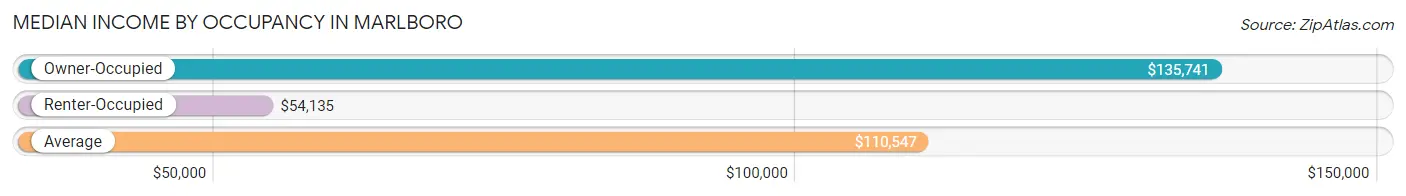
| Occupancy Type | # Households | Median Income |
| Owner-Occupied | 1,072 (70.7%) | $135,741 |
| Renter-Occupied | 445 (29.3%) | $54,135 |
| Average | 1,517 (100.0%) | $110,547 |
Occupancy by Householder Income Bracket in Marlboro
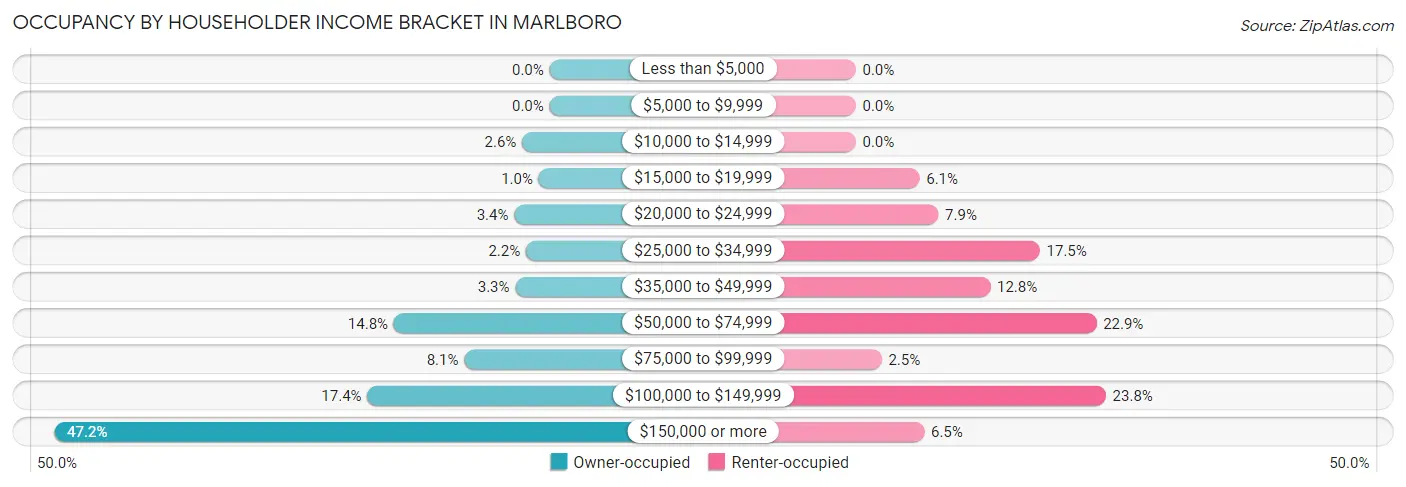
| Income Bracket | Owner-occupied | Renter-occupied |
| Less than $5,000 | 0 (0.0%) | 0 (0.0%) |
| $5,000 to $9,999 | 0 (0.0%) | 0 (0.0%) |
| $10,000 to $14,999 | 28 (2.6%) | 0 (0.0%) |
| $15,000 to $19,999 | 11 (1.0%) | 27 (6.1%) |
| $20,000 to $24,999 | 36 (3.4%) | 35 (7.9%) |
| $25,000 to $34,999 | 24 (2.2%) | 78 (17.5%) |
| $35,000 to $49,999 | 35 (3.3%) | 57 (12.8%) |
| $50,000 to $74,999 | 159 (14.8%) | 102 (22.9%) |
| $75,000 to $99,999 | 87 (8.1%) | 11 (2.5%) |
| $100,000 to $149,999 | 186 (17.3%) | 106 (23.8%) |
| $150,000 or more | 506 (47.2%) | 29 (6.5%) |
| Total | 1,072 (100.0%) | 445 (100.0%) |
Monthly Housing Cost Tiers in Marlboro
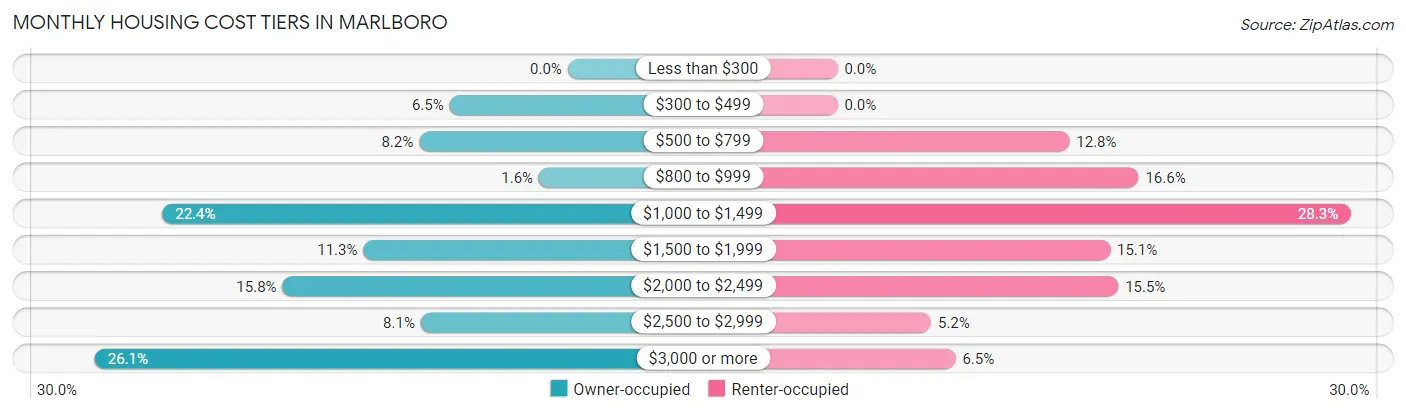
| Monthly Cost | Owner-occupied | Renter-occupied |
| Less than $300 | 0 (0.0%) | 0 (0.0%) |
| $300 to $499 | 70 (6.5%) | 0 (0.0%) |
| $500 to $799 | 88 (8.2%) | 57 (12.8%) |
| $800 to $999 | 17 (1.6%) | 74 (16.6%) |
| $1,000 to $1,499 | 240 (22.4%) | 126 (28.3%) |
| $1,500 to $1,999 | 121 (11.3%) | 67 (15.1%) |
| $2,000 to $2,499 | 169 (15.8%) | 69 (15.5%) |
| $2,500 to $2,999 | 87 (8.1%) | 23 (5.2%) |
| $3,000 or more | 280 (26.1%) | 29 (6.5%) |
| Total | 1,072 (100.0%) | 445 (100.0%) |
Physical Housing Characteristics in Marlboro
Housing Structures in Marlboro
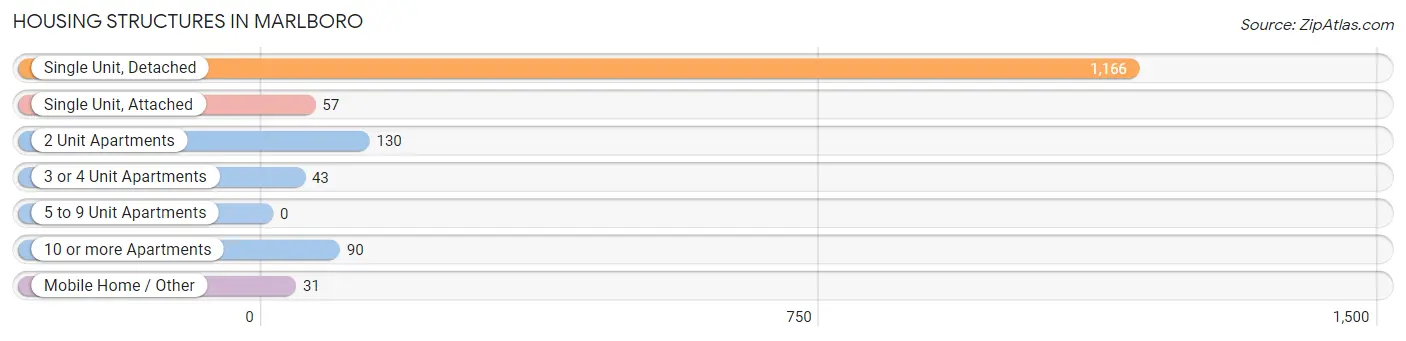
| Structure Type | # Housing Units | % Housing Units |
| Single Unit, Detached | 1,166 | 76.9% |
| Single Unit, Attached | 57 | 3.8% |
| 2 Unit Apartments | 130 | 8.6% |
| 3 or 4 Unit Apartments | 43 | 2.8% |
| 5 to 9 Unit Apartments | 0 | 0.0% |
| 10 or more Apartments | 90 | 5.9% |
| Mobile Home / Other | 31 | 2.0% |
| Total | 1,517 | 100.0% |
Housing Structures by Occupancy in Marlboro
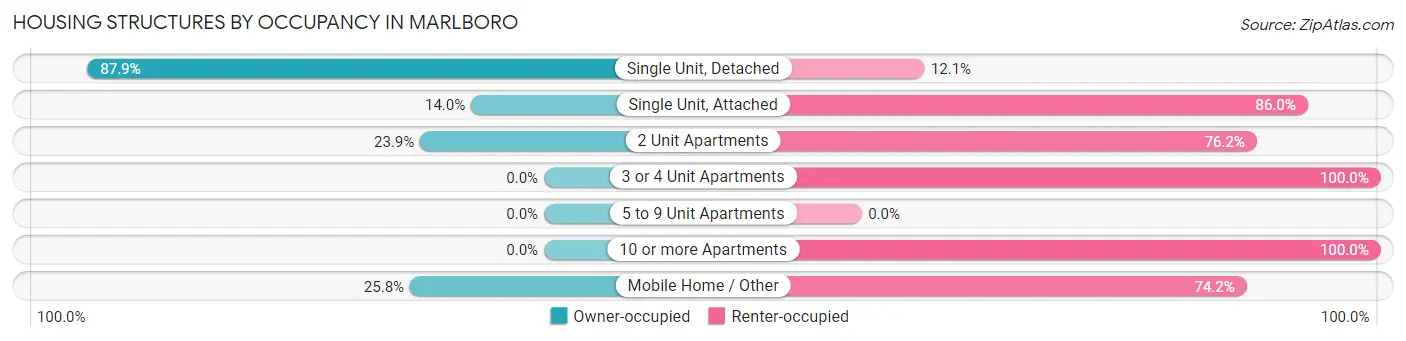
| Structure Type | Owner-occupied | Renter-occupied |
| Single Unit, Detached | 1,025 (87.9%) | 141 (12.1%) |
| Single Unit, Attached | 8 (14.0%) | 49 (86.0%) |
| 2 Unit Apartments | 31 (23.8%) | 99 (76.1%) |
| 3 or 4 Unit Apartments | 0 (0.0%) | 43 (100.0%) |
| 5 to 9 Unit Apartments | 0 (0.0%) | 0 (0.0%) |
| 10 or more Apartments | 0 (0.0%) | 90 (100.0%) |
| Mobile Home / Other | 8 (25.8%) | 23 (74.2%) |
| Total | 1,072 (70.7%) | 445 (29.3%) |
Housing Structures by Number of Rooms in Marlboro
| Number of Rooms | Owner-occupied | Renter-occupied |
| 1 Room | 0 (0.0%) | 35 (7.9%) |
| 2 or 3 Rooms | 0 (0.0%) | 115 (25.8%) |
| 4 or 5 Rooms | 203 (18.9%) | 199 (44.7%) |
| 6 or 7 Rooms | 338 (31.5%) | 52 (11.7%) |
| 8 or more Rooms | 531 (49.5%) | 44 (9.9%) |
| Total | 1,072 (100.0%) | 445 (100.0%) |
Housing Structure by Heating Type in Marlboro
| Heating Type | Owner-occupied | Renter-occupied |
| Utility Gas | 67 (6.2%) | 103 (23.2%) |
| Bottled, Tank, or LP Gas | 319 (29.8%) | 75 (16.9%) |
| Electricity | 40 (3.7%) | 63 (14.2%) |
| Fuel Oil or Kerosene | 626 (58.4%) | 204 (45.8%) |
| Coal or Coke | 0 (0.0%) | 0 (0.0%) |
| All other Fuels | 20 (1.9%) | 0 (0.0%) |
| No Fuel Used | 0 (0.0%) | 0 (0.0%) |
| Total | 1,072 (100.0%) | 445 (100.0%) |
Household Vehicle Usage in Marlboro
| Vehicles per Household | Owner-occupied | Renter-occupied |
| No Vehicle | 63 (5.9%) | 25 (5.6%) |
| 1 Vehicle | 279 (26.0%) | 206 (46.3%) |
| 2 Vehicles | 374 (34.9%) | 128 (28.8%) |
| 3 or more Vehicles | 356 (33.2%) | 86 (19.3%) |
| Total | 1,072 (100.0%) | 445 (100.0%) |
Real Estate & Mortgages in Marlboro
Real Estate and Mortgage Overview in Marlboro
| Characteristic | Without Mortgage | With Mortgage |
| Housing Units | 417 | 655 |
| Median Property Value | $272,700 | $382,900 |
| Median Household Income | $88,125 | $451 |
| Monthly Housing Costs | $1,084 | $280 |
| Real Estate Taxes | $7,275 | $14 |
Property Value by Mortgage Status in Marlboro
| Property Value | Without Mortgage | With Mortgage |
| Less than $50,000 | 0 (0.0%) | 11 (1.7%) |
| $50,000 to $99,999 | 0 (0.0%) | 22 (3.4%) |
| $100,000 to $299,999 | 256 (61.4%) | 195 (29.8%) |
| $300,000 to $499,999 | 147 (35.2%) | 317 (48.4%) |
| $500,000 to $749,999 | 6 (1.4%) | 110 (16.8%) |
| $750,000 to $999,999 | 8 (1.9%) | 0 (0.0%) |
| $1,000,000 or more | 0 (0.0%) | 0 (0.0%) |
| Total | 417 (100.0%) | 655 (100.0%) |
Household Income by Mortgage Status in Marlboro
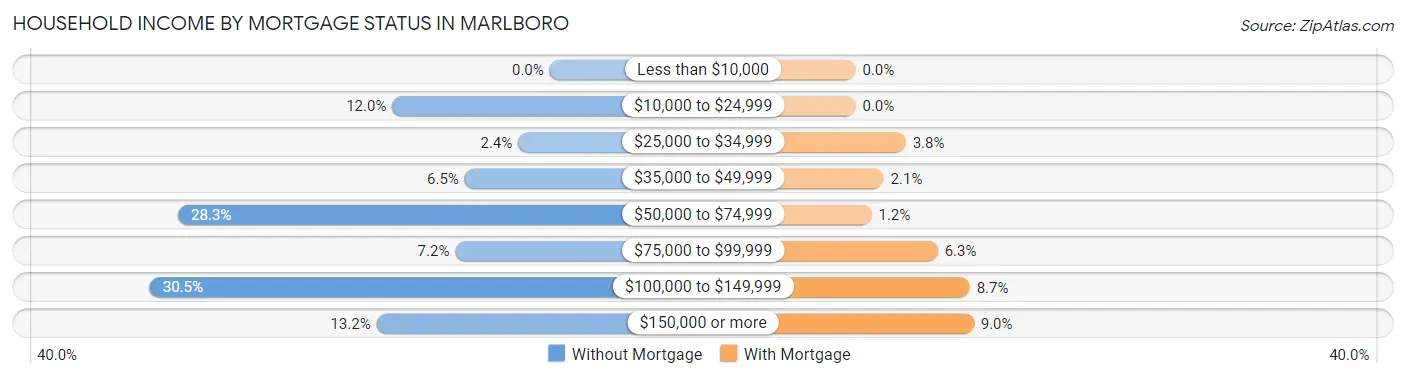
| Household Income | Without Mortgage | With Mortgage |
| Less than $10,000 | 0 (0.0%) | 0 (0.0%) |
| $10,000 to $24,999 | 50 (12.0%) | 0 (0.0%) |
| $25,000 to $34,999 | 10 (2.4%) | 25 (3.8%) |
| $35,000 to $49,999 | 27 (6.5%) | 14 (2.1%) |
| $50,000 to $74,999 | 118 (28.3%) | 8 (1.2%) |
| $75,000 to $99,999 | 30 (7.2%) | 41 (6.3%) |
| $100,000 to $149,999 | 127 (30.5%) | 57 (8.7%) |
| $150,000 or more | 55 (13.2%) | 59 (9.0%) |
| Total | 417 (100.0%) | 655 (100.0%) |
Property Value to Household Income Ratio in Marlboro
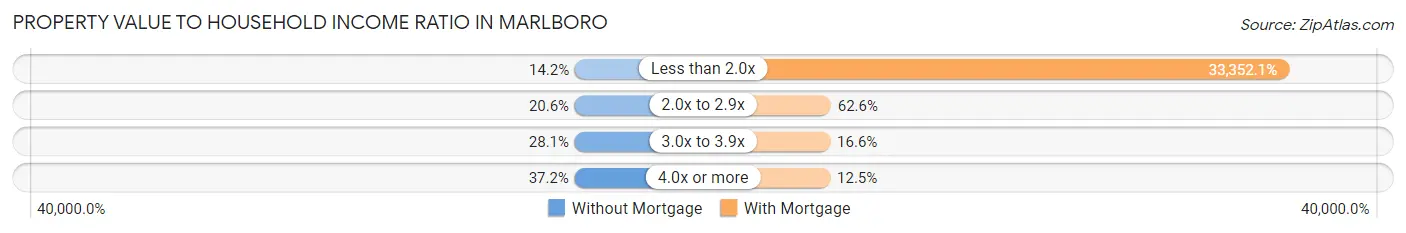
| Value-to-Income Ratio | Without Mortgage | With Mortgage |
| Less than 2.0x | 59 (14.1%) | 218,456 (33,352.1%) |
| 2.0x to 2.9x | 86 (20.6%) | 410 (62.6%) |
| 3.0x to 3.9x | 117 (28.1%) | 109 (16.6%) |
| 4.0x or more | 155 (37.2%) | 82 (12.5%) |
| Total | 417 (100.0%) | 655 (100.0%) |
Real Estate Taxes by Mortgage Status in Marlboro
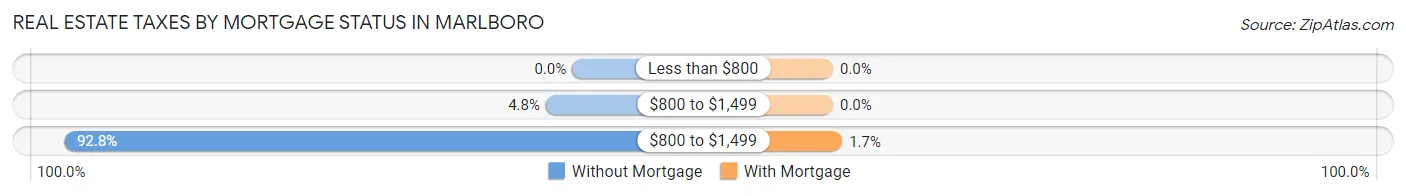
| Property Taxes | Without Mortgage | With Mortgage |
| Less than $800 | 0 (0.0%) | 0 (0.0%) |
| $800 to $1,499 | 20 (4.8%) | 0 (0.0%) |
| $800 to $1,499 | 387 (92.8%) | 11 (1.7%) |
| Total | 417 (100.0%) | 655 (100.0%) |
Health & Disability in Marlboro
Health Insurance Coverage by Age in Marlboro
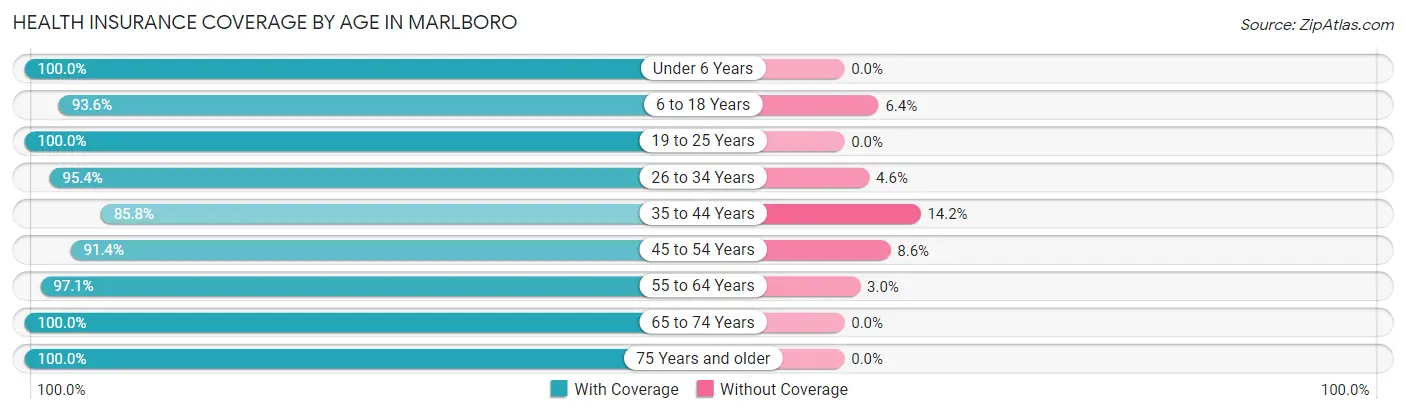
| Age Bracket | With Coverage | Without Coverage |
| Under 6 Years | 246 (100.0%) | 0 (0.0%) |
| 6 to 18 Years | 499 (93.6%) | 34 (6.4%) |
| 19 to 25 Years | 149 (100.0%) | 0 (0.0%) |
| 26 to 34 Years | 267 (95.4%) | 13 (4.6%) |
| 35 to 44 Years | 429 (85.8%) | 71 (14.2%) |
| 45 to 54 Years | 415 (91.4%) | 39 (8.6%) |
| 55 to 64 Years | 559 (97.1%) | 17 (2.9%) |
| 65 to 74 Years | 347 (100.0%) | 0 (0.0%) |
| 75 Years and older | 549 (100.0%) | 0 (0.0%) |
| Total | 3,460 (95.2%) | 174 (4.8%) |
Health Insurance Coverage by Citizenship Status in Marlboro
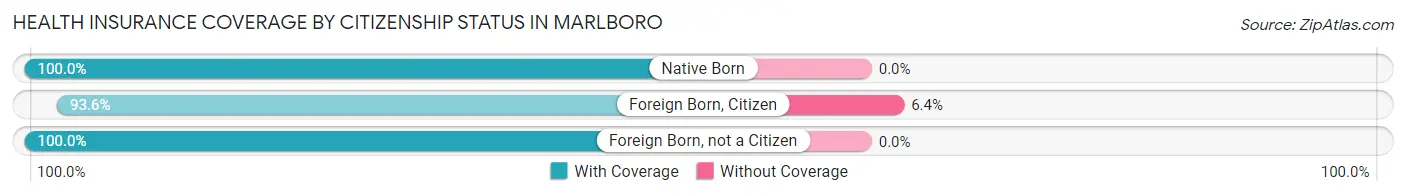
| Citizenship Status | With Coverage | Without Coverage |
| Native Born | 246 (100.0%) | 0 (0.0%) |
| Foreign Born, Citizen | 499 (93.6%) | 34 (6.4%) |
| Foreign Born, not a Citizen | 149 (100.0%) | 0 (0.0%) |
Health Insurance Coverage by Household Income in Marlboro
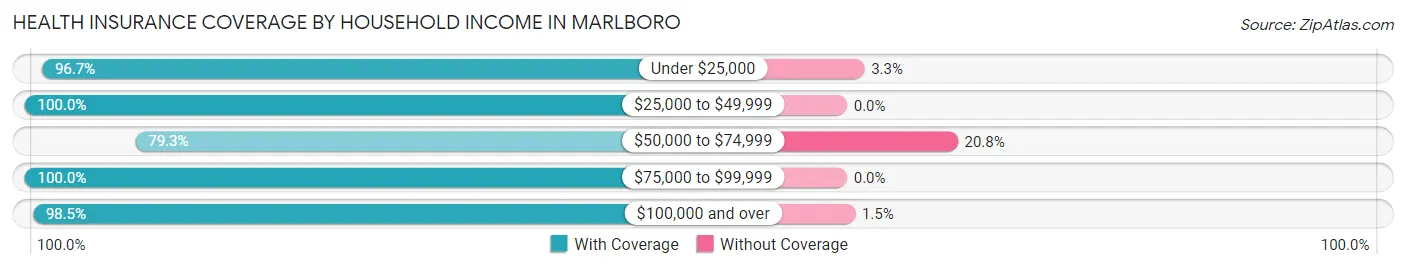
| Household Income | With Coverage | Without Coverage |
| Under $25,000 | 178 (96.7%) | 6 (3.3%) |
| $25,000 to $49,999 | 310 (100.0%) | 0 (0.0%) |
| $50,000 to $74,999 | 508 (79.2%) | 133 (20.7%) |
| $75,000 to $99,999 | 205 (100.0%) | 0 (0.0%) |
| $100,000 and over | 2,259 (98.5%) | 35 (1.5%) |
Public vs Private Health Insurance Coverage by Age in Marlboro
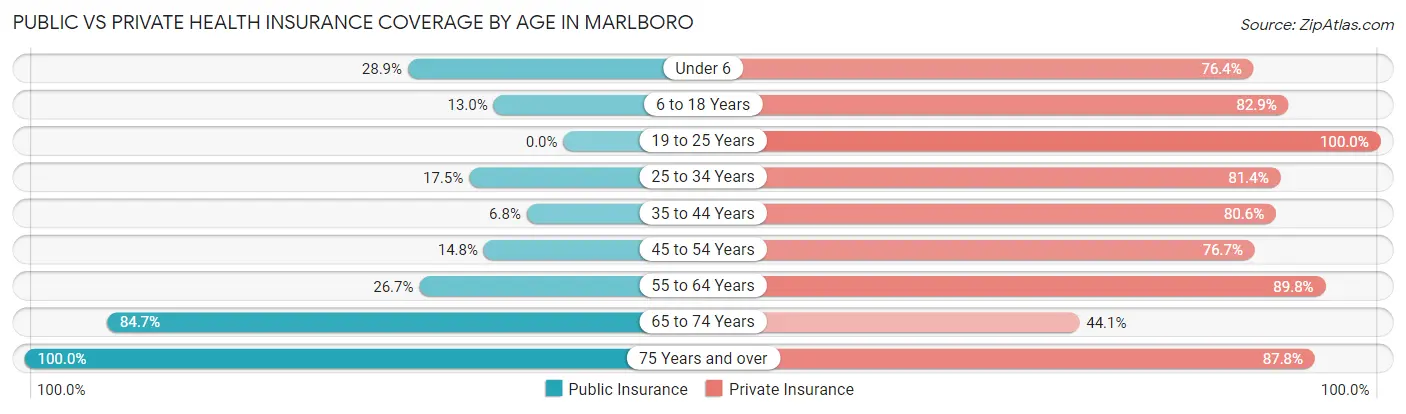
| Age Bracket | Public Insurance | Private Insurance |
| Under 6 | 71 (28.9%) | 188 (76.4%) |
| 6 to 18 Years | 69 (13.0%) | 442 (82.9%) |
| 19 to 25 Years | 0 (0.0%) | 149 (100.0%) |
| 25 to 34 Years | 49 (17.5%) | 228 (81.4%) |
| 35 to 44 Years | 34 (6.8%) | 403 (80.6%) |
| 45 to 54 Years | 67 (14.8%) | 348 (76.6%) |
| 55 to 64 Years | 154 (26.7%) | 517 (89.8%) |
| 65 to 74 Years | 294 (84.7%) | 153 (44.1%) |
| 75 Years and over | 549 (100.0%) | 482 (87.8%) |
| Total | 1,287 (35.4%) | 2,910 (80.1%) |
Disability Status by Sex by Age in Marlboro
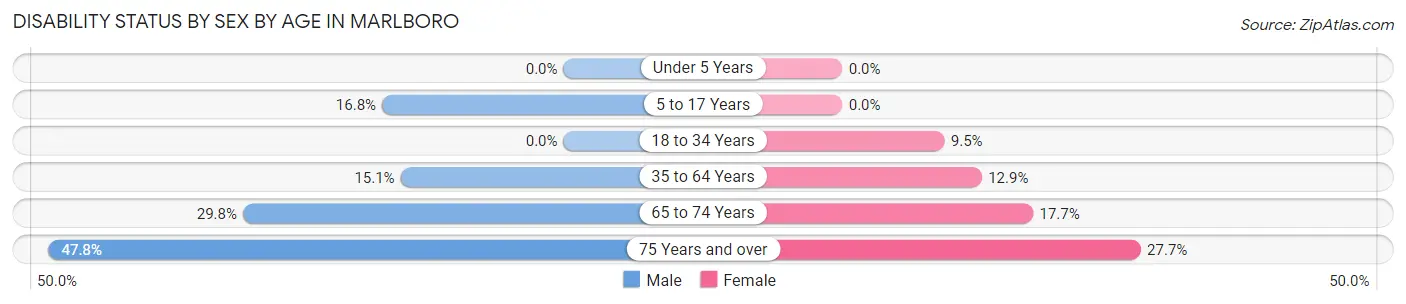
| Age Bracket | Male | Female |
| Under 5 Years | 0 (0.0%) | 0 (0.0%) |
| 5 to 17 Years | 49 (16.8%) | 0 (0.0%) |
| 18 to 34 Years | 0 (0.0%) | 23 (9.5%) |
| 35 to 64 Years | 111 (15.1%) | 103 (12.9%) |
| 65 to 74 Years | 36 (29.7%) | 40 (17.7%) |
| 75 Years and over | 107 (47.8%) | 90 (27.7%) |
Disability Class by Sex by Age in Marlboro
Disability Class: Hearing Difficulty
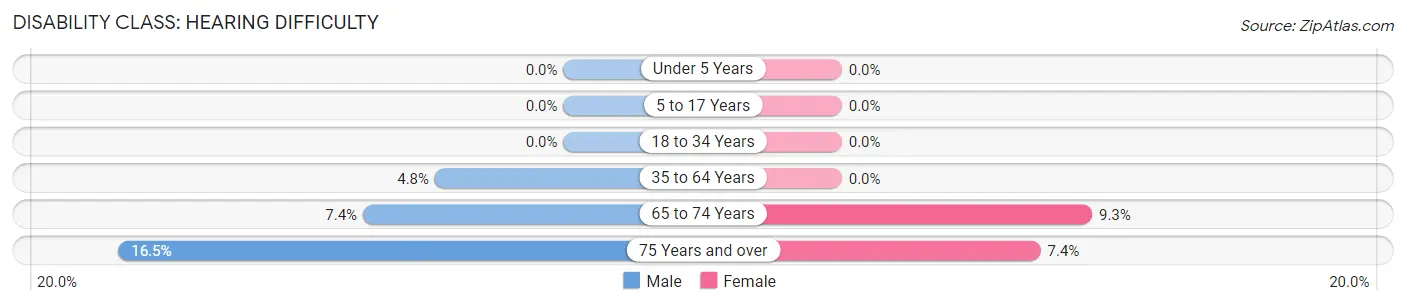
| Age Bracket | Male | Female |
| Under 5 Years | 0 (0.0%) | 0 (0.0%) |
| 5 to 17 Years | 0 (0.0%) | 0 (0.0%) |
| 18 to 34 Years | 0 (0.0%) | 0 (0.0%) |
| 35 to 64 Years | 35 (4.8%) | 0 (0.0%) |
| 65 to 74 Years | 9 (7.4%) | 21 (9.3%) |
| 75 Years and over | 37 (16.5%) | 24 (7.4%) |
Disability Class: Vision Difficulty
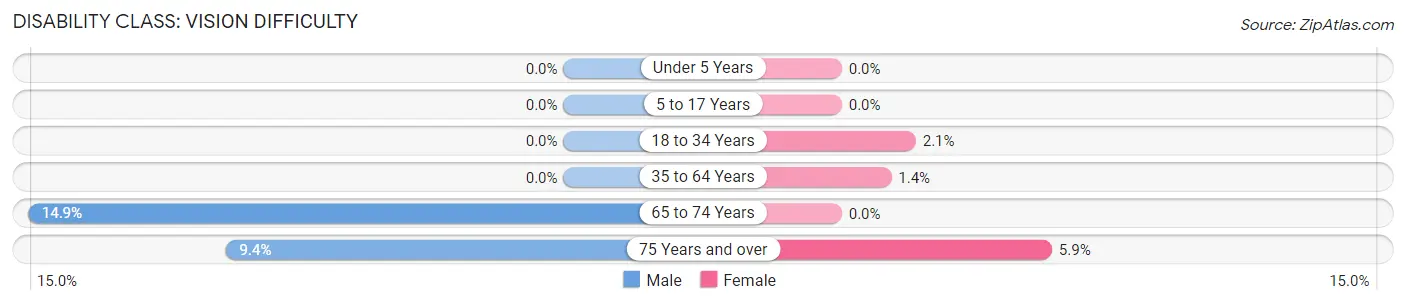
| Age Bracket | Male | Female |
| Under 5 Years | 0 (0.0%) | 0 (0.0%) |
| 5 to 17 Years | 0 (0.0%) | 0 (0.0%) |
| 18 to 34 Years | 0 (0.0%) | 5 (2.1%) |
| 35 to 64 Years | 0 (0.0%) | 11 (1.4%) |
| 65 to 74 Years | 18 (14.9%) | 0 (0.0%) |
| 75 Years and over | 21 (9.4%) | 19 (5.9%) |
Disability Class: Cognitive Difficulty
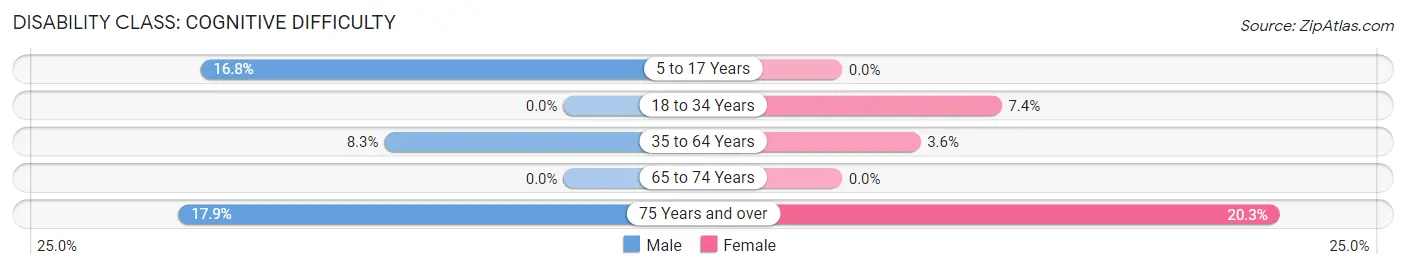
| Age Bracket | Male | Female |
| 5 to 17 Years | 49 (16.8%) | 0 (0.0%) |
| 18 to 34 Years | 0 (0.0%) | 18 (7.4%) |
| 35 to 64 Years | 61 (8.3%) | 29 (3.6%) |
| 65 to 74 Years | 0 (0.0%) | 0 (0.0%) |
| 75 Years and over | 40 (17.9%) | 66 (20.3%) |
Disability Class: Ambulatory Difficulty
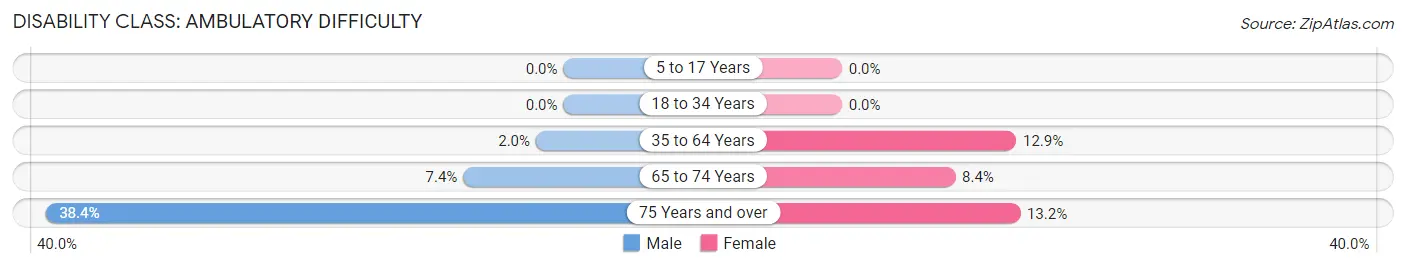
| Age Bracket | Male | Female |
| 5 to 17 Years | 0 (0.0%) | 0 (0.0%) |
| 18 to 34 Years | 0 (0.0%) | 0 (0.0%) |
| 35 to 64 Years | 15 (2.0%) | 103 (12.9%) |
| 65 to 74 Years | 9 (7.4%) | 19 (8.4%) |
| 75 Years and over | 86 (38.4%) | 43 (13.2%) |
Disability Class: Self-Care Difficulty
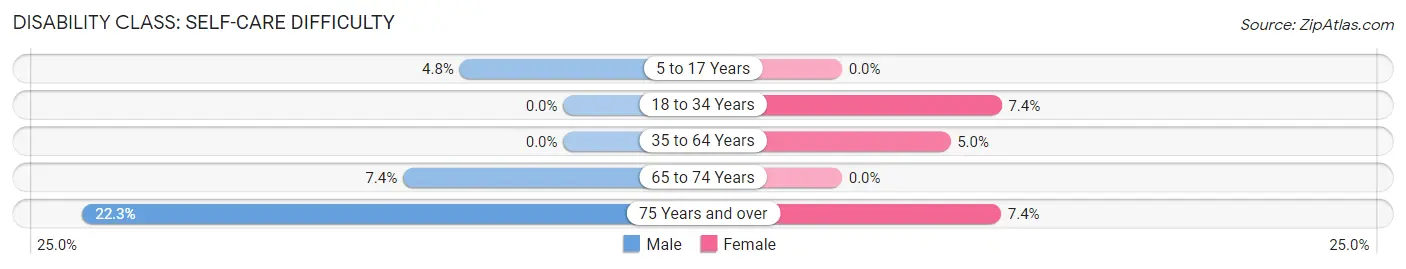
| Age Bracket | Male | Female |
| 5 to 17 Years | 14 (4.8%) | 0 (0.0%) |
| 18 to 34 Years | 0 (0.0%) | 18 (7.4%) |
| 35 to 64 Years | 0 (0.0%) | 40 (5.0%) |
| 65 to 74 Years | 9 (7.4%) | 0 (0.0%) |
| 75 Years and over | 50 (22.3%) | 24 (7.4%) |
Technology Access in Marlboro
Computing Device Access in Marlboro
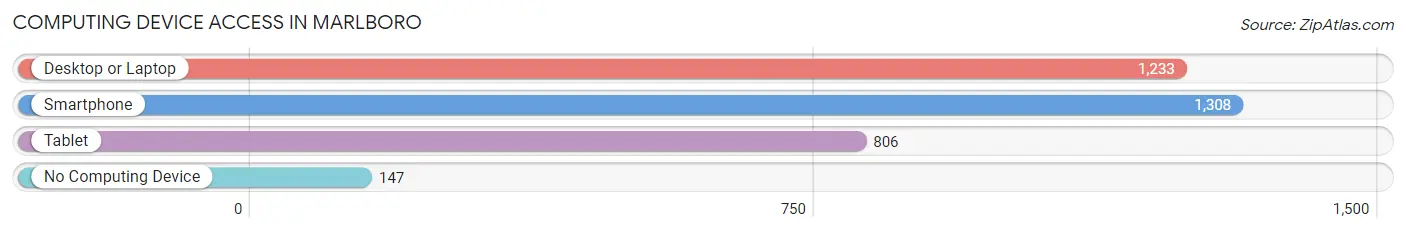
| Device Type | # Households | % Households |
| Desktop or Laptop | 1,233 | 81.3% |
| Smartphone | 1,308 | 86.2% |
| Tablet | 806 | 53.1% |
| No Computing Device | 147 | 9.7% |
| Total | 1,517 | 100.0% |
Internet Access in Marlboro
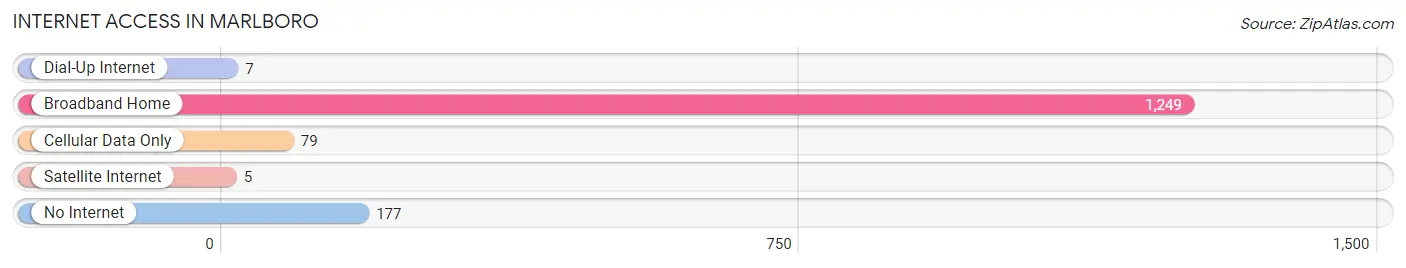
| Internet Type | # Households | % Households |
| Dial-Up Internet | 7 | 0.5% |
| Broadband Home | 1,249 | 82.3% |
| Cellular Data Only | 79 | 5.2% |
| Satellite Internet | 5 | 0.3% |
| No Internet | 177 | 11.7% |
| Total | 1,517 | 100.0% |
Marlboro Summary
Marlboro is a town located in Ulster County, New York, United States. It is part of the Hudson Valley region and is situated in the southeastern part of the county. The town is bordered by the towns of Plattekill and Newburgh to the north, Shawangunk to the east, Gardiner to the south, and Lloyd to the west. As of the 2010 census, the town had a population of 8,808.
History
Marlboro was first settled in 1709 by Dutch settlers. The town was originally part of the town of Newburgh, but was later separated and incorporated in 1848. The town was named after the Marlborough region of England.
Geography
Marlboro is located in southeastern Ulster County, bordered by the towns of Plattekill and Newburgh to the north, Shawangunk to the east, Gardiner to the south, and Lloyd to the west. The town is located in the Hudson Valley region of New York and is situated in the foothills of the Shawangunk Mountains. The Wallkill River flows through the town, and the town is home to several small lakes, including Marlboro Lake and Lake Marlboro.
Economy
Marlboro is home to several small businesses, including a number of farms, wineries, and restaurants. The town is also home to several large corporations, including IBM, PepsiCo, and CVS Health. The town is also home to the Marlboro Central School District, which serves the town and surrounding areas.
Demographics
As of the 2010 census, there were 8,808 people, 3,093 households, and 2,092 families residing in the town. The population density was 517.3 people per square mile (199.7/km2). The racial makeup of the town was 87.2% White, 5.3% African American, 0.3% Native American, 2.7% Asian, 0.1% Pacific Islander, 1.9% from other races, and 2.6% from two or more races. Hispanic or Latino of any race were 8.2% of the population.
The median income for a household in the town was $60,938, and the median income for a family was $71,944. Males had a median income of $50,917 versus $37,917 for females. The per capita income for the town was $25,945. About 4.2% of families and 6.2% of the population were below the poverty line, including 8.2% of those under age 18 and 4.2% of those age 65 or over.
Common Questions
What is Per Capita Income in Marlboro?
Per Capita income in Marlboro is $63,595.
What is the Median Family Income in Marlboro?
Median Family Income in Marlboro is $163,750.
What is the Median Household income in Marlboro?
Median Household Income in Marlboro is $110,547.
What is Income or Wage Gap in Marlboro?
Income or Wage Gap in Marlboro is 12.4%.
Women in Marlboro earn 87.6 cents for every dollar earned by a man.
What is Inequality or Gini Index in Marlboro?
Inequality or Gini Index in Marlboro is 0.49.
What is the Total Population of Marlboro?
Total Population of Marlboro is 3,635.
What is the Total Male Population of Marlboro?
Total Male Population of Marlboro is 1,715.
What is the Total Female Population of Marlboro?
Total Female Population of Marlboro is 1,920.
What is the Ratio of Males per 100 Females in Marlboro?
There are 89.32 Males per 100 Females in Marlboro.
What is the Ratio of Females per 100 Males in Marlboro?
There are 111.95 Females per 100 Males in Marlboro.
What is the Median Population Age in Marlboro?
Median Population Age in Marlboro is 49.3 Years.
What is the Average Family Size in Marlboro
Average Family Size in Marlboro is 2.9 People.
What is the Average Household Size in Marlboro
Average Household Size in Marlboro is 2.4 People.
How Large is the Labor Force in Marlboro?
There are 1,752 People in the Labor Forcein in Marlboro.
What is the Percentage of People in the Labor Force in Marlboro?
58.4% of People are in the Labor Force in Marlboro.