Secaucus, NJ Map & Demographics
Secaucus Map
Secaucus Overview
$60,425
PER CAPITA INCOME
$158,772
AVG FAMILY INCOME
$129,348
AVG HOUSEHOLD INCOME
37.1%
WAGE / INCOME GAP [ % ]
62.9¢/ $1
WAGE / INCOME GAP [ $ ]
0.41
INEQUALITY / GINI INDEX
21,470
TOTAL POPULATION
10,777
MALE POPULATION
10,693
FEMALE POPULATION
100.79
MALES / 100 FEMALES
99.22
FEMALES / 100 MALES
39.0
MEDIAN AGE
2.9
AVG FAMILY SIZE
2.4
AVG HOUSEHOLD SIZE
11,947
LABOR FORCE [ PEOPLE ]
67.2%
PERCENT IN LABOR FORCE
6.5%
UNEMPLOYMENT RATE
Secaucus Zip Codes
Income in Secaucus
Income Overview in Secaucus
Per Capita Income in Secaucus is $60,425, while median incomes of families and households are $158,772 and $129,348 respectively.
| Characteristic | Number | Measure |
| Per Capita Income | 21,470 | $60,425 |
| Median Family Income | 5,797 | $158,772 |
| Mean Family Income | 5,797 | $178,339 |
| Median Household Income | 8,607 | $129,348 |
| Mean Household Income | 8,607 | $151,880 |
| Income Deficit | 5,797 | $0 |
| Wage / Income Gap (%) | 21,470 | 37.09% |
| Wage / Income Gap ($) | 21,470 | 62.91¢ per $1 |
| Gini / Inequality Index | 21,470 | 0.41 |
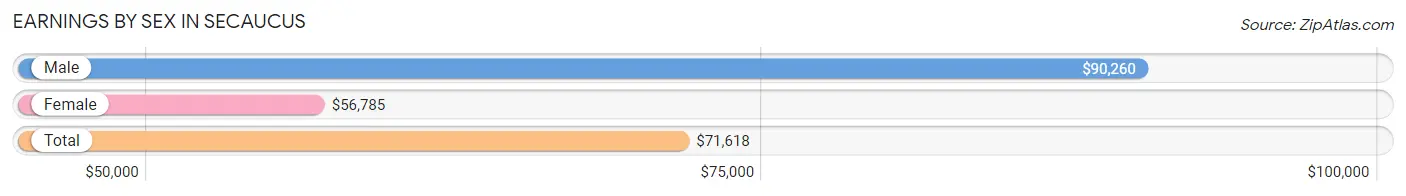
Earnings by Sex in Secaucus
Average Earnings in Secaucus are $71,618, $90,260 for men and $56,785 for women, a difference of 37.1%.
| Sex | Number | Average Earnings |
| Male | 6,841 (55.5%) | $90,260 |
| Female | 5,487 (44.5%) | $56,785 |
| Total | 12,328 (100.0%) | $71,618 |
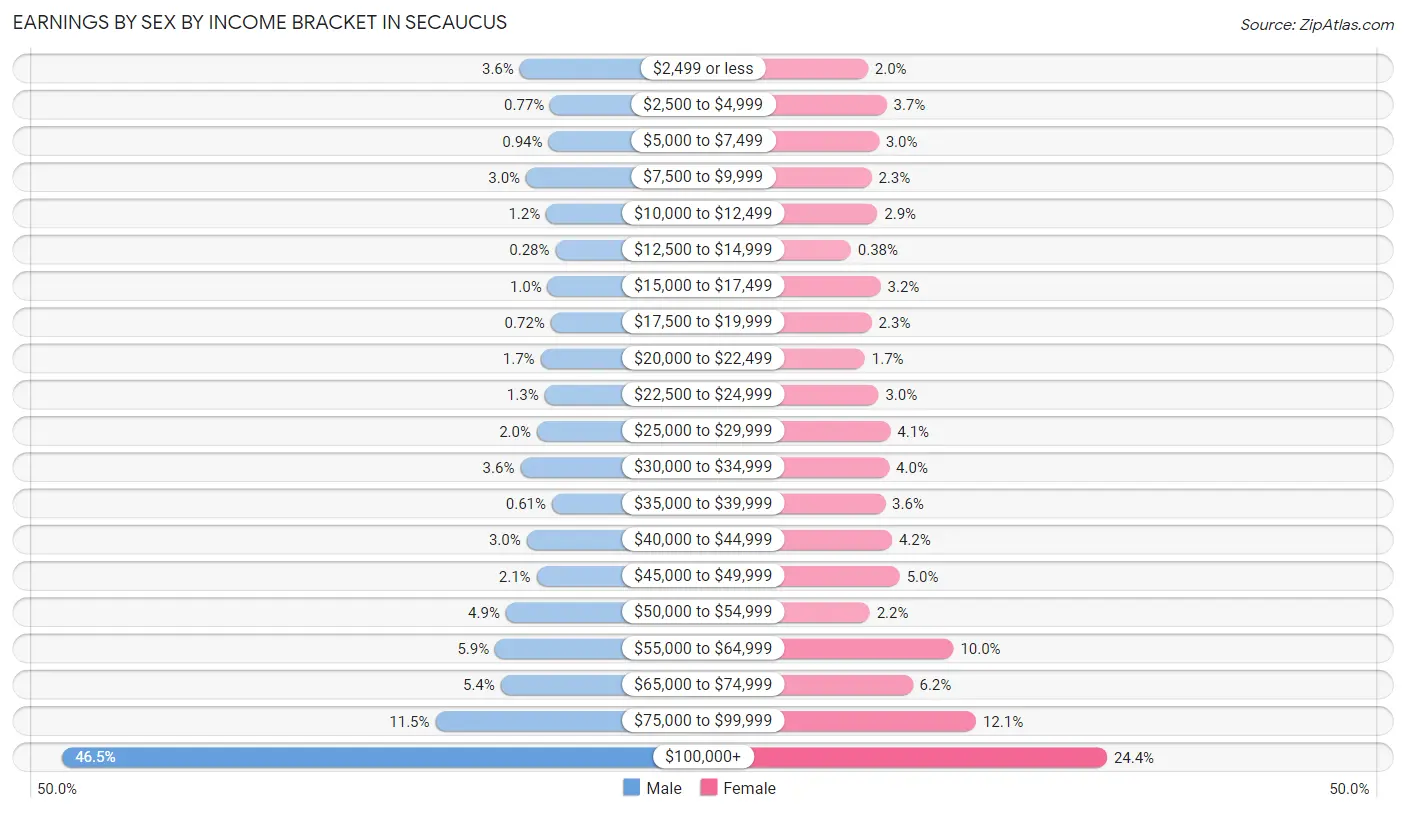
Earnings by Sex by Income Bracket in Secaucus
The most common earnings brackets in Secaucus are $100,000+ for men (3,179 | 46.5%) and $100,000+ for women (1,337 | 24.4%).
| Income | Male | Female |
| $2,499 or less | 248 (3.6%) | 108 (2.0%) |
| $2,500 to $4,999 | 53 (0.8%) | 204 (3.7%) |
| $5,000 to $7,499 | 64 (0.9%) | 164 (3.0%) |
| $7,500 to $9,999 | 208 (3.0%) | 127 (2.3%) |
| $10,000 to $12,499 | 79 (1.1%) | 157 (2.9%) |
| $12,500 to $14,999 | 19 (0.3%) | 21 (0.4%) |
| $15,000 to $17,499 | 69 (1.0%) | 174 (3.2%) |
| $17,500 to $19,999 | 49 (0.7%) | 128 (2.3%) |
| $20,000 to $22,499 | 115 (1.7%) | 93 (1.7%) |
| $22,500 to $24,999 | 89 (1.3%) | 163 (3.0%) |
| $25,000 to $29,999 | 138 (2.0%) | 224 (4.1%) |
| $30,000 to $34,999 | 244 (3.6%) | 218 (4.0%) |
| $35,000 to $39,999 | 42 (0.6%) | 197 (3.6%) |
| $40,000 to $44,999 | 204 (3.0%) | 232 (4.2%) |
| $45,000 to $49,999 | 140 (2.1%) | 272 (5.0%) |
| $50,000 to $54,999 | 337 (4.9%) | 118 (2.1%) |
| $55,000 to $64,999 | 406 (5.9%) | 548 (10.0%) |
| $65,000 to $74,999 | 370 (5.4%) | 338 (6.2%) |
| $75,000 to $99,999 | 788 (11.5%) | 664 (12.1%) |
| $100,000+ | 3,179 (46.5%) | 1,337 (24.4%) |
| Total | 6,841 (100.0%) | 5,487 (100.0%) |
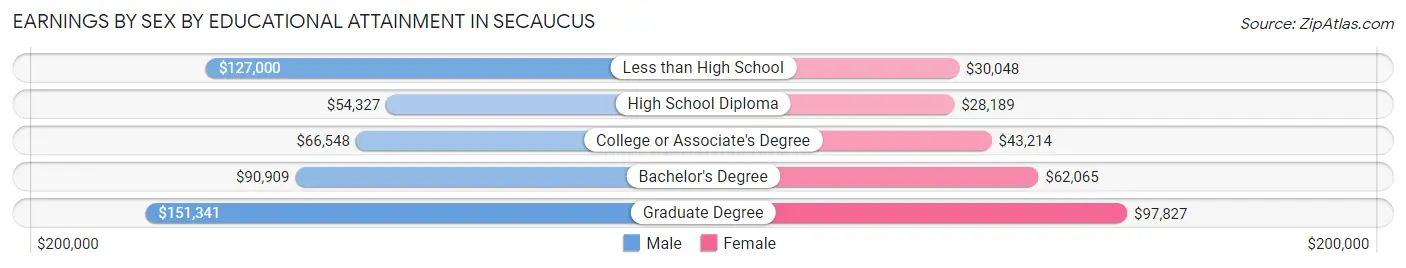
Earnings by Sex by Educational Attainment in Secaucus
Average earnings in Secaucus are $100,521 for men and $58,555 for women, a difference of 41.7%. Men with an educational attainment of graduate degree enjoy the highest average annual earnings of $151,341, while those with high school diploma education earn the least with $54,327. Women with an educational attainment of graduate degree earn the most with the average annual earnings of $97,827, while those with high school diploma education have the smallest earnings of $28,189.
| Educational Attainment | Male Income | Female Income |
| Less than High School | $127,000 | $30,048 |
| High School Diploma | $54,327 | $28,189 |
| College or Associate's Degree | $66,548 | $43,214 |
| Bachelor's Degree | $90,909 | $62,065 |
| Graduate Degree | $151,341 | $97,827 |
| Total | $100,521 | $58,555 |
Family Income in Secaucus
Family Income Brackets in Secaucus
According to the Secaucus family income data, there are 2,110 families falling into the $200,000+ income range, which is the most common income bracket and makes up 36.4% of all families. Conversely, the less than $10,000 income bracket is the least frequent group with only 6 families (0.1%) belonging to this category.
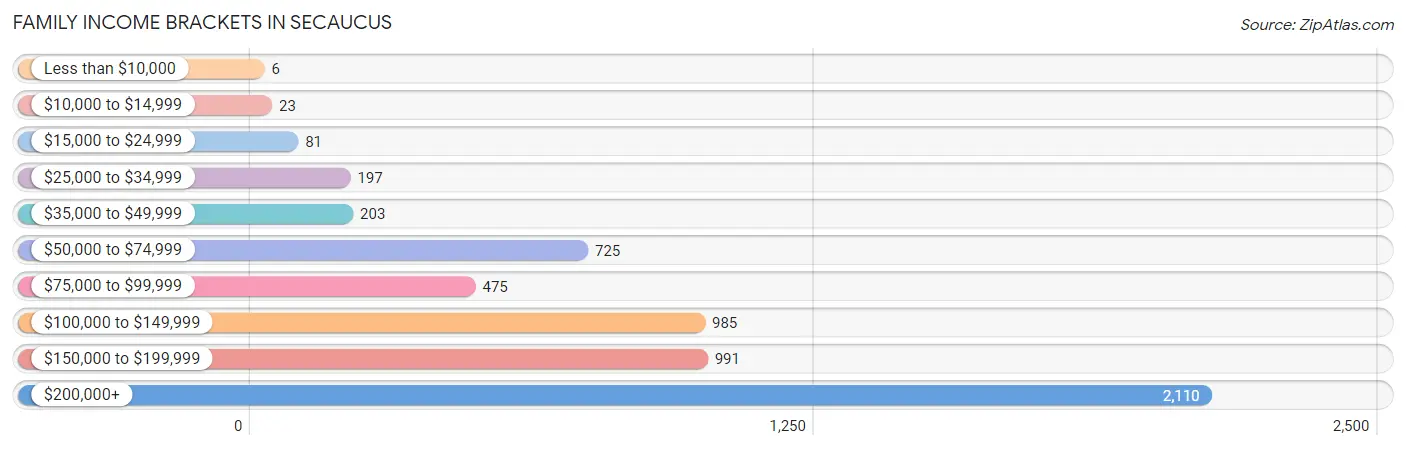
| Income Bracket | # Families | % Families |
| Less than $10,000 | 6 | 0.1% |
| $10,000 to $14,999 | 23 | 0.4% |
| $15,000 to $24,999 | 81 | 1.4% |
| $25,000 to $34,999 | 197 | 3.4% |
| $35,000 to $49,999 | 203 | 3.5% |
| $50,000 to $74,999 | 725 | 12.5% |
| $75,000 to $99,999 | 475 | 8.2% |
| $100,000 to $149,999 | 985 | 17.0% |
| $150,000 to $199,999 | 991 | 17.1% |
| $200,000+ | 2,110 | 36.4% |
Family Income by Famaliy Size in Secaucus
6-person families (183 | 3.2%) account for the highest median family income in Secaucus with $250,001 per family, while 2-person families (2,590 | 44.7%) have the highest median income of $67,322 per family member.
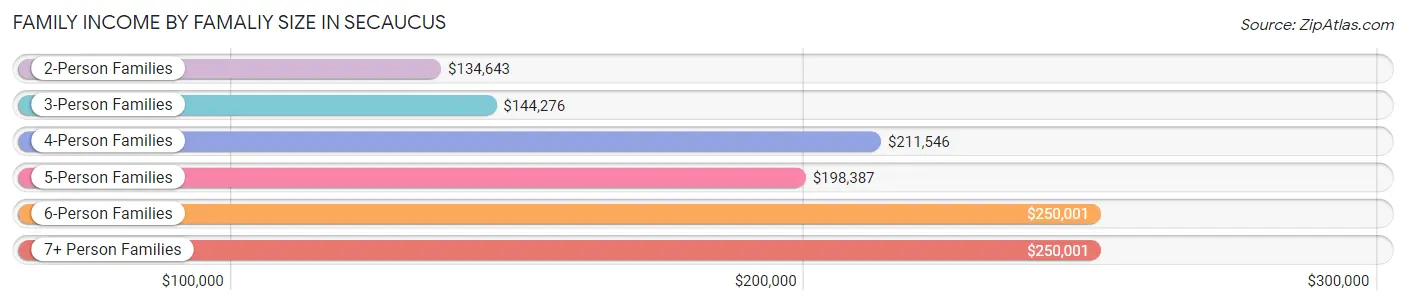
| Income Bracket | # Families | Median Income |
| 2-Person Families | 2,590 (44.7%) | $134,643 |
| 3-Person Families | 1,521 (26.2%) | $144,276 |
| 4-Person Families | 1,285 (22.2%) | $211,546 |
| 5-Person Families | 170 (2.9%) | $198,387 |
| 6-Person Families | 183 (3.2%) | $250,001 |
| 7+ Person Families | 48 (0.8%) | $250,001 |
| Total | 5,797 (100.0%) | $158,772 |
Family Income by Number of Earners in Secaucus
The median family income in Secaucus is $158,772, with families comprising 3+ earners (619) having the highest median family income of $215,707, while families with no earners (367) have the lowest median family income of $74,375, accounting for 10.7% and 6.3% of families, respectively.
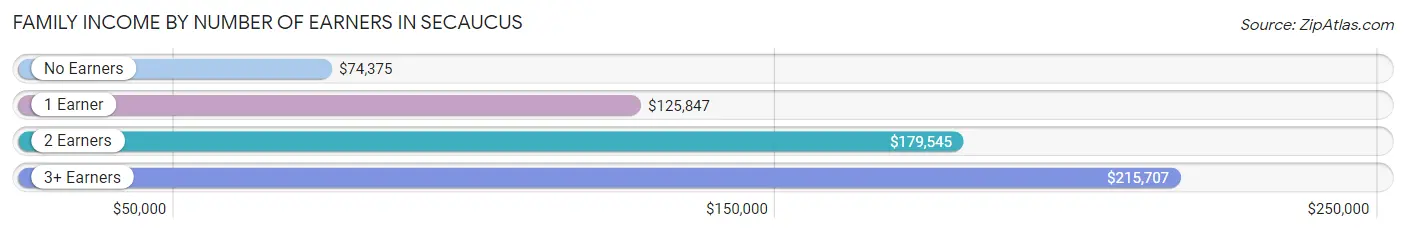
| Number of Earners | # Families | Median Income |
| No Earners | 367 (6.3%) | $74,375 |
| 1 Earner | 1,895 (32.7%) | $125,847 |
| 2 Earners | 2,916 (50.3%) | $179,545 |
| 3+ Earners | 619 (10.7%) | $215,707 |
| Total | 5,797 (100.0%) | $158,772 |
Household Income in Secaucus
Household Income Brackets in Secaucus
With 2,487 households falling in the category, the $200,000+ income range is the most frequent in Secaucus, accounting for 28.9% of all households. In contrast, only 95 households (1.1%) fall into the $10,000 to $14,999 income bracket, making it the least populous group.
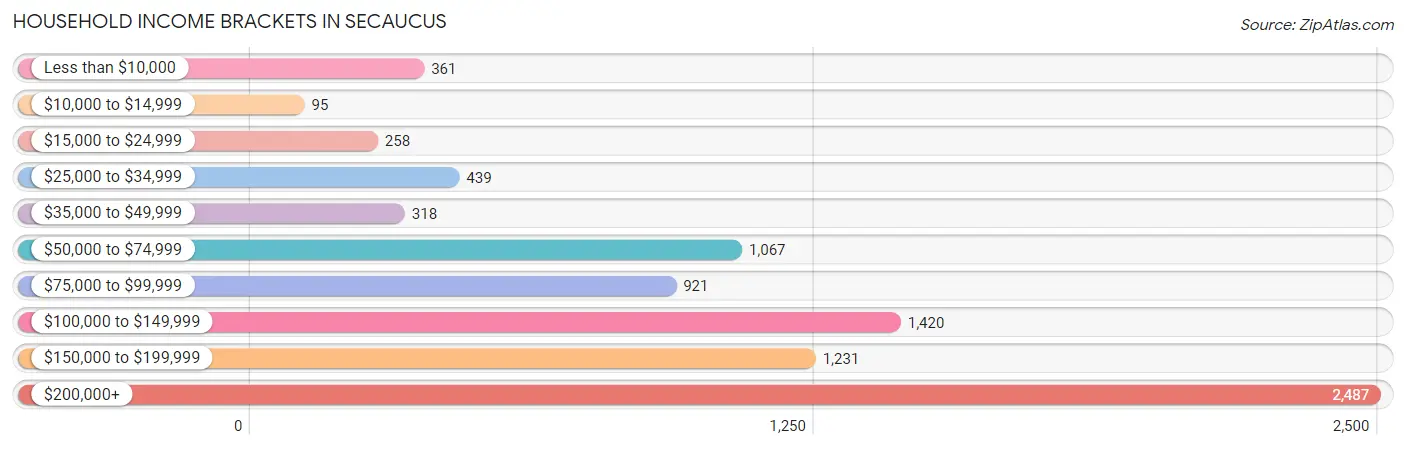
| Income Bracket | # Households | % Households |
| Less than $10,000 | 361 | 4.2% |
| $10,000 to $14,999 | 95 | 1.1% |
| $15,000 to $24,999 | 258 | 3.0% |
| $25,000 to $34,999 | 439 | 5.1% |
| $35,000 to $49,999 | 318 | 3.7% |
| $50,000 to $74,999 | 1,067 | 12.4% |
| $75,000 to $99,999 | 921 | 10.7% |
| $100,000 to $149,999 | 1,420 | 16.5% |
| $150,000 to $199,999 | 1,231 | 14.3% |
| $200,000+ | 2,487 | 28.9% |
Household Income by Householder Age in Secaucus
The median household income in Secaucus is $129,348, with the highest median household income of $160,866 found in the 25 to 44 years age bracket for the primary householder. A total of 3,559 households (41.3%) fall into this category. Meanwhile, the 15 to 24 years age bracket for the primary householder has the lowest median household income of $0, with 125 households (1.5%) in this group.
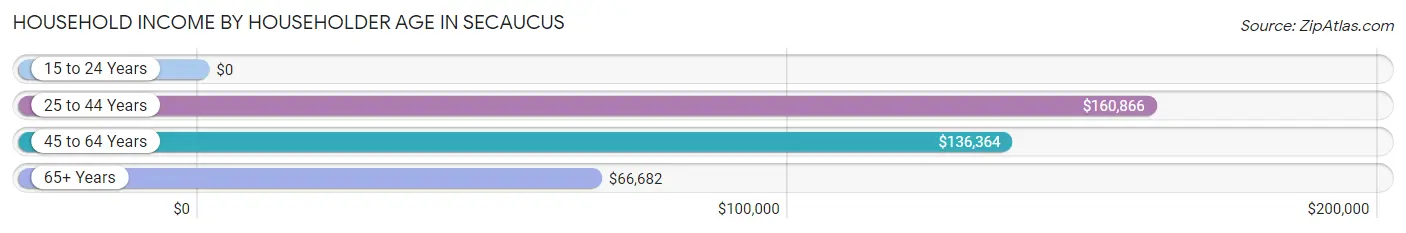
| Income Bracket | # Households | Median Income |
| 15 to 24 Years | 125 (1.5%) | $0 |
| 25 to 44 Years | 3,559 (41.3%) | $160,866 |
| 45 to 64 Years | 3,108 (36.1%) | $136,364 |
| 65+ Years | 1,815 (21.1%) | $66,682 |
| Total | 8,607 (100.0%) | $129,348 |
Poverty in Secaucus
Income Below Poverty by Sex and Age in Secaucus
With 6.6% poverty level for males and 4.0% for females among the residents of Secaucus, 75 year old and over males and 45 to 54 year old females are the most vulnerable to poverty, with 138 males (24.3%) and 158 females (11.8%) in their respective age groups living below the poverty level.
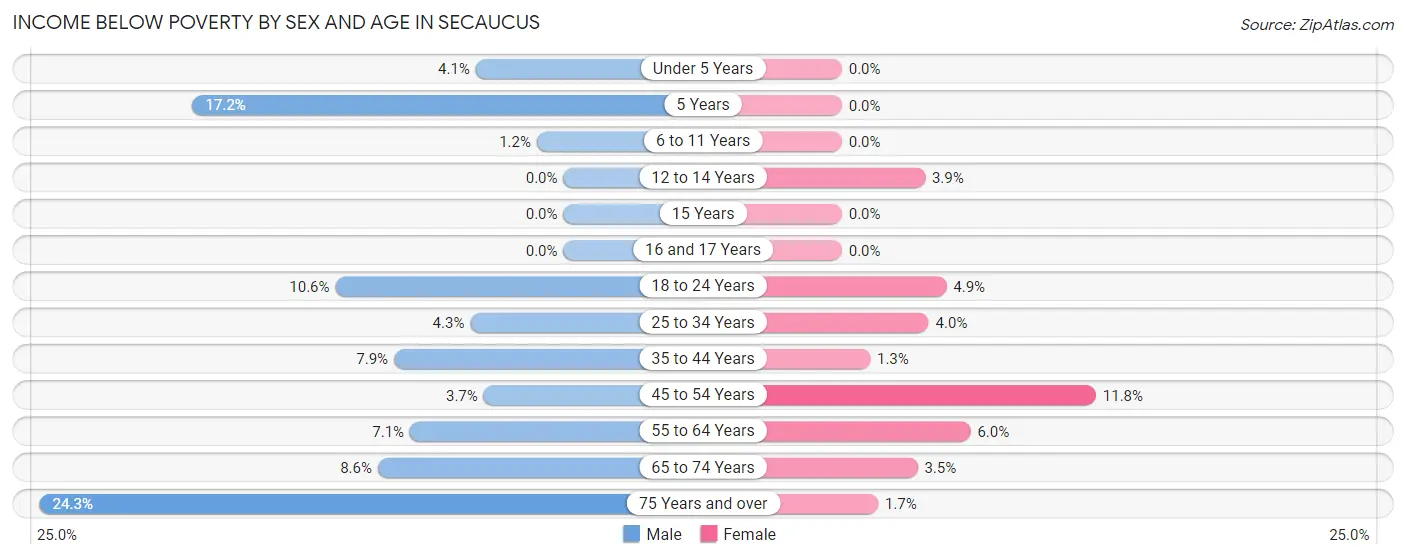
| Age Bracket | Male | Female |
| Under 5 Years | 22 (4.1%) | 0 (0.0%) |
| 5 Years | 21 (17.2%) | 0 (0.0%) |
| 6 to 11 Years | 10 (1.2%) | 0 (0.0%) |
| 12 to 14 Years | 0 (0.0%) | 9 (3.9%) |
| 15 Years | 0 (0.0%) | 0 (0.0%) |
| 16 and 17 Years | 0 (0.0%) | 0 (0.0%) |
| 18 to 24 Years | 77 (10.6%) | 13 (4.9%) |
| 25 to 34 Years | 95 (4.3%) | 83 (4.0%) |
| 35 to 44 Years | 136 (7.9%) | 19 (1.3%) |
| 45 to 54 Years | 55 (3.7%) | 158 (11.8%) |
| 55 to 64 Years | 83 (7.1%) | 88 (6.0%) |
| 65 to 74 Years | 63 (8.6%) | 41 (3.5%) |
| 75 Years and over | 138 (24.3%) | 11 (1.7%) |
| Total | 700 (6.6%) | 422 (4.0%) |
Income Above Poverty by Sex and Age in Secaucus
According to the poverty statistics in Secaucus, males aged 12 to 14 years and females aged under 5 years are the age groups that are most secure financially, with 100.0% of males and 100.0% of females in these age groups living above the poverty line.
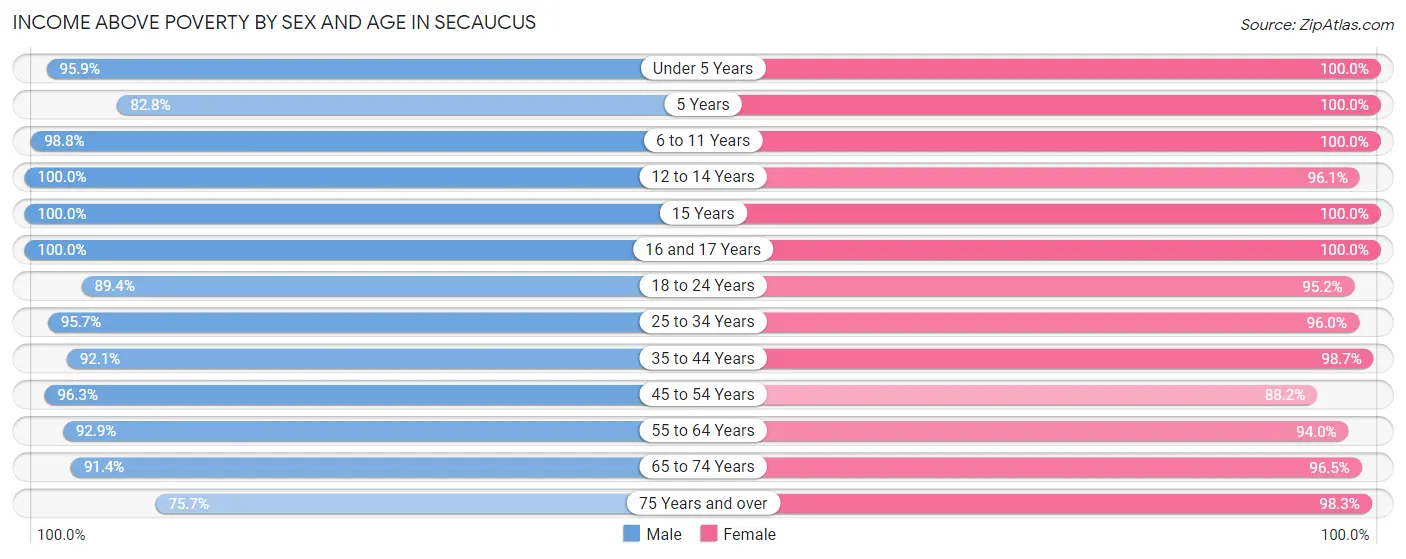
| Age Bracket | Male | Female |
| Under 5 Years | 519 (95.9%) | 515 (100.0%) |
| 5 Years | 101 (82.8%) | 58 (100.0%) |
| 6 to 11 Years | 801 (98.8%) | 950 (100.0%) |
| 12 to 14 Years | 230 (100.0%) | 224 (96.1%) |
| 15 Years | 131 (100.0%) | 96 (100.0%) |
| 16 and 17 Years | 211 (100.0%) | 192 (100.0%) |
| 18 to 24 Years | 651 (89.4%) | 255 (95.2%) |
| 25 to 34 Years | 2,105 (95.7%) | 1,979 (96.0%) |
| 35 to 44 Years | 1,594 (92.1%) | 1,430 (98.7%) |
| 45 to 54 Years | 1,430 (96.3%) | 1,182 (88.2%) |
| 55 to 64 Years | 1,082 (92.9%) | 1,385 (94.0%) |
| 65 to 74 Years | 669 (91.4%) | 1,126 (96.5%) |
| 75 Years and over | 430 (75.7%) | 643 (98.3%) |
| Total | 9,954 (93.4%) | 10,035 (96.0%) |
Income Below Poverty Among Married-Couple Families in Secaucus
The poverty statistics for married-couple families in Secaucus show that 0.8% or 37 of the total 4,463 families live below the poverty line. Families with 1 or 2 children have the highest poverty rate of 1.3%, comprising of 23 families. On the other hand, families with 3 or 4 children have the lowest poverty rate of 0.0%, which includes 0 families.
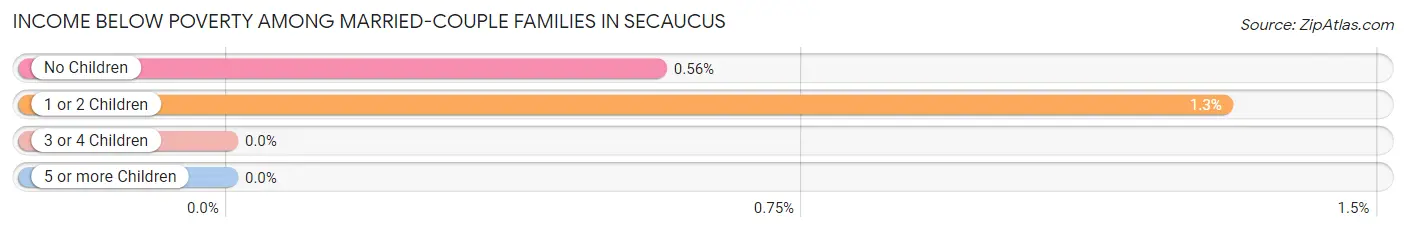
| Children | Above Poverty | Below Poverty |
| No Children | 2,491 (99.4%) | 14 (0.6%) |
| 1 or 2 Children | 1,747 (98.7%) | 23 (1.3%) |
| 3 or 4 Children | 188 (100.0%) | 0 (0.0%) |
| 5 or more Children | 0 (0.0%) | 0 (0.0%) |
| Total | 4,426 (99.2%) | 37 (0.8%) |
Income Below Poverty Among Single-Parent Households in Secaucus
According to the poverty data in Secaucus, 3.8% or 25 single-father households and 1.5% or 10 single-mother households are living below the poverty line. Among single-father households, those with no children have the highest poverty rate, with 25 households (6.2%) experiencing poverty. Likewise, among single-mother households, those with 1 or 2 children have the highest poverty rate, with 10 households (7.6%) falling below the poverty line.
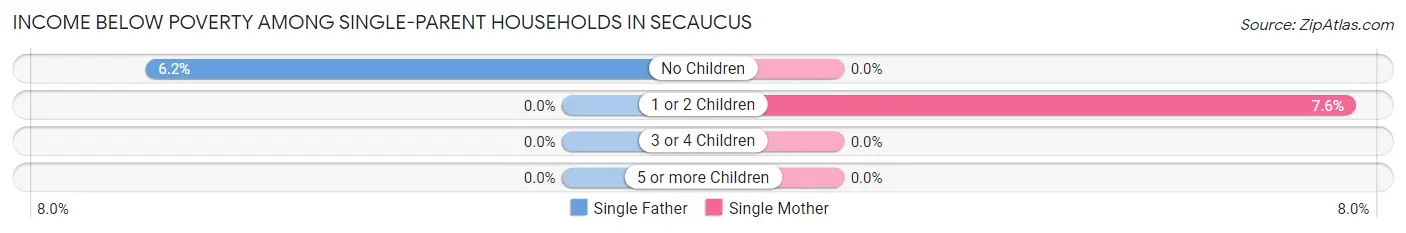
| Children | Single Father | Single Mother |
| No Children | 25 (6.2%) | 0 (0.0%) |
| 1 or 2 Children | 0 (0.0%) | 10 (7.6%) |
| 3 or 4 Children | 0 (0.0%) | 0 (0.0%) |
| 5 or more Children | 0 (0.0%) | 0 (0.0%) |
| Total | 25 (3.8%) | 10 (1.5%) |
Income Below Poverty Among Married-Couple vs Single-Parent Households in Secaucus
The poverty data for Secaucus shows that 37 of the married-couple family households (0.8%) and 35 of the single-parent households (2.6%) are living below the poverty level. Within the married-couple family households, those with 1 or 2 children have the highest poverty rate, with 23 households (1.3%) falling below the poverty line. Among the single-parent households, those with 1 or 2 children have the highest poverty rate, with 10 household (2.7%) living below poverty.
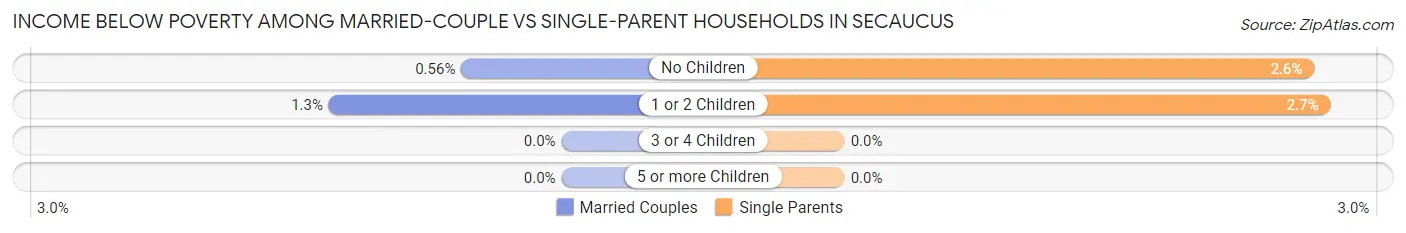
| Children | Married-Couple Families | Single-Parent Households |
| No Children | 14 (0.6%) | 25 (2.6%) |
| 1 or 2 Children | 23 (1.3%) | 10 (2.7%) |
| 3 or 4 Children | 0 (0.0%) | 0 (0.0%) |
| 5 or more Children | 0 (0.0%) | 0 (0.0%) |
| Total | 37 (0.8%) | 35 (2.6%) |
Race in Secaucus
The most populous races in Secaucus are White / Caucasian (9,941 | 46.3%), Asian (7,090 | 33.0%), and Hispanic or Latino (4,448 | 20.7%).
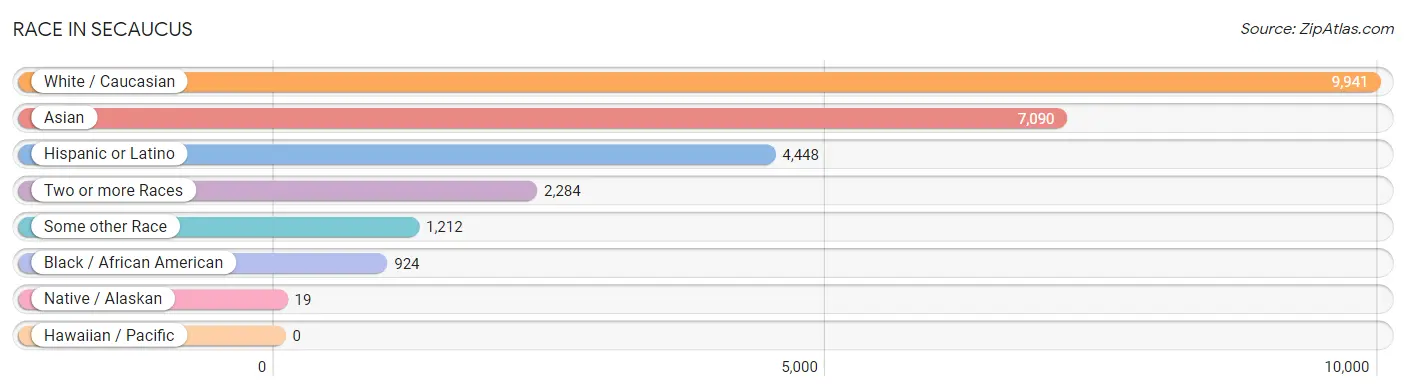
| Race | # Population | % Population |
| Asian | 7,090 | 33.0% |
| Black / African American | 924 | 4.3% |
| Hawaiian / Pacific | 0 | 0.0% |
| Hispanic or Latino | 4,448 | 20.7% |
| Native / Alaskan | 19 | 0.1% |
| White / Caucasian | 9,941 | 46.3% |
| Two or more Races | 2,284 | 10.6% |
| Some other Race | 1,212 | 5.7% |
| Total | 21,470 | 100.0% |
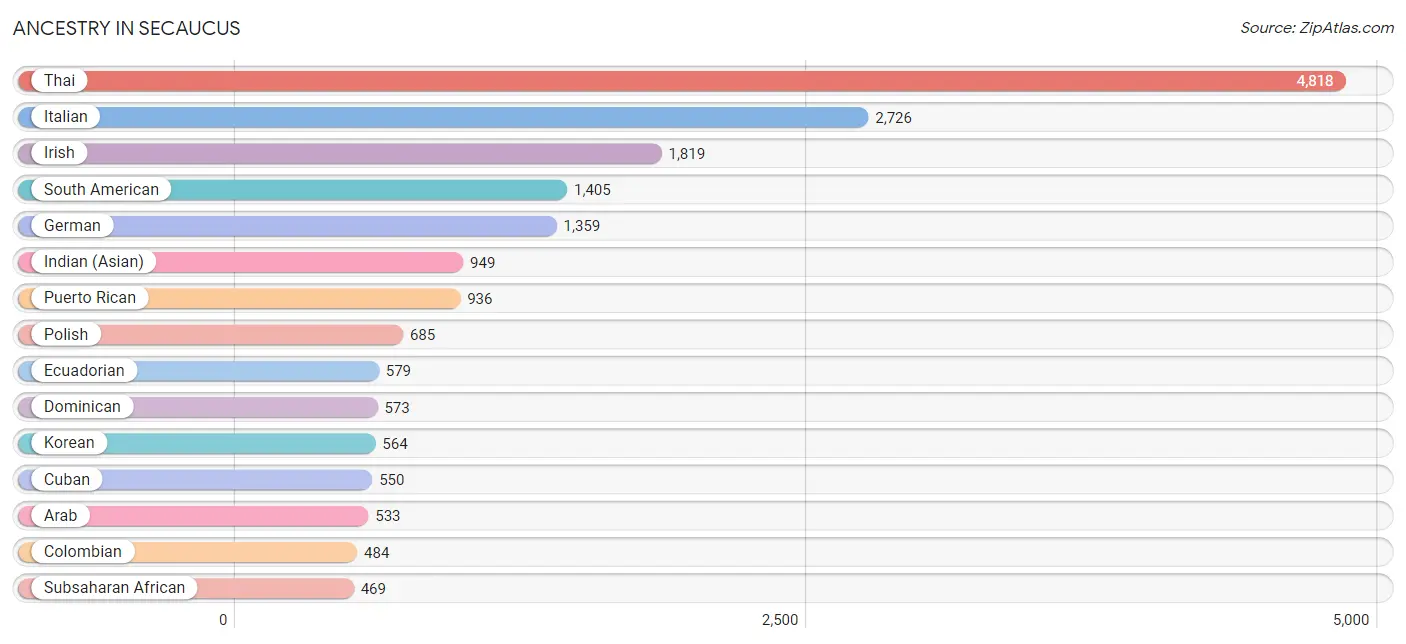
Ancestry in Secaucus
The most populous ancestries reported in Secaucus are Thai (4,818 | 22.4%), Italian (2,726 | 12.7%), Irish (1,819 | 8.5%), South American (1,405 | 6.5%), and German (1,359 | 6.3%), together accounting for 56.5% of all Secaucus residents.
| Ancestry | # Population | % Population |
| African | 223 | 1.0% |
| Albanian | 26 | 0.1% |
| American | 297 | 1.4% |
| Arab | 533 | 2.5% |
| Argentinean | 145 | 0.7% |
| Blackfeet | 25 | 0.1% |
| British | 41 | 0.2% |
| Bulgarian | 126 | 0.6% |
| Burmese | 246 | 1.1% |
| Central American | 171 | 0.8% |
| Colombian | 484 | 2.2% |
| Cuban | 550 | 2.6% |
| Delaware | 19 | 0.1% |
| Dominican | 573 | 2.7% |
| Dutch | 136 | 0.6% |
| Eastern European | 35 | 0.2% |
| Ecuadorian | 579 | 2.7% |
| Egyptian | 197 | 0.9% |
| English | 258 | 1.2% |
| Ethiopian | 98 | 0.5% |
| European | 86 | 0.4% |
| Filipino | 33 | 0.2% |
| French | 129 | 0.6% |
| German | 1,359 | 6.3% |
| Greek | 179 | 0.8% |
| Guatemalan | 24 | 0.1% |
| Honduran | 13 | 0.1% |
| Indian (Asian) | 949 | 4.4% |
| Indonesian | 52 | 0.2% |
| Iranian | 90 | 0.4% |
| Irish | 1,819 | 8.5% |
| Israeli | 29 | 0.1% |
| Italian | 2,726 | 12.7% |
| Jamaican | 93 | 0.4% |
| Jordanian | 156 | 0.7% |
| Korean | 564 | 2.6% |
| Lebanese | 21 | 0.1% |
| Lithuanian | 63 | 0.3% |
| Macedonian | 39 | 0.2% |
| Mexican | 427 | 2.0% |
| Moroccan | 64 | 0.3% |
| Nigerian | 51 | 0.2% |
| Palestinian | 37 | 0.2% |
| Panamanian | 24 | 0.1% |
| Peruvian | 173 | 0.8% |
| Polish | 685 | 3.2% |
| Portuguese | 34 | 0.2% |
| Puerto Rican | 936 | 4.4% |
| Romanian | 59 | 0.3% |
| Russian | 289 | 1.3% |
| Salvadoran | 110 | 0.5% |
| Scotch-Irish | 7 | 0.0% |
| Scottish | 23 | 0.1% |
| Slavic | 163 | 0.8% |
| Slovak | 11 | 0.1% |
| South American | 1,405 | 6.5% |
| Spaniard | 79 | 0.4% |
| Spanish | 26 | 0.1% |
| Sri Lankan | 53 | 0.3% |
| Subsaharan African | 469 | 2.2% |
| Sudanese | 38 | 0.2% |
| Swedish | 29 | 0.1% |
| Swiss | 15 | 0.1% |
| Syrian | 20 | 0.1% |
| Thai | 4,818 | 22.4% |
| Trinidadian and Tobagonian | 52 | 0.2% |
| Ukrainian | 115 | 0.5% |
| Venezuelan | 24 | 0.1% |
| Vietnamese | 19 | 0.1% |
| Welsh | 43 | 0.2% |
| Yugoslavian | 69 | 0.3% | View All 71 Rows |
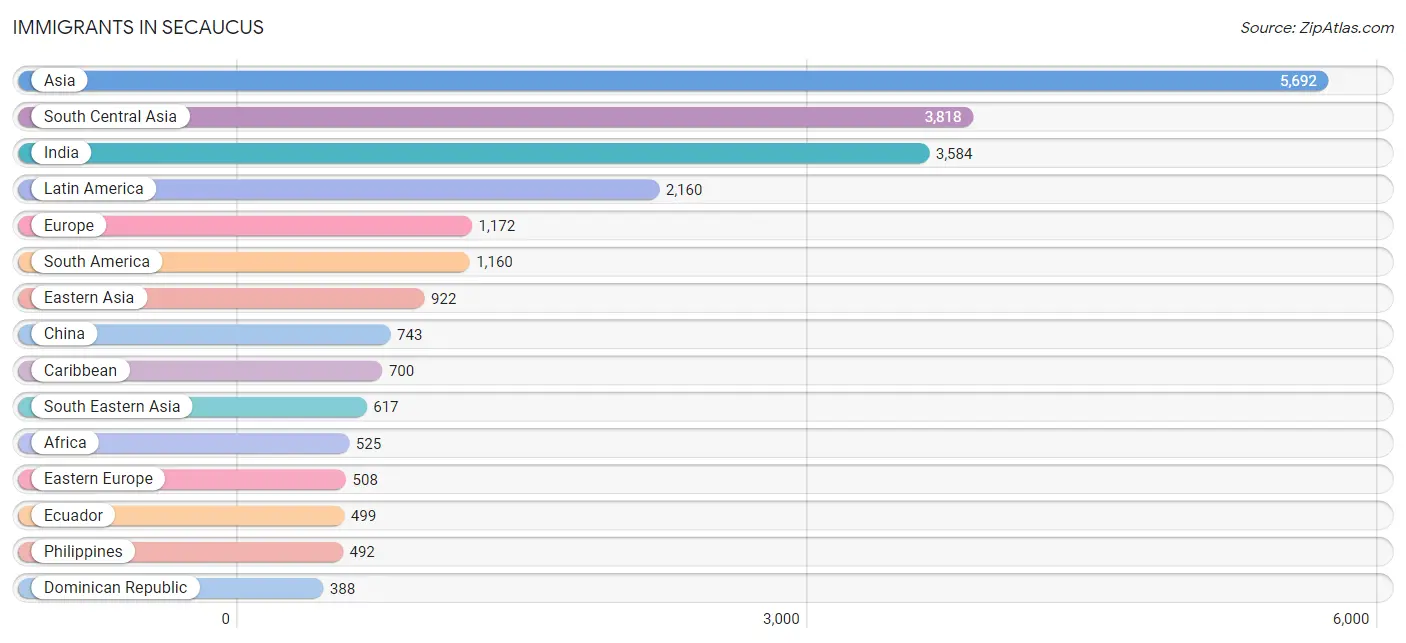
Immigrants in Secaucus
The most numerous immigrant groups reported in Secaucus came from Asia (5,692 | 26.5%), South Central Asia (3,818 | 17.8%), India (3,584 | 16.7%), Latin America (2,160 | 10.1%), and Europe (1,172 | 5.5%), together accounting for 76.5% of all Secaucus residents.
| Immigration Origin | # Population | % Population |
| Africa | 525 | 2.5% |
| Albania | 26 | 0.1% |
| Argentina | 40 | 0.2% |
| Asia | 5,692 | 26.5% |
| Australia | 17 | 0.1% |
| Bangladesh | 19 | 0.1% |
| Brazil | 97 | 0.4% |
| Bulgaria | 241 | 1.1% |
| Cameroon | 32 | 0.2% |
| Caribbean | 700 | 3.3% |
| Central America | 300 | 1.4% |
| China | 743 | 3.5% |
| Colombia | 325 | 1.5% |
| Cuba | 264 | 1.2% |
| Dominican Republic | 388 | 1.8% |
| Eastern Africa | 169 | 0.8% |
| Eastern Asia | 922 | 4.3% |
| Eastern Europe | 508 | 2.4% |
| Ecuador | 499 | 2.3% |
| Egypt | 54 | 0.3% |
| El Salvador | 94 | 0.4% |
| Ethiopia | 110 | 0.5% |
| Europe | 1,172 | 5.5% |
| France | 82 | 0.4% |
| Germany | 50 | 0.2% |
| Greece | 37 | 0.2% |
| Guatemala | 3 | 0.0% |
| Guyana | 11 | 0.1% |
| Honduras | 13 | 0.1% |
| Hong Kong | 111 | 0.5% |
| Hungary | 2 | 0.0% |
| India | 3,584 | 16.7% |
| Iran | 19 | 0.1% |
| Israel | 90 | 0.4% |
| Italy | 208 | 1.0% |
| Jamaica | 9 | 0.0% |
| Jordan | 142 | 0.7% |
| Korea | 179 | 0.8% |
| Kuwait | 11 | 0.1% |
| Latin America | 2,160 | 10.1% |
| Malaysia | 8 | 0.0% |
| Mexico | 166 | 0.8% |
| Middle Africa | 32 | 0.2% |
| Moldova | 93 | 0.4% |
| Morocco | 38 | 0.2% |
| Nepal | 7 | 0.0% |
| Nigeria | 51 | 0.2% |
| North Macedonia | 39 | 0.2% |
| Northern Africa | 130 | 0.6% |
| Northern Europe | 263 | 1.2% |
| Oceania | 17 | 0.1% |
| Pakistan | 169 | 0.8% |
| Panama | 24 | 0.1% |
| Peru | 164 | 0.8% |
| Philippines | 492 | 2.3% |
| Poland | 38 | 0.2% |
| Russia | 69 | 0.3% |
| Saudi Arabia | 72 | 0.3% |
| South America | 1,160 | 5.4% |
| South Central Asia | 3,818 | 17.8% |
| South Eastern Asia | 617 | 2.9% |
| Southern Europe | 269 | 1.3% |
| Spain | 24 | 0.1% |
| Sri Lanka | 20 | 0.1% |
| Sudan | 38 | 0.2% |
| Syria | 20 | 0.1% |
| Taiwan | 33 | 0.2% |
| Trinidad and Tobago | 39 | 0.2% |
| Venezuela | 24 | 0.1% |
| Vietnam | 65 | 0.3% |
| Western Africa | 194 | 0.9% |
| Western Asia | 335 | 1.6% |
| Western Europe | 132 | 0.6% | View All 73 Rows |
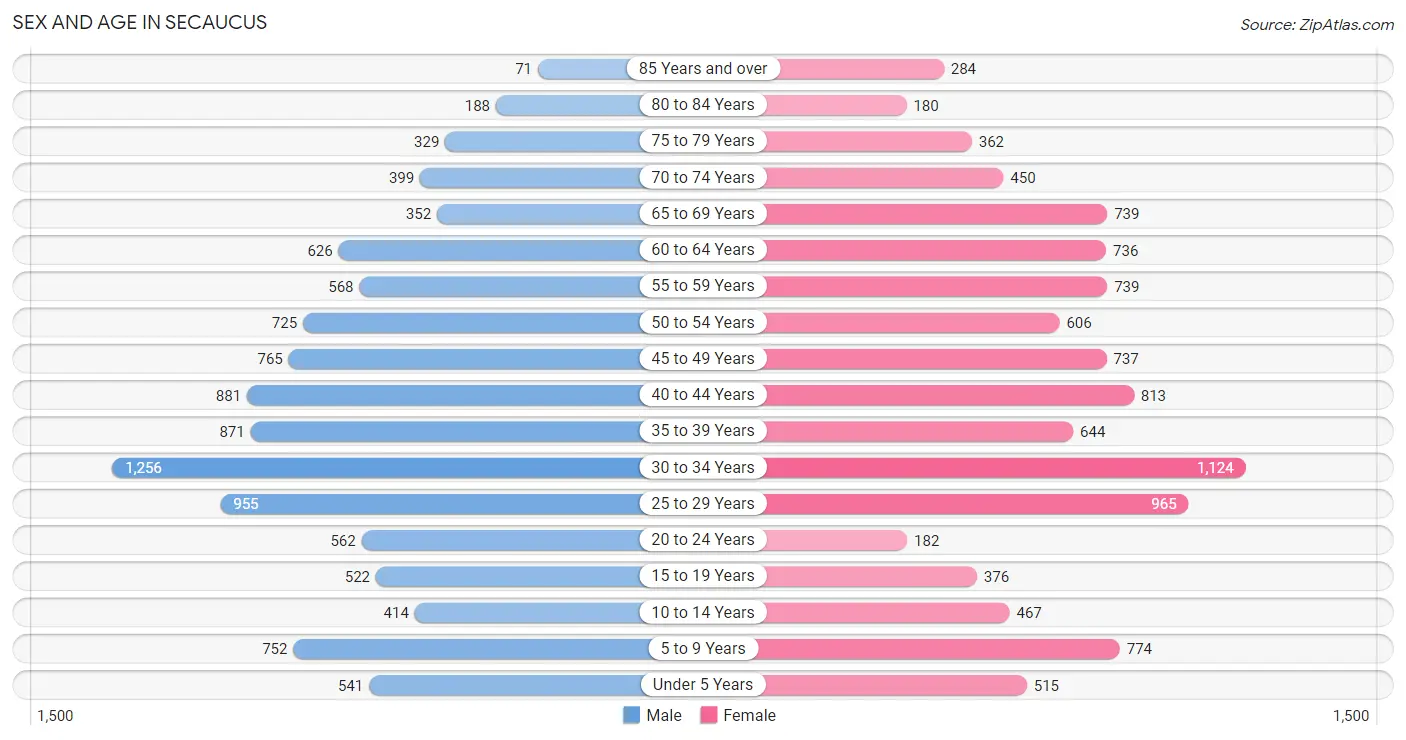
Sex and Age in Secaucus
Sex and Age in Secaucus
The most populous age groups in Secaucus are 30 to 34 Years (1,256 | 11.7%) for men and 30 to 34 Years (1,124 | 10.5%) for women.
| Age Bracket | Male | Female |
| Under 5 Years | 541 (5.0%) | 515 (4.8%) |
| 5 to 9 Years | 752 (7.0%) | 774 (7.2%) |
| 10 to 14 Years | 414 (3.8%) | 467 (4.4%) |
| 15 to 19 Years | 522 (4.8%) | 376 (3.5%) |
| 20 to 24 Years | 562 (5.2%) | 182 (1.7%) |
| 25 to 29 Years | 955 (8.9%) | 965 (9.0%) |
| 30 to 34 Years | 1,256 (11.7%) | 1,124 (10.5%) |
| 35 to 39 Years | 871 (8.1%) | 644 (6.0%) |
| 40 to 44 Years | 881 (8.2%) | 813 (7.6%) |
| 45 to 49 Years | 765 (7.1%) | 737 (6.9%) |
| 50 to 54 Years | 725 (6.7%) | 606 (5.7%) |
| 55 to 59 Years | 568 (5.3%) | 739 (6.9%) |
| 60 to 64 Years | 626 (5.8%) | 736 (6.9%) |
| 65 to 69 Years | 352 (3.3%) | 739 (6.9%) |
| 70 to 74 Years | 399 (3.7%) | 450 (4.2%) |
| 75 to 79 Years | 329 (3.0%) | 362 (3.4%) |
| 80 to 84 Years | 188 (1.7%) | 180 (1.7%) |
| 85 Years and over | 71 (0.7%) | 284 (2.7%) |
| Total | 10,777 (100.0%) | 10,693 (100.0%) |
Families and Households in Secaucus
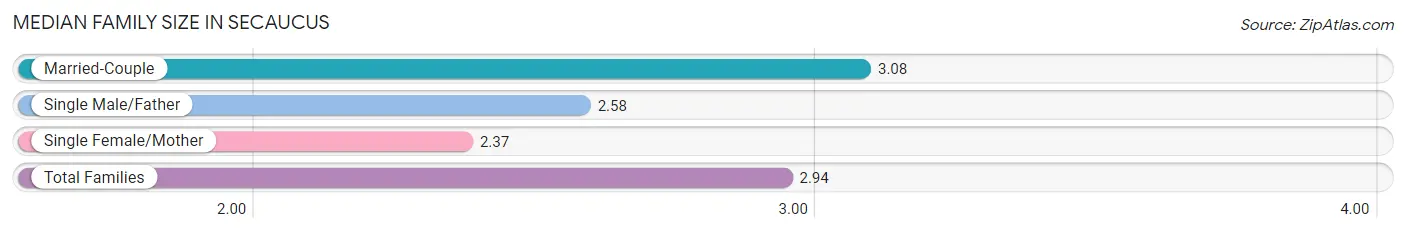
Median Family Size in Secaucus
The median family size in Secaucus is 2.94 persons per family, with married-couple families (4,463 | 77.0%) accounting for the largest median family size of 3.08 persons per family. On the other hand, single female/mother families (680 | 11.7%) represent the smallest median family size with 2.37 persons per family.
| Family Type | # Families | Family Size |
| Married-Couple | 4,463 (77.0%) | 3.08 |
| Single Male/Father | 654 (11.3%) | 2.58 |
| Single Female/Mother | 680 (11.7%) | 2.37 |
| Total Families | 5,797 (100.0%) | 2.94 |
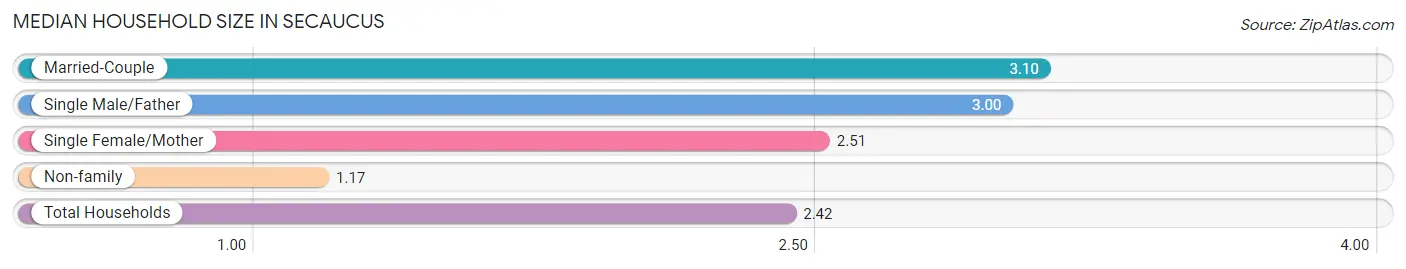
Median Household Size in Secaucus
The median household size in Secaucus is 2.42 persons per household, with married-couple households (4,463 | 51.8%) accounting for the largest median household size of 3.1 persons per household. non-family households (2,810 | 32.7%) represent the smallest median household size with 1.17 persons per household.
| Household Type | # Households | Household Size |
| Married-Couple | 4,463 (51.8%) | 3.10 |
| Single Male/Father | 654 (7.6%) | 3.00 |
| Single Female/Mother | 680 (7.9%) | 2.51 |
| Non-family | 2,810 (32.7%) | 1.17 |
| Total Households | 8,607 (100.0%) | 2.42 |
Household Size by Marriage Status in Secaucus
Out of a total of 8,607 households in Secaucus, 5,797 (67.3%) are family households, while 2,810 (32.7%) are nonfamily households. The most numerous type of family households are 2-person households, comprising 2,406, and the most common type of nonfamily households are 1-person households, comprising 2,313.
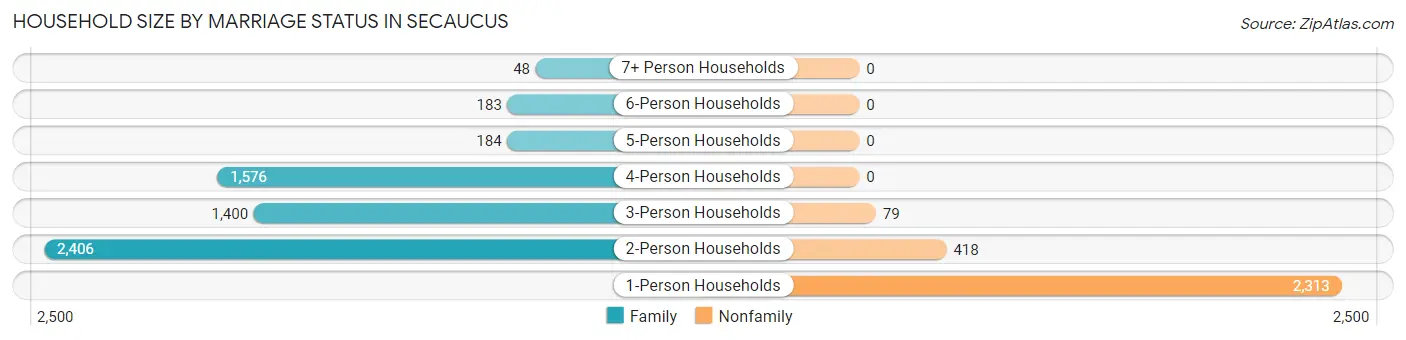
| Household Size | Family Households | Nonfamily Households |
| 1-Person Households | - | 2,313 (26.9%) |
| 2-Person Households | 2,406 (28.0%) | 418 (4.9%) |
| 3-Person Households | 1,400 (16.3%) | 79 (0.9%) |
| 4-Person Households | 1,576 (18.3%) | 0 (0.0%) |
| 5-Person Households | 184 (2.1%) | 0 (0.0%) |
| 6-Person Households | 183 (2.1%) | 0 (0.0%) |
| 7+ Person Households | 48 (0.6%) | 0 (0.0%) |
| Total | 5,797 (67.3%) | 2,810 (32.7%) |
Female Fertility in Secaucus
Fertility by Age in Secaucus
Average fertility rate in Secaucus is 63.0 births per 1,000 women. Women in the age bracket of 20 to 34 years have the highest fertility rate with 87.0 births per 1,000 women. Women in the age bracket of 20 to 34 years acount for 62.9% of all women with births.
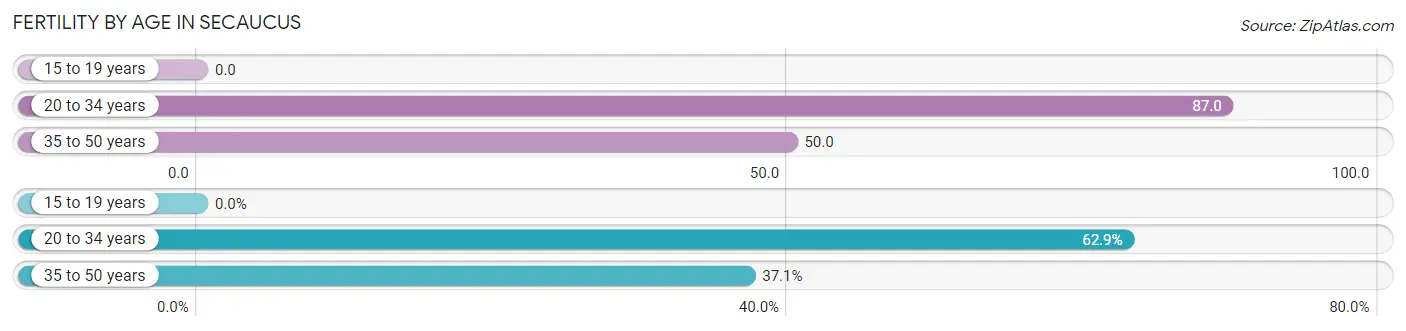
| Age Bracket | Women with Births | Births / 1,000 Women |
| 15 to 19 years | 0 (0.0%) | 0.0 |
| 20 to 34 years | 198 (62.9%) | 87.0 |
| 35 to 50 years | 117 (37.1%) | 50.0 |
| Total | 315 (100.0%) | 63.0 |
Fertility by Age by Marriage Status in Secaucus
85.7% of women with births (315) in Secaucus are married. The highest percentage of unmarried women with births falls into 35 to 50 years age bracket with 38.5% of them unmarried at the time of birth, while the lowest percentage of unmarried women with births belong to 20 to 34 years age bracket with 0.0% of them unmarried.
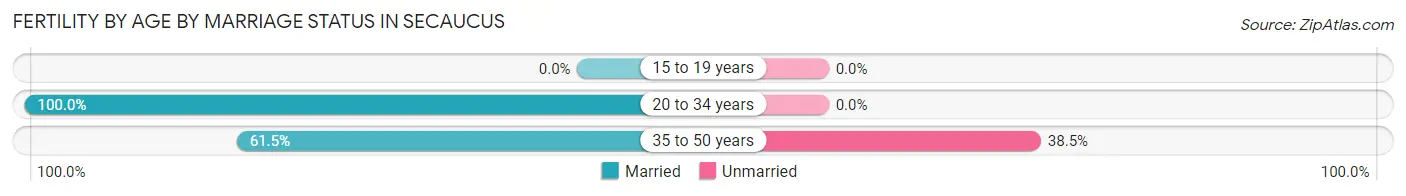
| Age Bracket | Married | Unmarried |
| 15 to 19 years | 0 (0.0%) | 0 (0.0%) |
| 20 to 34 years | 198 (100.0%) | 0 (0.0%) |
| 35 to 50 years | 72 (61.5%) | 45 (38.5%) |
| Total | 270 (85.7%) | 45 (14.3%) |
Fertility by Education in Secaucus
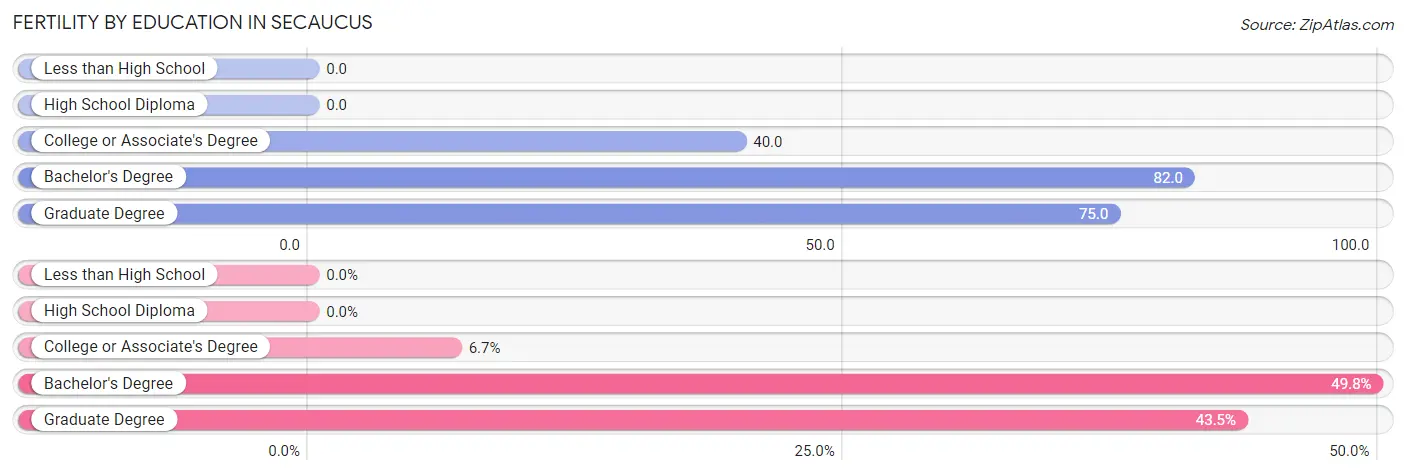
| Educational Attainment | Women with Births | Births / 1,000 Women |
| Less than High School | 0 (0.0%) | 0.0 |
| High School Diploma | 0 (0.0%) | 0.0 |
| College or Associate's Degree | 21 (6.7%) | 40.0 |
| Bachelor's Degree | 157 (49.8%) | 82.0 |
| Graduate Degree | 137 (43.5%) | 75.0 |
| Total | 315 (100.0%) | 63.0 |
Fertility by Education by Marriage Status in Secaucus
14.3% of women with births in Secaucus are unmarried. Women with the educational attainment of college or associate's degree are most likely to be married with 100.0% of them married at childbirth, while women with the educational attainment of graduate degree are least likely to be married with 32.9% of them unmarried at childbirth.
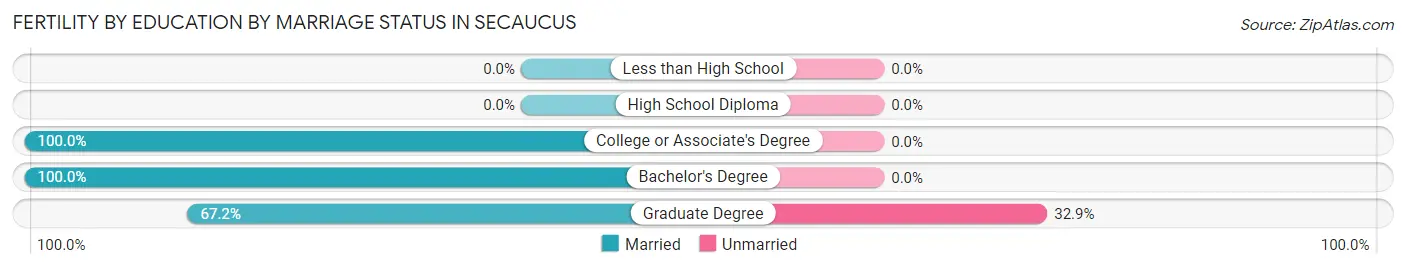
| Educational Attainment | Married | Unmarried |
| Less than High School | 0 (0.0%) | 0 (0.0%) |
| High School Diploma | 0 (0.0%) | 0 (0.0%) |
| College or Associate's Degree | 21 (100.0%) | 0 (0.0%) |
| Bachelor's Degree | 157 (100.0%) | 0 (0.0%) |
| Graduate Degree | 92 (67.1%) | 45 (32.9%) |
| Total | 270 (85.7%) | 45 (14.3%) |
Employment Characteristics in Secaucus
Employment by Class of Employer in Secaucus
Among the 11,098 employed individuals in Secaucus, private company employees (7,960 | 71.7%), local government employees (975 | 8.8%), and not-for-profit organizations (887 | 8.0%) make up the most common classes of employment.
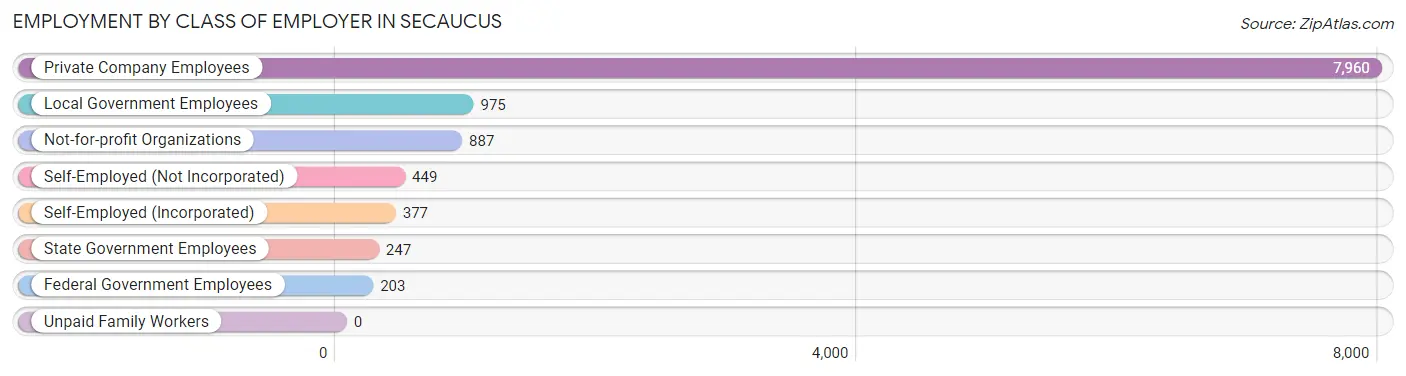
| Employer Class | # Employees | % Employees |
| Private Company Employees | 7,960 | 71.7% |
| Self-Employed (Incorporated) | 377 | 3.4% |
| Self-Employed (Not Incorporated) | 449 | 4.1% |
| Not-for-profit Organizations | 887 | 8.0% |
| Local Government Employees | 975 | 8.8% |
| State Government Employees | 247 | 2.2% |
| Federal Government Employees | 203 | 1.8% |
| Unpaid Family Workers | 0 | 0.0% |
| Total | 11,098 | 100.0% |
Employment Status by Age in Secaucus
According to the labor force statistics for Secaucus, out of the total population over 16 years of age (17,779), 67.2% or 11,947 individuals are in the labor force, with 6.5% or 777 of them unemployed. The age group with the highest labor force participation rate is 55 to 59 years, with 87.5% or 1,144 individuals in the labor force. Within the labor force, the 75 years and over age range has the highest percentage of unemployed individuals, with 26.3% or 15 of them being unemployed.
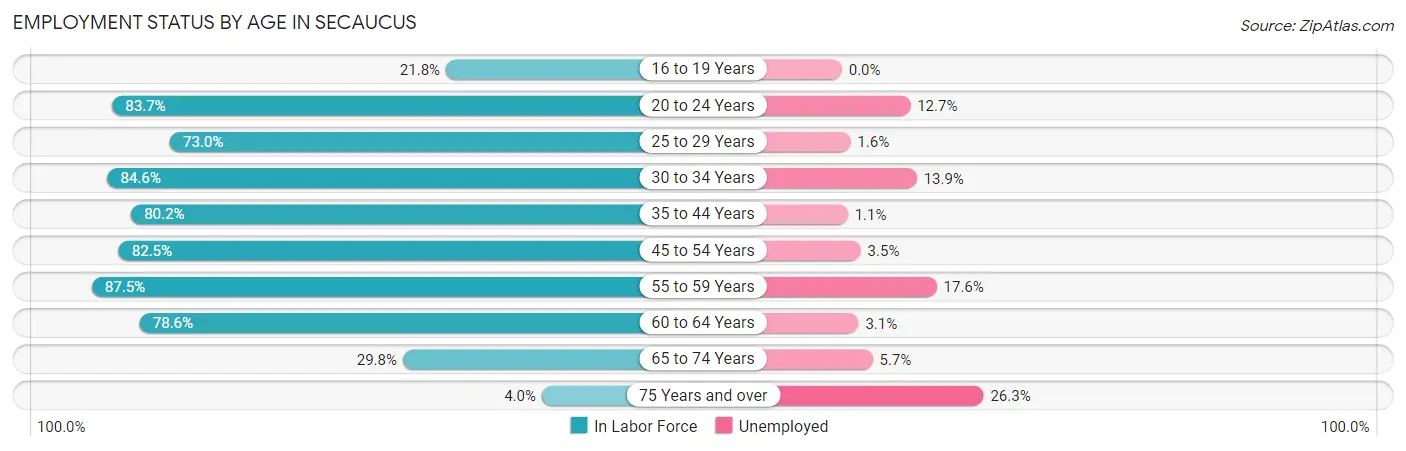
| Age Bracket | In Labor Force | Unemployed |
| 16 to 19 Years | 146 (21.8%) | 0 (0.0%) |
| 20 to 24 Years | 623 (83.7%) | 79 (12.7%) |
| 25 to 29 Years | 1,402 (73.0%) | 22 (1.6%) |
| 30 to 34 Years | 2,013 (84.6%) | 280 (13.9%) |
| 35 to 44 Years | 2,574 (80.2%) | 28 (1.1%) |
| 45 to 54 Years | 2,337 (82.5%) | 82 (3.5%) |
| 55 to 59 Years | 1,144 (87.5%) | 201 (17.6%) |
| 60 to 64 Years | 1,071 (78.6%) | 33 (3.1%) |
| 65 to 74 Years | 578 (29.8%) | 33 (5.7%) |
| 75 Years and over | 57 (4.0%) | 15 (26.3%) |
| Total | 11,947 (67.2%) | 777 (6.5%) |
Employment Status by Educational Attainment in Secaucus
According to labor force statistics for Secaucus, 81.0% of individuals (10,539) out of the total population between 25 and 64 years of age (13,011) are in the labor force, with 6.1% or 643 of them being unemployed. The group with the highest labor force participation rate are those with the educational attainment of college / associate degree, with 88.7% or 1,749 individuals in the labor force. Within the labor force, individuals with high school diploma education have the highest percentage of unemployment, with 12.5% or 177 of them being unemployed.
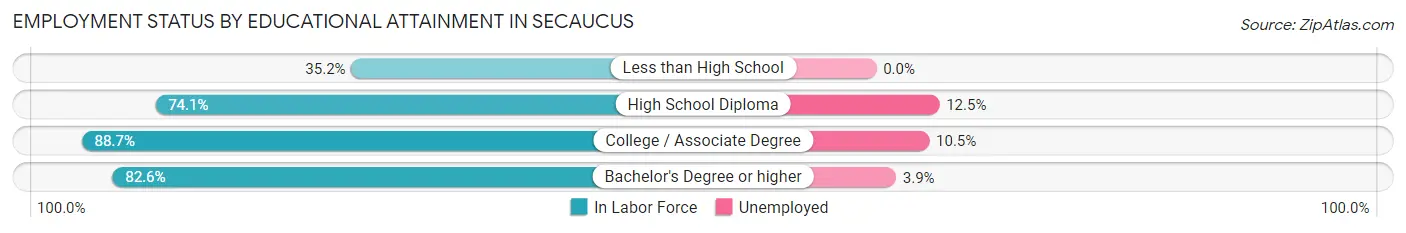
| Educational Attainment | In Labor Force | Unemployed |
| Less than High School | 119 (35.2%) | 0 (0.0%) |
| High School Diploma | 1,417 (74.1%) | 239 (12.5%) |
| College / Associate Degree | 1,749 (88.7%) | 207 (10.5%) |
| Bachelor's Degree or higher | 7,260 (82.6%) | 343 (3.9%) |
| Total | 10,539 (81.0%) | 794 (6.1%) |
Employment Occupations by Sex in Secaucus
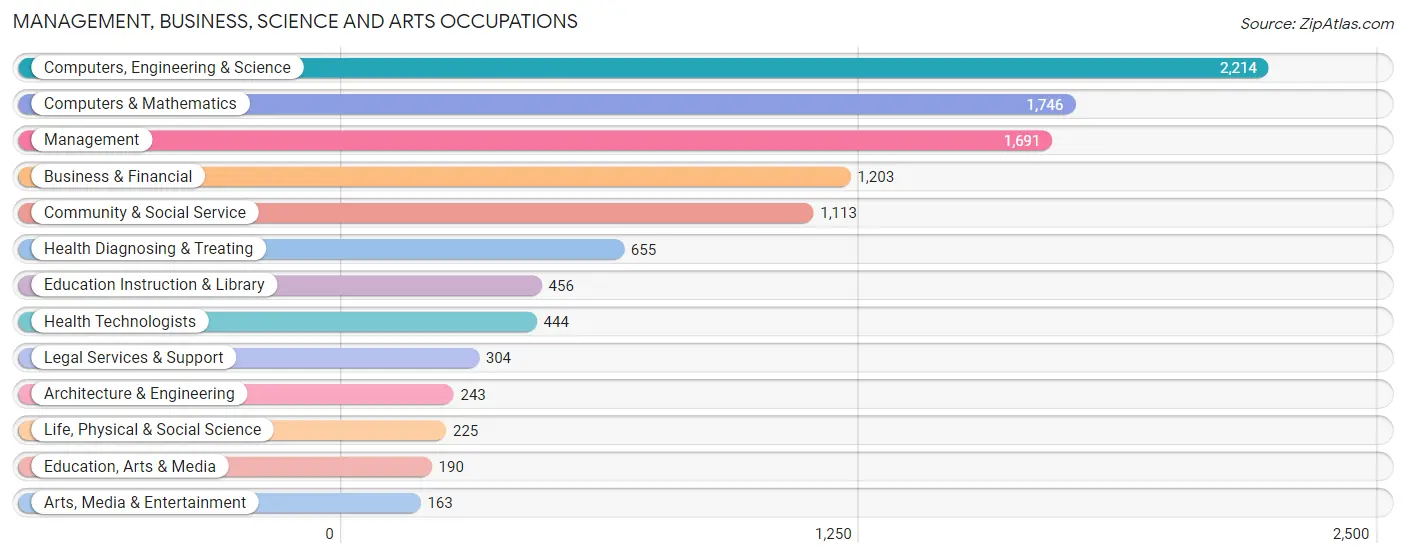
Management, Business, Science and Arts Occupations
The most common Management, Business, Science and Arts occupations in Secaucus are Computers, Engineering & Science (2,214 | 19.8%), Computers & Mathematics (1,746 | 15.6%), Management (1,691 | 15.1%), Business & Financial (1,203 | 10.8%), and Community & Social Service (1,113 | 10.0%).
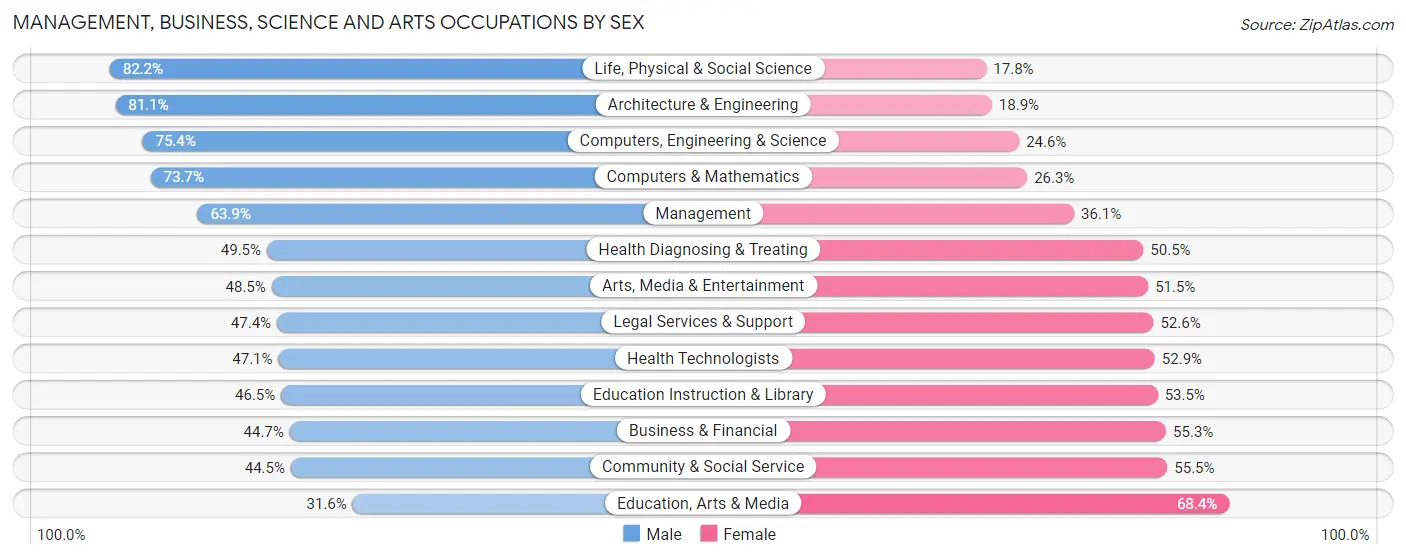
Management, Business, Science and Arts Occupations by Sex
Within the Management, Business, Science and Arts occupations in Secaucus, the most male-oriented occupations are Life, Physical & Social Science (82.2%), Architecture & Engineering (81.1%), and Computers, Engineering & Science (75.4%), while the most female-oriented occupations are Education, Arts & Media (68.4%), Community & Social Service (55.5%), and Business & Financial (55.3%).
| Occupation | Male | Female |
| Management | 1,081 (63.9%) | 610 (36.1%) |
| Business & Financial | 538 (44.7%) | 665 (55.3%) |
| Computers, Engineering & Science | 1,669 (75.4%) | 545 (24.6%) |
| Computers & Mathematics | 1,287 (73.7%) | 459 (26.3%) |
| Architecture & Engineering | 197 (81.1%) | 46 (18.9%) |
| Life, Physical & Social Science | 185 (82.2%) | 40 (17.8%) |
| Community & Social Service | 495 (44.5%) | 618 (55.5%) |
| Education, Arts & Media | 60 (31.6%) | 130 (68.4%) |
| Legal Services & Support | 144 (47.4%) | 160 (52.6%) |
| Education Instruction & Library | 212 (46.5%) | 244 (53.5%) |
| Arts, Media & Entertainment | 79 (48.5%) | 84 (51.5%) |
| Health Diagnosing & Treating | 324 (49.5%) | 331 (50.5%) |
| Health Technologists | 209 (47.1%) | 235 (52.9%) |
| Total (Category) | 4,107 (59.7%) | 2,769 (40.3%) |
| Total (Overall) | 6,281 (56.2%) | 4,893 (43.8%) |
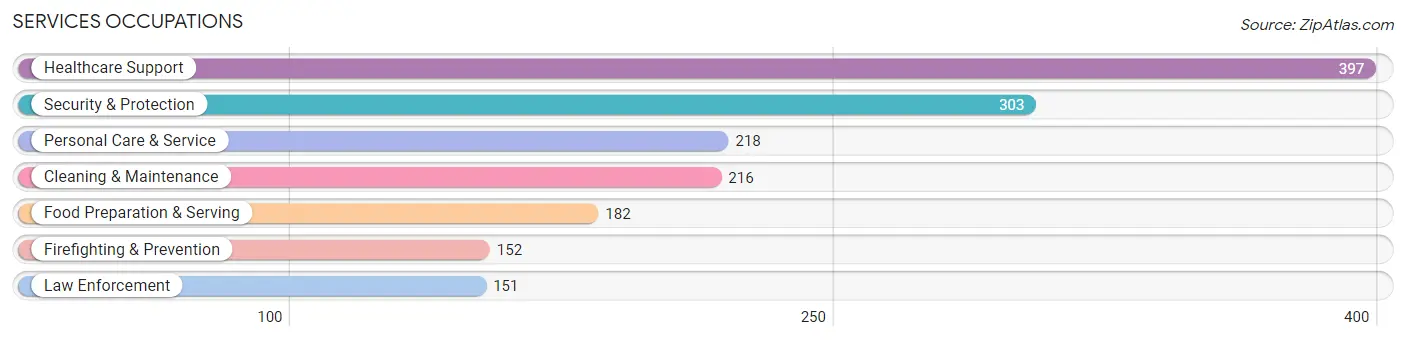
Services Occupations
The most common Services occupations in Secaucus are Healthcare Support (397 | 3.5%), Security & Protection (303 | 2.7%), Personal Care & Service (218 | 1.9%), Cleaning & Maintenance (216 | 1.9%), and Food Preparation & Serving (182 | 1.6%).
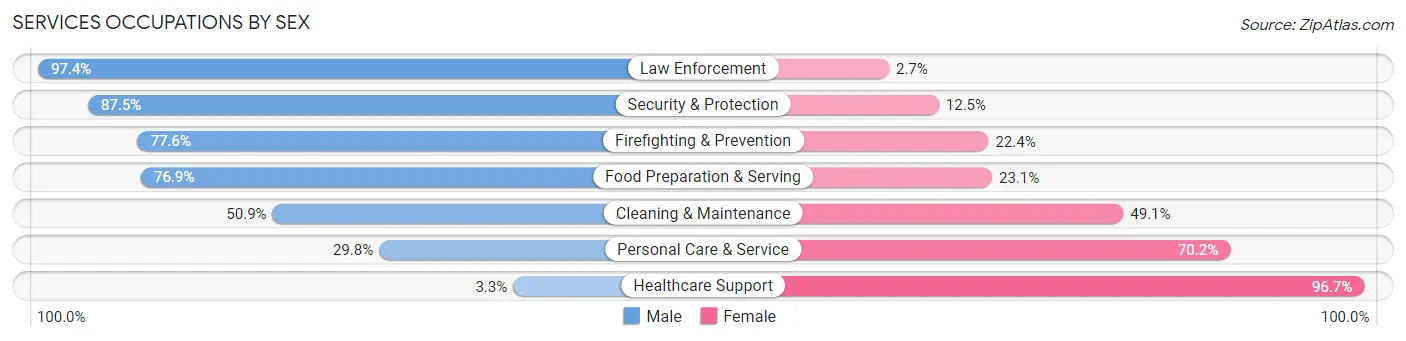
Services Occupations by Sex
Within the Services occupations in Secaucus, the most male-oriented occupations are Law Enforcement (97.4%), Security & Protection (87.5%), and Firefighting & Prevention (77.6%), while the most female-oriented occupations are Healthcare Support (96.7%), Personal Care & Service (70.2%), and Cleaning & Maintenance (49.1%).
| Occupation | Male | Female |
| Healthcare Support | 13 (3.3%) | 384 (96.7%) |
| Security & Protection | 265 (87.5%) | 38 (12.5%) |
| Firefighting & Prevention | 118 (77.6%) | 34 (22.4%) |
| Law Enforcement | 147 (97.4%) | 4 (2.6%) |
| Food Preparation & Serving | 140 (76.9%) | 42 (23.1%) |
| Cleaning & Maintenance | 110 (50.9%) | 106 (49.1%) |
| Personal Care & Service | 65 (29.8%) | 153 (70.2%) |
| Total (Category) | 593 (45.1%) | 723 (54.9%) |
| Total (Overall) | 6,281 (56.2%) | 4,893 (43.8%) |
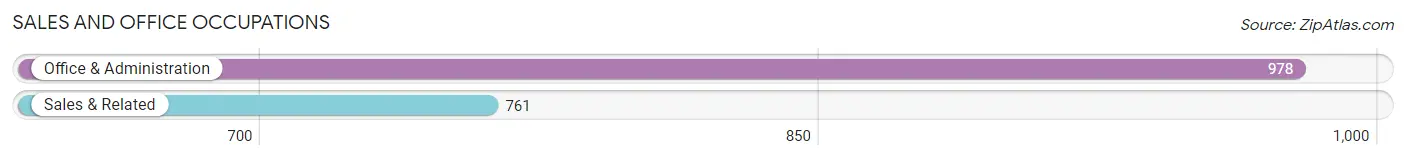
Sales and Office Occupations
The most common Sales and Office occupations in Secaucus are Office & Administration (978 | 8.7%), and Sales & Related (761 | 6.8%).
Sales and Office Occupations by Sex
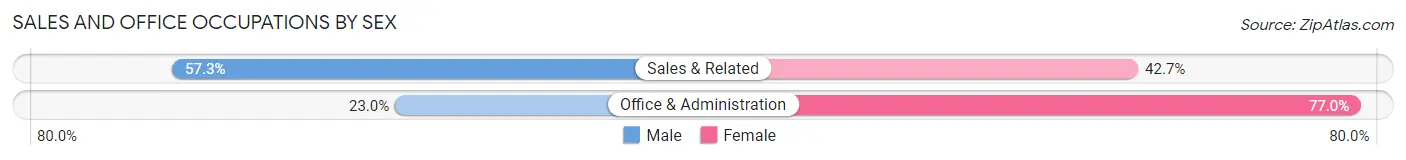
| Occupation | Male | Female |
| Sales & Related | 436 (57.3%) | 325 (42.7%) |
| Office & Administration | 225 (23.0%) | 753 (77.0%) |
| Total (Category) | 661 (38.0%) | 1,078 (62.0%) |
| Total (Overall) | 6,281 (56.2%) | 4,893 (43.8%) |
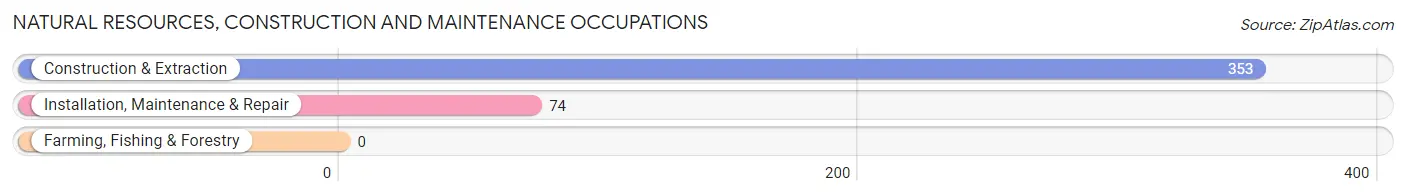
Natural Resources, Construction and Maintenance Occupations
The most common Natural Resources, Construction and Maintenance occupations in Secaucus are Construction & Extraction (353 | 3.2%), and Installation, Maintenance & Repair (74 | 0.7%).
Natural Resources, Construction and Maintenance Occupations by Sex
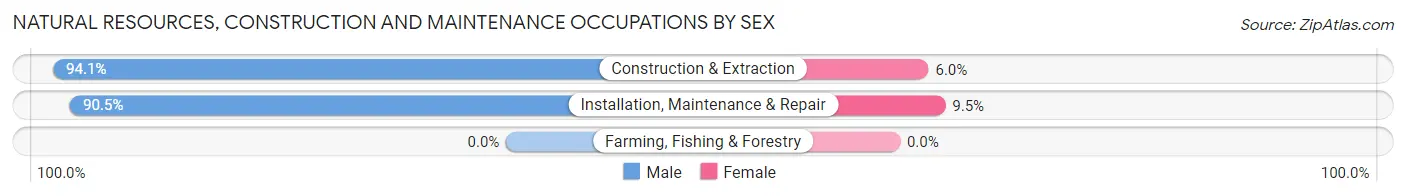
| Occupation | Male | Female |
| Farming, Fishing & Forestry | 0 (0.0%) | 0 (0.0%) |
| Construction & Extraction | 332 (94.1%) | 21 (5.9%) |
| Installation, Maintenance & Repair | 67 (90.5%) | 7 (9.5%) |
| Total (Category) | 399 (93.4%) | 28 (6.6%) |
| Total (Overall) | 6,281 (56.2%) | 4,893 (43.8%) |
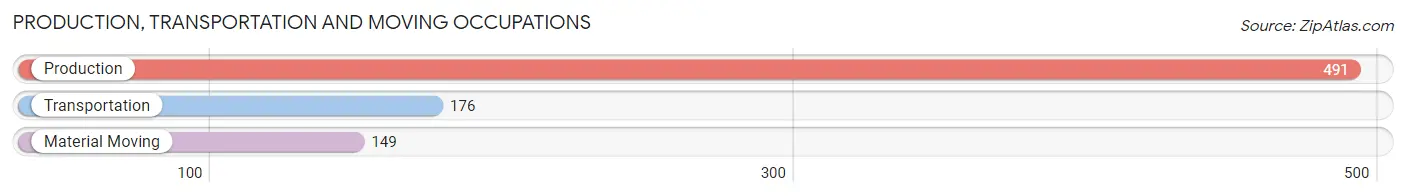
Production, Transportation and Moving Occupations
The most common Production, Transportation and Moving occupations in Secaucus are Production (491 | 4.4%), Transportation (176 | 1.6%), and Material Moving (149 | 1.3%).
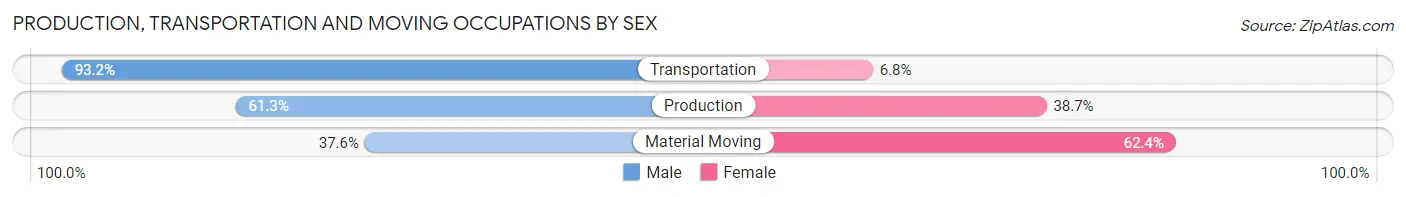
Production, Transportation and Moving Occupations by Sex
| Occupation | Male | Female |
| Production | 301 (61.3%) | 190 (38.7%) |
| Transportation | 164 (93.2%) | 12 (6.8%) |
| Material Moving | 56 (37.6%) | 93 (62.4%) |
| Total (Category) | 521 (63.8%) | 295 (36.1%) |
| Total (Overall) | 6,281 (56.2%) | 4,893 (43.8%) |
Employment Industries by Sex in Secaucus
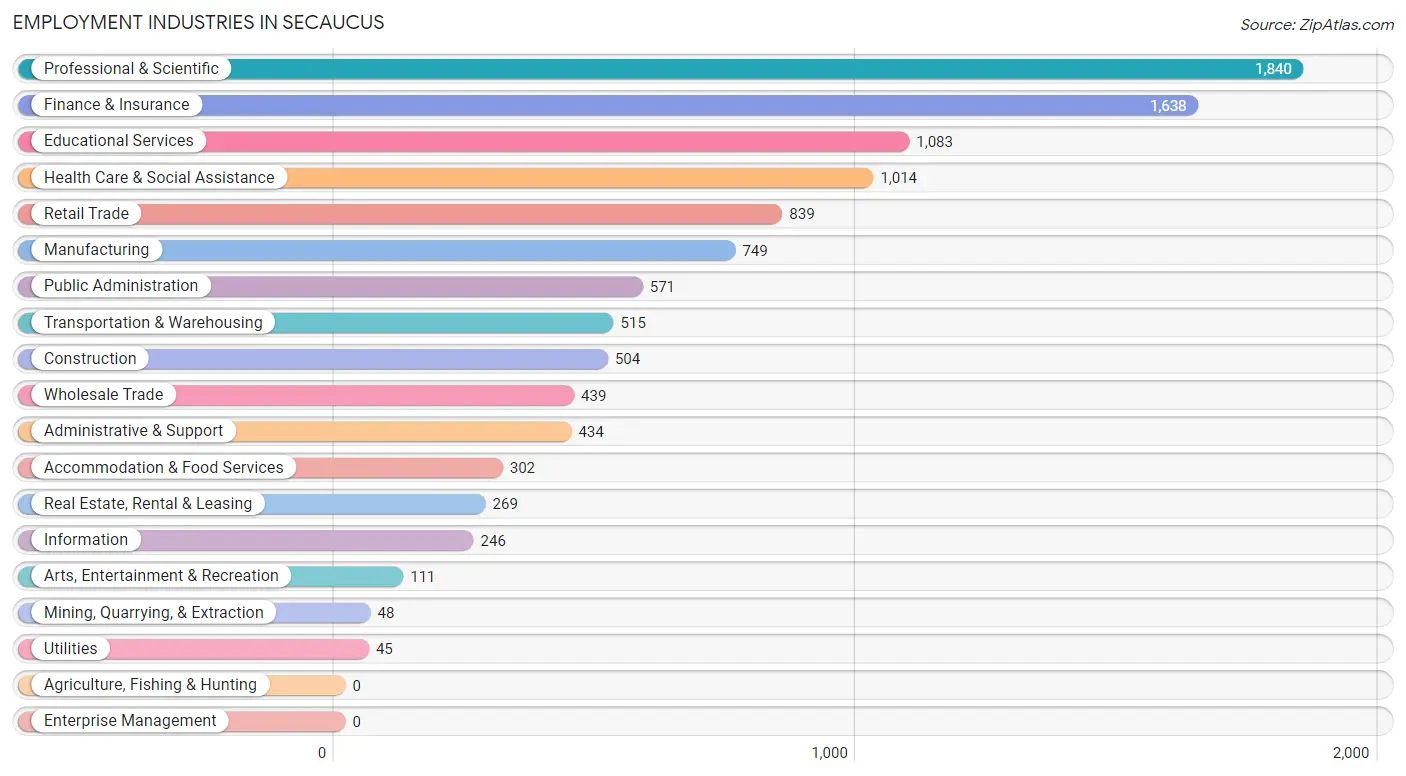
Employment Industries in Secaucus
The major employment industries in Secaucus include Professional & Scientific (1,840 | 16.5%), Finance & Insurance (1,638 | 14.7%), Educational Services (1,083 | 9.7%), Health Care & Social Assistance (1,014 | 9.1%), and Retail Trade (839 | 7.5%).
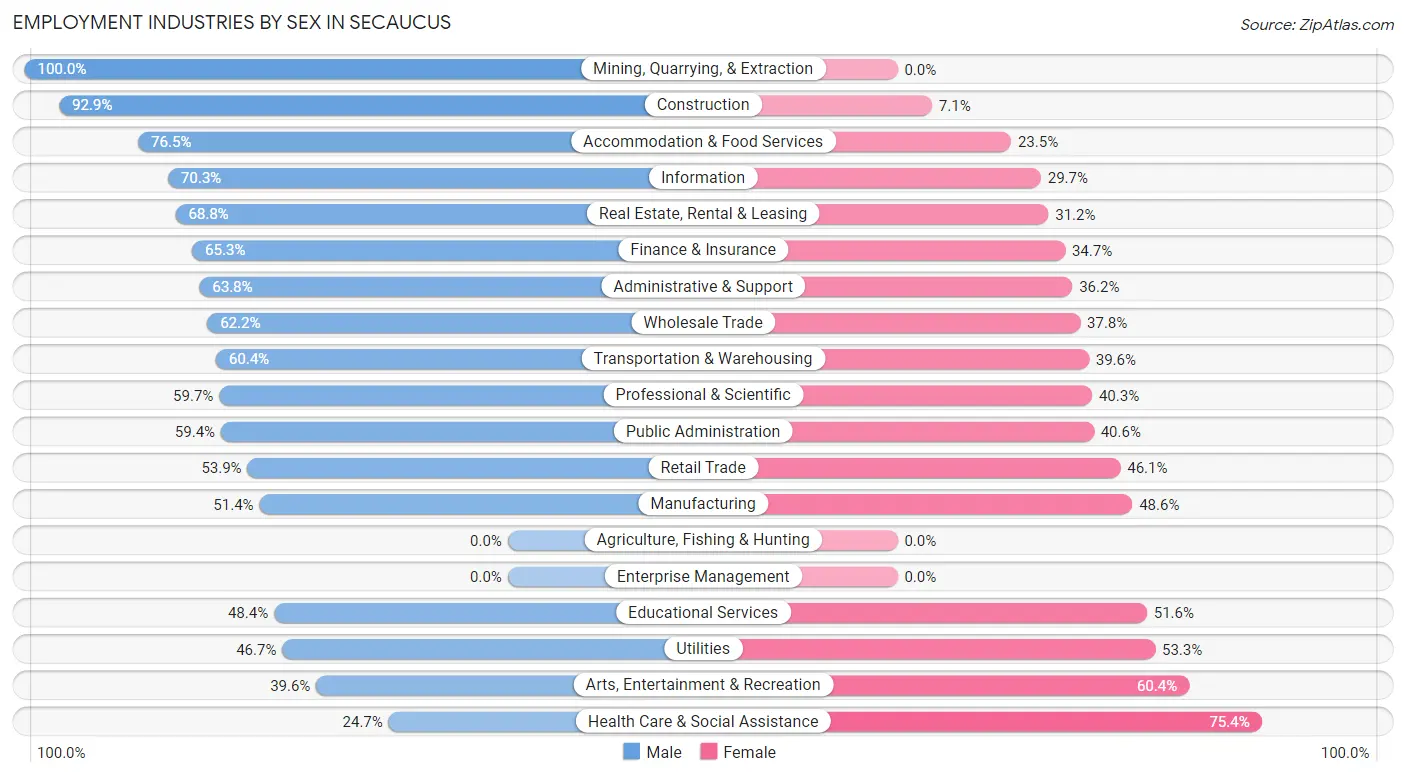
Employment Industries by Sex in Secaucus
The Secaucus industries that see more men than women are Mining, Quarrying, & Extraction (100.0%), Construction (92.9%), and Accommodation & Food Services (76.5%), whereas the industries that tend to have a higher number of women are Health Care & Social Assistance (75.3%), Arts, Entertainment & Recreation (60.4%), and Utilities (53.3%).
| Industry | Male | Female |
| Agriculture, Fishing & Hunting | 0 (0.0%) | 0 (0.0%) |
| Mining, Quarrying, & Extraction | 48 (100.0%) | 0 (0.0%) |
| Construction | 468 (92.9%) | 36 (7.1%) |
| Manufacturing | 385 (51.4%) | 364 (48.6%) |
| Wholesale Trade | 273 (62.2%) | 166 (37.8%) |
| Retail Trade | 452 (53.9%) | 387 (46.1%) |
| Transportation & Warehousing | 311 (60.4%) | 204 (39.6%) |
| Utilities | 21 (46.7%) | 24 (53.3%) |
| Information | 173 (70.3%) | 73 (29.7%) |
| Finance & Insurance | 1,070 (65.3%) | 568 (34.7%) |
| Real Estate, Rental & Leasing | 185 (68.8%) | 84 (31.2%) |
| Professional & Scientific | 1,099 (59.7%) | 741 (40.3%) |
| Enterprise Management | 0 (0.0%) | 0 (0.0%) |
| Administrative & Support | 277 (63.8%) | 157 (36.2%) |
| Educational Services | 524 (48.4%) | 559 (51.6%) |
| Health Care & Social Assistance | 250 (24.6%) | 764 (75.3%) |
| Arts, Entertainment & Recreation | 44 (39.6%) | 67 (60.4%) |
| Accommodation & Food Services | 231 (76.5%) | 71 (23.5%) |
| Public Administration | 339 (59.4%) | 232 (40.6%) |
| Total | 6,281 (56.2%) | 4,893 (43.8%) |
Education in Secaucus
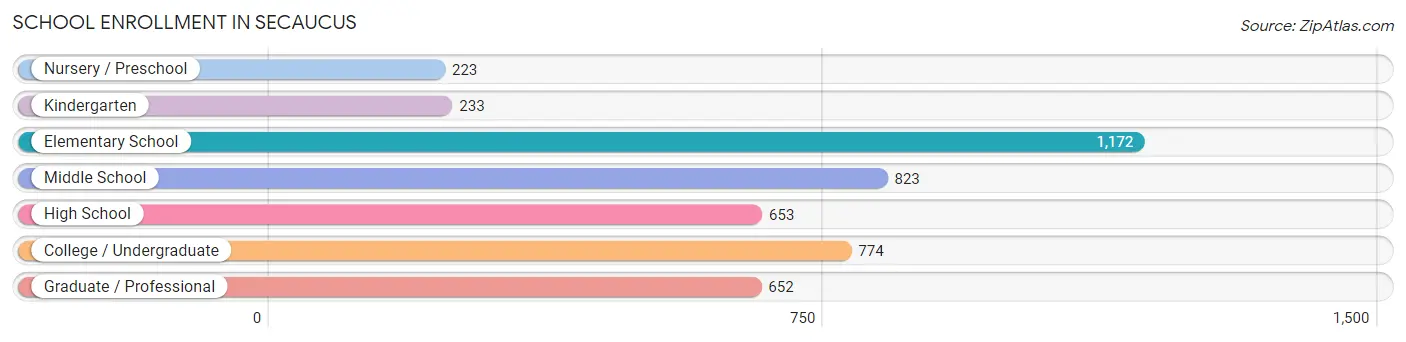
School Enrollment in Secaucus
The most common levels of schooling among the 4,530 students in Secaucus are elementary school (1,172 | 25.9%), middle school (823 | 18.2%), and college / undergraduate (774 | 17.1%).
| School Level | # Students | % Students |
| Nursery / Preschool | 223 | 4.9% |
| Kindergarten | 233 | 5.1% |
| Elementary School | 1,172 | 25.9% |
| Middle School | 823 | 18.2% |
| High School | 653 | 14.4% |
| College / Undergraduate | 774 | 17.1% |
| Graduate / Professional | 652 | 14.4% |
| Total | 4,530 | 100.0% |
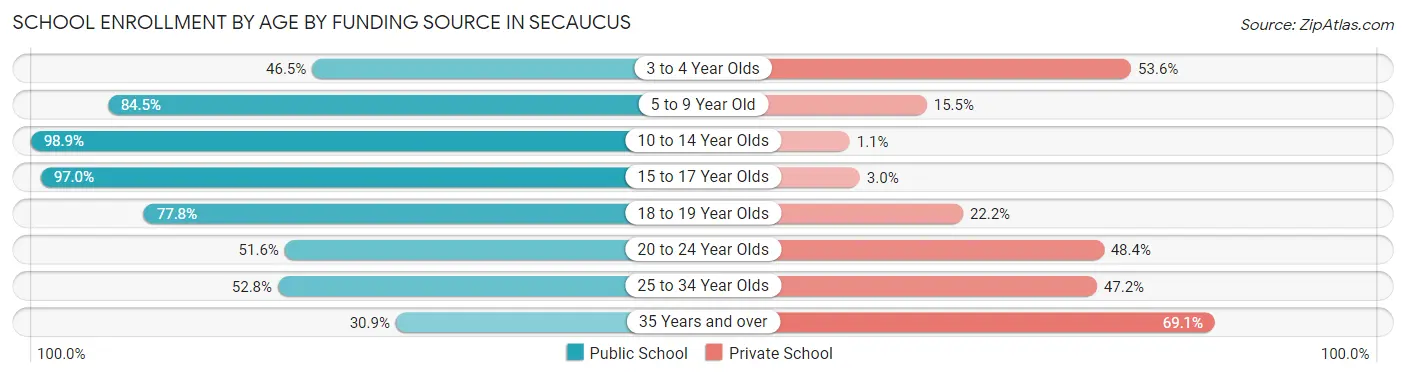
School Enrollment by Age by Funding Source in Secaucus
Out of a total of 4,530 students who are enrolled in schools in Secaucus, 1,051 (23.2%) attend a private institution, while the remaining 3,479 (76.8%) are enrolled in public schools. The age group of 35 years and over has the highest likelihood of being enrolled in private schools, with 271 (69.1% in the age bracket) enrolled. Conversely, the age group of 10 to 14 year olds has the lowest likelihood of being enrolled in a private school, with 871 (98.9% in the age bracket) attending a public institution.
| Age Bracket | Public School | Private School |
| 3 to 4 Year Olds | 72 (46.5%) | 83 (53.5%) |
| 5 to 9 Year Old | 1,196 (84.5%) | 219 (15.5%) |
| 10 to 14 Year Olds | 871 (98.9%) | 10 (1.1%) |
| 15 to 17 Year Olds | 611 (97.0%) | 19 (3.0%) |
| 18 to 19 Year Olds | 161 (77.8%) | 46 (22.2%) |
| 20 to 24 Year Olds | 165 (51.6%) | 155 (48.4%) |
| 25 to 34 Year Olds | 280 (52.8%) | 250 (47.2%) |
| 35 Years and over | 121 (30.9%) | 271 (69.1%) |
| Total | 3,479 (76.8%) | 1,051 (23.2%) |
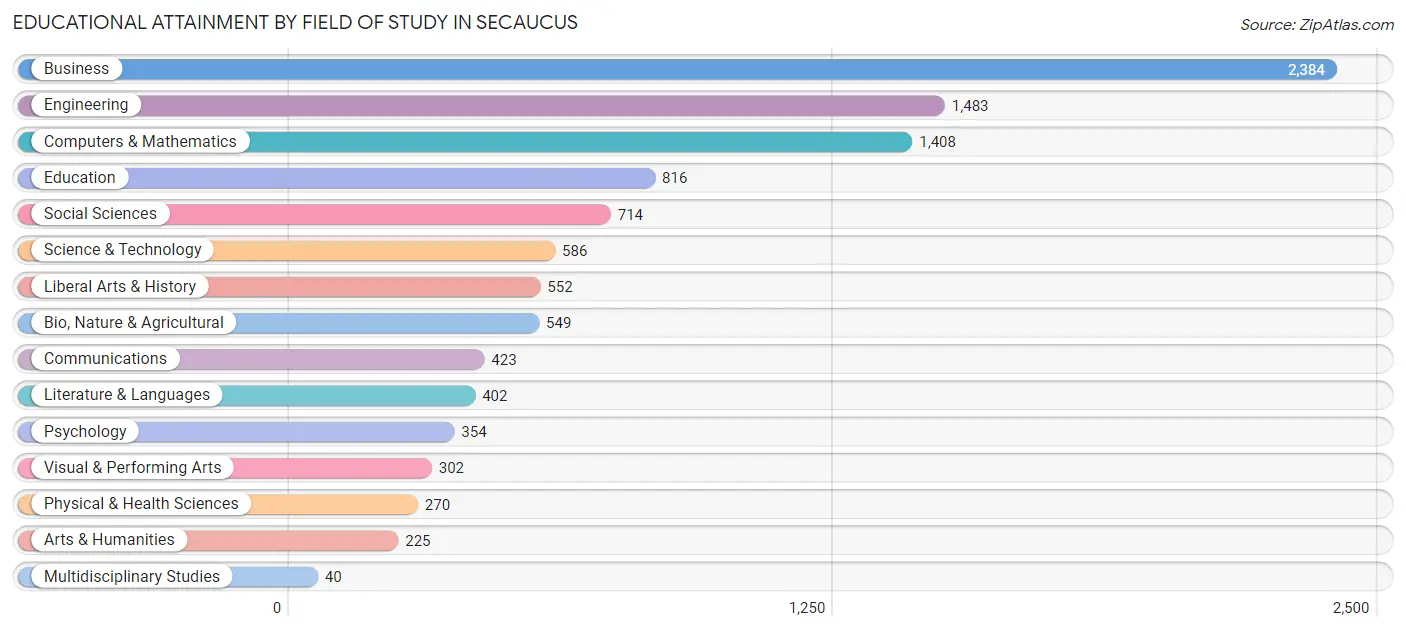
Educational Attainment by Field of Study in Secaucus
Business (2,384 | 22.7%), engineering (1,483 | 14.1%), computers & mathematics (1,408 | 13.4%), education (816 | 7.8%), and social sciences (714 | 6.8%) are the most common fields of study among 10,508 individuals in Secaucus who have obtained a bachelor's degree or higher.
| Field of Study | # Graduates | % Graduates |
| Computers & Mathematics | 1,408 | 13.4% |
| Bio, Nature & Agricultural | 549 | 5.2% |
| Physical & Health Sciences | 270 | 2.6% |
| Psychology | 354 | 3.4% |
| Social Sciences | 714 | 6.8% |
| Engineering | 1,483 | 14.1% |
| Multidisciplinary Studies | 40 | 0.4% |
| Science & Technology | 586 | 5.6% |
| Business | 2,384 | 22.7% |
| Education | 816 | 7.8% |
| Literature & Languages | 402 | 3.8% |
| Liberal Arts & History | 552 | 5.2% |
| Visual & Performing Arts | 302 | 2.9% |
| Communications | 423 | 4.0% |
| Arts & Humanities | 225 | 2.1% |
| Total | 10,508 | 100.0% |
Transportation & Commute in Secaucus
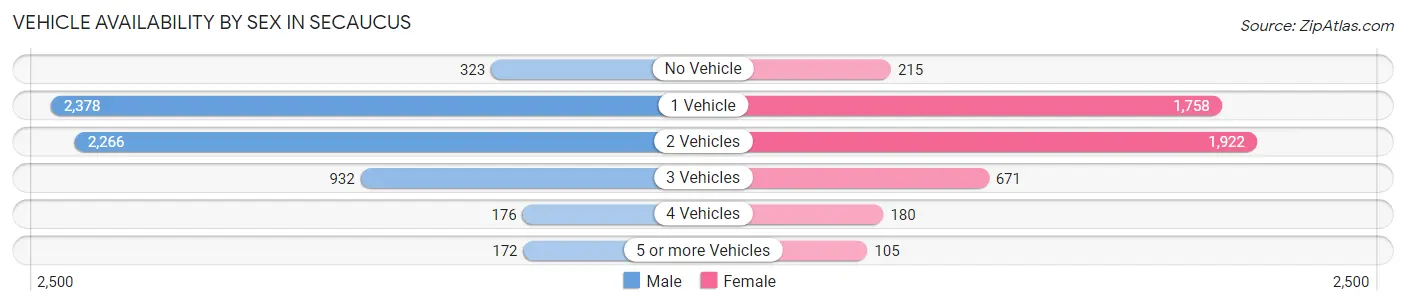
Vehicle Availability by Sex in Secaucus
The most prevalent vehicle ownership categories in Secaucus are males with 1 vehicle (2,378, accounting for 38.1%) and females with 1 vehicle (1,758, making up 49.0%).
| Vehicles Available | Male | Female |
| No Vehicle | 323 (5.2%) | 215 (4.4%) |
| 1 Vehicle | 2,378 (38.1%) | 1,758 (36.2%) |
| 2 Vehicles | 2,266 (36.3%) | 1,922 (39.6%) |
| 3 Vehicles | 932 (14.9%) | 671 (13.8%) |
| 4 Vehicles | 176 (2.8%) | 180 (3.7%) |
| 5 or more Vehicles | 172 (2.8%) | 105 (2.2%) |
| Total | 6,247 (100.0%) | 4,851 (100.0%) |
Commute Time in Secaucus
The most frequently occuring commute durations in Secaucus are 45 to 59 minutes (1,644 commuters, 18.8%), 60 to 89 minutes (1,174 commuters, 13.4%), and 30 to 34 minutes (1,109 commuters, 12.7%).
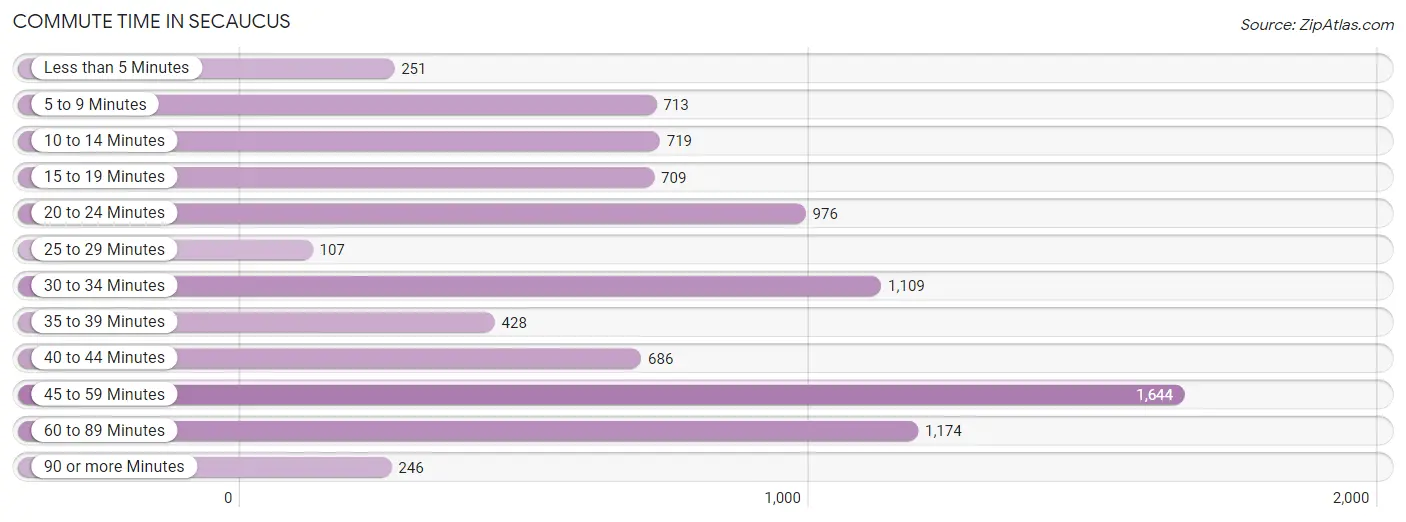
| Commute Time | # Commuters | % Commuters |
| Less than 5 Minutes | 251 | 2.9% |
| 5 to 9 Minutes | 713 | 8.1% |
| 10 to 14 Minutes | 719 | 8.2% |
| 15 to 19 Minutes | 709 | 8.1% |
| 20 to 24 Minutes | 976 | 11.1% |
| 25 to 29 Minutes | 107 | 1.2% |
| 30 to 34 Minutes | 1,109 | 12.7% |
| 35 to 39 Minutes | 428 | 4.9% |
| 40 to 44 Minutes | 686 | 7.8% |
| 45 to 59 Minutes | 1,644 | 18.8% |
| 60 to 89 Minutes | 1,174 | 13.4% |
| 90 or more Minutes | 246 | 2.8% |
Commute Time by Sex in Secaucus
The most common commute times in Secaucus are 45 to 59 minutes (1,190 commuters, 23.0%) for males and 10 to 14 minutes (503 commuters, 14.0%) for females.
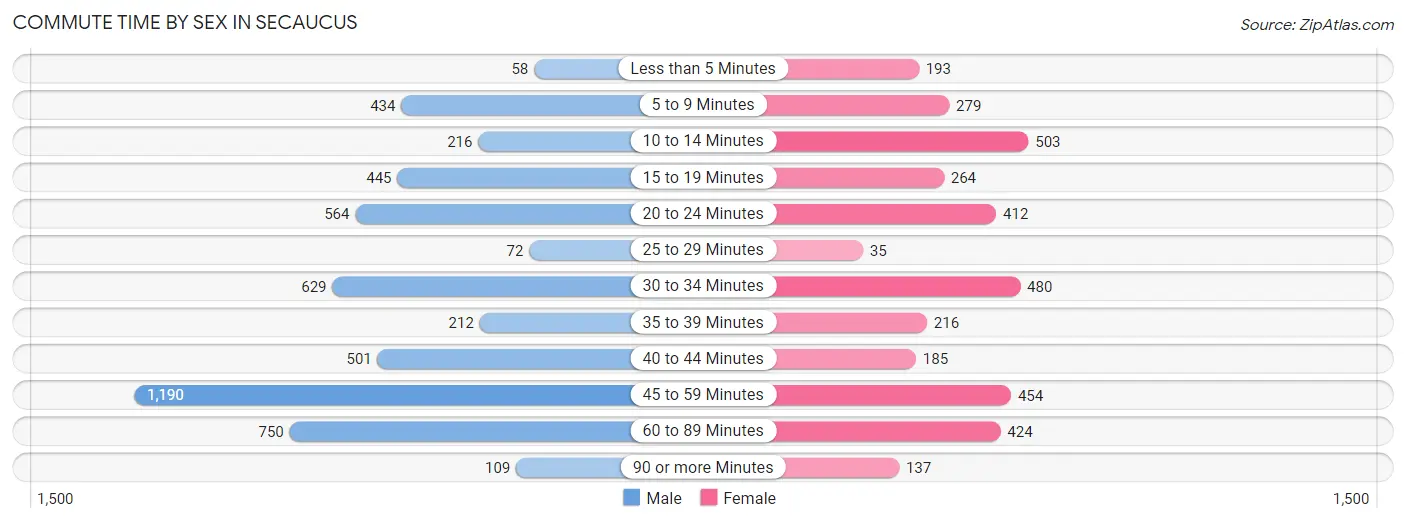
| Commute Time | Male | Female |
| Less than 5 Minutes | 58 (1.1%) | 193 (5.4%) |
| 5 to 9 Minutes | 434 (8.4%) | 279 (7.8%) |
| 10 to 14 Minutes | 216 (4.2%) | 503 (14.0%) |
| 15 to 19 Minutes | 445 (8.6%) | 264 (7.4%) |
| 20 to 24 Minutes | 564 (10.9%) | 412 (11.5%) |
| 25 to 29 Minutes | 72 (1.4%) | 35 (1.0%) |
| 30 to 34 Minutes | 629 (12.1%) | 480 (13.4%) |
| 35 to 39 Minutes | 212 (4.1%) | 216 (6.0%) |
| 40 to 44 Minutes | 501 (9.7%) | 185 (5.2%) |
| 45 to 59 Minutes | 1,190 (23.0%) | 454 (12.7%) |
| 60 to 89 Minutes | 750 (14.5%) | 424 (11.8%) |
| 90 or more Minutes | 109 (2.1%) | 137 (3.8%) |
Time of Departure to Work by Sex in Secaucus
The most frequent times of departure to work in Secaucus are 8:00 AM to 8:29 AM (760, 14.7%) for males and 8:00 AM to 8:29 AM (1,011, 28.2%) for females.
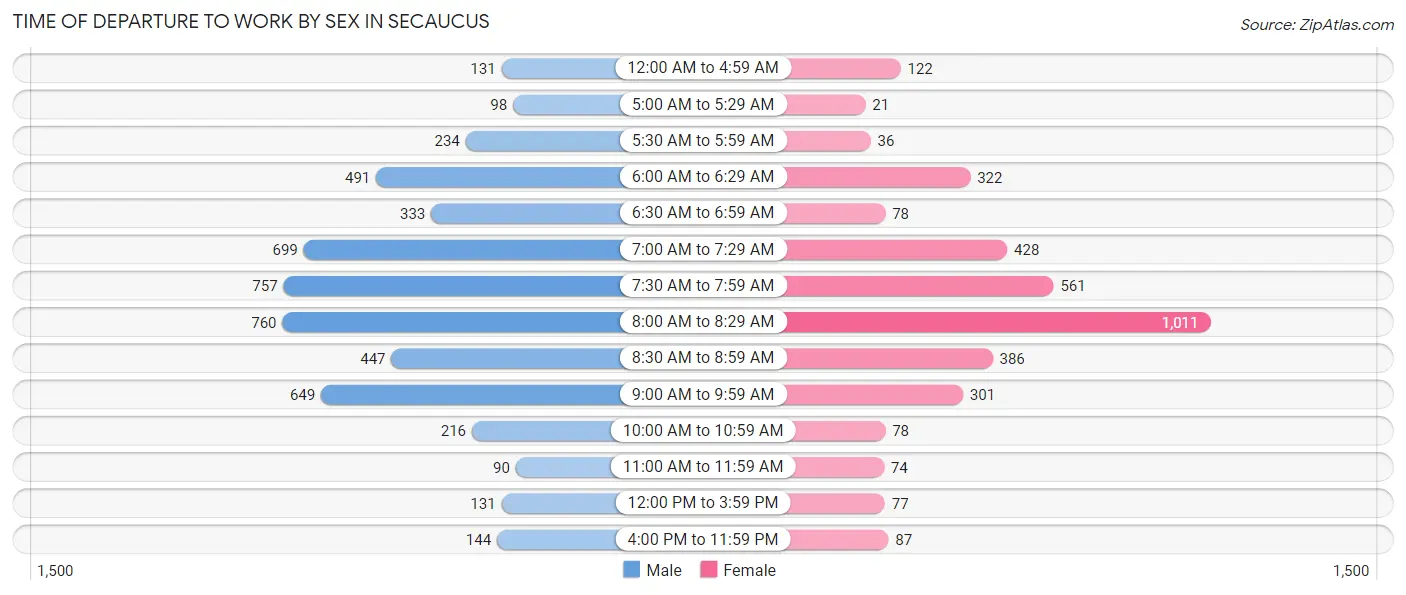
| Time of Departure | Male | Female |
| 12:00 AM to 4:59 AM | 131 (2.5%) | 122 (3.4%) |
| 5:00 AM to 5:29 AM | 98 (1.9%) | 21 (0.6%) |
| 5:30 AM to 5:59 AM | 234 (4.5%) | 36 (1.0%) |
| 6:00 AM to 6:29 AM | 491 (9.5%) | 322 (9.0%) |
| 6:30 AM to 6:59 AM | 333 (6.4%) | 78 (2.2%) |
| 7:00 AM to 7:29 AM | 699 (13.5%) | 428 (11.9%) |
| 7:30 AM to 7:59 AM | 757 (14.6%) | 561 (15.7%) |
| 8:00 AM to 8:29 AM | 760 (14.7%) | 1,011 (28.2%) |
| 8:30 AM to 8:59 AM | 447 (8.6%) | 386 (10.8%) |
| 9:00 AM to 9:59 AM | 649 (12.5%) | 301 (8.4%) |
| 10:00 AM to 10:59 AM | 216 (4.2%) | 78 (2.2%) |
| 11:00 AM to 11:59 AM | 90 (1.7%) | 74 (2.1%) |
| 12:00 PM to 3:59 PM | 131 (2.5%) | 77 (2.1%) |
| 4:00 PM to 11:59 PM | 144 (2.8%) | 87 (2.4%) |
| Total | 5,180 (100.0%) | 3,582 (100.0%) |
Housing Occupancy in Secaucus
Occupancy by Ownership in Secaucus
Of the total 8,607 dwellings in Secaucus, owner-occupied units account for 4,369 (50.8%), while renter-occupied units make up 4,238 (49.2%).
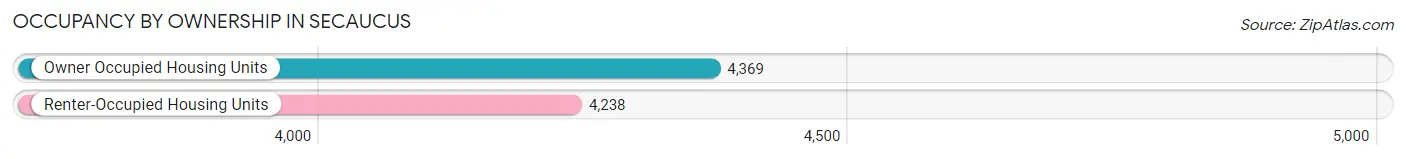
| Occupancy | # Housing Units | % Housing Units |
| Owner Occupied Housing Units | 4,369 | 50.8% |
| Renter-Occupied Housing Units | 4,238 | 49.2% |
| Total Occupied Housing Units | 8,607 | 100.0% |
Occupancy by Household Size in Secaucus
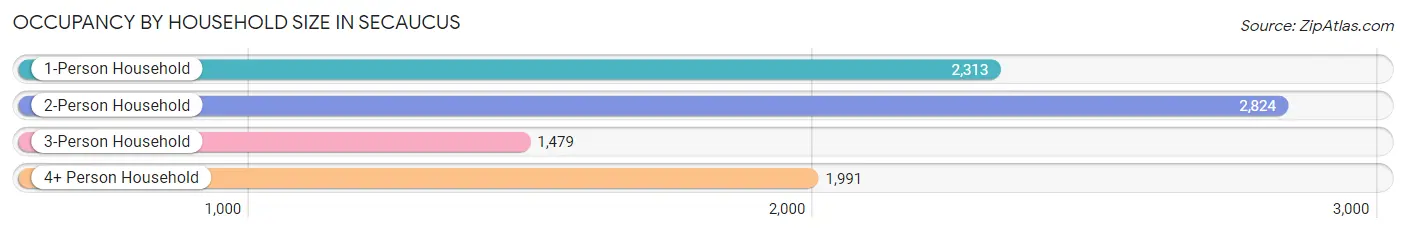
| Household Size | # Housing Units | % Housing Units |
| 1-Person Household | 2,313 | 26.9% |
| 2-Person Household | 2,824 | 32.8% |
| 3-Person Household | 1,479 | 17.2% |
| 4+ Person Household | 1,991 | 23.1% |
| Total Housing Units | 8,607 | 100.0% |
Occupancy by Ownership by Household Size in Secaucus
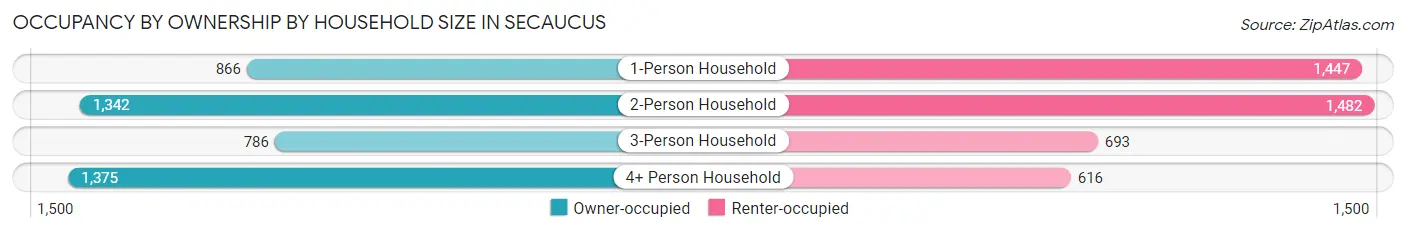
| Household Size | Owner-occupied | Renter-occupied |
| 1-Person Household | 866 (37.4%) | 1,447 (62.6%) |
| 2-Person Household | 1,342 (47.5%) | 1,482 (52.5%) |
| 3-Person Household | 786 (53.1%) | 693 (46.9%) |
| 4+ Person Household | 1,375 (69.1%) | 616 (30.9%) |
| Total Housing Units | 4,369 (50.8%) | 4,238 (49.2%) |
Occupancy by Educational Attainment in Secaucus
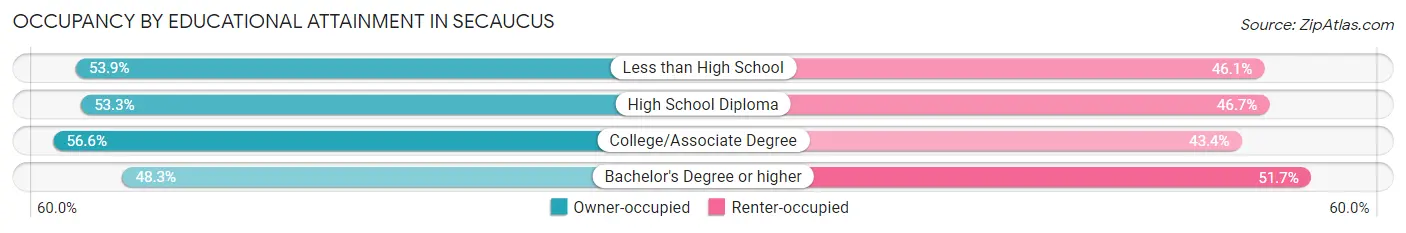
| Household Size | Owner-occupied | Renter-occupied |
| Less than High School | 146 (53.9%) | 125 (46.1%) |
| High School Diploma | 824 (53.3%) | 723 (46.7%) |
| College/Associate Degree | 811 (56.6%) | 623 (43.4%) |
| Bachelor's Degree or higher | 2,588 (48.3%) | 2,767 (51.7%) |
Occupancy by Age of Householder in Secaucus
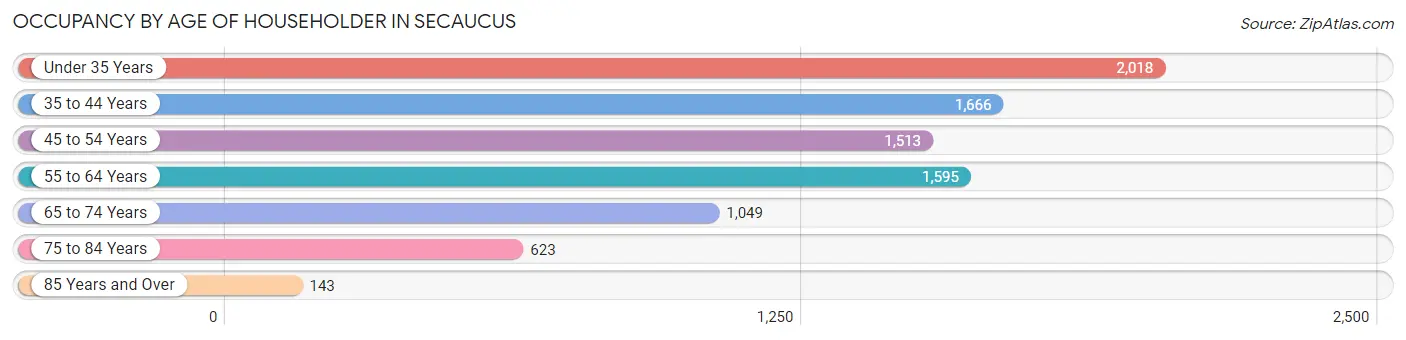
| Age Bracket | # Households | % Households |
| Under 35 Years | 2,018 | 23.4% |
| 35 to 44 Years | 1,666 | 19.4% |
| 45 to 54 Years | 1,513 | 17.6% |
| 55 to 64 Years | 1,595 | 18.5% |
| 65 to 74 Years | 1,049 | 12.2% |
| 75 to 84 Years | 623 | 7.2% |
| 85 Years and Over | 143 | 1.7% |
| Total | 8,607 | 100.0% |
Housing Finances in Secaucus
Median Income by Occupancy in Secaucus
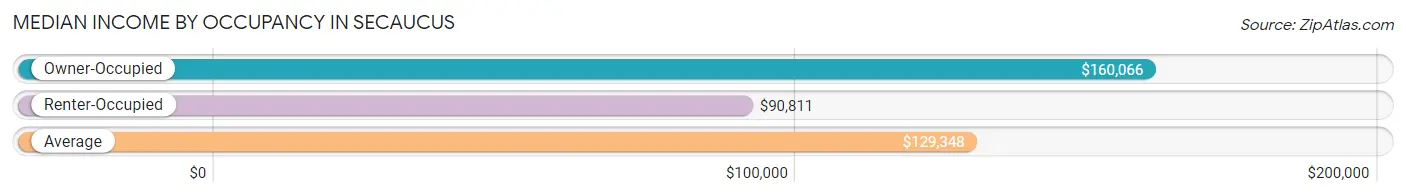
| Occupancy Type | # Households | Median Income |
| Owner-Occupied | 4,369 (50.8%) | $160,066 |
| Renter-Occupied | 4,238 (49.2%) | $90,811 |
| Average | 8,607 (100.0%) | $129,348 |
Occupancy by Householder Income Bracket in Secaucus
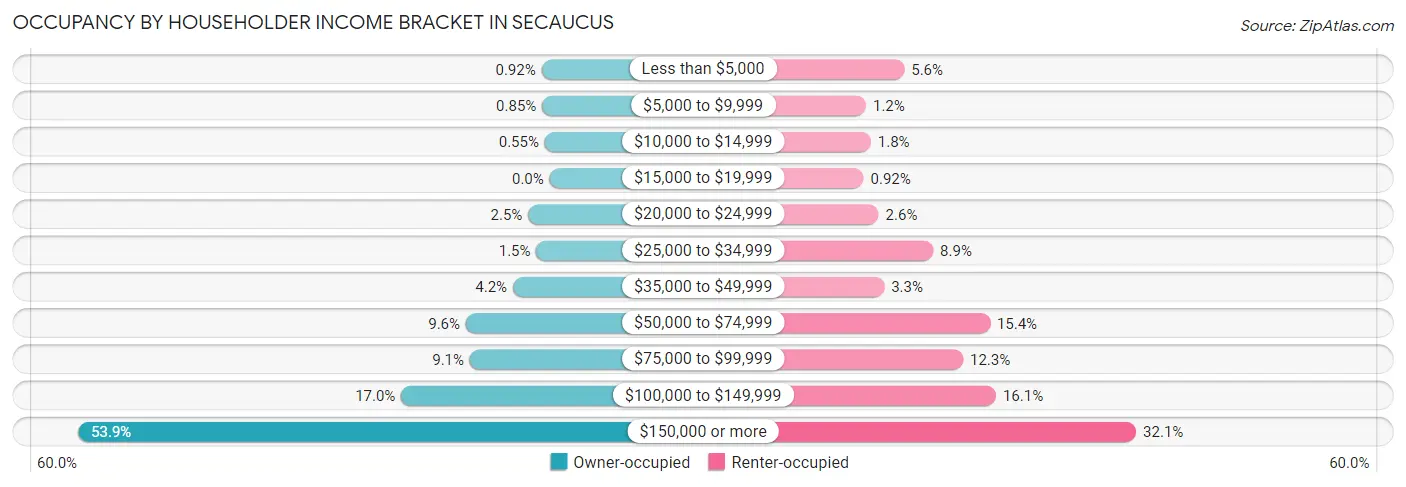
| Income Bracket | Owner-occupied | Renter-occupied |
| Less than $5,000 | 40 (0.9%) | 236 (5.6%) |
| $5,000 to $9,999 | 37 (0.9%) | 51 (1.2%) |
| $10,000 to $14,999 | 24 (0.5%) | 74 (1.8%) |
| $15,000 to $19,999 | 0 (0.0%) | 39 (0.9%) |
| $20,000 to $24,999 | 107 (2.5%) | 112 (2.6%) |
| $25,000 to $34,999 | 66 (1.5%) | 376 (8.9%) |
| $35,000 to $49,999 | 183 (4.2%) | 139 (3.3%) |
| $50,000 to $74,999 | 418 (9.6%) | 651 (15.4%) |
| $75,000 to $99,999 | 398 (9.1%) | 521 (12.3%) |
| $100,000 to $149,999 | 741 (17.0%) | 680 (16.1%) |
| $150,000 or more | 2,355 (53.9%) | 1,359 (32.1%) |
| Total | 4,369 (100.0%) | 4,238 (100.0%) |
Monthly Housing Cost Tiers in Secaucus
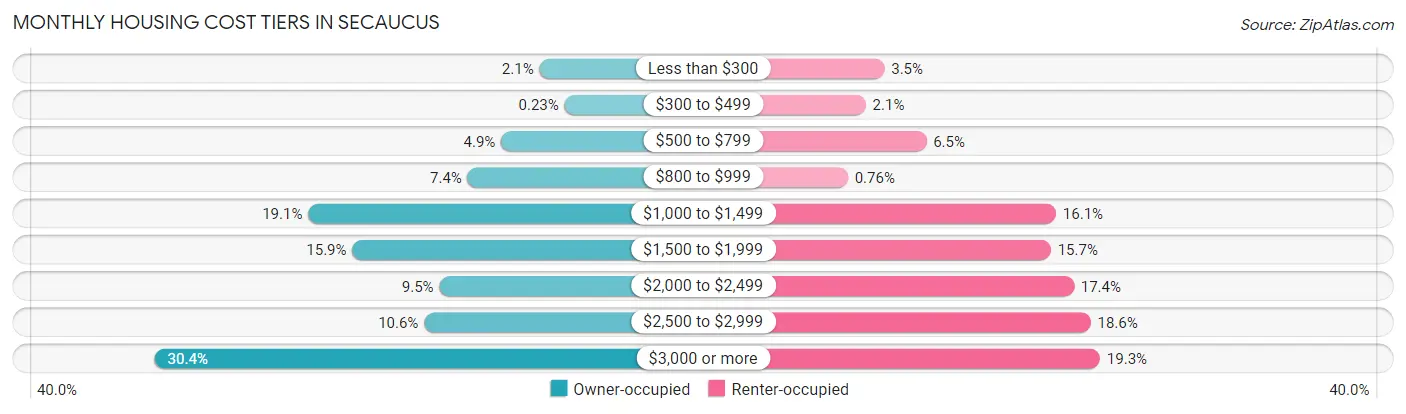
| Monthly Cost | Owner-occupied | Renter-occupied |
| Less than $300 | 91 (2.1%) | 146 (3.5%) |
| $300 to $499 | 10 (0.2%) | 88 (2.1%) |
| $500 to $799 | 214 (4.9%) | 277 (6.5%) |
| $800 to $999 | 322 (7.4%) | 32 (0.8%) |
| $1,000 to $1,499 | 835 (19.1%) | 682 (16.1%) |
| $1,500 to $1,999 | 693 (15.9%) | 666 (15.7%) |
| $2,000 to $2,499 | 413 (9.5%) | 738 (17.4%) |
| $2,500 to $2,999 | 462 (10.6%) | 790 (18.6%) |
| $3,000 or more | 1,329 (30.4%) | 819 (19.3%) |
| Total | 4,369 (100.0%) | 4,238 (100.0%) |
Physical Housing Characteristics in Secaucus
Housing Structures in Secaucus
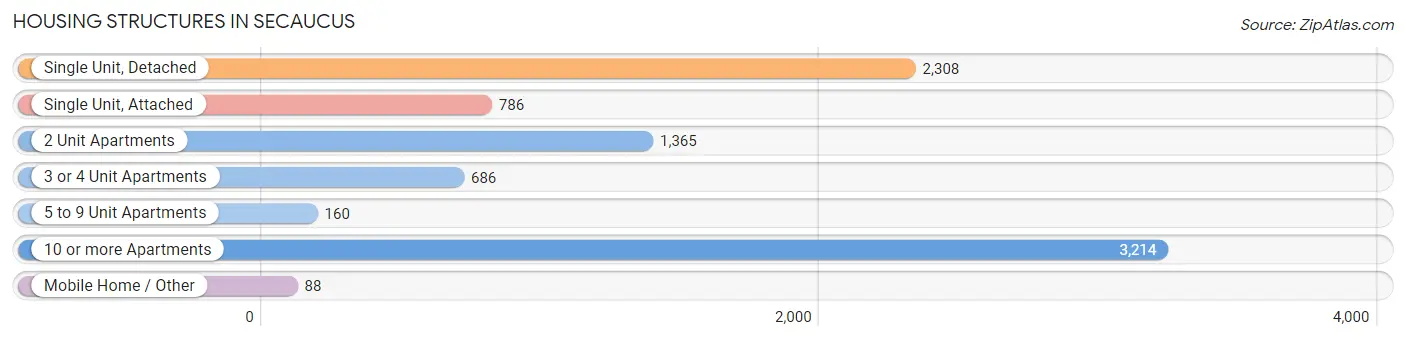
| Structure Type | # Housing Units | % Housing Units |
| Single Unit, Detached | 2,308 | 26.8% |
| Single Unit, Attached | 786 | 9.1% |
| 2 Unit Apartments | 1,365 | 15.9% |
| 3 or 4 Unit Apartments | 686 | 8.0% |
| 5 to 9 Unit Apartments | 160 | 1.9% |
| 10 or more Apartments | 3,214 | 37.3% |
| Mobile Home / Other | 88 | 1.0% |
| Total | 8,607 | 100.0% |
Housing Structures by Occupancy in Secaucus
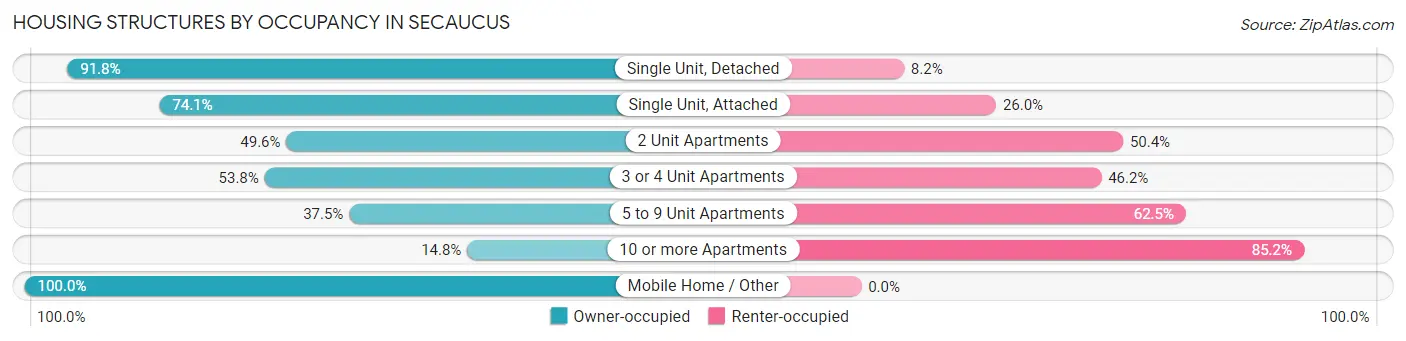
| Structure Type | Owner-occupied | Renter-occupied |
| Single Unit, Detached | 2,118 (91.8%) | 190 (8.2%) |
| Single Unit, Attached | 582 (74.1%) | 204 (26.0%) |
| 2 Unit Apartments | 677 (49.6%) | 688 (50.4%) |
| 3 or 4 Unit Apartments | 369 (53.8%) | 317 (46.2%) |
| 5 to 9 Unit Apartments | 60 (37.5%) | 100 (62.5%) |
| 10 or more Apartments | 475 (14.8%) | 2,739 (85.2%) |
| Mobile Home / Other | 88 (100.0%) | 0 (0.0%) |
| Total | 4,369 (50.8%) | 4,238 (49.2%) |
Housing Structures by Number of Rooms in Secaucus
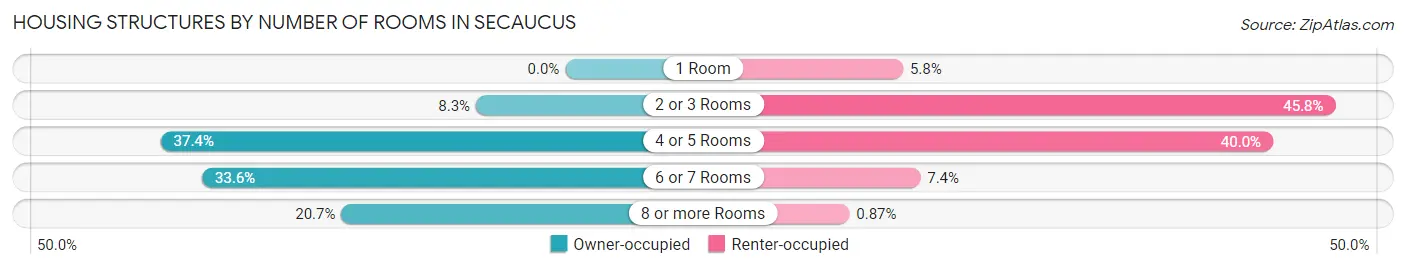
| Number of Rooms | Owner-occupied | Renter-occupied |
| 1 Room | 0 (0.0%) | 247 (5.8%) |
| 2 or 3 Rooms | 361 (8.3%) | 1,942 (45.8%) |
| 4 or 5 Rooms | 1,635 (37.4%) | 1,697 (40.0%) |
| 6 or 7 Rooms | 1,468 (33.6%) | 315 (7.4%) |
| 8 or more Rooms | 905 (20.7%) | 37 (0.9%) |
| Total | 4,369 (100.0%) | 4,238 (100.0%) |
Housing Structure by Heating Type in Secaucus
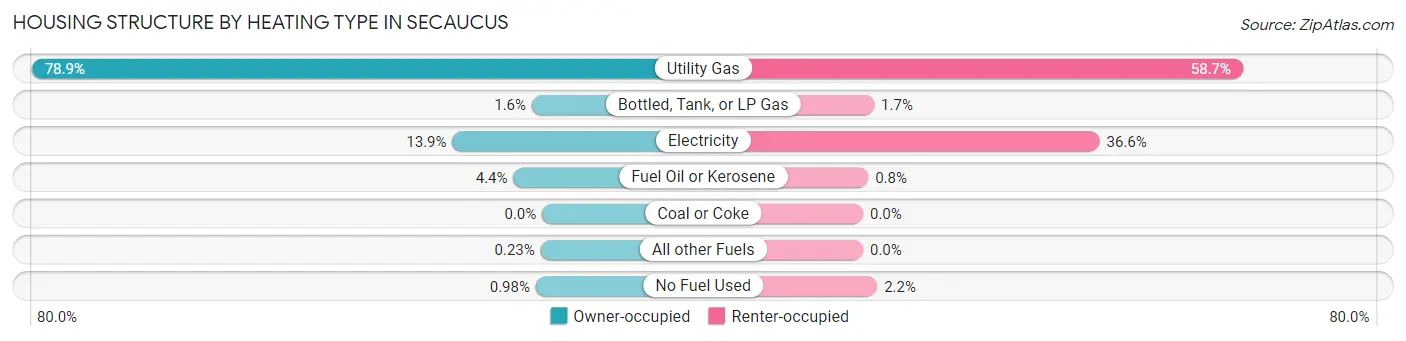
| Heating Type | Owner-occupied | Renter-occupied |
| Utility Gas | 3,447 (78.9%) | 2,488 (58.7%) |
| Bottled, Tank, or LP Gas | 69 (1.6%) | 73 (1.7%) |
| Electricity | 606 (13.9%) | 1,550 (36.6%) |
| Fuel Oil or Kerosene | 194 (4.4%) | 34 (0.8%) |
| Coal or Coke | 0 (0.0%) | 0 (0.0%) |
| All other Fuels | 10 (0.2%) | 0 (0.0%) |
| No Fuel Used | 43 (1.0%) | 93 (2.2%) |
| Total | 4,369 (100.0%) | 4,238 (100.0%) |
Household Vehicle Usage in Secaucus
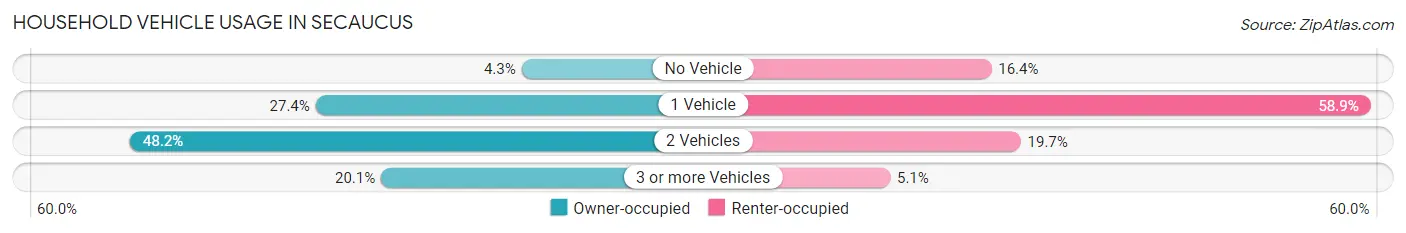
| Vehicles per Household | Owner-occupied | Renter-occupied |
| No Vehicle | 189 (4.3%) | 695 (16.4%) |
| 1 Vehicle | 1,197 (27.4%) | 2,495 (58.9%) |
| 2 Vehicles | 2,106 (48.2%) | 834 (19.7%) |
| 3 or more Vehicles | 877 (20.1%) | 214 (5.1%) |
| Total | 4,369 (100.0%) | 4,238 (100.0%) |
Real Estate & Mortgages in Secaucus
Real Estate and Mortgage Overview in Secaucus
| Characteristic | Without Mortgage | With Mortgage |
| Housing Units | 1,907 | 2,462 |
| Median Property Value | $497,000 | $604,800 |
| Median Household Income | $102,798 | $1,621 |
| Monthly Housing Costs | $1,163 | $1,329 |
| Real Estate Taxes | $7,282 | $11 |
Property Value by Mortgage Status in Secaucus
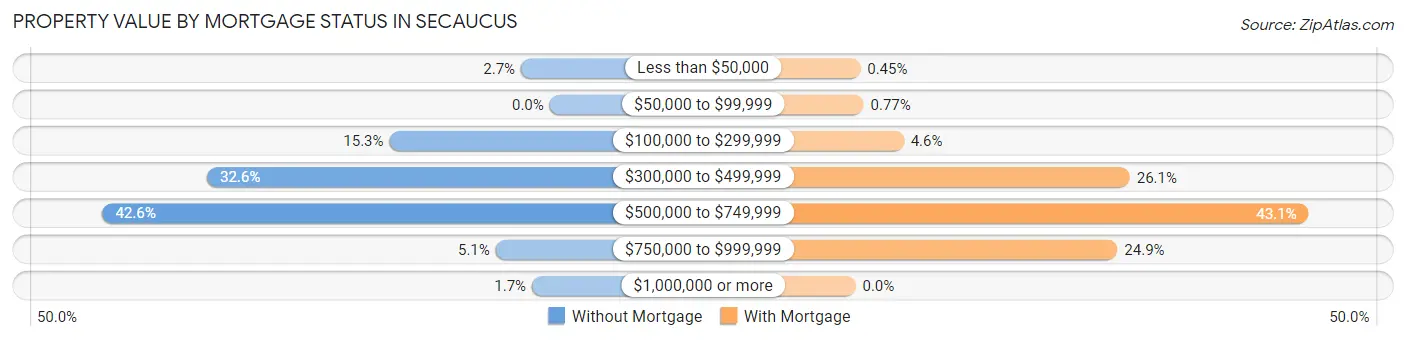
| Property Value | Without Mortgage | With Mortgage |
| Less than $50,000 | 52 (2.7%) | 11 (0.4%) |
| $50,000 to $99,999 | 0 (0.0%) | 19 (0.8%) |
| $100,000 to $299,999 | 291 (15.3%) | 113 (4.6%) |
| $300,000 to $499,999 | 622 (32.6%) | 643 (26.1%) |
| $500,000 to $749,999 | 812 (42.6%) | 1,062 (43.1%) |
| $750,000 to $999,999 | 98 (5.1%) | 614 (24.9%) |
| $1,000,000 or more | 32 (1.7%) | 0 (0.0%) |
| Total | 1,907 (100.0%) | 2,462 (100.0%) |
Household Income by Mortgage Status in Secaucus
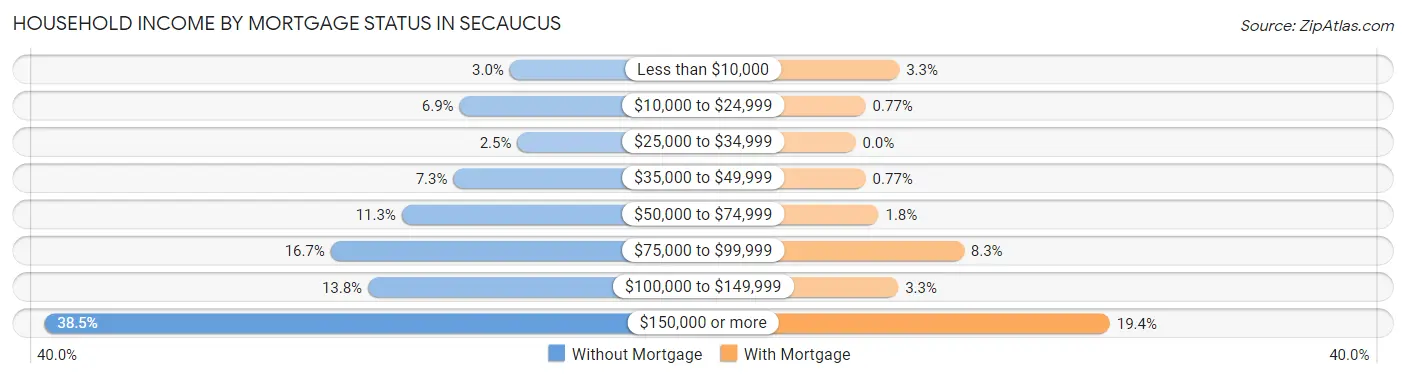
| Household Income | Without Mortgage | With Mortgage |
| Less than $10,000 | 58 (3.0%) | 82 (3.3%) |
| $10,000 to $24,999 | 131 (6.9%) | 19 (0.8%) |
| $25,000 to $34,999 | 47 (2.5%) | 0 (0.0%) |
| $35,000 to $49,999 | 140 (7.3%) | 19 (0.8%) |
| $50,000 to $74,999 | 215 (11.3%) | 43 (1.8%) |
| $75,000 to $99,999 | 318 (16.7%) | 203 (8.3%) |
| $100,000 to $149,999 | 264 (13.8%) | 80 (3.3%) |
| $150,000 or more | 734 (38.5%) | 477 (19.4%) |
| Total | 1,907 (100.0%) | 2,462 (100.0%) |
Property Value to Household Income Ratio in Secaucus
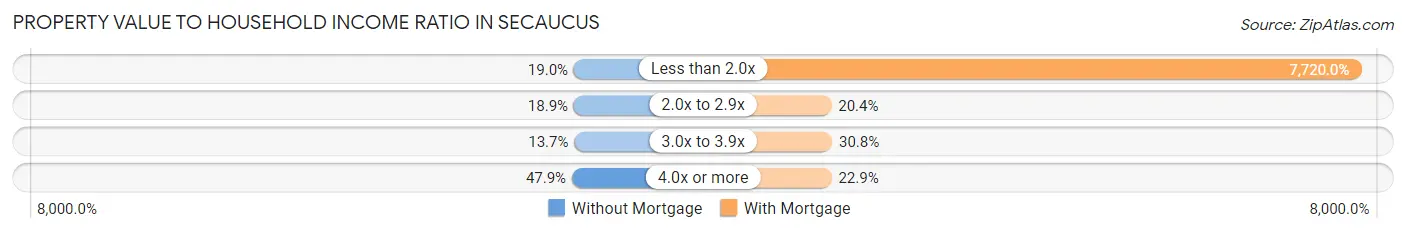
| Value-to-Income Ratio | Without Mortgage | With Mortgage |
| Less than 2.0x | 362 (19.0%) | 190,066 (7,720.0%) |
| 2.0x to 2.9x | 361 (18.9%) | 503 (20.4%) |
| 3.0x to 3.9x | 262 (13.7%) | 759 (30.8%) |
| 4.0x or more | 914 (47.9%) | 564 (22.9%) |
| Total | 1,907 (100.0%) | 2,462 (100.0%) |
Real Estate Taxes by Mortgage Status in Secaucus
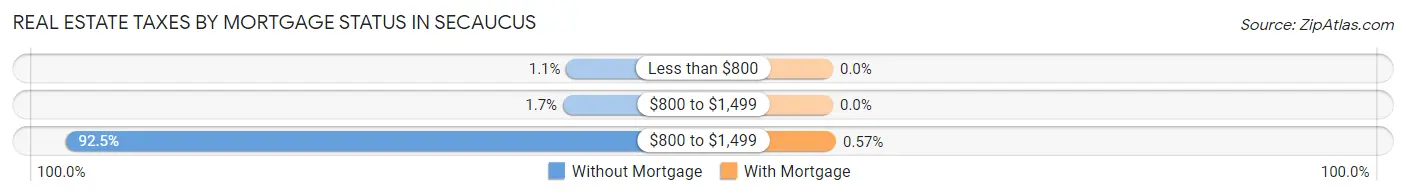
| Property Taxes | Without Mortgage | With Mortgage |
| Less than $800 | 20 (1.1%) | 0 (0.0%) |
| $800 to $1,499 | 32 (1.7%) | 0 (0.0%) |
| $800 to $1,499 | 1,764 (92.5%) | 14 (0.6%) |
| Total | 1,907 (100.0%) | 2,462 (100.0%) |
Health & Disability in Secaucus
Health Insurance Coverage by Age in Secaucus
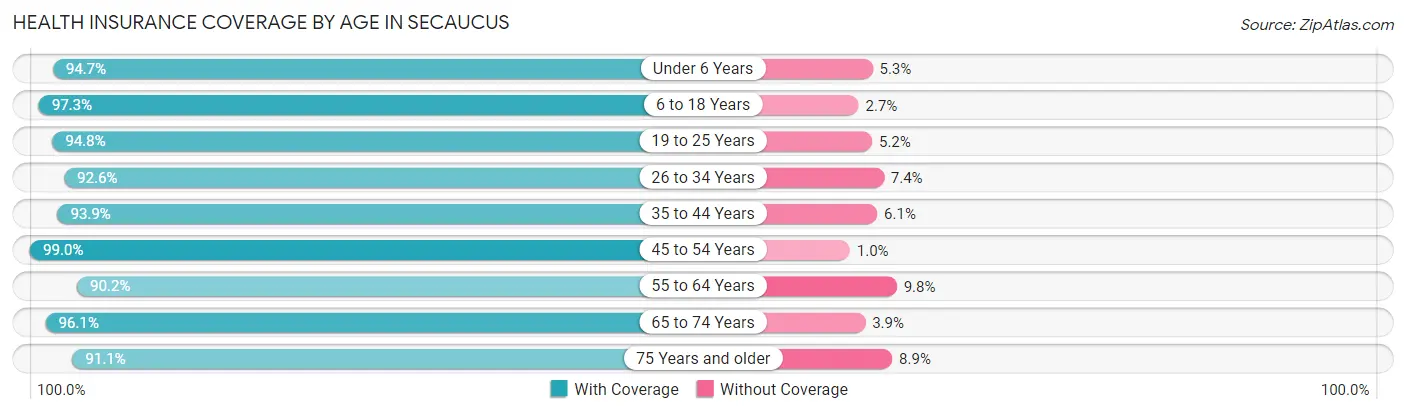
| Age Bracket | With Coverage | Without Coverage |
| Under 6 Years | 1,171 (94.7%) | 65 (5.3%) |
| 6 to 18 Years | 2,923 (97.3%) | 80 (2.7%) |
| 19 to 25 Years | 1,082 (94.8%) | 59 (5.2%) |
| 26 to 34 Years | 3,675 (92.6%) | 293 (7.4%) |
| 35 to 44 Years | 2,984 (93.9%) | 195 (6.1%) |
| 45 to 54 Years | 2,796 (99.0%) | 29 (1.0%) |
| 55 to 64 Years | 2,380 (90.2%) | 258 (9.8%) |
| 65 to 74 Years | 1,825 (96.1%) | 74 (3.9%) |
| 75 Years and older | 1,113 (91.1%) | 109 (8.9%) |
| Total | 19,949 (94.5%) | 1,162 (5.5%) |
Health Insurance Coverage by Citizenship Status in Secaucus
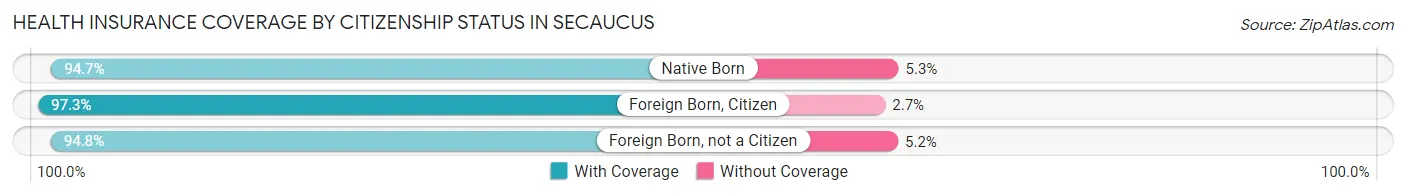
| Citizenship Status | With Coverage | Without Coverage |
| Native Born | 1,171 (94.7%) | 65 (5.3%) |
| Foreign Born, Citizen | 2,923 (97.3%) | 80 (2.7%) |
| Foreign Born, not a Citizen | 1,082 (94.8%) | 59 (5.2%) |
Health Insurance Coverage by Household Income in Secaucus
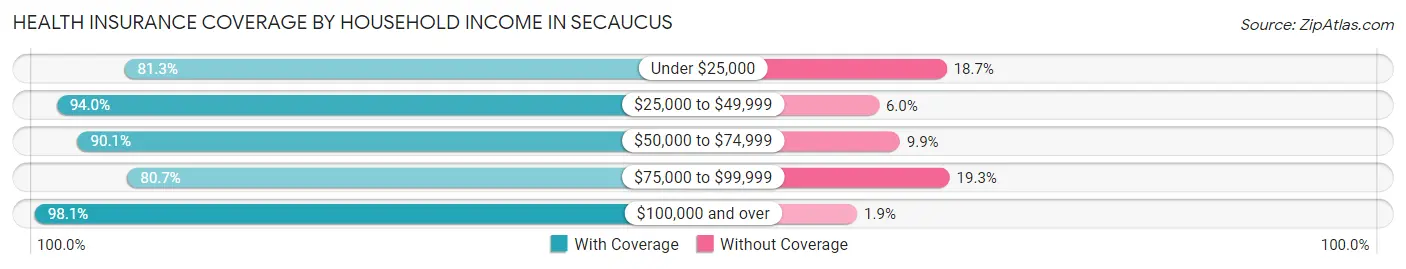
| Household Income | With Coverage | Without Coverage |
| Under $25,000 | 712 (81.3%) | 164 (18.7%) |
| $25,000 to $49,999 | 1,262 (94.0%) | 81 (6.0%) |
| $50,000 to $74,999 | 2,255 (90.1%) | 249 (9.9%) |
| $75,000 to $99,999 | 1,558 (80.7%) | 372 (19.3%) |
| $100,000 and over | 13,865 (98.1%) | 274 (1.9%) |
Public vs Private Health Insurance Coverage by Age in Secaucus
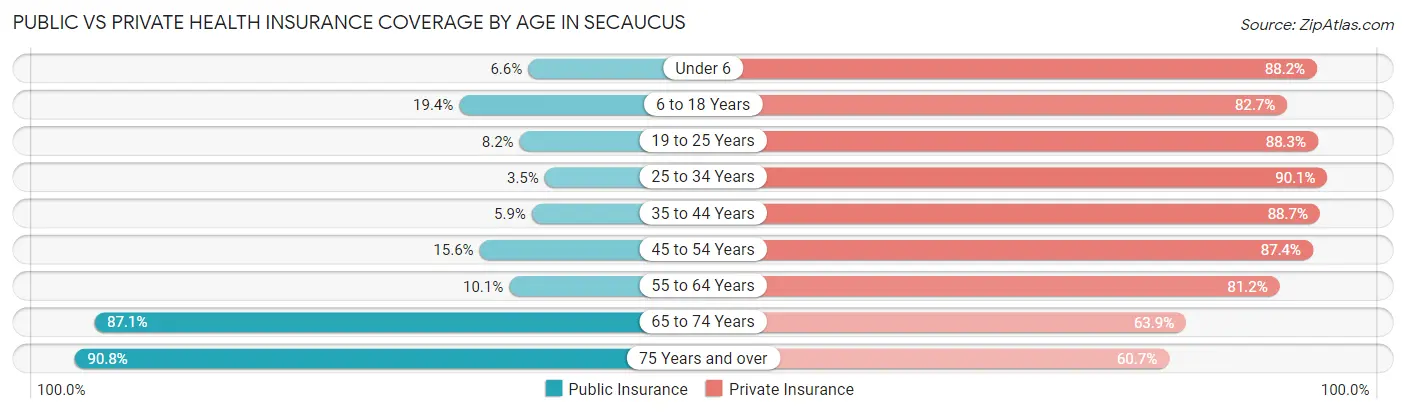
| Age Bracket | Public Insurance | Private Insurance |
| Under 6 | 81 (6.6%) | 1,090 (88.2%) |
| 6 to 18 Years | 581 (19.4%) | 2,482 (82.7%) |
| 19 to 25 Years | 93 (8.2%) | 1,008 (88.3%) |
| 25 to 34 Years | 138 (3.5%) | 3,576 (90.1%) |
| 35 to 44 Years | 187 (5.9%) | 2,820 (88.7%) |
| 45 to 54 Years | 440 (15.6%) | 2,470 (87.4%) |
| 55 to 64 Years | 266 (10.1%) | 2,143 (81.2%) |
| 65 to 74 Years | 1,654 (87.1%) | 1,213 (63.9%) |
| 75 Years and over | 1,109 (90.7%) | 742 (60.7%) |
| Total | 4,549 (21.5%) | 17,544 (83.1%) |
Disability Status by Sex by Age in Secaucus
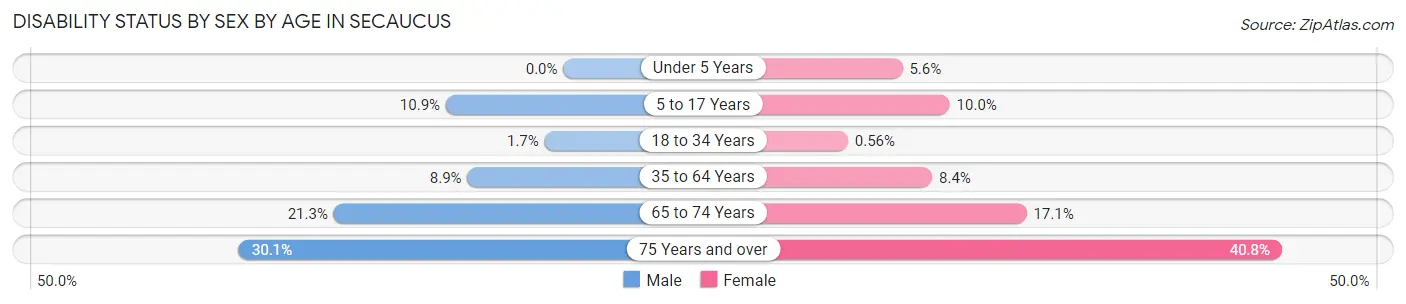
| Age Bracket | Male | Female |
| Under 5 Years | 0 (0.0%) | 29 (5.6%) |
| 5 to 17 Years | 164 (10.9%) | 153 (10.0%) |
| 18 to 34 Years | 51 (1.7%) | 13 (0.6%) |
| 35 to 64 Years | 390 (8.9%) | 357 (8.4%) |
| 65 to 74 Years | 156 (21.3%) | 200 (17.1%) |
| 75 Years and over | 171 (30.1%) | 267 (40.8%) |
Disability Class by Sex by Age in Secaucus
Disability Class: Hearing Difficulty
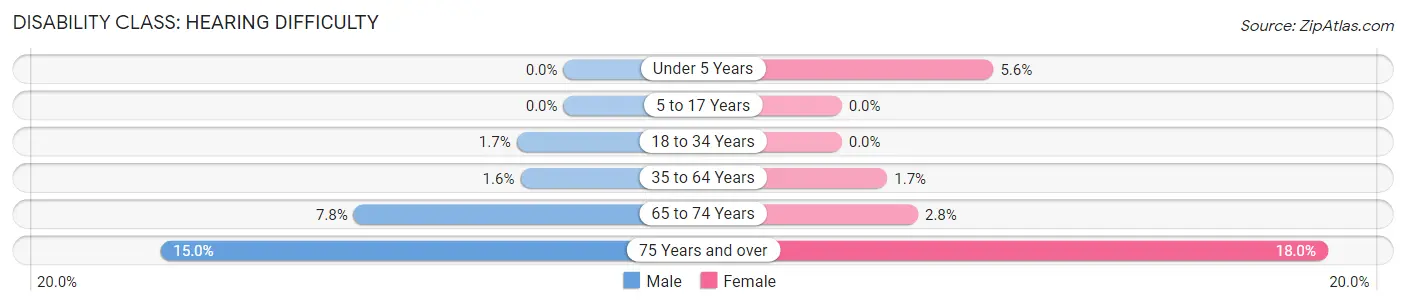
| Age Bracket | Male | Female |
| Under 5 Years | 0 (0.0%) | 29 (5.6%) |
| 5 to 17 Years | 0 (0.0%) | 0 (0.0%) |
| 18 to 34 Years | 51 (1.7%) | 0 (0.0%) |
| 35 to 64 Years | 70 (1.6%) | 72 (1.7%) |
| 65 to 74 Years | 57 (7.8%) | 33 (2.8%) |
| 75 Years and over | 85 (15.0%) | 118 (18.0%) |
Disability Class: Vision Difficulty
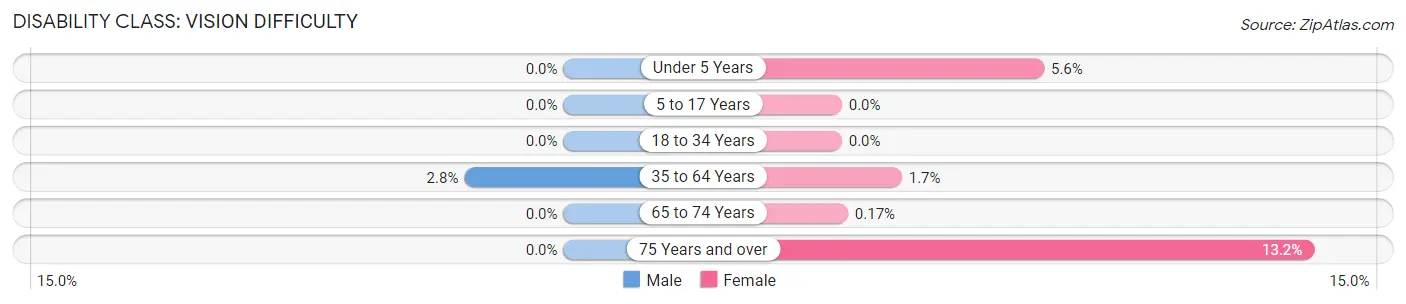
| Age Bracket | Male | Female |
| Under 5 Years | 0 (0.0%) | 29 (5.6%) |
| 5 to 17 Years | 0 (0.0%) | 0 (0.0%) |
| 18 to 34 Years | 0 (0.0%) | 0 (0.0%) |
| 35 to 64 Years | 121 (2.8%) | 71 (1.7%) |
| 65 to 74 Years | 0 (0.0%) | 2 (0.2%) |
| 75 Years and over | 0 (0.0%) | 86 (13.2%) |
Disability Class: Cognitive Difficulty
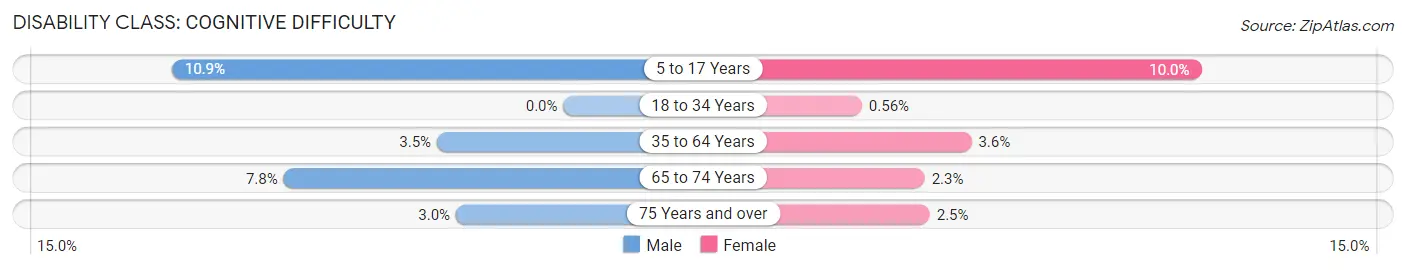
| Age Bracket | Male | Female |
| 5 to 17 Years | 164 (10.9%) | 153 (10.0%) |
| 18 to 34 Years | 0 (0.0%) | 13 (0.6%) |
| 35 to 64 Years | 154 (3.5%) | 154 (3.6%) |
| 65 to 74 Years | 57 (7.8%) | 27 (2.3%) |
| 75 Years and over | 17 (3.0%) | 16 (2.5%) |
Disability Class: Ambulatory Difficulty
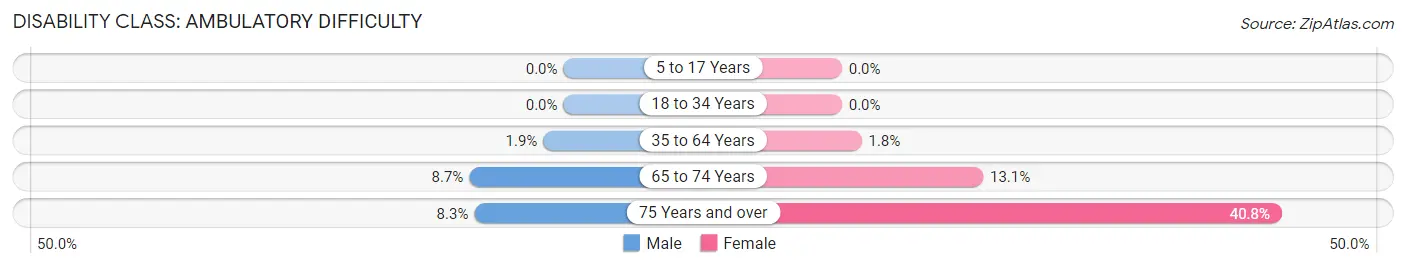
| Age Bracket | Male | Female |
| 5 to 17 Years | 0 (0.0%) | 0 (0.0%) |
| 18 to 34 Years | 0 (0.0%) | 0 (0.0%) |
| 35 to 64 Years | 82 (1.9%) | 78 (1.8%) |
| 65 to 74 Years | 64 (8.7%) | 153 (13.1%) |
| 75 Years and over | 47 (8.3%) | 267 (40.8%) |
Disability Class: Self-Care Difficulty
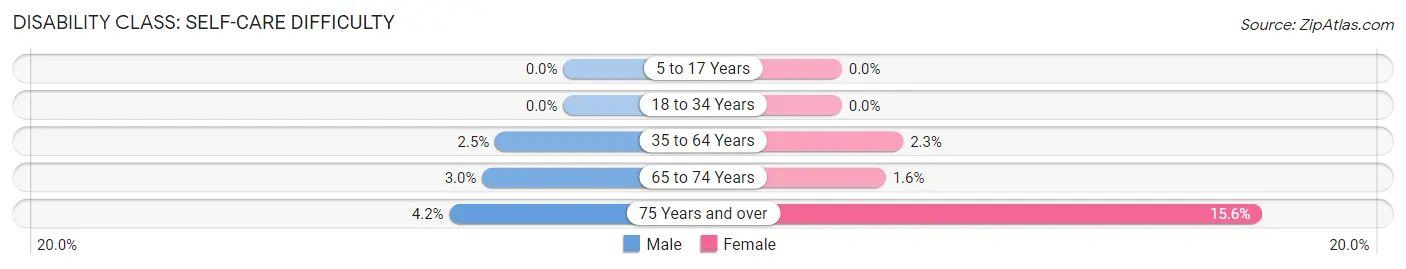
| Age Bracket | Male | Female |
| 5 to 17 Years | 0 (0.0%) | 0 (0.0%) |
| 18 to 34 Years | 0 (0.0%) | 0 (0.0%) |
| 35 to 64 Years | 111 (2.5%) | 97 (2.3%) |
| 65 to 74 Years | 22 (3.0%) | 19 (1.6%) |
| 75 Years and over | 24 (4.2%) | 102 (15.6%) |
Technology Access in Secaucus
Computing Device Access in Secaucus
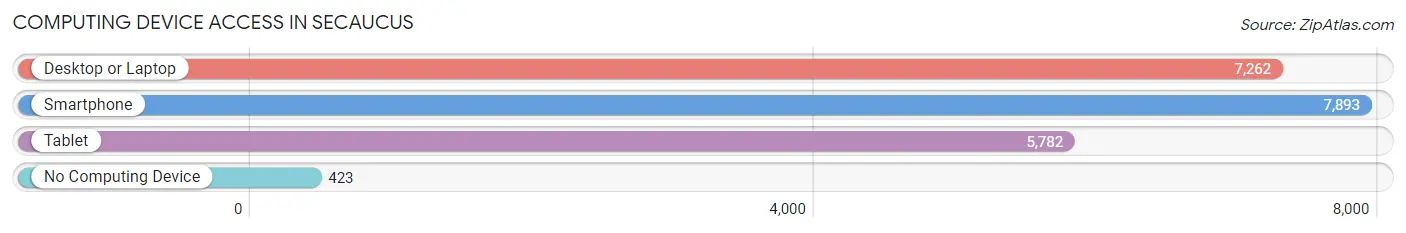
| Device Type | # Households | % Households |
| Desktop or Laptop | 7,262 | 84.4% |
| Smartphone | 7,893 | 91.7% |
| Tablet | 5,782 | 67.2% |
| No Computing Device | 423 | 4.9% |
| Total | 8,607 | 100.0% |
Internet Access in Secaucus
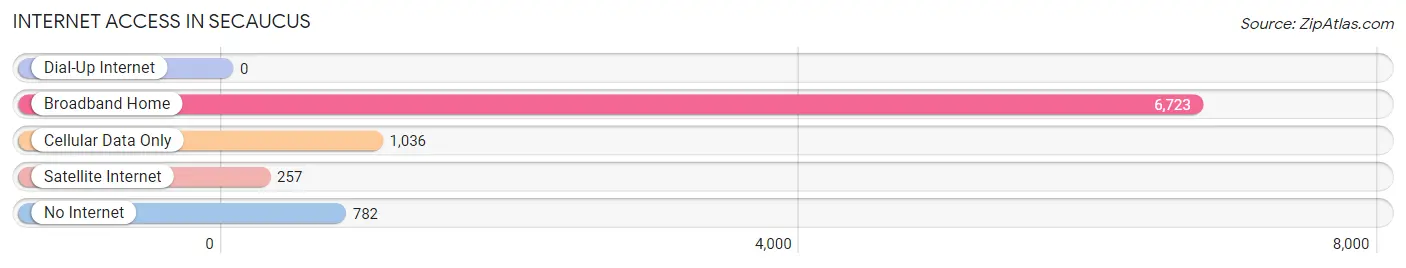
| Internet Type | # Households | % Households |
| Dial-Up Internet | 0 | 0.0% |
| Broadband Home | 6,723 | 78.1% |
| Cellular Data Only | 1,036 | 12.0% |
| Satellite Internet | 257 | 3.0% |
| No Internet | 782 | 9.1% |
| Total | 8,607 | 100.0% |
Secaucus Summary
Secaucus, NJ is a small town located in Hudson County, New Jersey. It is situated on the Hackensack River, just a few miles west of New York City. The town has a population of approximately 17,000 people and is known for its diverse population and vibrant economy.
History
The area that is now Secaucus was originally inhabited by the Hackensack Indians, who were part of the Lenape tribe. The first European settlers arrived in the area in the late 1600s, and the town was officially established in 1710. The town was named after the Hackensack Indians, who called the area “Secaucus,” which means “black land” in their language.
In the late 1800s, Secaucus began to develop as an industrial center. The town was home to several factories, including a silk mill, a paper mill, and a brickyard. The town also had a thriving agricultural industry, with farms producing vegetables, fruits, and dairy products.
In the early 1900s, Secaucus began to experience a population boom as immigrants from Europe and the Caribbean moved to the area. The town also became a popular destination for tourists, who came to enjoy the town’s natural beauty and its proximity to New York City.
Geography
Secaucus is located in Hudson County, New Jersey, just a few miles west of New York City. The town is situated on the Hackensack River, and is bordered by the towns of North Bergen, Jersey City, and Union City. The town is also close to the Meadowlands Sports Complex, which is home to the New York Giants and New York Jets football teams.
The town has a total area of 4.2 square miles, and is mostly flat. The town is located in a humid subtropical climate zone, and experiences hot, humid summers and cold, wet winters.
Economy
Secaucus has a vibrant economy, with a variety of businesses and industries. The town is home to several large corporations, including Panasonic, Unilever, and NBC Universal. The town is also home to several shopping centers, including the Harmon Meadow Plaza and the Secaucus Outlets.
The town is also home to several manufacturing companies, including a pharmaceutical company, a food processing plant, and a printing company. The town also has a thriving tourism industry, with many visitors coming to enjoy the town’s natural beauty and its proximity to New York City.
Demographics
As of the 2010 census, Secaucus had a population of 17,000 people. The town has a diverse population, with people of many different ethnic backgrounds. The town is approximately 55% white, 25% Hispanic, 10% African American, and 10% Asian. The town also has a large immigrant population, with people from India, China, and the Dominican Republic making up a significant portion of the population.
The median household income in Secaucus is $68,000, and the median home value is $400,000. The town has a low unemployment rate, and the majority of the population is employed in the service industry.
Conclusion
Secaucus, NJ is a small town located in Hudson County, New Jersey. It is situated on the Hackensack River, just a few miles west of New York City. The town has a population of approximately 17,000 people and is known for its diverse population and vibrant economy. The town has a variety of businesses and industries, and is home to several large corporations. The town also has a thriving tourism industry, with many visitors coming to enjoy the town’s natural beauty and its proximity to New York City. Secaucus has a diverse population, with people of many different ethnic backgrounds, and a median household income of $68,000.
Common Questions
What is Per Capita Income in Secaucus?
Per Capita income in Secaucus is $60,425.
What is the Median Family Income in Secaucus?
Median Family Income in Secaucus is $158,772.
What is the Median Household income in Secaucus?
Median Household Income in Secaucus is $129,348.
What is Income or Wage Gap in Secaucus?
Income or Wage Gap in Secaucus is 37.1%.
Women in Secaucus earn 62.9 cents for every dollar earned by a man.
What is Inequality or Gini Index in Secaucus?
Inequality or Gini Index in Secaucus is 0.41.
What is the Total Population of Secaucus?
Total Population of Secaucus is 21,470.
What is the Total Male Population of Secaucus?
Total Male Population of Secaucus is 10,777.
What is the Total Female Population of Secaucus?
Total Female Population of Secaucus is 10,693.
What is the Ratio of Males per 100 Females in Secaucus?
There are 100.79 Males per 100 Females in Secaucus.
What is the Ratio of Females per 100 Males in Secaucus?
There are 99.22 Females per 100 Males in Secaucus.
What is the Median Population Age in Secaucus?
Median Population Age in Secaucus is 39.0 Years.
What is the Average Family Size in Secaucus
Average Family Size in Secaucus is 2.9 People.
What is the Average Household Size in Secaucus
Average Household Size in Secaucus is 2.4 People.
How Large is the Labor Force in Secaucus?
There are 11,947 People in the Labor Forcein in Secaucus.
What is the Percentage of People in the Labor Force in Secaucus?
67.2% of People are in the Labor Force in Secaucus.
What is the Unemployment Rate in Secaucus?
Unemployment Rate in Secaucus is 6.5%.