Wayne, IL Map & Demographics
Wayne Map
Wayne Overview
$85,075
PER CAPITA INCOME
$175,330
AVG FAMILY INCOME
$165,313
AVG HOUSEHOLD INCOME
57.9%
WAGE / INCOME GAP [ % ]
42.1¢/ $1
WAGE / INCOME GAP [ $ ]
0.42
INEQUALITY / GINI INDEX
2,225
TOTAL POPULATION
1,089
MALE POPULATION
1,136
FEMALE POPULATION
95.86
MALES / 100 FEMALES
104.32
FEMALES / 100 MALES
52.3
MEDIAN AGE
2.8
AVG FAMILY SIZE
2.5
AVG HOUSEHOLD SIZE
1,390
LABOR FORCE [ PEOPLE ]
70.7%
PERCENT IN LABOR FORCE
2.9%
UNEMPLOYMENT RATE
Wayne Zip Codes
Wayne Area Codes
Income in Wayne
Income Overview in Wayne
Per Capita Income in Wayne is $85,075, while median incomes of families and households are $175,330 and $165,313 respectively.
| Characteristic | Number | Measure |
| Per Capita Income | 2,225 | $85,075 |
| Median Family Income | 678 | $175,330 |
| Mean Family Income | 678 | $233,326 |
| Median Household Income | 896 | $165,313 |
| Mean Household Income | 896 | $207,453 |
| Income Deficit | 678 | $0 |
| Wage / Income Gap (%) | 2,225 | 57.90% |
| Wage / Income Gap ($) | 2,225 | 42.10¢ per $1 |
| Gini / Inequality Index | 2,225 | 0.42 |
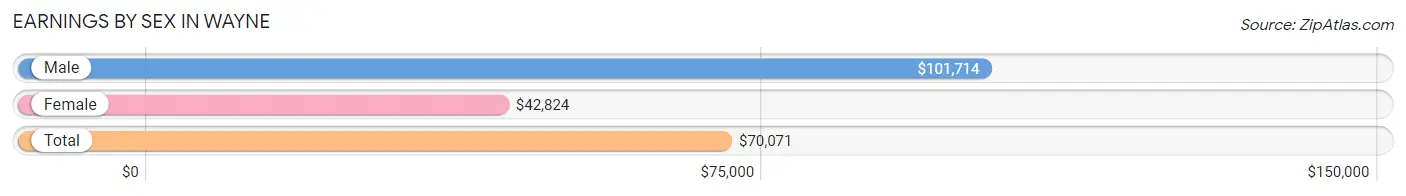
Earnings by Sex in Wayne
Average Earnings in Wayne are $70,071, $101,714 for men and $42,824 for women, a difference of 57.9%.
| Sex | Number | Average Earnings |
| Male | 743 (50.5%) | $101,714 |
| Female | 727 (49.5%) | $42,824 |
| Total | 1,470 (100.0%) | $70,071 |
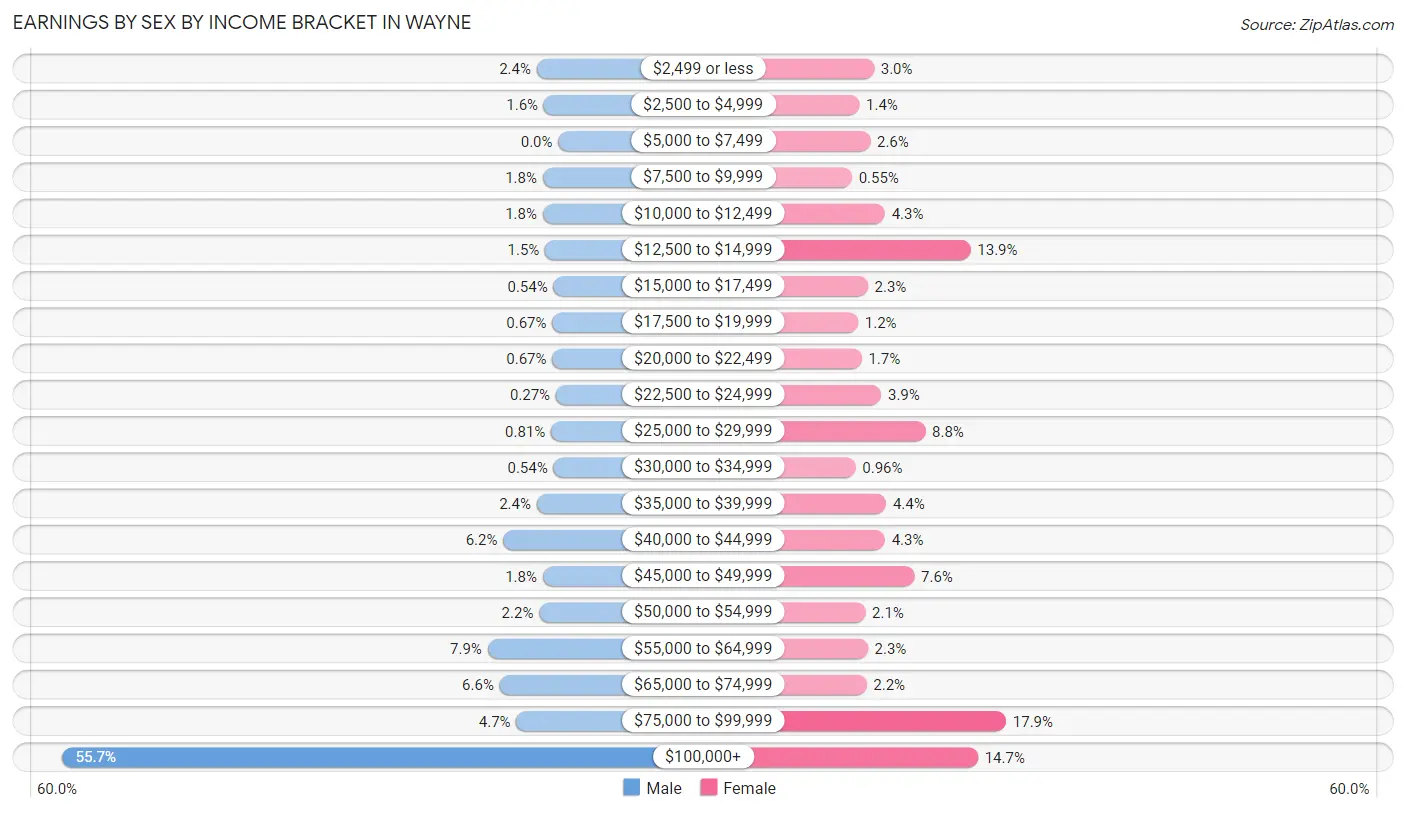
Earnings by Sex by Income Bracket in Wayne
The most common earnings brackets in Wayne are $100,000+ for men (414 | 55.7%) and $75,000 to $99,999 for women (130 | 17.9%).
| Income | Male | Female |
| $2,499 or less | 18 (2.4%) | 22 (3.0%) |
| $2,500 to $4,999 | 12 (1.6%) | 10 (1.4%) |
| $5,000 to $7,499 | 0 (0.0%) | 19 (2.6%) |
| $7,500 to $9,999 | 13 (1.8%) | 4 (0.5%) |
| $10,000 to $12,499 | 13 (1.8%) | 31 (4.3%) |
| $12,500 to $14,999 | 11 (1.5%) | 101 (13.9%) |
| $15,000 to $17,499 | 4 (0.5%) | 17 (2.3%) |
| $17,500 to $19,999 | 5 (0.7%) | 9 (1.2%) |
| $20,000 to $22,499 | 5 (0.7%) | 12 (1.7%) |
| $22,500 to $24,999 | 2 (0.3%) | 28 (3.8%) |
| $25,000 to $29,999 | 6 (0.8%) | 64 (8.8%) |
| $30,000 to $34,999 | 4 (0.5%) | 7 (1.0%) |
| $35,000 to $39,999 | 18 (2.4%) | 32 (4.4%) |
| $40,000 to $44,999 | 46 (6.2%) | 31 (4.3%) |
| $45,000 to $49,999 | 13 (1.8%) | 55 (7.6%) |
| $50,000 to $54,999 | 16 (2.1%) | 15 (2.1%) |
| $55,000 to $64,999 | 59 (7.9%) | 17 (2.3%) |
| $65,000 to $74,999 | 49 (6.6%) | 16 (2.2%) |
| $75,000 to $99,999 | 35 (4.7%) | 130 (17.9%) |
| $100,000+ | 414 (55.7%) | 107 (14.7%) |
| Total | 743 (100.0%) | 727 (100.0%) |
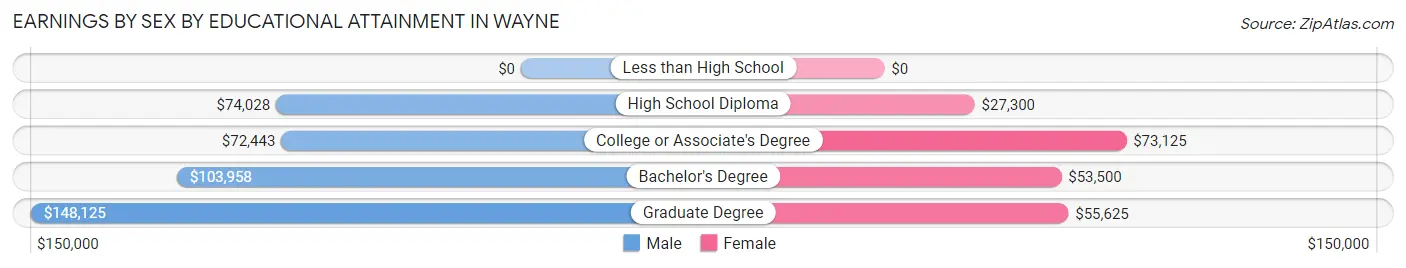
Earnings by Sex by Educational Attainment in Wayne
Average earnings in Wayne are $102,137 for men and $47,372 for women, a difference of 53.6%. Men with an educational attainment of graduate degree enjoy the highest average annual earnings of $148,125, while those with college or associate's degree education earn the least with $72,443. Women with an educational attainment of college or associate's degree earn the most with the average annual earnings of $73,125, while those with high school diploma education have the smallest earnings of $27,300.
| Educational Attainment | Male Income | Female Income |
| Less than High School | - | - |
| High School Diploma | $74,028 | $27,300 |
| College or Associate's Degree | $72,443 | $73,125 |
| Bachelor's Degree | $103,958 | $53,500 |
| Graduate Degree | $148,125 | $55,625 |
| Total | $102,137 | $47,372 |
Family Income in Wayne
Family Income Brackets in Wayne
According to the Wayne family income data, there are 230 families falling into the $200,000+ income range, which is the most common income bracket and makes up 33.9% of all families.
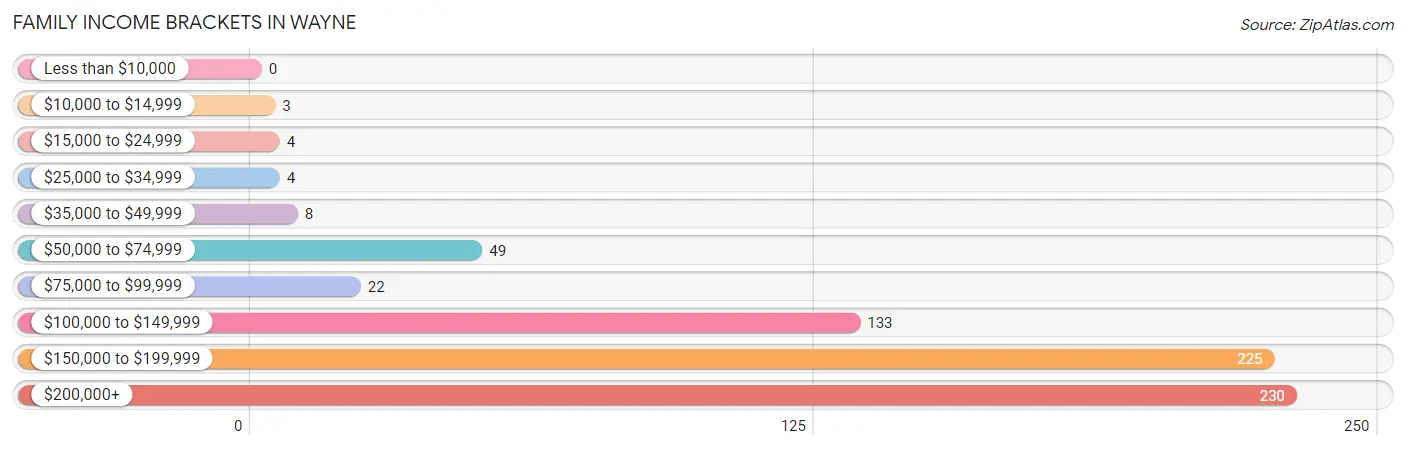
| Income Bracket | # Families | % Families |
| Less than $10,000 | 0 | 0.0% |
| $10,000 to $14,999 | 3 | 0.4% |
| $15,000 to $24,999 | 4 | 0.6% |
| $25,000 to $34,999 | 4 | 0.6% |
| $35,000 to $49,999 | 8 | 1.2% |
| $50,000 to $74,999 | 49 | 7.2% |
| $75,000 to $99,999 | 22 | 3.2% |
| $100,000 to $149,999 | 133 | 19.6% |
| $150,000 to $199,999 | 225 | 33.2% |
| $200,000+ | 230 | 33.9% |
Family Income by Famaliy Size in Wayne
3-person families (125 | 18.4%) account for the highest median family income in Wayne with $200,313 per family, while 2-person families (376 | 55.5%) have the highest median income of $82,578 per family member.
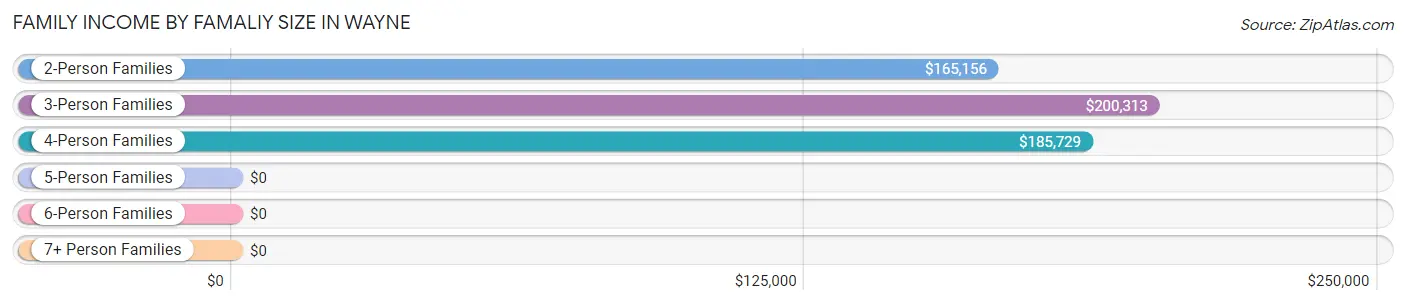
| Income Bracket | # Families | Median Income |
| 2-Person Families | 376 (55.5%) | $165,156 |
| 3-Person Families | 125 (18.4%) | $200,313 |
| 4-Person Families | 129 (19.0%) | $185,729 |
| 5-Person Families | 33 (4.9%) | $0 |
| 6-Person Families | 15 (2.2%) | $0 |
| 7+ Person Families | 0 (0.0%) | $0 |
| Total | 678 (100.0%) | $175,330 |
Family Income by Number of Earners in Wayne
The median family income in Wayne is $175,330, with families comprising 3+ earners (96) having the highest median family income of $183,333, while families with 1 earner (167) have the lowest median family income of $143,958, accounting for 14.2% and 24.6% of families, respectively.
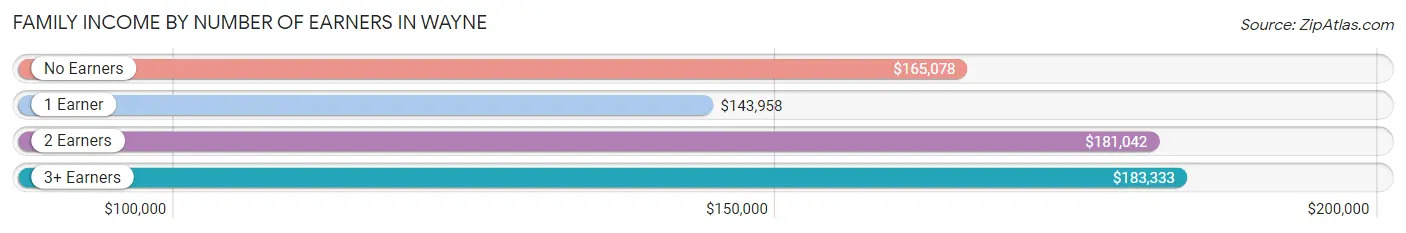
| Number of Earners | # Families | Median Income |
| No Earners | 71 (10.5%) | $165,078 |
| 1 Earner | 167 (24.6%) | $143,958 |
| 2 Earners | 344 (50.7%) | $181,042 |
| 3+ Earners | 96 (14.2%) | $183,333 |
| Total | 678 (100.0%) | $175,330 |
Household Income in Wayne
Household Income Brackets in Wayne
With 268 households falling in the category, the $200,000+ income range is the most frequent in Wayne, accounting for 29.9% of all households.
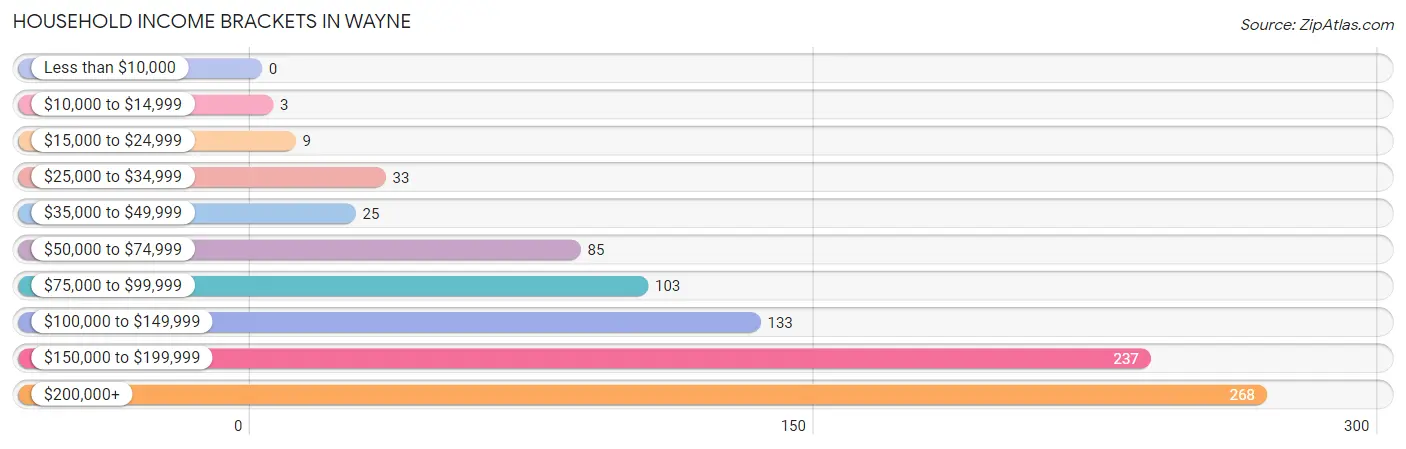
| Income Bracket | # Households | % Households |
| Less than $10,000 | 0 | 0.0% |
| $10,000 to $14,999 | 3 | 0.3% |
| $15,000 to $24,999 | 9 | 1.0% |
| $25,000 to $34,999 | 33 | 3.7% |
| $35,000 to $49,999 | 25 | 2.8% |
| $50,000 to $74,999 | 85 | 9.5% |
| $75,000 to $99,999 | 103 | 11.5% |
| $100,000 to $149,999 | 133 | 14.8% |
| $150,000 to $199,999 | 237 | 26.5% |
| $200,000+ | 268 | 29.9% |
Household Income by Householder Age in Wayne
The median household income in Wayne is $165,313, with the highest median household income of $170,208 found in the 65+ years age bracket for the primary householder. A total of 325 households (36.3%) fall into this category.
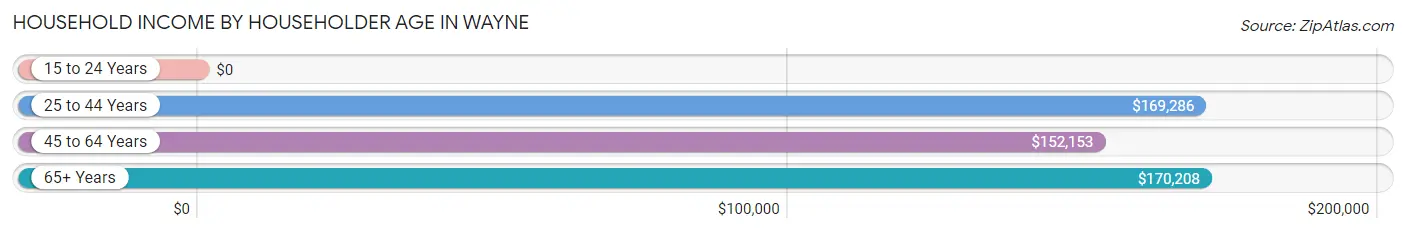
| Income Bracket | # Households | Median Income |
| 15 to 24 Years | 0 (0.0%) | $0 |
| 25 to 44 Years | 130 (14.5%) | $169,286 |
| 45 to 64 Years | 441 (49.2%) | $152,153 |
| 65+ Years | 325 (36.3%) | $170,208 |
| Total | 896 (100.0%) | $165,313 |
Poverty in Wayne
Income Below Poverty by Sex and Age in Wayne
With 0.7% poverty level for males and 1.1% for females among the residents of Wayne, 16 and 17 year old males and 75 year old and over females are the most vulnerable to poverty, with 5 males (11.6%) and 5 females (12.5%) in their respective age groups living below the poverty level.
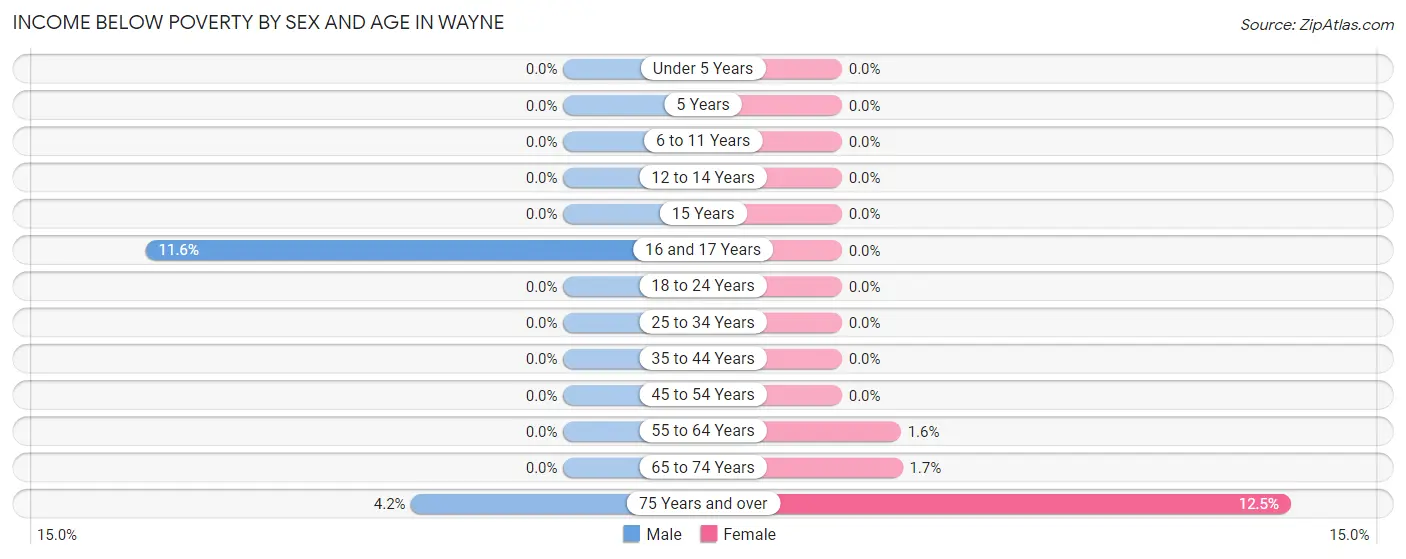
| Age Bracket | Male | Female |
| Under 5 Years | 0 (0.0%) | 0 (0.0%) |
| 5 Years | 0 (0.0%) | 0 (0.0%) |
| 6 to 11 Years | 0 (0.0%) | 0 (0.0%) |
| 12 to 14 Years | 0 (0.0%) | 0 (0.0%) |
| 15 Years | 0 (0.0%) | 0 (0.0%) |
| 16 and 17 Years | 5 (11.6%) | 0 (0.0%) |
| 18 to 24 Years | 0 (0.0%) | 0 (0.0%) |
| 25 to 34 Years | 0 (0.0%) | 0 (0.0%) |
| 35 to 44 Years | 0 (0.0%) | 0 (0.0%) |
| 45 to 54 Years | 0 (0.0%) | 0 (0.0%) |
| 55 to 64 Years | 0 (0.0%) | 5 (1.6%) |
| 65 to 74 Years | 0 (0.0%) | 3 (1.7%) |
| 75 Years and over | 3 (4.2%) | 5 (12.5%) |
| Total | 8 (0.7%) | 13 (1.1%) |
Income Above Poverty by Sex and Age in Wayne
According to the poverty statistics in Wayne, males aged under 5 years and females aged under 5 years are the age groups that are most secure financially, with 100.0% of males and 100.0% of females in these age groups living above the poverty line.
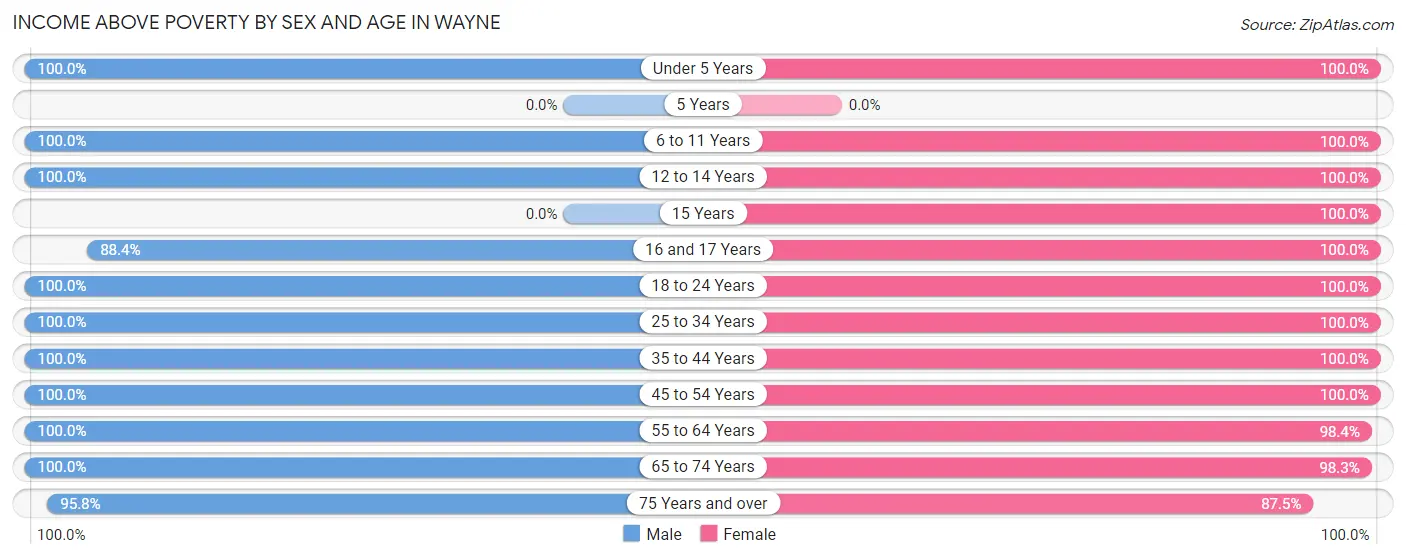
| Age Bracket | Male | Female |
| Under 5 Years | 79 (100.0%) | 32 (100.0%) |
| 5 Years | 0 (0.0%) | 0 (0.0%) |
| 6 to 11 Years | 33 (100.0%) | 50 (100.0%) |
| 12 to 14 Years | 20 (100.0%) | 28 (100.0%) |
| 15 Years | 0 (0.0%) | 12 (100.0%) |
| 16 and 17 Years | 38 (88.4%) | 32 (100.0%) |
| 18 to 24 Years | 10 (100.0%) | 136 (100.0%) |
| 25 to 34 Years | 114 (100.0%) | 66 (100.0%) |
| 35 to 44 Years | 114 (100.0%) | 73 (100.0%) |
| 45 to 54 Years | 145 (100.0%) | 185 (100.0%) |
| 55 to 64 Years | 195 (100.0%) | 299 (98.4%) |
| 65 to 74 Years | 260 (100.0%) | 175 (98.3%) |
| 75 Years and over | 68 (95.8%) | 35 (87.5%) |
| Total | 1,076 (99.3%) | 1,123 (98.9%) |
Income Below Poverty Among Married-Couple Families in Wayne
The poverty statistics for married-couple families in Wayne show that 0.5% or 3 of the total 633 families live below the poverty line. Families with no children have the highest poverty rate of 0.6%, comprising of 3 families. On the other hand, families with 1 or 2 children have the lowest poverty rate of 0.0%, which includes 0 families.
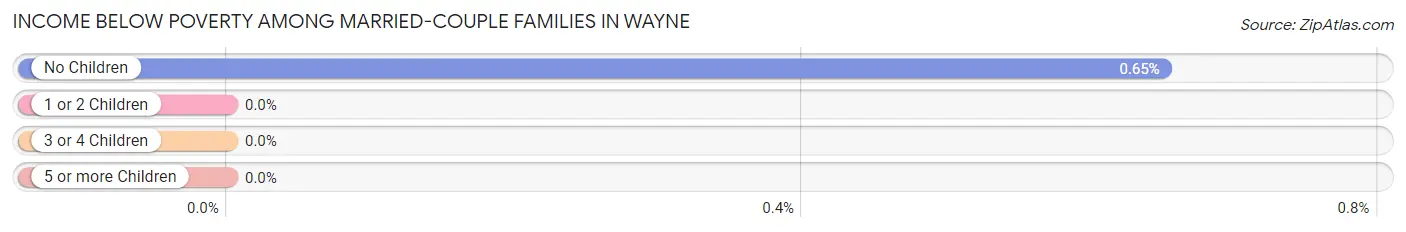
| Children | Above Poverty | Below Poverty |
| No Children | 457 (99.4%) | 3 (0.6%) |
| 1 or 2 Children | 156 (100.0%) | 0 (0.0%) |
| 3 or 4 Children | 17 (100.0%) | 0 (0.0%) |
| 5 or more Children | 0 (0.0%) | 0 (0.0%) |
| Total | 630 (99.5%) | 3 (0.5%) |
Income Below Poverty Among Single-Parent Households in Wayne
| Children | Single Father | Single Mother |
| No Children | 0 (0.0%) | 0 (0.0%) |
| 1 or 2 Children | 0 (0.0%) | 0 (0.0%) |
| 3 or 4 Children | 0 (0.0%) | 0 (0.0%) |
| 5 or more Children | 0 (0.0%) | 0 (0.0%) |
| Total | 0 (0.0%) | 0 (0.0%) |
Income Below Poverty Among Married-Couple vs Single-Parent Households in Wayne
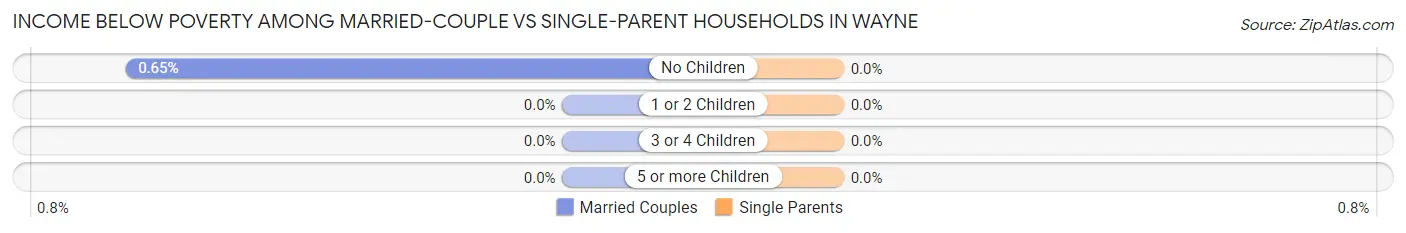
| Children | Married-Couple Families | Single-Parent Households |
| No Children | 3 (0.6%) | 0 (0.0%) |
| 1 or 2 Children | 0 (0.0%) | 0 (0.0%) |
| 3 or 4 Children | 0 (0.0%) | 0 (0.0%) |
| 5 or more Children | 0 (0.0%) | 0 (0.0%) |
| Total | 3 (0.5%) | 0 (0.0%) |
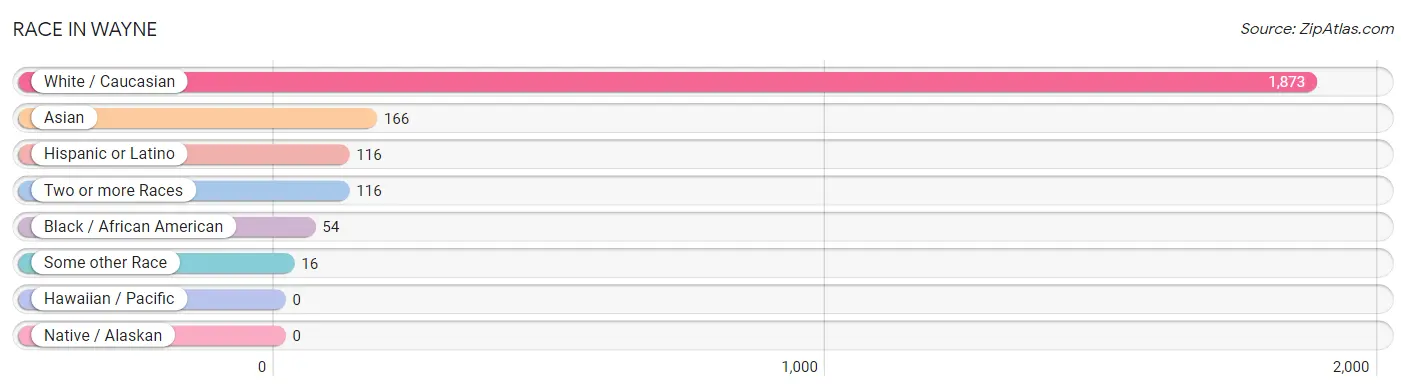
Race in Wayne
The most populous races in Wayne are White / Caucasian (1,873 | 84.2%), Asian (166 | 7.5%), and Hispanic or Latino (116 | 5.2%).
| Race | # Population | % Population |
| Asian | 166 | 7.5% |
| Black / African American | 54 | 2.4% |
| Hawaiian / Pacific | 0 | 0.0% |
| Hispanic or Latino | 116 | 5.2% |
| Native / Alaskan | 0 | 0.0% |
| White / Caucasian | 1,873 | 84.2% |
| Two or more Races | 116 | 5.2% |
| Some other Race | 16 | 0.7% |
| Total | 2,225 | 100.0% |
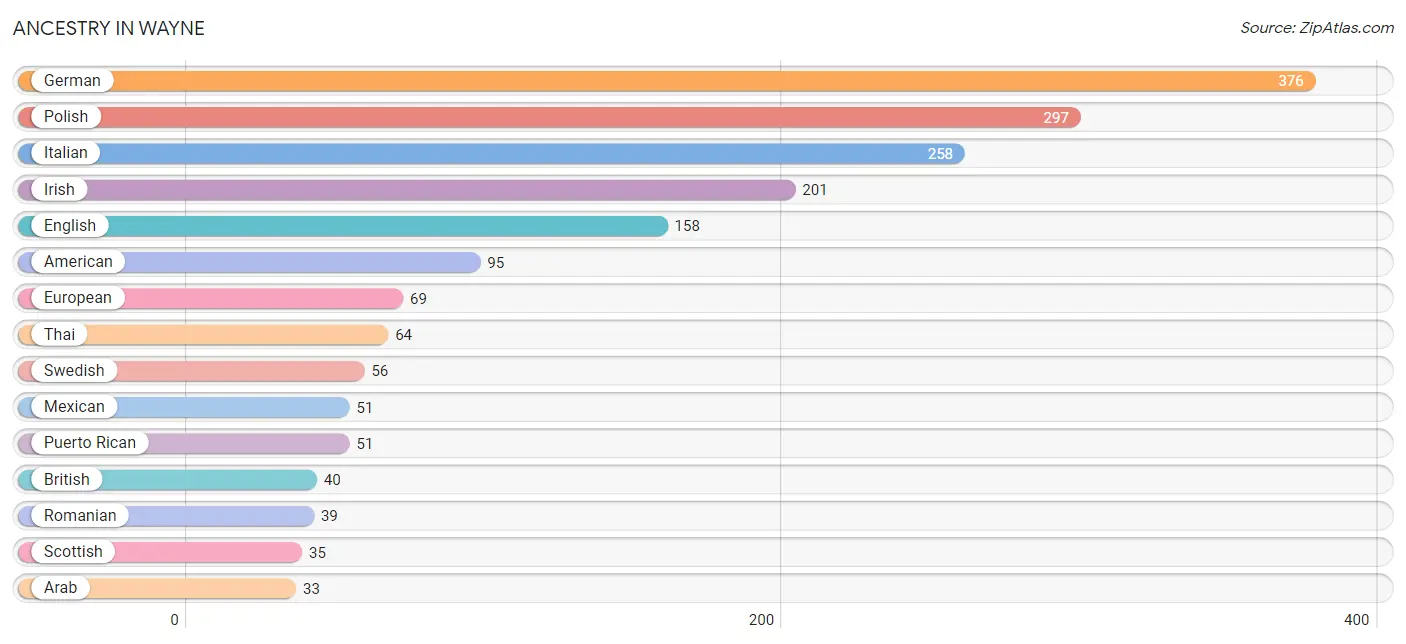
Ancestry in Wayne
The most populous ancestries reported in Wayne are German (376 | 16.9%), Polish (297 | 13.4%), Italian (258 | 11.6%), Irish (201 | 9.0%), and English (158 | 7.1%), together accounting for 58.0% of all Wayne residents.
| Ancestry | # Population | % Population |
| American | 95 | 4.3% |
| Arab | 33 | 1.5% |
| Armenian | 7 | 0.3% |
| British | 40 | 1.8% |
| Canadian | 21 | 0.9% |
| Carpatho Rusyn | 3 | 0.1% |
| Croatian | 23 | 1.0% |
| Cuban | 12 | 0.5% |
| Czech | 26 | 1.2% |
| Czechoslovakian | 16 | 0.7% |
| Danish | 10 | 0.4% |
| Dominican | 2 | 0.1% |
| Dutch | 15 | 0.7% |
| Eastern European | 10 | 0.4% |
| Egyptian | 6 | 0.3% |
| English | 158 | 7.1% |
| European | 69 | 3.1% |
| French | 28 | 1.3% |
| French Canadian | 17 | 0.8% |
| German | 376 | 16.9% |
| Greek | 11 | 0.5% |
| Hungarian | 9 | 0.4% |
| Irish | 201 | 9.0% |
| Italian | 258 | 11.6% |
| Jordanian | 27 | 1.2% |
| Mexican | 51 | 2.3% |
| Northern European | 21 | 0.9% |
| Norwegian | 5 | 0.2% |
| Polish | 297 | 13.4% |
| Portuguese | 17 | 0.8% |
| Puerto Rican | 51 | 2.3% |
| Romanian | 39 | 1.8% |
| Russian | 7 | 0.3% |
| Scandinavian | 5 | 0.2% |
| Scotch-Irish | 9 | 0.4% |
| Scottish | 35 | 1.6% |
| Serbian | 16 | 0.7% |
| Slovak | 5 | 0.2% |
| Slovene | 4 | 0.2% |
| Swedish | 56 | 2.5% |
| Swiss | 14 | 0.6% |
| Thai | 64 | 2.9% |
| Turkish | 5 | 0.2% |
| Welsh | 9 | 0.4% | View All 44 Rows |
Immigrants in Wayne
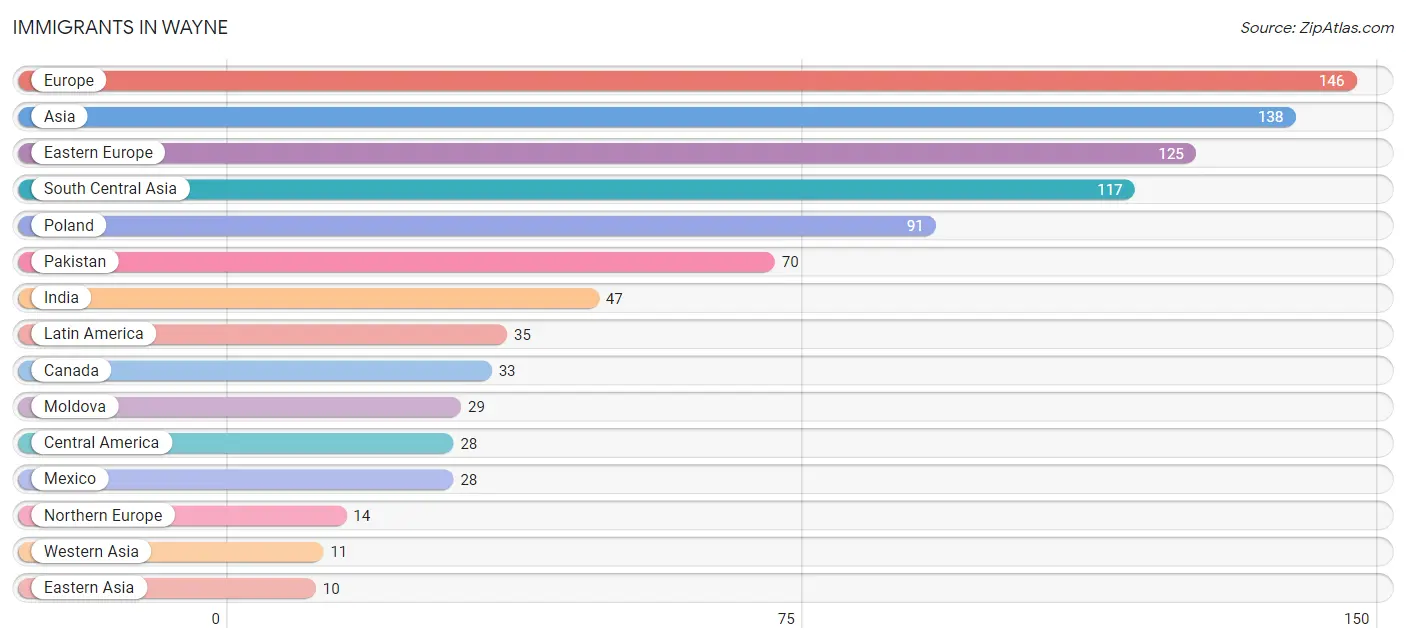
The most numerous immigrant groups reported in Wayne came from Europe (146 | 6.6%), Asia (138 | 6.2%), Eastern Europe (125 | 5.6%), South Central Asia (117 | 5.3%), and Poland (91 | 4.1%), together accounting for 27.7% of all Wayne residents.
| Immigration Origin | # Population | % Population |
| Africa | 6 | 0.3% |
| Asia | 138 | 6.2% |
| Canada | 33 | 1.5% |
| Caribbean | 7 | 0.3% |
| Central America | 28 | 1.3% |
| Croatia | 5 | 0.2% |
| Cuba | 7 | 0.3% |
| Eastern Asia | 10 | 0.4% |
| Eastern Europe | 125 | 5.6% |
| Egypt | 6 | 0.3% |
| England | 9 | 0.4% |
| Europe | 146 | 6.6% |
| India | 47 | 2.1% |
| Japan | 10 | 0.4% |
| Jordan | 6 | 0.3% |
| Latin America | 35 | 1.6% |
| Mexico | 28 | 1.3% |
| Moldova | 29 | 1.3% |
| Netherlands | 7 | 0.3% |
| Northern Africa | 6 | 0.3% |
| Northern Europe | 14 | 0.6% |
| Pakistan | 70 | 3.2% |
| Poland | 91 | 4.1% |
| South Central Asia | 117 | 5.3% |
| Turkey | 5 | 0.2% |
| Western Asia | 11 | 0.5% |
| Western Europe | 7 | 0.3% | View All 27 Rows |
Sex and Age in Wayne
Sex and Age in Wayne
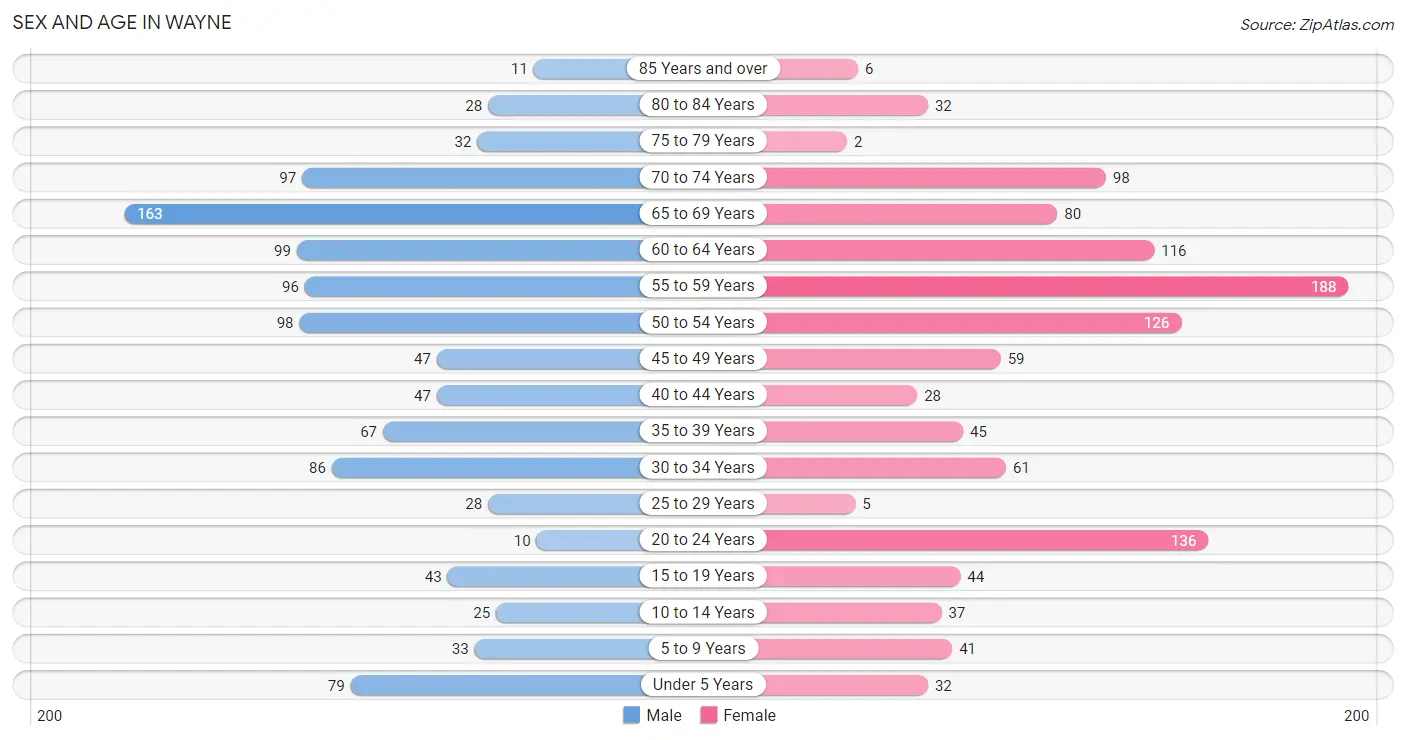
The most populous age groups in Wayne are 65 to 69 Years (163 | 15.0%) for men and 55 to 59 Years (188 | 16.6%) for women.
| Age Bracket | Male | Female |
| Under 5 Years | 79 (7.2%) | 32 (2.8%) |
| 5 to 9 Years | 33 (3.0%) | 41 (3.6%) |
| 10 to 14 Years | 25 (2.3%) | 37 (3.3%) |
| 15 to 19 Years | 43 (4.0%) | 44 (3.9%) |
| 20 to 24 Years | 10 (0.9%) | 136 (12.0%) |
| 25 to 29 Years | 28 (2.6%) | 5 (0.4%) |
| 30 to 34 Years | 86 (7.9%) | 61 (5.4%) |
| 35 to 39 Years | 67 (6.1%) | 45 (4.0%) |
| 40 to 44 Years | 47 (4.3%) | 28 (2.5%) |
| 45 to 49 Years | 47 (4.3%) | 59 (5.2%) |
| 50 to 54 Years | 98 (9.0%) | 126 (11.1%) |
| 55 to 59 Years | 96 (8.8%) | 188 (16.6%) |
| 60 to 64 Years | 99 (9.1%) | 116 (10.2%) |
| 65 to 69 Years | 163 (15.0%) | 80 (7.0%) |
| 70 to 74 Years | 97 (8.9%) | 98 (8.6%) |
| 75 to 79 Years | 32 (2.9%) | 2 (0.2%) |
| 80 to 84 Years | 28 (2.6%) | 32 (2.8%) |
| 85 Years and over | 11 (1.0%) | 6 (0.5%) |
| Total | 1,089 (100.0%) | 1,136 (100.0%) |
Families and Households in Wayne
Median Family Size in Wayne
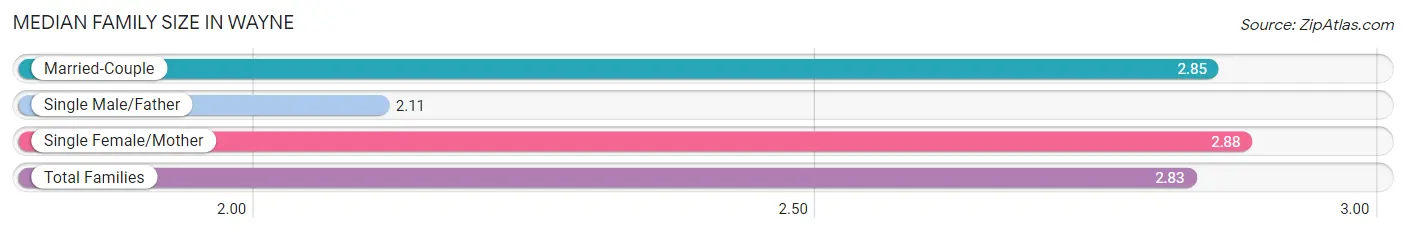
The median family size in Wayne is 2.83 persons per family, with single female/mother families (26 | 3.8%) accounting for the largest median family size of 2.88 persons per family. On the other hand, single male/father families (19 | 2.8%) represent the smallest median family size with 2.11 persons per family.
| Family Type | # Families | Family Size |
| Married-Couple | 633 (93.4%) | 2.85 |
| Single Male/Father | 19 (2.8%) | 2.11 |
| Single Female/Mother | 26 (3.8%) | 2.88 |
| Total Families | 678 (100.0%) | 2.83 |
Median Household Size in Wayne
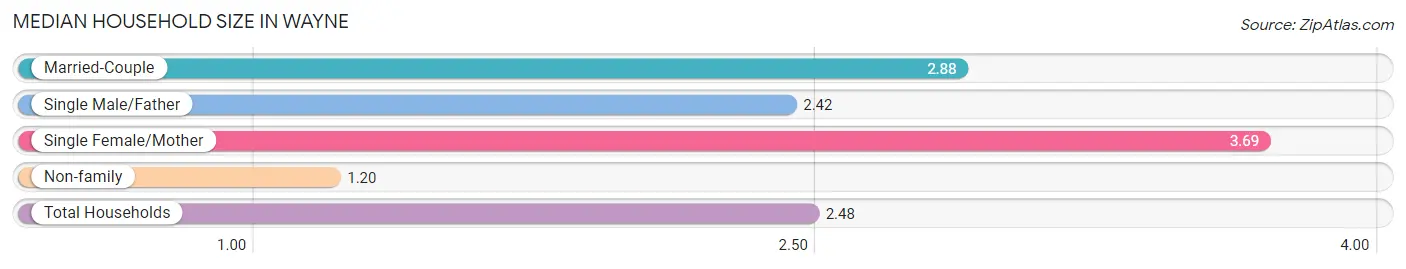
The median household size in Wayne is 2.48 persons per household, with single female/mother households (26 | 2.9%) accounting for the largest median household size of 3.69 persons per household. non-family households (218 | 24.3%) represent the smallest median household size with 1.20 persons per household.
| Household Type | # Households | Household Size |
| Married-Couple | 633 (70.7%) | 2.88 |
| Single Male/Father | 19 (2.1%) | 2.42 |
| Single Female/Mother | 26 (2.9%) | 3.69 |
| Non-family | 218 (24.3%) | 1.20 |
| Total Households | 896 (100.0%) | 2.48 |
Household Size by Marriage Status in Wayne
Out of a total of 896 households in Wayne, 678 (75.7%) are family households, while 218 (24.3%) are nonfamily households. The most numerous type of family households are 2-person households, comprising 369, and the most common type of nonfamily households are 1-person households, comprising 183.
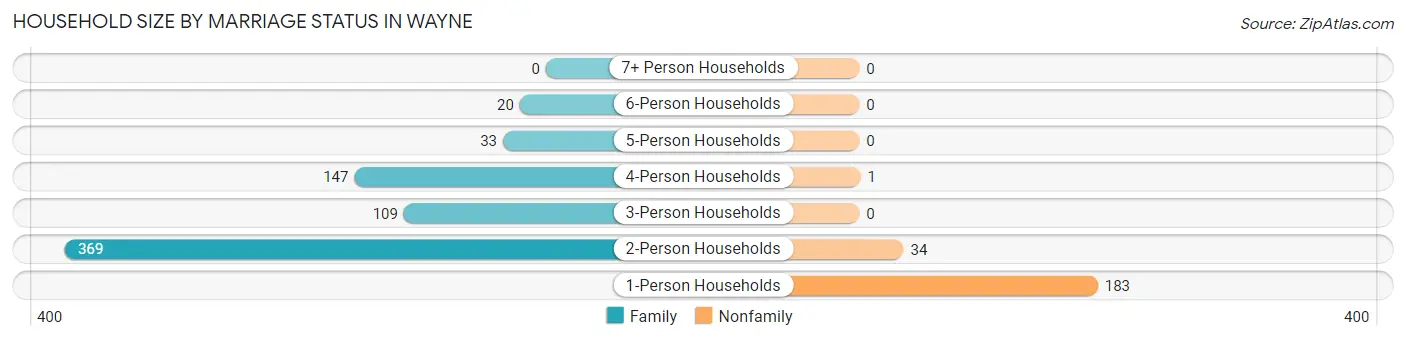
| Household Size | Family Households | Nonfamily Households |
| 1-Person Households | - | 183 (20.4%) |
| 2-Person Households | 369 (41.2%) | 34 (3.8%) |
| 3-Person Households | 109 (12.2%) | 0 (0.0%) |
| 4-Person Households | 147 (16.4%) | 1 (0.1%) |
| 5-Person Households | 33 (3.7%) | 0 (0.0%) |
| 6-Person Households | 20 (2.2%) | 0 (0.0%) |
| 7+ Person Households | 0 (0.0%) | 0 (0.0%) |
| Total | 678 (75.7%) | 218 (24.3%) |
Female Fertility in Wayne
Fertility by Age in Wayne
Average fertility rate in Wayne is 45.0 births per 1,000 women. Women in the age bracket of 20 to 34 years have the highest fertility rate with 69.0 births per 1,000 women. Women in the age bracket of 20 to 34 years acount for 73.7% of all women with births.
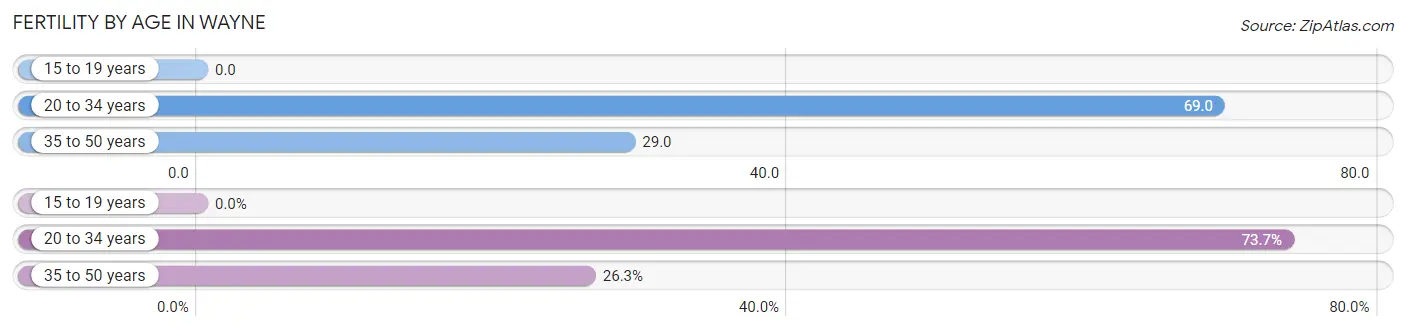
| Age Bracket | Women with Births | Births / 1,000 Women |
| 15 to 19 years | 0 (0.0%) | 0.0 |
| 20 to 34 years | 14 (73.7%) | 69.0 |
| 35 to 50 years | 5 (26.3%) | 29.0 |
| Total | 19 (100.0%) | 45.0 |
Fertility by Age by Marriage Status in Wayne
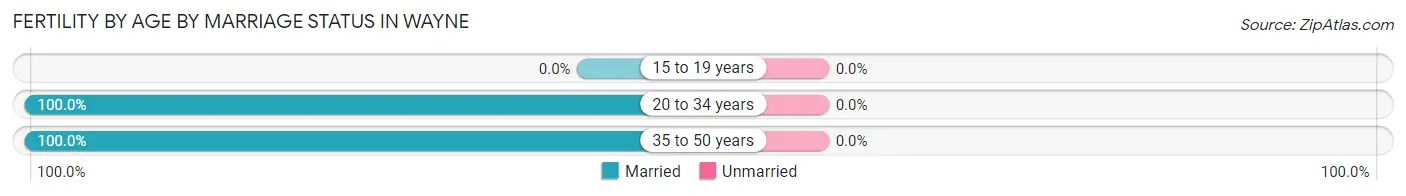
| Age Bracket | Married | Unmarried |
| 15 to 19 years | 0 (0.0%) | 0 (0.0%) |
| 20 to 34 years | 14 (100.0%) | 0 (0.0%) |
| 35 to 50 years | 5 (100.0%) | 0 (0.0%) |
| Total | 19 (100.0%) | 0 (0.0%) |
Fertility by Education in Wayne
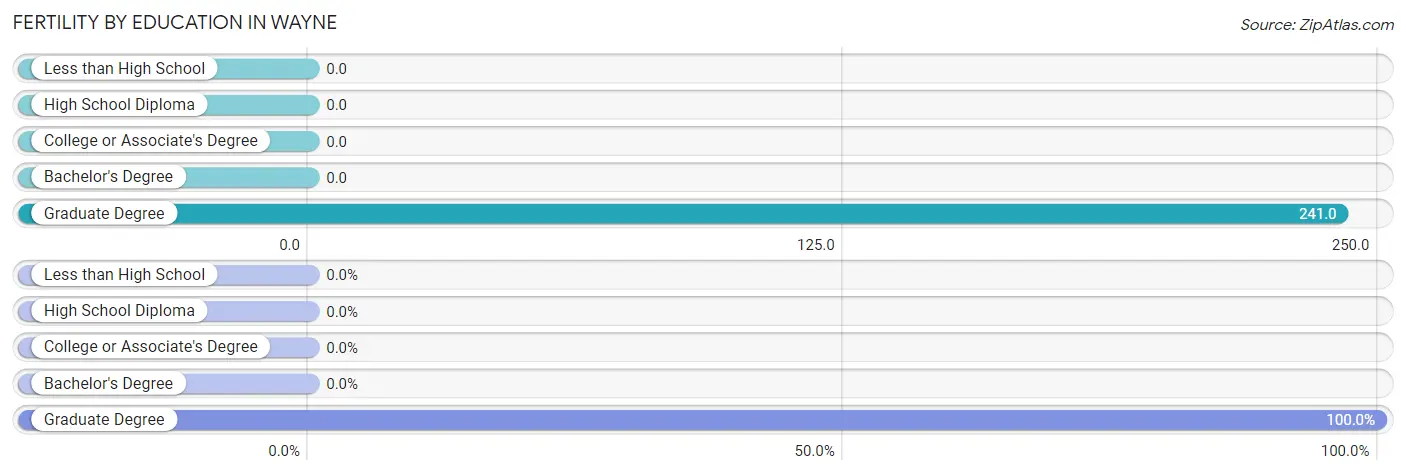
| Educational Attainment | Women with Births | Births / 1,000 Women |
| Less than High School | 0 (0.0%) | 0.0 |
| High School Diploma | 0 (0.0%) | 0.0 |
| College or Associate's Degree | 0 (0.0%) | 0.0 |
| Bachelor's Degree | 0 (0.0%) | 0.0 |
| Graduate Degree | 19 (100.0%) | 241.0 |
| Total | 19 (100.0%) | 45.0 |
Fertility by Education by Marriage Status in Wayne
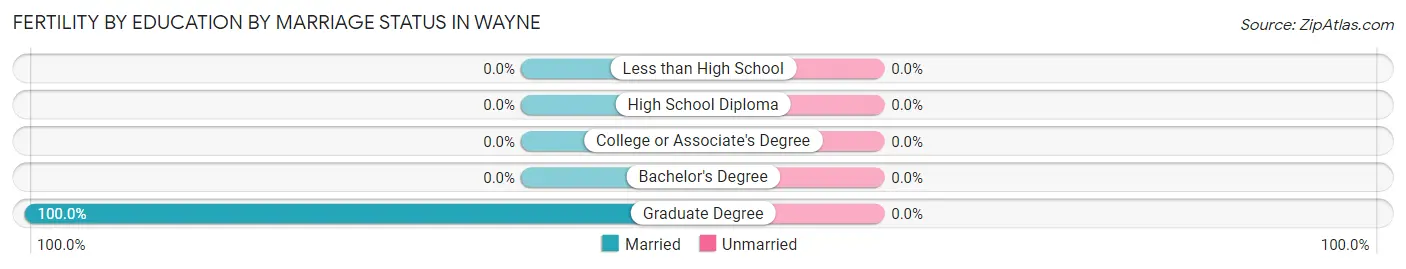
| Educational Attainment | Married | Unmarried |
| Less than High School | 0 (0.0%) | 0 (0.0%) |
| High School Diploma | 0 (0.0%) | 0 (0.0%) |
| College or Associate's Degree | 0 (0.0%) | 0 (0.0%) |
| Bachelor's Degree | 0 (0.0%) | 0 (0.0%) |
| Graduate Degree | 19 (100.0%) | 0 (0.0%) |
| Total | 19 (100.0%) | 0 (0.0%) |
Employment Characteristics in Wayne
Employment by Class of Employer in Wayne
Among the 1,326 employed individuals in Wayne, private company employees (989 | 74.6%), self-employed (incorporated) (133 | 10.0%), and self-employed (not incorporated) (67 | 5.1%) make up the most common classes of employment.
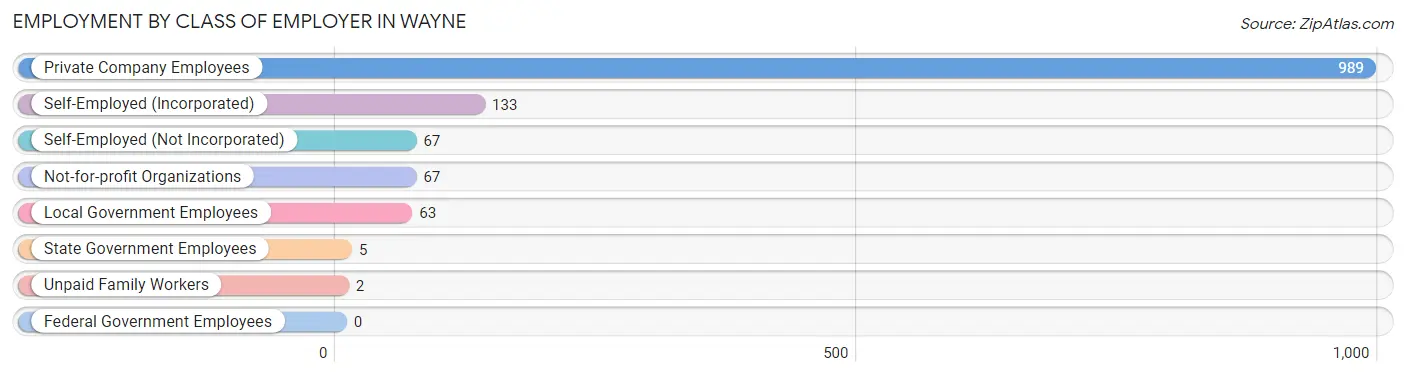
| Employer Class | # Employees | % Employees |
| Private Company Employees | 989 | 74.6% |
| Self-Employed (Incorporated) | 133 | 10.0% |
| Self-Employed (Not Incorporated) | 67 | 5.1% |
| Not-for-profit Organizations | 67 | 5.1% |
| Local Government Employees | 63 | 4.8% |
| State Government Employees | 5 | 0.4% |
| Federal Government Employees | 0 | 0.0% |
| Unpaid Family Workers | 2 | 0.2% |
| Total | 1,326 | 100.0% |
Employment Status by Age in Wayne
According to the labor force statistics for Wayne, out of the total population over 16 years of age (1,966), 70.7% or 1,390 individuals are in the labor force, with 2.9% or 40 of them unemployed. The age group with the highest labor force participation rate is 25 to 29 years, with 100.0% or 33 individuals in the labor force. Within the labor force, the 25 to 29 years age range has the highest percentage of unemployed individuals, with 33.3% or 11 of them being unemployed.
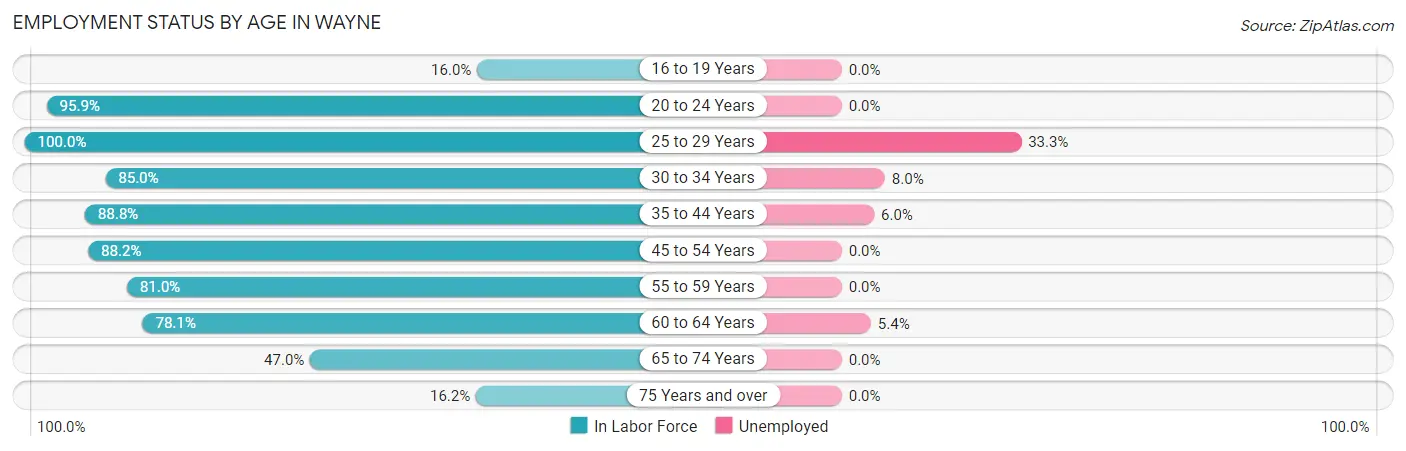
| Age Bracket | In Labor Force | Unemployed |
| 16 to 19 Years | 12 (16.0%) | 0 (0.0%) |
| 20 to 24 Years | 140 (95.9%) | 0 (0.0%) |
| 25 to 29 Years | 33 (100.0%) | 11 (33.3%) |
| 30 to 34 Years | 125 (85.0%) | 10 (8.0%) |
| 35 to 44 Years | 166 (88.8%) | 10 (6.0%) |
| 45 to 54 Years | 291 (88.2%) | 0 (0.0%) |
| 55 to 59 Years | 230 (81.0%) | 0 (0.0%) |
| 60 to 64 Years | 168 (78.1%) | 9 (5.4%) |
| 65 to 74 Years | 206 (47.0%) | 0 (0.0%) |
| 75 Years and over | 18 (16.2%) | 0 (0.0%) |
| Total | 1,390 (70.7%) | 40 (2.9%) |
Employment Status by Educational Attainment in Wayne
According to labor force statistics for Wayne, 84.7% of individuals (1,013) out of the total population between 25 and 64 years of age (1,196) are in the labor force, with 3.9% or 40 of them being unemployed. The group with the highest labor force participation rate are those with the educational attainment of college / associate degree, with 90.5% or 398 individuals in the labor force. Within the labor force, individuals with high school diploma education have the highest percentage of unemployment, with 8.9% or 9 of them being unemployed.
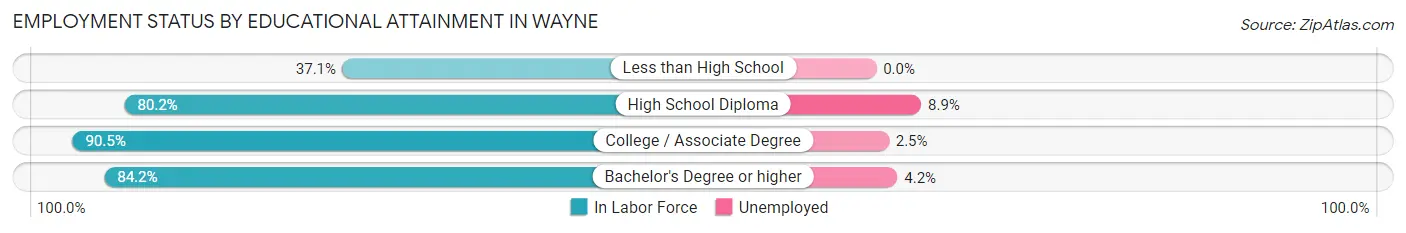
| Educational Attainment | In Labor Force | Unemployed |
| Less than High School | 13 (37.1%) | 0 (0.0%) |
| High School Diploma | 101 (80.2%) | 11 (8.9%) |
| College / Associate Degree | 398 (90.5%) | 11 (2.5%) |
| Bachelor's Degree or higher | 501 (84.2%) | 25 (4.2%) |
| Total | 1,013 (84.7%) | 47 (3.9%) |
Employment Occupations by Sex in Wayne
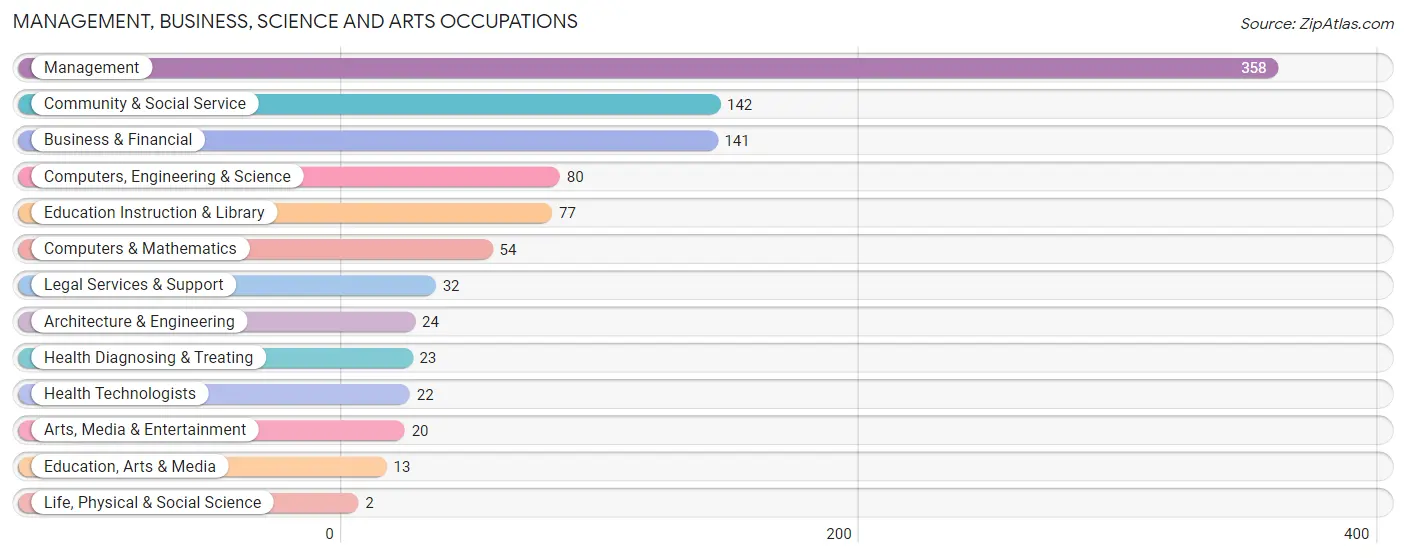
Management, Business, Science and Arts Occupations
The most common Management, Business, Science and Arts occupations in Wayne are Management (358 | 26.5%), Community & Social Service (142 | 10.5%), Business & Financial (141 | 10.4%), Computers, Engineering & Science (80 | 5.9%), and Education Instruction & Library (77 | 5.7%).
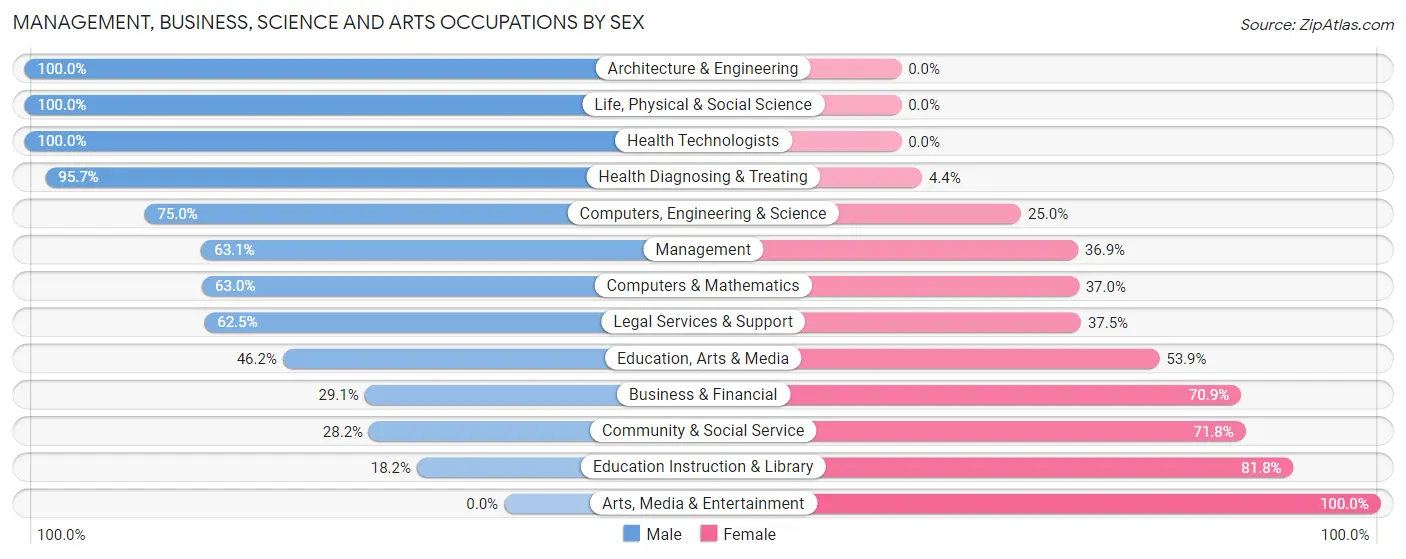
Management, Business, Science and Arts Occupations by Sex
Within the Management, Business, Science and Arts occupations in Wayne, the most male-oriented occupations are Architecture & Engineering (100.0%), Life, Physical & Social Science (100.0%), and Health Technologists (100.0%), while the most female-oriented occupations are Arts, Media & Entertainment (100.0%), Education Instruction & Library (81.8%), and Community & Social Service (71.8%).
| Occupation | Male | Female |
| Management | 226 (63.1%) | 132 (36.9%) |
| Business & Financial | 41 (29.1%) | 100 (70.9%) |
| Computers, Engineering & Science | 60 (75.0%) | 20 (25.0%) |
| Computers & Mathematics | 34 (63.0%) | 20 (37.0%) |
| Architecture & Engineering | 24 (100.0%) | 0 (0.0%) |
| Life, Physical & Social Science | 2 (100.0%) | 0 (0.0%) |
| Community & Social Service | 40 (28.2%) | 102 (71.8%) |
| Education, Arts & Media | 6 (46.2%) | 7 (53.8%) |
| Legal Services & Support | 20 (62.5%) | 12 (37.5%) |
| Education Instruction & Library | 14 (18.2%) | 63 (81.8%) |
| Arts, Media & Entertainment | 0 (0.0%) | 20 (100.0%) |
| Health Diagnosing & Treating | 22 (95.7%) | 1 (4.3%) |
| Health Technologists | 22 (100.0%) | 0 (0.0%) |
| Total (Category) | 389 (52.3%) | 355 (47.7%) |
| Total (Overall) | 686 (50.8%) | 663 (49.1%) |
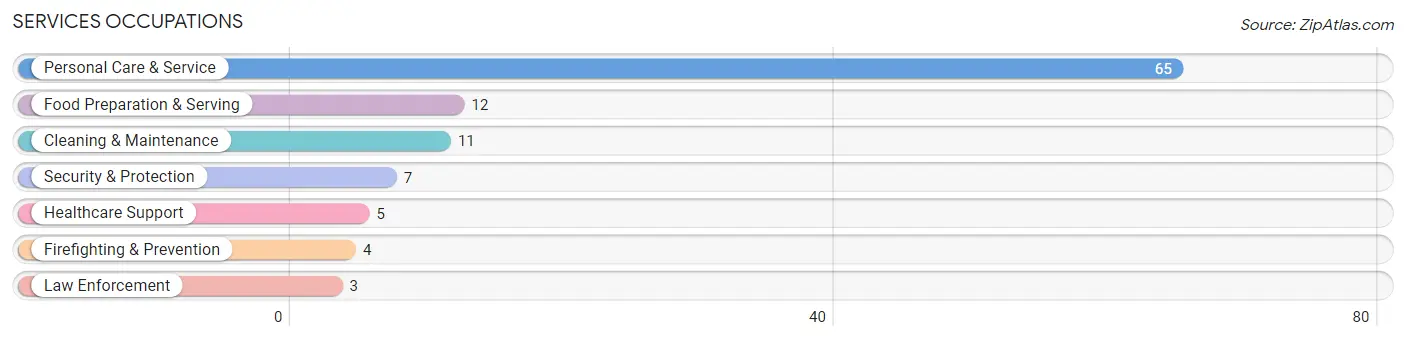
Services Occupations
The most common Services occupations in Wayne are Personal Care & Service (65 | 4.8%), Food Preparation & Serving (12 | 0.9%), Cleaning & Maintenance (11 | 0.8%), Security & Protection (7 | 0.5%), and Healthcare Support (5 | 0.4%).
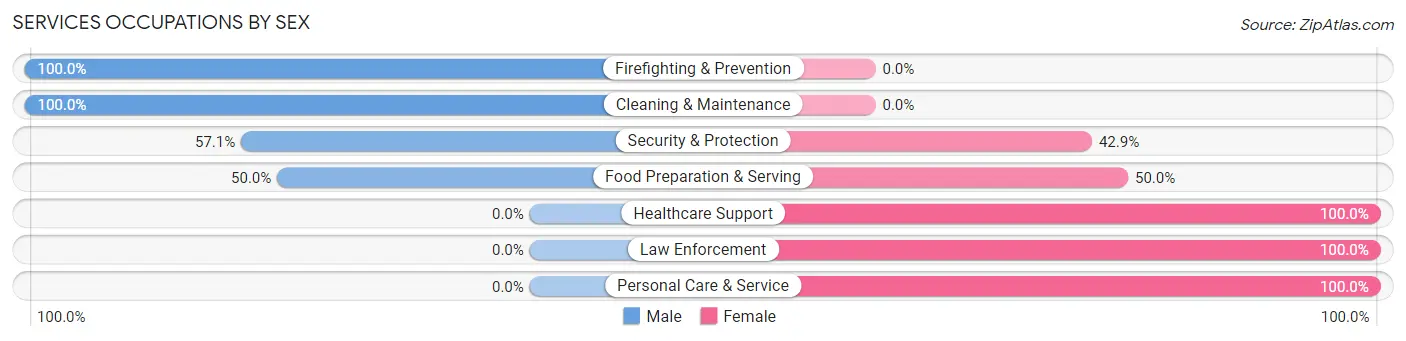
Services Occupations by Sex
Within the Services occupations in Wayne, the most male-oriented occupations are Firefighting & Prevention (100.0%), Cleaning & Maintenance (100.0%), and Security & Protection (57.1%), while the most female-oriented occupations are Healthcare Support (100.0%), Law Enforcement (100.0%), and Personal Care & Service (100.0%).
| Occupation | Male | Female |
| Healthcare Support | 0 (0.0%) | 5 (100.0%) |
| Security & Protection | 4 (57.1%) | 3 (42.9%) |
| Firefighting & Prevention | 4 (100.0%) | 0 (0.0%) |
| Law Enforcement | 0 (0.0%) | 3 (100.0%) |
| Food Preparation & Serving | 6 (50.0%) | 6 (50.0%) |
| Cleaning & Maintenance | 11 (100.0%) | 0 (0.0%) |
| Personal Care & Service | 0 (0.0%) | 65 (100.0%) |
| Total (Category) | 21 (21.0%) | 79 (79.0%) |
| Total (Overall) | 686 (50.8%) | 663 (49.1%) |
Sales and Office Occupations
The most common Sales and Office occupations in Wayne are Office & Administration (169 | 12.5%), and Sales & Related (142 | 10.5%).

Sales and Office Occupations by Sex
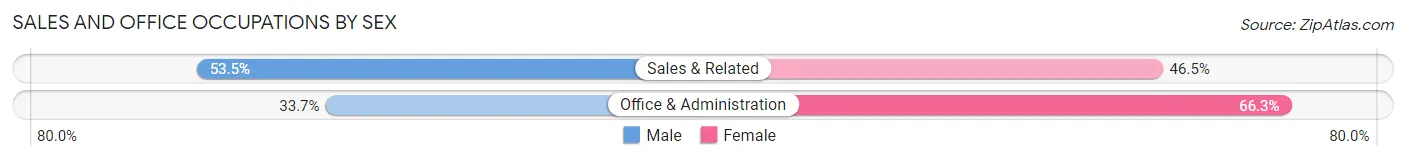
| Occupation | Male | Female |
| Sales & Related | 76 (53.5%) | 66 (46.5%) |
| Office & Administration | 57 (33.7%) | 112 (66.3%) |
| Total (Category) | 133 (42.8%) | 178 (57.2%) |
| Total (Overall) | 686 (50.8%) | 663 (49.1%) |
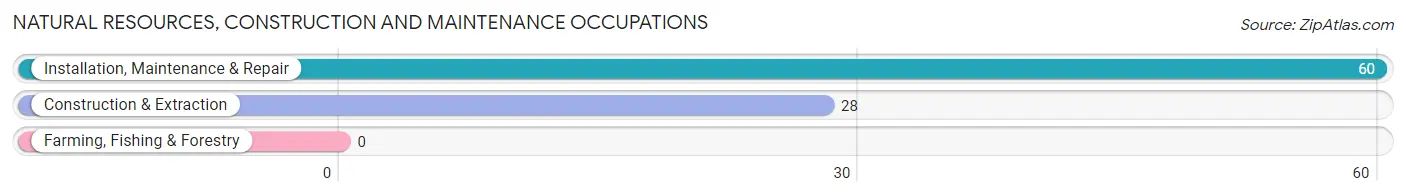
Natural Resources, Construction and Maintenance Occupations
The most common Natural Resources, Construction and Maintenance occupations in Wayne are Installation, Maintenance & Repair (60 | 4.4%), and Construction & Extraction (28 | 2.1%).
Natural Resources, Construction and Maintenance Occupations by Sex
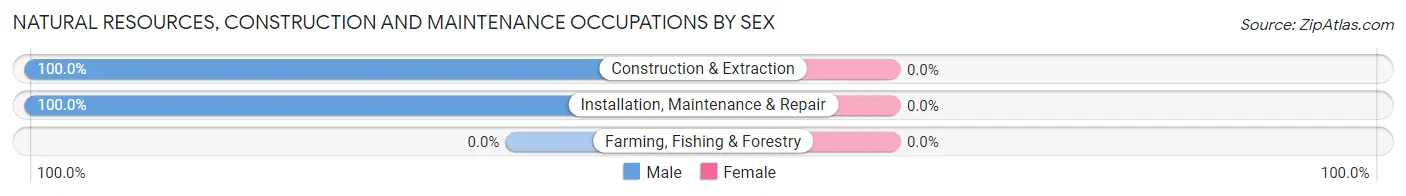
| Occupation | Male | Female |
| Farming, Fishing & Forestry | 0 (0.0%) | 0 (0.0%) |
| Construction & Extraction | 28 (100.0%) | 0 (0.0%) |
| Installation, Maintenance & Repair | 60 (100.0%) | 0 (0.0%) |
| Total (Category) | 88 (100.0%) | 0 (0.0%) |
| Total (Overall) | 686 (50.8%) | 663 (49.1%) |
Production, Transportation and Moving Occupations
The most common Production, Transportation and Moving occupations in Wayne are Material Moving (51 | 3.8%), Transportation (45 | 3.3%), and Production (10 | 0.7%).
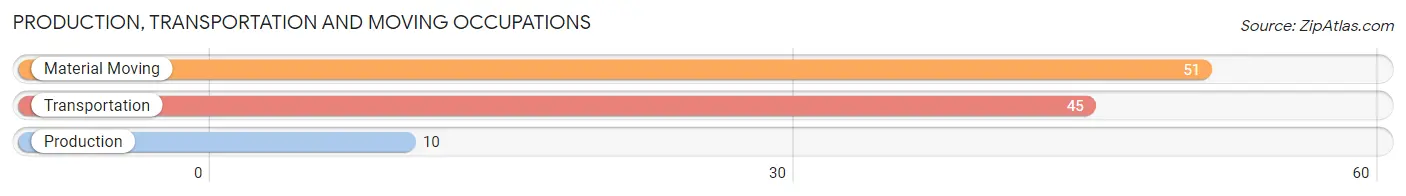
Production, Transportation and Moving Occupations by Sex
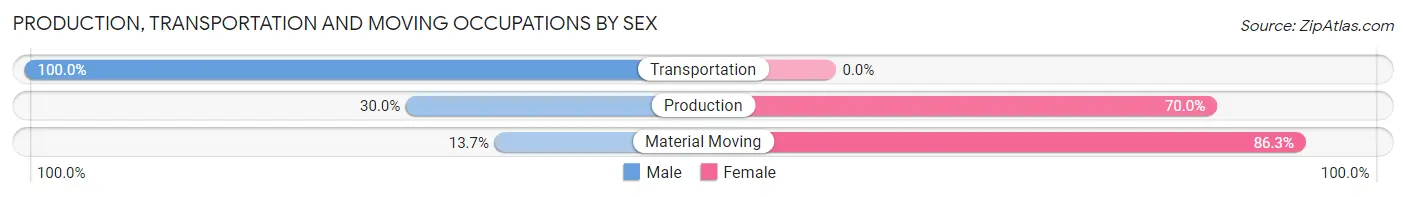
| Occupation | Male | Female |
| Production | 3 (30.0%) | 7 (70.0%) |
| Transportation | 45 (100.0%) | 0 (0.0%) |
| Material Moving | 7 (13.7%) | 44 (86.3%) |
| Total (Category) | 55 (51.9%) | 51 (48.1%) |
| Total (Overall) | 686 (50.8%) | 663 (49.1%) |
Employment Industries by Sex in Wayne
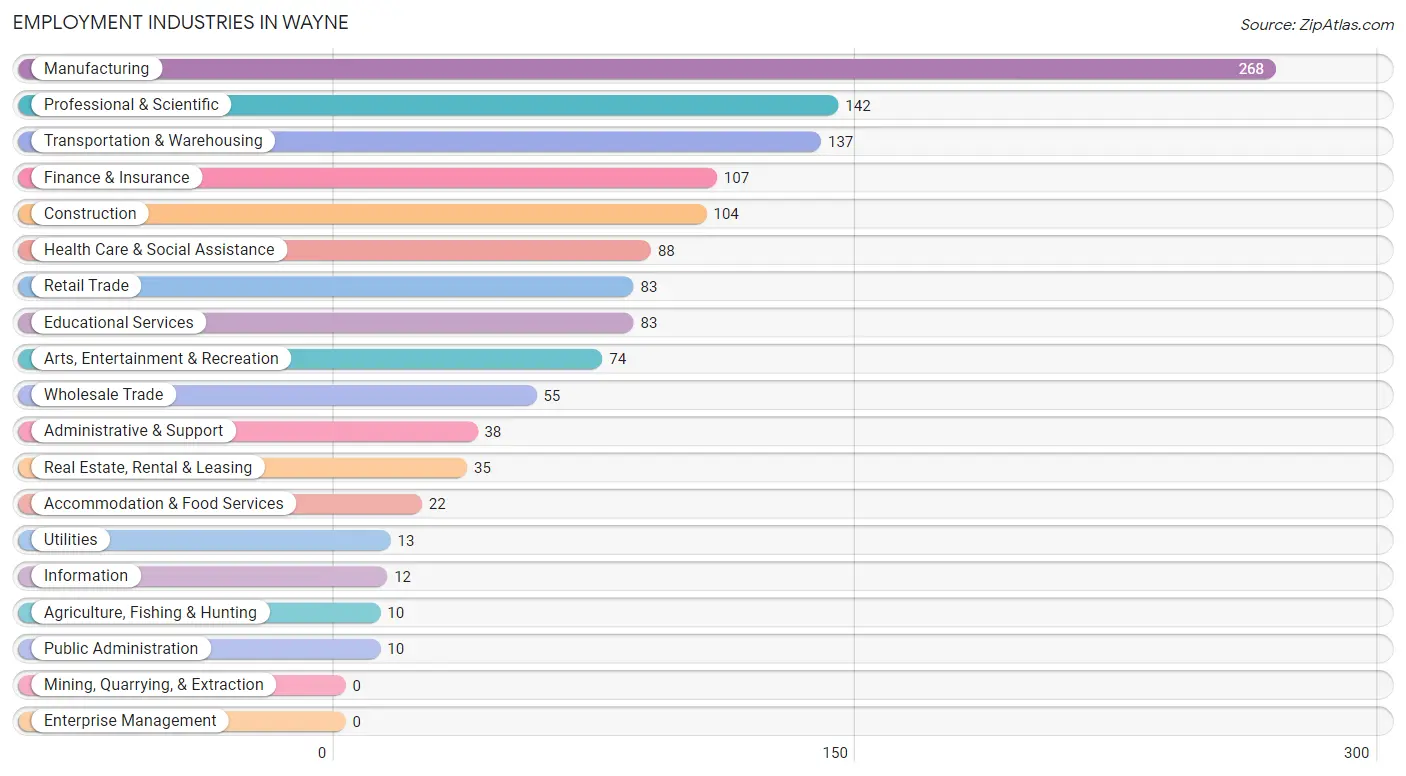
Employment Industries in Wayne
The major employment industries in Wayne include Manufacturing (268 | 19.9%), Professional & Scientific (142 | 10.5%), Transportation & Warehousing (137 | 10.2%), Finance & Insurance (107 | 7.9%), and Construction (104 | 7.7%).
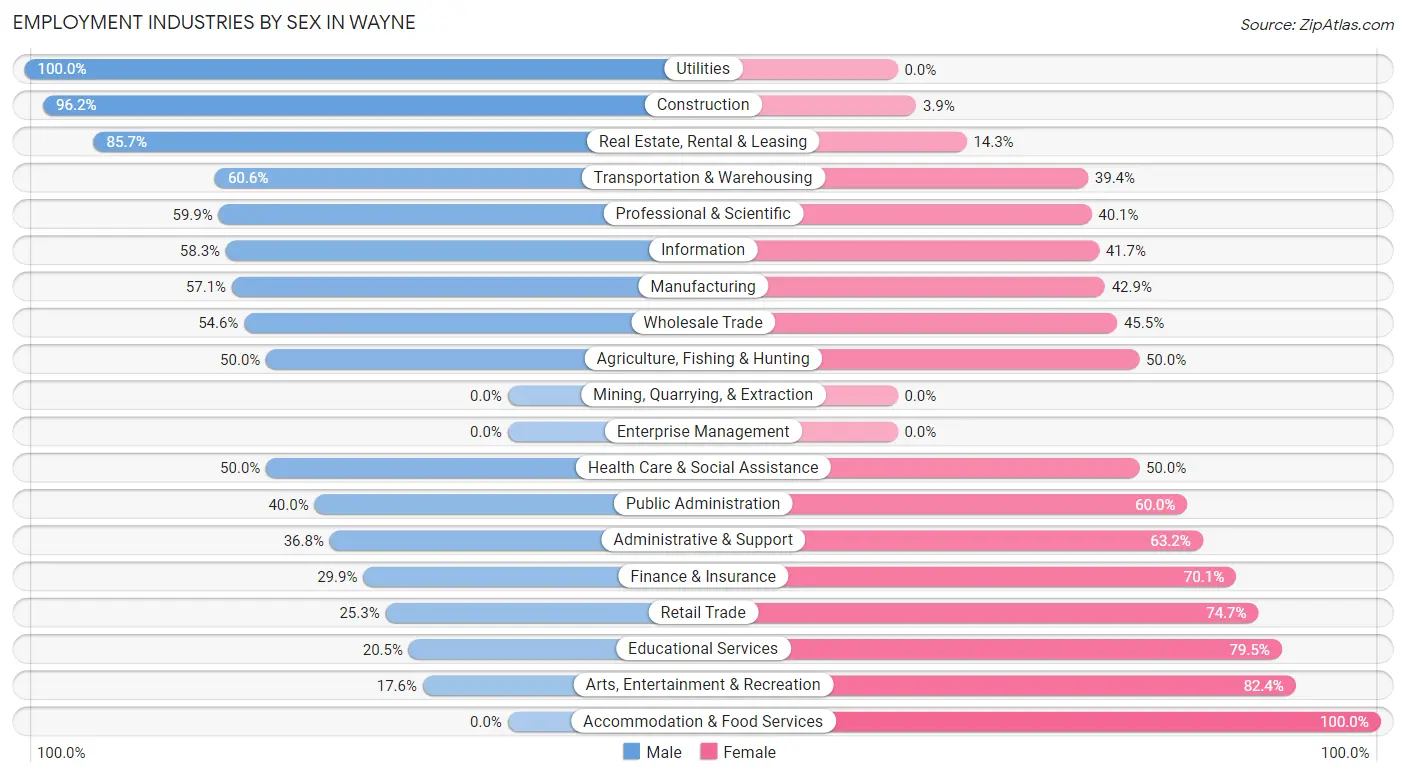
Employment Industries by Sex in Wayne
The Wayne industries that see more men than women are Utilities (100.0%), Construction (96.2%), and Real Estate, Rental & Leasing (85.7%), whereas the industries that tend to have a higher number of women are Accommodation & Food Services (100.0%), Arts, Entertainment & Recreation (82.4%), and Educational Services (79.5%).
| Industry | Male | Female |
| Agriculture, Fishing & Hunting | 5 (50.0%) | 5 (50.0%) |
| Mining, Quarrying, & Extraction | 0 (0.0%) | 0 (0.0%) |
| Construction | 100 (96.2%) | 4 (3.8%) |
| Manufacturing | 153 (57.1%) | 115 (42.9%) |
| Wholesale Trade | 30 (54.5%) | 25 (45.5%) |
| Retail Trade | 21 (25.3%) | 62 (74.7%) |
| Transportation & Warehousing | 83 (60.6%) | 54 (39.4%) |
| Utilities | 13 (100.0%) | 0 (0.0%) |
| Information | 7 (58.3%) | 5 (41.7%) |
| Finance & Insurance | 32 (29.9%) | 75 (70.1%) |
| Real Estate, Rental & Leasing | 30 (85.7%) | 5 (14.3%) |
| Professional & Scientific | 85 (59.9%) | 57 (40.1%) |
| Enterprise Management | 0 (0.0%) | 0 (0.0%) |
| Administrative & Support | 14 (36.8%) | 24 (63.2%) |
| Educational Services | 17 (20.5%) | 66 (79.5%) |
| Health Care & Social Assistance | 44 (50.0%) | 44 (50.0%) |
| Arts, Entertainment & Recreation | 13 (17.6%) | 61 (82.4%) |
| Accommodation & Food Services | 0 (0.0%) | 22 (100.0%) |
| Public Administration | 4 (40.0%) | 6 (60.0%) |
| Total | 686 (50.8%) | 663 (49.1%) |
Education in Wayne
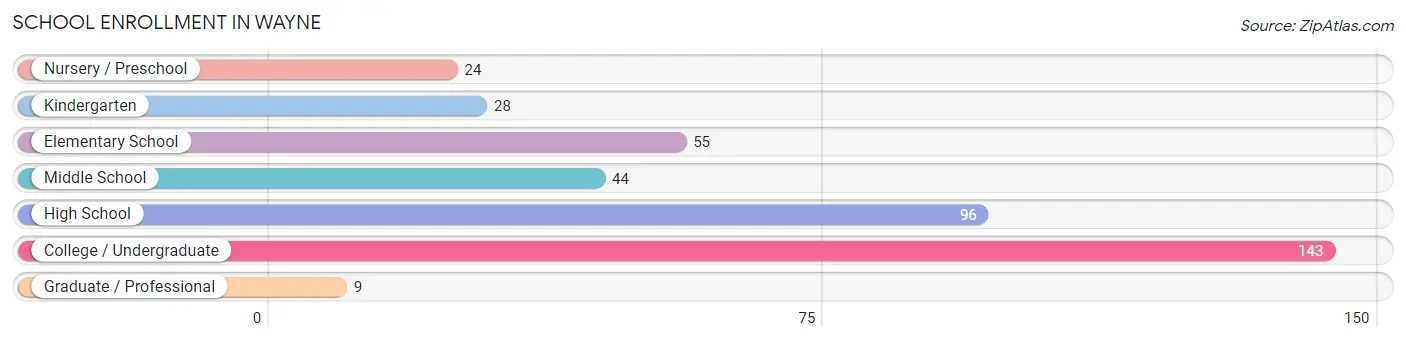
School Enrollment in Wayne
The most common levels of schooling among the 399 students in Wayne are college / undergraduate (143 | 35.8%), high school (96 | 24.1%), and elementary school (55 | 13.8%).
| School Level | # Students | % Students |
| Nursery / Preschool | 24 | 6.0% |
| Kindergarten | 28 | 7.0% |
| Elementary School | 55 | 13.8% |
| Middle School | 44 | 11.0% |
| High School | 96 | 24.1% |
| College / Undergraduate | 143 | 35.8% |
| Graduate / Professional | 9 | 2.3% |
| Total | 399 | 100.0% |
School Enrollment by Age by Funding Source in Wayne
Out of a total of 399 students who are enrolled in schools in Wayne, 119 (29.8%) attend a private institution, while the remaining 280 (70.2%) are enrolled in public schools. The age group of 3 to 4 year olds has the highest likelihood of being enrolled in private schools, with 18 (75.0% in the age bracket) enrolled. Conversely, the age group of 25 to 34 year olds has the lowest likelihood of being enrolled in a private school, with 13 (100.0% in the age bracket) attending a public institution.
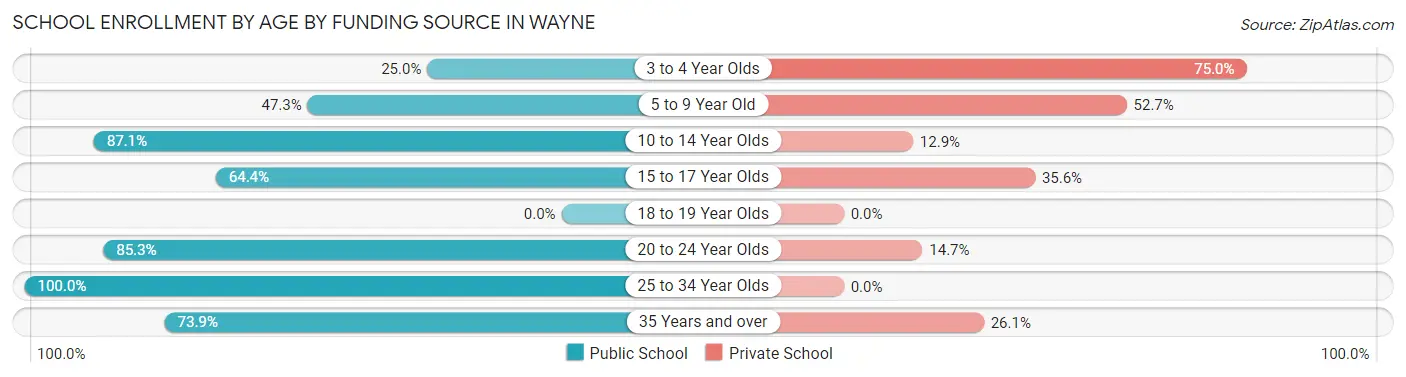
| Age Bracket | Public School | Private School |
| 3 to 4 Year Olds | 6 (25.0%) | 18 (75.0%) |
| 5 to 9 Year Old | 35 (47.3%) | 39 (52.7%) |
| 10 to 14 Year Olds | 54 (87.1%) | 8 (12.9%) |
| 15 to 17 Year Olds | 56 (64.4%) | 31 (35.6%) |
| 18 to 19 Year Olds | 0 (0.0%) | 0 (0.0%) |
| 20 to 24 Year Olds | 99 (85.3%) | 17 (14.7%) |
| 25 to 34 Year Olds | 13 (100.0%) | 0 (0.0%) |
| 35 Years and over | 17 (73.9%) | 6 (26.1%) |
| Total | 280 (70.2%) | 119 (29.8%) |
Educational Attainment by Field of Study in Wayne
Business (304 | 30.5%), engineering (152 | 15.3%), bio, nature & agricultural (108 | 10.8%), social sciences (76 | 7.6%), and arts & humanities (58 | 5.8%) are the most common fields of study among 996 individuals in Wayne who have obtained a bachelor's degree or higher.
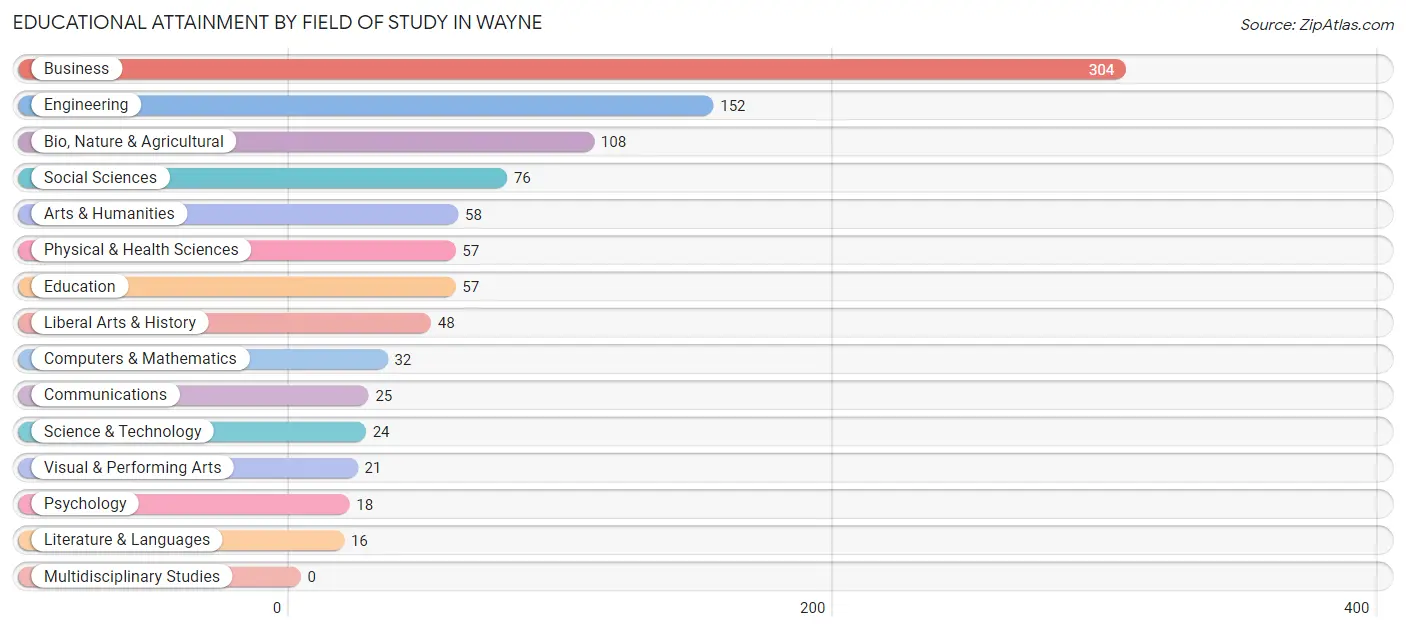
| Field of Study | # Graduates | % Graduates |
| Computers & Mathematics | 32 | 3.2% |
| Bio, Nature & Agricultural | 108 | 10.8% |
| Physical & Health Sciences | 57 | 5.7% |
| Psychology | 18 | 1.8% |
| Social Sciences | 76 | 7.6% |
| Engineering | 152 | 15.3% |
| Multidisciplinary Studies | 0 | 0.0% |
| Science & Technology | 24 | 2.4% |
| Business | 304 | 30.5% |
| Education | 57 | 5.7% |
| Literature & Languages | 16 | 1.6% |
| Liberal Arts & History | 48 | 4.8% |
| Visual & Performing Arts | 21 | 2.1% |
| Communications | 25 | 2.5% |
| Arts & Humanities | 58 | 5.8% |
| Total | 996 | 100.0% |
Transportation & Commute in Wayne
Vehicle Availability by Sex in Wayne
The most prevalent vehicle ownership categories in Wayne are males with 3 vehicles (234, accounting for 34.6%) and females with 3 vehicles (132, making up 36.1%).
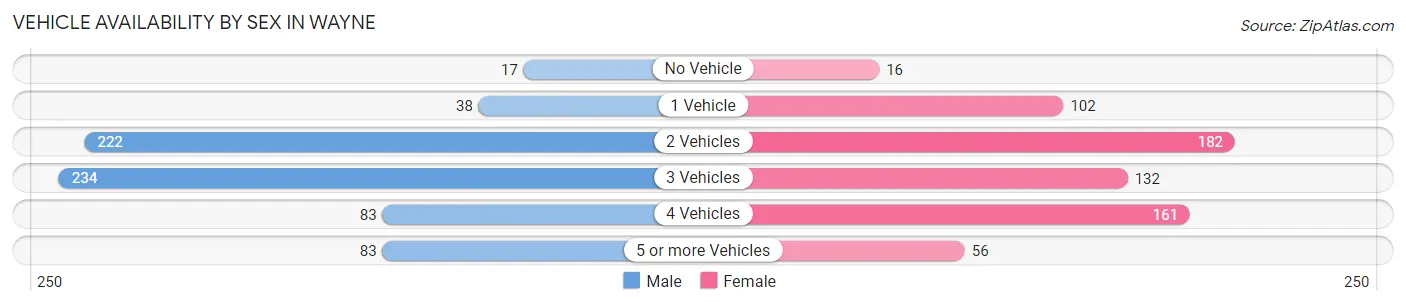
| Vehicles Available | Male | Female |
| No Vehicle | 17 (2.5%) | 16 (2.5%) |
| 1 Vehicle | 38 (5.6%) | 102 (15.7%) |
| 2 Vehicles | 222 (32.8%) | 182 (28.0%) |
| 3 Vehicles | 234 (34.6%) | 132 (20.3%) |
| 4 Vehicles | 83 (12.3%) | 161 (24.8%) |
| 5 or more Vehicles | 83 (12.3%) | 56 (8.6%) |
| Total | 677 (100.0%) | 649 (100.0%) |
Commute Time in Wayne
The most frequently occuring commute durations in Wayne are 30 to 34 minutes (262 commuters, 23.4%), 15 to 19 minutes (175 commuters, 15.6%), and 5 to 9 minutes (129 commuters, 11.5%).
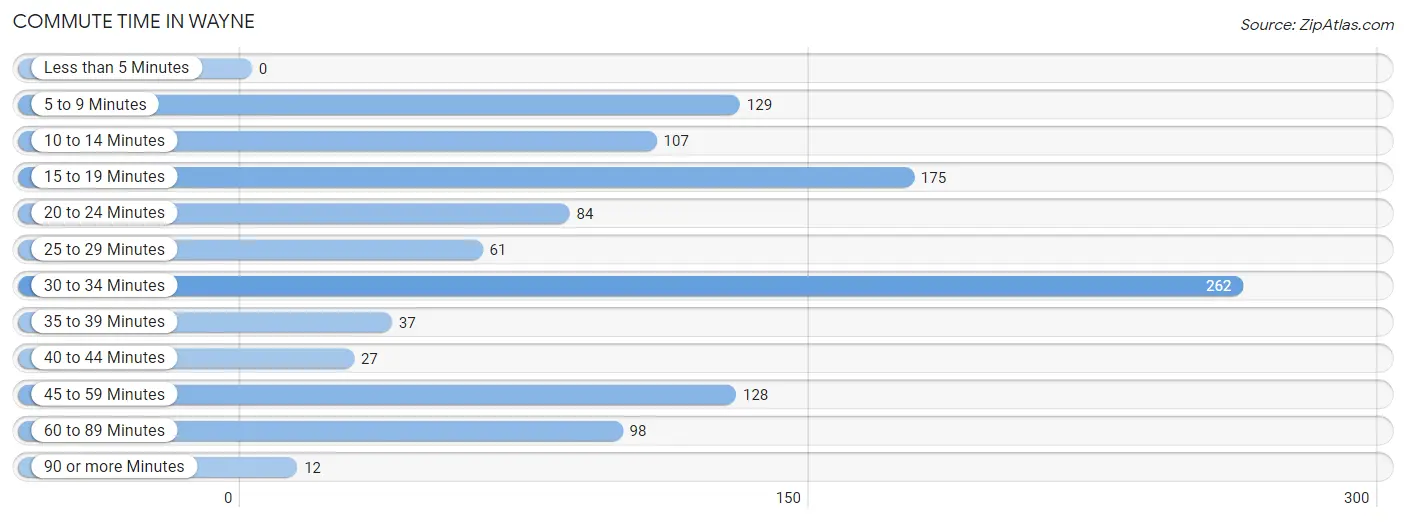
| Commute Time | # Commuters | % Commuters |
| Less than 5 Minutes | 0 | 0.0% |
| 5 to 9 Minutes | 129 | 11.5% |
| 10 to 14 Minutes | 107 | 9.6% |
| 15 to 19 Minutes | 175 | 15.6% |
| 20 to 24 Minutes | 84 | 7.5% |
| 25 to 29 Minutes | 61 | 5.4% |
| 30 to 34 Minutes | 262 | 23.4% |
| 35 to 39 Minutes | 37 | 3.3% |
| 40 to 44 Minutes | 27 | 2.4% |
| 45 to 59 Minutes | 128 | 11.4% |
| 60 to 89 Minutes | 98 | 8.7% |
| 90 or more Minutes | 12 | 1.1% |
Commute Time by Sex in Wayne
The most common commute times in Wayne are 30 to 34 minutes (130 commuters, 21.7%) for males and 30 to 34 minutes (132 commuters, 25.3%) for females.
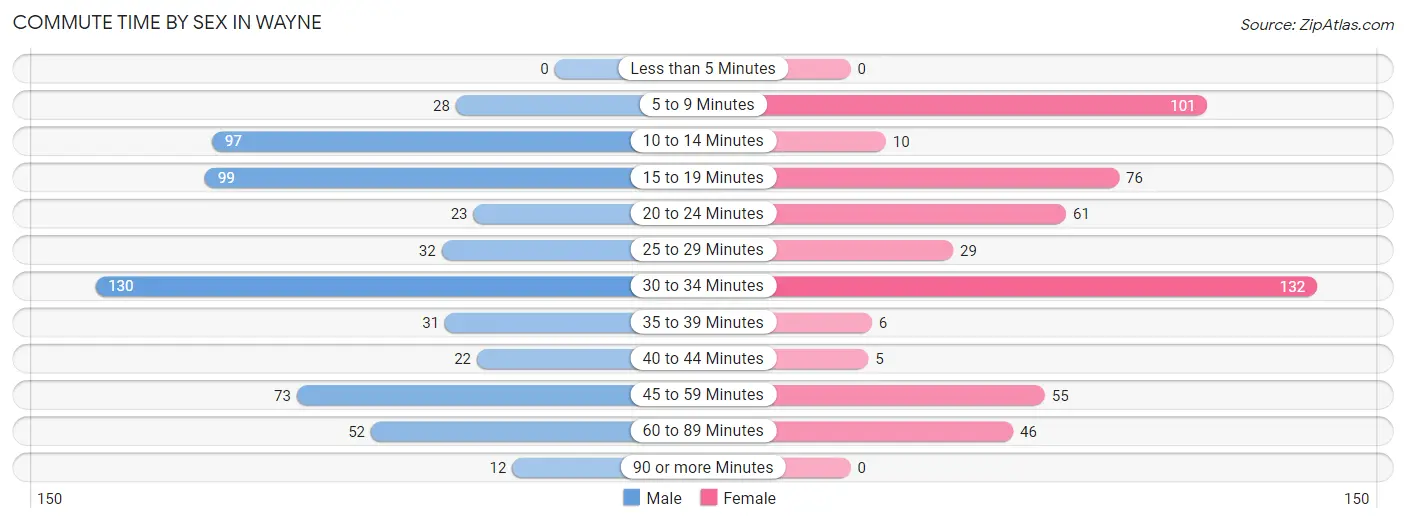
| Commute Time | Male | Female |
| Less than 5 Minutes | 0 (0.0%) | 0 (0.0%) |
| 5 to 9 Minutes | 28 (4.7%) | 101 (19.4%) |
| 10 to 14 Minutes | 97 (16.2%) | 10 (1.9%) |
| 15 to 19 Minutes | 99 (16.5%) | 76 (14.6%) |
| 20 to 24 Minutes | 23 (3.8%) | 61 (11.7%) |
| 25 to 29 Minutes | 32 (5.3%) | 29 (5.6%) |
| 30 to 34 Minutes | 130 (21.7%) | 132 (25.3%) |
| 35 to 39 Minutes | 31 (5.2%) | 6 (1.1%) |
| 40 to 44 Minutes | 22 (3.7%) | 5 (1.0%) |
| 45 to 59 Minutes | 73 (12.2%) | 55 (10.6%) |
| 60 to 89 Minutes | 52 (8.7%) | 46 (8.8%) |
| 90 or more Minutes | 12 (2.0%) | 0 (0.0%) |
Time of Departure to Work by Sex in Wayne
The most frequent times of departure to work in Wayne are 6:30 AM to 6:59 AM (95, 15.9%) for males and 9:00 AM to 9:59 AM (102, 19.6%) for females.
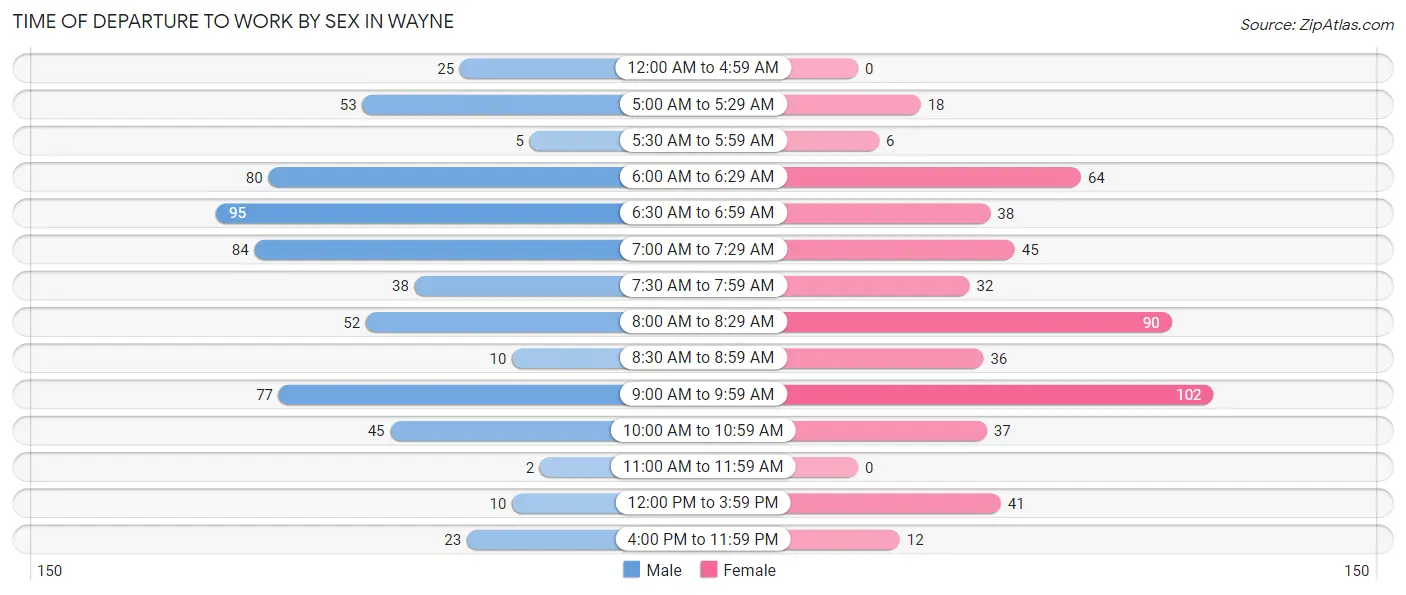
| Time of Departure | Male | Female |
| 12:00 AM to 4:59 AM | 25 (4.2%) | 0 (0.0%) |
| 5:00 AM to 5:29 AM | 53 (8.8%) | 18 (3.5%) |
| 5:30 AM to 5:59 AM | 5 (0.8%) | 6 (1.1%) |
| 6:00 AM to 6:29 AM | 80 (13.4%) | 64 (12.3%) |
| 6:30 AM to 6:59 AM | 95 (15.9%) | 38 (7.3%) |
| 7:00 AM to 7:29 AM | 84 (14.0%) | 45 (8.6%) |
| 7:30 AM to 7:59 AM | 38 (6.3%) | 32 (6.1%) |
| 8:00 AM to 8:29 AM | 52 (8.7%) | 90 (17.3%) |
| 8:30 AM to 8:59 AM | 10 (1.7%) | 36 (6.9%) |
| 9:00 AM to 9:59 AM | 77 (12.9%) | 102 (19.6%) |
| 10:00 AM to 10:59 AM | 45 (7.5%) | 37 (7.1%) |
| 11:00 AM to 11:59 AM | 2 (0.3%) | 0 (0.0%) |
| 12:00 PM to 3:59 PM | 10 (1.7%) | 41 (7.9%) |
| 4:00 PM to 11:59 PM | 23 (3.8%) | 12 (2.3%) |
| Total | 599 (100.0%) | 521 (100.0%) |
Housing Occupancy in Wayne
Occupancy by Ownership in Wayne
Of the total 896 dwellings in Wayne, owner-occupied units account for 842 (94.0%), while renter-occupied units make up 54 (6.0%).
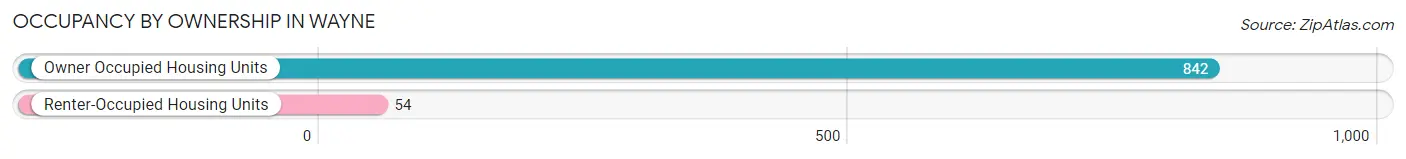
| Occupancy | # Housing Units | % Housing Units |
| Owner Occupied Housing Units | 842 | 94.0% |
| Renter-Occupied Housing Units | 54 | 6.0% |
| Total Occupied Housing Units | 896 | 100.0% |
Occupancy by Household Size in Wayne
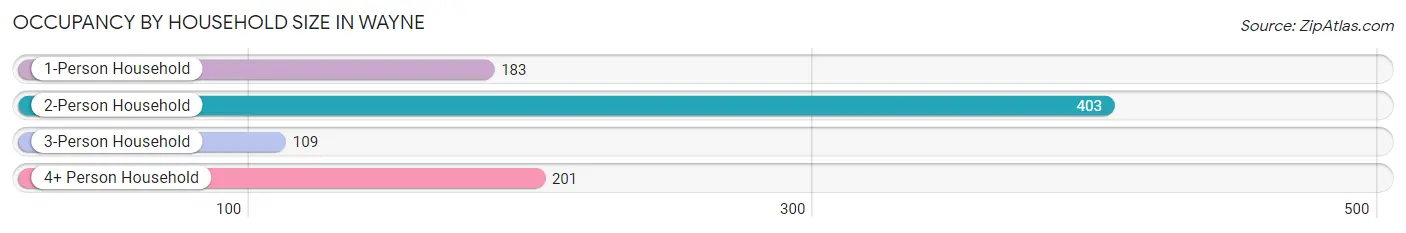
| Household Size | # Housing Units | % Housing Units |
| 1-Person Household | 183 | 20.4% |
| 2-Person Household | 403 | 45.0% |
| 3-Person Household | 109 | 12.2% |
| 4+ Person Household | 201 | 22.4% |
| Total Housing Units | 896 | 100.0% |
Occupancy by Ownership by Household Size in Wayne
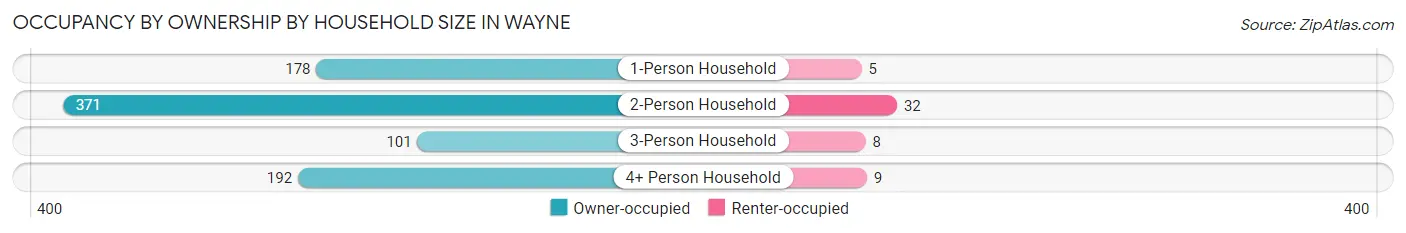
| Household Size | Owner-occupied | Renter-occupied |
| 1-Person Household | 178 (97.3%) | 5 (2.7%) |
| 2-Person Household | 371 (92.1%) | 32 (7.9%) |
| 3-Person Household | 101 (92.7%) | 8 (7.3%) |
| 4+ Person Household | 192 (95.5%) | 9 (4.5%) |
| Total Housing Units | 842 (94.0%) | 54 (6.0%) |
Occupancy by Educational Attainment in Wayne
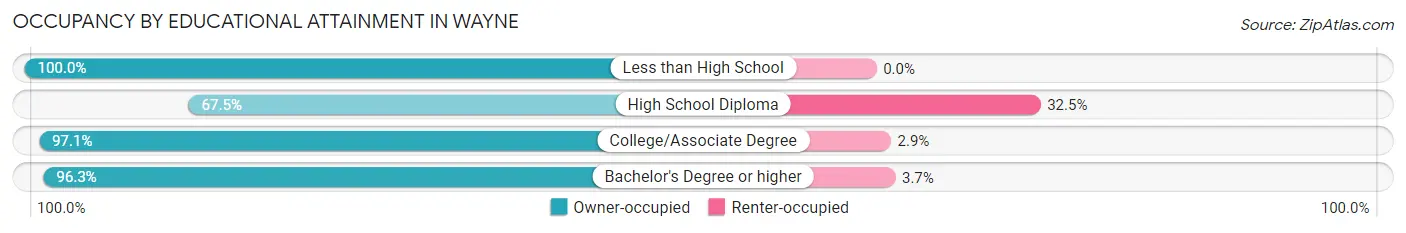
| Household Size | Owner-occupied | Renter-occupied |
| Less than High School | 17 (100.0%) | 0 (0.0%) |
| High School Diploma | 56 (67.5%) | 27 (32.5%) |
| College/Associate Degree | 306 (97.1%) | 9 (2.9%) |
| Bachelor's Degree or higher | 463 (96.3%) | 18 (3.7%) |
Occupancy by Age of Householder in Wayne
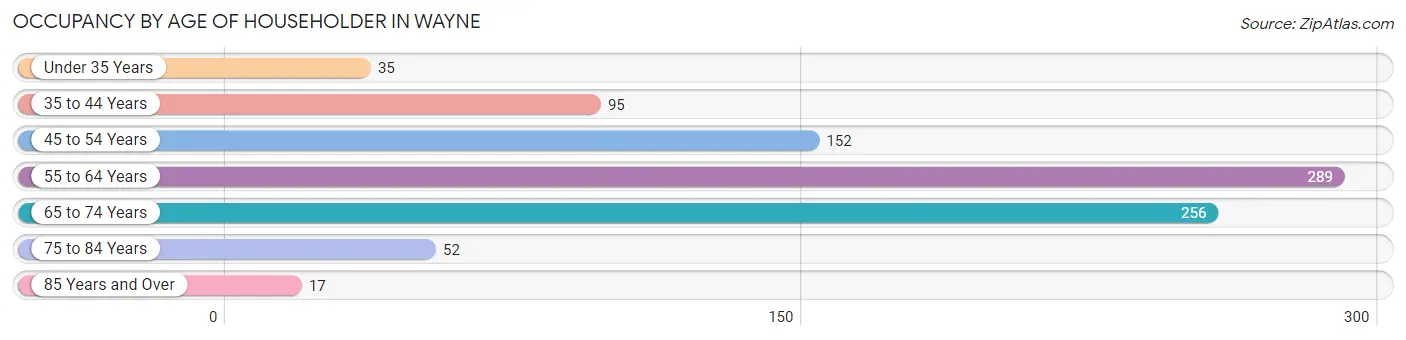
| Age Bracket | # Households | % Households |
| Under 35 Years | 35 | 3.9% |
| 35 to 44 Years | 95 | 10.6% |
| 45 to 54 Years | 152 | 17.0% |
| 55 to 64 Years | 289 | 32.3% |
| 65 to 74 Years | 256 | 28.6% |
| 75 to 84 Years | 52 | 5.8% |
| 85 Years and Over | 17 | 1.9% |
| Total | 896 | 100.0% |
Housing Finances in Wayne
Median Income by Occupancy in Wayne
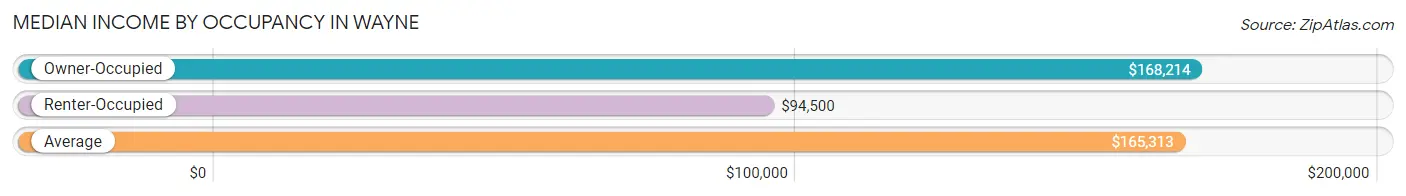
| Occupancy Type | # Households | Median Income |
| Owner-Occupied | 842 (94.0%) | $168,214 |
| Renter-Occupied | 54 (6.0%) | $94,500 |
| Average | 896 (100.0%) | $165,313 |
Occupancy by Householder Income Bracket in Wayne
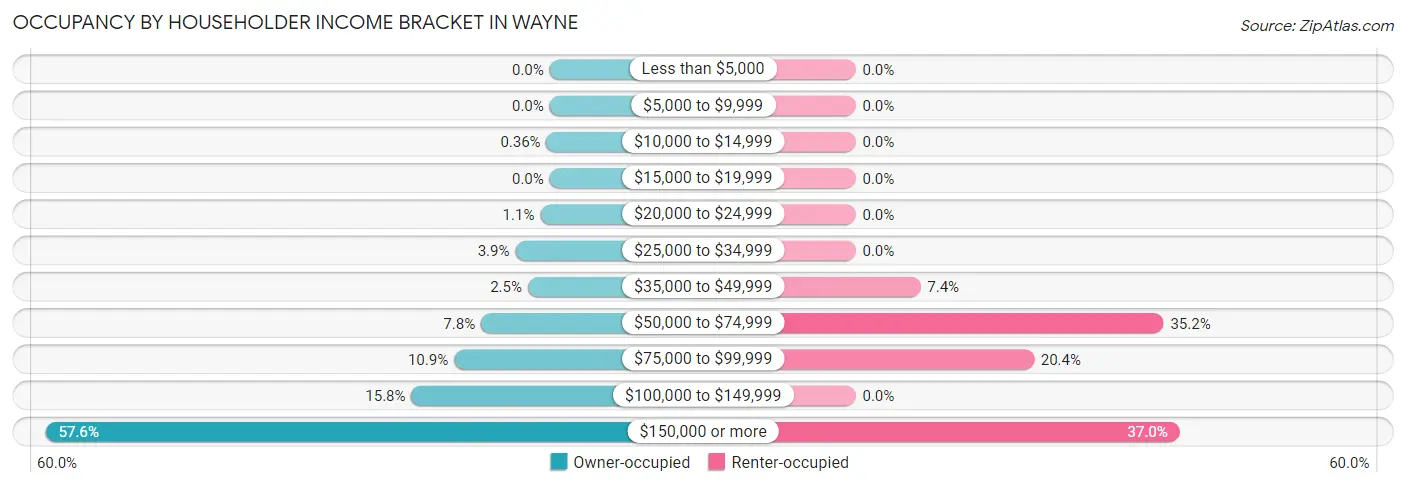
| Income Bracket | Owner-occupied | Renter-occupied |
| Less than $5,000 | 0 (0.0%) | 0 (0.0%) |
| $5,000 to $9,999 | 0 (0.0%) | 0 (0.0%) |
| $10,000 to $14,999 | 3 (0.4%) | 0 (0.0%) |
| $15,000 to $19,999 | 0 (0.0%) | 0 (0.0%) |
| $20,000 to $24,999 | 9 (1.1%) | 0 (0.0%) |
| $25,000 to $34,999 | 33 (3.9%) | 0 (0.0%) |
| $35,000 to $49,999 | 21 (2.5%) | 4 (7.4%) |
| $50,000 to $74,999 | 66 (7.8%) | 19 (35.2%) |
| $75,000 to $99,999 | 92 (10.9%) | 11 (20.4%) |
| $100,000 to $149,999 | 133 (15.8%) | 0 (0.0%) |
| $150,000 or more | 485 (57.6%) | 20 (37.0%) |
| Total | 842 (100.0%) | 54 (100.0%) |
Monthly Housing Cost Tiers in Wayne
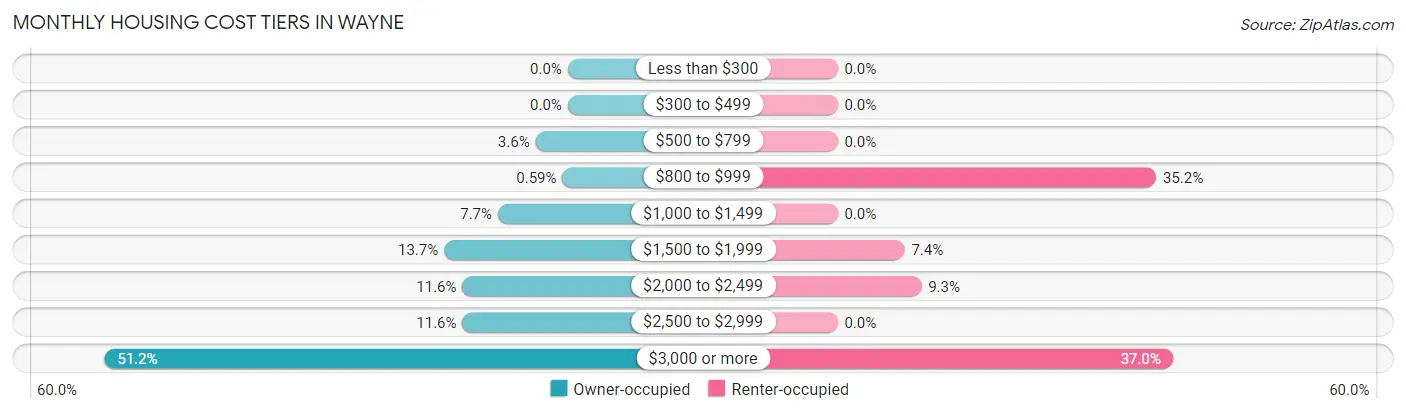
| Monthly Cost | Owner-occupied | Renter-occupied |
| Less than $300 | 0 (0.0%) | 0 (0.0%) |
| $300 to $499 | 0 (0.0%) | 0 (0.0%) |
| $500 to $799 | 30 (3.6%) | 0 (0.0%) |
| $800 to $999 | 5 (0.6%) | 19 (35.2%) |
| $1,000 to $1,499 | 65 (7.7%) | 0 (0.0%) |
| $1,500 to $1,999 | 115 (13.7%) | 4 (7.4%) |
| $2,000 to $2,499 | 98 (11.6%) | 5 (9.3%) |
| $2,500 to $2,999 | 98 (11.6%) | 0 (0.0%) |
| $3,000 or more | 431 (51.2%) | 20 (37.0%) |
| Total | 842 (100.0%) | 54 (100.0%) |
Physical Housing Characteristics in Wayne
Housing Structures in Wayne
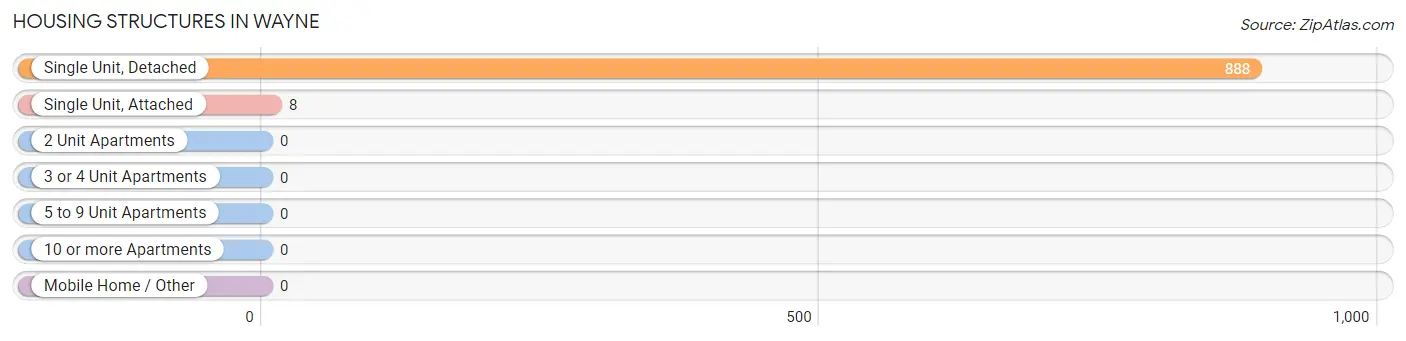
| Structure Type | # Housing Units | % Housing Units |
| Single Unit, Detached | 888 | 99.1% |
| Single Unit, Attached | 8 | 0.9% |
| 2 Unit Apartments | 0 | 0.0% |
| 3 or 4 Unit Apartments | 0 | 0.0% |
| 5 to 9 Unit Apartments | 0 | 0.0% |
| 10 or more Apartments | 0 | 0.0% |
| Mobile Home / Other | 0 | 0.0% |
| Total | 896 | 100.0% |
Housing Structures by Occupancy in Wayne
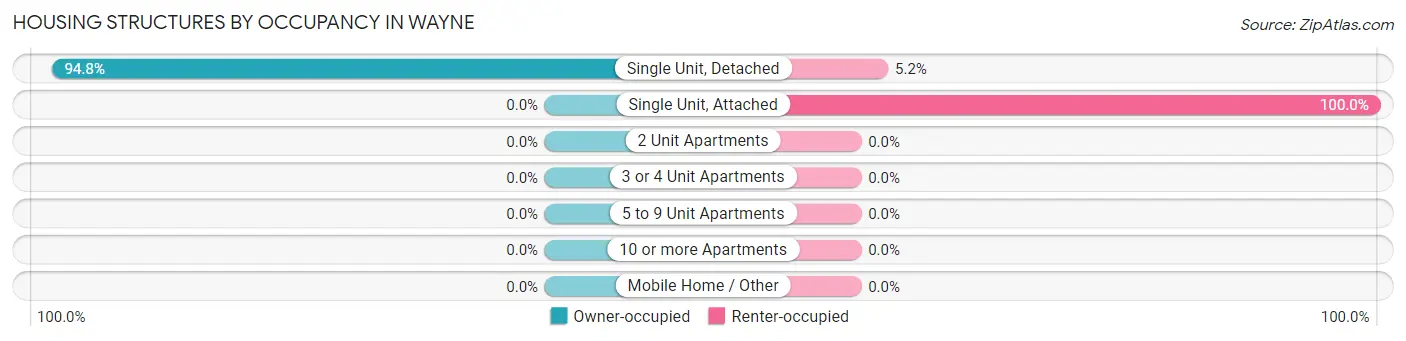
| Structure Type | Owner-occupied | Renter-occupied |
| Single Unit, Detached | 842 (94.8%) | 46 (5.2%) |
| Single Unit, Attached | 0 (0.0%) | 8 (100.0%) |
| 2 Unit Apartments | 0 (0.0%) | 0 (0.0%) |
| 3 or 4 Unit Apartments | 0 (0.0%) | 0 (0.0%) |
| 5 to 9 Unit Apartments | 0 (0.0%) | 0 (0.0%) |
| 10 or more Apartments | 0 (0.0%) | 0 (0.0%) |
| Mobile Home / Other | 0 (0.0%) | 0 (0.0%) |
| Total | 842 (94.0%) | 54 (6.0%) |
Housing Structures by Number of Rooms in Wayne
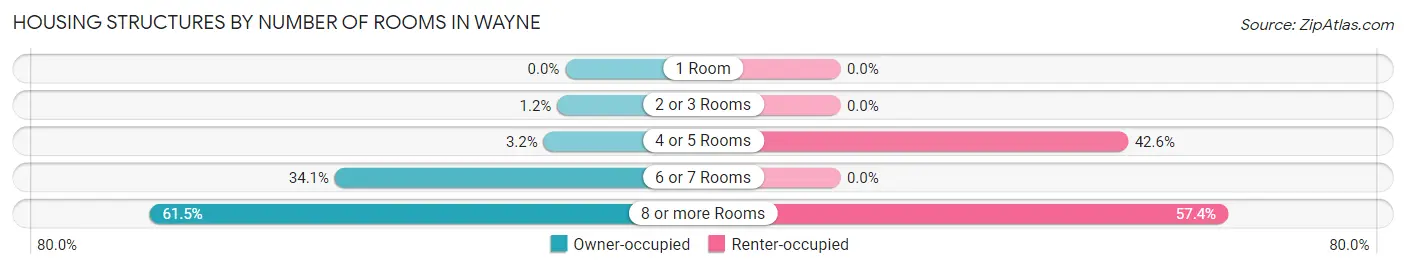
| Number of Rooms | Owner-occupied | Renter-occupied |
| 1 Room | 0 (0.0%) | 0 (0.0%) |
| 2 or 3 Rooms | 10 (1.2%) | 0 (0.0%) |
| 4 or 5 Rooms | 27 (3.2%) | 23 (42.6%) |
| 6 or 7 Rooms | 287 (34.1%) | 0 (0.0%) |
| 8 or more Rooms | 518 (61.5%) | 31 (57.4%) |
| Total | 842 (100.0%) | 54 (100.0%) |
Housing Structure by Heating Type in Wayne
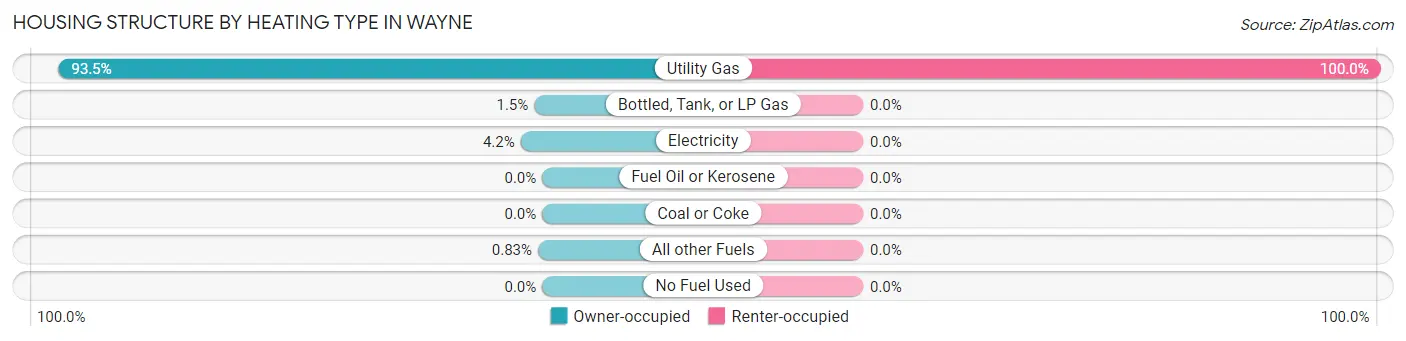
| Heating Type | Owner-occupied | Renter-occupied |
| Utility Gas | 787 (93.5%) | 54 (100.0%) |
| Bottled, Tank, or LP Gas | 13 (1.5%) | 0 (0.0%) |
| Electricity | 35 (4.2%) | 0 (0.0%) |
| Fuel Oil or Kerosene | 0 (0.0%) | 0 (0.0%) |
| Coal or Coke | 0 (0.0%) | 0 (0.0%) |
| All other Fuels | 7 (0.8%) | 0 (0.0%) |
| No Fuel Used | 0 (0.0%) | 0 (0.0%) |
| Total | 842 (100.0%) | 54 (100.0%) |
Household Vehicle Usage in Wayne
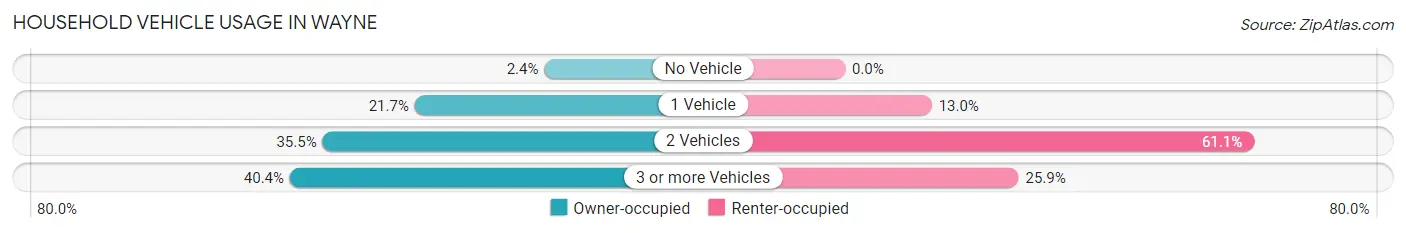
| Vehicles per Household | Owner-occupied | Renter-occupied |
| No Vehicle | 20 (2.4%) | 0 (0.0%) |
| 1 Vehicle | 183 (21.7%) | 7 (13.0%) |
| 2 Vehicles | 299 (35.5%) | 33 (61.1%) |
| 3 or more Vehicles | 340 (40.4%) | 14 (25.9%) |
| Total | 842 (100.0%) | 54 (100.0%) |
Real Estate & Mortgages in Wayne
Real Estate and Mortgage Overview in Wayne
| Characteristic | Without Mortgage | With Mortgage |
| Housing Units | 245 | 597 |
| Median Property Value | $706,500 | $646,000 |
| Median Household Income | $166,484 | $342 |
| Monthly Housing Costs | $1,501 | $404 |
| Real Estate Taxes | $10,001 | $17 |
Property Value by Mortgage Status in Wayne
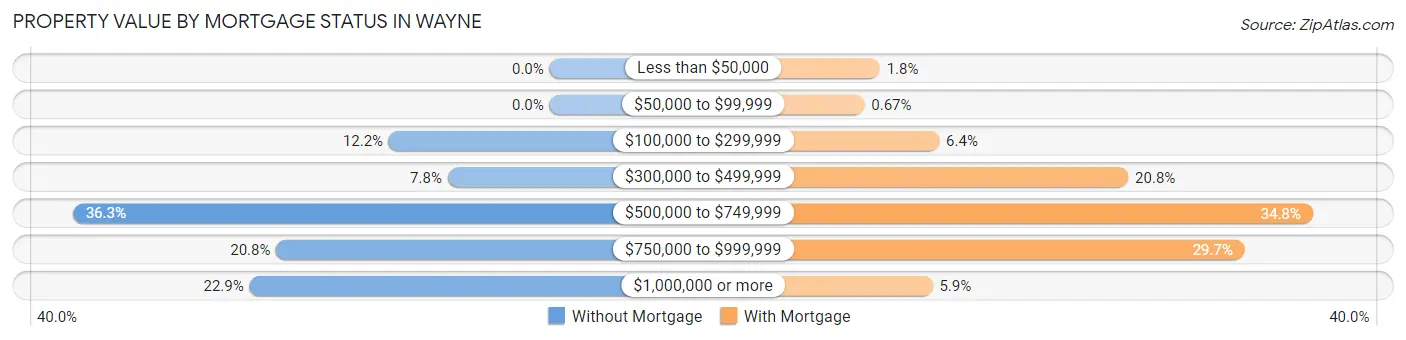
| Property Value | Without Mortgage | With Mortgage |
| Less than $50,000 | 0 (0.0%) | 11 (1.8%) |
| $50,000 to $99,999 | 0 (0.0%) | 4 (0.7%) |
| $100,000 to $299,999 | 30 (12.2%) | 38 (6.4%) |
| $300,000 to $499,999 | 19 (7.8%) | 124 (20.8%) |
| $500,000 to $749,999 | 89 (36.3%) | 208 (34.8%) |
| $750,000 to $999,999 | 51 (20.8%) | 177 (29.6%) |
| $1,000,000 or more | 56 (22.9%) | 35 (5.9%) |
| Total | 245 (100.0%) | 597 (100.0%) |
Household Income by Mortgage Status in Wayne
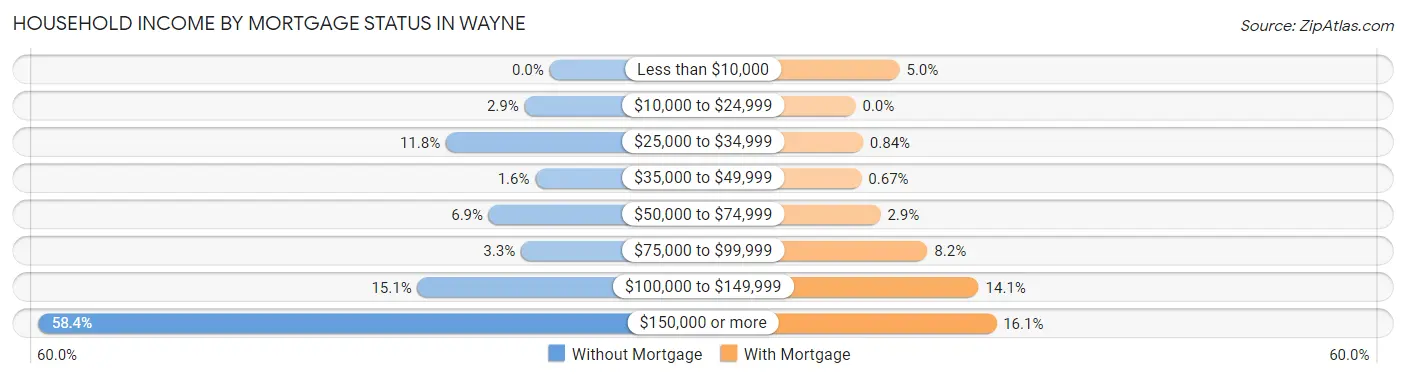
| Household Income | Without Mortgage | With Mortgage |
| Less than $10,000 | 0 (0.0%) | 30 (5.0%) |
| $10,000 to $24,999 | 7 (2.9%) | 0 (0.0%) |
| $25,000 to $34,999 | 29 (11.8%) | 5 (0.8%) |
| $35,000 to $49,999 | 4 (1.6%) | 4 (0.7%) |
| $50,000 to $74,999 | 17 (6.9%) | 17 (2.9%) |
| $75,000 to $99,999 | 8 (3.3%) | 49 (8.2%) |
| $100,000 to $149,999 | 37 (15.1%) | 84 (14.1%) |
| $150,000 or more | 143 (58.4%) | 96 (16.1%) |
| Total | 245 (100.0%) | 597 (100.0%) |
Property Value to Household Income Ratio in Wayne
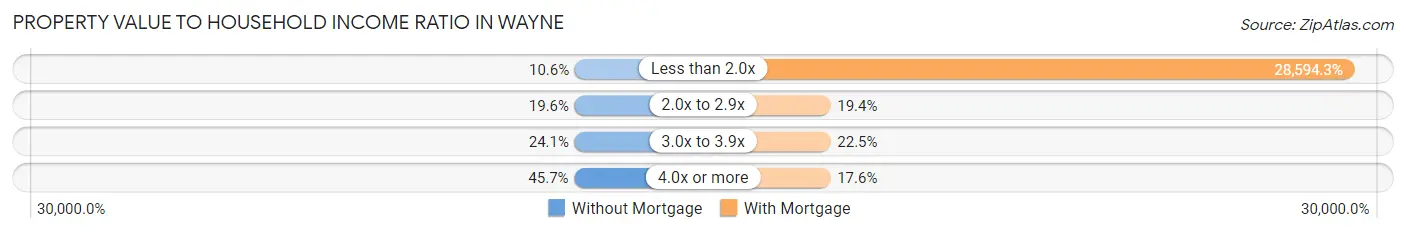
| Value-to-Income Ratio | Without Mortgage | With Mortgage |
| Less than 2.0x | 26 (10.6%) | 170,708 (28,594.3%) |
| 2.0x to 2.9x | 48 (19.6%) | 116 (19.4%) |
| 3.0x to 3.9x | 59 (24.1%) | 134 (22.5%) |
| 4.0x or more | 112 (45.7%) | 105 (17.6%) |
| Total | 245 (100.0%) | 597 (100.0%) |
Real Estate Taxes by Mortgage Status in Wayne
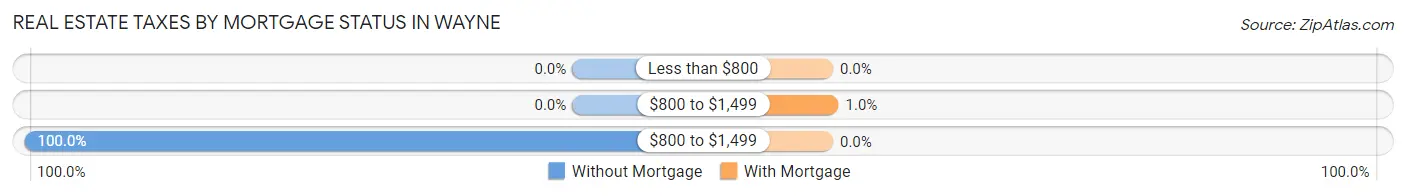
| Property Taxes | Without Mortgage | With Mortgage |
| Less than $800 | 0 (0.0%) | 0 (0.0%) |
| $800 to $1,499 | 0 (0.0%) | 6 (1.0%) |
| $800 to $1,499 | 245 (100.0%) | 0 (0.0%) |
| Total | 245 (100.0%) | 597 (100.0%) |
Health & Disability in Wayne
Health Insurance Coverage by Age in Wayne
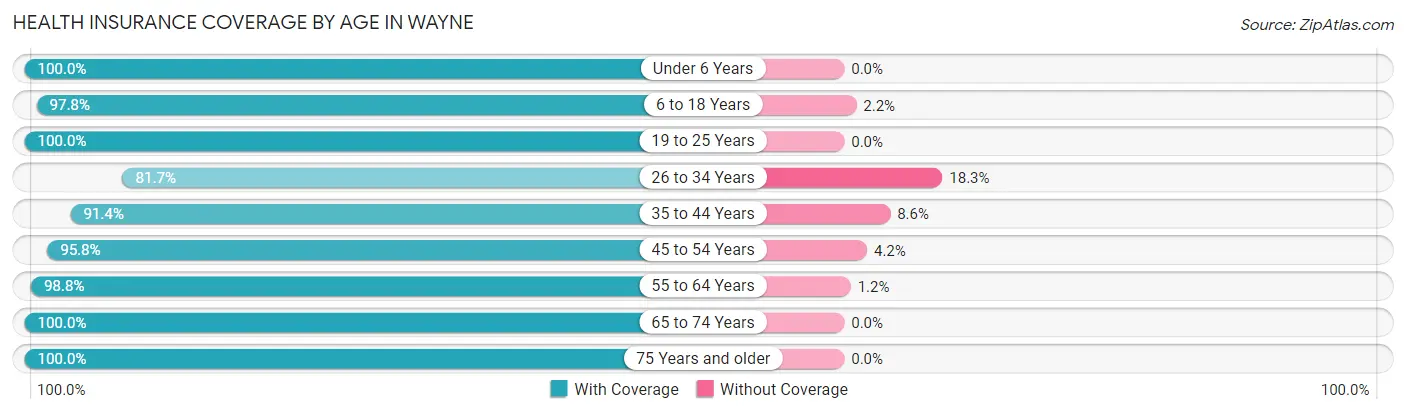
| Age Bracket | With Coverage | Without Coverage |
| Under 6 Years | 111 (100.0%) | 0 (0.0%) |
| 6 to 18 Years | 218 (97.8%) | 5 (2.2%) |
| 19 to 25 Years | 151 (100.0%) | 0 (0.0%) |
| 26 to 34 Years | 143 (81.7%) | 32 (18.3%) |
| 35 to 44 Years | 171 (91.4%) | 16 (8.6%) |
| 45 to 54 Years | 316 (95.8%) | 14 (4.2%) |
| 55 to 64 Years | 493 (98.8%) | 6 (1.2%) |
| 65 to 74 Years | 438 (100.0%) | 0 (0.0%) |
| 75 Years and older | 111 (100.0%) | 0 (0.0%) |
| Total | 2,152 (96.7%) | 73 (3.3%) |
Health Insurance Coverage by Citizenship Status in Wayne
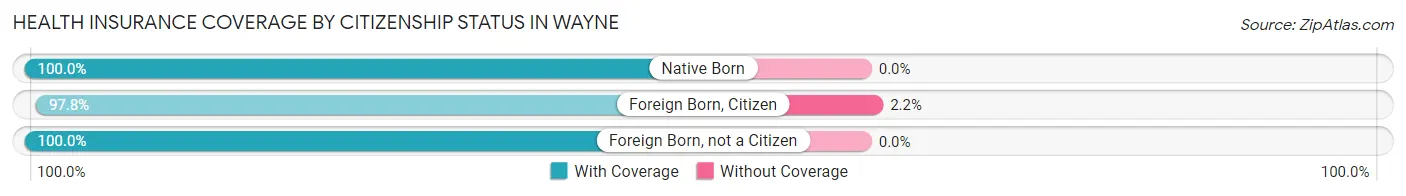
| Citizenship Status | With Coverage | Without Coverage |
| Native Born | 111 (100.0%) | 0 (0.0%) |
| Foreign Born, Citizen | 218 (97.8%) | 5 (2.2%) |
| Foreign Born, not a Citizen | 151 (100.0%) | 0 (0.0%) |
Health Insurance Coverage by Household Income in Wayne
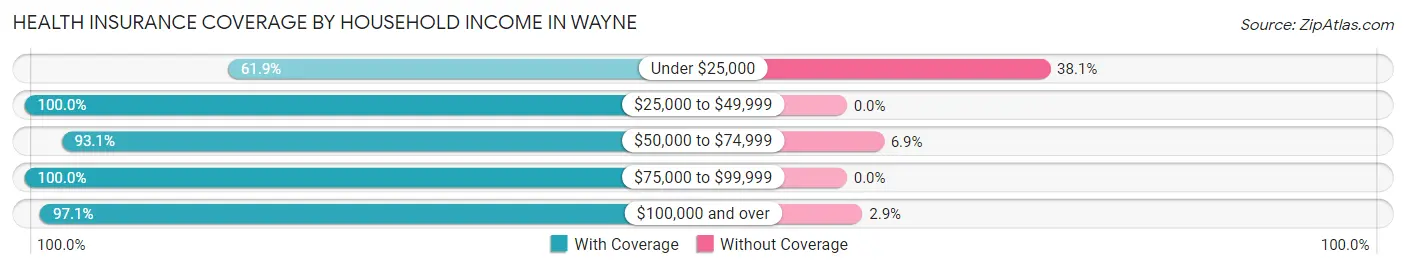
| Household Income | With Coverage | Without Coverage |
| Under $25,000 | 13 (61.9%) | 8 (38.1%) |
| $25,000 to $49,999 | 71 (100.0%) | 0 (0.0%) |
| $50,000 to $74,999 | 148 (93.1%) | 11 (6.9%) |
| $75,000 to $99,999 | 126 (100.0%) | 0 (0.0%) |
| $100,000 and over | 1,794 (97.1%) | 54 (2.9%) |
Public vs Private Health Insurance Coverage by Age in Wayne
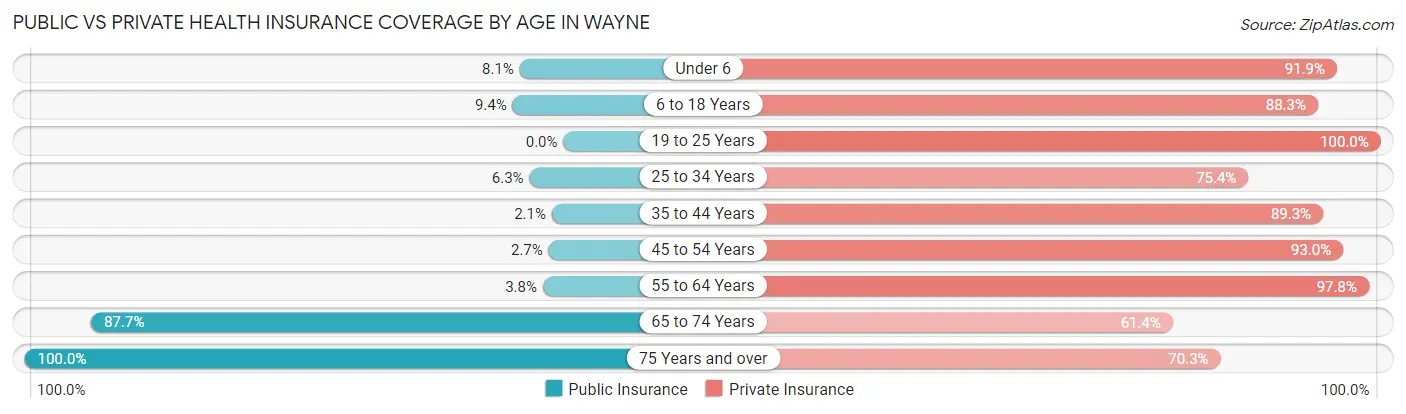
| Age Bracket | Public Insurance | Private Insurance |
| Under 6 | 9 (8.1%) | 102 (91.9%) |
| 6 to 18 Years | 21 (9.4%) | 197 (88.3%) |
| 19 to 25 Years | 0 (0.0%) | 151 (100.0%) |
| 25 to 34 Years | 11 (6.3%) | 132 (75.4%) |
| 35 to 44 Years | 4 (2.1%) | 167 (89.3%) |
| 45 to 54 Years | 9 (2.7%) | 307 (93.0%) |
| 55 to 64 Years | 19 (3.8%) | 488 (97.8%) |
| 65 to 74 Years | 384 (87.7%) | 269 (61.4%) |
| 75 Years and over | 111 (100.0%) | 78 (70.3%) |
| Total | 568 (25.5%) | 1,891 (85.0%) |
Disability Status by Sex by Age in Wayne
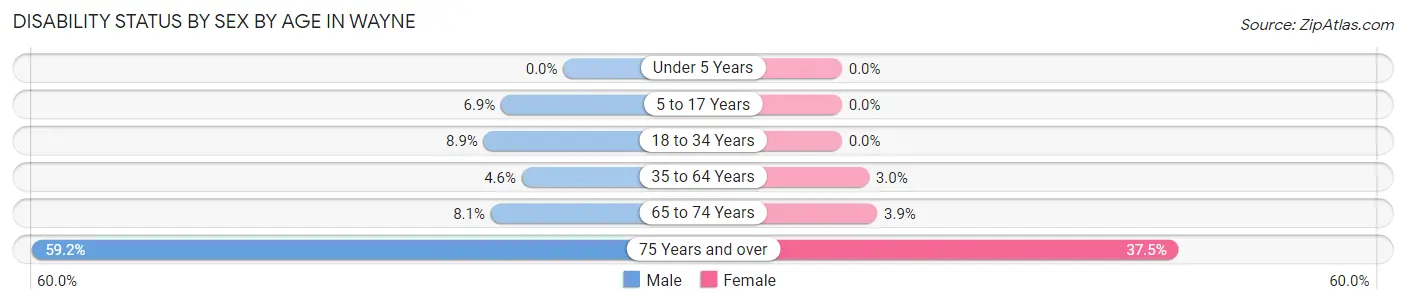
| Age Bracket | Male | Female |
| Under 5 Years | 0 (0.0%) | 0 (0.0%) |
| 5 to 17 Years | 7 (6.9%) | 0 (0.0%) |
| 18 to 34 Years | 11 (8.9%) | 0 (0.0%) |
| 35 to 64 Years | 21 (4.6%) | 17 (3.0%) |
| 65 to 74 Years | 21 (8.1%) | 7 (3.9%) |
| 75 Years and over | 42 (59.2%) | 15 (37.5%) |
Disability Class by Sex by Age in Wayne
Disability Class: Hearing Difficulty
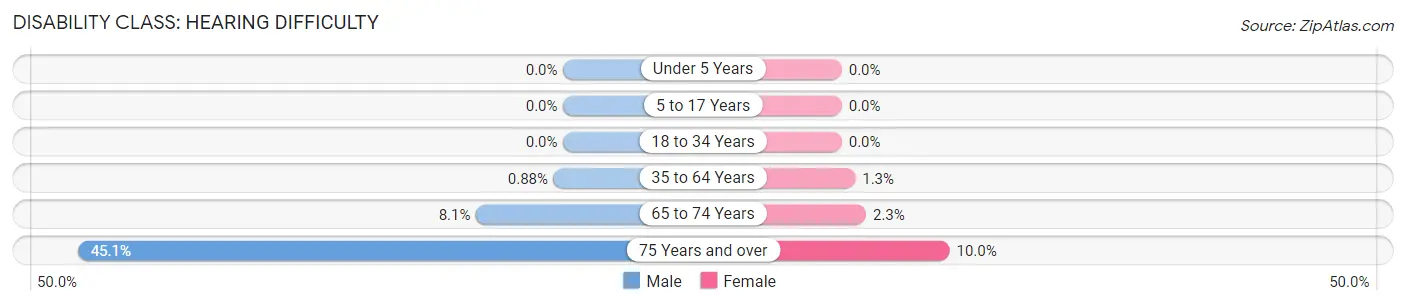
| Age Bracket | Male | Female |
| Under 5 Years | 0 (0.0%) | 0 (0.0%) |
| 5 to 17 Years | 0 (0.0%) | 0 (0.0%) |
| 18 to 34 Years | 0 (0.0%) | 0 (0.0%) |
| 35 to 64 Years | 4 (0.9%) | 7 (1.3%) |
| 65 to 74 Years | 21 (8.1%) | 4 (2.2%) |
| 75 Years and over | 32 (45.1%) | 4 (10.0%) |
Disability Class: Vision Difficulty
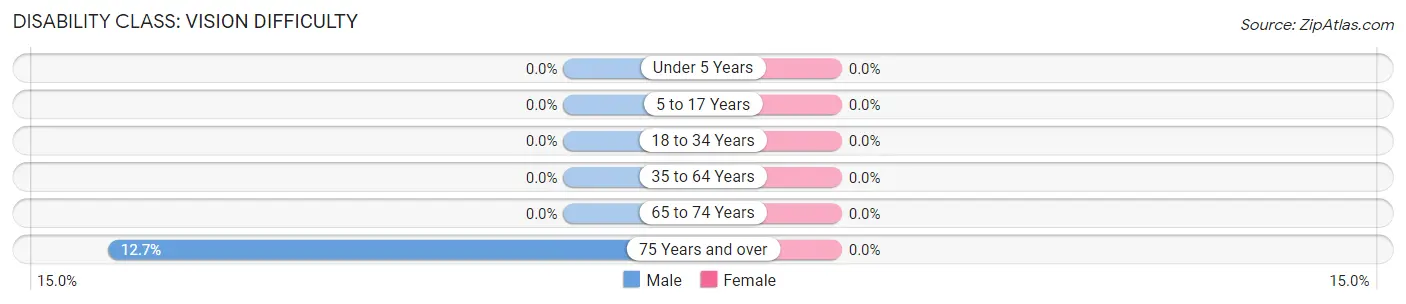
| Age Bracket | Male | Female |
| Under 5 Years | 0 (0.0%) | 0 (0.0%) |
| 5 to 17 Years | 0 (0.0%) | 0 (0.0%) |
| 18 to 34 Years | 0 (0.0%) | 0 (0.0%) |
| 35 to 64 Years | 0 (0.0%) | 0 (0.0%) |
| 65 to 74 Years | 0 (0.0%) | 0 (0.0%) |
| 75 Years and over | 9 (12.7%) | 0 (0.0%) |
Disability Class: Cognitive Difficulty
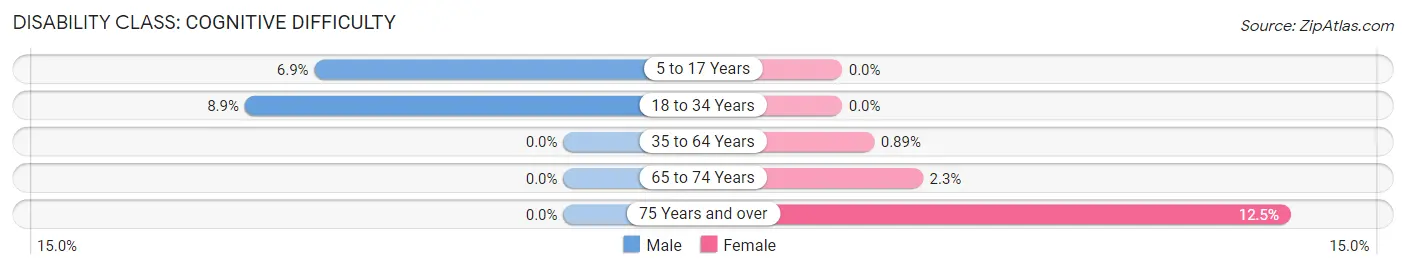
| Age Bracket | Male | Female |
| 5 to 17 Years | 7 (6.9%) | 0 (0.0%) |
| 18 to 34 Years | 11 (8.9%) | 0 (0.0%) |
| 35 to 64 Years | 0 (0.0%) | 5 (0.9%) |
| 65 to 74 Years | 0 (0.0%) | 4 (2.2%) |
| 75 Years and over | 0 (0.0%) | 5 (12.5%) |
Disability Class: Ambulatory Difficulty
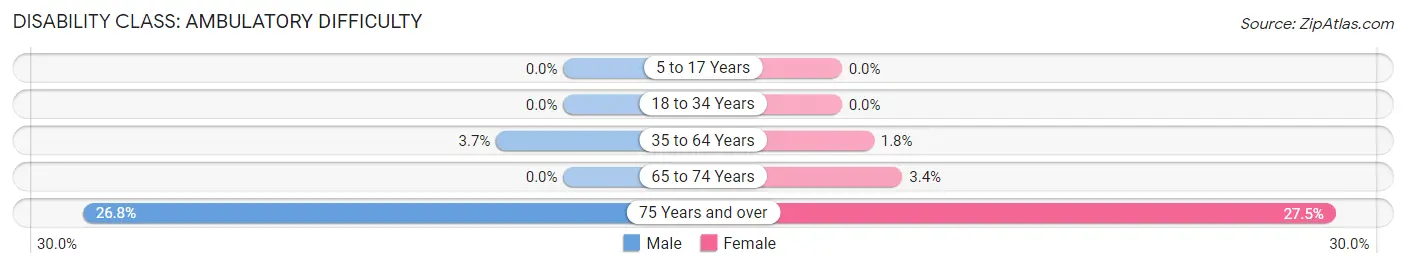
| Age Bracket | Male | Female |
| 5 to 17 Years | 0 (0.0%) | 0 (0.0%) |
| 18 to 34 Years | 0 (0.0%) | 0 (0.0%) |
| 35 to 64 Years | 17 (3.7%) | 10 (1.8%) |
| 65 to 74 Years | 0 (0.0%) | 6 (3.4%) |
| 75 Years and over | 19 (26.8%) | 11 (27.5%) |
Disability Class: Self-Care Difficulty
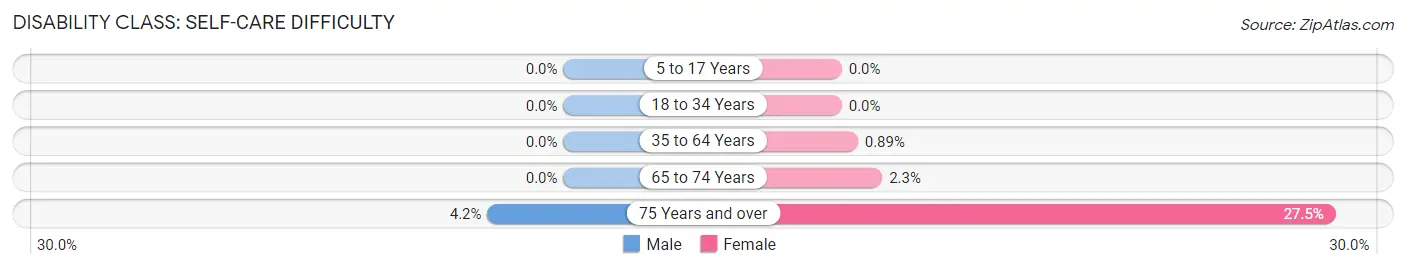
| Age Bracket | Male | Female |
| 5 to 17 Years | 0 (0.0%) | 0 (0.0%) |
| 18 to 34 Years | 0 (0.0%) | 0 (0.0%) |
| 35 to 64 Years | 0 (0.0%) | 5 (0.9%) |
| 65 to 74 Years | 0 (0.0%) | 4 (2.2%) |
| 75 Years and over | 3 (4.2%) | 11 (27.5%) |
Technology Access in Wayne
Computing Device Access in Wayne
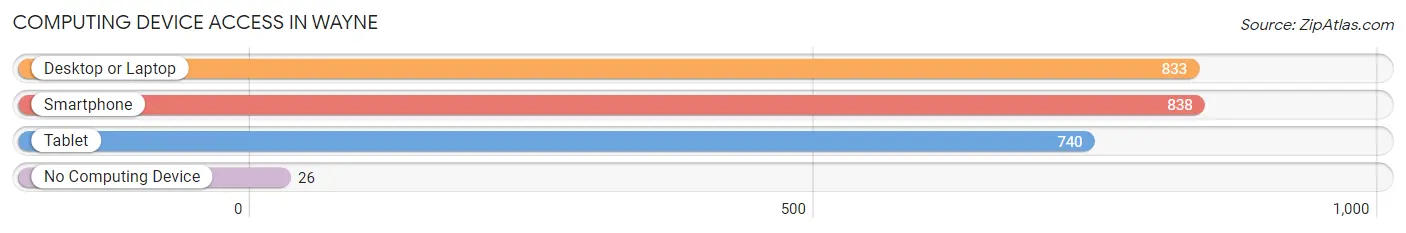
| Device Type | # Households | % Households |
| Desktop or Laptop | 833 | 93.0% |
| Smartphone | 838 | 93.5% |
| Tablet | 740 | 82.6% |
| No Computing Device | 26 | 2.9% |
| Total | 896 | 100.0% |
Internet Access in Wayne
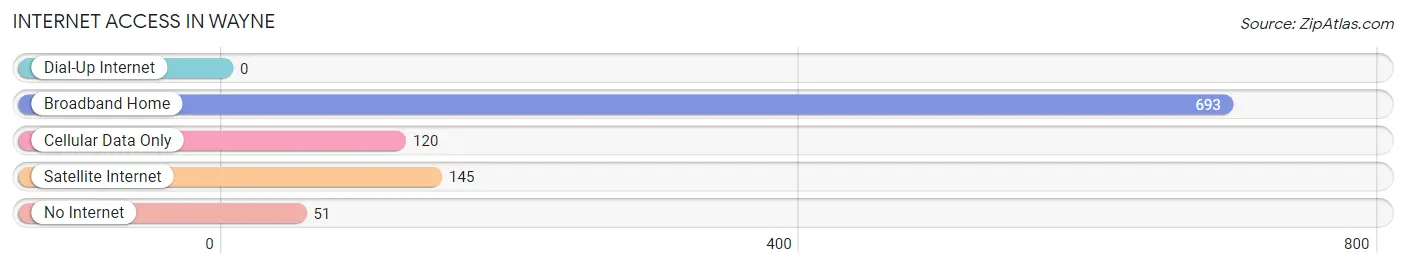
| Internet Type | # Households | % Households |
| Dial-Up Internet | 0 | 0.0% |
| Broadband Home | 693 | 77.3% |
| Cellular Data Only | 120 | 13.4% |
| Satellite Internet | 145 | 16.2% |
| No Internet | 51 | 5.7% |
| Total | 896 | 100.0% |
Wayne Summary
Wayne, Illinois is a small village located in DuPage County, approximately 25 miles west of Chicago. It is a part of the Chicago metropolitan area and is home to a population of 2,431 people as of the 2010 census. The village was founded in 1835 and was named after General Anthony Wayne, a Revolutionary War hero.
Geography
Wayne is located at 41°51'17"N 88°7'45"W (41.854722, -88.129028). It is situated in the western part of DuPage County, approximately 25 miles west of Chicago. The village is bordered by Bartlett to the north, St. Charles to the east, Geneva to the south, and Elgin to the west. The total area of Wayne is 2.2 square miles, all of which is land.
The village is located in the Fox River Valley, which is part of the larger Illinois River Valley. The Fox River runs through the village and is a popular recreational spot for fishing, boating, and swimming. The village is also home to several parks, including Wayne Park, which features a playground, picnic area, and walking trails.
Climate
Wayne has a humid continental climate, with hot, humid summers and cold, snowy winters. The average high temperature in July is 84°F (29°C), and the average low temperature in January is 16°F (-9°C). The average annual precipitation is 37.3 inches (94.7 cm).
Demographics
As of the 2010 census, Wayne had a population of 2,431 people. The racial makeup of the village was 94.2% White, 1.2% African American, 0.2% Native American, 1.7% Asian, 0.1% Pacific Islander, 1.2% from other races, and 1.5% from two or more races. Hispanic or Latino of any race were 4.2% of the population.
The median household income in Wayne was $90,917 in 2018, and the median family income was $103,917. The per capita income was $41,917. About 2.2% of families and 3.2% of the population were below the poverty line.
Economy
Wayne is a small village with a limited economy. The village is home to several small businesses, including restaurants, retail stores, and professional services. The village is also home to several industrial and manufacturing companies, including a plastics manufacturer and a metal fabrication company.
The village is served by the Metra commuter rail line, which provides access to downtown Chicago. The village is also served by several major highways, including Interstate 88, which runs through the village.
Conclusion
Wayne, Illinois is a small village located in DuPage County, approximately 25 miles west of Chicago. It is a part of the Chicago metropolitan area and is home to a population of 2,431 people as of the 2010 census. The village has a humid continental climate, with hot, humid summers and cold, snowy winters. The racial makeup of the village is 94.2% White, 1.2% African American, 0.2% Native American, 1.7% Asian, 0.1% Pacific Islander, 1.2% from other races, and 1.5% from two or more races. The median household income in Wayne was $90,917 in 2018, and the median family income was $103,917. The village is home to several small businesses, including restaurants, retail stores, and professional services. It is also served by the Metra commuter rail line and several major highways, providing access to downtown Chicago.
Common Questions
What is Per Capita Income in Wayne?
Per Capita income in Wayne is $85,075.
What is the Median Family Income in Wayne?
Median Family Income in Wayne is $175,330.
What is the Median Household income in Wayne?
Median Household Income in Wayne is $165,313.
What is Income or Wage Gap in Wayne?
Income or Wage Gap in Wayne is 57.9%.
Women in Wayne earn 42.1 cents for every dollar earned by a man.
What is Inequality or Gini Index in Wayne?
Inequality or Gini Index in Wayne is 0.42.
What is the Total Population of Wayne?
Total Population of Wayne is 2,225.
What is the Total Male Population of Wayne?
Total Male Population of Wayne is 1,089.
What is the Total Female Population of Wayne?
Total Female Population of Wayne is 1,136.
What is the Ratio of Males per 100 Females in Wayne?
There are 95.86 Males per 100 Females in Wayne.
What is the Ratio of Females per 100 Males in Wayne?
There are 104.32 Females per 100 Males in Wayne.
What is the Median Population Age in Wayne?
Median Population Age in Wayne is 52.3 Years.
What is the Average Family Size in Wayne
Average Family Size in Wayne is 2.8 People.
What is the Average Household Size in Wayne
Average Household Size in Wayne is 2.5 People.
How Large is the Labor Force in Wayne?
There are 1,390 People in the Labor Forcein in Wayne.
What is the Percentage of People in the Labor Force in Wayne?
70.7% of People are in the Labor Force in Wayne.
What is the Unemployment Rate in Wayne?
Unemployment Rate in Wayne is 2.9%.