Hyde Park, NY Map & Demographics
Hyde Park Map
Hyde Park Overview
$54,382
PER CAPITA INCOME
$120,924
AVG FAMILY INCOME
$81,136
AVG HOUSEHOLD INCOME
28.8%
WAGE / INCOME GAP [ % ]
71.2¢/ $1
WAGE / INCOME GAP [ $ ]
0.52
INEQUALITY / GINI INDEX
1,963
TOTAL POPULATION
998
MALE POPULATION
965
FEMALE POPULATION
103.42
MALES / 100 FEMALES
96.69
FEMALES / 100 MALES
44.2
MEDIAN AGE
2.9
AVG FAMILY SIZE
2.1
AVG HOUSEHOLD SIZE
984
LABOR FORCE [ PEOPLE ]
56.2%
PERCENT IN LABOR FORCE
6.1%
UNEMPLOYMENT RATE
Hyde Park Zip Codes
Hyde Park Area Codes
Income in Hyde Park
Income Overview in Hyde Park
Per Capita Income in Hyde Park is $54,382, while median incomes of families and households are $120,924 and $81,136 respectively.
| Characteristic | Number | Measure |
| Per Capita Income | 1,963 | $54,382 |
| Median Family Income | 459 | $120,924 |
| Mean Family Income | 459 | $140,607 |
| Median Household Income | 914 | $81,136 |
| Mean Household Income | 914 | $115,616 |
| Income Deficit | 459 | $0 |
| Wage / Income Gap (%) | 1,963 | 28.78% |
| Wage / Income Gap ($) | 1,963 | 71.22¢ per $1 |
| Gini / Inequality Index | 1,963 | 0.52 |
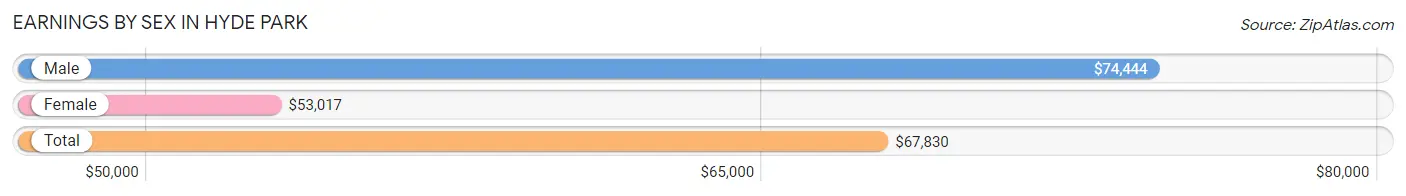
Earnings by Sex in Hyde Park
Average Earnings in Hyde Park are $67,830, $74,444 for men and $53,017 for women, a difference of 28.8%.
| Sex | Number | Average Earnings |
| Male | 578 (57.2%) | $74,444 |
| Female | 432 (42.8%) | $53,017 |
| Total | 1,010 (100.0%) | $67,830 |
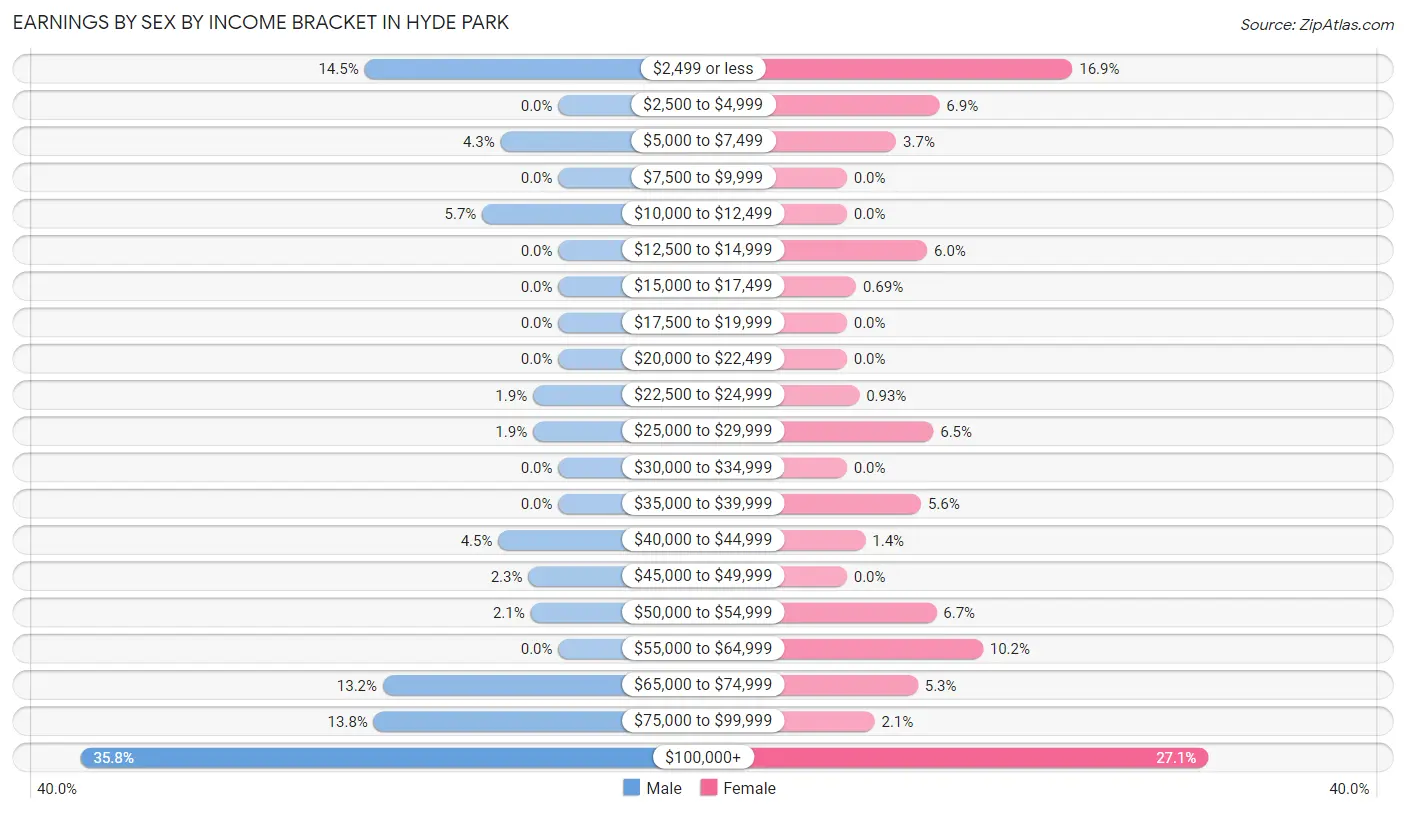
Earnings by Sex by Income Bracket in Hyde Park
The most common earnings brackets in Hyde Park are $100,000+ for men (207 | 35.8%) and $100,000+ for women (117 | 27.1%).
| Income | Male | Female |
| $2,499 or less | 84 (14.5%) | 73 (16.9%) |
| $2,500 to $4,999 | 0 (0.0%) | 30 (6.9%) |
| $5,000 to $7,499 | 25 (4.3%) | 16 (3.7%) |
| $7,500 to $9,999 | 0 (0.0%) | 0 (0.0%) |
| $10,000 to $12,499 | 33 (5.7%) | 0 (0.0%) |
| $12,500 to $14,999 | 0 (0.0%) | 26 (6.0%) |
| $15,000 to $17,499 | 0 (0.0%) | 3 (0.7%) |
| $17,500 to $19,999 | 0 (0.0%) | 0 (0.0%) |
| $20,000 to $22,499 | 0 (0.0%) | 0 (0.0%) |
| $22,500 to $24,999 | 11 (1.9%) | 4 (0.9%) |
| $25,000 to $29,999 | 11 (1.9%) | 28 (6.5%) |
| $30,000 to $34,999 | 0 (0.0%) | 0 (0.0%) |
| $35,000 to $39,999 | 0 (0.0%) | 24 (5.6%) |
| $40,000 to $44,999 | 26 (4.5%) | 6 (1.4%) |
| $45,000 to $49,999 | 13 (2.2%) | 0 (0.0%) |
| $50,000 to $54,999 | 12 (2.1%) | 29 (6.7%) |
| $55,000 to $64,999 | 0 (0.0%) | 44 (10.2%) |
| $65,000 to $74,999 | 76 (13.2%) | 23 (5.3%) |
| $75,000 to $99,999 | 80 (13.8%) | 9 (2.1%) |
| $100,000+ | 207 (35.8%) | 117 (27.1%) |
| Total | 578 (100.0%) | 432 (100.0%) |
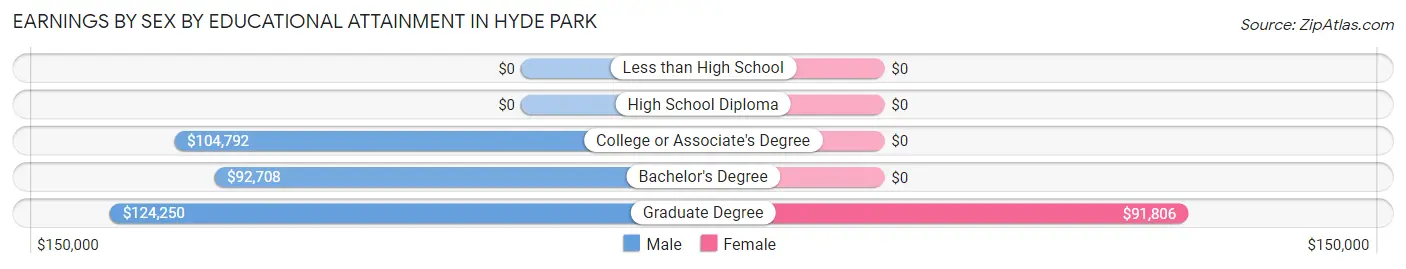
Earnings by Sex by Educational Attainment in Hyde Park
Average earnings in Hyde Park are $93,490 for men and $63,520 for women, a difference of 32.1%. Men with an educational attainment of graduate degree enjoy the highest average annual earnings of $124,250, while those with bachelor's degree education earn the least with $92,708. Women with an educational attainment of graduate degree earn the most with the average annual earnings of $91,806, while those with graduate degree education have the smallest earnings of $91,806.
| Educational Attainment | Male Income | Female Income |
| Less than High School | - | - |
| High School Diploma | - | - |
| College or Associate's Degree | $104,792 | $0 |
| Bachelor's Degree | $92,708 | $0 |
| Graduate Degree | $124,250 | $91,806 |
| Total | $93,490 | $63,520 |
Family Income in Hyde Park
Family Income Brackets in Hyde Park
According to the Hyde Park family income data, there are 115 families falling into the $150,000 to $199,999 income range, which is the most common income bracket and makes up 25.1% of all families.
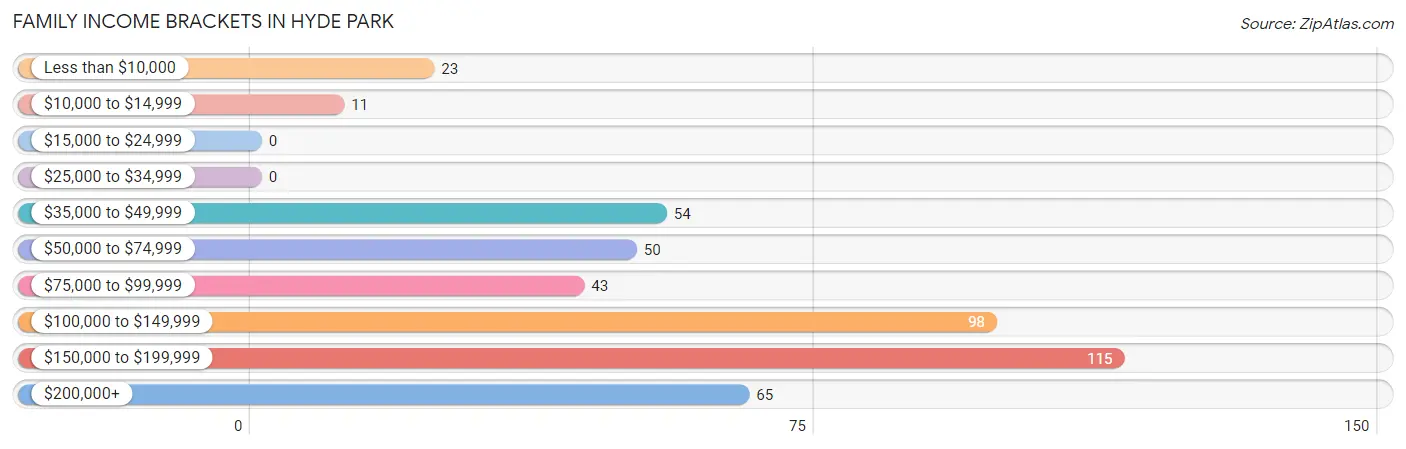
| Income Bracket | # Families | % Families |
| Less than $10,000 | 23 | 5.0% |
| $10,000 to $14,999 | 11 | 2.4% |
| $15,000 to $24,999 | 0 | 0.0% |
| $25,000 to $34,999 | 0 | 0.0% |
| $35,000 to $49,999 | 54 | 11.8% |
| $50,000 to $74,999 | 50 | 10.9% |
| $75,000 to $99,999 | 43 | 9.4% |
| $100,000 to $149,999 | 98 | 21.4% |
| $150,000 to $199,999 | 115 | 25.1% |
| $200,000+ | 65 | 14.2% |
Family Income by Famaliy Size in Hyde Park
4-person families (27 | 5.9%) account for the highest median family income in Hyde Park with $219,875 per family, while 4-person families (27 | 5.9%) have the highest median income of $54,969 per family member.
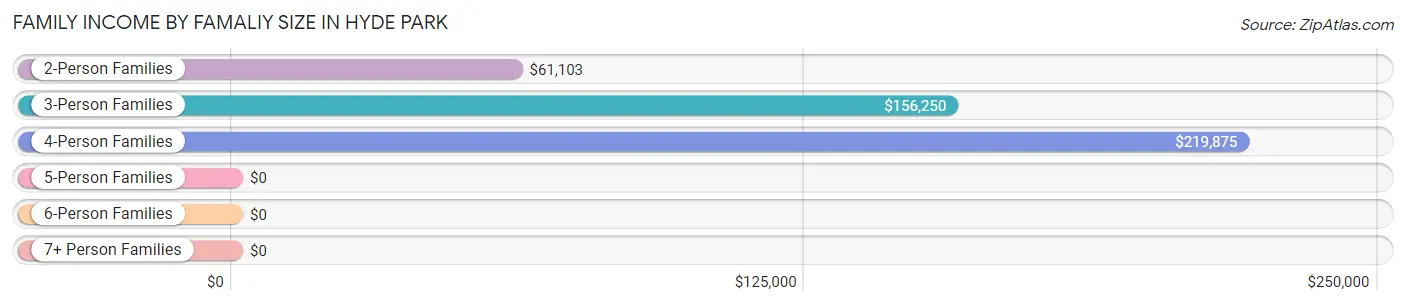
| Income Bracket | # Families | Median Income |
| 2-Person Families | 233 (50.8%) | $61,103 |
| 3-Person Families | 171 (37.2%) | $156,250 |
| 4-Person Families | 27 (5.9%) | $219,875 |
| 5-Person Families | 0 (0.0%) | $0 |
| 6-Person Families | 0 (0.0%) | $0 |
| 7+ Person Families | 28 (6.1%) | $0 |
| Total | 459 (100.0%) | $120,924 |
Family Income by Number of Earners in Hyde Park
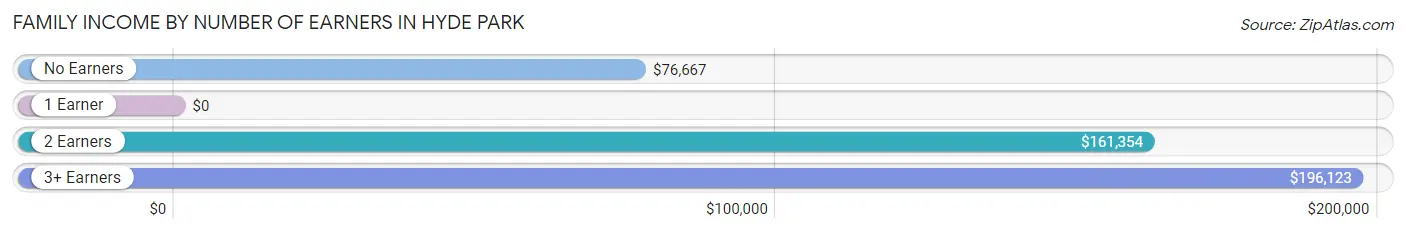
| Number of Earners | # Families | Median Income |
| No Earners | 104 (22.7%) | $76,667 |
| 1 Earner | 159 (34.6%) | $0 |
| 2 Earners | 91 (19.8%) | $161,354 |
| 3+ Earners | 105 (22.9%) | $196,123 |
| Total | 459 (100.0%) | $120,924 |
Household Income in Hyde Park
Household Income Brackets in Hyde Park
With 191 households falling in the category, the $100,000 to $149,999 income range is the most frequent in Hyde Park, accounting for 20.9% of all households. In contrast, only 19 households (2.1%) fall into the $25,000 to $34,999 income bracket, making it the least populous group.
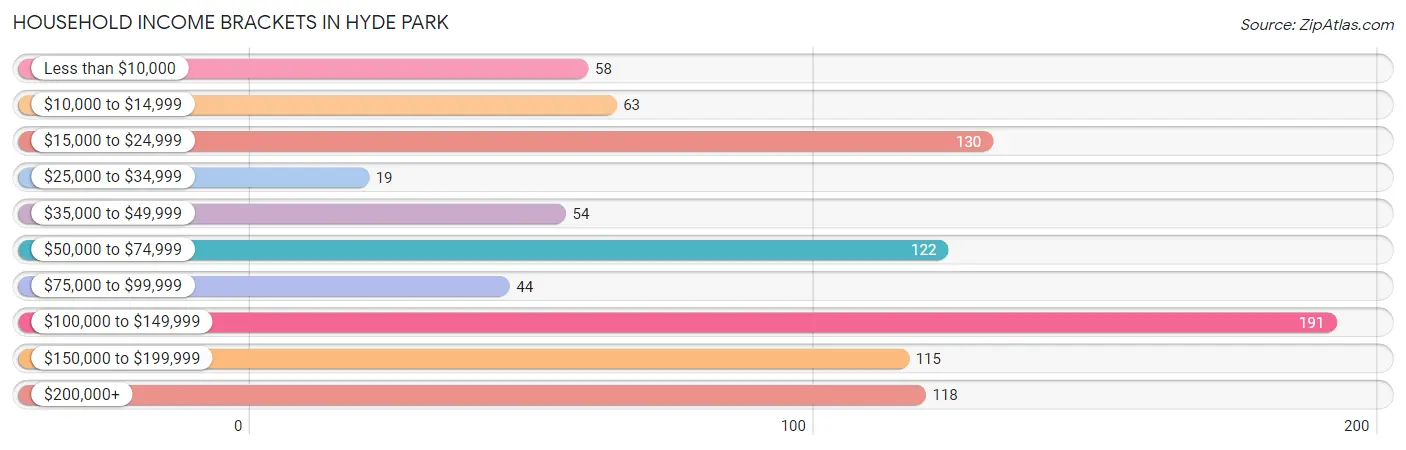
| Income Bracket | # Households | % Households |
| Less than $10,000 | 58 | 6.3% |
| $10,000 to $14,999 | 63 | 6.9% |
| $15,000 to $24,999 | 130 | 14.2% |
| $25,000 to $34,999 | 19 | 2.1% |
| $35,000 to $49,999 | 54 | 5.9% |
| $50,000 to $74,999 | 122 | 13.3% |
| $75,000 to $99,999 | 44 | 4.8% |
| $100,000 to $149,999 | 191 | 20.9% |
| $150,000 to $199,999 | 115 | 12.6% |
| $200,000+ | 118 | 12.9% |
Household Income by Householder Age in Hyde Park
The median household income in Hyde Park is $81,136, with the highest median household income of $143,147 found in the 45 to 64 years age bracket for the primary householder. A total of 315 households (34.5%) fall into this category. Meanwhile, the 15 to 24 years age bracket for the primary householder has the lowest median household income of $0, with 83 households (9.1%) in this group.
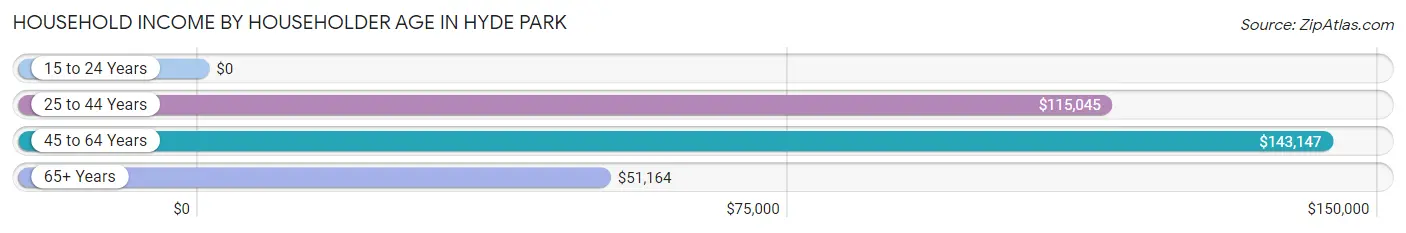
| Income Bracket | # Households | Median Income |
| 15 to 24 Years | 83 (9.1%) | $0 |
| 25 to 44 Years | 193 (21.1%) | $115,045 |
| 45 to 64 Years | 315 (34.5%) | $143,147 |
| 65+ Years | 323 (35.3%) | $51,164 |
| Total | 914 (100.0%) | $81,136 |
Poverty in Hyde Park
Income Below Poverty by Sex and Age in Hyde Park
With 18.2% poverty level for males and 8.9% for females among the residents of Hyde Park, 25 to 34 year old males and 18 to 24 year old females are the most vulnerable to poverty, with 36 males (42.3%) and 44 females (57.9%) in their respective age groups living below the poverty level.
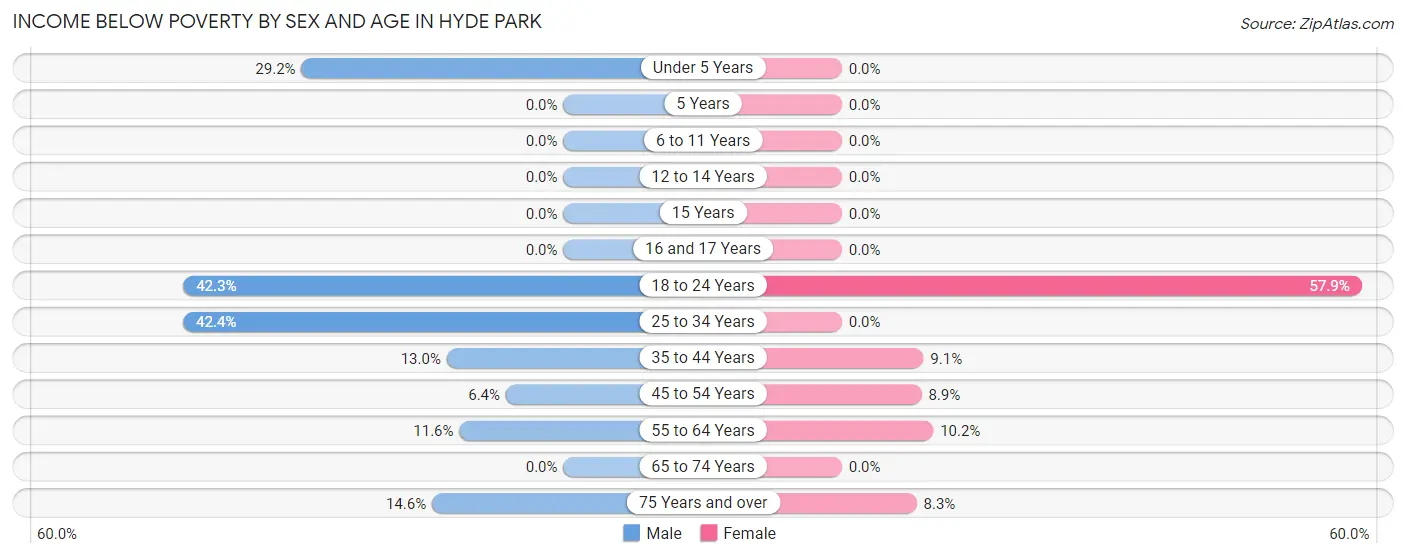
| Age Bracket | Male | Female |
| Under 5 Years | 21 (29.2%) | 0 (0.0%) |
| 5 Years | 0 (0.0%) | 0 (0.0%) |
| 6 to 11 Years | 0 (0.0%) | 0 (0.0%) |
| 12 to 14 Years | 0 (0.0%) | 0 (0.0%) |
| 15 Years | 0 (0.0%) | 0 (0.0%) |
| 16 and 17 Years | 0 (0.0%) | 0 (0.0%) |
| 18 to 24 Years | 80 (42.3%) | 44 (57.9%) |
| 25 to 34 Years | 36 (42.3%) | 0 (0.0%) |
| 35 to 44 Years | 20 (13.0%) | 8 (9.1%) |
| 45 to 54 Years | 8 (6.4%) | 11 (8.9%) |
| 55 to 64 Years | 11 (11.6%) | 17 (10.2%) |
| 65 to 74 Years | 0 (0.0%) | 0 (0.0%) |
| 75 Years and over | 6 (14.6%) | 6 (8.3%) |
| Total | 182 (18.2%) | 86 (8.9%) |
Income Above Poverty by Sex and Age in Hyde Park
According to the poverty statistics in Hyde Park, males aged 6 to 11 years and females aged 6 to 11 years are the age groups that are most secure financially, with 100.0% of males and 100.0% of females in these age groups living above the poverty line.
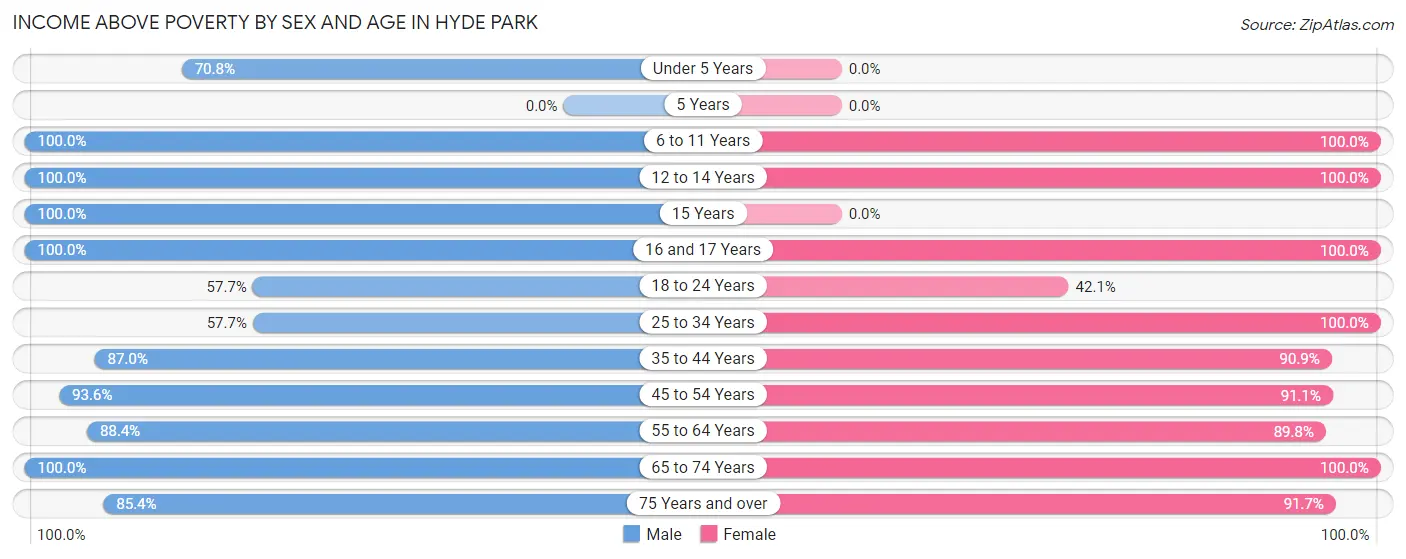
| Age Bracket | Male | Female |
| Under 5 Years | 51 (70.8%) | 0 (0.0%) |
| 5 Years | 0 (0.0%) | 0 (0.0%) |
| 6 to 11 Years | 36 (100.0%) | 65 (100.0%) |
| 12 to 14 Years | 13 (100.0%) | 13 (100.0%) |
| 15 Years | 11 (100.0%) | 0 (0.0%) |
| 16 and 17 Years | 35 (100.0%) | 89 (100.0%) |
| 18 to 24 Years | 109 (57.7%) | 32 (42.1%) |
| 25 to 34 Years | 49 (57.7%) | 97 (100.0%) |
| 35 to 44 Years | 134 (87.0%) | 80 (90.9%) |
| 45 to 54 Years | 117 (93.6%) | 113 (91.1%) |
| 55 to 64 Years | 84 (88.4%) | 150 (89.8%) |
| 65 to 74 Years | 142 (100.0%) | 171 (100.0%) |
| 75 Years and over | 35 (85.4%) | 66 (91.7%) |
| Total | 816 (81.8%) | 876 (91.1%) |
Income Below Poverty Among Married-Couple Families in Hyde Park
The poverty statistics for married-couple families in Hyde Park show that 5.3% or 17 of the total 322 families live below the poverty line. Families with no children have the highest poverty rate of 6.9%, comprising of 17 families. On the other hand, families with 1 or 2 children have the lowest poverty rate of 0.0%, which includes 0 families.
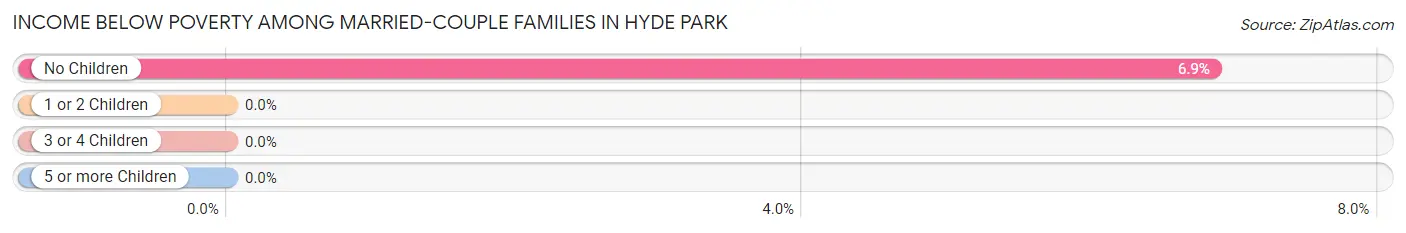
| Children | Above Poverty | Below Poverty |
| No Children | 231 (93.1%) | 17 (6.9%) |
| 1 or 2 Children | 46 (100.0%) | 0 (0.0%) |
| 3 or 4 Children | 14 (100.0%) | 0 (0.0%) |
| 5 or more Children | 14 (100.0%) | 0 (0.0%) |
| Total | 305 (94.7%) | 17 (5.3%) |
Income Below Poverty Among Single-Parent Households in Hyde Park
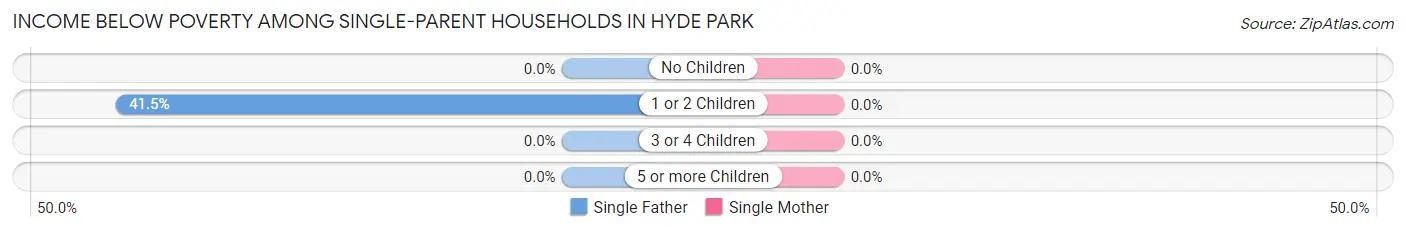
| Children | Single Father | Single Mother |
| No Children | 0 (0.0%) | 0 (0.0%) |
| 1 or 2 Children | 17 (41.5%) | 0 (0.0%) |
| 3 or 4 Children | 0 (0.0%) | 0 (0.0%) |
| 5 or more Children | 0 (0.0%) | 0 (0.0%) |
| Total | 17 (35.4%) | 0 (0.0%) |
Income Below Poverty Among Married-Couple vs Single-Parent Households in Hyde Park
The poverty data for Hyde Park shows that 17 of the married-couple family households (5.3%) and 17 of the single-parent households (12.4%) are living below the poverty level. Within the married-couple family households, those with no children have the highest poverty rate, with 17 households (6.9%) falling below the poverty line. Among the single-parent households, those with 1 or 2 children have the highest poverty rate, with 17 household (16.0%) living below poverty.
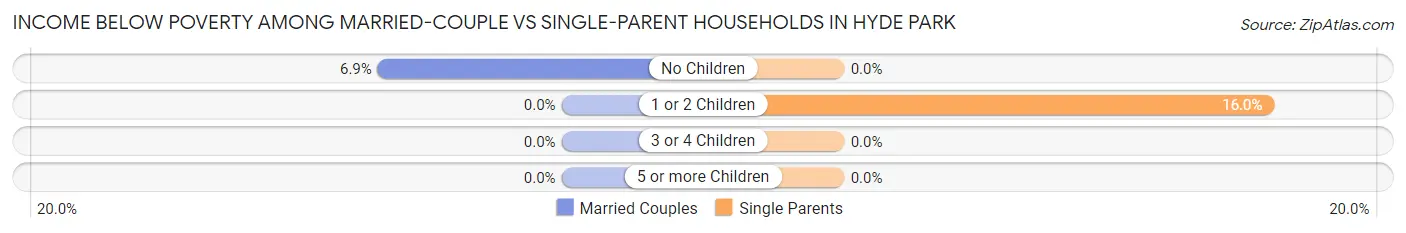
| Children | Married-Couple Families | Single-Parent Households |
| No Children | 17 (6.9%) | 0 (0.0%) |
| 1 or 2 Children | 0 (0.0%) | 17 (16.0%) |
| 3 or 4 Children | 0 (0.0%) | 0 (0.0%) |
| 5 or more Children | 0 (0.0%) | 0 (0.0%) |
| Total | 17 (5.3%) | 17 (12.4%) |
Race in Hyde Park
The most populous races in Hyde Park are White / Caucasian (1,682 | 85.7%), Black / African American (151 | 7.7%), and Hispanic or Latino (119 | 6.1%).
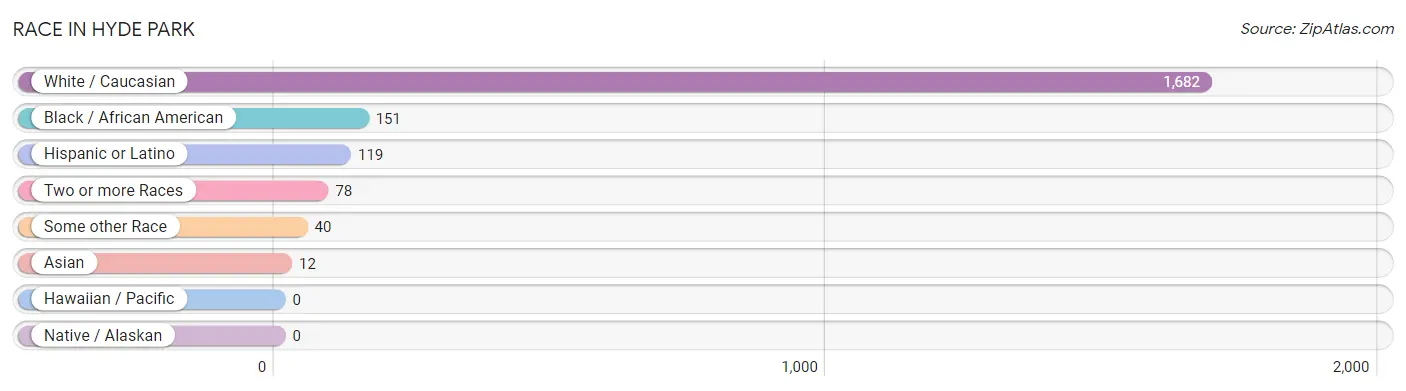
| Race | # Population | % Population |
| Asian | 12 | 0.6% |
| Black / African American | 151 | 7.7% |
| Hawaiian / Pacific | 0 | 0.0% |
| Hispanic or Latino | 119 | 6.1% |
| Native / Alaskan | 0 | 0.0% |
| White / Caucasian | 1,682 | 85.7% |
| Two or more Races | 78 | 4.0% |
| Some other Race | 40 | 2.0% |
| Total | 1,963 | 100.0% |
Ancestry in Hyde Park
The most populous ancestries reported in Hyde Park are Irish (502 | 25.6%), German (450 | 22.9%), Italian (193 | 9.8%), English (154 | 7.9%), and European (153 | 7.8%), together accounting for 74.0% of all Hyde Park residents.
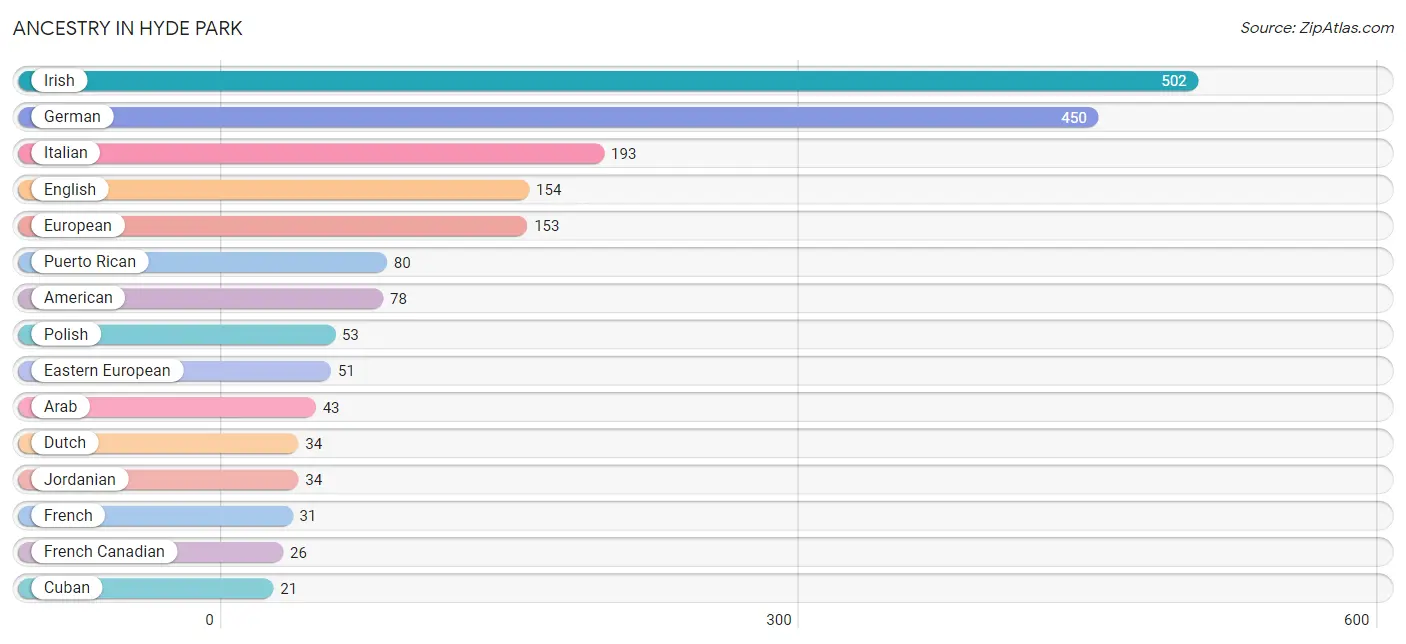
| Ancestry | # Population | % Population |
| American | 78 | 4.0% |
| Arab | 43 | 2.2% |
| Burmese | 12 | 0.6% |
| Canadian | 9 | 0.5% |
| Central American | 6 | 0.3% |
| Costa Rican | 6 | 0.3% |
| Cuban | 21 | 1.1% |
| Czech | 5 | 0.3% |
| Dominican | 12 | 0.6% |
| Dutch | 34 | 1.7% |
| Eastern European | 51 | 2.6% |
| English | 154 | 7.9% |
| European | 153 | 7.8% |
| French | 31 | 1.6% |
| French Canadian | 26 | 1.3% |
| German | 450 | 22.9% |
| Greek | 9 | 0.5% |
| Hungarian | 16 | 0.8% |
| Irish | 502 | 25.6% |
| Italian | 193 | 9.8% |
| Jordanian | 34 | 1.7% |
| Lebanese | 9 | 0.5% |
| Polish | 53 | 2.7% |
| Puerto Rican | 80 | 4.1% |
| Russian | 21 | 1.1% |
| Scotch-Irish | 11 | 0.6% |
| Scottish | 20 | 1.0% |
| Tongan | 6 | 0.3% |
| Ukrainian | 14 | 0.7% |
| Welsh | 2 | 0.1% |
| West Indian | 3 | 0.2% | View All 31 Rows |
Immigrants in Hyde Park
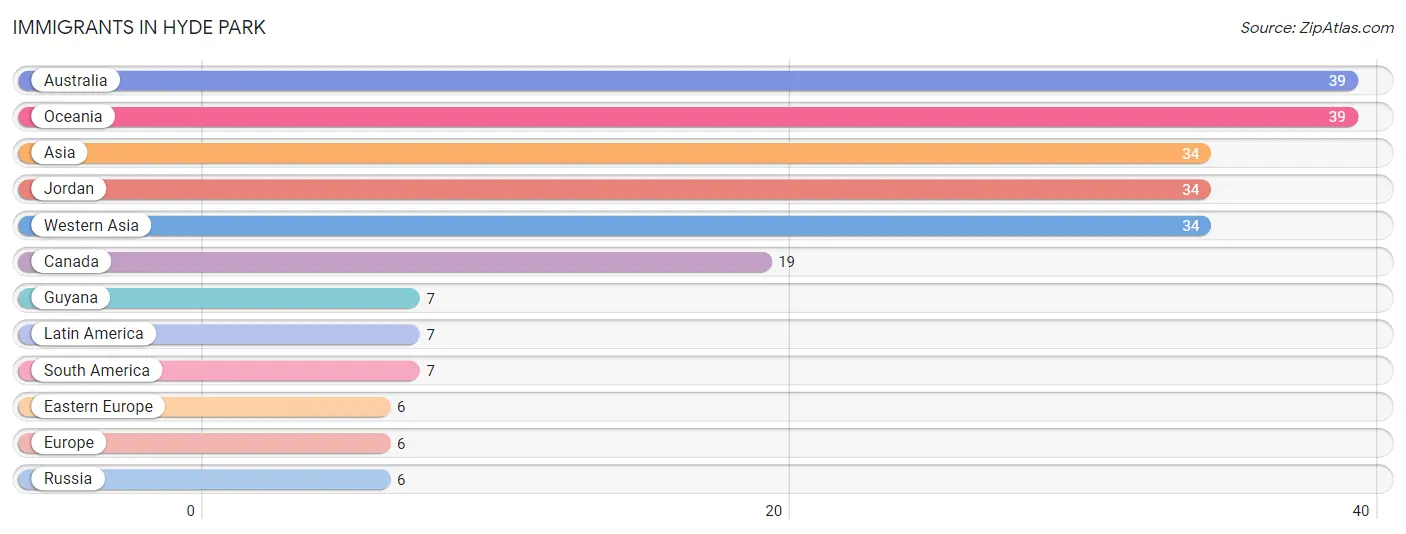
The most numerous immigrant groups reported in Hyde Park came from Australia (39 | 2.0%), Oceania (39 | 2.0%), Asia (34 | 1.7%), Jordan (34 | 1.7%), and Western Asia (34 | 1.7%), together accounting for 9.2% of all Hyde Park residents.
| Immigration Origin | # Population | % Population |
| Asia | 34 | 1.7% |
| Australia | 39 | 2.0% |
| Canada | 19 | 1.0% |
| Eastern Europe | 6 | 0.3% |
| Europe | 6 | 0.3% |
| Guyana | 7 | 0.4% |
| Jordan | 34 | 1.7% |
| Latin America | 7 | 0.4% |
| Oceania | 39 | 2.0% |
| Russia | 6 | 0.3% |
| South America | 7 | 0.4% |
| Western Asia | 34 | 1.7% | View All 12 Rows |
Sex and Age in Hyde Park
Sex and Age in Hyde Park
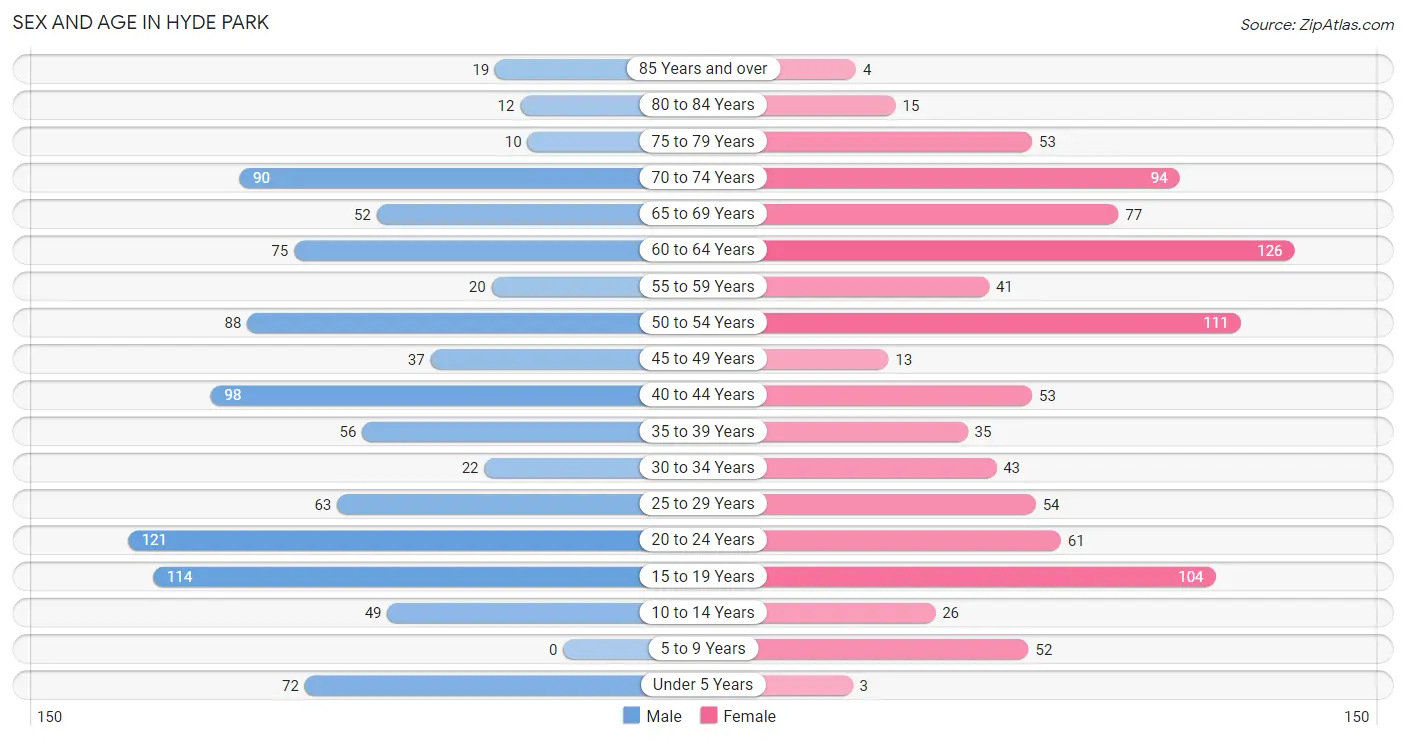
The most populous age groups in Hyde Park are 20 to 24 Years (121 | 12.1%) for men and 60 to 64 Years (126 | 13.1%) for women.
| Age Bracket | Male | Female |
| Under 5 Years | 72 (7.2%) | 3 (0.3%) |
| 5 to 9 Years | 0 (0.0%) | 52 (5.4%) |
| 10 to 14 Years | 49 (4.9%) | 26 (2.7%) |
| 15 to 19 Years | 114 (11.4%) | 104 (10.8%) |
| 20 to 24 Years | 121 (12.1%) | 61 (6.3%) |
| 25 to 29 Years | 63 (6.3%) | 54 (5.6%) |
| 30 to 34 Years | 22 (2.2%) | 43 (4.5%) |
| 35 to 39 Years | 56 (5.6%) | 35 (3.6%) |
| 40 to 44 Years | 98 (9.8%) | 53 (5.5%) |
| 45 to 49 Years | 37 (3.7%) | 13 (1.3%) |
| 50 to 54 Years | 88 (8.8%) | 111 (11.5%) |
| 55 to 59 Years | 20 (2.0%) | 41 (4.3%) |
| 60 to 64 Years | 75 (7.5%) | 126 (13.1%) |
| 65 to 69 Years | 52 (5.2%) | 77 (8.0%) |
| 70 to 74 Years | 90 (9.0%) | 94 (9.7%) |
| 75 to 79 Years | 10 (1.0%) | 53 (5.5%) |
| 80 to 84 Years | 12 (1.2%) | 15 (1.5%) |
| 85 Years and over | 19 (1.9%) | 4 (0.4%) |
| Total | 998 (100.0%) | 965 (100.0%) |
Families and Households in Hyde Park
Median Family Size in Hyde Park
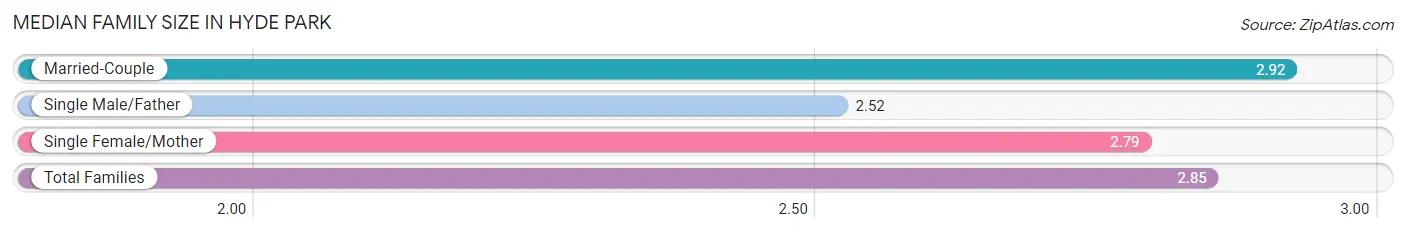
The median family size in Hyde Park is 2.85 persons per family, with married-couple families (322 | 70.2%) accounting for the largest median family size of 2.92 persons per family. On the other hand, single male/father families (48 | 10.5%) represent the smallest median family size with 2.52 persons per family.
| Family Type | # Families | Family Size |
| Married-Couple | 322 (70.2%) | 2.92 |
| Single Male/Father | 48 (10.5%) | 2.52 |
| Single Female/Mother | 89 (19.4%) | 2.79 |
| Total Families | 459 (100.0%) | 2.85 |
Median Household Size in Hyde Park
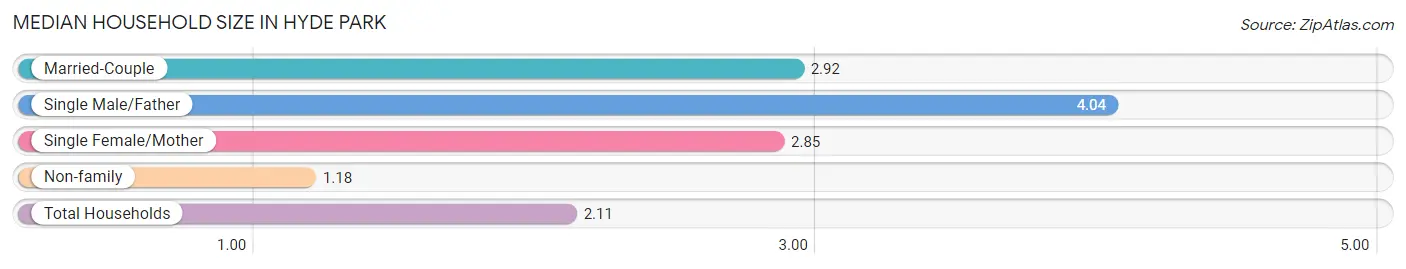
The median household size in Hyde Park is 2.11 persons per household, with single male/father households (48 | 5.2%) accounting for the largest median household size of 4.04 persons per household. non-family households (455 | 49.8%) represent the smallest median household size with 1.18 persons per household.
| Household Type | # Households | Household Size |
| Married-Couple | 322 (35.2%) | 2.92 |
| Single Male/Father | 48 (5.2%) | 4.04 |
| Single Female/Mother | 89 (9.7%) | 2.85 |
| Non-family | 455 (49.8%) | 1.18 |
| Total Households | 914 (100.0%) | 2.11 |
Household Size by Marriage Status in Hyde Park
Out of a total of 914 households in Hyde Park, 459 (50.2%) are family households, while 455 (49.8%) are nonfamily households. The most numerous type of family households are 2-person households, comprising 210, and the most common type of nonfamily households are 1-person households, comprising 382.
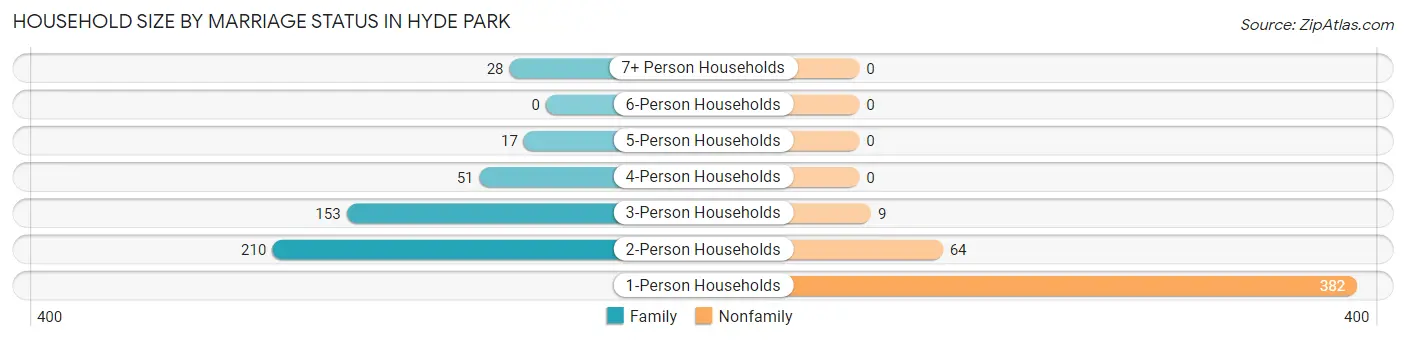
| Household Size | Family Households | Nonfamily Households |
| 1-Person Households | - | 382 (41.8%) |
| 2-Person Households | 210 (23.0%) | 64 (7.0%) |
| 3-Person Households | 153 (16.7%) | 9 (1.0%) |
| 4-Person Households | 51 (5.6%) | 0 (0.0%) |
| 5-Person Households | 17 (1.9%) | 0 (0.0%) |
| 6-Person Households | 0 (0.0%) | 0 (0.0%) |
| 7+ Person Households | 28 (3.1%) | 0 (0.0%) |
| Total | 459 (50.2%) | 455 (49.8%) |
Female Fertility in Hyde Park
Fertility by Age in Hyde Park
| Age Bracket | Women with Births | Births / 1,000 Women |
| 15 to 19 years | 0 (0.0%) | 0.0 |
| 20 to 34 years | 0 (0.0%) | 0.0 |
| 35 to 50 years | 0 (0.0%) | 0.0 |
| Total | 0 (0.0%) | 0.0 |
Fertility by Age by Marriage Status in Hyde Park
| Age Bracket | Married | Unmarried |
| 15 to 19 years | 0 (0.0%) | 0 (0.0%) |
| 20 to 34 years | 0 (0.0%) | 0 (0.0%) |
| 35 to 50 years | 0 (0.0%) | 0 (0.0%) |
| Total | 0 (0.0%) | 0 (0.0%) |
Fertility by Education in Hyde Park
| Educational Attainment | Women with Births | Births / 1,000 Women |
| Less than High School | 0 (0.0%) | 0.0 |
| High School Diploma | 0 (0.0%) | 0.0 |
| College or Associate's Degree | 0 (0.0%) | 0.0 |
| Bachelor's Degree | 0 (0.0%) | 0.0 |
| Graduate Degree | 0 (0.0%) | 0.0 |
| Total | 0 (0.0%) | 0.0 |
Fertility by Education by Marriage Status in Hyde Park
| Educational Attainment | Married | Unmarried |
| Less than High School | 0 (0.0%) | 0 (0.0%) |
| High School Diploma | 0 (0.0%) | 0 (0.0%) |
| College or Associate's Degree | 0 (0.0%) | 0 (0.0%) |
| Bachelor's Degree | 0 (0.0%) | 0 (0.0%) |
| Graduate Degree | 0 (0.0%) | 0 (0.0%) |
| Total | 0 (0.0%) | 0 (0.0%) |
Employment Characteristics in Hyde Park
Employment by Class of Employer in Hyde Park
Among the 911 employed individuals in Hyde Park, private company employees (540 | 59.3%), not-for-profit organizations (146 | 16.0%), and self-employed (not incorporated) (71 | 7.8%) make up the most common classes of employment.
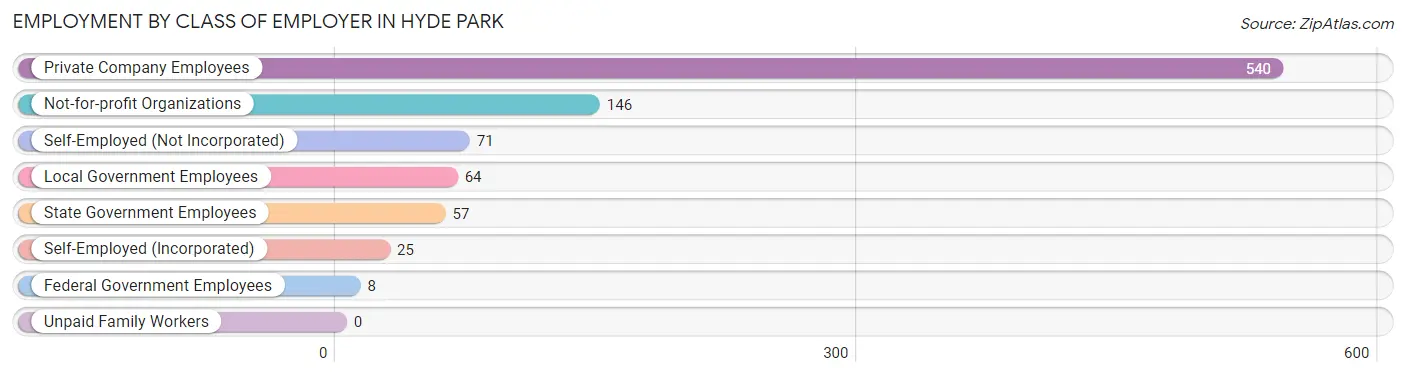
| Employer Class | # Employees | % Employees |
| Private Company Employees | 540 | 59.3% |
| Self-Employed (Incorporated) | 25 | 2.7% |
| Self-Employed (Not Incorporated) | 71 | 7.8% |
| Not-for-profit Organizations | 146 | 16.0% |
| Local Government Employees | 64 | 7.0% |
| State Government Employees | 57 | 6.3% |
| Federal Government Employees | 8 | 0.9% |
| Unpaid Family Workers | 0 | 0.0% |
| Total | 911 | 100.0% |
Employment Status by Age in Hyde Park
According to the labor force statistics for Hyde Park, out of the total population over 16 years of age (1,750), 56.2% or 984 individuals are in the labor force, with 6.1% or 60 of them unemployed. The age group with the highest labor force participation rate is 45 to 54 years, with 89.6% or 223 individuals in the labor force. Within the labor force, the 45 to 54 years age range has the highest percentage of unemployed individuals, with 13.9% or 31 of them being unemployed.
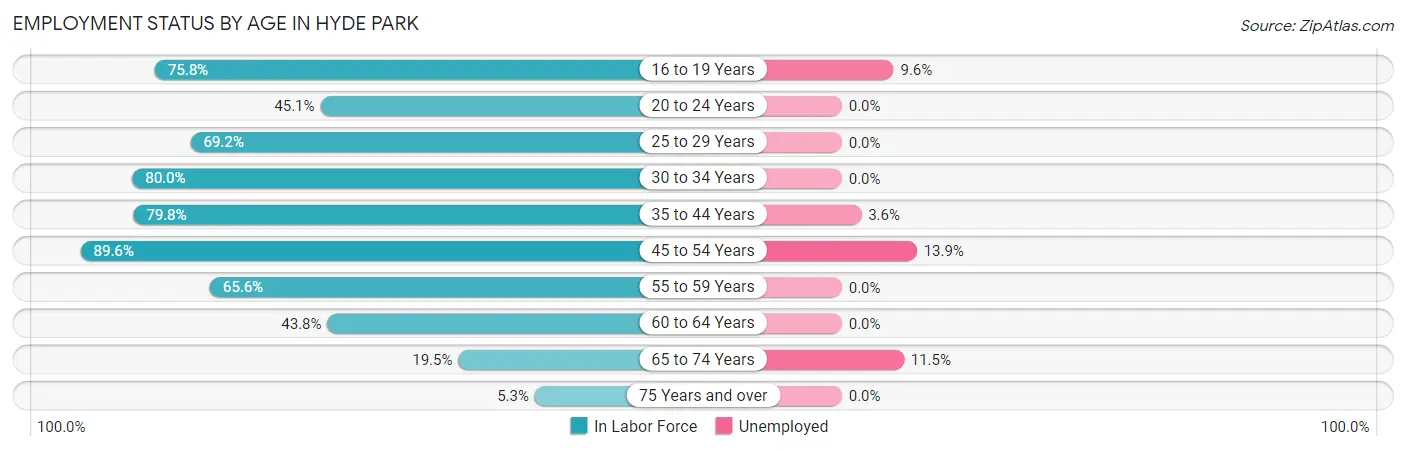
| Age Bracket | In Labor Force | Unemployed |
| 16 to 19 Years | 157 (75.8%) | 15 (9.6%) |
| 20 to 24 Years | 82 (45.1%) | 0 (0.0%) |
| 25 to 29 Years | 81 (69.2%) | 0 (0.0%) |
| 30 to 34 Years | 52 (80.0%) | 0 (0.0%) |
| 35 to 44 Years | 193 (79.8%) | 7 (3.6%) |
| 45 to 54 Years | 223 (89.6%) | 31 (13.9%) |
| 55 to 59 Years | 40 (65.6%) | 0 (0.0%) |
| 60 to 64 Years | 88 (43.8%) | 0 (0.0%) |
| 65 to 74 Years | 61 (19.5%) | 7 (11.5%) |
| 75 Years and over | 6 (5.3%) | 0 (0.0%) |
| Total | 984 (56.2%) | 60 (6.1%) |
Employment Status by Educational Attainment in Hyde Park
According to labor force statistics for Hyde Park, 72.4% of individuals (677) out of the total population between 25 and 64 years of age (935) are in the labor force, with 5.6% or 38 of them being unemployed. The group with the highest labor force participation rate are those with the educational attainment of bachelor's degree or higher, with 88.7% or 307 individuals in the labor force. Within the labor force, individuals with high school diploma education have the highest percentage of unemployment, with 15.1% or 8 of them being unemployed.
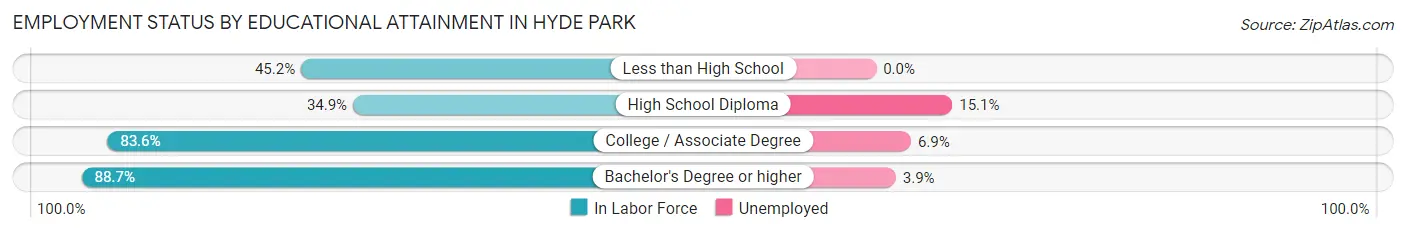
| Educational Attainment | In Labor Force | Unemployed |
| Less than High School | 57 (45.2%) | 0 (0.0%) |
| High School Diploma | 53 (34.9%) | 23 (15.1%) |
| College / Associate Degree | 260 (83.6%) | 21 (6.9%) |
| Bachelor's Degree or higher | 307 (88.7%) | 13 (3.9%) |
| Total | 677 (72.4%) | 52 (5.6%) |
Employment Occupations by Sex in Hyde Park
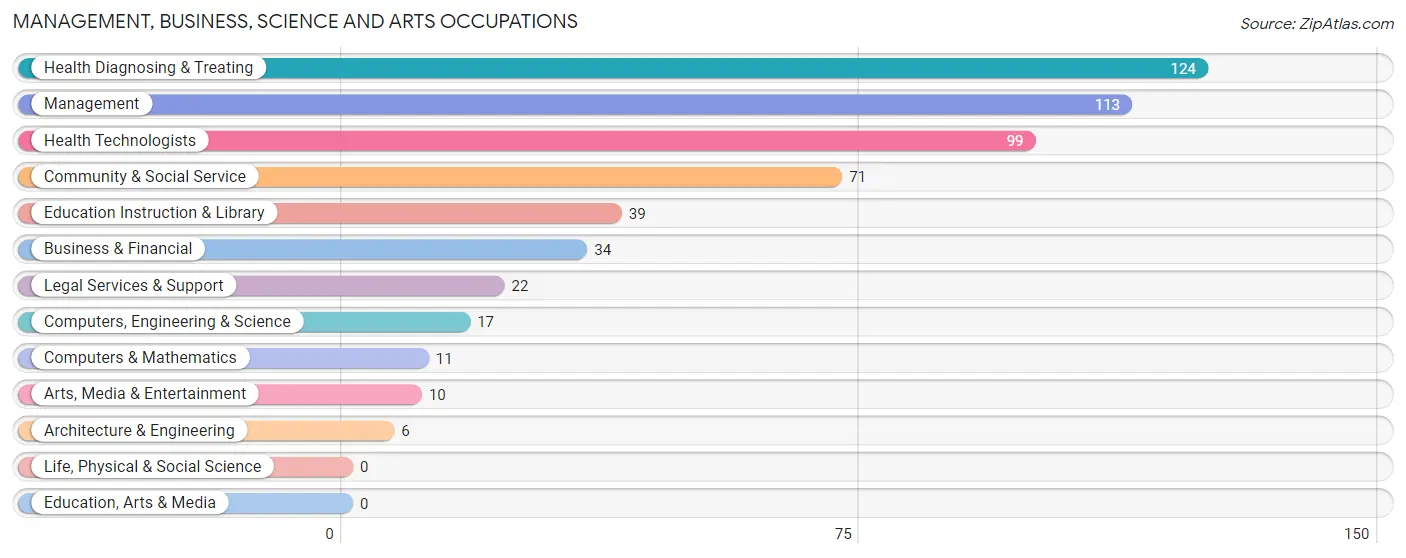
Management, Business, Science and Arts Occupations
The most common Management, Business, Science and Arts occupations in Hyde Park are Health Diagnosing & Treating (124 | 13.4%), Management (113 | 12.2%), Health Technologists (99 | 10.7%), Community & Social Service (71 | 7.7%), and Education Instruction & Library (39 | 4.2%).
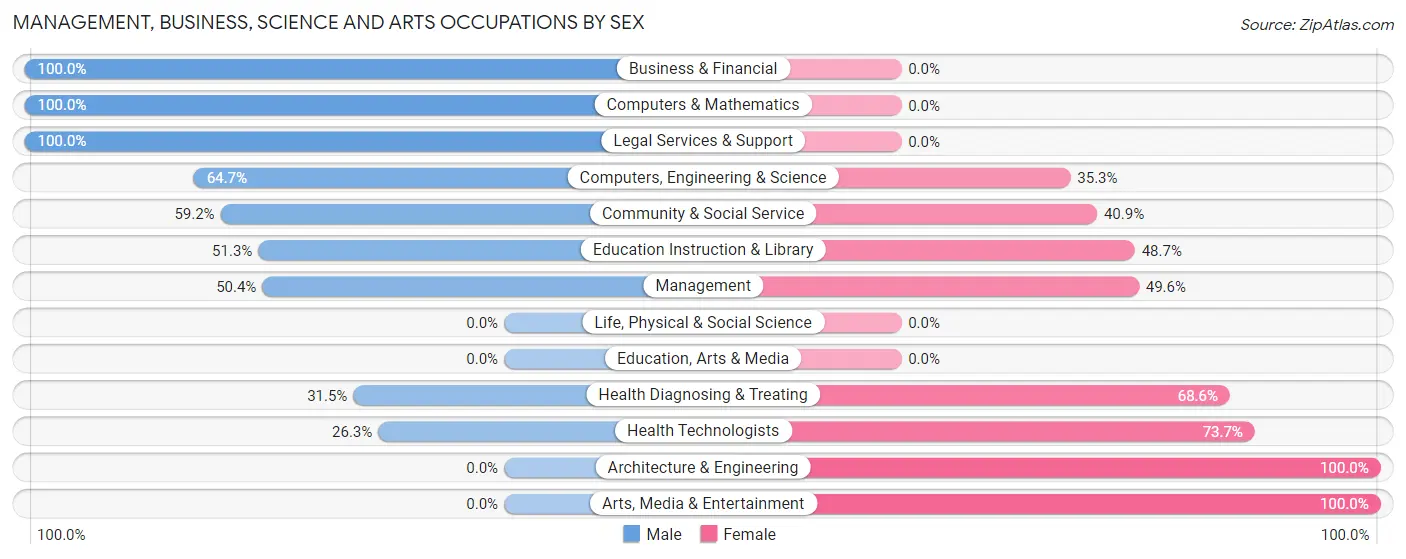
Management, Business, Science and Arts Occupations by Sex
Within the Management, Business, Science and Arts occupations in Hyde Park, the most male-oriented occupations are Business & Financial (100.0%), Computers & Mathematics (100.0%), and Legal Services & Support (100.0%), while the most female-oriented occupations are Architecture & Engineering (100.0%), Arts, Media & Entertainment (100.0%), and Health Technologists (73.7%).
| Occupation | Male | Female |
| Management | 57 (50.4%) | 56 (49.6%) |
| Business & Financial | 34 (100.0%) | 0 (0.0%) |
| Computers, Engineering & Science | 11 (64.7%) | 6 (35.3%) |
| Computers & Mathematics | 11 (100.0%) | 0 (0.0%) |
| Architecture & Engineering | 0 (0.0%) | 6 (100.0%) |
| Life, Physical & Social Science | 0 (0.0%) | 0 (0.0%) |
| Community & Social Service | 42 (59.2%) | 29 (40.8%) |
| Education, Arts & Media | 0 (0.0%) | 0 (0.0%) |
| Legal Services & Support | 22 (100.0%) | 0 (0.0%) |
| Education Instruction & Library | 20 (51.3%) | 19 (48.7%) |
| Arts, Media & Entertainment | 0 (0.0%) | 10 (100.0%) |
| Health Diagnosing & Treating | 39 (31.5%) | 85 (68.5%) |
| Health Technologists | 26 (26.3%) | 73 (73.7%) |
| Total (Category) | 183 (51.0%) | 176 (49.0%) |
| Total (Overall) | 510 (55.2%) | 413 (44.8%) |
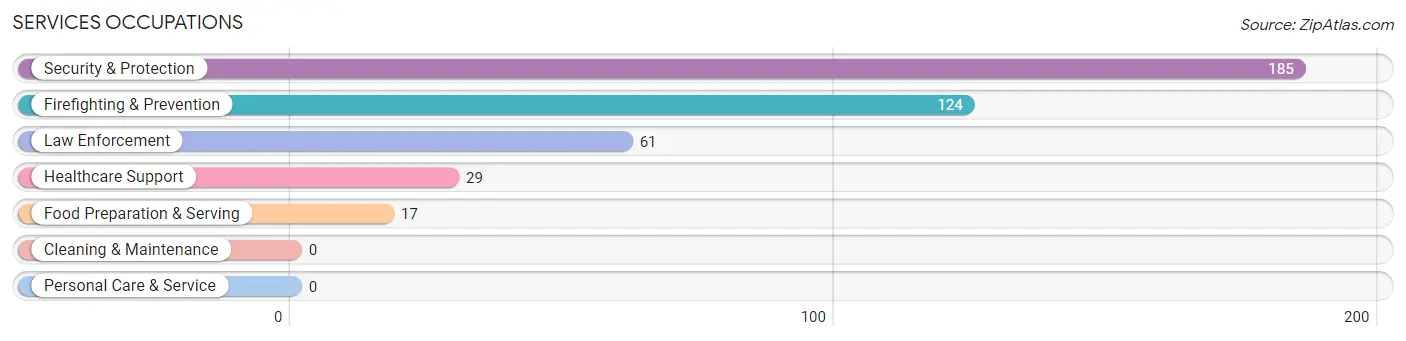
Services Occupations
The most common Services occupations in Hyde Park are Security & Protection (185 | 20.0%), Firefighting & Prevention (124 | 13.4%), Law Enforcement (61 | 6.6%), Healthcare Support (29 | 3.1%), and Food Preparation & Serving (17 | 1.8%).
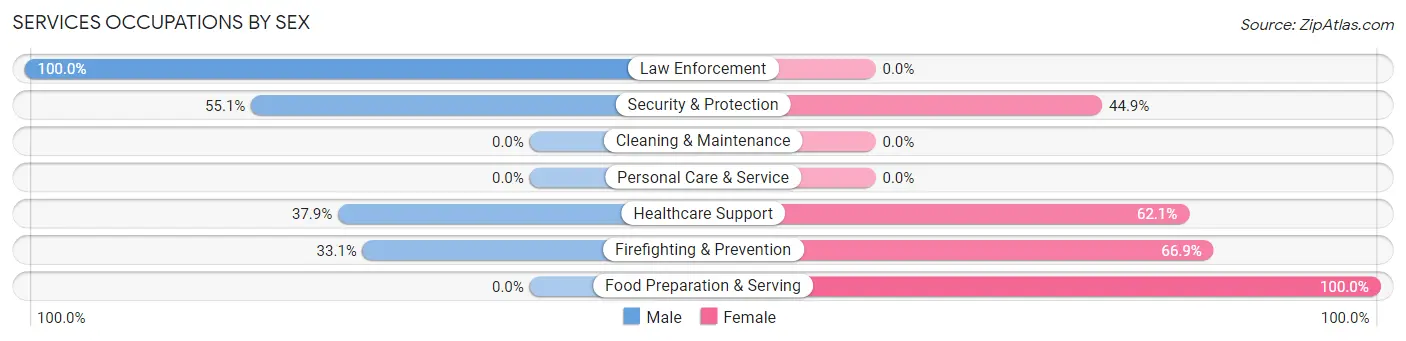
Services Occupations by Sex
Within the Services occupations in Hyde Park, the most male-oriented occupations are Law Enforcement (100.0%), Security & Protection (55.1%), and Healthcare Support (37.9%), while the most female-oriented occupations are Food Preparation & Serving (100.0%), Firefighting & Prevention (66.9%), and Healthcare Support (62.1%).
| Occupation | Male | Female |
| Healthcare Support | 11 (37.9%) | 18 (62.1%) |
| Security & Protection | 102 (55.1%) | 83 (44.9%) |
| Firefighting & Prevention | 41 (33.1%) | 83 (66.9%) |
| Law Enforcement | 61 (100.0%) | 0 (0.0%) |
| Food Preparation & Serving | 0 (0.0%) | 17 (100.0%) |
| Cleaning & Maintenance | 0 (0.0%) | 0 (0.0%) |
| Personal Care & Service | 0 (0.0%) | 0 (0.0%) |
| Total (Category) | 113 (48.9%) | 118 (51.1%) |
| Total (Overall) | 510 (55.2%) | 413 (44.8%) |
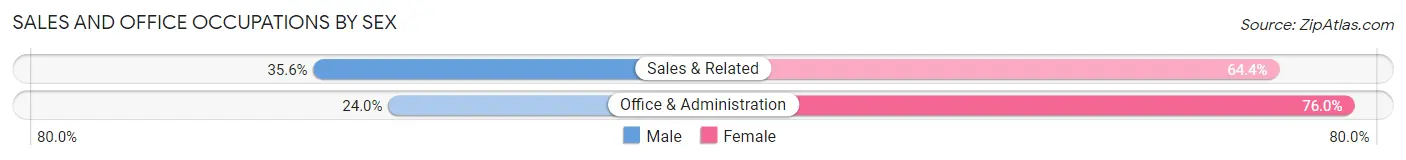
Sales and Office Occupations
The most common Sales and Office occupations in Hyde Park are Office & Administration (104 | 11.3%), and Sales & Related (45 | 4.9%).
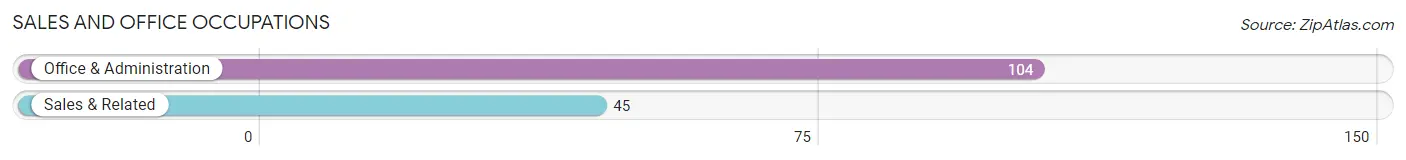
Sales and Office Occupations by Sex
| Occupation | Male | Female |
| Sales & Related | 16 (35.6%) | 29 (64.4%) |
| Office & Administration | 25 (24.0%) | 79 (76.0%) |
| Total (Category) | 41 (27.5%) | 108 (72.5%) |
| Total (Overall) | 510 (55.2%) | 413 (44.8%) |
Natural Resources, Construction and Maintenance Occupations
The most common Natural Resources, Construction and Maintenance occupations in Hyde Park are , and Construction & Extraction (109 | 11.8%).
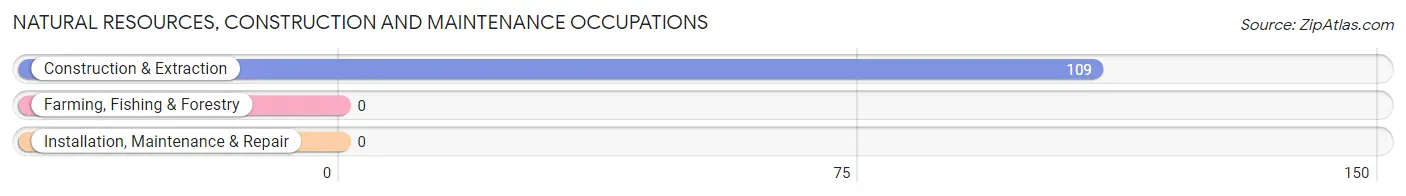
Natural Resources, Construction and Maintenance Occupations by Sex

| Occupation | Male | Female |
| Farming, Fishing & Forestry | 0 (0.0%) | 0 (0.0%) |
| Construction & Extraction | 109 (100.0%) | 0 (0.0%) |
| Installation, Maintenance & Repair | 0 (0.0%) | 0 (0.0%) |
| Total (Category) | 109 (100.0%) | 0 (0.0%) |
| Total (Overall) | 510 (55.2%) | 413 (44.8%) |
Production, Transportation and Moving Occupations
The most common Production, Transportation and Moving occupations in Hyde Park are Transportation (64 | 6.9%), and Production (11 | 1.2%).
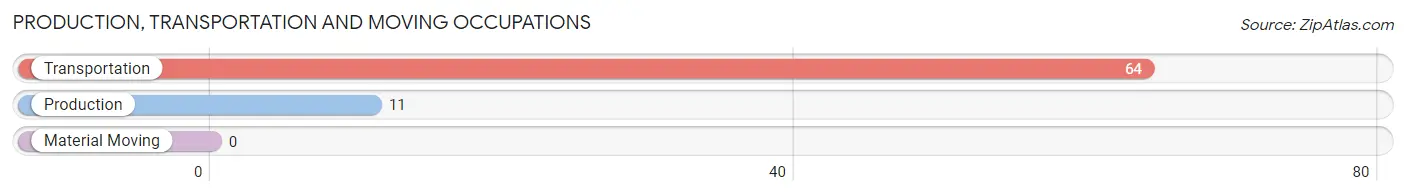
Production, Transportation and Moving Occupations by Sex
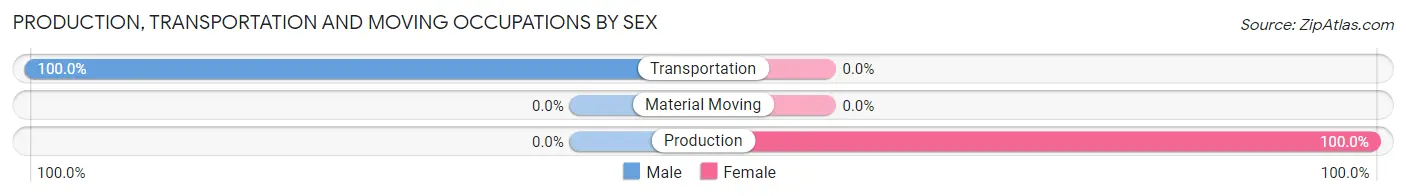
| Occupation | Male | Female |
| Production | 0 (0.0%) | 11 (100.0%) |
| Transportation | 64 (100.0%) | 0 (0.0%) |
| Material Moving | 0 (0.0%) | 0 (0.0%) |
| Total (Category) | 64 (85.3%) | 11 (14.7%) |
| Total (Overall) | 510 (55.2%) | 413 (44.8%) |
Employment Industries by Sex in Hyde Park
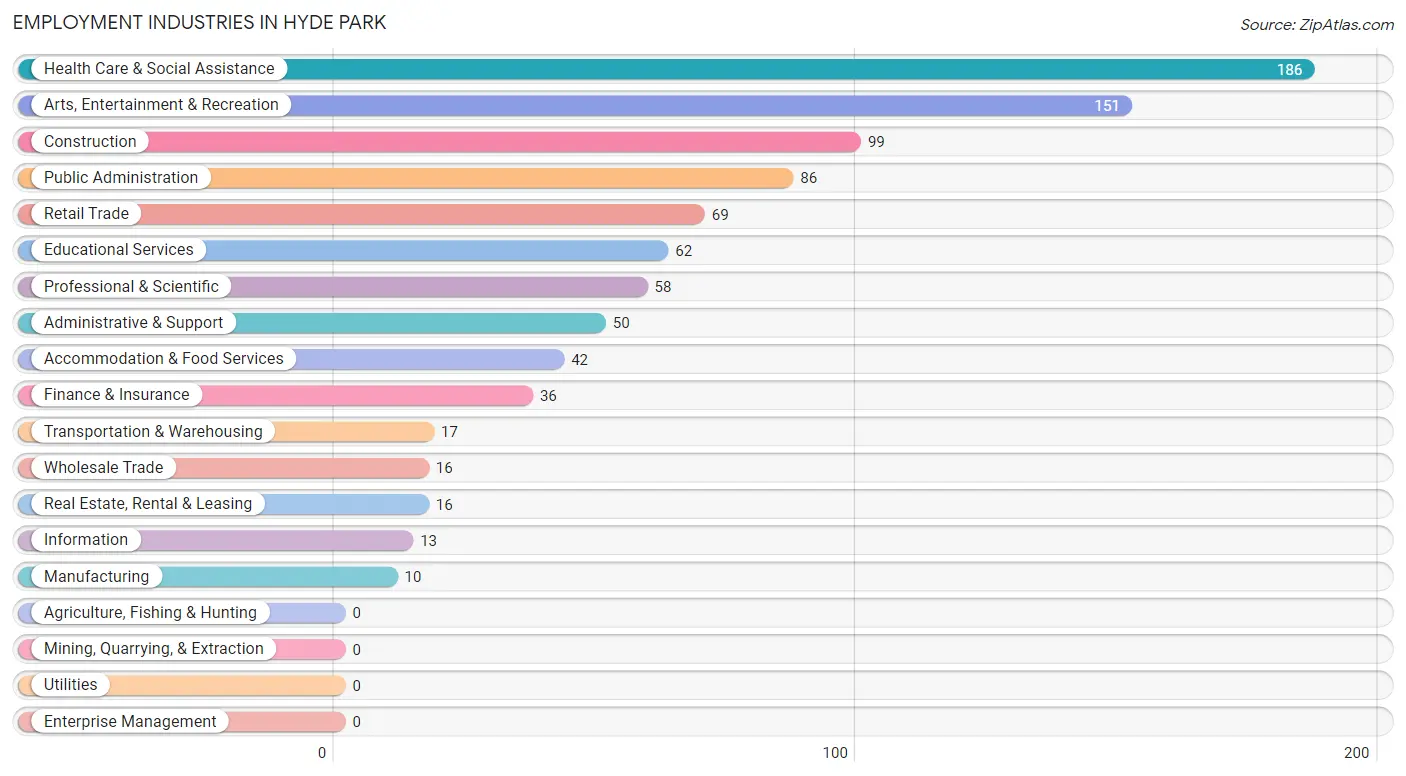
Employment Industries in Hyde Park
The major employment industries in Hyde Park include Health Care & Social Assistance (186 | 20.2%), Arts, Entertainment & Recreation (151 | 16.4%), Construction (99 | 10.7%), Public Administration (86 | 9.3%), and Retail Trade (69 | 7.5%).
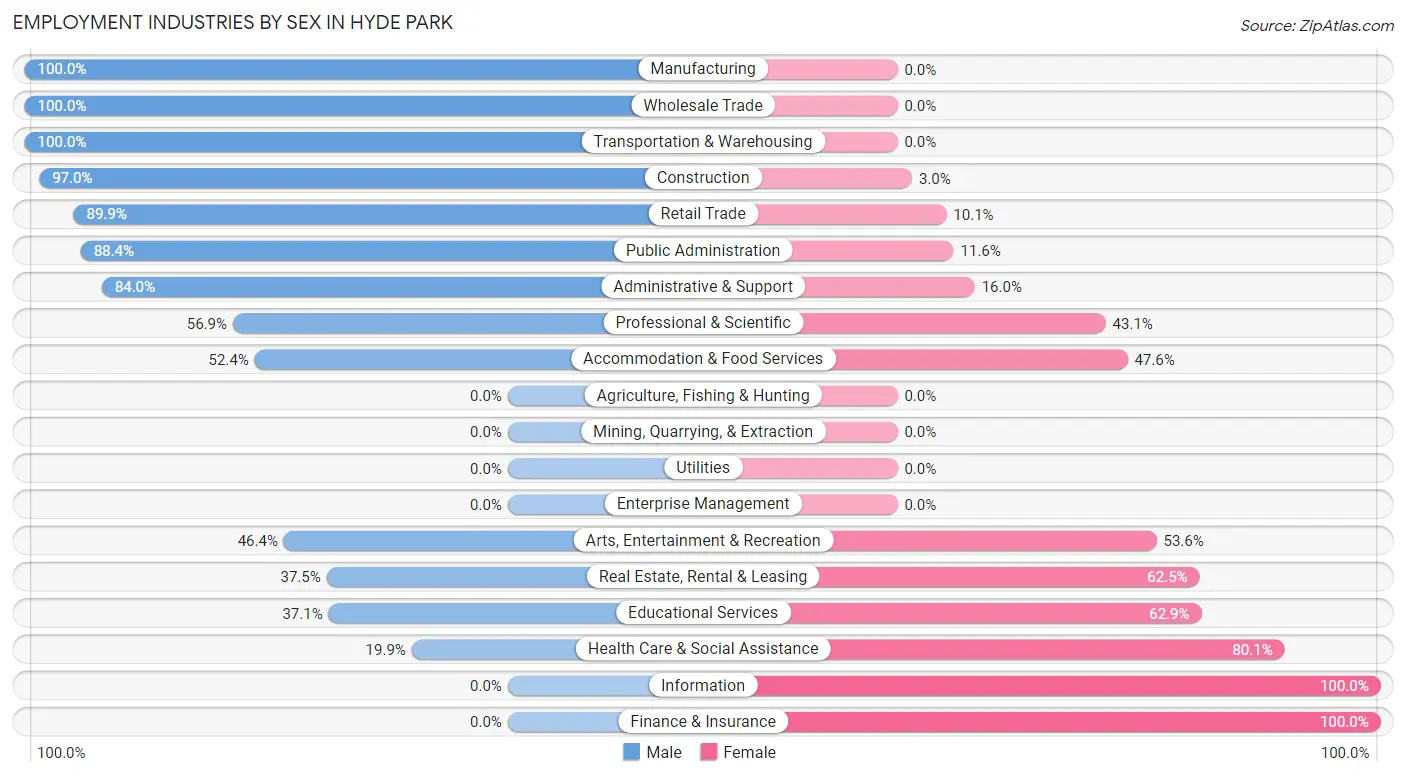
Employment Industries by Sex in Hyde Park
The Hyde Park industries that see more men than women are Manufacturing (100.0%), Wholesale Trade (100.0%), and Transportation & Warehousing (100.0%), whereas the industries that tend to have a higher number of women are Information (100.0%), Finance & Insurance (100.0%), and Health Care & Social Assistance (80.1%).
| Industry | Male | Female |
| Agriculture, Fishing & Hunting | 0 (0.0%) | 0 (0.0%) |
| Mining, Quarrying, & Extraction | 0 (0.0%) | 0 (0.0%) |
| Construction | 96 (97.0%) | 3 (3.0%) |
| Manufacturing | 10 (100.0%) | 0 (0.0%) |
| Wholesale Trade | 16 (100.0%) | 0 (0.0%) |
| Retail Trade | 62 (89.9%) | 7 (10.1%) |
| Transportation & Warehousing | 17 (100.0%) | 0 (0.0%) |
| Utilities | 0 (0.0%) | 0 (0.0%) |
| Information | 0 (0.0%) | 13 (100.0%) |
| Finance & Insurance | 0 (0.0%) | 36 (100.0%) |
| Real Estate, Rental & Leasing | 6 (37.5%) | 10 (62.5%) |
| Professional & Scientific | 33 (56.9%) | 25 (43.1%) |
| Enterprise Management | 0 (0.0%) | 0 (0.0%) |
| Administrative & Support | 42 (84.0%) | 8 (16.0%) |
| Educational Services | 23 (37.1%) | 39 (62.9%) |
| Health Care & Social Assistance | 37 (19.9%) | 149 (80.1%) |
| Arts, Entertainment & Recreation | 70 (46.4%) | 81 (53.6%) |
| Accommodation & Food Services | 22 (52.4%) | 20 (47.6%) |
| Public Administration | 76 (88.4%) | 10 (11.6%) |
| Total | 510 (55.2%) | 413 (44.8%) |
Education in Hyde Park
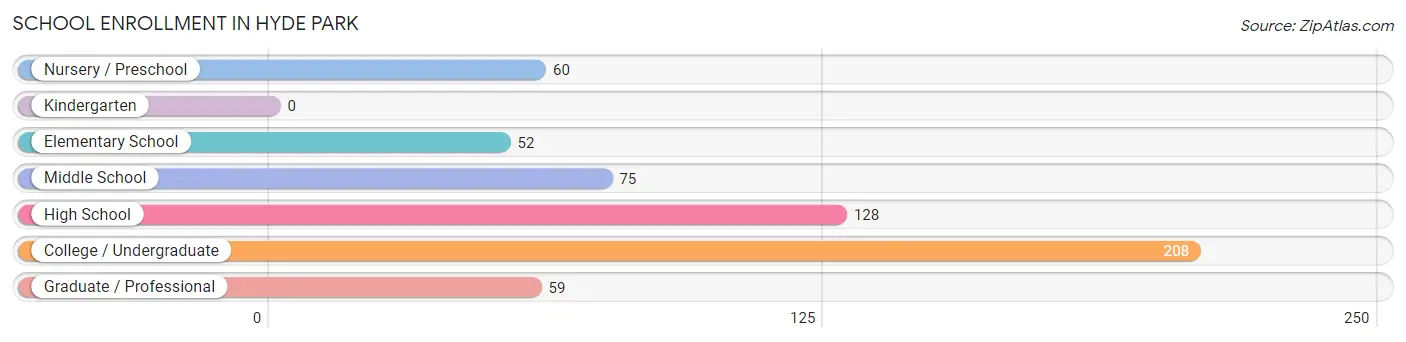
School Enrollment in Hyde Park
The most common levels of schooling among the 582 students in Hyde Park are college / undergraduate (208 | 35.7%), high school (128 | 22.0%), and middle school (75 | 12.9%).
| School Level | # Students | % Students |
| Nursery / Preschool | 60 | 10.3% |
| Kindergarten | 0 | 0.0% |
| Elementary School | 52 | 8.9% |
| Middle School | 75 | 12.9% |
| High School | 128 | 22.0% |
| College / Undergraduate | 208 | 35.7% |
| Graduate / Professional | 59 | 10.1% |
| Total | 582 | 100.0% |
School Enrollment by Age by Funding Source in Hyde Park
Out of a total of 582 students who are enrolled in schools in Hyde Park, 192 (33.0%) attend a private institution, while the remaining 390 (67.0%) are enrolled in public schools. The age group of 25 to 34 year olds has the highest likelihood of being enrolled in private schools, with 29 (100.0% in the age bracket) enrolled. Conversely, the age group of 5 to 9 year old has the lowest likelihood of being enrolled in a private school, with 52 (100.0% in the age bracket) attending a public institution.
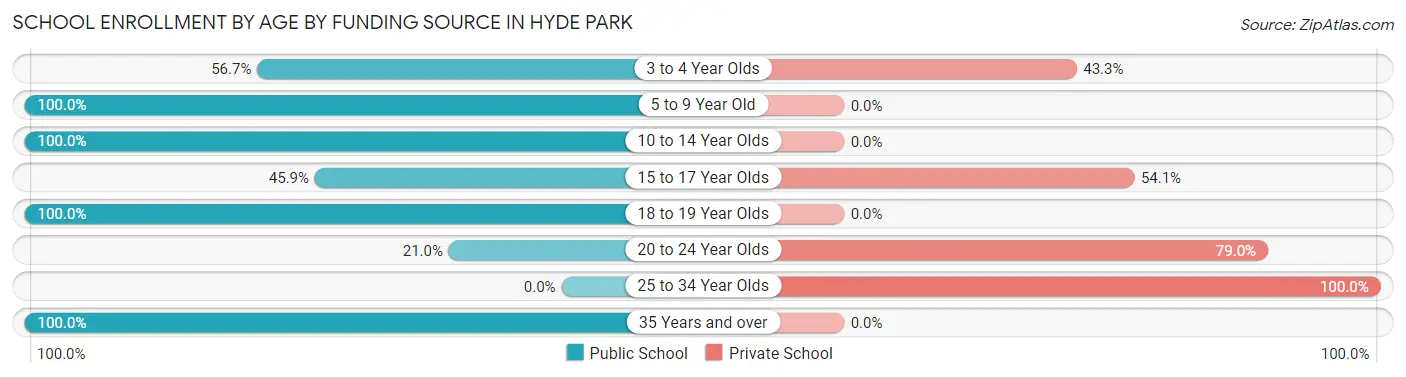
| Age Bracket | Public School | Private School |
| 3 to 4 Year Olds | 34 (56.7%) | 26 (43.3%) |
| 5 to 9 Year Old | 52 (100.0%) | 0 (0.0%) |
| 10 to 14 Year Olds | 75 (100.0%) | 0 (0.0%) |
| 15 to 17 Year Olds | 62 (45.9%) | 73 (54.1%) |
| 18 to 19 Year Olds | 83 (100.0%) | 0 (0.0%) |
| 20 to 24 Year Olds | 17 (21.0%) | 64 (79.0%) |
| 25 to 34 Year Olds | 0 (0.0%) | 29 (100.0%) |
| 35 Years and over | 67 (100.0%) | 0 (0.0%) |
| Total | 390 (67.0%) | 192 (33.0%) |
Educational Attainment by Field of Study in Hyde Park
Science & technology (97 | 18.1%), education (63 | 11.7%), business (53 | 9.9%), arts & humanities (47 | 8.7%), and visual & performing arts (46 | 8.6%) are the most common fields of study among 537 individuals in Hyde Park who have obtained a bachelor's degree or higher.
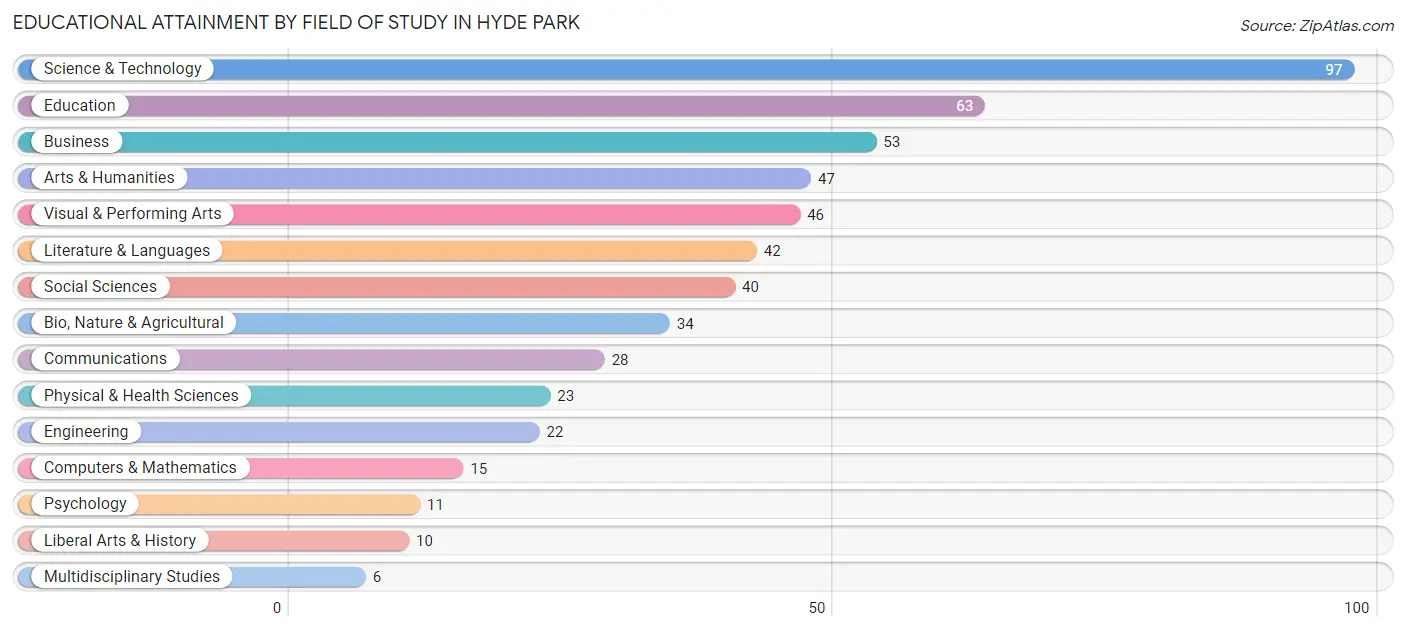
| Field of Study | # Graduates | % Graduates |
| Computers & Mathematics | 15 | 2.8% |
| Bio, Nature & Agricultural | 34 | 6.3% |
| Physical & Health Sciences | 23 | 4.3% |
| Psychology | 11 | 2.1% |
| Social Sciences | 40 | 7.4% |
| Engineering | 22 | 4.1% |
| Multidisciplinary Studies | 6 | 1.1% |
| Science & Technology | 97 | 18.1% |
| Business | 53 | 9.9% |
| Education | 63 | 11.7% |
| Literature & Languages | 42 | 7.8% |
| Liberal Arts & History | 10 | 1.9% |
| Visual & Performing Arts | 46 | 8.6% |
| Communications | 28 | 5.2% |
| Arts & Humanities | 47 | 8.7% |
| Total | 537 | 100.0% |
Transportation & Commute in Hyde Park
Vehicle Availability by Sex in Hyde Park
The most prevalent vehicle ownership categories in Hyde Park are males with 2 vehicles (232, accounting for 47.0%) and females with 2 vehicles (244, making up 56.2%).
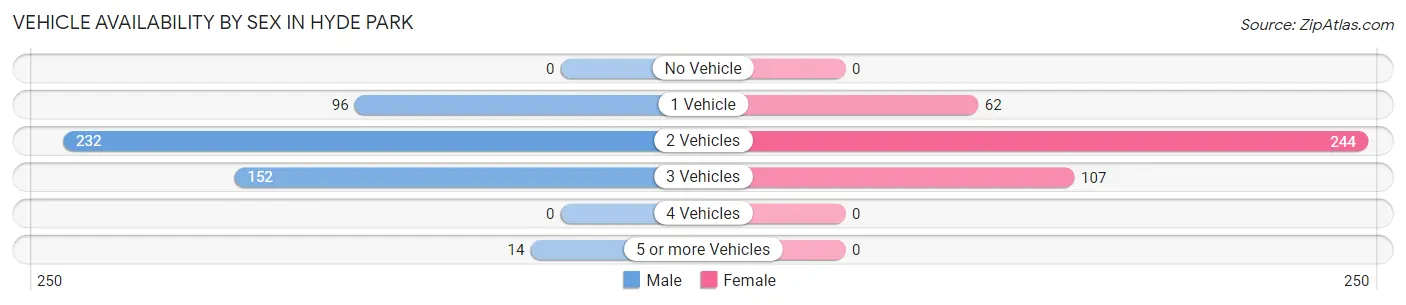
| Vehicles Available | Male | Female |
| No Vehicle | 0 (0.0%) | 0 (0.0%) |
| 1 Vehicle | 96 (19.4%) | 62 (15.0%) |
| 2 Vehicles | 232 (47.0%) | 244 (59.1%) |
| 3 Vehicles | 152 (30.8%) | 107 (25.9%) |
| 4 Vehicles | 0 (0.0%) | 0 (0.0%) |
| 5 or more Vehicles | 14 (2.8%) | 0 (0.0%) |
| Total | 494 (100.0%) | 413 (100.0%) |
Commute Time in Hyde Park
The most frequently occuring commute durations in Hyde Park are 15 to 19 minutes (250 commuters, 29.6%), 60 to 89 minutes (136 commuters, 16.1%), and 20 to 24 minutes (121 commuters, 14.3%).
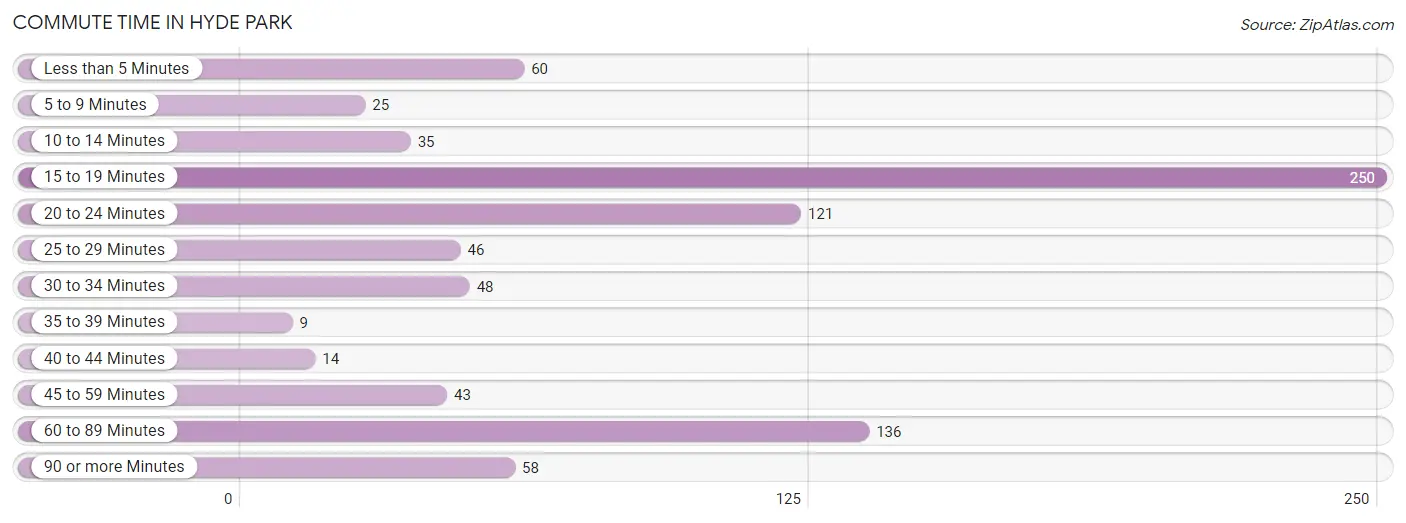
| Commute Time | # Commuters | % Commuters |
| Less than 5 Minutes | 60 | 7.1% |
| 5 to 9 Minutes | 25 | 3.0% |
| 10 to 14 Minutes | 35 | 4.1% |
| 15 to 19 Minutes | 250 | 29.6% |
| 20 to 24 Minutes | 121 | 14.3% |
| 25 to 29 Minutes | 46 | 5.4% |
| 30 to 34 Minutes | 48 | 5.7% |
| 35 to 39 Minutes | 9 | 1.1% |
| 40 to 44 Minutes | 14 | 1.7% |
| 45 to 59 Minutes | 43 | 5.1% |
| 60 to 89 Minutes | 136 | 16.1% |
| 90 or more Minutes | 58 | 6.9% |
Commute Time by Sex in Hyde Park
The most common commute times in Hyde Park are 60 to 89 minutes (112 commuters, 24.8%) for males and 15 to 19 minutes (194 commuters, 49.2%) for females.
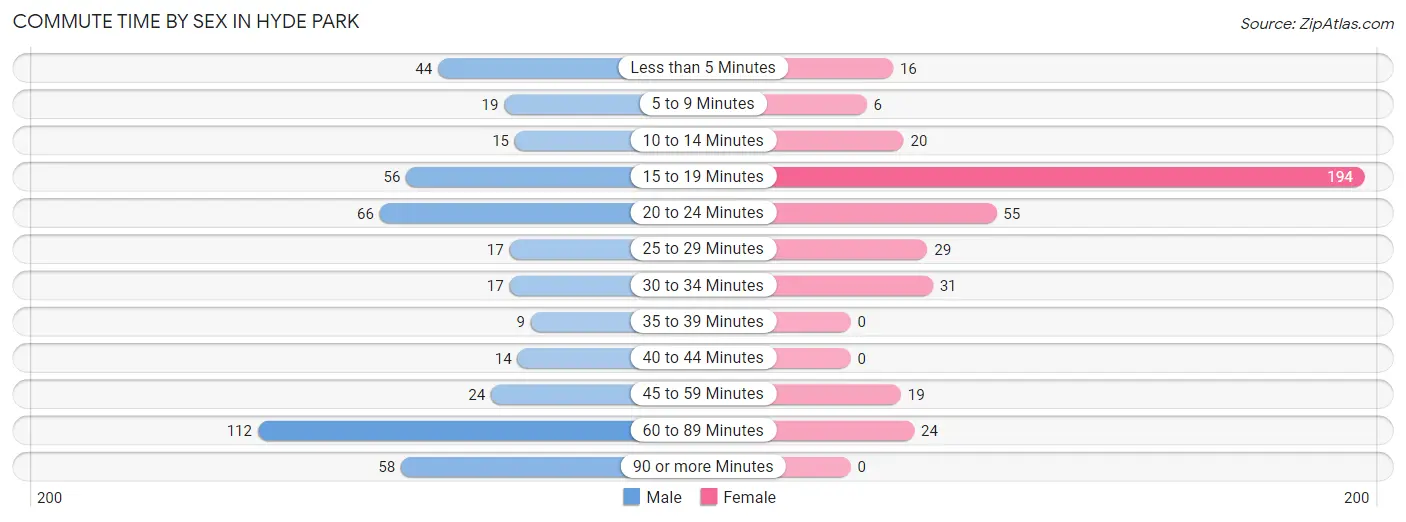
| Commute Time | Male | Female |
| Less than 5 Minutes | 44 (9.8%) | 16 (4.1%) |
| 5 to 9 Minutes | 19 (4.2%) | 6 (1.5%) |
| 10 to 14 Minutes | 15 (3.3%) | 20 (5.1%) |
| 15 to 19 Minutes | 56 (12.4%) | 194 (49.2%) |
| 20 to 24 Minutes | 66 (14.6%) | 55 (14.0%) |
| 25 to 29 Minutes | 17 (3.8%) | 29 (7.4%) |
| 30 to 34 Minutes | 17 (3.8%) | 31 (7.9%) |
| 35 to 39 Minutes | 9 (2.0%) | 0 (0.0%) |
| 40 to 44 Minutes | 14 (3.1%) | 0 (0.0%) |
| 45 to 59 Minutes | 24 (5.3%) | 19 (4.8%) |
| 60 to 89 Minutes | 112 (24.8%) | 24 (6.1%) |
| 90 or more Minutes | 58 (12.9%) | 0 (0.0%) |
Time of Departure to Work by Sex in Hyde Park
The most frequent times of departure to work in Hyde Park are 5:30 AM to 5:59 AM (114, 25.3%) for males and 6:30 AM to 6:59 AM (80, 20.3%) for females.
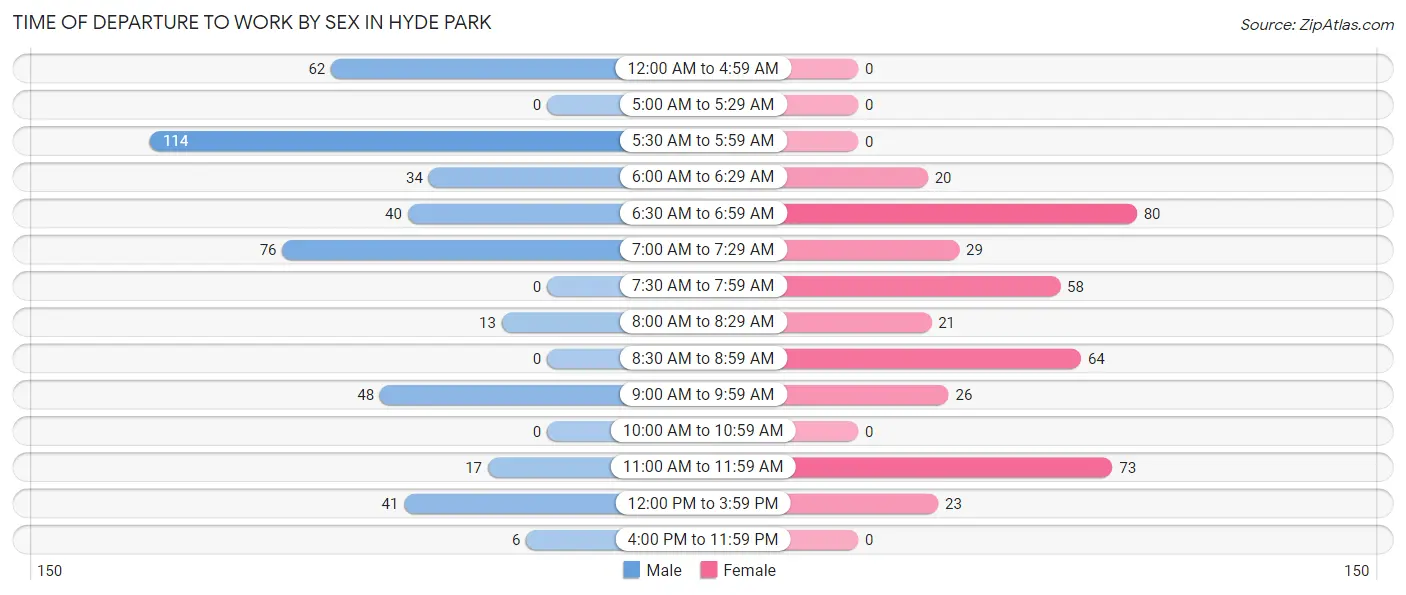
| Time of Departure | Male | Female |
| 12:00 AM to 4:59 AM | 62 (13.8%) | 0 (0.0%) |
| 5:00 AM to 5:29 AM | 0 (0.0%) | 0 (0.0%) |
| 5:30 AM to 5:59 AM | 114 (25.3%) | 0 (0.0%) |
| 6:00 AM to 6:29 AM | 34 (7.5%) | 20 (5.1%) |
| 6:30 AM to 6:59 AM | 40 (8.9%) | 80 (20.3%) |
| 7:00 AM to 7:29 AM | 76 (16.9%) | 29 (7.4%) |
| 7:30 AM to 7:59 AM | 0 (0.0%) | 58 (14.7%) |
| 8:00 AM to 8:29 AM | 13 (2.9%) | 21 (5.3%) |
| 8:30 AM to 8:59 AM | 0 (0.0%) | 64 (16.2%) |
| 9:00 AM to 9:59 AM | 48 (10.6%) | 26 (6.6%) |
| 10:00 AM to 10:59 AM | 0 (0.0%) | 0 (0.0%) |
| 11:00 AM to 11:59 AM | 17 (3.8%) | 73 (18.5%) |
| 12:00 PM to 3:59 PM | 41 (9.1%) | 23 (5.8%) |
| 4:00 PM to 11:59 PM | 6 (1.3%) | 0 (0.0%) |
| Total | 451 (100.0%) | 394 (100.0%) |
Housing Occupancy in Hyde Park
Occupancy by Ownership in Hyde Park
Of the total 914 dwellings in Hyde Park, owner-occupied units account for 665 (72.8%), while renter-occupied units make up 249 (27.2%).
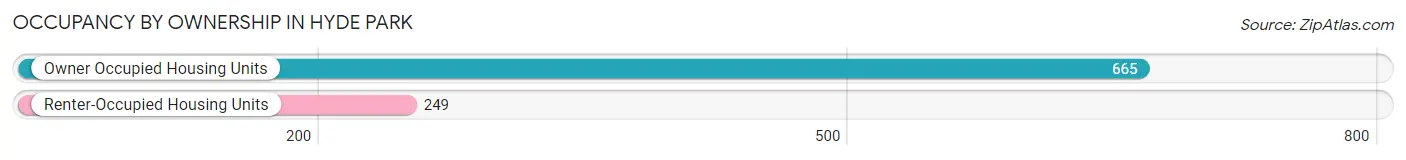
| Occupancy | # Housing Units | % Housing Units |
| Owner Occupied Housing Units | 665 | 72.8% |
| Renter-Occupied Housing Units | 249 | 27.2% |
| Total Occupied Housing Units | 914 | 100.0% |
Occupancy by Household Size in Hyde Park
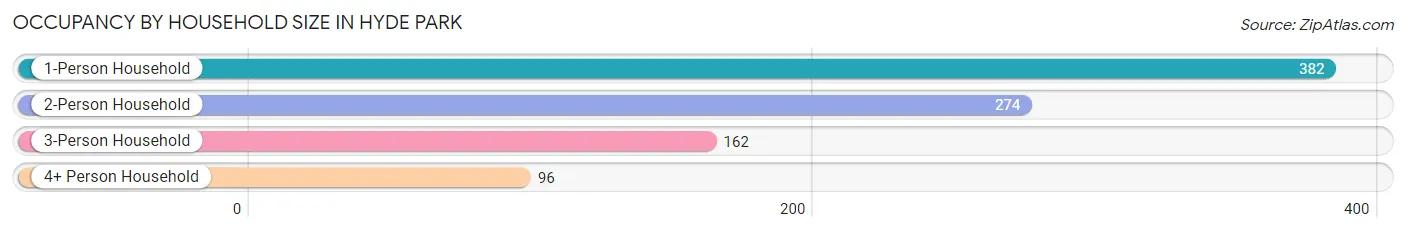
| Household Size | # Housing Units | % Housing Units |
| 1-Person Household | 382 | 41.8% |
| 2-Person Household | 274 | 30.0% |
| 3-Person Household | 162 | 17.7% |
| 4+ Person Household | 96 | 10.5% |
| Total Housing Units | 914 | 100.0% |
Occupancy by Ownership by Household Size in Hyde Park
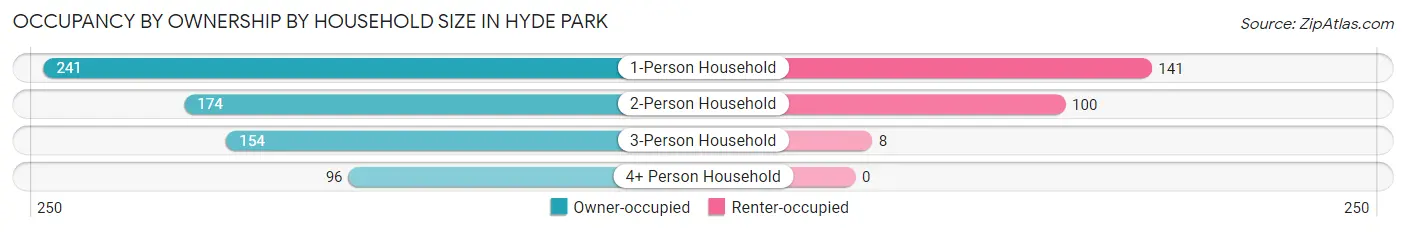
| Household Size | Owner-occupied | Renter-occupied |
| 1-Person Household | 241 (63.1%) | 141 (36.9%) |
| 2-Person Household | 174 (63.5%) | 100 (36.5%) |
| 3-Person Household | 154 (95.1%) | 8 (4.9%) |
| 4+ Person Household | 96 (100.0%) | 0 (0.0%) |
| Total Housing Units | 665 (72.8%) | 249 (27.2%) |
Occupancy by Educational Attainment in Hyde Park
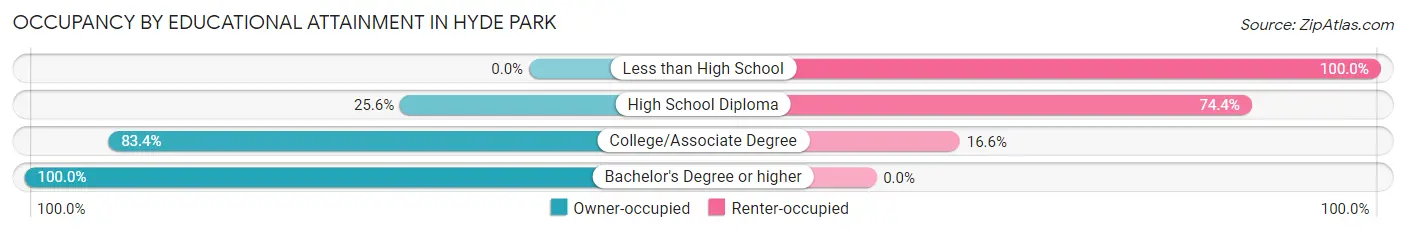
| Household Size | Owner-occupied | Renter-occupied |
| Less than High School | 0 (0.0%) | 50 (100.0%) |
| High School Diploma | 46 (25.6%) | 134 (74.4%) |
| College/Associate Degree | 327 (83.4%) | 65 (16.6%) |
| Bachelor's Degree or higher | 292 (100.0%) | 0 (0.0%) |
Occupancy by Age of Householder in Hyde Park
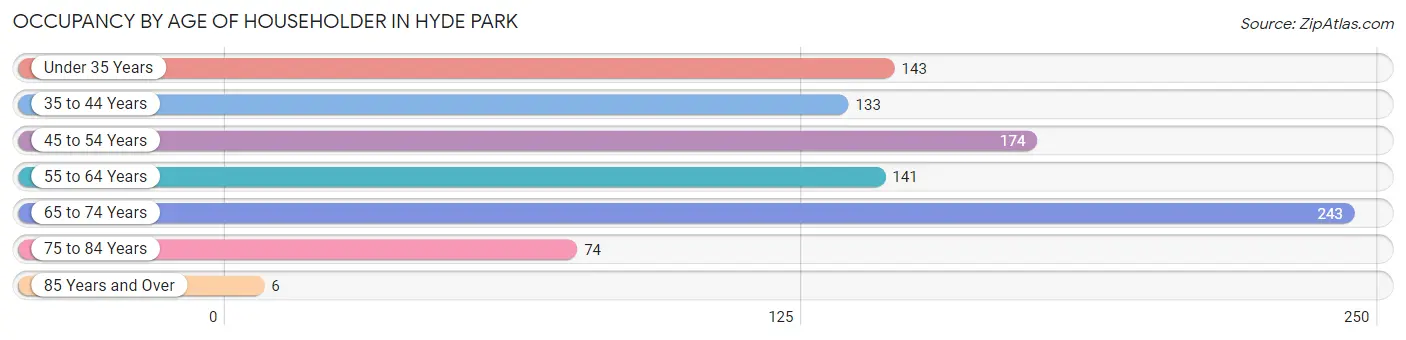
| Age Bracket | # Households | % Households |
| Under 35 Years | 143 | 15.7% |
| 35 to 44 Years | 133 | 14.5% |
| 45 to 54 Years | 174 | 19.0% |
| 55 to 64 Years | 141 | 15.4% |
| 65 to 74 Years | 243 | 26.6% |
| 75 to 84 Years | 74 | 8.1% |
| 85 Years and Over | 6 | 0.7% |
| Total | 914 | 100.0% |
Housing Finances in Hyde Park
Median Income by Occupancy in Hyde Park
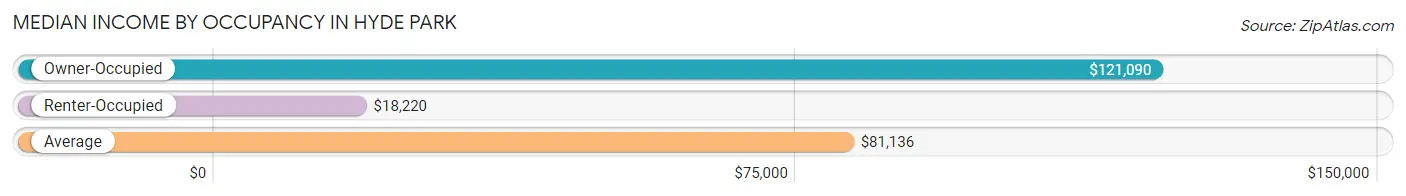
| Occupancy Type | # Households | Median Income |
| Owner-Occupied | 665 (72.8%) | $121,090 |
| Renter-Occupied | 249 (27.2%) | $18,220 |
| Average | 914 (100.0%) | $81,136 |
Occupancy by Householder Income Bracket in Hyde Park
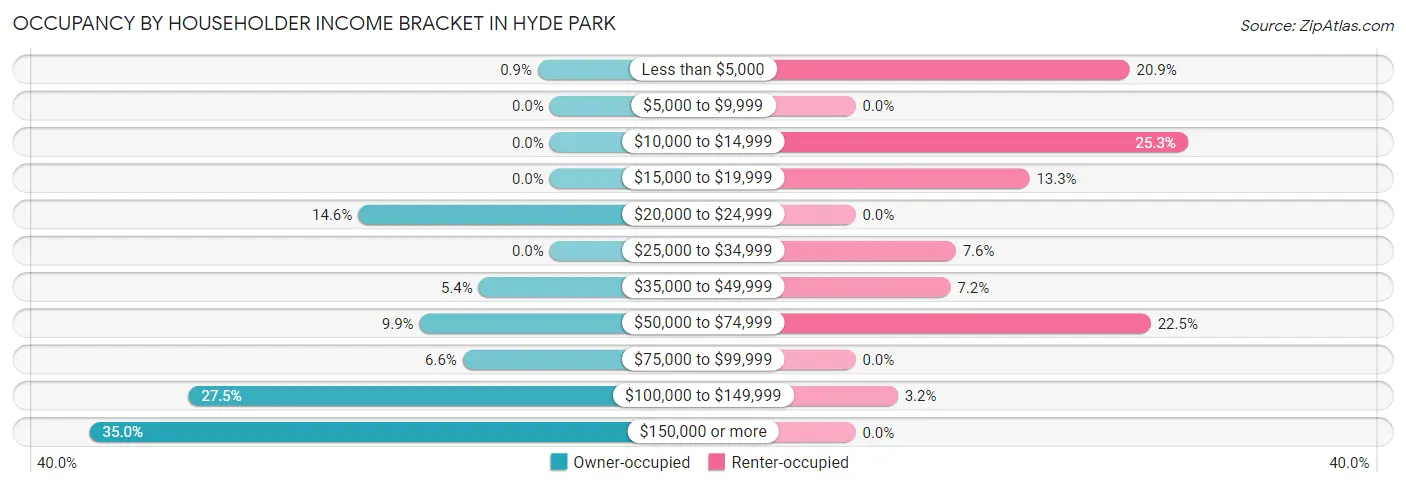
| Income Bracket | Owner-occupied | Renter-occupied |
| Less than $5,000 | 6 (0.9%) | 52 (20.9%) |
| $5,000 to $9,999 | 0 (0.0%) | 0 (0.0%) |
| $10,000 to $14,999 | 0 (0.0%) | 63 (25.3%) |
| $15,000 to $19,999 | 0 (0.0%) | 33 (13.3%) |
| $20,000 to $24,999 | 97 (14.6%) | 0 (0.0%) |
| $25,000 to $34,999 | 0 (0.0%) | 19 (7.6%) |
| $35,000 to $49,999 | 36 (5.4%) | 18 (7.2%) |
| $50,000 to $74,999 | 66 (9.9%) | 56 (22.5%) |
| $75,000 to $99,999 | 44 (6.6%) | 0 (0.0%) |
| $100,000 to $149,999 | 183 (27.5%) | 8 (3.2%) |
| $150,000 or more | 233 (35.0%) | 0 (0.0%) |
| Total | 665 (100.0%) | 249 (100.0%) |
Monthly Housing Cost Tiers in Hyde Park
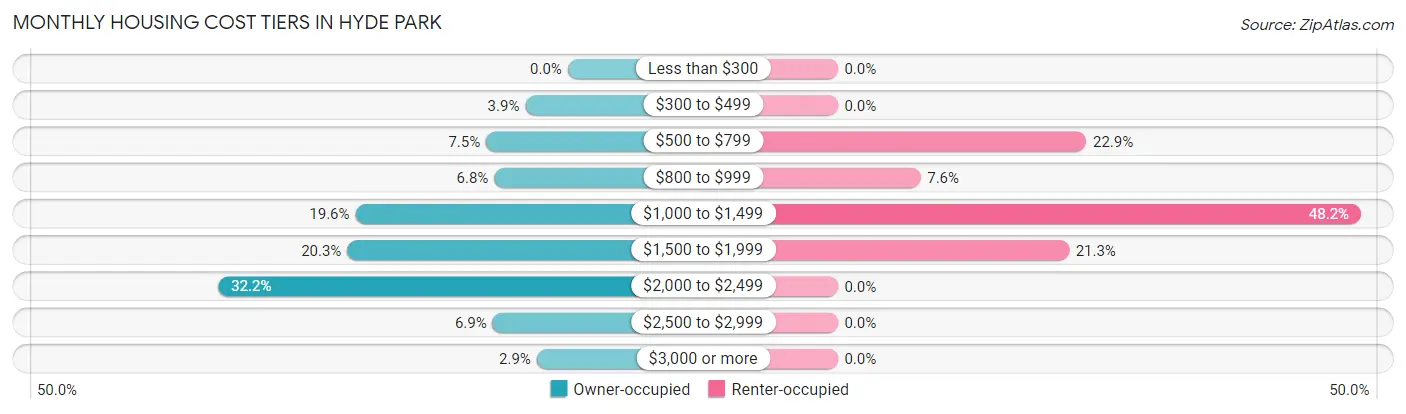
| Monthly Cost | Owner-occupied | Renter-occupied |
| Less than $300 | 0 (0.0%) | 0 (0.0%) |
| $300 to $499 | 26 (3.9%) | 0 (0.0%) |
| $500 to $799 | 50 (7.5%) | 57 (22.9%) |
| $800 to $999 | 45 (6.8%) | 19 (7.6%) |
| $1,000 to $1,499 | 130 (19.6%) | 120 (48.2%) |
| $1,500 to $1,999 | 135 (20.3%) | 53 (21.3%) |
| $2,000 to $2,499 | 214 (32.2%) | 0 (0.0%) |
| $2,500 to $2,999 | 46 (6.9%) | 0 (0.0%) |
| $3,000 or more | 19 (2.9%) | 0 (0.0%) |
| Total | 665 (100.0%) | 249 (100.0%) |
Physical Housing Characteristics in Hyde Park
Housing Structures in Hyde Park
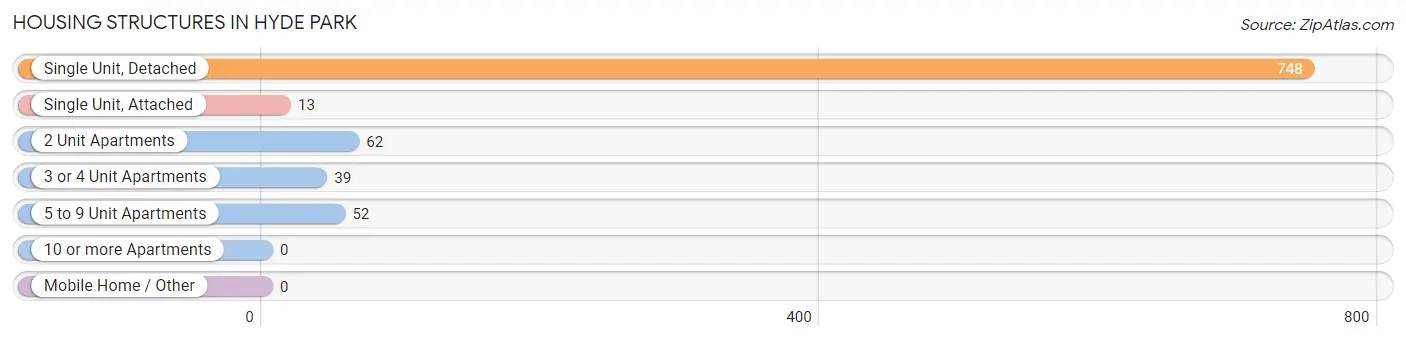
| Structure Type | # Housing Units | % Housing Units |
| Single Unit, Detached | 748 | 81.8% |
| Single Unit, Attached | 13 | 1.4% |
| 2 Unit Apartments | 62 | 6.8% |
| 3 or 4 Unit Apartments | 39 | 4.3% |
| 5 to 9 Unit Apartments | 52 | 5.7% |
| 10 or more Apartments | 0 | 0.0% |
| Mobile Home / Other | 0 | 0.0% |
| Total | 914 | 100.0% |
Housing Structures by Occupancy in Hyde Park
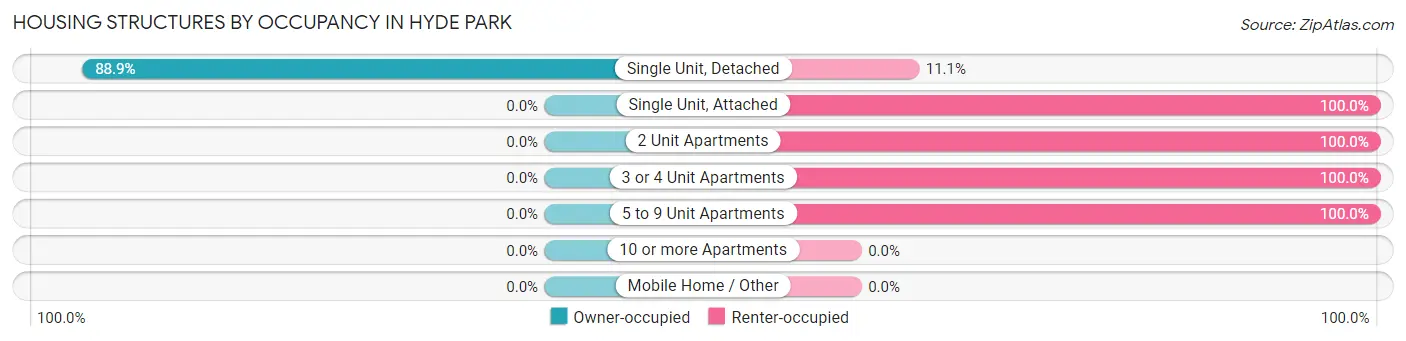
| Structure Type | Owner-occupied | Renter-occupied |
| Single Unit, Detached | 665 (88.9%) | 83 (11.1%) |
| Single Unit, Attached | 0 (0.0%) | 13 (100.0%) |
| 2 Unit Apartments | 0 (0.0%) | 62 (100.0%) |
| 3 or 4 Unit Apartments | 0 (0.0%) | 39 (100.0%) |
| 5 to 9 Unit Apartments | 0 (0.0%) | 52 (100.0%) |
| 10 or more Apartments | 0 (0.0%) | 0 (0.0%) |
| Mobile Home / Other | 0 (0.0%) | 0 (0.0%) |
| Total | 665 (72.8%) | 249 (27.2%) |
Housing Structures by Number of Rooms in Hyde Park
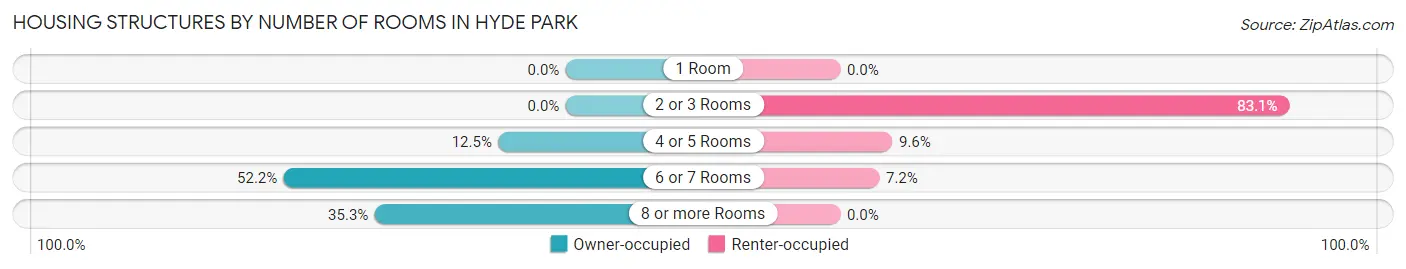
| Number of Rooms | Owner-occupied | Renter-occupied |
| 1 Room | 0 (0.0%) | 0 (0.0%) |
| 2 or 3 Rooms | 0 (0.0%) | 207 (83.1%) |
| 4 or 5 Rooms | 83 (12.5%) | 24 (9.6%) |
| 6 or 7 Rooms | 347 (52.2%) | 18 (7.2%) |
| 8 or more Rooms | 235 (35.3%) | 0 (0.0%) |
| Total | 665 (100.0%) | 249 (100.0%) |
Housing Structure by Heating Type in Hyde Park
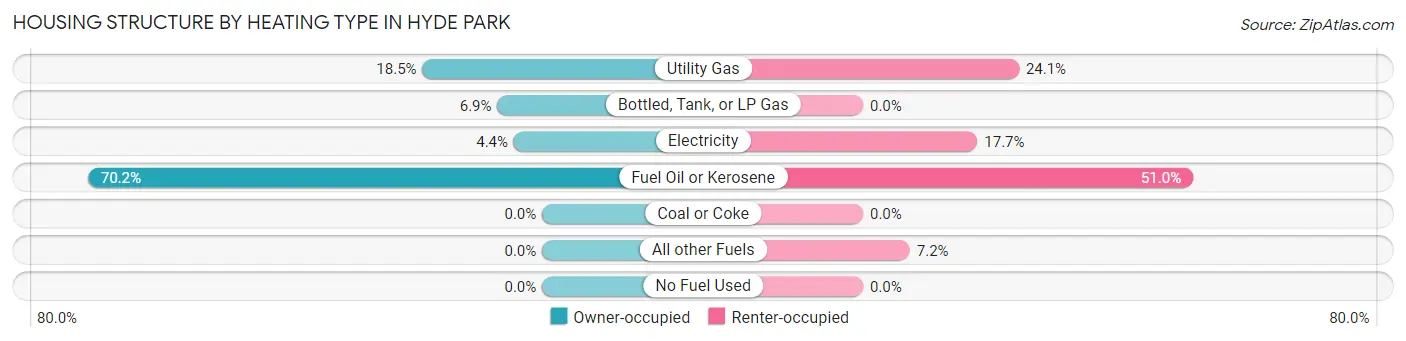
| Heating Type | Owner-occupied | Renter-occupied |
| Utility Gas | 123 (18.5%) | 60 (24.1%) |
| Bottled, Tank, or LP Gas | 46 (6.9%) | 0 (0.0%) |
| Electricity | 29 (4.4%) | 44 (17.7%) |
| Fuel Oil or Kerosene | 467 (70.2%) | 127 (51.0%) |
| Coal or Coke | 0 (0.0%) | 0 (0.0%) |
| All other Fuels | 0 (0.0%) | 18 (7.2%) |
| No Fuel Used | 0 (0.0%) | 0 (0.0%) |
| Total | 665 (100.0%) | 249 (100.0%) |
Household Vehicle Usage in Hyde Park
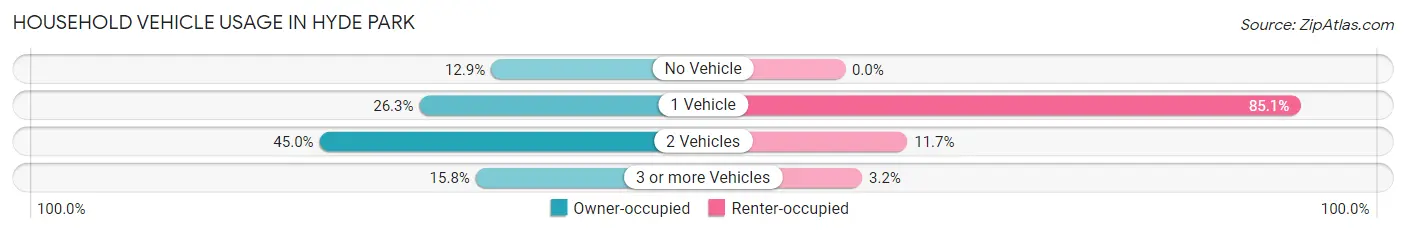
| Vehicles per Household | Owner-occupied | Renter-occupied |
| No Vehicle | 86 (12.9%) | 0 (0.0%) |
| 1 Vehicle | 175 (26.3%) | 212 (85.1%) |
| 2 Vehicles | 299 (45.0%) | 29 (11.7%) |
| 3 or more Vehicles | 105 (15.8%) | 8 (3.2%) |
| Total | 665 (100.0%) | 249 (100.0%) |
Real Estate & Mortgages in Hyde Park
Real Estate and Mortgage Overview in Hyde Park
| Characteristic | Without Mortgage | With Mortgage |
| Housing Units | 263 | 402 |
| Median Property Value | $285,700 | $272,600 |
| Median Household Income | - | - |
| Monthly Housing Costs | $1,122 | $19 |
| Real Estate Taxes | $6,619 | $0 |
Property Value by Mortgage Status in Hyde Park
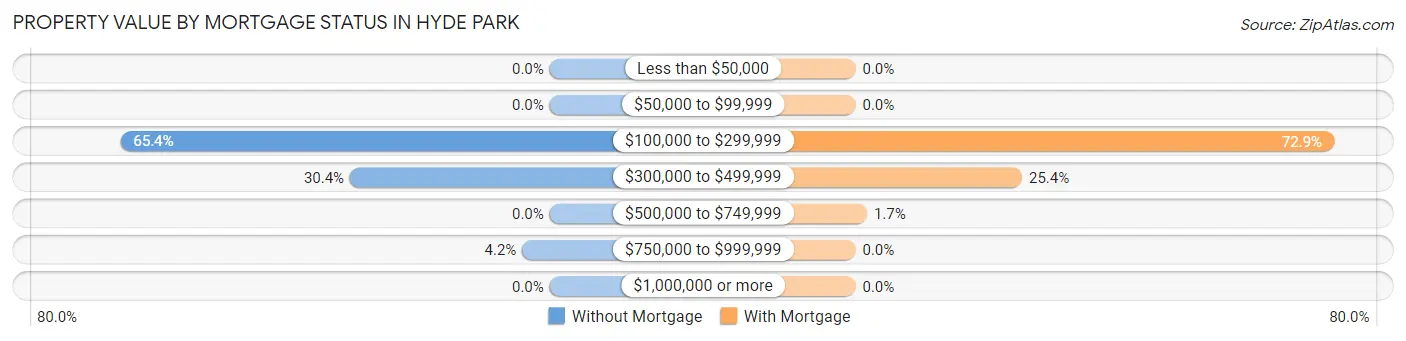
| Property Value | Without Mortgage | With Mortgage |
| Less than $50,000 | 0 (0.0%) | 0 (0.0%) |
| $50,000 to $99,999 | 0 (0.0%) | 0 (0.0%) |
| $100,000 to $299,999 | 172 (65.4%) | 293 (72.9%) |
| $300,000 to $499,999 | 80 (30.4%) | 102 (25.4%) |
| $500,000 to $749,999 | 0 (0.0%) | 7 (1.7%) |
| $750,000 to $999,999 | 11 (4.2%) | 0 (0.0%) |
| $1,000,000 or more | 0 (0.0%) | 0 (0.0%) |
| Total | 263 (100.0%) | 402 (100.0%) |
Household Income by Mortgage Status in Hyde Park
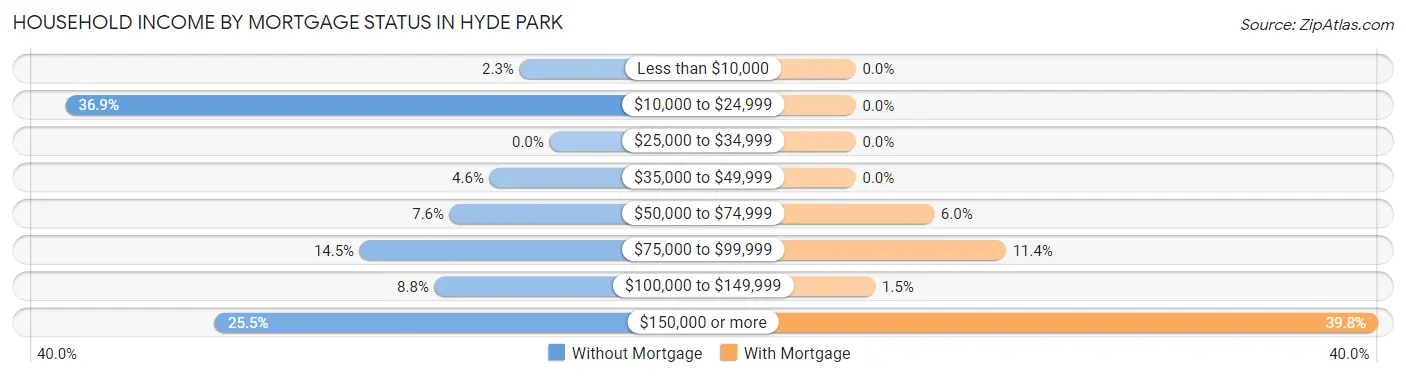
| Household Income | Without Mortgage | With Mortgage |
| Less than $10,000 | 6 (2.3%) | 0 (0.0%) |
| $10,000 to $24,999 | 97 (36.9%) | 0 (0.0%) |
| $25,000 to $34,999 | 0 (0.0%) | 0 (0.0%) |
| $35,000 to $49,999 | 12 (4.6%) | 0 (0.0%) |
| $50,000 to $74,999 | 20 (7.6%) | 24 (6.0%) |
| $75,000 to $99,999 | 38 (14.4%) | 46 (11.4%) |
| $100,000 to $149,999 | 23 (8.7%) | 6 (1.5%) |
| $150,000 or more | 67 (25.5%) | 160 (39.8%) |
| Total | 263 (100.0%) | 402 (100.0%) |
Property Value to Household Income Ratio in Hyde Park
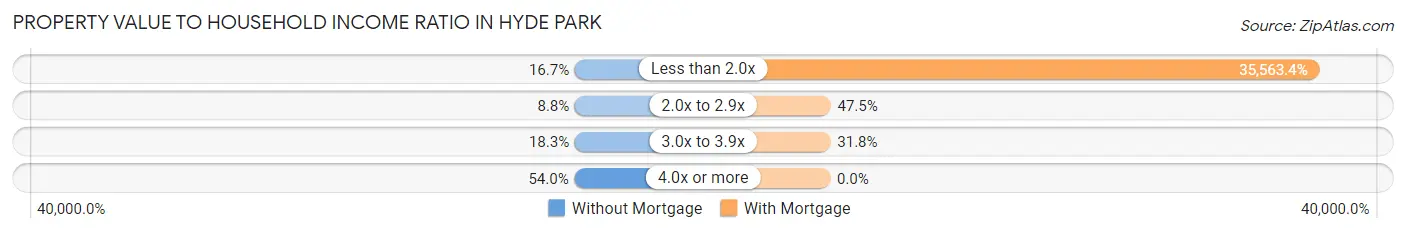
| Value-to-Income Ratio | Without Mortgage | With Mortgage |
| Less than 2.0x | 44 (16.7%) | 142,965 (35,563.4%) |
| 2.0x to 2.9x | 23 (8.7%) | 191 (47.5%) |
| 3.0x to 3.9x | 48 (18.2%) | 128 (31.8%) |
| 4.0x or more | 142 (54.0%) | 0 (0.0%) |
| Total | 263 (100.0%) | 402 (100.0%) |
Real Estate Taxes by Mortgage Status in Hyde Park
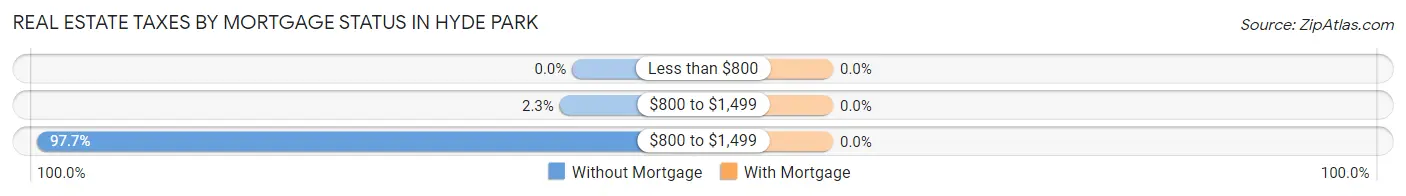
| Property Taxes | Without Mortgage | With Mortgage |
| Less than $800 | 0 (0.0%) | 0 (0.0%) |
| $800 to $1,499 | 6 (2.3%) | 0 (0.0%) |
| $800 to $1,499 | 257 (97.7%) | 0 (0.0%) |
| Total | 263 (100.0%) | 402 (100.0%) |
Health & Disability in Hyde Park
Health Insurance Coverage by Age in Hyde Park
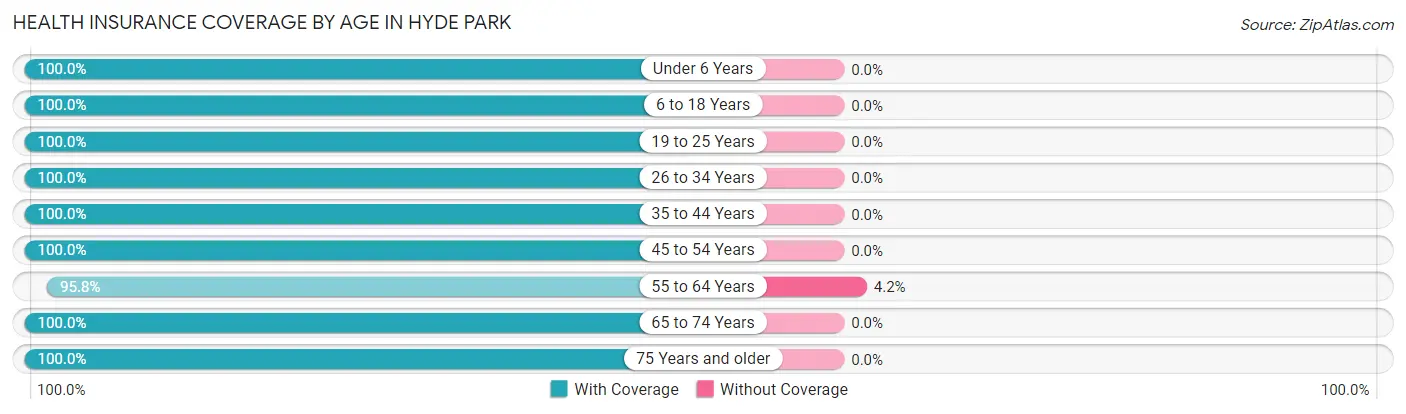
| Age Bracket | With Coverage | Without Coverage |
| Under 6 Years | 75 (100.0%) | 0 (0.0%) |
| 6 to 18 Years | 292 (100.0%) | 0 (0.0%) |
| 19 to 25 Years | 235 (100.0%) | 0 (0.0%) |
| 26 to 34 Years | 182 (100.0%) | 0 (0.0%) |
| 35 to 44 Years | 242 (100.0%) | 0 (0.0%) |
| 45 to 54 Years | 249 (100.0%) | 0 (0.0%) |
| 55 to 64 Years | 251 (95.8%) | 11 (4.2%) |
| 65 to 74 Years | 313 (100.0%) | 0 (0.0%) |
| 75 Years and older | 113 (100.0%) | 0 (0.0%) |
| Total | 1,952 (99.4%) | 11 (0.6%) |
Health Insurance Coverage by Citizenship Status in Hyde Park
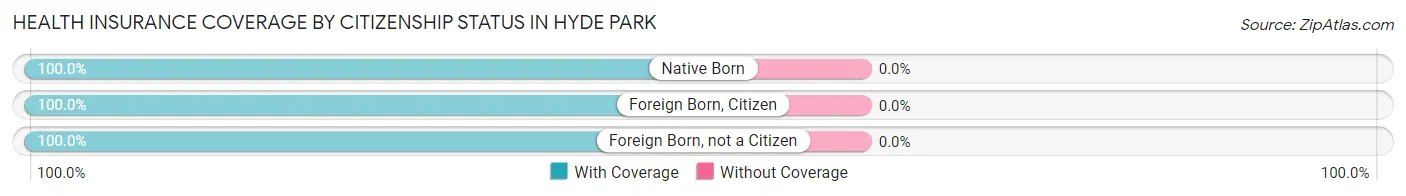
| Citizenship Status | With Coverage | Without Coverage |
| Native Born | 75 (100.0%) | 0 (0.0%) |
| Foreign Born, Citizen | 292 (100.0%) | 0 (0.0%) |
| Foreign Born, not a Citizen | 235 (100.0%) | 0 (0.0%) |
Health Insurance Coverage by Household Income in Hyde Park
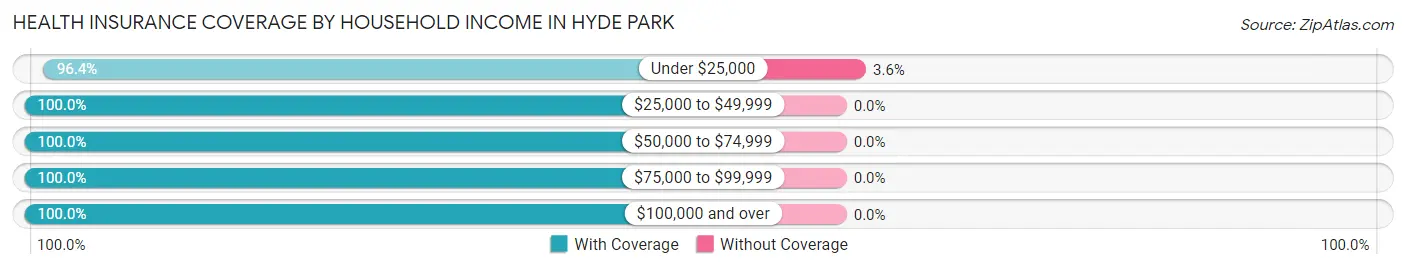
| Household Income | With Coverage | Without Coverage |
| Under $25,000 | 293 (96.4%) | 11 (3.6%) |
| $25,000 to $49,999 | 131 (100.0%) | 0 (0.0%) |
| $50,000 to $74,999 | 164 (100.0%) | 0 (0.0%) |
| $75,000 to $99,999 | 139 (100.0%) | 0 (0.0%) |
| $100,000 and over | 1,186 (100.0%) | 0 (0.0%) |
Public vs Private Health Insurance Coverage by Age in Hyde Park
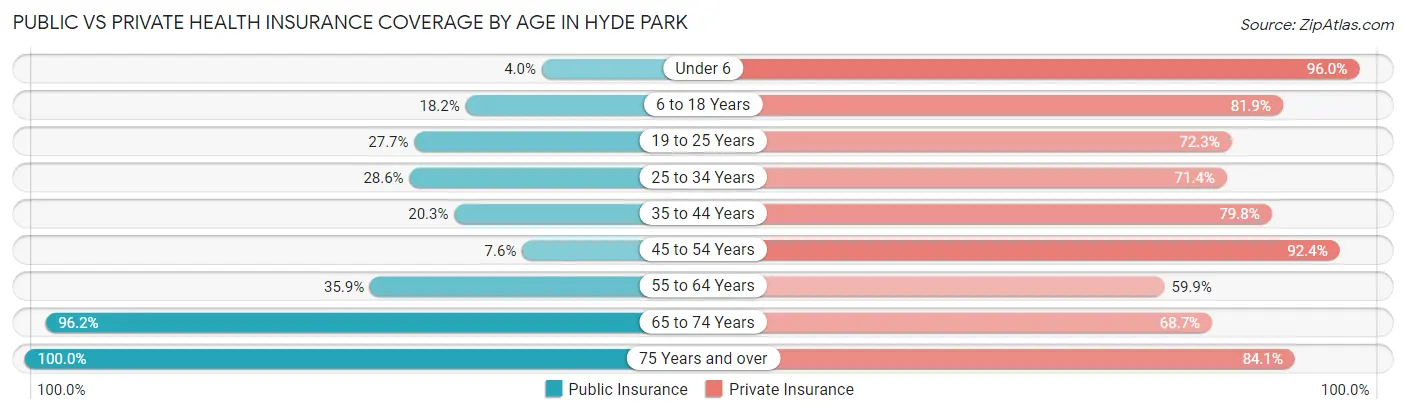
| Age Bracket | Public Insurance | Private Insurance |
| Under 6 | 3 (4.0%) | 72 (96.0%) |
| 6 to 18 Years | 53 (18.1%) | 239 (81.9%) |
| 19 to 25 Years | 65 (27.7%) | 170 (72.3%) |
| 25 to 34 Years | 52 (28.6%) | 130 (71.4%) |
| 35 to 44 Years | 49 (20.3%) | 193 (79.7%) |
| 45 to 54 Years | 19 (7.6%) | 230 (92.4%) |
| 55 to 64 Years | 94 (35.9%) | 157 (59.9%) |
| 65 to 74 Years | 301 (96.2%) | 215 (68.7%) |
| 75 Years and over | 113 (100.0%) | 95 (84.1%) |
| Total | 749 (38.2%) | 1,501 (76.5%) |
Disability Status by Sex by Age in Hyde Park
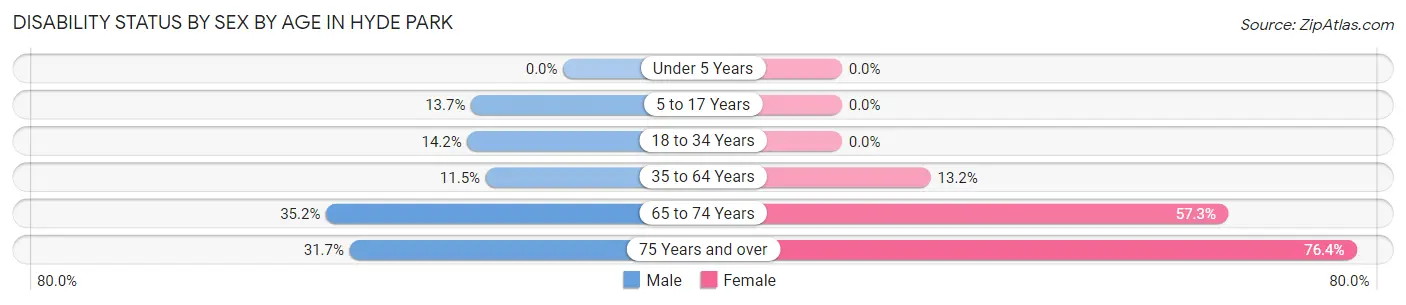
| Age Bracket | Male | Female |
| Under 5 Years | 0 (0.0%) | 0 (0.0%) |
| 5 to 17 Years | 13 (13.7%) | 0 (0.0%) |
| 18 to 34 Years | 39 (14.2%) | 0 (0.0%) |
| 35 to 64 Years | 43 (11.5%) | 50 (13.2%) |
| 65 to 74 Years | 50 (35.2%) | 98 (57.3%) |
| 75 Years and over | 13 (31.7%) | 55 (76.4%) |
Disability Class by Sex by Age in Hyde Park
Disability Class: Hearing Difficulty
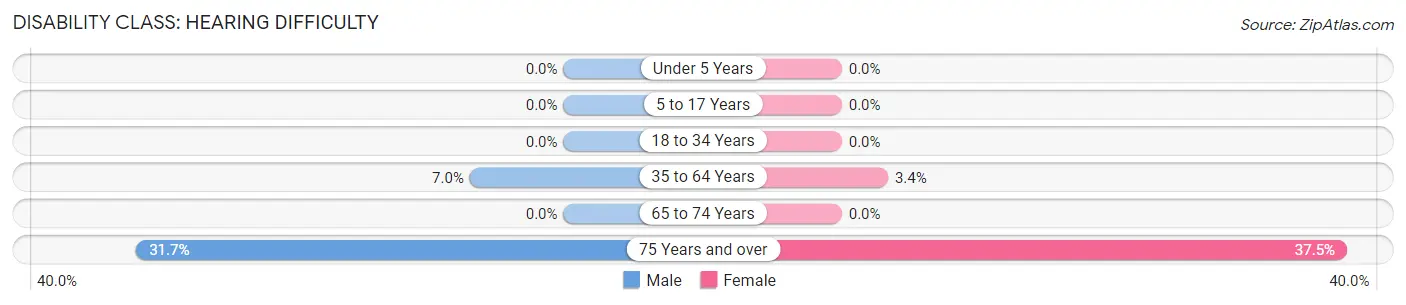
| Age Bracket | Male | Female |
| Under 5 Years | 0 (0.0%) | 0 (0.0%) |
| 5 to 17 Years | 0 (0.0%) | 0 (0.0%) |
| 18 to 34 Years | 0 (0.0%) | 0 (0.0%) |
| 35 to 64 Years | 26 (7.0%) | 13 (3.4%) |
| 65 to 74 Years | 0 (0.0%) | 0 (0.0%) |
| 75 Years and over | 13 (31.7%) | 27 (37.5%) |
Disability Class: Vision Difficulty
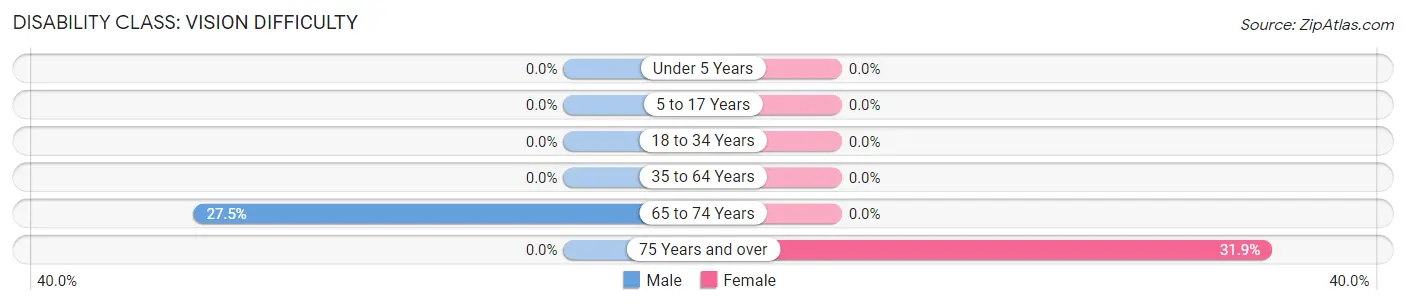
| Age Bracket | Male | Female |
| Under 5 Years | 0 (0.0%) | 0 (0.0%) |
| 5 to 17 Years | 0 (0.0%) | 0 (0.0%) |
| 18 to 34 Years | 0 (0.0%) | 0 (0.0%) |
| 35 to 64 Years | 0 (0.0%) | 0 (0.0%) |
| 65 to 74 Years | 39 (27.5%) | 0 (0.0%) |
| 75 Years and over | 0 (0.0%) | 23 (31.9%) |
Disability Class: Cognitive Difficulty
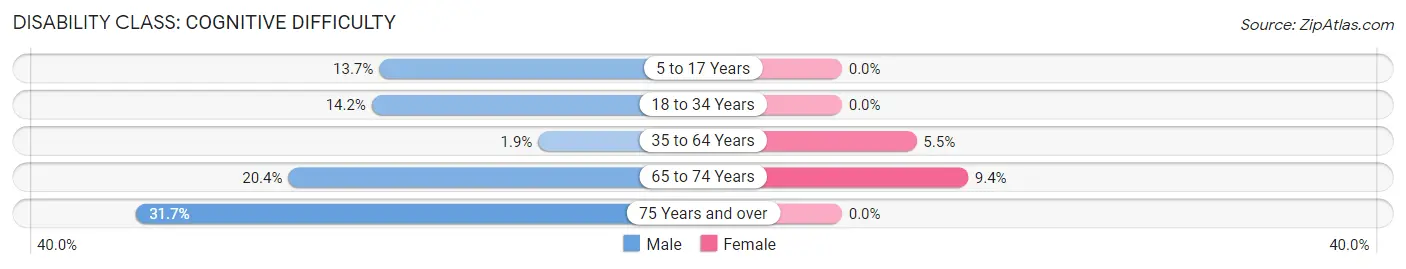
| Age Bracket | Male | Female |
| 5 to 17 Years | 13 (13.7%) | 0 (0.0%) |
| 18 to 34 Years | 39 (14.2%) | 0 (0.0%) |
| 35 to 64 Years | 7 (1.9%) | 21 (5.5%) |
| 65 to 74 Years | 29 (20.4%) | 16 (9.4%) |
| 75 Years and over | 13 (31.7%) | 0 (0.0%) |
Disability Class: Ambulatory Difficulty
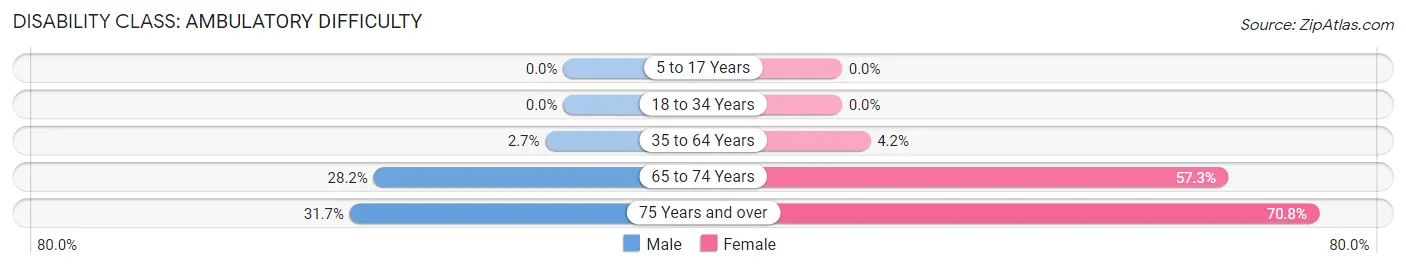
| Age Bracket | Male | Female |
| 5 to 17 Years | 0 (0.0%) | 0 (0.0%) |
| 18 to 34 Years | 0 (0.0%) | 0 (0.0%) |
| 35 to 64 Years | 10 (2.7%) | 16 (4.2%) |
| 65 to 74 Years | 40 (28.2%) | 98 (57.3%) |
| 75 Years and over | 13 (31.7%) | 51 (70.8%) |
Disability Class: Self-Care Difficulty
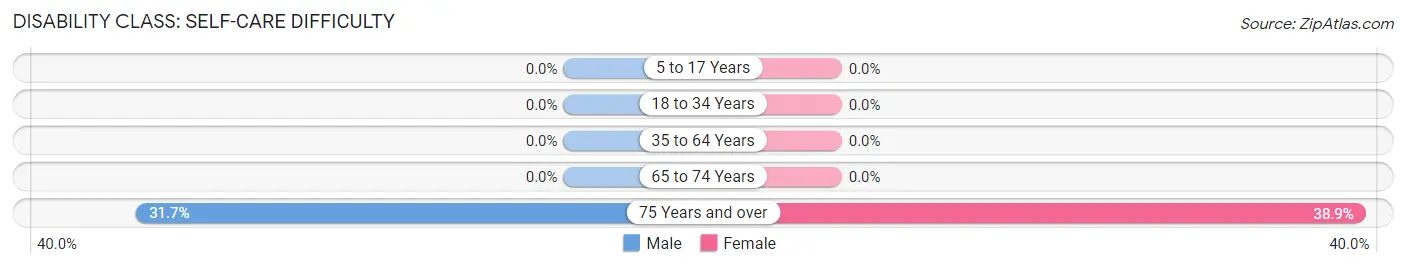
| Age Bracket | Male | Female |
| 5 to 17 Years | 0 (0.0%) | 0 (0.0%) |
| 18 to 34 Years | 0 (0.0%) | 0 (0.0%) |
| 35 to 64 Years | 0 (0.0%) | 0 (0.0%) |
| 65 to 74 Years | 0 (0.0%) | 0 (0.0%) |
| 75 Years and over | 13 (31.7%) | 28 (38.9%) |
Technology Access in Hyde Park
Computing Device Access in Hyde Park
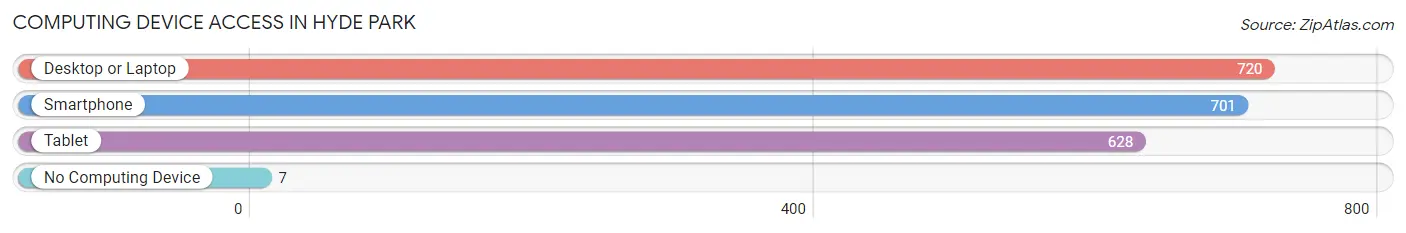
| Device Type | # Households | % Households |
| Desktop or Laptop | 720 | 78.8% |
| Smartphone | 701 | 76.7% |
| Tablet | 628 | 68.7% |
| No Computing Device | 7 | 0.8% |
| Total | 914 | 100.0% |
Internet Access in Hyde Park
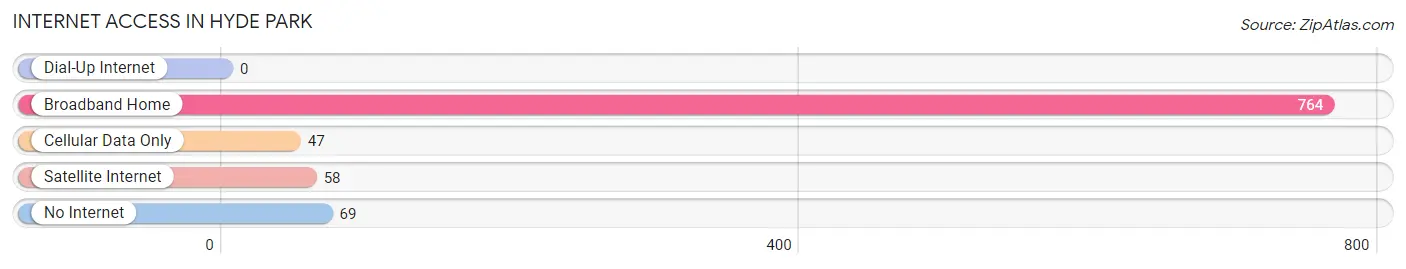
| Internet Type | # Households | % Households |
| Dial-Up Internet | 0 | 0.0% |
| Broadband Home | 764 | 83.6% |
| Cellular Data Only | 47 | 5.1% |
| Satellite Internet | 58 | 6.4% |
| No Internet | 69 | 7.5% |
| Total | 914 | 100.0% |
Hyde Park Summary
Hyde Park is a town located in Dutchess County, New York, United States. It is part of the Poughkeepsie–Newburgh–Middletown, NY Metropolitan Statistical Area. As of the 2010 census, the population was 21,571.
History
Hyde Park was first settled in 1742 by Dutch and English settlers. The town was originally part of the Great Nine Partners Patent of 1697. The town was named after the estate of Edward Hyde, who was the first Lord of the Manor of Hyde. The town was part of the Rombout Precinct until 1812, when it was incorporated as a town.
Geography
Hyde Park is located in the Hudson Valley, about 90 miles north of New York City. It is bordered by the towns of Poughkeepsie to the south, Pleasant Valley to the west, and Clinton to the east. The town is situated on the east bank of the Hudson River, and is home to the Franklin D. Roosevelt National Historic Site.
The town has a total area of 33.2 square miles, of which 32.7 square miles is land and 0.5 square miles is water. The terrain is mostly hilly, with some flat areas along the Hudson River.
Economy
The economy of Hyde Park is largely based on tourism. The town is home to the Franklin D. Roosevelt National Historic Site, which attracts thousands of visitors each year. The town is also home to the Culinary Institute of America, which is a major employer in the area. Other major employers include IBM, the Dutchess County government, and the Hyde Park Central School District.
Demographics
As of the 2010 census, there were 21,571 people, 8,717 households, and 5,845 families residing in the town. The population density was 659.2 people per square mile. The racial makeup of the town was 87.2% White, 6.2% African American, 0.3% Native American, 2.3% Asian, 0.1% Pacific Islander, 1.7% from other races, and 2.2% from two or more races. Hispanic or Latino of any race were 6.3% of the population.
The median income for a household in the town was $63,917, and the median income for a family was $76,917. The per capita income for the town was $30,917. About 4.2% of families and 6.3% of the population were below the poverty line, including 8.2% of those under age 18 and 4.2% of those age 65 or over.
Common Questions
What is Per Capita Income in Hyde Park?
Per Capita income in Hyde Park is $54,382.
What is the Median Family Income in Hyde Park?
Median Family Income in Hyde Park is $120,924.
What is the Median Household income in Hyde Park?
Median Household Income in Hyde Park is $81,136.
What is Income or Wage Gap in Hyde Park?
Income or Wage Gap in Hyde Park is 28.8%.
Women in Hyde Park earn 71.2 cents for every dollar earned by a man.
What is Inequality or Gini Index in Hyde Park?
Inequality or Gini Index in Hyde Park is 0.52.
What is the Total Population of Hyde Park?
Total Population of Hyde Park is 1,963.
What is the Total Male Population of Hyde Park?
Total Male Population of Hyde Park is 998.
What is the Total Female Population of Hyde Park?
Total Female Population of Hyde Park is 965.
What is the Ratio of Males per 100 Females in Hyde Park?
There are 103.42 Males per 100 Females in Hyde Park.
What is the Ratio of Females per 100 Males in Hyde Park?
There are 96.69 Females per 100 Males in Hyde Park.
What is the Median Population Age in Hyde Park?
Median Population Age in Hyde Park is 44.2 Years.
What is the Average Family Size in Hyde Park
Average Family Size in Hyde Park is 2.9 People.
What is the Average Household Size in Hyde Park
Average Household Size in Hyde Park is 2.1 People.
How Large is the Labor Force in Hyde Park?
There are 984 People in the Labor Forcein in Hyde Park.
What is the Percentage of People in the Labor Force in Hyde Park?
56.2% of People are in the Labor Force in Hyde Park.
What is the Unemployment Rate in Hyde Park?
Unemployment Rate in Hyde Park is 6.1%.