Yelm, WA Map & Demographics
Yelm Map
Yelm Overview
$31,622
PER CAPITA INCOME
$91,375
AVG FAMILY INCOME
$88,818
AVG HOUSEHOLD INCOME
45.5%
WAGE / INCOME GAP [ % ]
54.5¢/ $1
WAGE / INCOME GAP [ $ ]
0.31
INEQUALITY / GINI INDEX
10,438
TOTAL POPULATION
4,988
MALE POPULATION
5,450
FEMALE POPULATION
91.52
MALES / 100 FEMALES
109.26
FEMALES / 100 MALES
31.4
MEDIAN AGE
3.6
AVG FAMILY SIZE
3.1
AVG HOUSEHOLD SIZE
5,234
LABOR FORCE [ PEOPLE ]
68.6%
PERCENT IN LABOR FORCE
4.7%
UNEMPLOYMENT RATE
Yelm Zip Codes
Yelm Area Codes
Income in Yelm
Income Overview in Yelm
Per Capita Income in Yelm is $31,622, while median incomes of families and households are $91,375 and $88,818 respectively.
| Characteristic | Number | Measure |
| Per Capita Income | 10,438 | $31,622 |
| Median Family Income | 2,547 | $91,375 |
| Mean Family Income | 2,547 | $103,444 |
| Median Household Income | 3,314 | $88,818 |
| Mean Household Income | 3,314 | $95,235 |
| Income Deficit | 2,547 | $0 |
| Wage / Income Gap (%) | 10,438 | 45.50% |
| Wage / Income Gap ($) | 10,438 | 54.50¢ per $1 |
| Gini / Inequality Index | 10,438 | 0.31 |
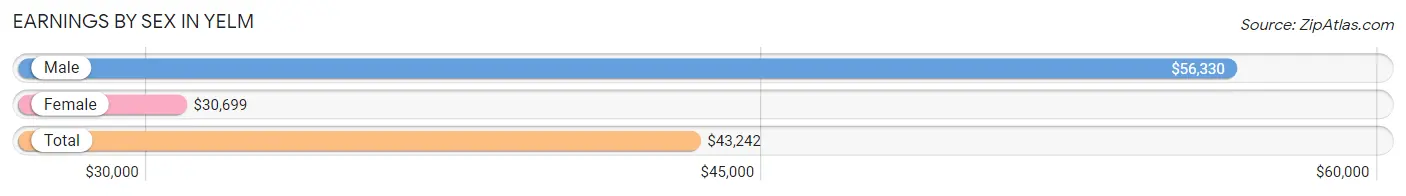
Earnings by Sex in Yelm
Average Earnings in Yelm are $43,242, $56,330 for men and $30,699 for women, a difference of 45.5%.
| Sex | Number | Average Earnings |
| Male | 2,856 (52.7%) | $56,330 |
| Female | 2,567 (47.3%) | $30,699 |
| Total | 5,423 (100.0%) | $43,242 |
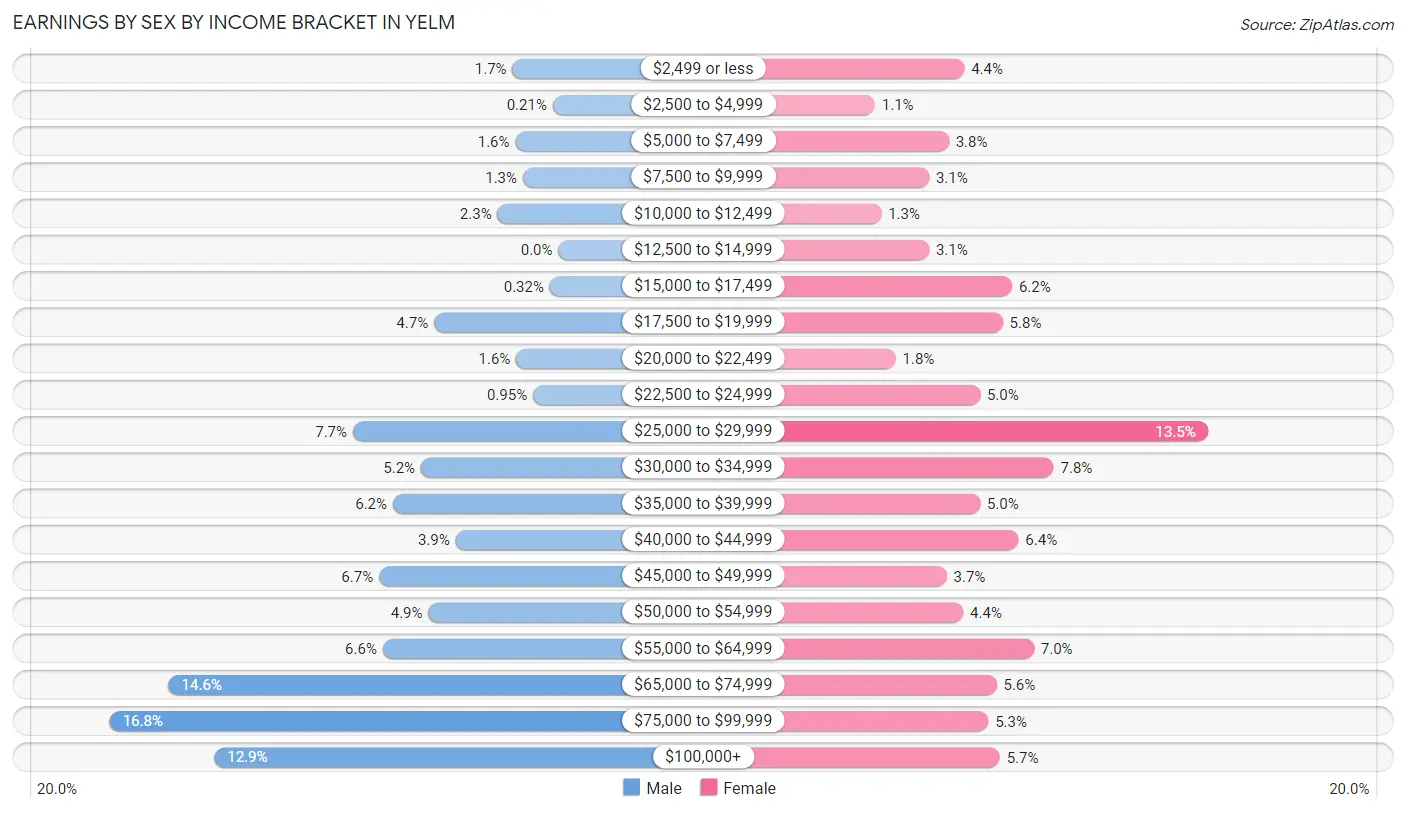
Earnings by Sex by Income Bracket in Yelm
The most common earnings brackets in Yelm are $75,000 to $99,999 for men (480 | 16.8%) and $25,000 to $29,999 for women (347 | 13.5%).
| Income | Male | Female |
| $2,499 or less | 49 (1.7%) | 113 (4.4%) |
| $2,500 to $4,999 | 6 (0.2%) | 27 (1.1%) |
| $5,000 to $7,499 | 46 (1.6%) | 98 (3.8%) |
| $7,500 to $9,999 | 38 (1.3%) | 79 (3.1%) |
| $10,000 to $12,499 | 65 (2.3%) | 33 (1.3%) |
| $12,500 to $14,999 | 0 (0.0%) | 79 (3.1%) |
| $15,000 to $17,499 | 9 (0.3%) | 159 (6.2%) |
| $17,500 to $19,999 | 133 (4.7%) | 150 (5.8%) |
| $20,000 to $22,499 | 45 (1.6%) | 47 (1.8%) |
| $22,500 to $24,999 | 27 (0.9%) | 128 (5.0%) |
| $25,000 to $29,999 | 220 (7.7%) | 347 (13.5%) |
| $30,000 to $34,999 | 147 (5.1%) | 199 (7.7%) |
| $35,000 to $39,999 | 177 (6.2%) | 128 (5.0%) |
| $40,000 to $44,999 | 110 (3.8%) | 165 (6.4%) |
| $45,000 to $49,999 | 192 (6.7%) | 96 (3.7%) |
| $50,000 to $54,999 | 139 (4.9%) | 112 (4.4%) |
| $55,000 to $64,999 | 188 (6.6%) | 180 (7.0%) |
| $65,000 to $74,999 | 417 (14.6%) | 144 (5.6%) |
| $75,000 to $99,999 | 480 (16.8%) | 136 (5.3%) |
| $100,000+ | 368 (12.9%) | 147 (5.7%) |
| Total | 2,856 (100.0%) | 2,567 (100.0%) |
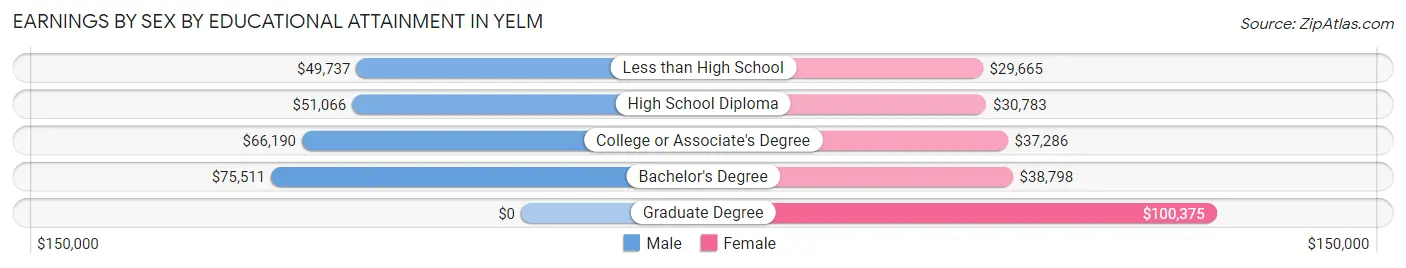
Earnings by Sex by Educational Attainment in Yelm
Average earnings in Yelm are $64,602 for men and $36,809 for women, a difference of 43.0%. Men with an educational attainment of bachelor's degree enjoy the highest average annual earnings of $75,511, while those with less than high school education earn the least with $49,737. Women with an educational attainment of graduate degree earn the most with the average annual earnings of $100,375, while those with less than high school education have the smallest earnings of $29,665.
| Educational Attainment | Male Income | Female Income |
| Less than High School | $49,737 | $29,665 |
| High School Diploma | $51,066 | $30,783 |
| College or Associate's Degree | $66,190 | $37,286 |
| Bachelor's Degree | $75,511 | $38,798 |
| Graduate Degree | - | - |
| Total | $64,602 | $36,809 |
Family Income in Yelm
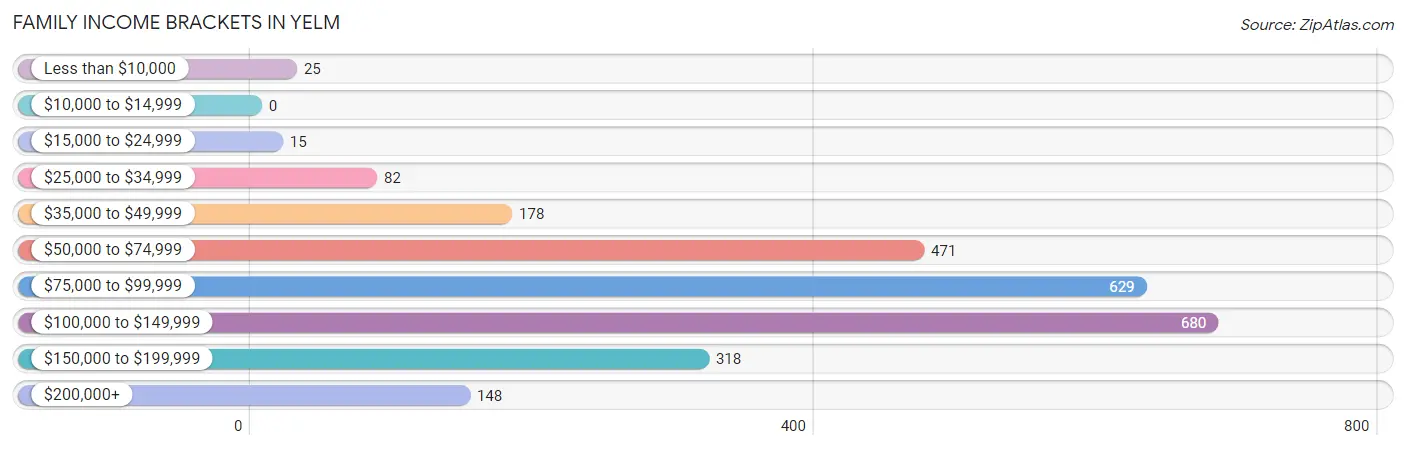
Family Income Brackets in Yelm
According to the Yelm family income data, there are 680 families falling into the $100,000 to $149,999 income range, which is the most common income bracket and makes up 26.7% of all families.
| Income Bracket | # Families | % Families |
| Less than $10,000 | 25 | 1.0% |
| $10,000 to $14,999 | 0 | 0.0% |
| $15,000 to $24,999 | 15 | 0.6% |
| $25,000 to $34,999 | 82 | 3.2% |
| $35,000 to $49,999 | 178 | 7.0% |
| $50,000 to $74,999 | 471 | 18.5% |
| $75,000 to $99,999 | 629 | 24.7% |
| $100,000 to $149,999 | 680 | 26.7% |
| $150,000 to $199,999 | 318 | 12.5% |
| $200,000+ | 148 | 5.8% |
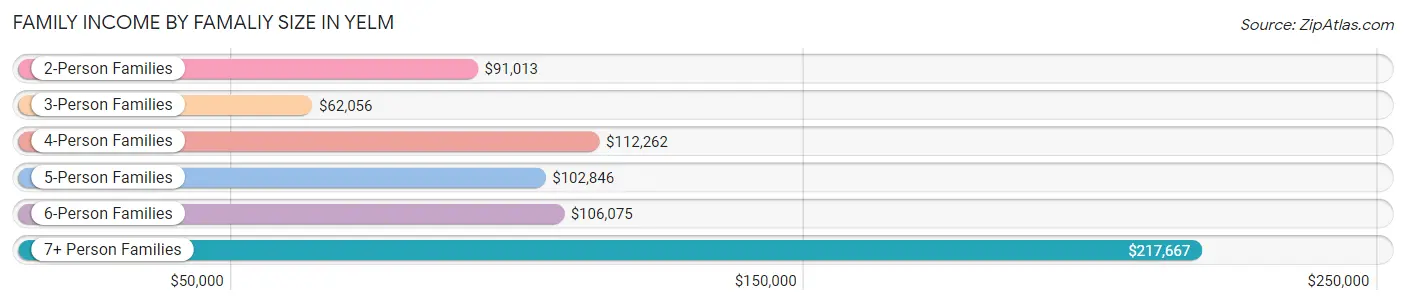
Family Income by Famaliy Size in Yelm
7+ person families (84 | 3.3%) account for the highest median family income in Yelm with $217,667 per family, while 2-person families (833 | 32.7%) have the highest median income of $45,506 per family member.
| Income Bracket | # Families | Median Income |
| 2-Person Families | 833 (32.7%) | $91,013 |
| 3-Person Families | 554 (21.7%) | $62,056 |
| 4-Person Families | 592 (23.2%) | $112,262 |
| 5-Person Families | 355 (13.9%) | $102,846 |
| 6-Person Families | 129 (5.1%) | $106,075 |
| 7+ Person Families | 84 (3.3%) | $217,667 |
| Total | 2,547 (100.0%) | $91,375 |
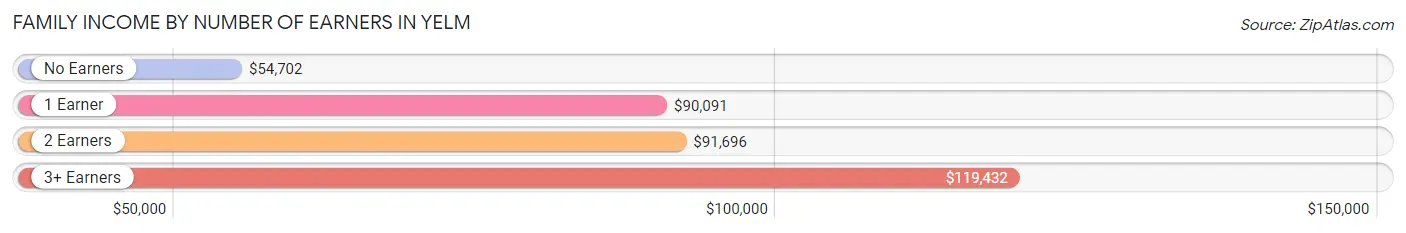
Family Income by Number of Earners in Yelm
The median family income in Yelm is $91,375, with families comprising 3+ earners (300) having the highest median family income of $119,432, while families with no earners (119) have the lowest median family income of $54,702, accounting for 11.8% and 4.7% of families, respectively.
| Number of Earners | # Families | Median Income |
| No Earners | 119 (4.7%) | $54,702 |
| 1 Earner | 897 (35.2%) | $90,091 |
| 2 Earners | 1,231 (48.3%) | $91,696 |
| 3+ Earners | 300 (11.8%) | $119,432 |
| Total | 2,547 (100.0%) | $91,375 |
Household Income in Yelm
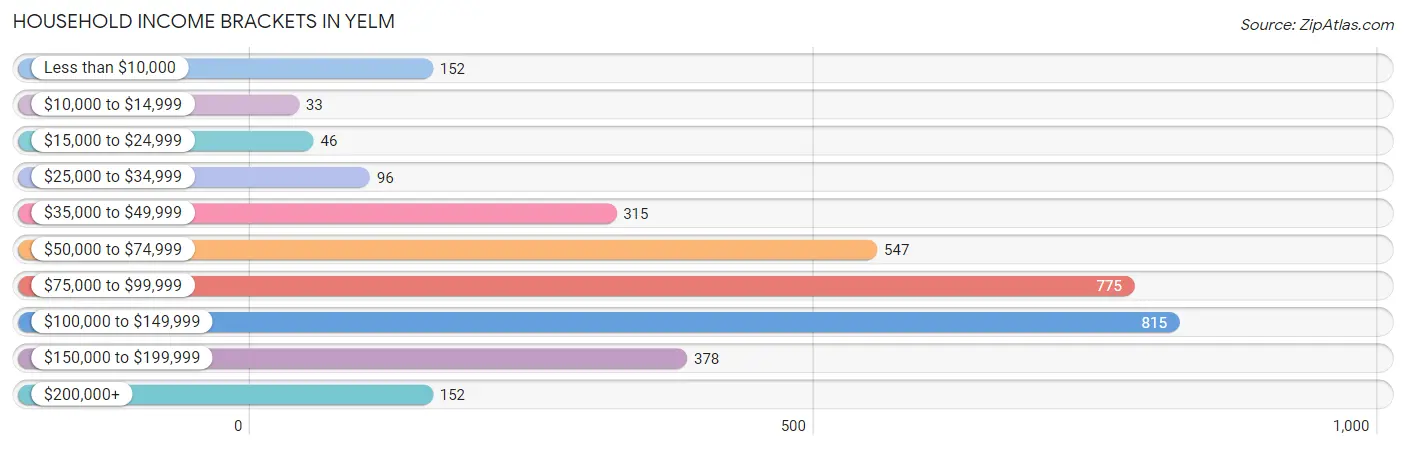
Household Income Brackets in Yelm
With 815 households falling in the category, the $100,000 to $149,999 income range is the most frequent in Yelm, accounting for 24.6% of all households. In contrast, only 33 households (1.0%) fall into the $10,000 to $14,999 income bracket, making it the least populous group.
| Income Bracket | # Households | % Households |
| Less than $10,000 | 152 | 4.6% |
| $10,000 to $14,999 | 33 | 1.0% |
| $15,000 to $24,999 | 46 | 1.4% |
| $25,000 to $34,999 | 96 | 2.9% |
| $35,000 to $49,999 | 315 | 9.5% |
| $50,000 to $74,999 | 547 | 16.5% |
| $75,000 to $99,999 | 775 | 23.4% |
| $100,000 to $149,999 | 815 | 24.6% |
| $150,000 to $199,999 | 378 | 11.4% |
| $200,000+ | 152 | 4.6% |
Household Income by Householder Age in Yelm
The median household income in Yelm is $88,818, with the highest median household income of $105,663 found in the 45 to 64 years age bracket for the primary householder. A total of 1,012 households (30.5%) fall into this category. Meanwhile, the 65+ years age bracket for the primary householder has the lowest median household income of $44,952, with 601 households (18.1%) in this group.
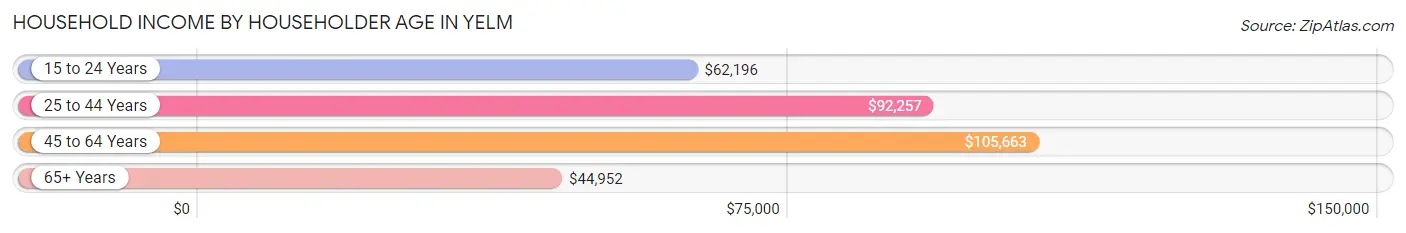
| Income Bracket | # Households | Median Income |
| 15 to 24 Years | 288 (8.7%) | $62,196 |
| 25 to 44 Years | 1,413 (42.6%) | $92,257 |
| 45 to 64 Years | 1,012 (30.5%) | $105,663 |
| 65+ Years | 601 (18.1%) | $44,952 |
| Total | 3,314 (100.0%) | $88,818 |
Poverty in Yelm
Income Below Poverty by Sex and Age in Yelm
With 5.4% poverty level for males and 5.1% for females among the residents of Yelm, 65 to 74 year old males and 65 to 74 year old females are the most vulnerable to poverty, with 66 males (37.5%) and 47 females (23.6%) in their respective age groups living below the poverty level.
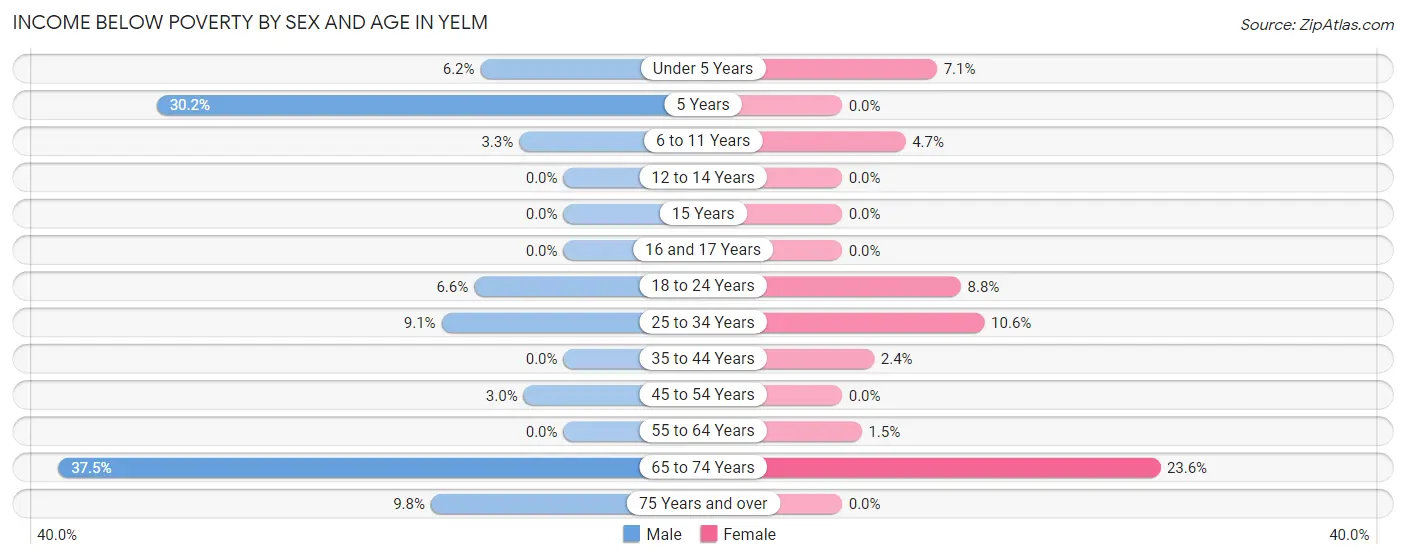
| Age Bracket | Male | Female |
| Under 5 Years | 18 (6.2%) | 37 (7.0%) |
| 5 Years | 16 (30.2%) | 0 (0.0%) |
| 6 to 11 Years | 17 (3.3%) | 24 (4.7%) |
| 12 to 14 Years | 0 (0.0%) | 0 (0.0%) |
| 15 Years | 0 (0.0%) | 0 (0.0%) |
| 16 and 17 Years | 0 (0.0%) | 0 (0.0%) |
| 18 to 24 Years | 38 (6.6%) | 51 (8.8%) |
| 25 to 34 Years | 83 (9.0%) | 91 (10.6%) |
| 35 to 44 Years | 0 (0.0%) | 19 (2.4%) |
| 45 to 54 Years | 21 (3.0%) | 0 (0.0%) |
| 55 to 64 Years | 0 (0.0%) | 7 (1.5%) |
| 65 to 74 Years | 66 (37.5%) | 47 (23.6%) |
| 75 Years and over | 12 (9.8%) | 0 (0.0%) |
| Total | 271 (5.4%) | 276 (5.1%) |
Income Above Poverty by Sex and Age in Yelm
According to the poverty statistics in Yelm, males aged 12 to 14 years and females aged 5 years are the age groups that are most secure financially, with 100.0% of males and 100.0% of females in these age groups living above the poverty line.
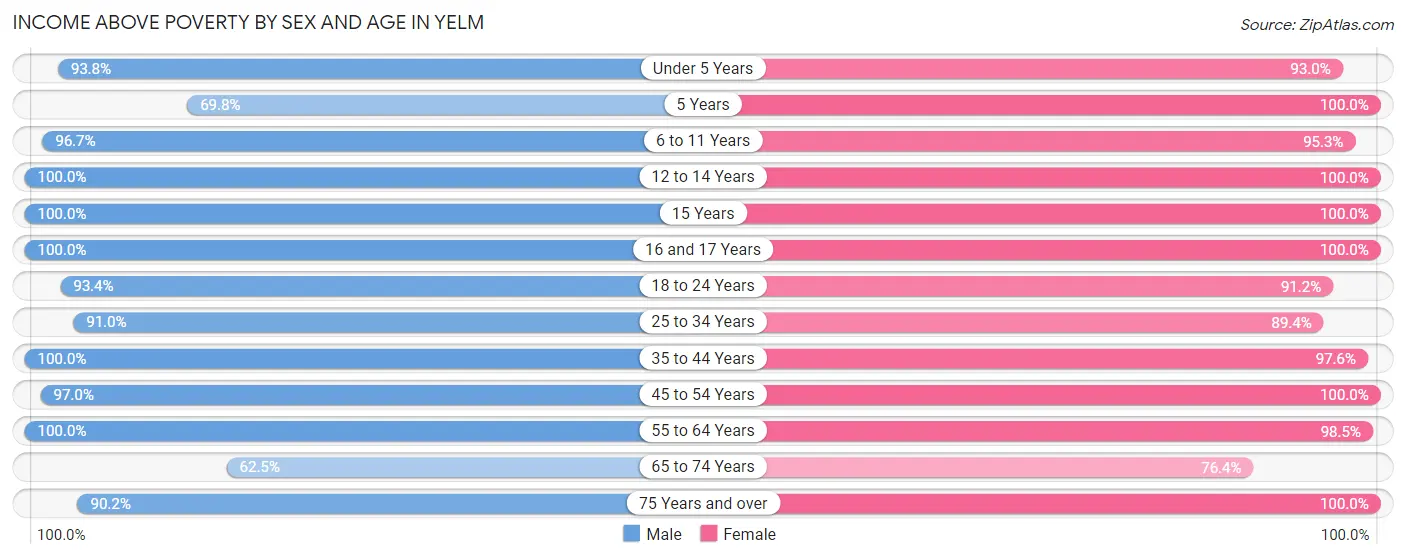
| Age Bracket | Male | Female |
| Under 5 Years | 274 (93.8%) | 488 (92.9%) |
| 5 Years | 37 (69.8%) | 137 (100.0%) |
| 6 to 11 Years | 499 (96.7%) | 486 (95.3%) |
| 12 to 14 Years | 302 (100.0%) | 203 (100.0%) |
| 15 Years | 133 (100.0%) | 137 (100.0%) |
| 16 and 17 Years | 66 (100.0%) | 246 (100.0%) |
| 18 to 24 Years | 535 (93.4%) | 527 (91.2%) |
| 25 to 34 Years | 834 (90.9%) | 770 (89.4%) |
| 35 to 44 Years | 768 (100.0%) | 781 (97.6%) |
| 45 to 54 Years | 688 (97.0%) | 518 (100.0%) |
| 55 to 64 Years | 361 (100.0%) | 474 (98.5%) |
| 65 to 74 Years | 110 (62.5%) | 152 (76.4%) |
| 75 Years and over | 110 (90.2%) | 255 (100.0%) |
| Total | 4,717 (94.6%) | 5,174 (94.9%) |
Income Below Poverty Among Married-Couple Families in Yelm
The poverty statistics for married-couple families in Yelm show that 2.1% or 42 of the total 2,038 families live below the poverty line. Families with 3 or 4 children have the highest poverty rate of 5.1%, comprising of 16 families. On the other hand, families with no children have the lowest poverty rate of 0.0%, which includes 0 families.
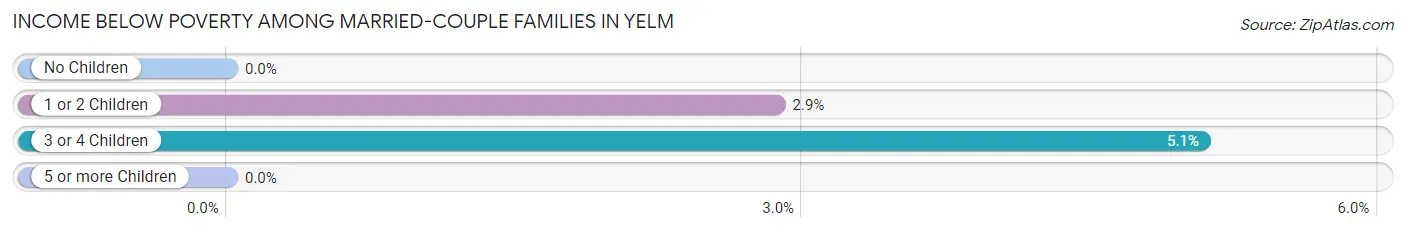
| Children | Above Poverty | Below Poverty |
| No Children | 777 (100.0%) | 0 (0.0%) |
| 1 or 2 Children | 884 (97.1%) | 26 (2.9%) |
| 3 or 4 Children | 299 (94.9%) | 16 (5.1%) |
| 5 or more Children | 36 (100.0%) | 0 (0.0%) |
| Total | 1,996 (97.9%) | 42 (2.1%) |
Income Below Poverty Among Single-Parent Households in Yelm
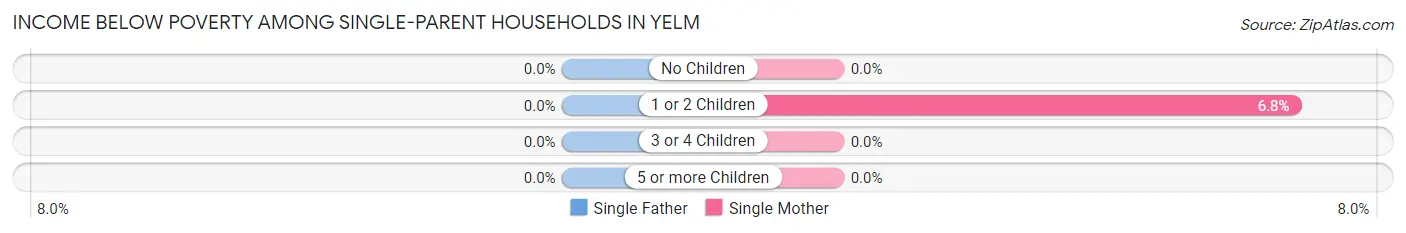
| Children | Single Father | Single Mother |
| No Children | 0 (0.0%) | 0 (0.0%) |
| 1 or 2 Children | 0 (0.0%) | 15 (6.8%) |
| 3 or 4 Children | 0 (0.0%) | 0 (0.0%) |
| 5 or more Children | 0 (0.0%) | 0 (0.0%) |
| Total | 0 (0.0%) | 15 (4.3%) |
Income Below Poverty Among Married-Couple vs Single-Parent Households in Yelm
The poverty data for Yelm shows that 42 of the married-couple family households (2.1%) and 15 of the single-parent households (2.9%) are living below the poverty level. Within the married-couple family households, those with 3 or 4 children have the highest poverty rate, with 16 households (5.1%) falling below the poverty line. Among the single-parent households, those with 1 or 2 children have the highest poverty rate, with 15 household (4.6%) living below poverty.
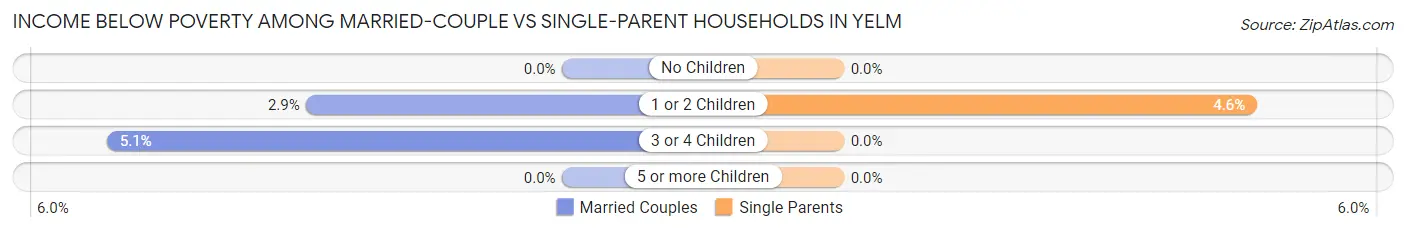
| Children | Married-Couple Families | Single-Parent Households |
| No Children | 0 (0.0%) | 0 (0.0%) |
| 1 or 2 Children | 26 (2.9%) | 15 (4.6%) |
| 3 or 4 Children | 16 (5.1%) | 0 (0.0%) |
| 5 or more Children | 0 (0.0%) | 0 (0.0%) |
| Total | 42 (2.1%) | 15 (2.9%) |
Race in Yelm
The most populous races in Yelm are White / Caucasian (7,479 | 71.7%), Two or more Races (1,531 | 14.7%), and Hispanic or Latino (1,067 | 10.2%).
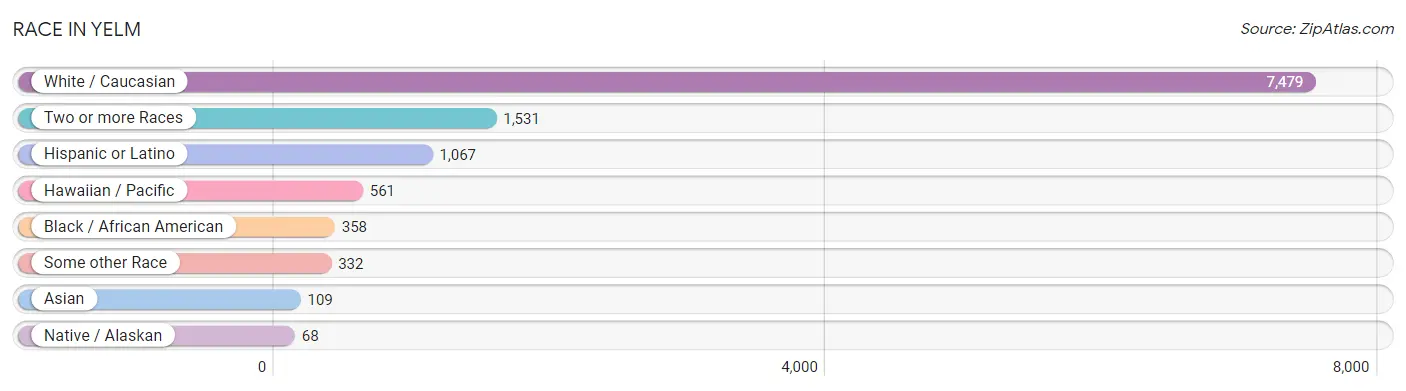
| Race | # Population | % Population |
| Asian | 109 | 1.0% |
| Black / African American | 358 | 3.4% |
| Hawaiian / Pacific | 561 | 5.4% |
| Hispanic or Latino | 1,067 | 10.2% |
| Native / Alaskan | 68 | 0.6% |
| White / Caucasian | 7,479 | 71.7% |
| Two or more Races | 1,531 | 14.7% |
| Some other Race | 332 | 3.2% |
| Total | 10,438 | 100.0% |
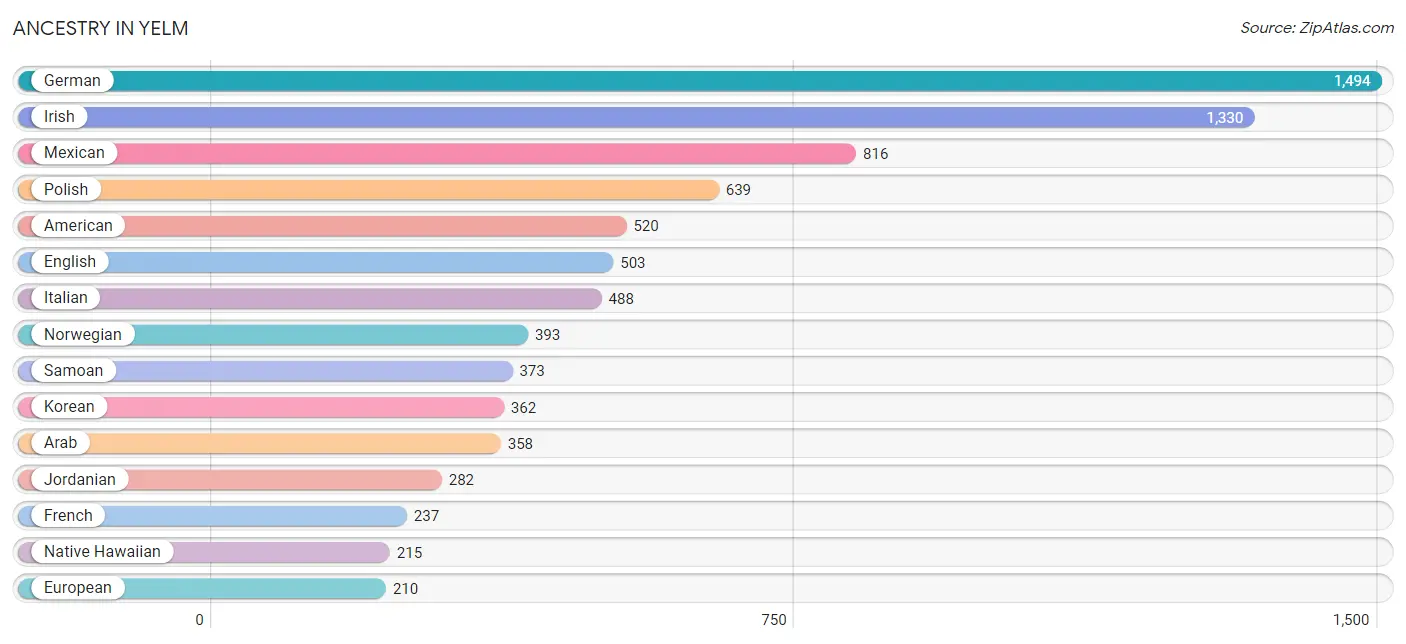
Ancestry in Yelm
The most populous ancestries reported in Yelm are German (1,494 | 14.3%), Irish (1,330 | 12.7%), Mexican (816 | 7.8%), Polish (639 | 6.1%), and American (520 | 5.0%), together accounting for 46.0% of all Yelm residents.
| Ancestry | # Population | % Population |
| African | 10 | 0.1% |
| American | 520 | 5.0% |
| Arab | 358 | 3.4% |
| Austrian | 56 | 0.5% |
| Bhutanese | 136 | 1.3% |
| Blackfeet | 26 | 0.3% |
| British | 49 | 0.5% |
| Burmese | 56 | 0.5% |
| Canadian | 73 | 0.7% |
| Cherokee | 9 | 0.1% |
| Croatian | 141 | 1.3% |
| Cuban | 23 | 0.2% |
| Czech | 22 | 0.2% |
| Danish | 182 | 1.7% |
| Dutch | 134 | 1.3% |
| Eastern European | 17 | 0.2% |
| Egyptian | 20 | 0.2% |
| English | 503 | 4.8% |
| European | 210 | 2.0% |
| Finnish | 32 | 0.3% |
| French | 237 | 2.3% |
| French Canadian | 86 | 0.8% |
| German | 1,494 | 14.3% |
| Greek | 59 | 0.6% |
| Guamanian / Chamorro | 74 | 0.7% |
| Icelander | 26 | 0.3% |
| Indian (Asian) | 18 | 0.2% |
| Irish | 1,330 | 12.7% |
| Iroquois | 79 | 0.8% |
| Italian | 488 | 4.7% |
| Jordanian | 282 | 2.7% |
| Korean | 362 | 3.5% |
| Lithuanian | 11 | 0.1% |
| Lumbee | 30 | 0.3% |
| Luxembourger | 45 | 0.4% |
| Mexican | 816 | 7.8% |
| Native Hawaiian | 215 | 2.1% |
| Nigerian | 5 | 0.1% |
| Norwegian | 393 | 3.8% |
| Pennsylvania German | 21 | 0.2% |
| Polish | 639 | 6.1% |
| Portuguese | 14 | 0.1% |
| Puerto Rican | 116 | 1.1% |
| Puget Sound Salish | 37 | 0.4% |
| Russian | 108 | 1.0% |
| Samoan | 373 | 3.6% |
| Scandinavian | 76 | 0.7% |
| Scotch-Irish | 107 | 1.0% |
| Scottish | 205 | 2.0% |
| South African | 43 | 0.4% |
| Spaniard | 21 | 0.2% |
| Sri Lankan | 27 | 0.3% |
| Subsaharan African | 96 | 0.9% |
| Swedish | 157 | 1.5% |
| Thai | 18 | 0.2% |
| Tlingit-Haida | 16 | 0.2% |
| Turkish | 49 | 0.5% |
| Ukrainian | 38 | 0.4% |
| Welsh | 92 | 0.9% | View All 59 Rows |
Immigrants in Yelm
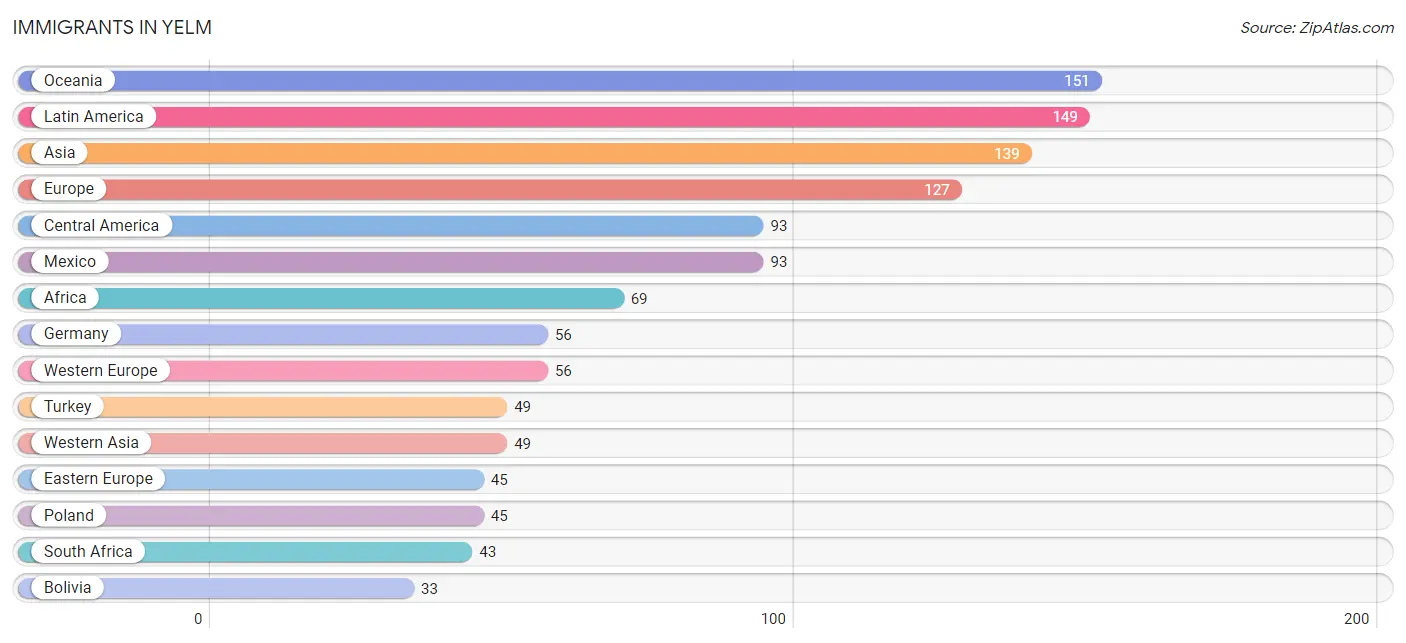
The most numerous immigrant groups reported in Yelm came from Oceania (151 | 1.5%), Latin America (149 | 1.4%), Asia (139 | 1.3%), Europe (127 | 1.2%), and Central America (93 | 0.9%), together accounting for 6.3% of all Yelm residents.
| Immigration Origin | # Population | % Population |
| Africa | 69 | 0.7% |
| Asia | 139 | 1.3% |
| Bolivia | 33 | 0.3% |
| Canada | 14 | 0.1% |
| Caribbean | 23 | 0.2% |
| Central America | 93 | 0.9% |
| Cuba | 23 | 0.2% |
| Denmark | 8 | 0.1% |
| Eastern Asia | 33 | 0.3% |
| Eastern Europe | 45 | 0.4% |
| Europe | 127 | 1.2% |
| Germany | 56 | 0.5% |
| Iran | 28 | 0.3% |
| Japan | 19 | 0.2% |
| Korea | 14 | 0.1% |
| Latin America | 149 | 1.4% |
| Mexico | 93 | 0.9% |
| Northern Europe | 26 | 0.3% |
| Oceania | 151 | 1.5% |
| Philippines | 29 | 0.3% |
| Poland | 45 | 0.4% |
| Scotland | 12 | 0.1% |
| South Africa | 43 | 0.4% |
| South America | 33 | 0.3% |
| South Central Asia | 28 | 0.3% |
| South Eastern Asia | 29 | 0.3% |
| Turkey | 49 | 0.5% |
| Western Africa | 26 | 0.3% |
| Western Asia | 49 | 0.5% |
| Western Europe | 56 | 0.5% | View All 30 Rows |
Sex and Age in Yelm
Sex and Age in Yelm
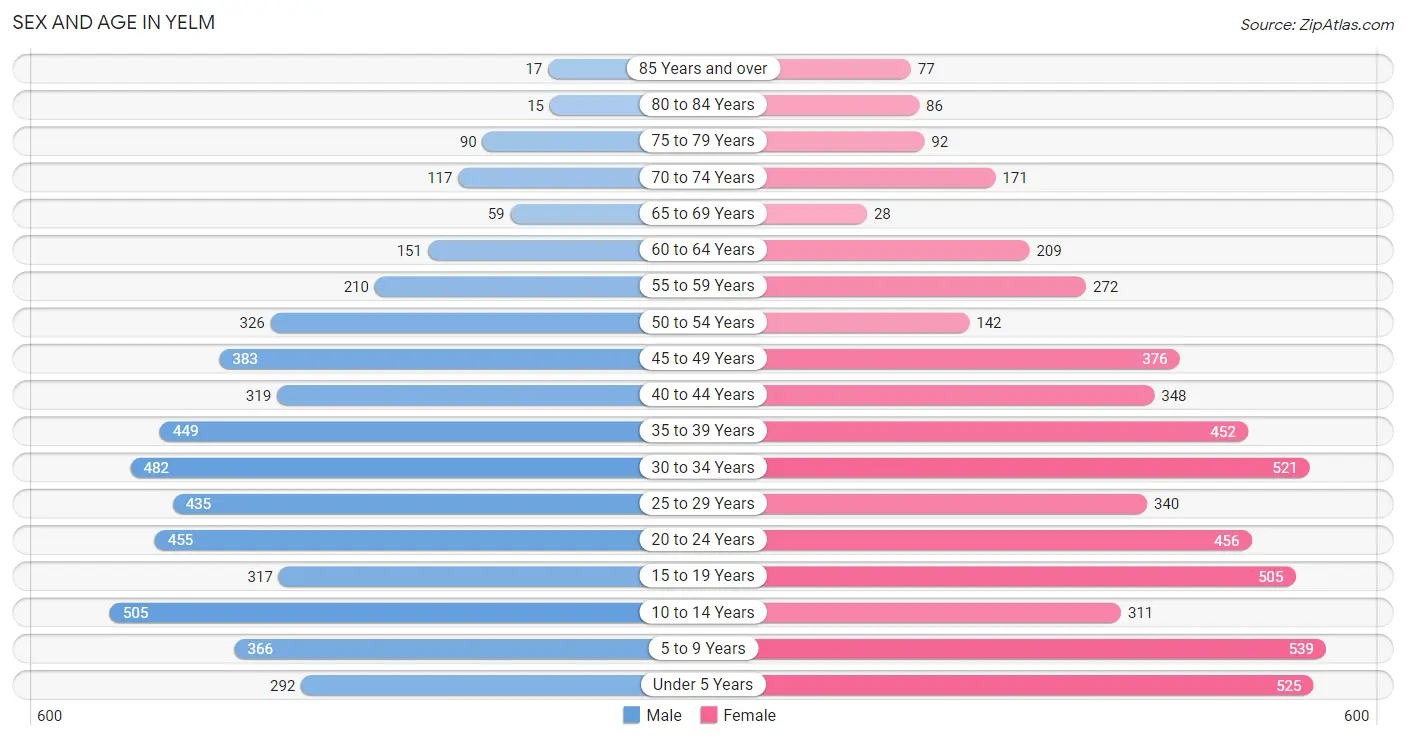
The most populous age groups in Yelm are 10 to 14 Years (505 | 10.1%) for men and 5 to 9 Years (539 | 9.9%) for women.
| Age Bracket | Male | Female |
| Under 5 Years | 292 (5.9%) | 525 (9.6%) |
| 5 to 9 Years | 366 (7.3%) | 539 (9.9%) |
| 10 to 14 Years | 505 (10.1%) | 311 (5.7%) |
| 15 to 19 Years | 317 (6.4%) | 505 (9.3%) |
| 20 to 24 Years | 455 (9.1%) | 456 (8.4%) |
| 25 to 29 Years | 435 (8.7%) | 340 (6.2%) |
| 30 to 34 Years | 482 (9.7%) | 521 (9.6%) |
| 35 to 39 Years | 449 (9.0%) | 452 (8.3%) |
| 40 to 44 Years | 319 (6.4%) | 348 (6.4%) |
| 45 to 49 Years | 383 (7.7%) | 376 (6.9%) |
| 50 to 54 Years | 326 (6.5%) | 142 (2.6%) |
| 55 to 59 Years | 210 (4.2%) | 272 (5.0%) |
| 60 to 64 Years | 151 (3.0%) | 209 (3.8%) |
| 65 to 69 Years | 59 (1.2%) | 28 (0.5%) |
| 70 to 74 Years | 117 (2.4%) | 171 (3.1%) |
| 75 to 79 Years | 90 (1.8%) | 92 (1.7%) |
| 80 to 84 Years | 15 (0.3%) | 86 (1.6%) |
| 85 Years and over | 17 (0.3%) | 77 (1.4%) |
| Total | 4,988 (100.0%) | 5,450 (100.0%) |
Families and Households in Yelm
Median Family Size in Yelm
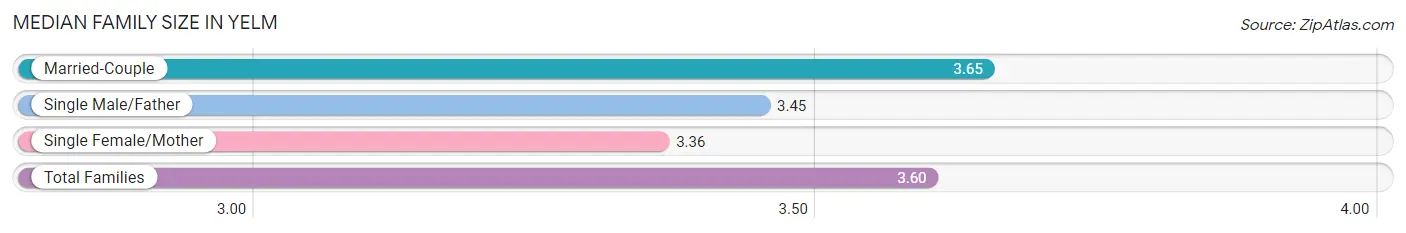
The median family size in Yelm is 3.60 persons per family, with married-couple families (2,038 | 80.0%) accounting for the largest median family size of 3.65 persons per family. On the other hand, single female/mother families (346 | 13.6%) represent the smallest median family size with 3.36 persons per family.
| Family Type | # Families | Family Size |
| Married-Couple | 2,038 (80.0%) | 3.65 |
| Single Male/Father | 163 (6.4%) | 3.45 |
| Single Female/Mother | 346 (13.6%) | 3.36 |
| Total Families | 2,547 (100.0%) | 3.60 |
Median Household Size in Yelm
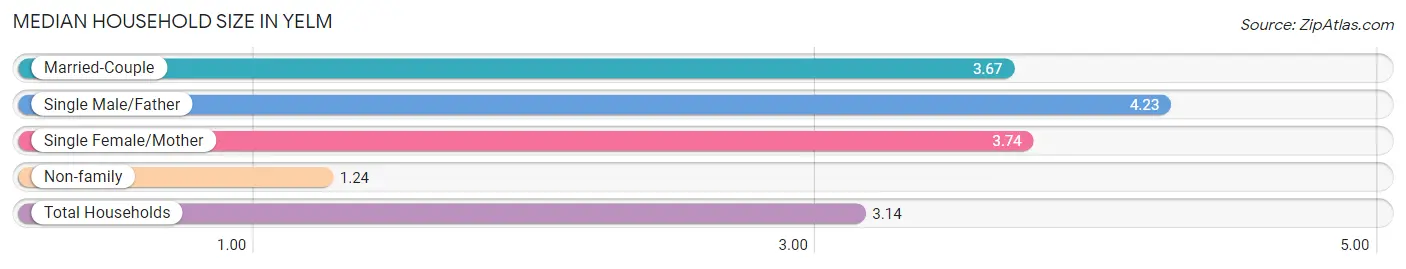
The median household size in Yelm is 3.14 persons per household, with single male/father households (163 | 4.9%) accounting for the largest median household size of 4.23 persons per household. non-family households (767 | 23.1%) represent the smallest median household size with 1.24 persons per household.
| Household Type | # Households | Household Size |
| Married-Couple | 2,038 (61.5%) | 3.67 |
| Single Male/Father | 163 (4.9%) | 4.23 |
| Single Female/Mother | 346 (10.4%) | 3.74 |
| Non-family | 767 (23.1%) | 1.24 |
| Total Households | 3,314 (100.0%) | 3.14 |
Household Size by Marriage Status in Yelm
Out of a total of 3,314 households in Yelm, 2,547 (76.9%) are family households, while 767 (23.1%) are nonfamily households. The most numerous type of family households are 2-person households, comprising 817, and the most common type of nonfamily households are 1-person households, comprising 618.
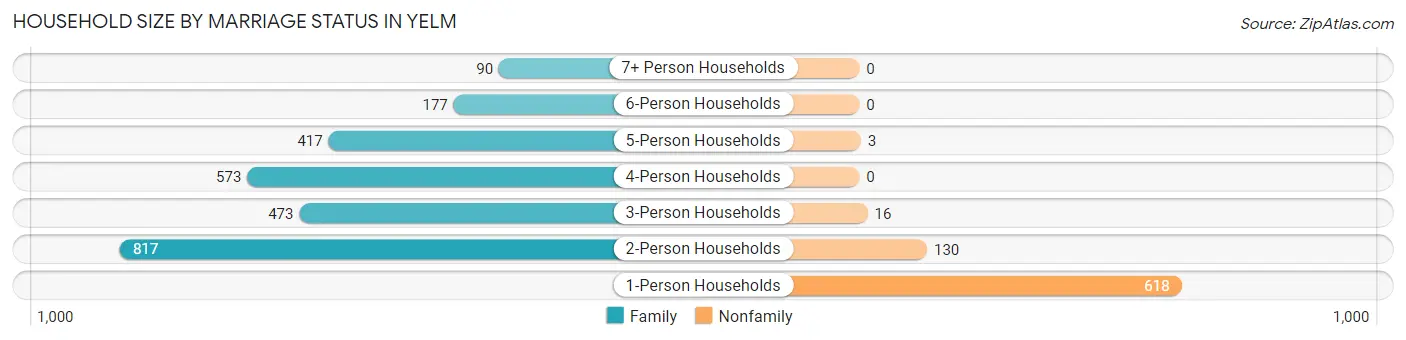
| Household Size | Family Households | Nonfamily Households |
| 1-Person Households | - | 618 (18.6%) |
| 2-Person Households | 817 (24.6%) | 130 (3.9%) |
| 3-Person Households | 473 (14.3%) | 16 (0.5%) |
| 4-Person Households | 573 (17.3%) | 0 (0.0%) |
| 5-Person Households | 417 (12.6%) | 3 (0.1%) |
| 6-Person Households | 177 (5.3%) | 0 (0.0%) |
| 7+ Person Households | 90 (2.7%) | 0 (0.0%) |
| Total | 2,547 (76.9%) | 767 (23.1%) |
Female Fertility in Yelm
Fertility by Age in Yelm
Average fertility rate in Yelm is 79.0 births per 1,000 women. Women in the age bracket of 35 to 50 years have the highest fertility rate with 88.0 births per 1,000 women. Women in the age bracket of 35 to 50 years acount for 44.3% of all women with births.
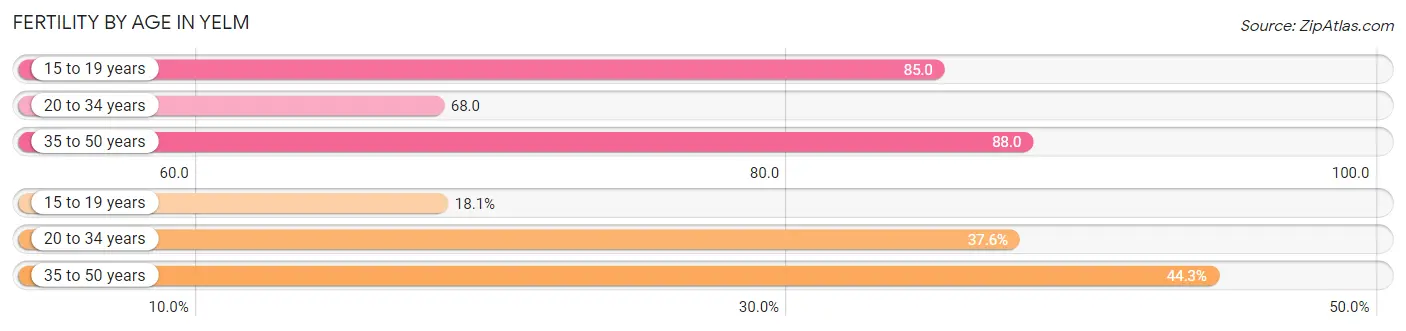
| Age Bracket | Women with Births | Births / 1,000 Women |
| 15 to 19 years | 43 (18.1%) | 85.0 |
| 20 to 34 years | 89 (37.6%) | 68.0 |
| 35 to 50 years | 105 (44.3%) | 88.0 |
| Total | 237 (100.0%) | 79.0 |
Fertility by Age by Marriage Status in Yelm
64.6% of women with births (237) in Yelm are married. The highest percentage of unmarried women with births falls into 15 to 19 years age bracket with 100.0% of them unmarried at the time of birth, while the lowest percentage of unmarried women with births belong to 20 to 34 years age bracket with 0.0% of them unmarried.
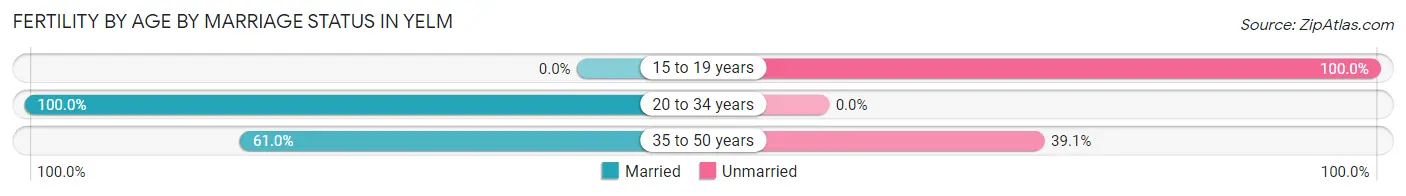
| Age Bracket | Married | Unmarried |
| 15 to 19 years | 0 (0.0%) | 43 (100.0%) |
| 20 to 34 years | 89 (100.0%) | 0 (0.0%) |
| 35 to 50 years | 64 (61.0%) | 41 (39.1%) |
| Total | 153 (64.6%) | 84 (35.4%) |
Fertility by Education in Yelm
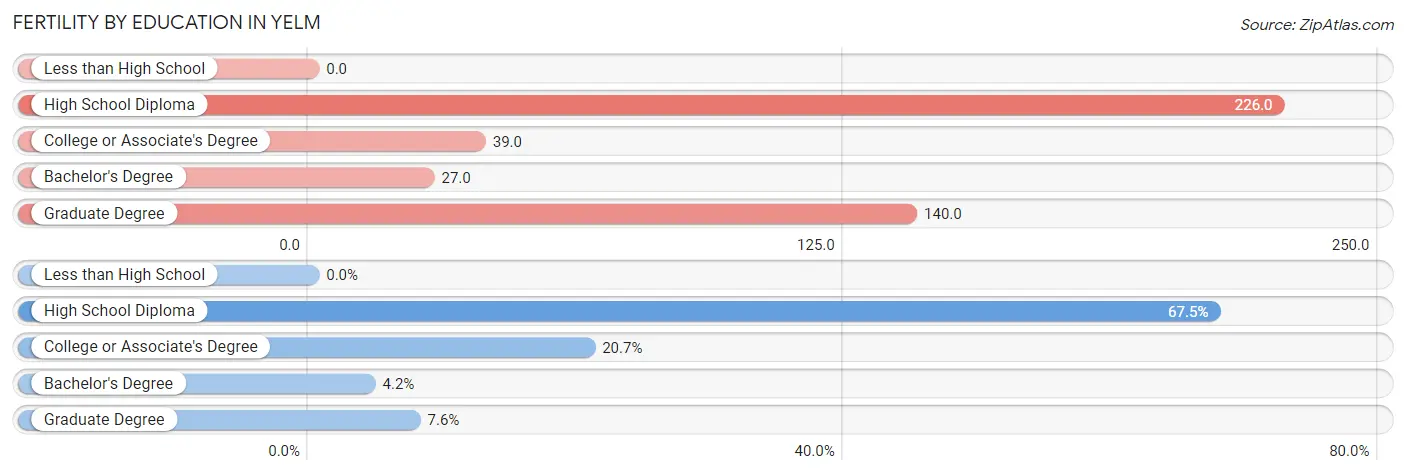
| Educational Attainment | Women with Births | Births / 1,000 Women |
| Less than High School | 0 (0.0%) | 0.0 |
| High School Diploma | 160 (67.5%) | 226.0 |
| College or Associate's Degree | 49 (20.7%) | 39.0 |
| Bachelor's Degree | 10 (4.2%) | 27.0 |
| Graduate Degree | 18 (7.6%) | 140.0 |
| Total | 237 (100.0%) | 79.0 |
Fertility by Education by Marriage Status in Yelm
35.4% of women with births in Yelm are unmarried. Women with the educational attainment of bachelor's degree are most likely to be married with 100.0% of them married at childbirth, while women with the educational attainment of college or associate's degree are least likely to be married with 83.7% of them unmarried at childbirth.
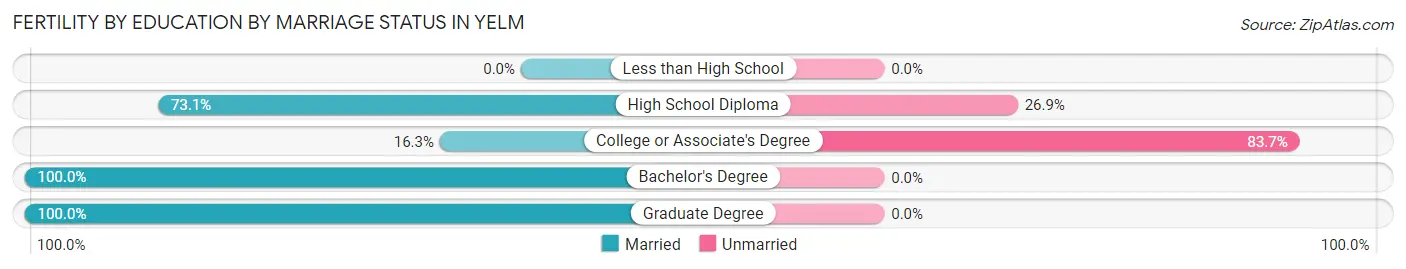
| Educational Attainment | Married | Unmarried |
| Less than High School | 0 (0.0%) | 0 (0.0%) |
| High School Diploma | 117 (73.1%) | 43 (26.9%) |
| College or Associate's Degree | 8 (16.3%) | 41 (83.7%) |
| Bachelor's Degree | 10 (100.0%) | 0 (0.0%) |
| Graduate Degree | 18 (100.0%) | 0 (0.0%) |
| Total | 153 (64.6%) | 84 (35.4%) |
Employment Characteristics in Yelm
Employment by Class of Employer in Yelm
Among the 4,962 employed individuals in Yelm, private company employees (2,648 | 53.4%), federal government employees (1,251 | 25.2%), and state government employees (423 | 8.5%) make up the most common classes of employment.
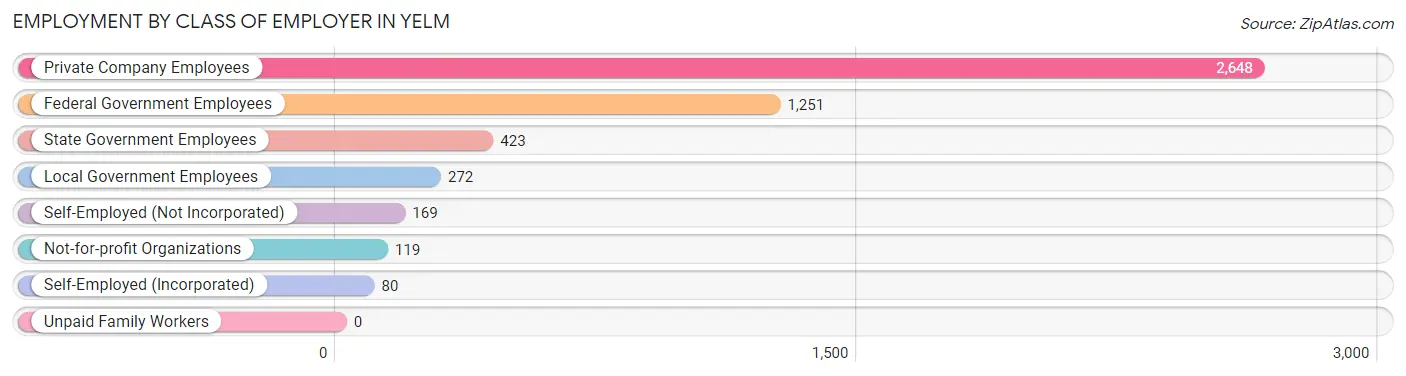
| Employer Class | # Employees | % Employees |
| Private Company Employees | 2,648 | 53.4% |
| Self-Employed (Incorporated) | 80 | 1.6% |
| Self-Employed (Not Incorporated) | 169 | 3.4% |
| Not-for-profit Organizations | 119 | 2.4% |
| Local Government Employees | 272 | 5.5% |
| State Government Employees | 423 | 8.5% |
| Federal Government Employees | 1,251 | 25.2% |
| Unpaid Family Workers | 0 | 0.0% |
| Total | 4,962 | 100.0% |
Employment Status by Age in Yelm
According to the labor force statistics for Yelm, out of the total population over 16 years of age (7,630), 68.6% or 5,234 individuals are in the labor force, with 4.7% or 246 of them unemployed. The age group with the highest labor force participation rate is 35 to 44 years, with 87.8% or 1,377 individuals in the labor force. Within the labor force, the 16 to 19 years age range has the highest percentage of unemployed individuals, with 25.6% or 61 of them being unemployed.
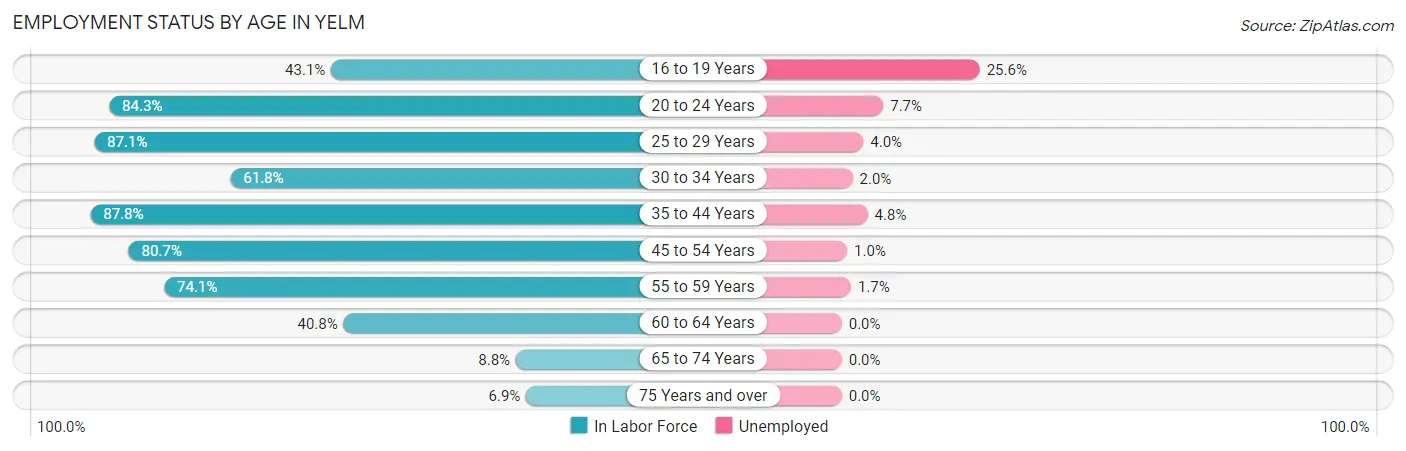
| Age Bracket | In Labor Force | Unemployed |
| 16 to 19 Years | 238 (43.1%) | 61 (25.6%) |
| 20 to 24 Years | 768 (84.3%) | 59 (7.7%) |
| 25 to 29 Years | 675 (87.1%) | 27 (4.0%) |
| 30 to 34 Years | 620 (61.8%) | 12 (2.0%) |
| 35 to 44 Years | 1,377 (87.8%) | 66 (4.8%) |
| 45 to 54 Years | 990 (80.7%) | 10 (1.0%) |
| 55 to 59 Years | 357 (74.1%) | 6 (1.7%) |
| 60 to 64 Years | 147 (40.8%) | 0 (0.0%) |
| 65 to 74 Years | 33 (8.8%) | 0 (0.0%) |
| 75 Years and over | 26 (6.9%) | 0 (0.0%) |
| Total | 5,234 (68.6%) | 246 (4.7%) |
Employment Status by Educational Attainment in Yelm
According to labor force statistics for Yelm, 76.9% of individuals (4,164) out of the total population between 25 and 64 years of age (5,415) are in the labor force, with 2.7% or 112 of them being unemployed. The group with the highest labor force participation rate are those with the educational attainment of less than high school, with 90.1% or 335 individuals in the labor force. Within the labor force, individuals with bachelor's degree or higher education have the highest percentage of unemployment, with 6.7% or 59 of them being unemployed.
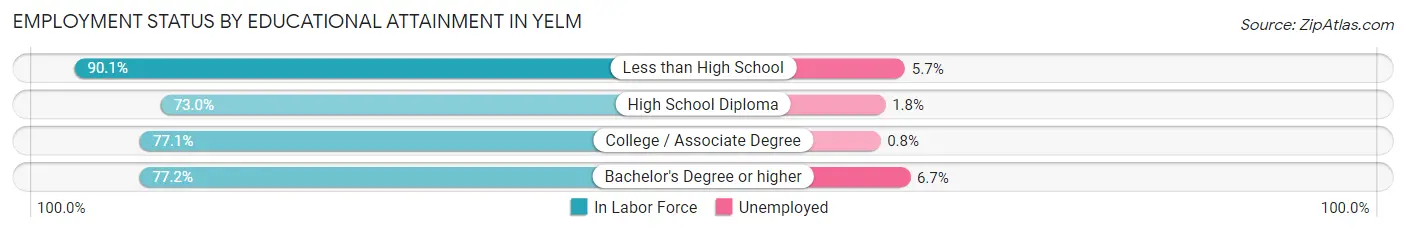
| Educational Attainment | In Labor Force | Unemployed |
| Less than High School | 335 (90.1%) | 21 (5.7%) |
| High School Diploma | 1,018 (73.0%) | 25 (1.8%) |
| College / Associate Degree | 1,930 (77.1%) | 20 (0.8%) |
| Bachelor's Degree or higher | 884 (77.2%) | 77 (6.7%) |
| Total | 4,164 (76.9%) | 146 (2.7%) |
Employment Occupations by Sex in Yelm
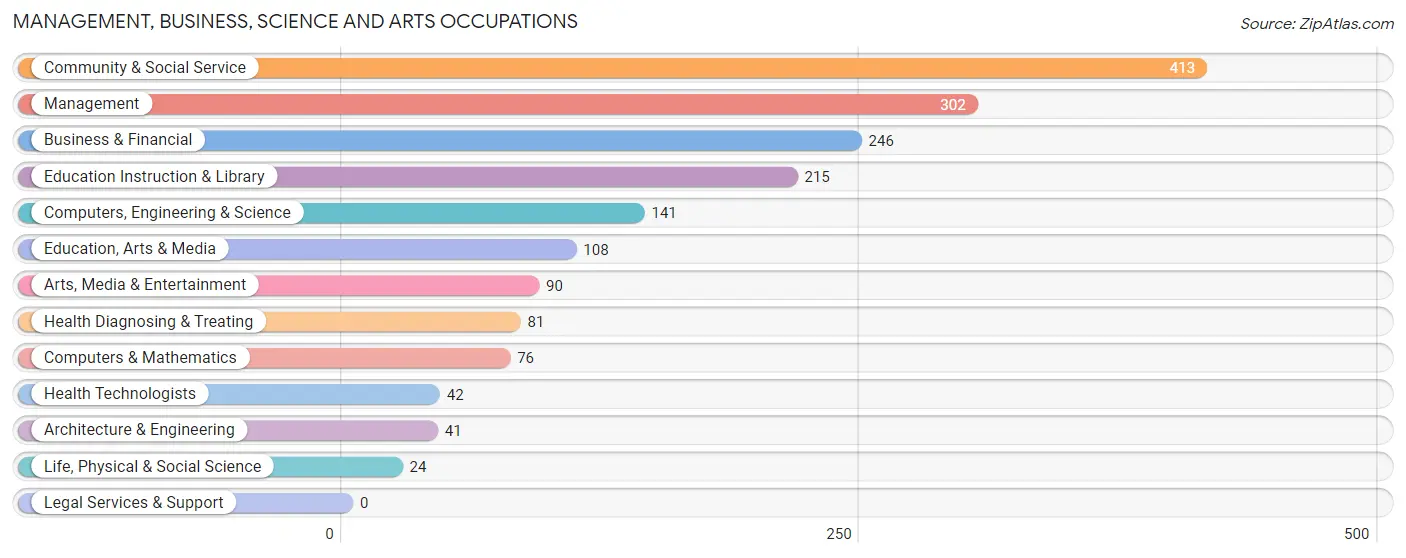
Management, Business, Science and Arts Occupations
The most common Management, Business, Science and Arts occupations in Yelm are Community & Social Service (413 | 9.8%), Management (302 | 7.1%), Business & Financial (246 | 5.8%), Education Instruction & Library (215 | 5.1%), and Computers, Engineering & Science (141 | 3.3%).
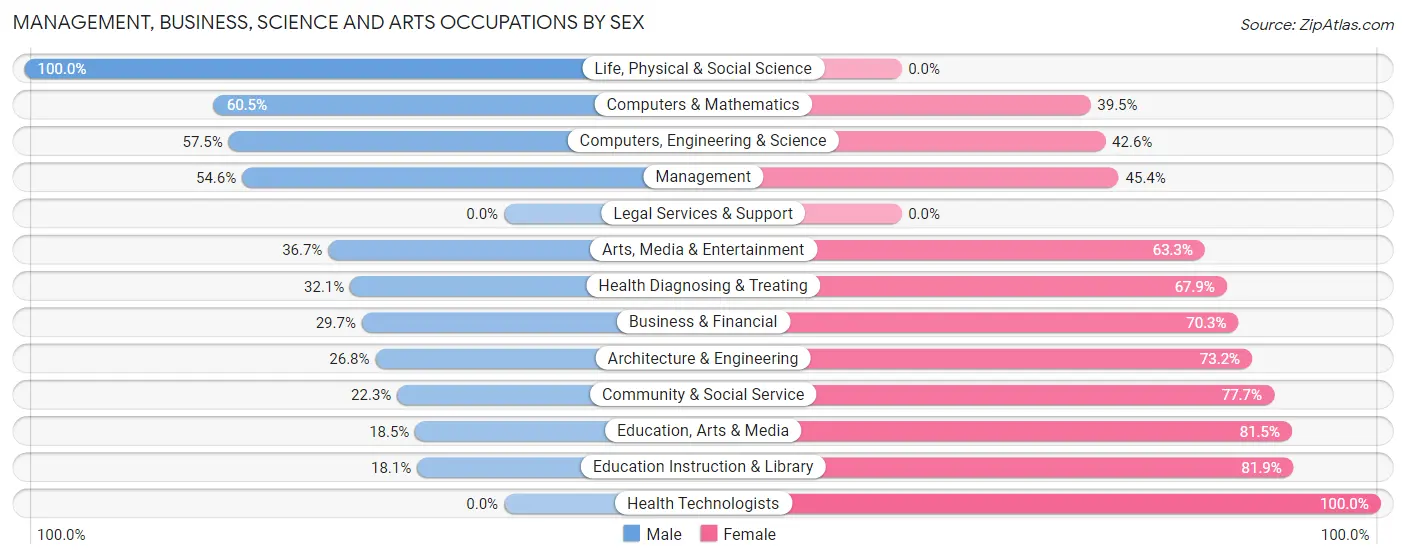
Management, Business, Science and Arts Occupations by Sex
Within the Management, Business, Science and Arts occupations in Yelm, the most male-oriented occupations are Life, Physical & Social Science (100.0%), Computers & Mathematics (60.5%), and Computers, Engineering & Science (57.5%), while the most female-oriented occupations are Health Technologists (100.0%), Education Instruction & Library (81.9%), and Education, Arts & Media (81.5%).
| Occupation | Male | Female |
| Management | 165 (54.6%) | 137 (45.4%) |
| Business & Financial | 73 (29.7%) | 173 (70.3%) |
| Computers, Engineering & Science | 81 (57.5%) | 60 (42.5%) |
| Computers & Mathematics | 46 (60.5%) | 30 (39.5%) |
| Architecture & Engineering | 11 (26.8%) | 30 (73.2%) |
| Life, Physical & Social Science | 24 (100.0%) | 0 (0.0%) |
| Community & Social Service | 92 (22.3%) | 321 (77.7%) |
| Education, Arts & Media | 20 (18.5%) | 88 (81.5%) |
| Legal Services & Support | 0 (0.0%) | 0 (0.0%) |
| Education Instruction & Library | 39 (18.1%) | 176 (81.9%) |
| Arts, Media & Entertainment | 33 (36.7%) | 57 (63.3%) |
| Health Diagnosing & Treating | 26 (32.1%) | 55 (67.9%) |
| Health Technologists | 0 (0.0%) | 42 (100.0%) |
| Total (Category) | 437 (36.9%) | 746 (63.1%) |
| Total (Overall) | 2,113 (50.0%) | 2,111 (50.0%) |
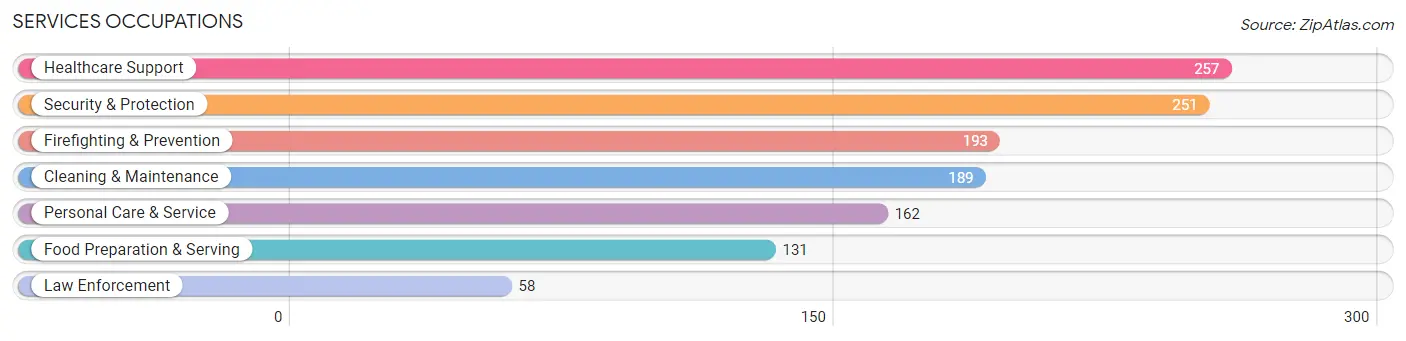
Services Occupations
The most common Services occupations in Yelm are Healthcare Support (257 | 6.1%), Security & Protection (251 | 5.9%), Firefighting & Prevention (193 | 4.6%), Cleaning & Maintenance (189 | 4.5%), and Personal Care & Service (162 | 3.8%).
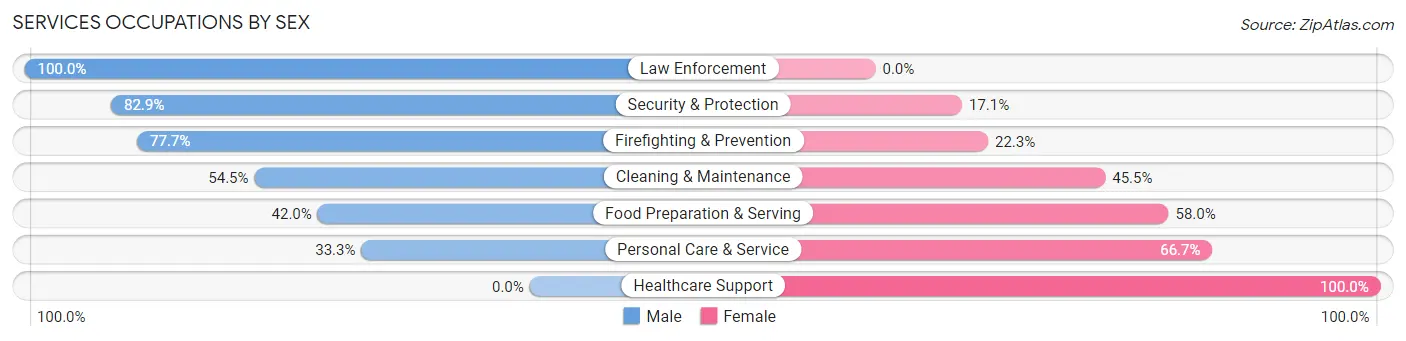
Services Occupations by Sex
Within the Services occupations in Yelm, the most male-oriented occupations are Law Enforcement (100.0%), Security & Protection (82.9%), and Firefighting & Prevention (77.7%), while the most female-oriented occupations are Healthcare Support (100.0%), Personal Care & Service (66.7%), and Food Preparation & Serving (58.0%).
| Occupation | Male | Female |
| Healthcare Support | 0 (0.0%) | 257 (100.0%) |
| Security & Protection | 208 (82.9%) | 43 (17.1%) |
| Firefighting & Prevention | 150 (77.7%) | 43 (22.3%) |
| Law Enforcement | 58 (100.0%) | 0 (0.0%) |
| Food Preparation & Serving | 55 (42.0%) | 76 (58.0%) |
| Cleaning & Maintenance | 103 (54.5%) | 86 (45.5%) |
| Personal Care & Service | 54 (33.3%) | 108 (66.7%) |
| Total (Category) | 420 (42.4%) | 570 (57.6%) |
| Total (Overall) | 2,113 (50.0%) | 2,111 (50.0%) |
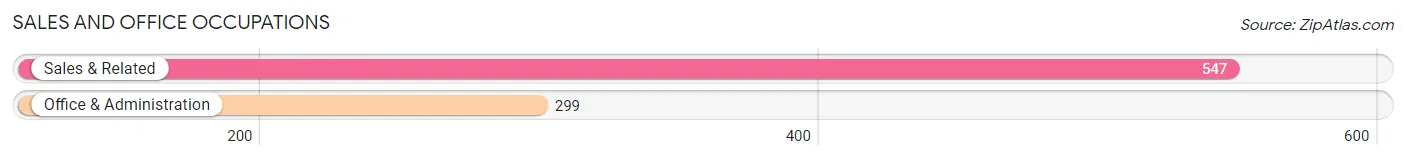
Sales and Office Occupations
The most common Sales and Office occupations in Yelm are Sales & Related (547 | 13.0%), and Office & Administration (299 | 7.1%).
Sales and Office Occupations by Sex
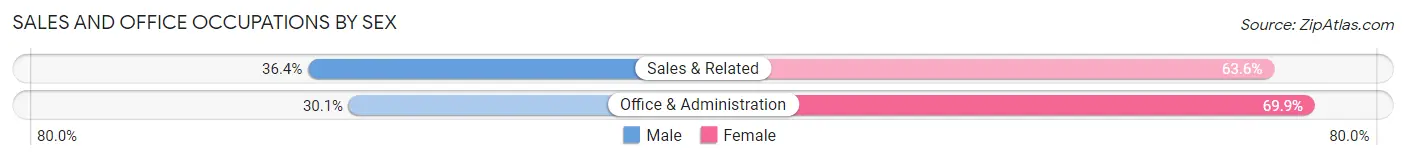
| Occupation | Male | Female |
| Sales & Related | 199 (36.4%) | 348 (63.6%) |
| Office & Administration | 90 (30.1%) | 209 (69.9%) |
| Total (Category) | 289 (34.2%) | 557 (65.8%) |
| Total (Overall) | 2,113 (50.0%) | 2,111 (50.0%) |
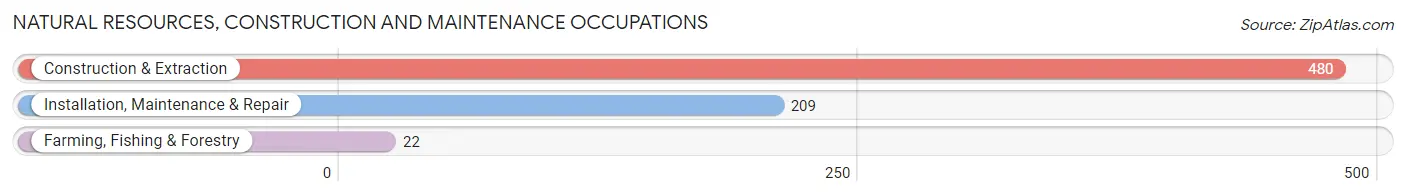
Natural Resources, Construction and Maintenance Occupations
The most common Natural Resources, Construction and Maintenance occupations in Yelm are Construction & Extraction (480 | 11.4%), Installation, Maintenance & Repair (209 | 5.0%), and Farming, Fishing & Forestry (22 | 0.5%).
Natural Resources, Construction and Maintenance Occupations by Sex
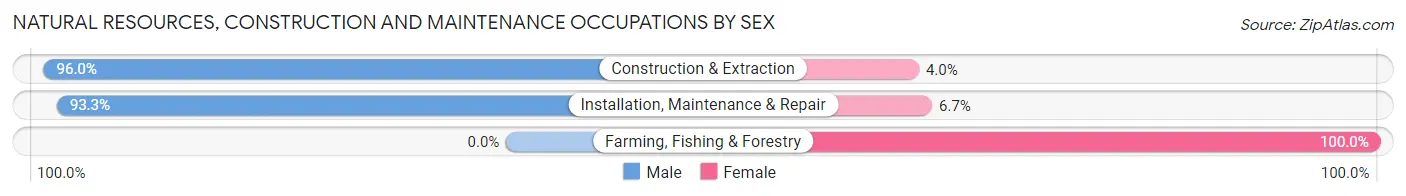
| Occupation | Male | Female |
| Farming, Fishing & Forestry | 0 (0.0%) | 22 (100.0%) |
| Construction & Extraction | 461 (96.0%) | 19 (4.0%) |
| Installation, Maintenance & Repair | 195 (93.3%) | 14 (6.7%) |
| Total (Category) | 656 (92.3%) | 55 (7.7%) |
| Total (Overall) | 2,113 (50.0%) | 2,111 (50.0%) |
Production, Transportation and Moving Occupations
The most common Production, Transportation and Moving occupations in Yelm are Material Moving (228 | 5.4%), Transportation (166 | 3.9%), and Production (100 | 2.4%).
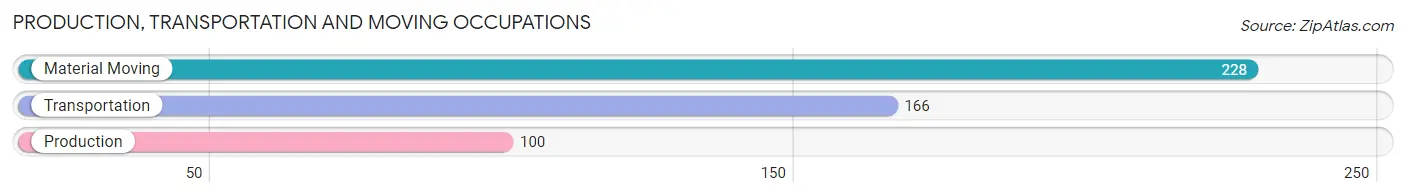
Production, Transportation and Moving Occupations by Sex
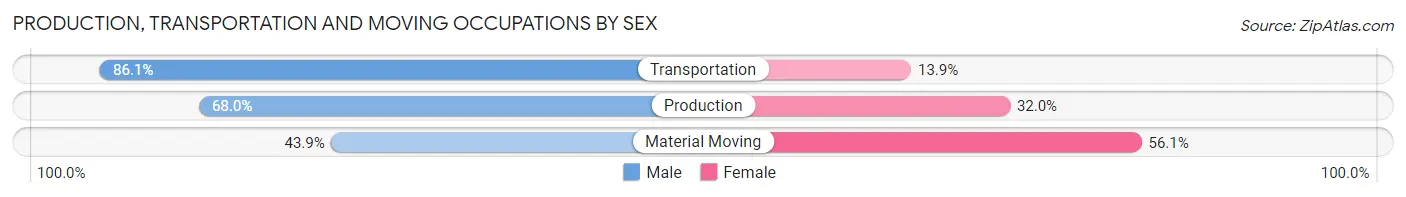
| Occupation | Male | Female |
| Production | 68 (68.0%) | 32 (32.0%) |
| Transportation | 143 (86.1%) | 23 (13.9%) |
| Material Moving | 100 (43.9%) | 128 (56.1%) |
| Total (Category) | 311 (63.0%) | 183 (37.0%) |
| Total (Overall) | 2,113 (50.0%) | 2,111 (50.0%) |
Employment Industries by Sex in Yelm
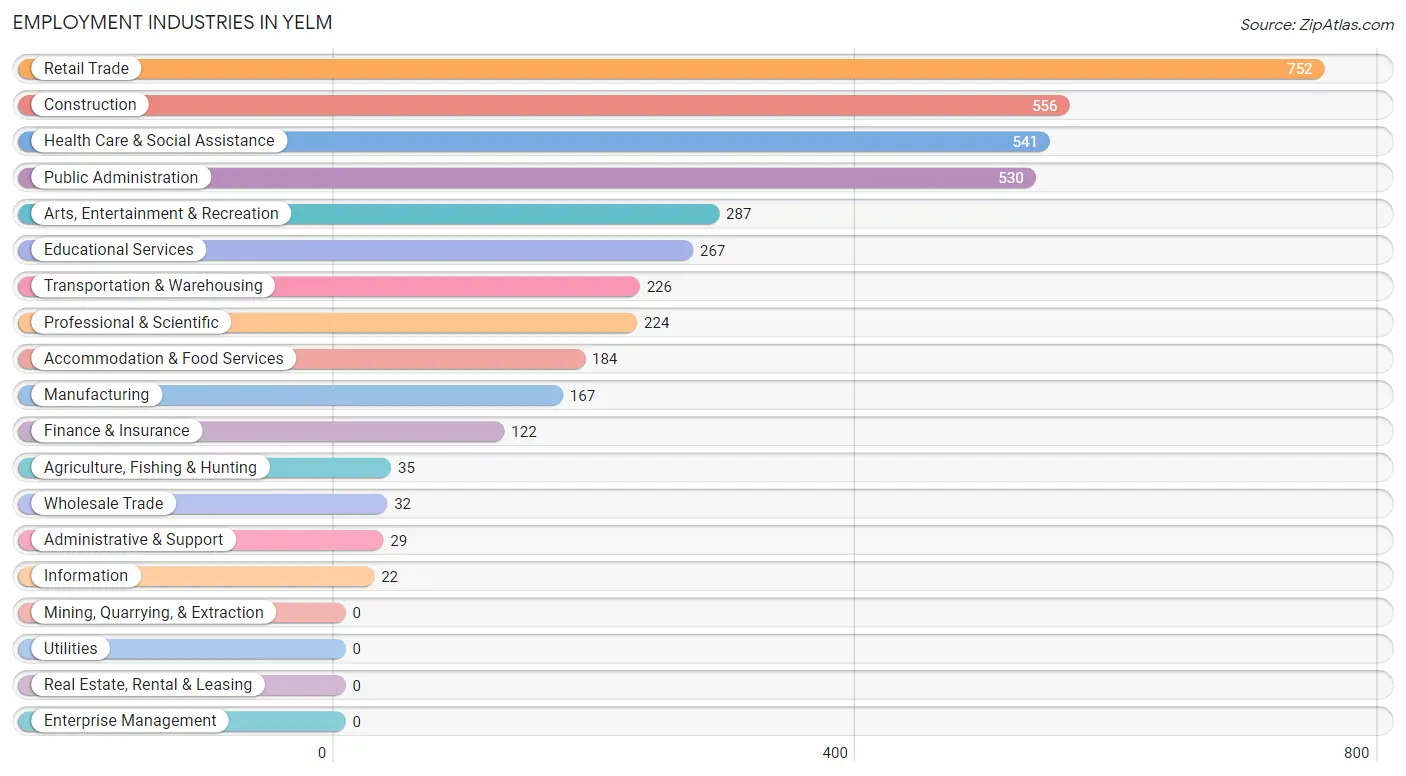
Employment Industries in Yelm
The major employment industries in Yelm include Retail Trade (752 | 17.8%), Construction (556 | 13.2%), Health Care & Social Assistance (541 | 12.8%), Public Administration (530 | 12.6%), and Arts, Entertainment & Recreation (287 | 6.8%).
Employment Industries by Sex in Yelm
The Yelm industries that see more men than women are Wholesale Trade (100.0%), Information (100.0%), and Construction (94.1%), whereas the industries that tend to have a higher number of women are Finance & Insurance (100.0%), Health Care & Social Assistance (75.4%), and Educational Services (70.4%).
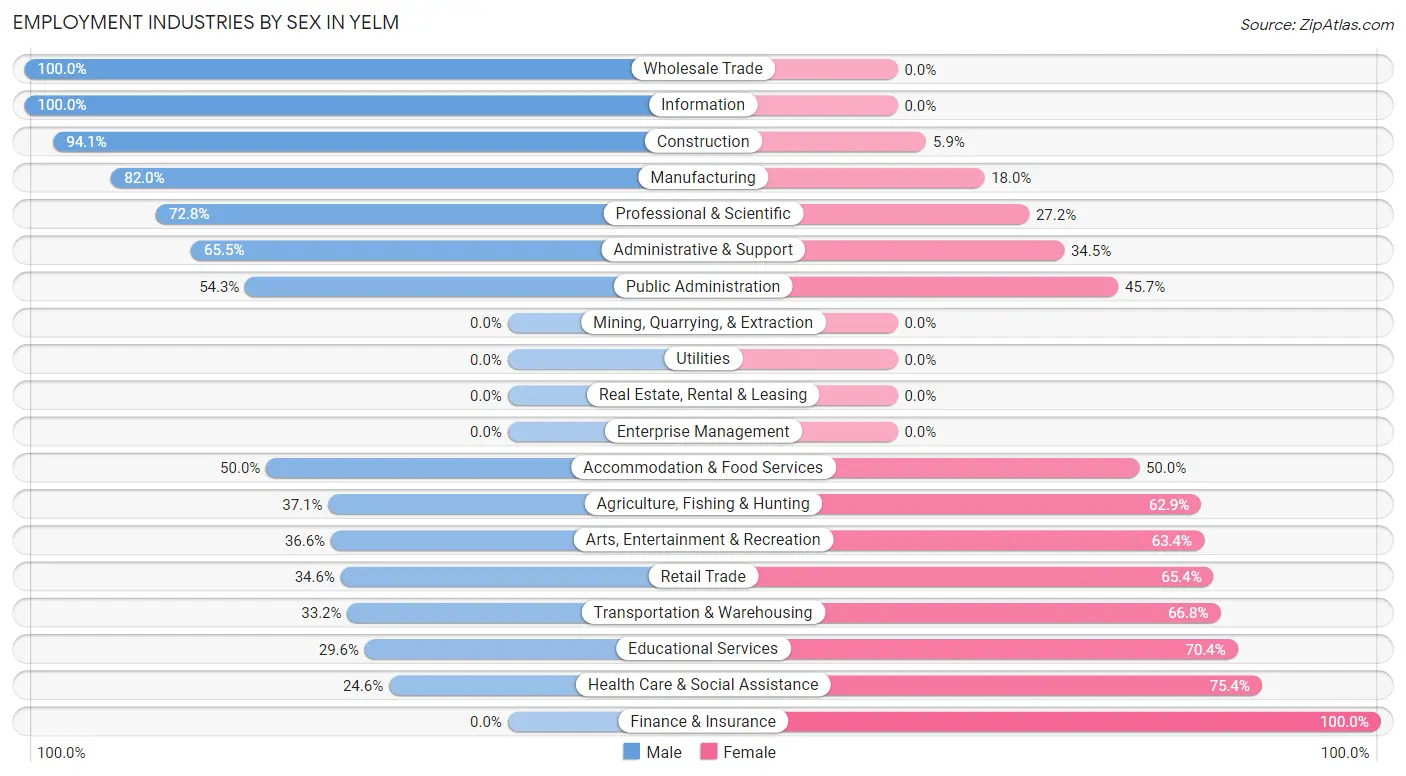
| Industry | Male | Female |
| Agriculture, Fishing & Hunting | 13 (37.1%) | 22 (62.9%) |
| Mining, Quarrying, & Extraction | 0 (0.0%) | 0 (0.0%) |
| Construction | 523 (94.1%) | 33 (5.9%) |
| Manufacturing | 137 (82.0%) | 30 (18.0%) |
| Wholesale Trade | 32 (100.0%) | 0 (0.0%) |
| Retail Trade | 260 (34.6%) | 492 (65.4%) |
| Transportation & Warehousing | 75 (33.2%) | 151 (66.8%) |
| Utilities | 0 (0.0%) | 0 (0.0%) |
| Information | 22 (100.0%) | 0 (0.0%) |
| Finance & Insurance | 0 (0.0%) | 122 (100.0%) |
| Real Estate, Rental & Leasing | 0 (0.0%) | 0 (0.0%) |
| Professional & Scientific | 163 (72.8%) | 61 (27.2%) |
| Enterprise Management | 0 (0.0%) | 0 (0.0%) |
| Administrative & Support | 19 (65.5%) | 10 (34.5%) |
| Educational Services | 79 (29.6%) | 188 (70.4%) |
| Health Care & Social Assistance | 133 (24.6%) | 408 (75.4%) |
| Arts, Entertainment & Recreation | 105 (36.6%) | 182 (63.4%) |
| Accommodation & Food Services | 92 (50.0%) | 92 (50.0%) |
| Public Administration | 288 (54.3%) | 242 (45.7%) |
| Total | 2,113 (50.0%) | 2,111 (50.0%) |
Education in Yelm
School Enrollment in Yelm
The most common levels of schooling among the 3,182 students in Yelm are college / undergraduate (829 | 26.1%), middle school (725 | 22.8%), and high school (651 | 20.5%).
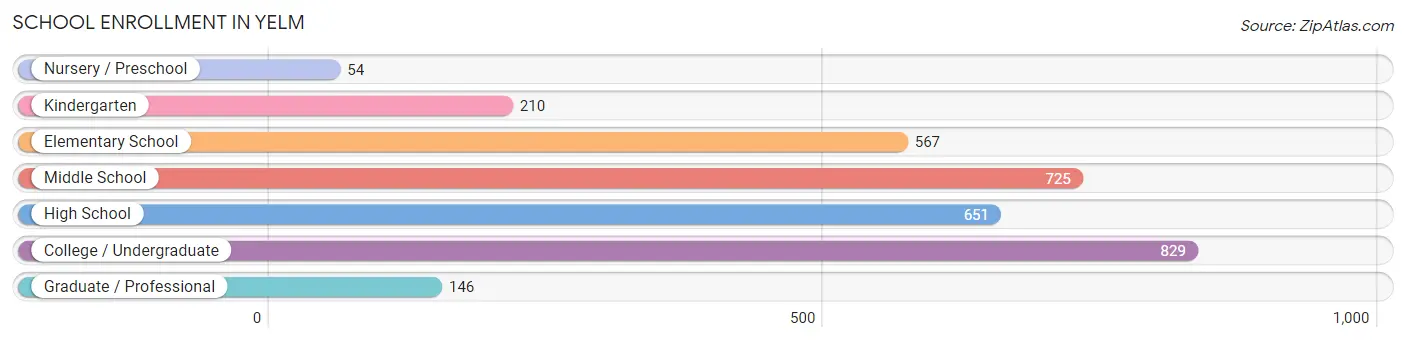
| School Level | # Students | % Students |
| Nursery / Preschool | 54 | 1.7% |
| Kindergarten | 210 | 6.6% |
| Elementary School | 567 | 17.8% |
| Middle School | 725 | 22.8% |
| High School | 651 | 20.5% |
| College / Undergraduate | 829 | 26.1% |
| Graduate / Professional | 146 | 4.6% |
| Total | 3,182 | 100.0% |
School Enrollment by Age by Funding Source in Yelm
Out of a total of 3,182 students who are enrolled in schools in Yelm, 369 (11.6%) attend a private institution, while the remaining 2,813 (88.4%) are enrolled in public schools. The age group of 18 to 19 year olds has the highest likelihood of being enrolled in private schools, with 61 (75.3% in the age bracket) enrolled. Conversely, the age group of 15 to 17 year olds has the lowest likelihood of being enrolled in a private school, with 582 (100.0% in the age bracket) attending a public institution.
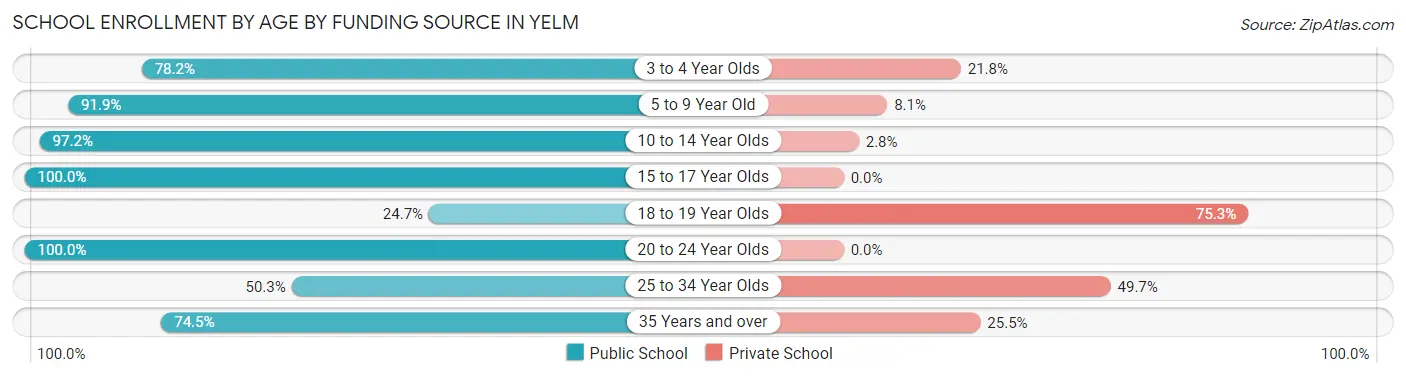
| Age Bracket | Public School | Private School |
| 3 to 4 Year Olds | 43 (78.2%) | 12 (21.8%) |
| 5 to 9 Year Old | 691 (91.9%) | 61 (8.1%) |
| 10 to 14 Year Olds | 762 (97.2%) | 22 (2.8%) |
| 15 to 17 Year Olds | 582 (100.0%) | 0 (0.0%) |
| 18 to 19 Year Olds | 20 (24.7%) | 61 (75.3%) |
| 20 to 24 Year Olds | 264 (100.0%) | 0 (0.0%) |
| 25 to 34 Year Olds | 91 (50.3%) | 90 (49.7%) |
| 35 Years and over | 360 (74.5%) | 123 (25.5%) |
| Total | 2,813 (88.4%) | 369 (11.6%) |
Educational Attainment by Field of Study in Yelm
Education (251 | 17.4%), business (187 | 13.0%), literature & languages (149 | 10.3%), psychology (126 | 8.7%), and science & technology (120 | 8.3%) are the most common fields of study among 1,442 individuals in Yelm who have obtained a bachelor's degree or higher.
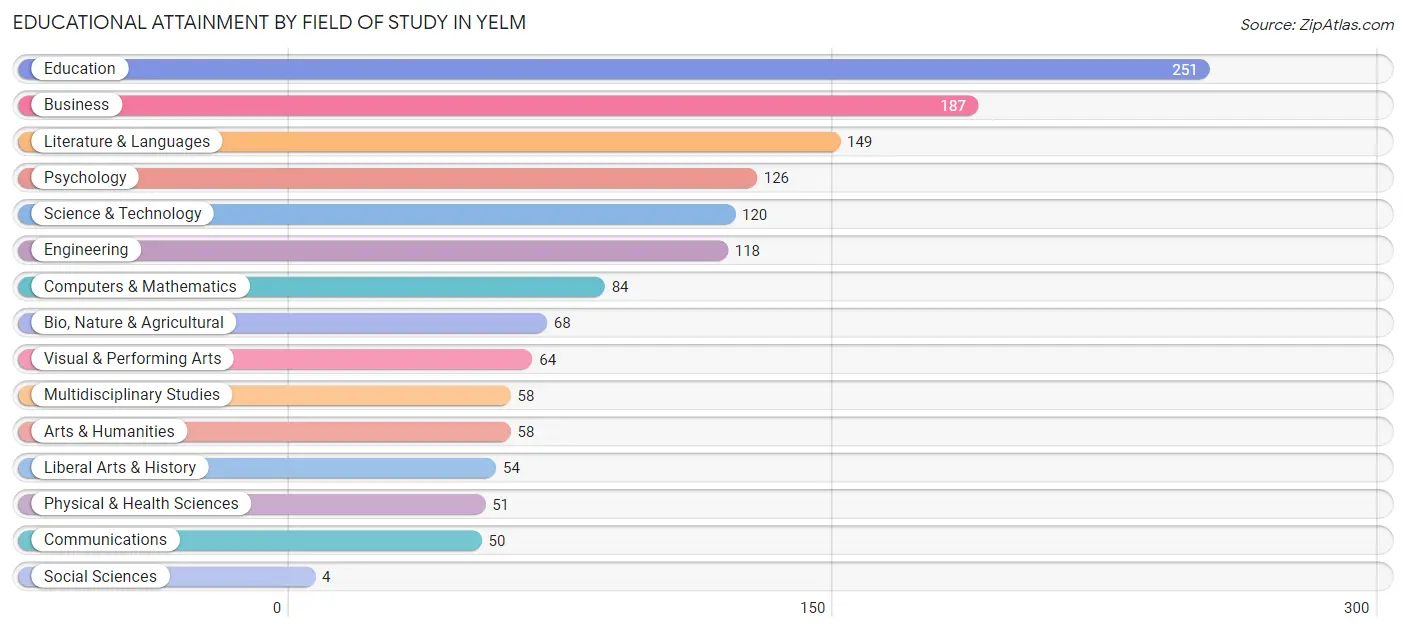
| Field of Study | # Graduates | % Graduates |
| Computers & Mathematics | 84 | 5.8% |
| Bio, Nature & Agricultural | 68 | 4.7% |
| Physical & Health Sciences | 51 | 3.5% |
| Psychology | 126 | 8.7% |
| Social Sciences | 4 | 0.3% |
| Engineering | 118 | 8.2% |
| Multidisciplinary Studies | 58 | 4.0% |
| Science & Technology | 120 | 8.3% |
| Business | 187 | 13.0% |
| Education | 251 | 17.4% |
| Literature & Languages | 149 | 10.3% |
| Liberal Arts & History | 54 | 3.7% |
| Visual & Performing Arts | 64 | 4.4% |
| Communications | 50 | 3.5% |
| Arts & Humanities | 58 | 4.0% |
| Total | 1,442 | 100.0% |
Transportation & Commute in Yelm
Vehicle Availability by Sex in Yelm
The most prevalent vehicle ownership categories in Yelm are males with 2 vehicles (1,504, accounting for 54.5%) and females with 2 vehicles (1,009, making up 68.9%).
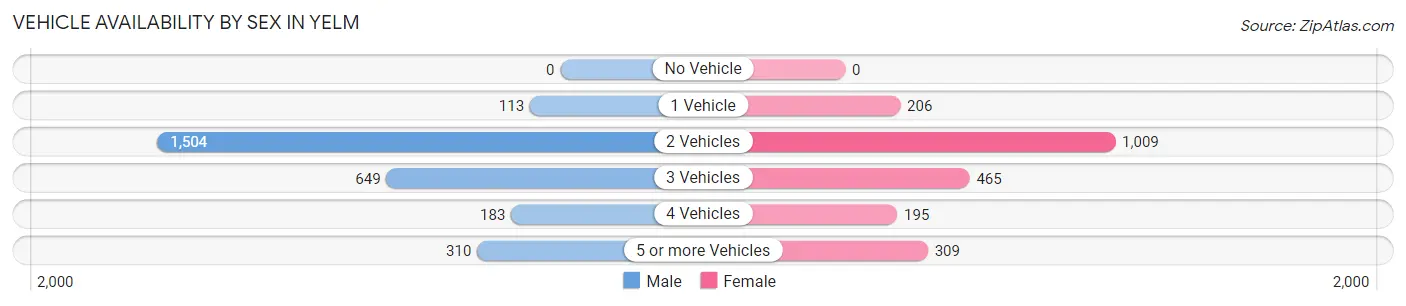
| Vehicles Available | Male | Female |
| No Vehicle | 0 (0.0%) | 0 (0.0%) |
| 1 Vehicle | 113 (4.1%) | 206 (9.4%) |
| 2 Vehicles | 1,504 (54.5%) | 1,009 (46.2%) |
| 3 Vehicles | 649 (23.5%) | 465 (21.3%) |
| 4 Vehicles | 183 (6.6%) | 195 (8.9%) |
| 5 or more Vehicles | 310 (11.2%) | 309 (14.1%) |
| Total | 2,759 (100.0%) | 2,184 (100.0%) |
Commute Time in Yelm
The most frequently occuring commute durations in Yelm are 45 to 59 minutes (863 commuters, 18.2%), 30 to 34 minutes (832 commuters, 17.5%), and 35 to 39 minutes (688 commuters, 14.5%).
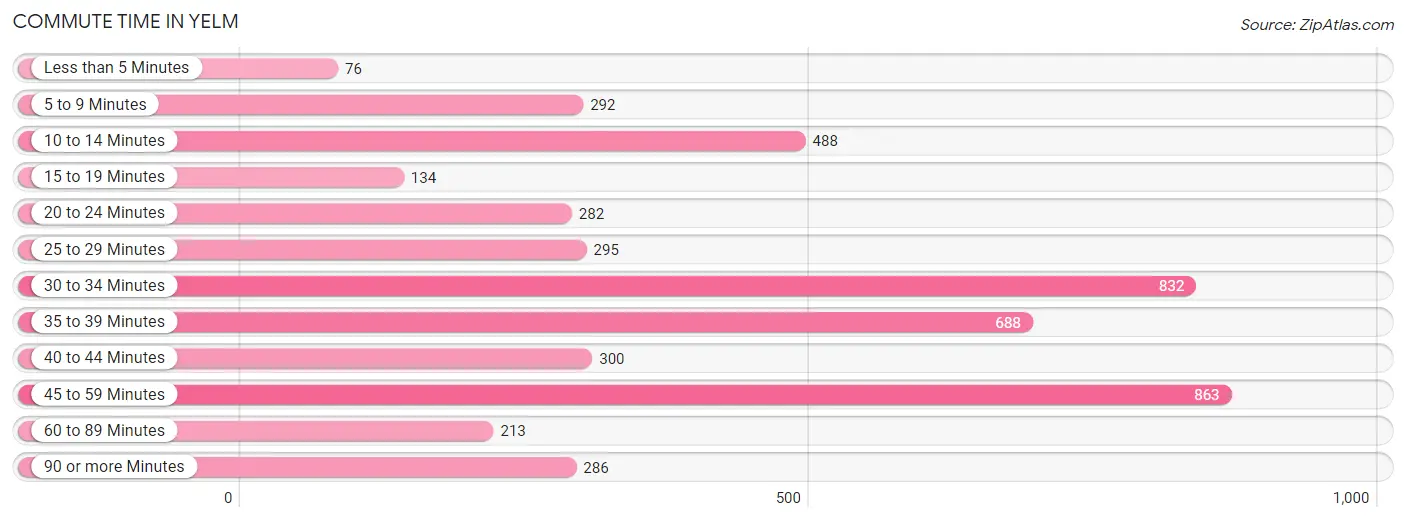
| Commute Time | # Commuters | % Commuters |
| Less than 5 Minutes | 76 | 1.6% |
| 5 to 9 Minutes | 292 | 6.1% |
| 10 to 14 Minutes | 488 | 10.3% |
| 15 to 19 Minutes | 134 | 2.8% |
| 20 to 24 Minutes | 282 | 5.9% |
| 25 to 29 Minutes | 295 | 6.2% |
| 30 to 34 Minutes | 832 | 17.5% |
| 35 to 39 Minutes | 688 | 14.5% |
| 40 to 44 Minutes | 300 | 6.3% |
| 45 to 59 Minutes | 863 | 18.2% |
| 60 to 89 Minutes | 213 | 4.5% |
| 90 or more Minutes | 286 | 6.0% |
Commute Time by Sex in Yelm
The most common commute times in Yelm are 30 to 34 minutes (581 commuters, 21.2%) for males and 45 to 59 minutes (411 commuters, 20.5%) for females.
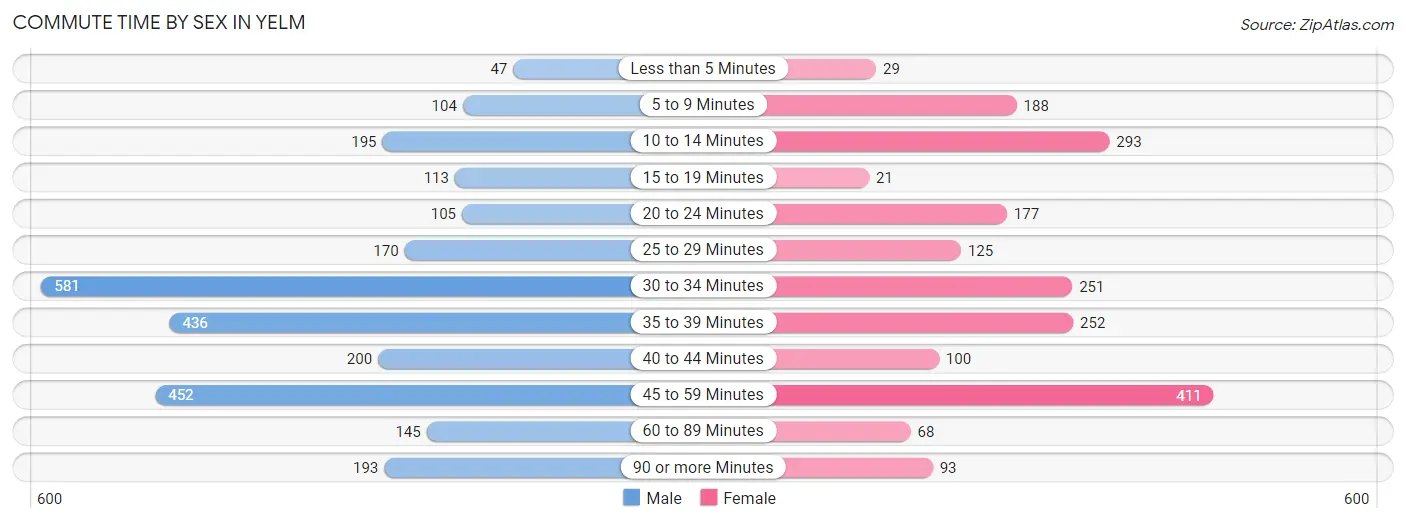
| Commute Time | Male | Female |
| Less than 5 Minutes | 47 (1.7%) | 29 (1.4%) |
| 5 to 9 Minutes | 104 (3.8%) | 188 (9.4%) |
| 10 to 14 Minutes | 195 (7.1%) | 293 (14.6%) |
| 15 to 19 Minutes | 113 (4.1%) | 21 (1.1%) |
| 20 to 24 Minutes | 105 (3.8%) | 177 (8.8%) |
| 25 to 29 Minutes | 170 (6.2%) | 125 (6.2%) |
| 30 to 34 Minutes | 581 (21.2%) | 251 (12.5%) |
| 35 to 39 Minutes | 436 (15.9%) | 252 (12.6%) |
| 40 to 44 Minutes | 200 (7.3%) | 100 (5.0%) |
| 45 to 59 Minutes | 452 (16.5%) | 411 (20.5%) |
| 60 to 89 Minutes | 145 (5.3%) | 68 (3.4%) |
| 90 or more Minutes | 193 (7.0%) | 93 (4.6%) |
Time of Departure to Work by Sex in Yelm
The most frequent times of departure to work in Yelm are 12:00 AM to 4:59 AM (530, 19.3%) for males and 7:00 AM to 7:29 AM (335, 16.7%) for females.
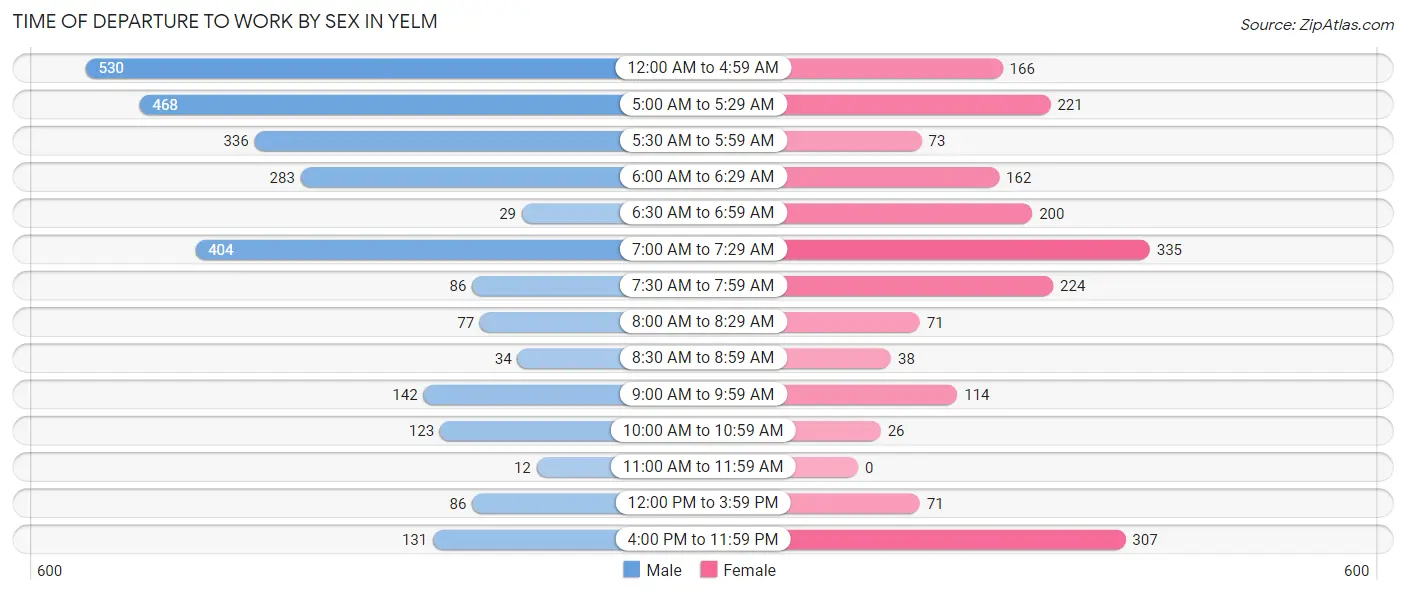
| Time of Departure | Male | Female |
| 12:00 AM to 4:59 AM | 530 (19.3%) | 166 (8.3%) |
| 5:00 AM to 5:29 AM | 468 (17.1%) | 221 (11.0%) |
| 5:30 AM to 5:59 AM | 336 (12.3%) | 73 (3.6%) |
| 6:00 AM to 6:29 AM | 283 (10.3%) | 162 (8.1%) |
| 6:30 AM to 6:59 AM | 29 (1.1%) | 200 (10.0%) |
| 7:00 AM to 7:29 AM | 404 (14.7%) | 335 (16.7%) |
| 7:30 AM to 7:59 AM | 86 (3.1%) | 224 (11.2%) |
| 8:00 AM to 8:29 AM | 77 (2.8%) | 71 (3.5%) |
| 8:30 AM to 8:59 AM | 34 (1.2%) | 38 (1.9%) |
| 9:00 AM to 9:59 AM | 142 (5.2%) | 114 (5.7%) |
| 10:00 AM to 10:59 AM | 123 (4.5%) | 26 (1.3%) |
| 11:00 AM to 11:59 AM | 12 (0.4%) | 0 (0.0%) |
| 12:00 PM to 3:59 PM | 86 (3.1%) | 71 (3.5%) |
| 4:00 PM to 11:59 PM | 131 (4.8%) | 307 (15.3%) |
| Total | 2,741 (100.0%) | 2,008 (100.0%) |
Housing Occupancy in Yelm
Occupancy by Ownership in Yelm
Of the total 3,314 dwellings in Yelm, owner-occupied units account for 2,333 (70.4%), while renter-occupied units make up 981 (29.6%).
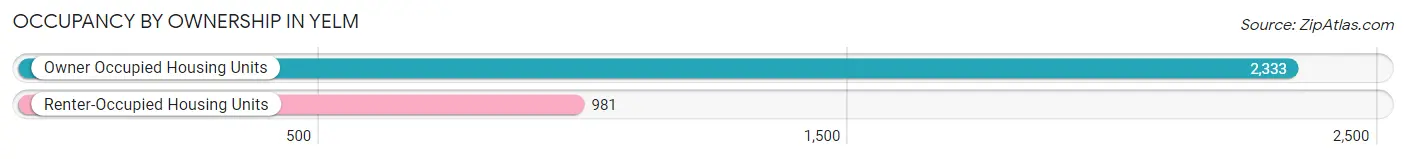
| Occupancy | # Housing Units | % Housing Units |
| Owner Occupied Housing Units | 2,333 | 70.4% |
| Renter-Occupied Housing Units | 981 | 29.6% |
| Total Occupied Housing Units | 3,314 | 100.0% |
Occupancy by Household Size in Yelm
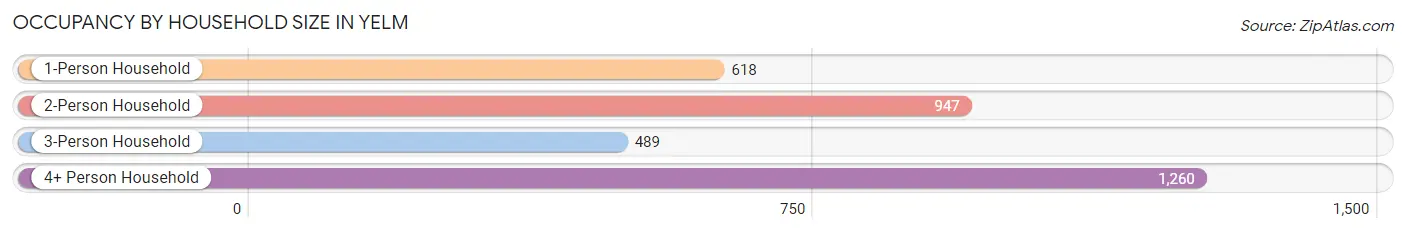
| Household Size | # Housing Units | % Housing Units |
| 1-Person Household | 618 | 18.6% |
| 2-Person Household | 947 | 28.6% |
| 3-Person Household | 489 | 14.8% |
| 4+ Person Household | 1,260 | 38.0% |
| Total Housing Units | 3,314 | 100.0% |
Occupancy by Ownership by Household Size in Yelm
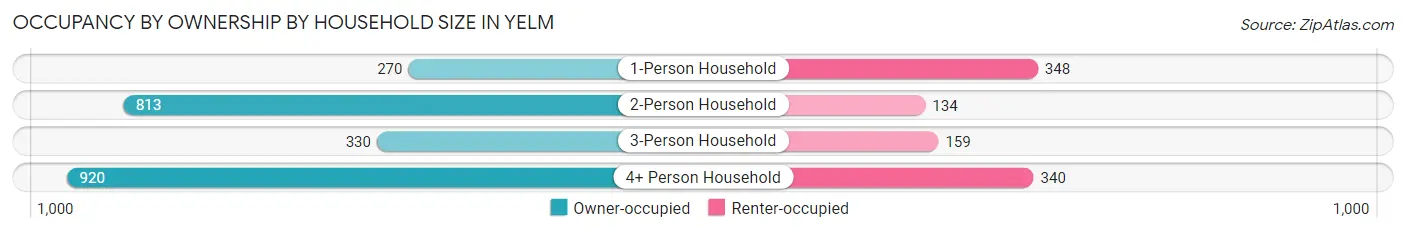
| Household Size | Owner-occupied | Renter-occupied |
| 1-Person Household | 270 (43.7%) | 348 (56.3%) |
| 2-Person Household | 813 (85.9%) | 134 (14.1%) |
| 3-Person Household | 330 (67.5%) | 159 (32.5%) |
| 4+ Person Household | 920 (73.0%) | 340 (27.0%) |
| Total Housing Units | 2,333 (70.4%) | 981 (29.6%) |
Occupancy by Educational Attainment in Yelm
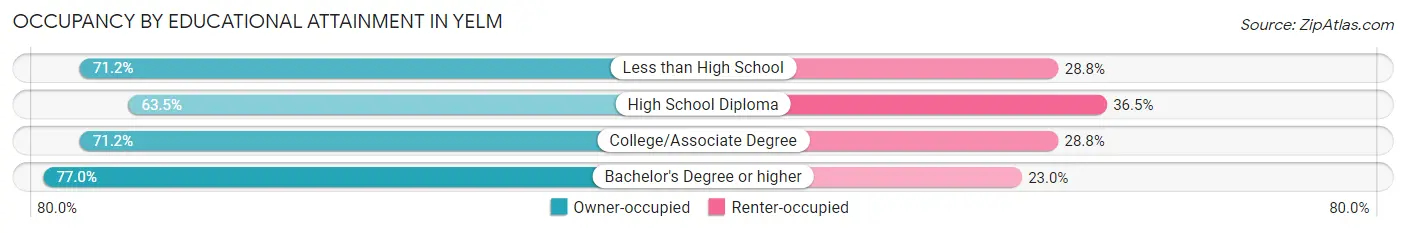
| Household Size | Owner-occupied | Renter-occupied |
| Less than High School | 84 (71.2%) | 34 (28.8%) |
| High School Diploma | 529 (63.5%) | 304 (36.5%) |
| College/Associate Degree | 1,228 (71.2%) | 496 (28.8%) |
| Bachelor's Degree or higher | 492 (77.0%) | 147 (23.0%) |
Occupancy by Age of Householder in Yelm
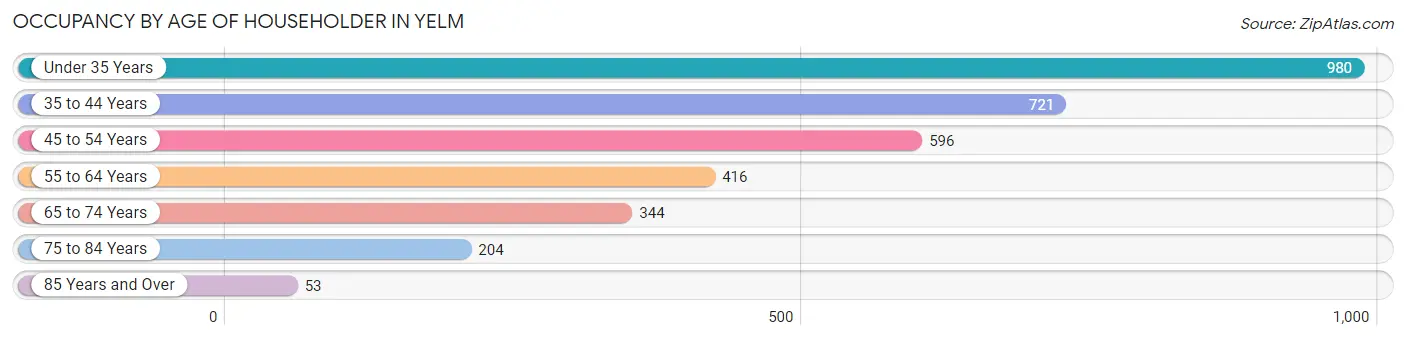
| Age Bracket | # Households | % Households |
| Under 35 Years | 980 | 29.6% |
| 35 to 44 Years | 721 | 21.8% |
| 45 to 54 Years | 596 | 18.0% |
| 55 to 64 Years | 416 | 12.6% |
| 65 to 74 Years | 344 | 10.4% |
| 75 to 84 Years | 204 | 6.2% |
| 85 Years and Over | 53 | 1.6% |
| Total | 3,314 | 100.0% |
Housing Finances in Yelm
Median Income by Occupancy in Yelm
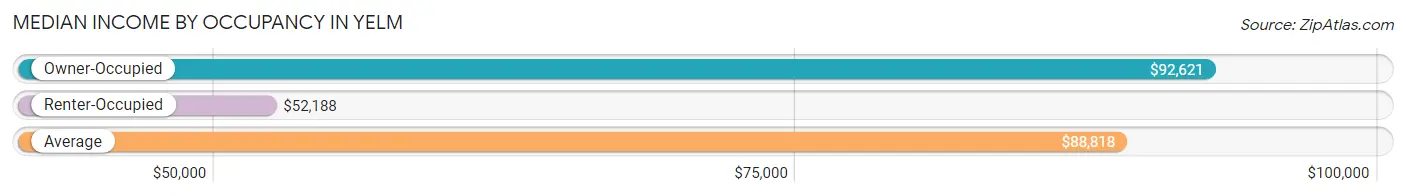
| Occupancy Type | # Households | Median Income |
| Owner-Occupied | 2,333 (70.4%) | $92,621 |
| Renter-Occupied | 981 (29.6%) | $52,188 |
| Average | 3,314 (100.0%) | $88,818 |
Occupancy by Householder Income Bracket in Yelm
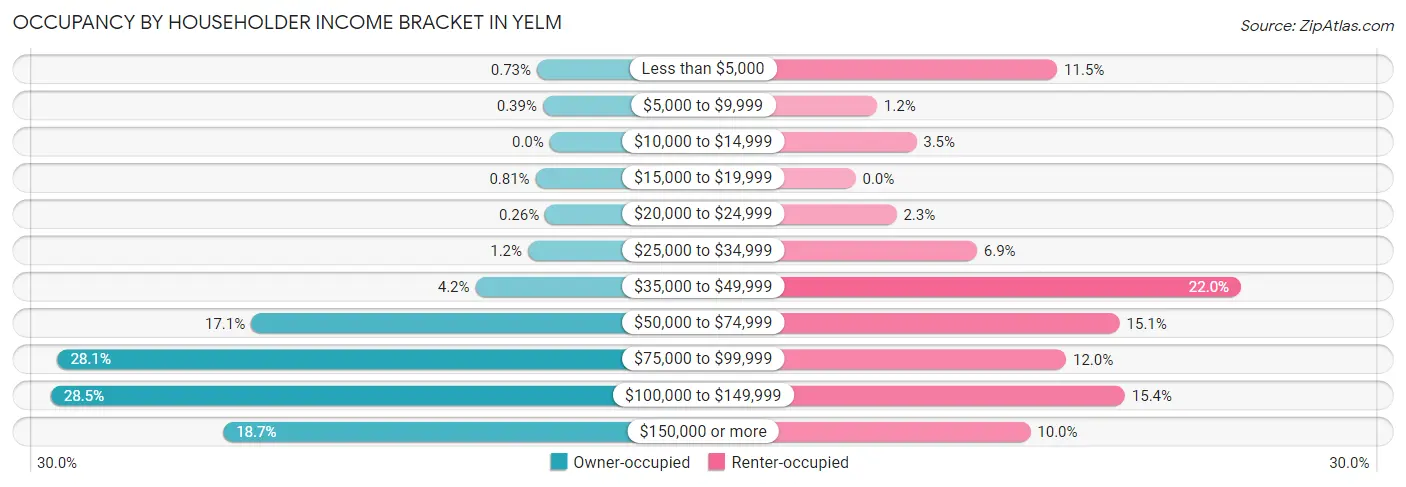
| Income Bracket | Owner-occupied | Renter-occupied |
| Less than $5,000 | 17 (0.7%) | 113 (11.5%) |
| $5,000 to $9,999 | 9 (0.4%) | 12 (1.2%) |
| $10,000 to $14,999 | 0 (0.0%) | 34 (3.5%) |
| $15,000 to $19,999 | 19 (0.8%) | 0 (0.0%) |
| $20,000 to $24,999 | 6 (0.3%) | 23 (2.3%) |
| $25,000 to $34,999 | 29 (1.2%) | 68 (6.9%) |
| $35,000 to $49,999 | 99 (4.2%) | 216 (22.0%) |
| $50,000 to $74,999 | 398 (17.1%) | 148 (15.1%) |
| $75,000 to $99,999 | 656 (28.1%) | 118 (12.0%) |
| $100,000 to $149,999 | 665 (28.5%) | 151 (15.4%) |
| $150,000 or more | 435 (18.6%) | 98 (10.0%) |
| Total | 2,333 (100.0%) | 981 (100.0%) |
Monthly Housing Cost Tiers in Yelm
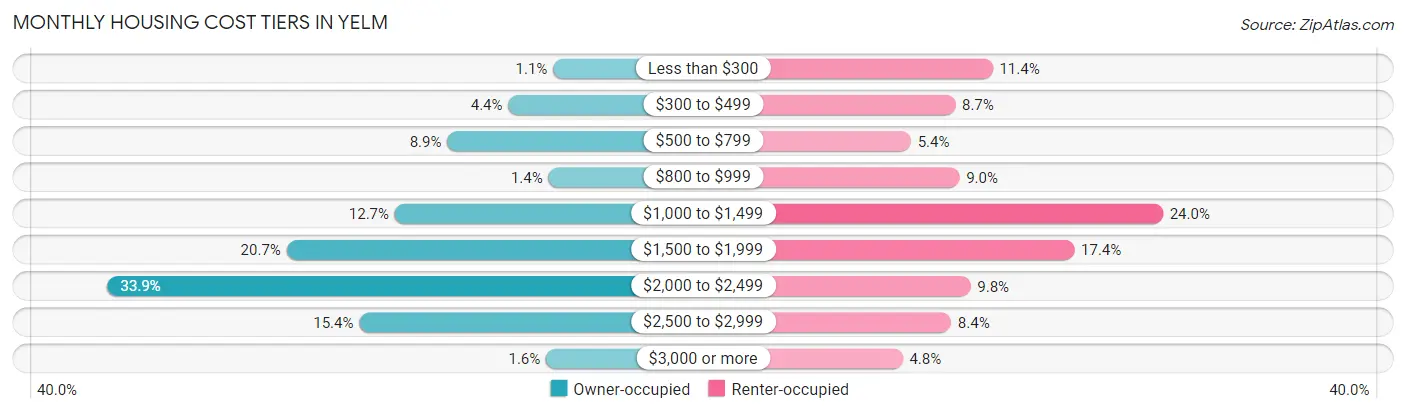
| Monthly Cost | Owner-occupied | Renter-occupied |
| Less than $300 | 25 (1.1%) | 112 (11.4%) |
| $300 to $499 | 102 (4.4%) | 85 (8.7%) |
| $500 to $799 | 207 (8.9%) | 53 (5.4%) |
| $800 to $999 | 33 (1.4%) | 88 (9.0%) |
| $1,000 to $1,499 | 297 (12.7%) | 235 (24.0%) |
| $1,500 to $1,999 | 483 (20.7%) | 171 (17.4%) |
| $2,000 to $2,499 | 791 (33.9%) | 96 (9.8%) |
| $2,500 to $2,999 | 358 (15.3%) | 82 (8.4%) |
| $3,000 or more | 37 (1.6%) | 47 (4.8%) |
| Total | 2,333 (100.0%) | 981 (100.0%) |
Physical Housing Characteristics in Yelm
Housing Structures in Yelm
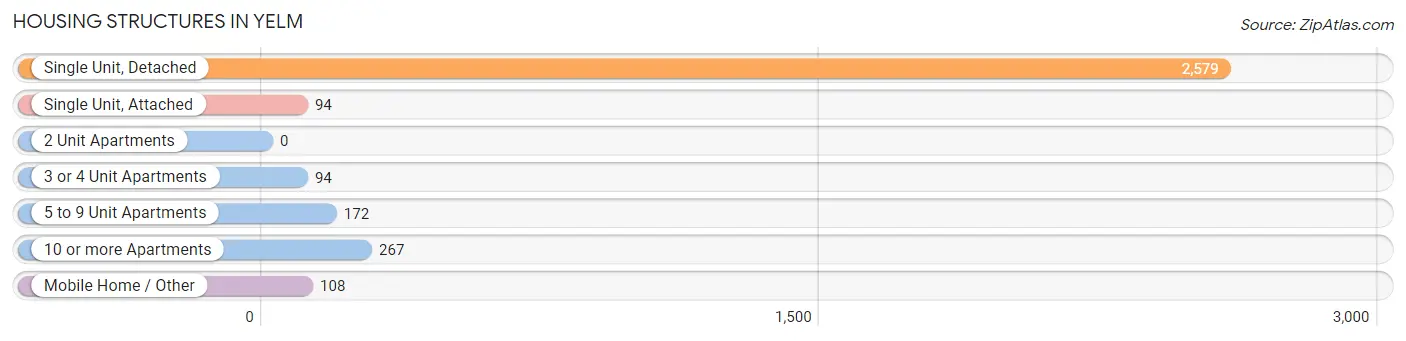
| Structure Type | # Housing Units | % Housing Units |
| Single Unit, Detached | 2,579 | 77.8% |
| Single Unit, Attached | 94 | 2.8% |
| 2 Unit Apartments | 0 | 0.0% |
| 3 or 4 Unit Apartments | 94 | 2.8% |
| 5 to 9 Unit Apartments | 172 | 5.2% |
| 10 or more Apartments | 267 | 8.1% |
| Mobile Home / Other | 108 | 3.3% |
| Total | 3,314 | 100.0% |
Housing Structures by Occupancy in Yelm
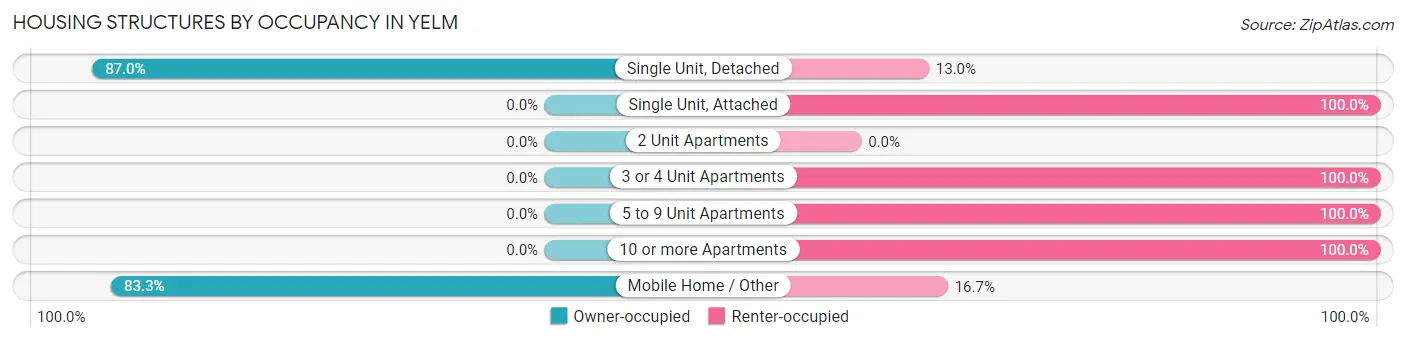
| Structure Type | Owner-occupied | Renter-occupied |
| Single Unit, Detached | 2,243 (87.0%) | 336 (13.0%) |
| Single Unit, Attached | 0 (0.0%) | 94 (100.0%) |
| 2 Unit Apartments | 0 (0.0%) | 0 (0.0%) |
| 3 or 4 Unit Apartments | 0 (0.0%) | 94 (100.0%) |
| 5 to 9 Unit Apartments | 0 (0.0%) | 172 (100.0%) |
| 10 or more Apartments | 0 (0.0%) | 267 (100.0%) |
| Mobile Home / Other | 90 (83.3%) | 18 (16.7%) |
| Total | 2,333 (70.4%) | 981 (29.6%) |
Housing Structures by Number of Rooms in Yelm
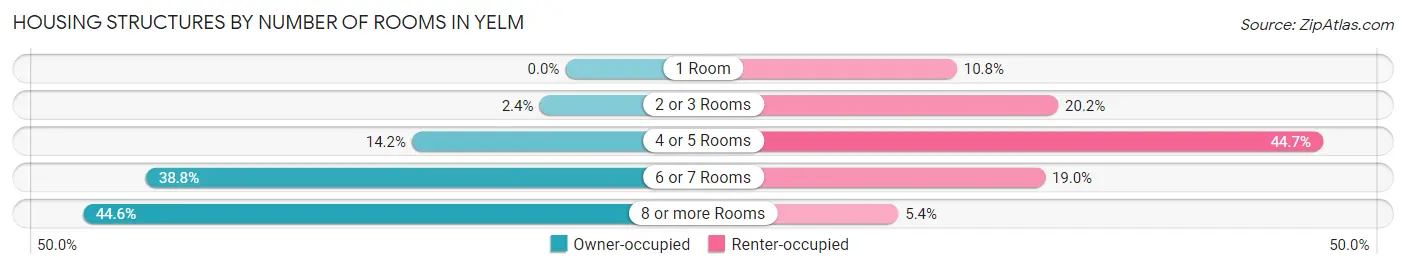
| Number of Rooms | Owner-occupied | Renter-occupied |
| 1 Room | 0 (0.0%) | 106 (10.8%) |
| 2 or 3 Rooms | 56 (2.4%) | 198 (20.2%) |
| 4 or 5 Rooms | 331 (14.2%) | 438 (44.7%) |
| 6 or 7 Rooms | 905 (38.8%) | 186 (19.0%) |
| 8 or more Rooms | 1,041 (44.6%) | 53 (5.4%) |
| Total | 2,333 (100.0%) | 981 (100.0%) |
Housing Structure by Heating Type in Yelm
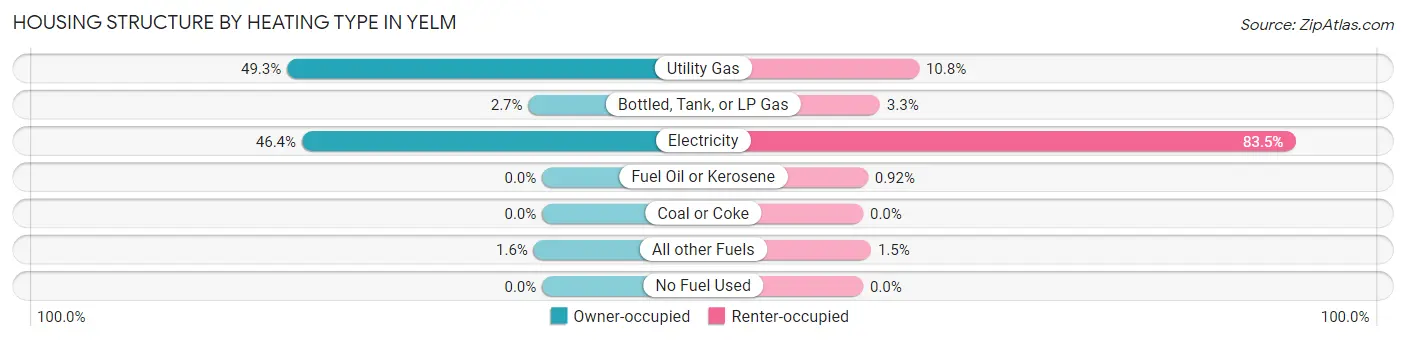
| Heating Type | Owner-occupied | Renter-occupied |
| Utility Gas | 1,150 (49.3%) | 106 (10.8%) |
| Bottled, Tank, or LP Gas | 62 (2.7%) | 32 (3.3%) |
| Electricity | 1,083 (46.4%) | 819 (83.5%) |
| Fuel Oil or Kerosene | 0 (0.0%) | 9 (0.9%) |
| Coal or Coke | 0 (0.0%) | 0 (0.0%) |
| All other Fuels | 38 (1.6%) | 15 (1.5%) |
| No Fuel Used | 0 (0.0%) | 0 (0.0%) |
| Total | 2,333 (100.0%) | 981 (100.0%) |
Household Vehicle Usage in Yelm
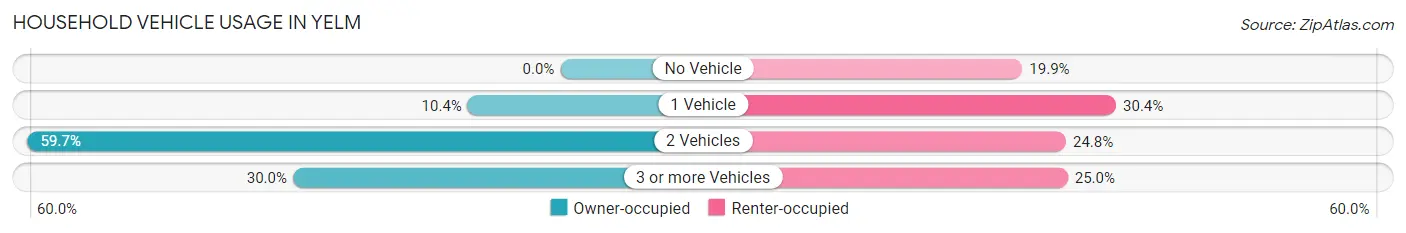
| Vehicles per Household | Owner-occupied | Renter-occupied |
| No Vehicle | 0 (0.0%) | 195 (19.9%) |
| 1 Vehicle | 242 (10.4%) | 298 (30.4%) |
| 2 Vehicles | 1,392 (59.7%) | 243 (24.8%) |
| 3 or more Vehicles | 699 (30.0%) | 245 (25.0%) |
| Total | 2,333 (100.0%) | 981 (100.0%) |
Real Estate & Mortgages in Yelm
Real Estate and Mortgage Overview in Yelm
| Characteristic | Without Mortgage | With Mortgage |
| Housing Units | 374 | 1,959 |
| Median Property Value | $376,300 | $383,800 |
| Median Household Income | $81,613 | $361 |
| Monthly Housing Costs | $591 | $37 |
| Real Estate Taxes | $2,725 | $50 |
Property Value by Mortgage Status in Yelm
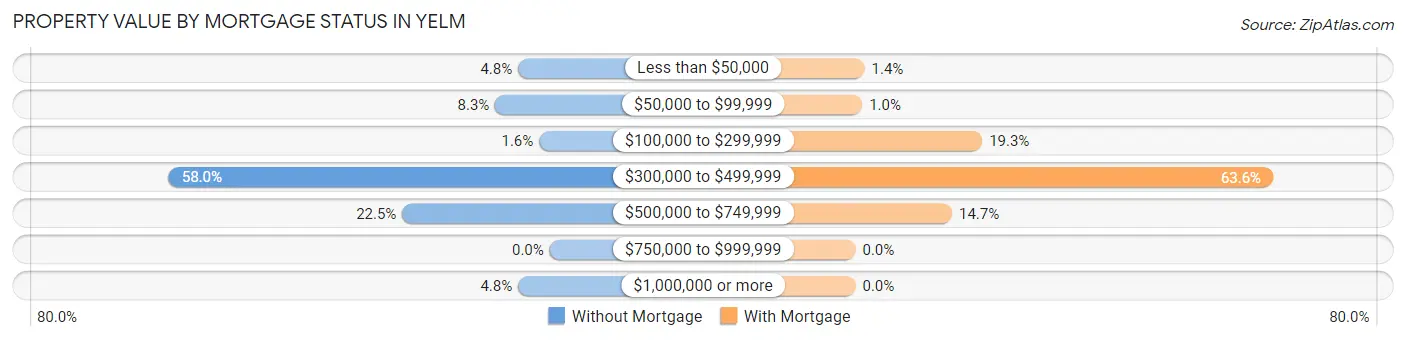
| Property Value | Without Mortgage | With Mortgage |
| Less than $50,000 | 18 (4.8%) | 27 (1.4%) |
| $50,000 to $99,999 | 31 (8.3%) | 20 (1.0%) |
| $100,000 to $299,999 | 6 (1.6%) | 378 (19.3%) |
| $300,000 to $499,999 | 217 (58.0%) | 1,246 (63.6%) |
| $500,000 to $749,999 | 84 (22.5%) | 288 (14.7%) |
| $750,000 to $999,999 | 0 (0.0%) | 0 (0.0%) |
| $1,000,000 or more | 18 (4.8%) | 0 (0.0%) |
| Total | 374 (100.0%) | 1,959 (100.0%) |
Household Income by Mortgage Status in Yelm
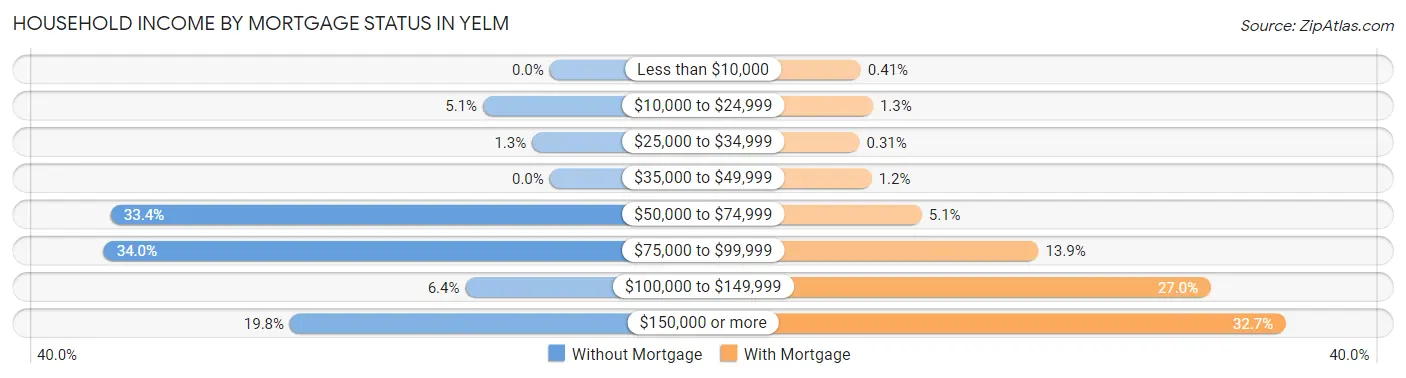
| Household Income | Without Mortgage | With Mortgage |
| Less than $10,000 | 0 (0.0%) | 8 (0.4%) |
| $10,000 to $24,999 | 19 (5.1%) | 26 (1.3%) |
| $25,000 to $34,999 | 5 (1.3%) | 6 (0.3%) |
| $35,000 to $49,999 | 0 (0.0%) | 24 (1.2%) |
| $50,000 to $74,999 | 125 (33.4%) | 99 (5.1%) |
| $75,000 to $99,999 | 127 (34.0%) | 273 (13.9%) |
| $100,000 to $149,999 | 24 (6.4%) | 529 (27.0%) |
| $150,000 or more | 74 (19.8%) | 641 (32.7%) |
| Total | 374 (100.0%) | 1,959 (100.0%) |
Property Value to Household Income Ratio in Yelm
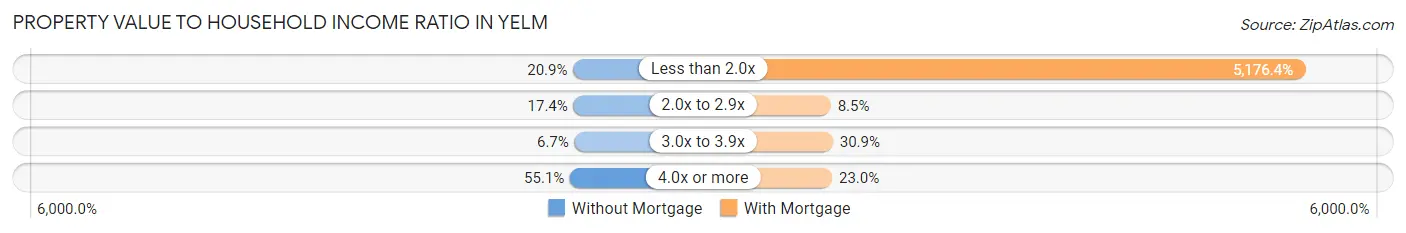
| Value-to-Income Ratio | Without Mortgage | With Mortgage |
| Less than 2.0x | 78 (20.9%) | 101,406 (5,176.4%) |
| 2.0x to 2.9x | 65 (17.4%) | 167 (8.5%) |
| 3.0x to 3.9x | 25 (6.7%) | 606 (30.9%) |
| 4.0x or more | 206 (55.1%) | 451 (23.0%) |
| Total | 374 (100.0%) | 1,959 (100.0%) |
Real Estate Taxes by Mortgage Status in Yelm
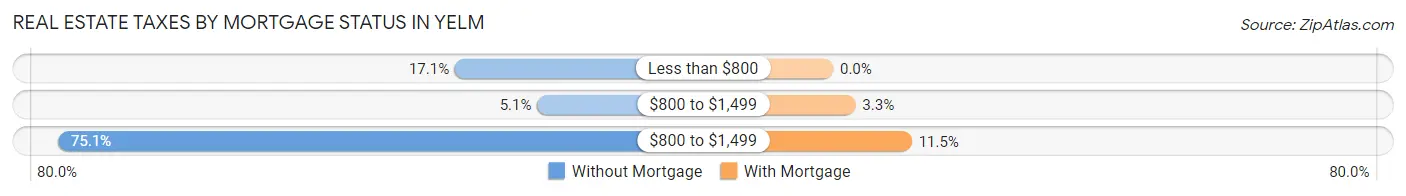
| Property Taxes | Without Mortgage | With Mortgage |
| Less than $800 | 64 (17.1%) | 0 (0.0%) |
| $800 to $1,499 | 19 (5.1%) | 64 (3.3%) |
| $800 to $1,499 | 281 (75.1%) | 225 (11.5%) |
| Total | 374 (100.0%) | 1,959 (100.0%) |
Health & Disability in Yelm
Health Insurance Coverage by Age in Yelm
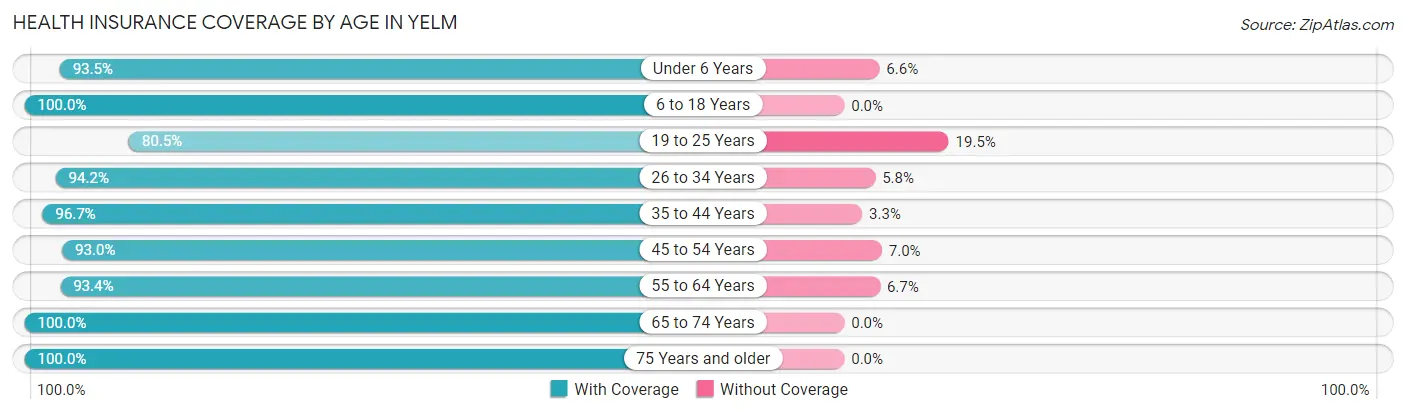
| Age Bracket | With Coverage | Without Coverage |
| Under 6 Years | 941 (93.4%) | 66 (6.6%) |
| 6 to 18 Years | 2,188 (100.0%) | 0 (0.0%) |
| 19 to 25 Years | 948 (80.5%) | 229 (19.5%) |
| 26 to 34 Years | 1,111 (94.2%) | 68 (5.8%) |
| 35 to 44 Years | 1,276 (96.7%) | 44 (3.3%) |
| 45 to 54 Years | 1,090 (93.0%) | 82 (7.0%) |
| 55 to 64 Years | 786 (93.3%) | 56 (6.7%) |
| 65 to 74 Years | 375 (100.0%) | 0 (0.0%) |
| 75 Years and older | 377 (100.0%) | 0 (0.0%) |
| Total | 9,092 (94.3%) | 545 (5.7%) |
Health Insurance Coverage by Citizenship Status in Yelm
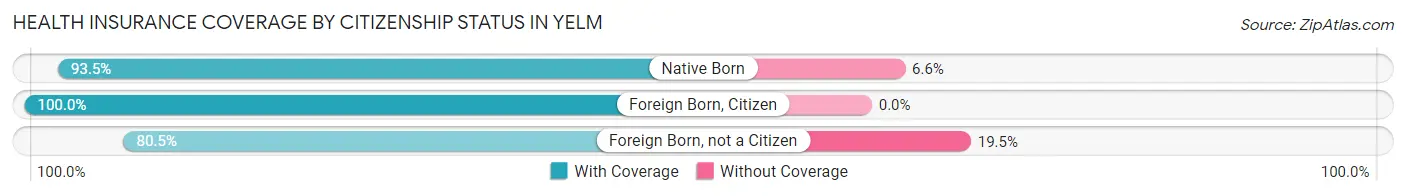
| Citizenship Status | With Coverage | Without Coverage |
| Native Born | 941 (93.4%) | 66 (6.6%) |
| Foreign Born, Citizen | 2,188 (100.0%) | 0 (0.0%) |
| Foreign Born, not a Citizen | 948 (80.5%) | 229 (19.5%) |
Health Insurance Coverage by Household Income in Yelm
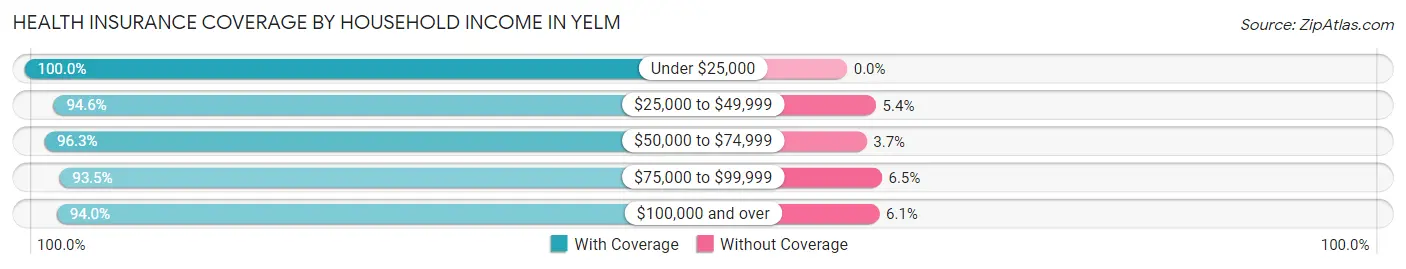
| Household Income | With Coverage | Without Coverage |
| Under $25,000 | 290 (100.0%) | 0 (0.0%) |
| $25,000 to $49,999 | 979 (94.6%) | 56 (5.4%) |
| $50,000 to $74,999 | 944 (96.3%) | 36 (3.7%) |
| $75,000 to $99,999 | 2,140 (93.5%) | 149 (6.5%) |
| $100,000 and over | 4,720 (94.0%) | 304 (6.0%) |
Public vs Private Health Insurance Coverage by Age in Yelm
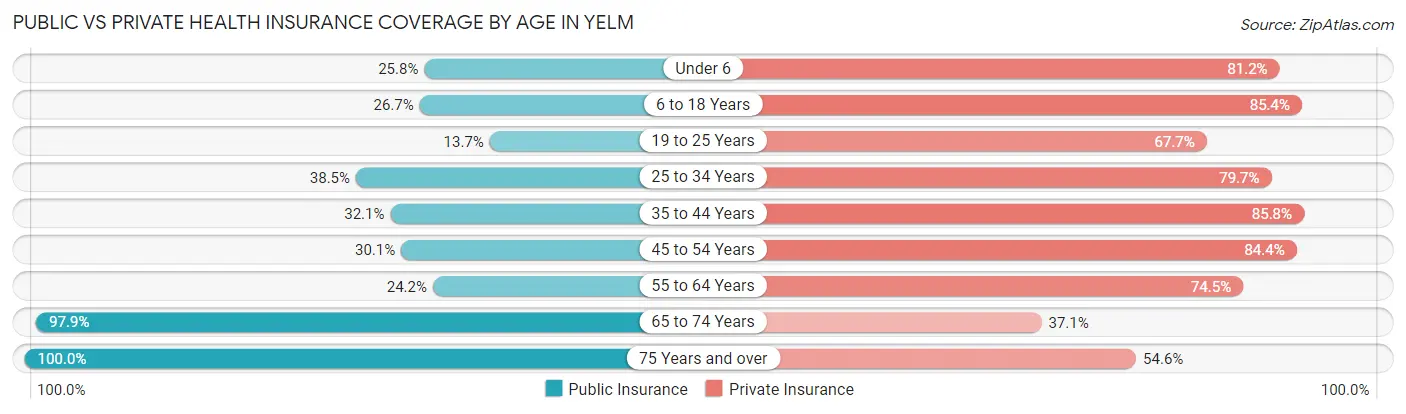
| Age Bracket | Public Insurance | Private Insurance |
| Under 6 | 260 (25.8%) | 818 (81.2%) |
| 6 to 18 Years | 584 (26.7%) | 1,868 (85.4%) |
| 19 to 25 Years | 161 (13.7%) | 797 (67.7%) |
| 25 to 34 Years | 454 (38.5%) | 940 (79.7%) |
| 35 to 44 Years | 424 (32.1%) | 1,132 (85.8%) |
| 45 to 54 Years | 353 (30.1%) | 989 (84.4%) |
| 55 to 64 Years | 204 (24.2%) | 627 (74.5%) |
| 65 to 74 Years | 367 (97.9%) | 139 (37.1%) |
| 75 Years and over | 377 (100.0%) | 206 (54.6%) |
| Total | 3,184 (33.0%) | 7,516 (78.0%) |
Disability Status by Sex by Age in Yelm
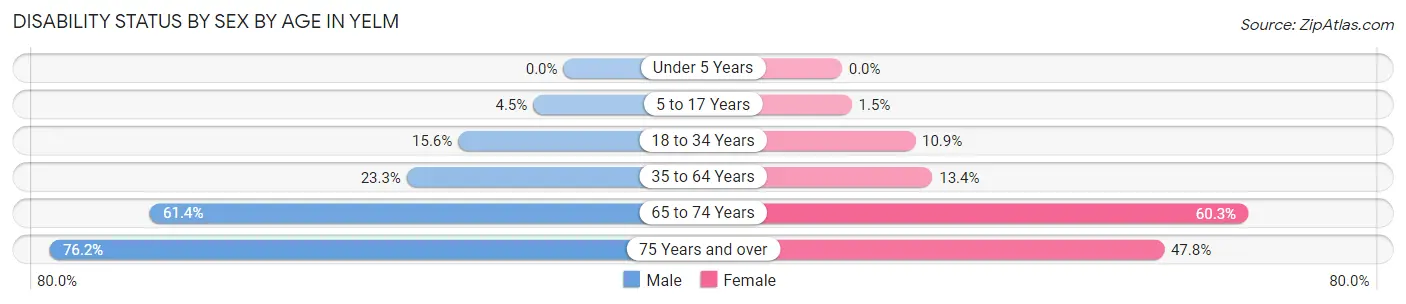
| Age Bracket | Male | Female |
| Under 5 Years | 0 (0.0%) | 0 (0.0%) |
| 5 to 17 Years | 48 (4.5%) | 18 (1.5%) |
| 18 to 34 Years | 173 (15.6%) | 144 (10.9%) |
| 35 to 64 Years | 362 (23.3%) | 239 (13.4%) |
| 65 to 74 Years | 108 (61.4%) | 120 (60.3%) |
| 75 Years and over | 93 (76.2%) | 122 (47.8%) |
Disability Class by Sex by Age in Yelm
Disability Class: Hearing Difficulty
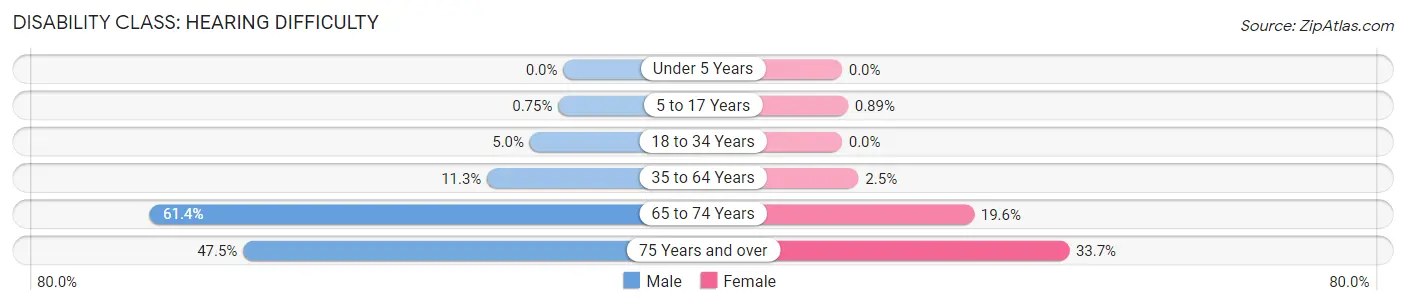
| Age Bracket | Male | Female |
| Under 5 Years | 0 (0.0%) | 0 (0.0%) |
| 5 to 17 Years | 8 (0.7%) | 11 (0.9%) |
| 18 to 34 Years | 55 (5.0%) | 0 (0.0%) |
| 35 to 64 Years | 176 (11.3%) | 44 (2.5%) |
| 65 to 74 Years | 108 (61.4%) | 39 (19.6%) |
| 75 Years and over | 58 (47.5%) | 86 (33.7%) |
Disability Class: Vision Difficulty
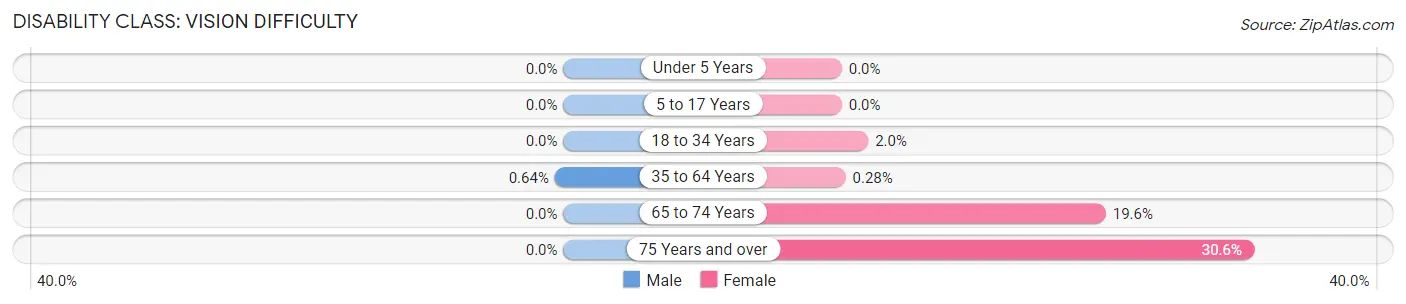
| Age Bracket | Male | Female |
| Under 5 Years | 0 (0.0%) | 0 (0.0%) |
| 5 to 17 Years | 0 (0.0%) | 0 (0.0%) |
| 18 to 34 Years | 0 (0.0%) | 26 (2.0%) |
| 35 to 64 Years | 10 (0.6%) | 5 (0.3%) |
| 65 to 74 Years | 0 (0.0%) | 39 (19.6%) |
| 75 Years and over | 0 (0.0%) | 78 (30.6%) |
Disability Class: Cognitive Difficulty
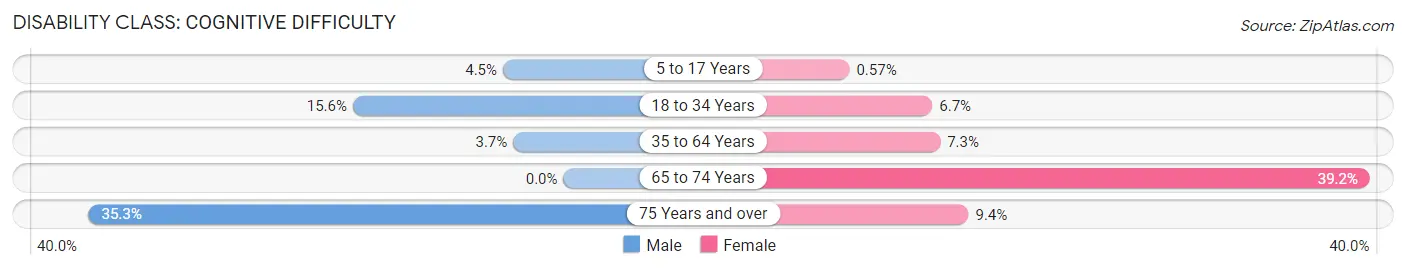
| Age Bracket | Male | Female |
| 5 to 17 Years | 48 (4.5%) | 7 (0.6%) |
| 18 to 34 Years | 173 (15.6%) | 89 (6.7%) |
| 35 to 64 Years | 58 (3.7%) | 130 (7.3%) |
| 65 to 74 Years | 0 (0.0%) | 78 (39.2%) |
| 75 Years and over | 43 (35.2%) | 24 (9.4%) |
Disability Class: Ambulatory Difficulty
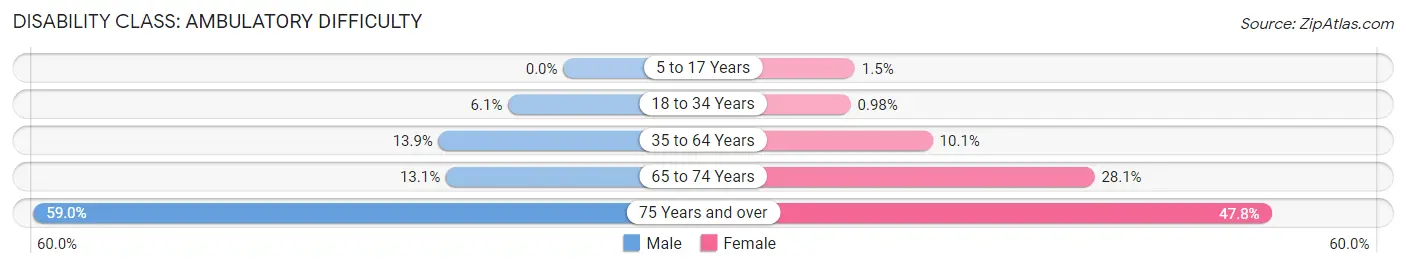
| Age Bracket | Male | Female |
| 5 to 17 Years | 0 (0.0%) | 18 (1.5%) |
| 18 to 34 Years | 68 (6.1%) | 13 (1.0%) |
| 35 to 64 Years | 216 (13.9%) | 180 (10.1%) |
| 65 to 74 Years | 23 (13.1%) | 56 (28.1%) |
| 75 Years and over | 72 (59.0%) | 122 (47.8%) |
Disability Class: Self-Care Difficulty
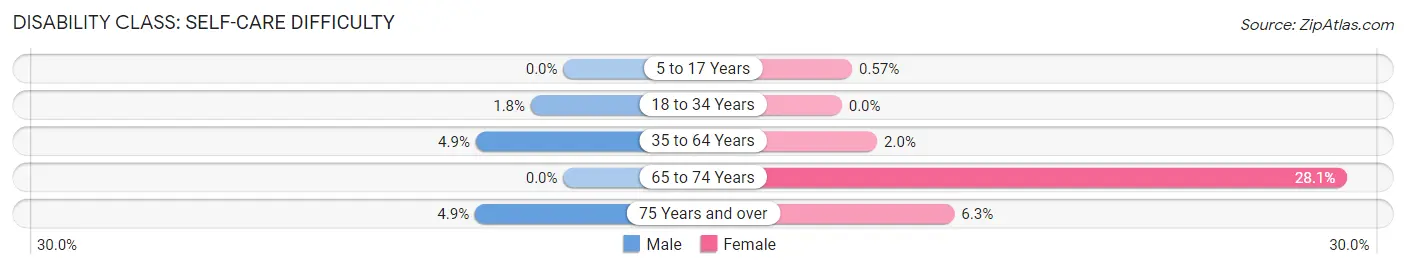
| Age Bracket | Male | Female |
| 5 to 17 Years | 0 (0.0%) | 7 (0.6%) |
| 18 to 34 Years | 20 (1.8%) | 0 (0.0%) |
| 35 to 64 Years | 76 (4.9%) | 35 (2.0%) |
| 65 to 74 Years | 0 (0.0%) | 56 (28.1%) |
| 75 Years and over | 6 (4.9%) | 16 (6.3%) |
Technology Access in Yelm
Computing Device Access in Yelm
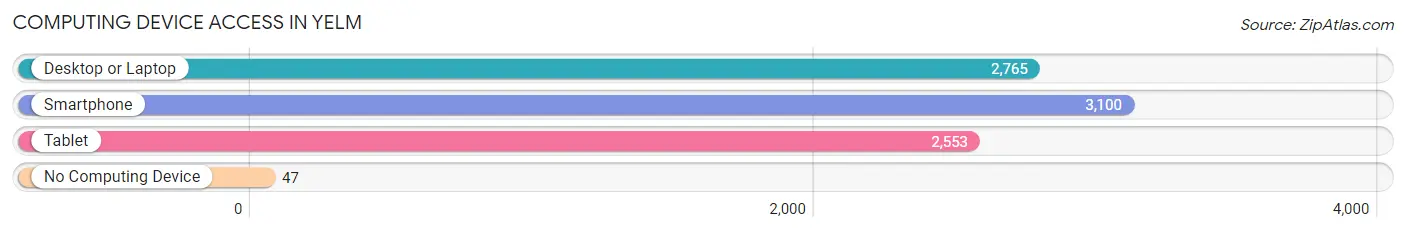
| Device Type | # Households | % Households |
| Desktop or Laptop | 2,765 | 83.4% |
| Smartphone | 3,100 | 93.5% |
| Tablet | 2,553 | 77.0% |
| No Computing Device | 47 | 1.4% |
| Total | 3,314 | 100.0% |
Internet Access in Yelm
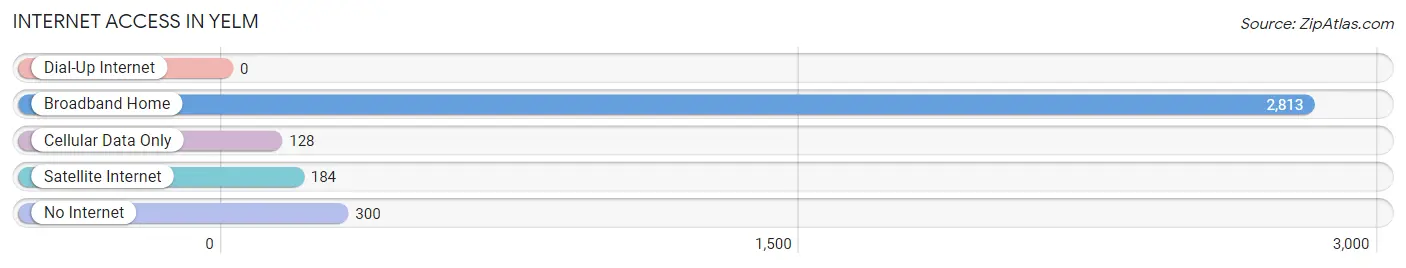
| Internet Type | # Households | % Households |
| Dial-Up Internet | 0 | 0.0% |
| Broadband Home | 2,813 | 84.9% |
| Cellular Data Only | 128 | 3.9% |
| Satellite Internet | 184 | 5.6% |
| No Internet | 300 | 9.0% |
| Total | 3,314 | 100.0% |
Yelm Summary
Yelm is a city located in Thurston County, Washington, United States. It is located approximately 25 miles southeast of Olympia, the state capital. The population was 6,848 at the 2010 census.
History
Yelm was first settled in 1853 by a group of settlers from the Oregon Territory. The town was named after the nearby Yelm Prairie, which was named after the Chinook word for “heat” or “warmth”. The town was officially incorporated in 1924.
In the early 1900s, Yelm was a small farming community, with a population of only a few hundred people. The town was primarily supported by the logging industry, which provided jobs for many of the town’s residents.
In the 1950s, the town began to grow rapidly, as the population increased from 1,000 to over 5,000. This growth was largely due to the construction of the nearby Nisqually River Dam, which provided irrigation for the area’s farms.
In the late 1970s, the town experienced a period of rapid growth, as the population increased from 5,000 to over 10,000. This growth was largely due to the construction of the nearby Olympia-Yelm Highway, which provided easy access to the larger cities of Olympia and Tacoma.
Geography
Yelm is located at 46°59′N 122°41′W (46.983, -122.683). According to the United States Census Bureau, the city has a total area of 5.3 square miles (13.7 km2), of which, 5.2 square miles (13.5 km2) is land and 0.1 square miles (0.2 km2) is water.
The city is located in the Nisqually River Valley, which is surrounded by the Cascade Mountains to the east and the Olympic Mountains to the west. The city is located approximately 25 miles southeast of Olympia, the state capital.
Economy
Yelm’s economy is largely based on agriculture and tourism. The city is home to several farms, which produce a variety of crops, including apples, cherries, and vegetables. The city is also home to several wineries, which produce a variety of wines.
The city is also home to several businesses, including a variety of restaurants, retail stores, and service providers. The city is also home to several manufacturing companies, which produce a variety of products, including furniture, clothing, and electronics.
Demographics
As of the 2010 census, there were 6,848 people, 2,717 households, and 1,845 families residing in the city. The population density was 1,312.3 people per square mile (506.2/km2). There were 2,945 housing units at an average density of 563.3 per square mile (217.7/km2). The racial makeup of the city was 81.2% White, 0.7% African American, 1.2% Native American, 1.2% Asian, 0.2% Pacific Islander, 11.7% from other races, and 3.8% from two or more races. Hispanic or Latino of any race were 20.2% of the population.
There were 2,717 households, out of which 33.2% had children under the age of 18 living with them, 48.2% were married couples living together, 13.7% had a female householder with no husband present, and 32.2% were non-families. 25.7% of all households were made up of individuals, and 8.3% had someone living alone who was 65 years of age or older. The average household size was 2.51 and the average family size was 3.02.
In the city, the population was spread out, with 25.9% under the age of 18, 8.7% from 18 to 24, 28.3% from 25 to 44, 24.3% from 45 to 64, and 12.8% who were 65 years of age or older. The median age was 36 years. For every 100 females, there were 97.2 males. For every 100 females age 18 and over, there were 94.2 males.
The median income for a household in the city was $41,944, and the median income for a family was $50,944. Males had a median income of $41,944 versus $30,944 for females. The per capita income for the city was $20,944. About 10.2% of families and 13.7% of the population were below the poverty line, including 17.7% of those under age 18 and 8.3% of those age 65 or over.
Common Questions
What is Per Capita Income in Yelm?
Per Capita income in Yelm is $31,622.
What is the Median Family Income in Yelm?
Median Family Income in Yelm is $91,375.
What is the Median Household income in Yelm?
Median Household Income in Yelm is $88,818.
What is Income or Wage Gap in Yelm?
Income or Wage Gap in Yelm is 45.5%.
Women in Yelm earn 54.5 cents for every dollar earned by a man.
What is Inequality or Gini Index in Yelm?
Inequality or Gini Index in Yelm is 0.31.
What is the Total Population of Yelm?
Total Population of Yelm is 10,438.
What is the Total Male Population of Yelm?
Total Male Population of Yelm is 4,988.
What is the Total Female Population of Yelm?
Total Female Population of Yelm is 5,450.
What is the Ratio of Males per 100 Females in Yelm?
There are 91.52 Males per 100 Females in Yelm.
What is the Ratio of Females per 100 Males in Yelm?
There are 109.26 Females per 100 Males in Yelm.
What is the Median Population Age in Yelm?
Median Population Age in Yelm is 31.4 Years.
What is the Average Family Size in Yelm
Average Family Size in Yelm is 3.6 People.
What is the Average Household Size in Yelm
Average Household Size in Yelm is 3.1 People.
How Large is the Labor Force in Yelm?
There are 5,234 People in the Labor Forcein in Yelm.
What is the Percentage of People in the Labor Force in Yelm?
68.6% of People are in the Labor Force in Yelm.
What is the Unemployment Rate in Yelm?
Unemployment Rate in Yelm is 4.7%.