South Barrington, IL Map & Demographics
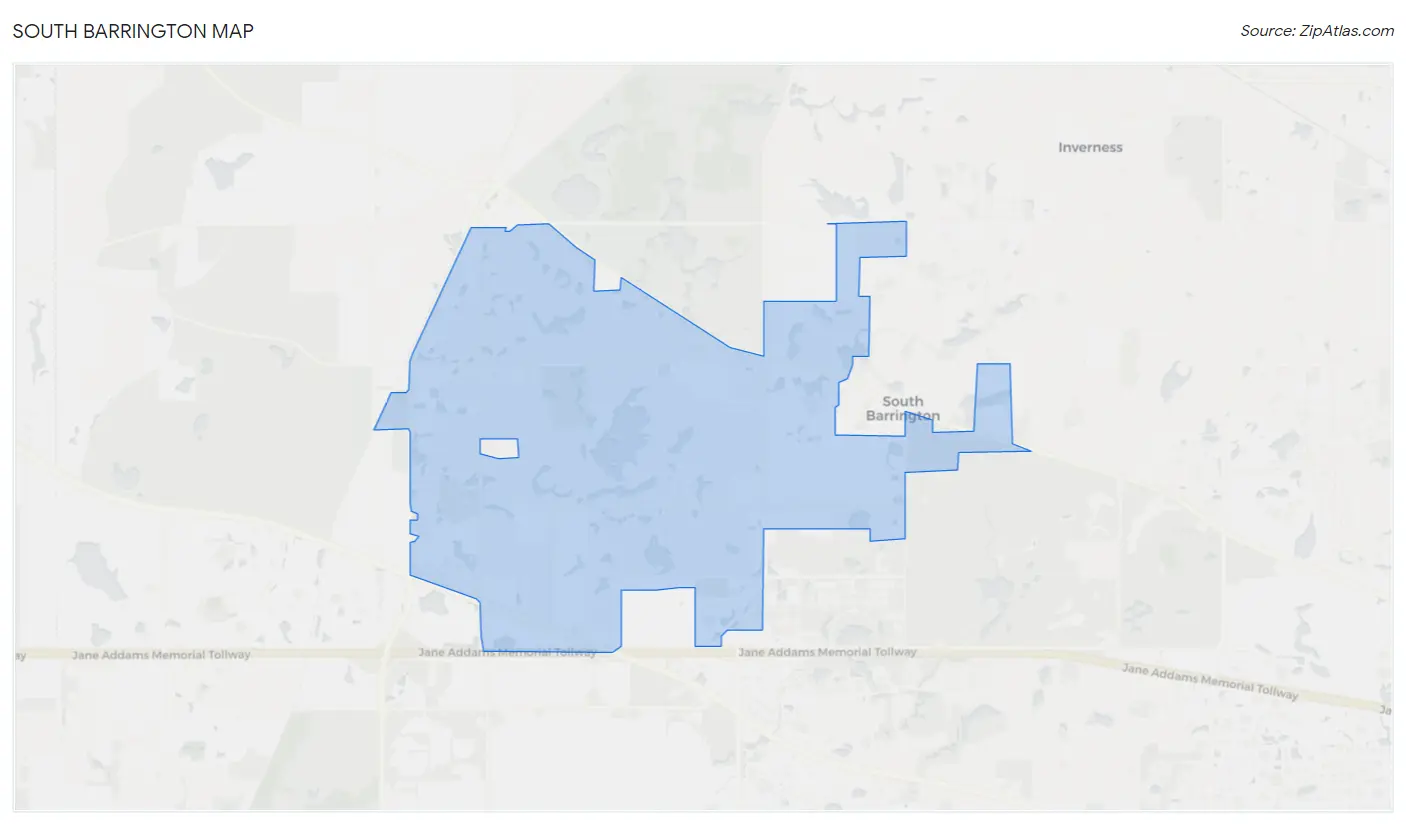
South Barrington Map
South Barrington Overview
$91,197
PER CAPITA INCOME
$226,815
AVG FAMILY INCOME
$226,042
AVG HOUSEHOLD INCOME
42.0%
WAGE / INCOME GAP [ % ]
58.0¢/ $1
WAGE / INCOME GAP [ $ ]
0.43
INEQUALITY / GINI INDEX
5,001
TOTAL POPULATION
2,595
MALE POPULATION
2,406
FEMALE POPULATION
107.86
MALES / 100 FEMALES
92.72
FEMALES / 100 MALES
48.3
MEDIAN AGE
3.1
AVG FAMILY SIZE
3.1
AVG HOUSEHOLD SIZE
2,334
LABOR FORCE [ PEOPLE ]
61.0%
PERCENT IN LABOR FORCE
1.8%
UNEMPLOYMENT RATE
Income in South Barrington
Income Overview in South Barrington
Per Capita Income in South Barrington is $91,197, while median incomes of families and households are $226,815 and $226,042 respectively.
| Characteristic | Number | Measure |
| Per Capita Income | 5,001 | $91,197 |
| Median Family Income | 1,559 | $226,815 |
| Mean Family Income | 1,559 | $285,346 |
| Median Household Income | 1,613 | $226,042 |
| Mean Household Income | 1,613 | $281,172 |
| Income Deficit | 1,559 | $0 |
| Wage / Income Gap (%) | 5,001 | 42.01% |
| Wage / Income Gap ($) | 5,001 | 57.99¢ per $1 |
| Gini / Inequality Index | 5,001 | 0.43 |
Earnings by Sex in South Barrington
Average Earnings in South Barrington are $101,488, $137,361 for men and $79,653 for women, a difference of 42.0%.
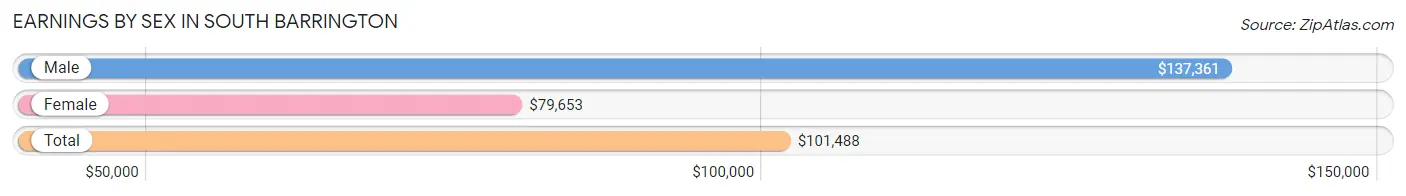
| Sex | Number | Average Earnings |
| Male | 1,405 (57.0%) | $137,361 |
| Female | 1,061 (43.0%) | $79,653 |
| Total | 2,466 (100.0%) | $101,488 |
Earnings by Sex by Income Bracket in South Barrington
The most common earnings brackets in South Barrington are $100,000+ for men (877 | 62.4%) and $100,000+ for women (406 | 38.3%).
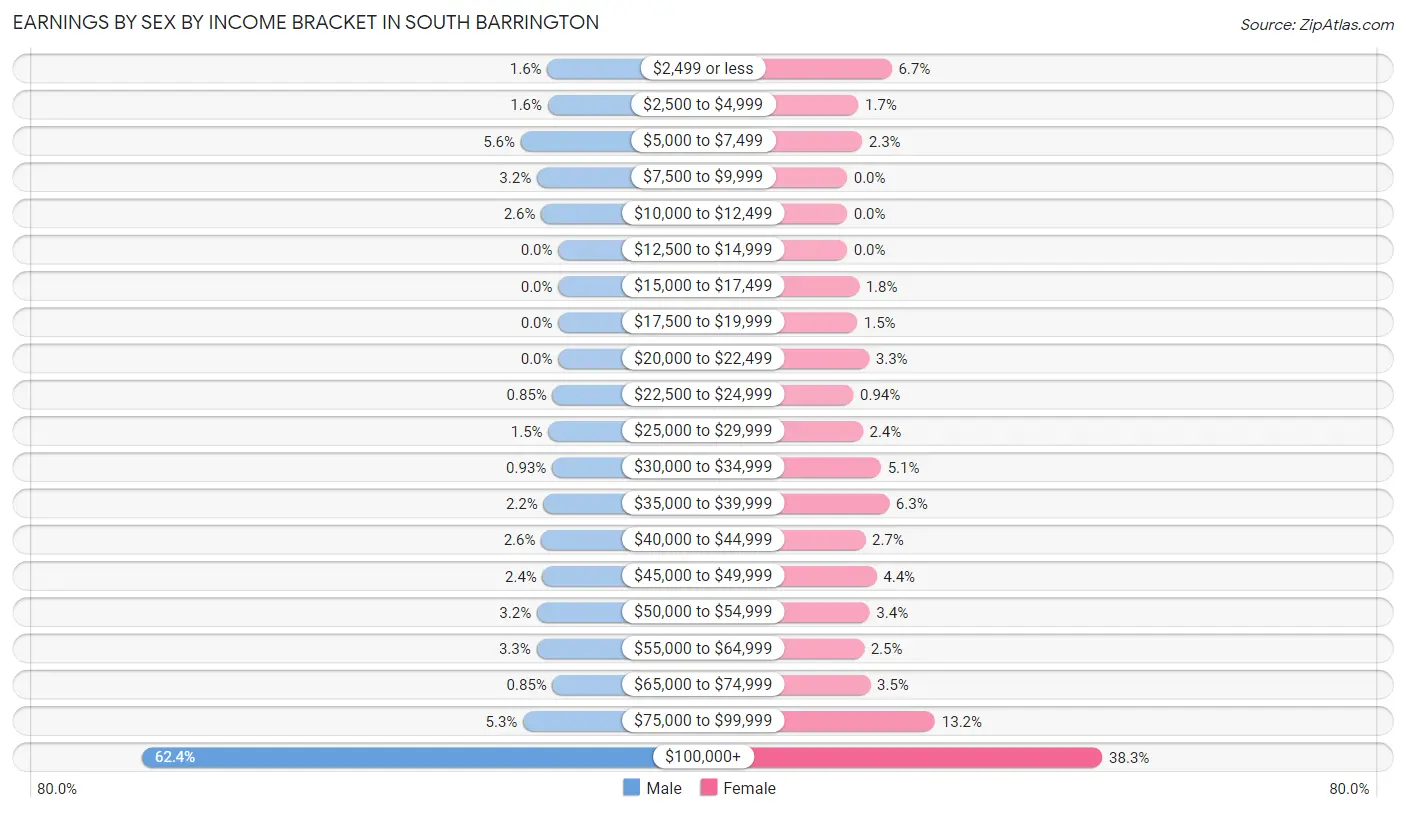
| Income | Male | Female |
| $2,499 or less | 23 (1.6%) | 71 (6.7%) |
| $2,500 to $4,999 | 22 (1.6%) | 18 (1.7%) |
| $5,000 to $7,499 | 79 (5.6%) | 24 (2.3%) |
| $7,500 to $9,999 | 45 (3.2%) | 0 (0.0%) |
| $10,000 to $12,499 | 36 (2.6%) | 0 (0.0%) |
| $12,500 to $14,999 | 0 (0.0%) | 0 (0.0%) |
| $15,000 to $17,499 | 0 (0.0%) | 19 (1.8%) |
| $17,500 to $19,999 | 0 (0.0%) | 16 (1.5%) |
| $20,000 to $22,499 | 0 (0.0%) | 35 (3.3%) |
| $22,500 to $24,999 | 12 (0.9%) | 10 (0.9%) |
| $25,000 to $29,999 | 21 (1.5%) | 25 (2.4%) |
| $30,000 to $34,999 | 13 (0.9%) | 54 (5.1%) |
| $35,000 to $39,999 | 31 (2.2%) | 67 (6.3%) |
| $40,000 to $44,999 | 36 (2.6%) | 29 (2.7%) |
| $45,000 to $49,999 | 33 (2.4%) | 47 (4.4%) |
| $50,000 to $54,999 | 45 (3.2%) | 36 (3.4%) |
| $55,000 to $64,999 | 46 (3.3%) | 27 (2.5%) |
| $65,000 to $74,999 | 12 (0.9%) | 37 (3.5%) |
| $75,000 to $99,999 | 74 (5.3%) | 140 (13.2%) |
| $100,000+ | 877 (62.4%) | 406 (38.3%) |
| Total | 1,405 (100.0%) | 1,061 (100.0%) |
Earnings by Sex by Educational Attainment in South Barrington
Average earnings in South Barrington are $159,074 for men and $82,026 for women, a difference of 48.4%. Men with an educational attainment of graduate degree enjoy the highest average annual earnings of $221,384, while those with high school diploma education earn the least with $45,595. Women with an educational attainment of graduate degree earn the most with the average annual earnings of $101,693, while those with college or associate's degree education have the smallest earnings of $38,516.
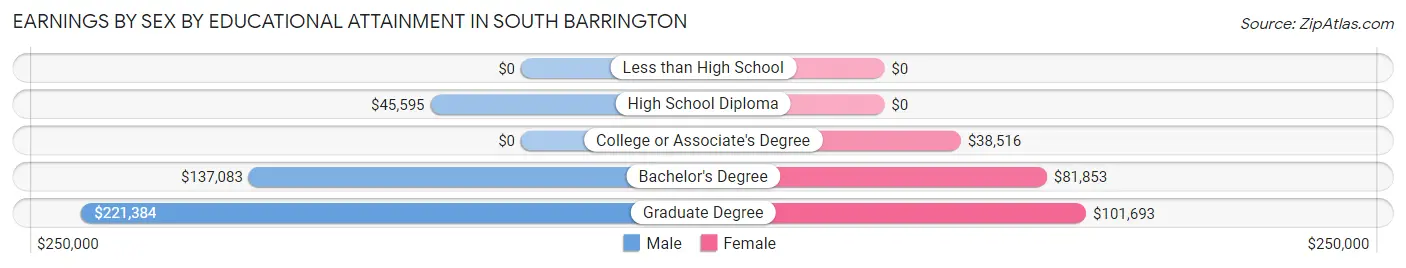
| Educational Attainment | Male Income | Female Income |
| Less than High School | - | - |
| High School Diploma | $45,595 | $0 |
| College or Associate's Degree | - | - |
| Bachelor's Degree | $137,083 | $81,853 |
| Graduate Degree | $221,384 | $101,693 |
| Total | $159,074 | $82,026 |
Family Income in South Barrington
Family Income Brackets in South Barrington
According to the South Barrington family income data, there are 848 families falling into the $200,000+ income range, which is the most common income bracket and makes up 54.4% of all families.
| Income Bracket | # Families | % Families |
| Less than $10,000 | 0 | 0.0% |
| $10,000 to $14,999 | 0 | 0.0% |
| $15,000 to $24,999 | 19 | 1.2% |
| $25,000 to $34,999 | 48 | 3.1% |
| $35,000 to $49,999 | 76 | 4.9% |
| $50,000 to $74,999 | 65 | 4.2% |
| $75,000 to $99,999 | 76 | 4.9% |
| $100,000 to $149,999 | 226 | 14.5% |
| $150,000 to $199,999 | 200 | 12.8% |
| $200,000+ | 848 | 54.4% |
Family Income by Famaliy Size in South Barrington
3-person families (292 | 18.7%) account for the highest median family income in South Barrington with $250,001 per family, while 3-person families (292 | 18.7%) have the highest median income of $83,334 per family member.
| Income Bracket | # Families | Median Income |
| 2-Person Families | 744 (47.7%) | $145,185 |
| 3-Person Families | 292 (18.7%) | $250,001 |
| 4-Person Families | 231 (14.8%) | $250,001 |
| 5-Person Families | 164 (10.5%) | $0 |
| 6-Person Families | 64 (4.1%) | $230,952 |
| 7+ Person Families | 64 (4.1%) | $0 |
| Total | 1,559 (100.0%) | $226,815 |
Family Income by Number of Earners in South Barrington
The median family income in South Barrington is $226,815, with families comprising 3+ earners (200) having the highest median family income of $250,001, while families with no earners (185) have the lowest median family income of $130,573, accounting for 12.8% and 11.9% of families, respectively.
| Number of Earners | # Families | Median Income |
| No Earners | 185 (11.9%) | $130,573 |
| 1 Earner | 516 (33.1%) | $177,778 |
| 2 Earners | 658 (42.2%) | $250,000 |
| 3+ Earners | 200 (12.8%) | $250,001 |
| Total | 1,559 (100.0%) | $226,815 |
Household Income in South Barrington
Household Income Brackets in South Barrington
With 861 households falling in the category, the $200,000+ income range is the most frequent in South Barrington, accounting for 53.4% of all households.
| Income Bracket | # Households | % Households |
| Less than $10,000 | 0 | 0.0% |
| $10,000 to $14,999 | 0 | 0.0% |
| $15,000 to $24,999 | 19 | 1.2% |
| $25,000 to $34,999 | 58 | 3.6% |
| $35,000 to $49,999 | 76 | 4.7% |
| $50,000 to $74,999 | 79 | 4.9% |
| $75,000 to $99,999 | 85 | 5.3% |
| $100,000 to $149,999 | 235 | 14.6% |
| $150,000 to $199,999 | 198 | 12.3% |
| $200,000+ | 861 | 53.4% |
Household Income by Householder Age in South Barrington
The median household income in South Barrington is $226,042, with the highest median household income of $233,880 found in the 45 to 64 years age bracket for the primary householder. A total of 945 households (58.6%) fall into this category.
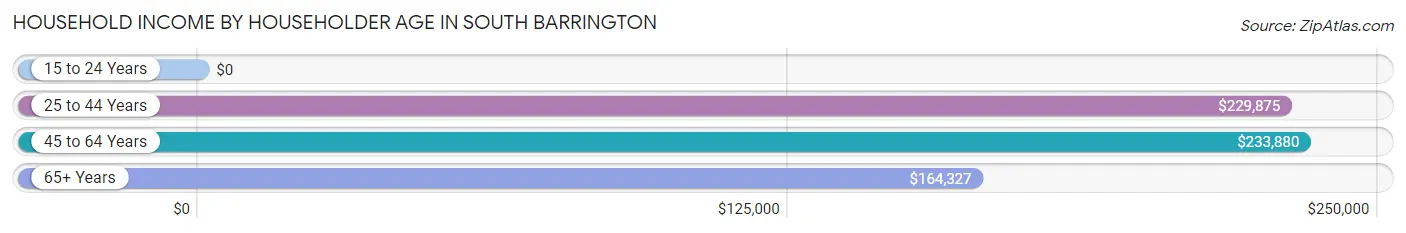
| Income Bracket | # Households | Median Income |
| 15 to 24 Years | 0 (0.0%) | $0 |
| 25 to 44 Years | 143 (8.9%) | $229,875 |
| 45 to 64 Years | 945 (58.6%) | $233,880 |
| 65+ Years | 525 (32.6%) | $164,327 |
| Total | 1,613 (100.0%) | $226,042 |
Poverty in South Barrington
Income Below Poverty by Sex and Age in South Barrington
With 0.7% poverty level for males and 2.0% for females among the residents of South Barrington, 55 to 64 year old males and 65 to 74 year old females are the most vulnerable to poverty, with 19 males (4.6%) and 30 females (7.7%) in their respective age groups living below the poverty level.
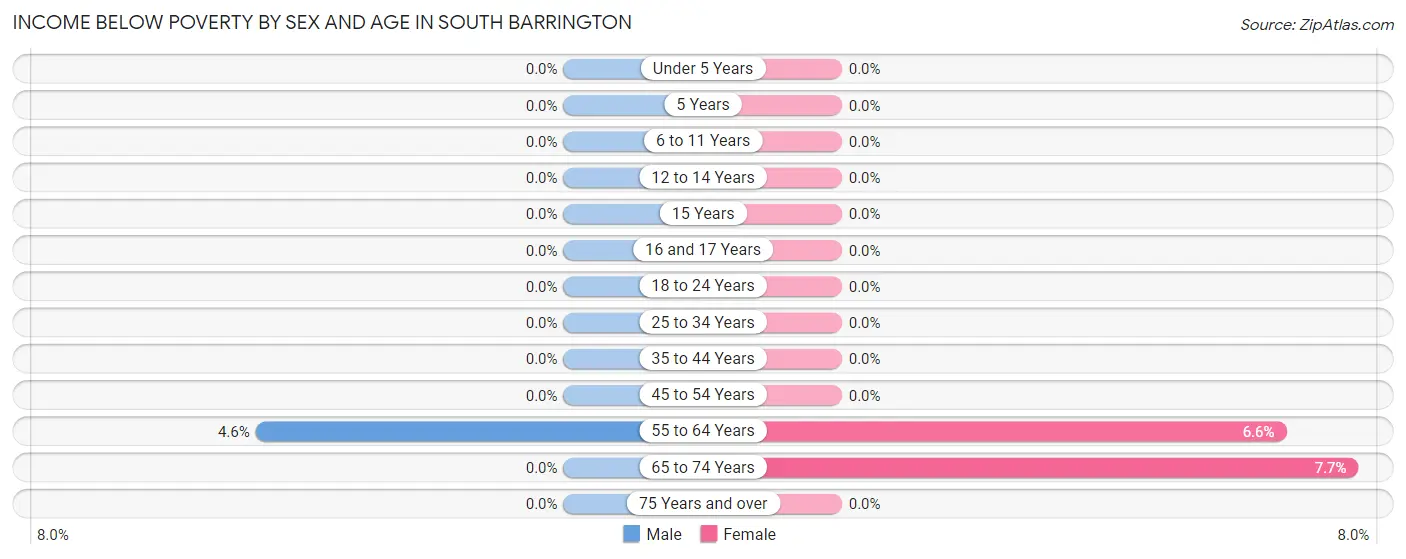
| Age Bracket | Male | Female |
| Under 5 Years | 0 (0.0%) | 0 (0.0%) |
| 5 Years | 0 (0.0%) | 0 (0.0%) |
| 6 to 11 Years | 0 (0.0%) | 0 (0.0%) |
| 12 to 14 Years | 0 (0.0%) | 0 (0.0%) |
| 15 Years | 0 (0.0%) | 0 (0.0%) |
| 16 and 17 Years | 0 (0.0%) | 0 (0.0%) |
| 18 to 24 Years | 0 (0.0%) | 0 (0.0%) |
| 25 to 34 Years | 0 (0.0%) | 0 (0.0%) |
| 35 to 44 Years | 0 (0.0%) | 0 (0.0%) |
| 45 to 54 Years | 0 (0.0%) | 0 (0.0%) |
| 55 to 64 Years | 19 (4.6%) | 19 (6.6%) |
| 65 to 74 Years | 0 (0.0%) | 30 (7.7%) |
| 75 Years and over | 0 (0.0%) | 0 (0.0%) |
| Total | 19 (0.7%) | 49 (2.0%) |
Income Above Poverty by Sex and Age in South Barrington
According to the poverty statistics in South Barrington, males aged under 5 years and females aged under 5 years are the age groups that are most secure financially, with 100.0% of males and 100.0% of females in these age groups living above the poverty line.
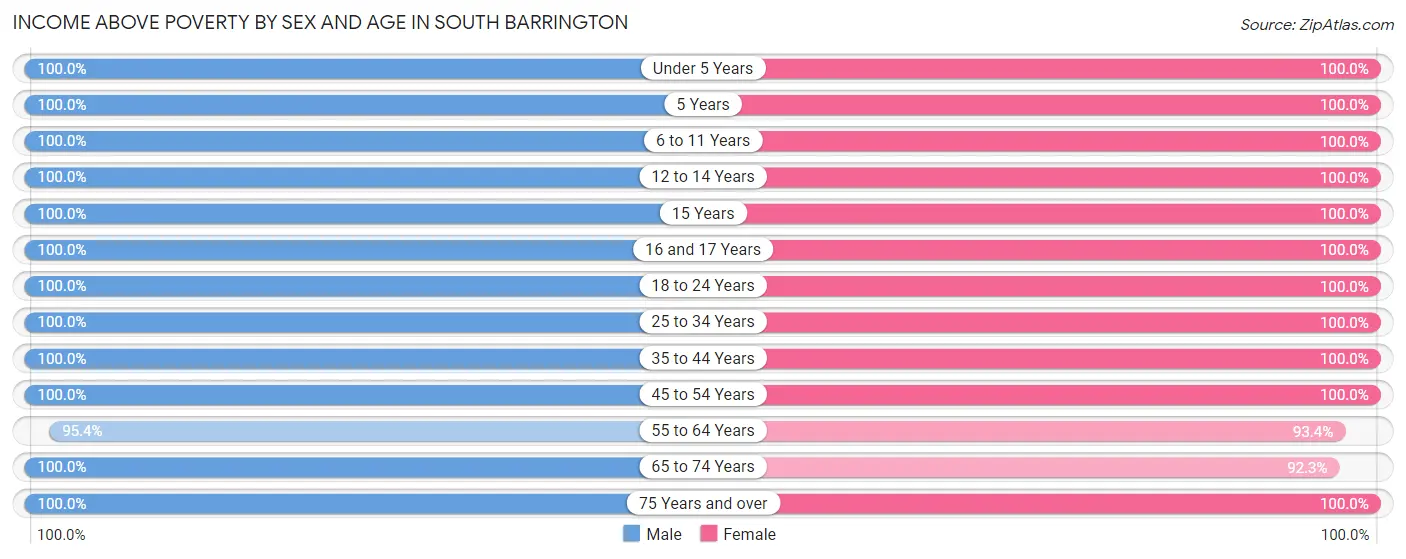
| Age Bracket | Male | Female |
| Under 5 Years | 82 (100.0%) | 90 (100.0%) |
| 5 Years | 49 (100.0%) | 12 (100.0%) |
| 6 to 11 Years | 270 (100.0%) | 185 (100.0%) |
| 12 to 14 Years | 235 (100.0%) | 148 (100.0%) |
| 15 Years | 88 (100.0%) | 15 (100.0%) |
| 16 and 17 Years | 55 (100.0%) | 147 (100.0%) |
| 18 to 24 Years | 131 (100.0%) | 76 (100.0%) |
| 25 to 34 Years | 65 (100.0%) | 48 (100.0%) |
| 35 to 44 Years | 98 (100.0%) | 323 (100.0%) |
| 45 to 54 Years | 556 (100.0%) | 504 (100.0%) |
| 55 to 64 Years | 397 (95.4%) | 269 (93.4%) |
| 65 to 74 Years | 421 (100.0%) | 361 (92.3%) |
| 75 Years and over | 129 (100.0%) | 179 (100.0%) |
| Total | 2,576 (99.3%) | 2,357 (98.0%) |
Income Below Poverty Among Married-Couple Families in South Barrington
The poverty statistics for married-couple families in South Barrington show that 1.3% or 19 of the total 1,464 families live below the poverty line. Families with no children have the highest poverty rate of 2.2%, comprising of 19 families. On the other hand, families with 1 or 2 children have the lowest poverty rate of 0.0%, which includes 0 families.
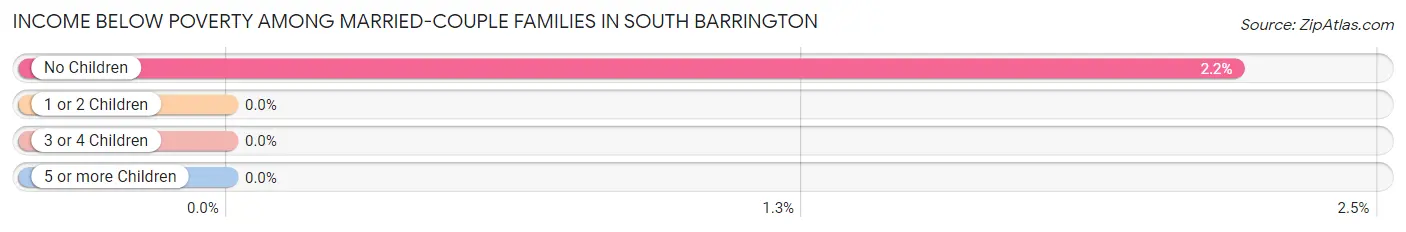
| Children | Above Poverty | Below Poverty |
| No Children | 849 (97.8%) | 19 (2.2%) |
| 1 or 2 Children | 419 (100.0%) | 0 (0.0%) |
| 3 or 4 Children | 177 (100.0%) | 0 (0.0%) |
| 5 or more Children | 0 (0.0%) | 0 (0.0%) |
| Total | 1,445 (98.7%) | 19 (1.3%) |
Income Below Poverty Among Single-Parent Households in South Barrington
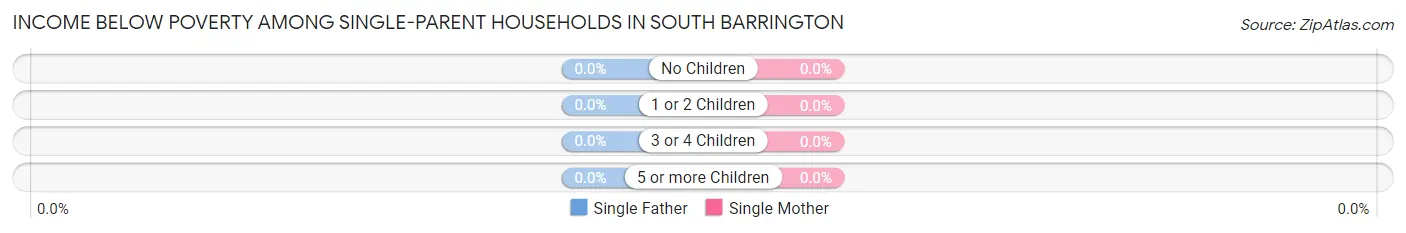
| Children | Single Father | Single Mother |
| No Children | 0 (0.0%) | 0 (0.0%) |
| 1 or 2 Children | 0 (0.0%) | 0 (0.0%) |
| 3 or 4 Children | 0 (0.0%) | 0 (0.0%) |
| 5 or more Children | 0 (0.0%) | 0 (0.0%) |
| Total | 0 (0.0%) | 0 (0.0%) |
Income Below Poverty Among Married-Couple vs Single-Parent Households in South Barrington
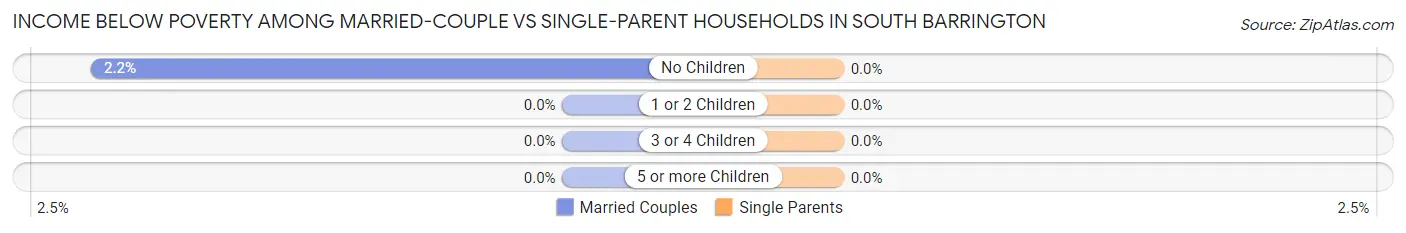
| Children | Married-Couple Families | Single-Parent Households |
| No Children | 19 (2.2%) | 0 (0.0%) |
| 1 or 2 Children | 0 (0.0%) | 0 (0.0%) |
| 3 or 4 Children | 0 (0.0%) | 0 (0.0%) |
| 5 or more Children | 0 (0.0%) | 0 (0.0%) |
| Total | 19 (1.3%) | 0 (0.0%) |
Race in South Barrington
The most populous races in South Barrington are White / Caucasian (2,603 | 52.0%), Asian (2,111 | 42.2%), and Two or more Races (129 | 2.6%).
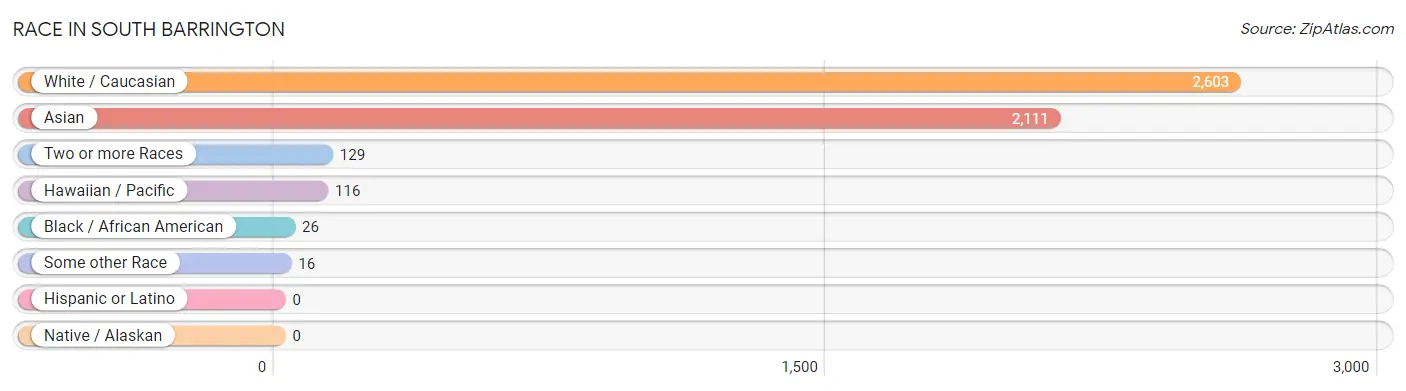
| Race | # Population | % Population |
| Asian | 2,111 | 42.2% |
| Black / African American | 26 | 0.5% |
| Hawaiian / Pacific | 116 | 2.3% |
| Hispanic or Latino | 0 | 0.0% |
| Native / Alaskan | 0 | 0.0% |
| White / Caucasian | 2,603 | 52.0% |
| Two or more Races | 129 | 2.6% |
| Some other Race | 16 | 0.3% |
| Total | 5,001 | 100.0% |
Ancestry in South Barrington
The most populous ancestries reported in South Barrington are Thai (1,418 | 28.3%), German (526 | 10.5%), Polish (497 | 9.9%), Irish (386 | 7.7%), and Burmese (376 | 7.5%), together accounting for 64.1% of all South Barrington residents.
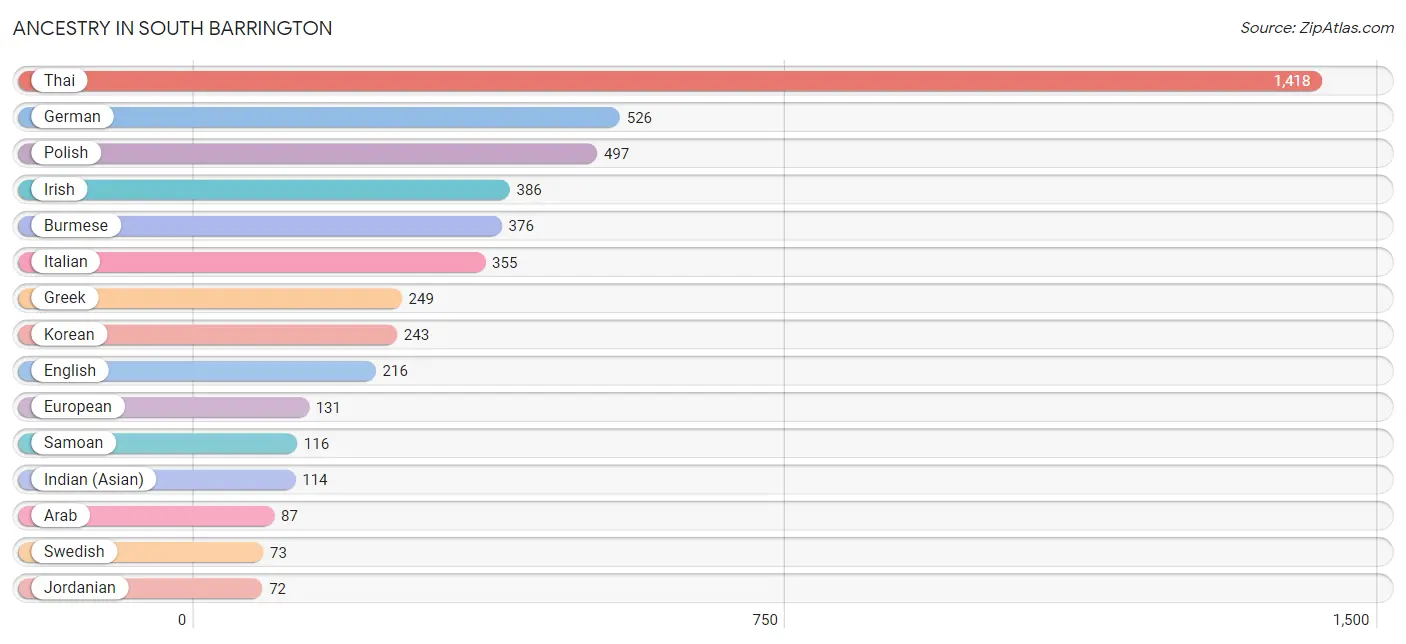
| Ancestry | # Population | % Population |
| African | 7 | 0.1% |
| American | 21 | 0.4% |
| Arab | 87 | 1.7% |
| Belgian | 12 | 0.2% |
| Bhutanese | 29 | 0.6% |
| Burmese | 376 | 7.5% |
| Cherokee | 15 | 0.3% |
| Czech | 11 | 0.2% |
| Czechoslovakian | 12 | 0.2% |
| Dutch | 18 | 0.4% |
| Eastern European | 62 | 1.2% |
| English | 216 | 4.3% |
| European | 131 | 2.6% |
| Filipino | 29 | 0.6% |
| Finnish | 25 | 0.5% |
| French | 9 | 0.2% |
| German | 526 | 10.5% |
| Greek | 249 | 5.0% |
| Indian (Asian) | 114 | 2.3% |
| Indonesian | 47 | 0.9% |
| Iranian | 62 | 1.2% |
| Irish | 386 | 7.7% |
| Italian | 355 | 7.1% |
| Jordanian | 72 | 1.4% |
| Korean | 243 | 4.9% |
| Norwegian | 37 | 0.7% |
| Pakistani | 27 | 0.5% |
| Pennsylvania German | 64 | 1.3% |
| Polish | 497 | 9.9% |
| Russian | 40 | 0.8% |
| Samoan | 116 | 2.3% |
| Scotch-Irish | 43 | 0.9% |
| Scottish | 28 | 0.6% |
| Sri Lankan | 47 | 0.9% |
| Subsaharan African | 7 | 0.1% |
| Swedish | 73 | 1.5% |
| Swiss | 12 | 0.2% |
| Thai | 1,418 | 28.3% |
| Welsh | 16 | 0.3% | View All 39 Rows |
Immigrants in South Barrington
The most numerous immigrant groups reported in South Barrington came from Asia (1,225 | 24.5%), South Central Asia (724 | 14.5%), India (682 | 13.6%), Eastern Asia (265 | 5.3%), and Korea (168 | 3.4%), together accounting for 61.3% of all South Barrington residents.
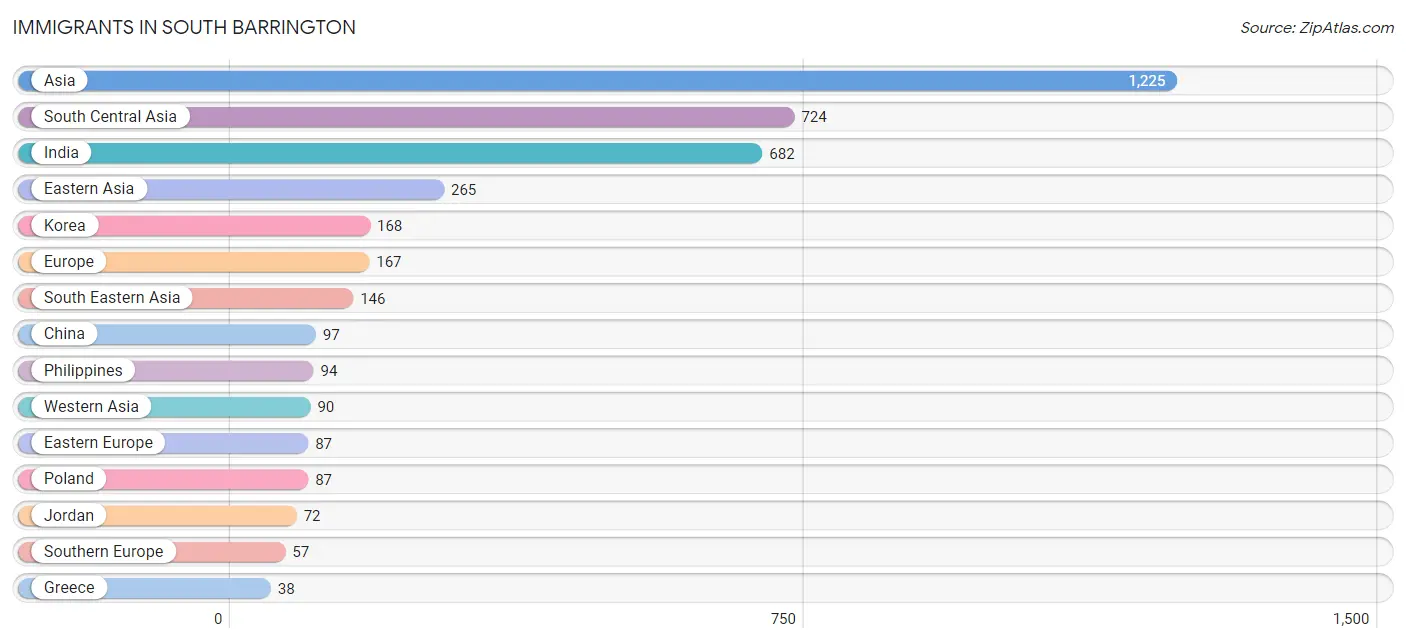
| Immigration Origin | # Population | % Population |
| Africa | 7 | 0.1% |
| Asia | 1,225 | 24.5% |
| Canada | 37 | 0.7% |
| China | 97 | 1.9% |
| Eastern Asia | 265 | 5.3% |
| Eastern Europe | 87 | 1.7% |
| England | 23 | 0.5% |
| Europe | 167 | 3.3% |
| Greece | 38 | 0.8% |
| India | 682 | 13.6% |
| Iran | 21 | 0.4% |
| Italy | 19 | 0.4% |
| Jordan | 72 | 1.4% |
| Korea | 168 | 3.4% |
| Northern Africa | 7 | 0.1% |
| Northern Europe | 23 | 0.5% |
| Oceania | 24 | 0.5% |
| Pakistan | 21 | 0.4% |
| Philippines | 94 | 1.9% |
| Poland | 87 | 1.7% |
| South Central Asia | 724 | 14.5% |
| South Eastern Asia | 146 | 2.9% |
| Southern Europe | 57 | 1.1% |
| Syria | 8 | 0.2% |
| Taiwan | 29 | 0.6% |
| Thailand | 27 | 0.5% |
| Vietnam | 25 | 0.5% |
| Western Asia | 90 | 1.8% | View All 28 Rows |
Sex and Age in South Barrington
Sex and Age in South Barrington
The most populous age groups in South Barrington are 10 to 14 Years (338 | 13.0%) for men and 50 to 54 Years (300 | 12.5%) for women.
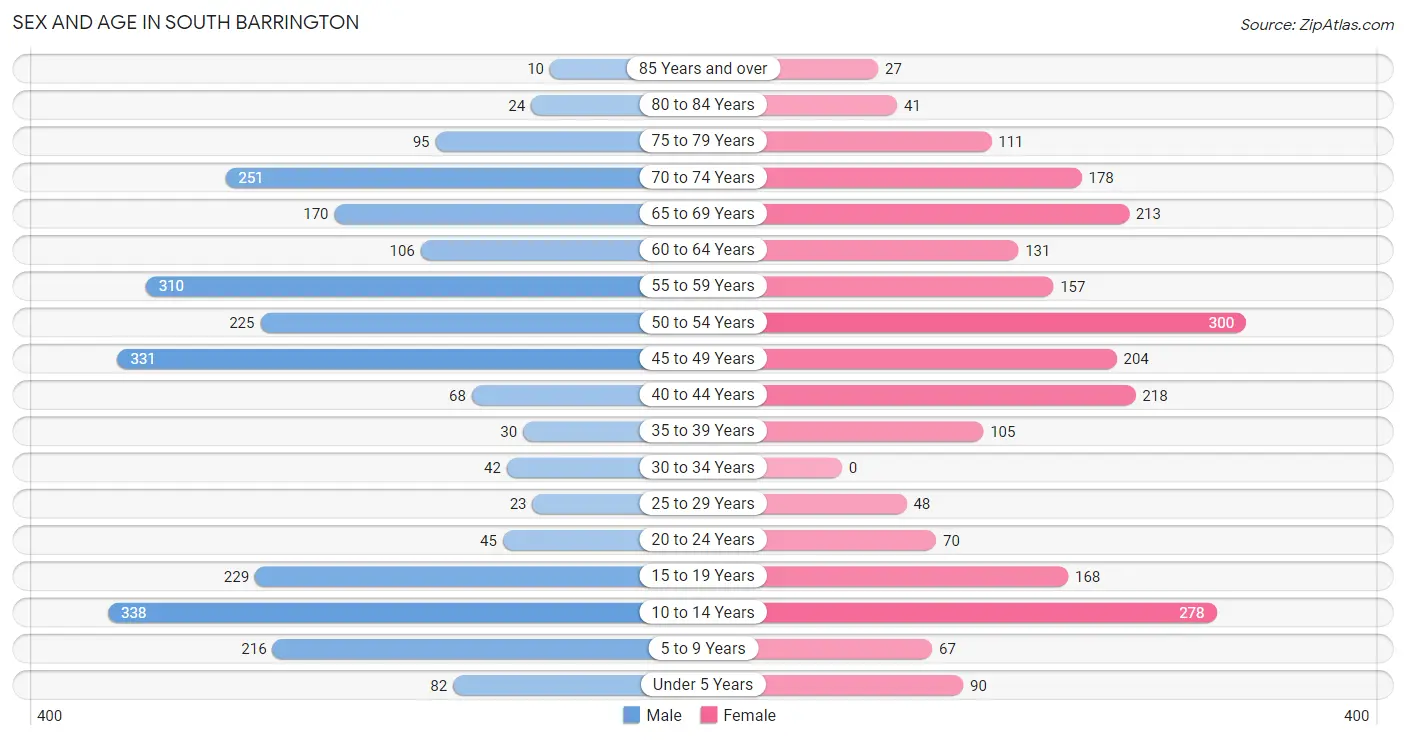
| Age Bracket | Male | Female |
| Under 5 Years | 82 (3.2%) | 90 (3.7%) |
| 5 to 9 Years | 216 (8.3%) | 67 (2.8%) |
| 10 to 14 Years | 338 (13.0%) | 278 (11.6%) |
| 15 to 19 Years | 229 (8.8%) | 168 (7.0%) |
| 20 to 24 Years | 45 (1.7%) | 70 (2.9%) |
| 25 to 29 Years | 23 (0.9%) | 48 (2.0%) |
| 30 to 34 Years | 42 (1.6%) | 0 (0.0%) |
| 35 to 39 Years | 30 (1.2%) | 105 (4.4%) |
| 40 to 44 Years | 68 (2.6%) | 218 (9.1%) |
| 45 to 49 Years | 331 (12.8%) | 204 (8.5%) |
| 50 to 54 Years | 225 (8.7%) | 300 (12.5%) |
| 55 to 59 Years | 310 (11.9%) | 157 (6.5%) |
| 60 to 64 Years | 106 (4.1%) | 131 (5.4%) |
| 65 to 69 Years | 170 (6.6%) | 213 (8.8%) |
| 70 to 74 Years | 251 (9.7%) | 178 (7.4%) |
| 75 to 79 Years | 95 (3.7%) | 111 (4.6%) |
| 80 to 84 Years | 24 (0.9%) | 41 (1.7%) |
| 85 Years and over | 10 (0.4%) | 27 (1.1%) |
| Total | 2,595 (100.0%) | 2,406 (100.0%) |
Families and Households in South Barrington
Median Family Size in South Barrington
The median family size in South Barrington is 3.13 persons per family, with single female/mother families (68 | 4.4%) accounting for the largest median family size of 3.85 persons per family. On the other hand, single male/father families (27 | 1.7%) represent the smallest median family size with 2.04 persons per family.
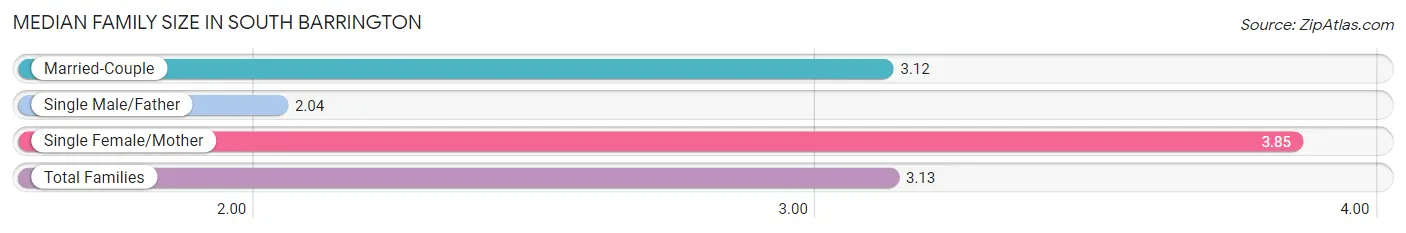
| Family Type | # Families | Family Size |
| Married-Couple | 1,464 (93.9%) | 3.12 |
| Single Male/Father | 27 (1.7%) | 2.04 |
| Single Female/Mother | 68 (4.4%) | 3.85 |
| Total Families | 1,559 (100.0%) | 3.13 |
Median Household Size in South Barrington
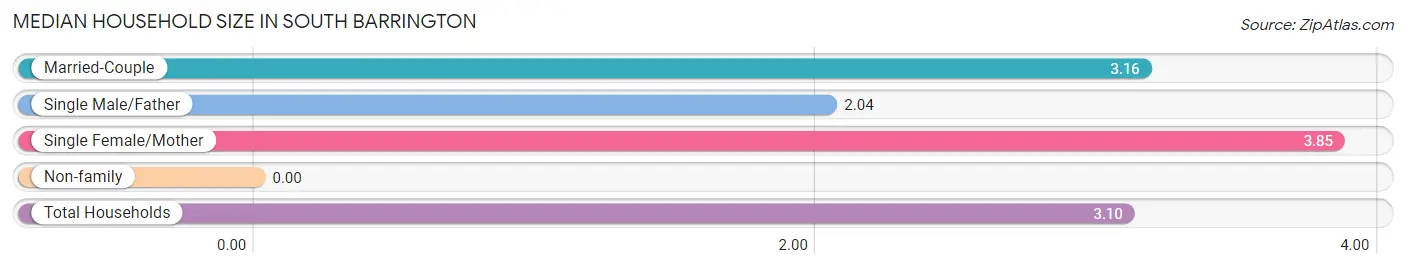
| Household Type | # Households | Household Size |
| Married-Couple | 1,464 (90.8%) | 3.16 |
| Single Male/Father | 27 (1.7%) | 2.04 |
| Single Female/Mother | 68 (4.2%) | 3.85 |
| Non-family | 54 (3.4%) | - |
| Total Households | 1,613 (100.0%) | 3.10 |
Household Size by Marriage Status in South Barrington
Out of a total of 1,613 households in South Barrington, 1,559 (96.7%) are family households, while 54 (3.4%) are nonfamily households. The most numerous type of family households are 2-person households, comprising 744, and the most common type of nonfamily households are 1-person households, comprising 54.
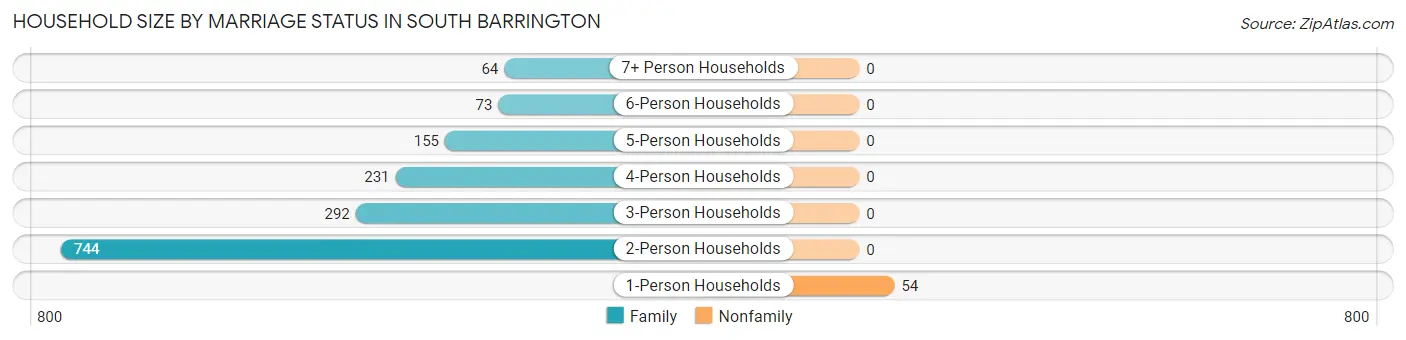
| Household Size | Family Households | Nonfamily Households |
| 1-Person Households | - | 54 (3.4%) |
| 2-Person Households | 744 (46.1%) | 0 (0.0%) |
| 3-Person Households | 292 (18.1%) | 0 (0.0%) |
| 4-Person Households | 231 (14.3%) | 0 (0.0%) |
| 5-Person Households | 155 (9.6%) | 0 (0.0%) |
| 6-Person Households | 73 (4.5%) | 0 (0.0%) |
| 7+ Person Households | 64 (4.0%) | 0 (0.0%) |
| Total | 1,559 (96.7%) | 54 (3.4%) |
Female Fertility in South Barrington
Fertility by Age in South Barrington
Average fertility rate in South Barrington is 20.0 births per 1,000 women. Women in the age bracket of 35 to 50 years have the highest fertility rate with 29.0 births per 1,000 women. Women in the age bracket of 35 to 50 years acount for 100.0% of all women with births.
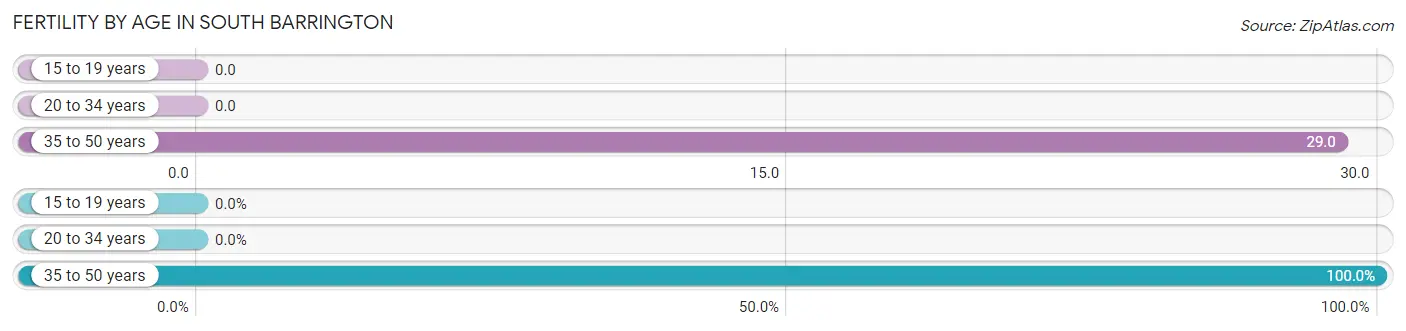
| Age Bracket | Women with Births | Births / 1,000 Women |
| 15 to 19 years | 0 (0.0%) | 0.0 |
| 20 to 34 years | 0 (0.0%) | 0.0 |
| 35 to 50 years | 18 (100.0%) | 29.0 |
| Total | 18 (100.0%) | 20.0 |
Fertility by Age by Marriage Status in South Barrington
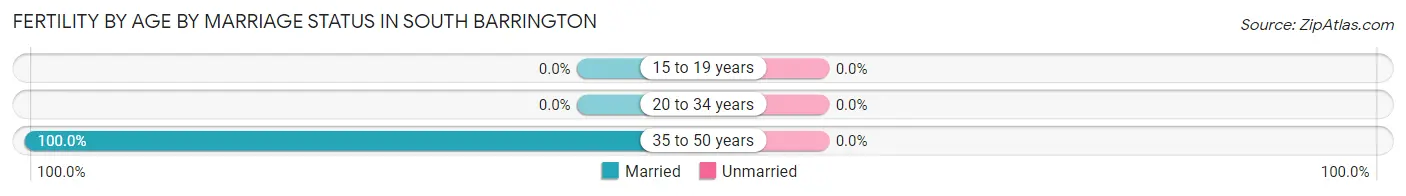
| Age Bracket | Married | Unmarried |
| 15 to 19 years | 0 (0.0%) | 0 (0.0%) |
| 20 to 34 years | 0 (0.0%) | 0 (0.0%) |
| 35 to 50 years | 18 (100.0%) | 0 (0.0%) |
| Total | 18 (100.0%) | 0 (0.0%) |
Fertility by Education in South Barrington
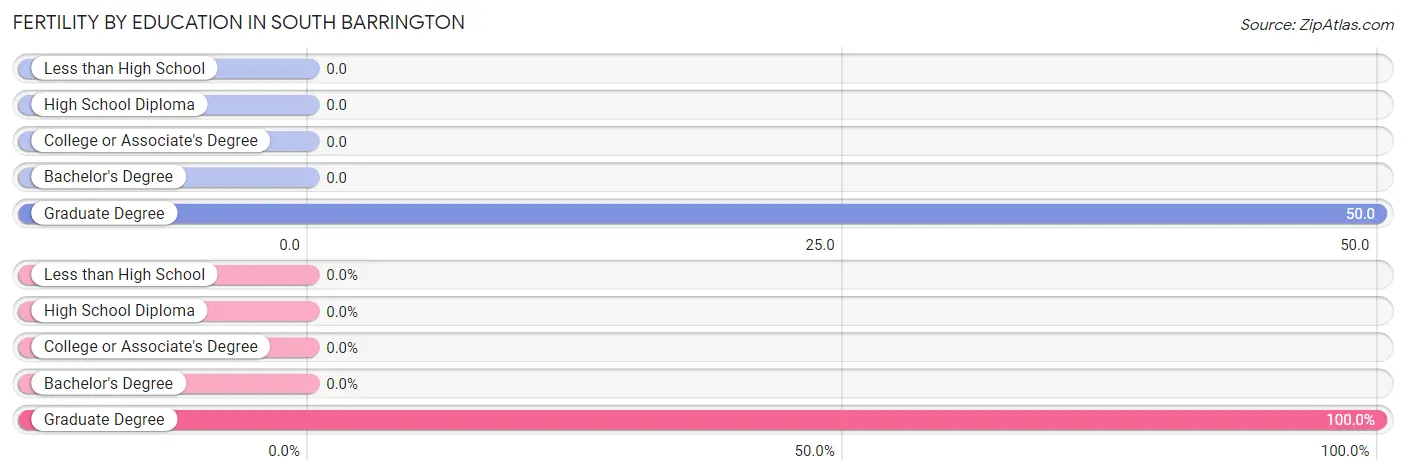
| Educational Attainment | Women with Births | Births / 1,000 Women |
| Less than High School | 0 (0.0%) | 0.0 |
| High School Diploma | 0 (0.0%) | 0.0 |
| College or Associate's Degree | 0 (0.0%) | 0.0 |
| Bachelor's Degree | 0 (0.0%) | 0.0 |
| Graduate Degree | 18 (100.0%) | 50.0 |
| Total | 18 (100.0%) | 20.0 |
Fertility by Education by Marriage Status in South Barrington
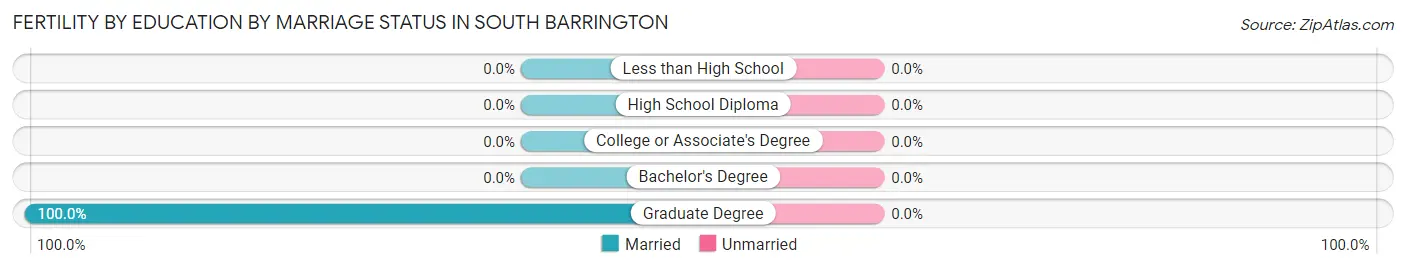
| Educational Attainment | Married | Unmarried |
| Less than High School | 0 (0.0%) | 0 (0.0%) |
| High School Diploma | 0 (0.0%) | 0 (0.0%) |
| College or Associate's Degree | 0 (0.0%) | 0 (0.0%) |
| Bachelor's Degree | 0 (0.0%) | 0 (0.0%) |
| Graduate Degree | 18 (100.0%) | 0 (0.0%) |
| Total | 18 (100.0%) | 0 (0.0%) |
Employment Characteristics in South Barrington
Employment by Class of Employer in South Barrington
Among the 2,255 employed individuals in South Barrington, private company employees (1,262 | 56.0%), self-employed (incorporated) (463 | 20.5%), and self-employed (not incorporated) (162 | 7.2%) make up the most common classes of employment.
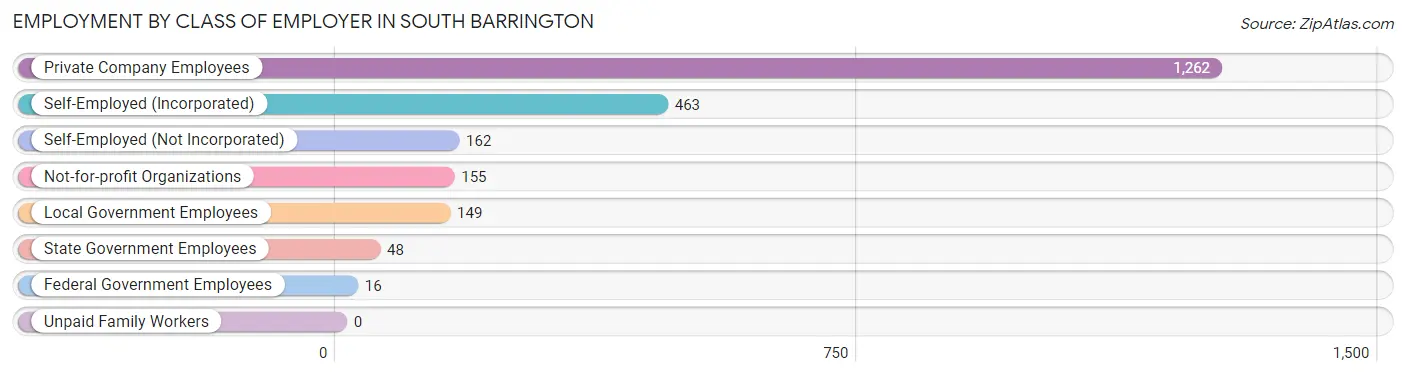
| Employer Class | # Employees | % Employees |
| Private Company Employees | 1,262 | 56.0% |
| Self-Employed (Incorporated) | 463 | 20.5% |
| Self-Employed (Not Incorporated) | 162 | 7.2% |
| Not-for-profit Organizations | 155 | 6.9% |
| Local Government Employees | 149 | 6.6% |
| State Government Employees | 48 | 2.1% |
| Federal Government Employees | 16 | 0.7% |
| Unpaid Family Workers | 0 | 0.0% |
| Total | 2,255 | 100.0% |
Employment Status by Age in South Barrington
According to the labor force statistics for South Barrington, out of the total population over 16 years of age (3,827), 61.0% or 2,334 individuals are in the labor force, with 1.8% or 42 of them unemployed. The age group with the highest labor force participation rate is 30 to 34 years, with 100.0% or 42 individuals in the labor force. Within the labor force, the 20 to 24 years age range has the highest percentage of unemployed individuals, with 27.6% or 27 of them being unemployed.
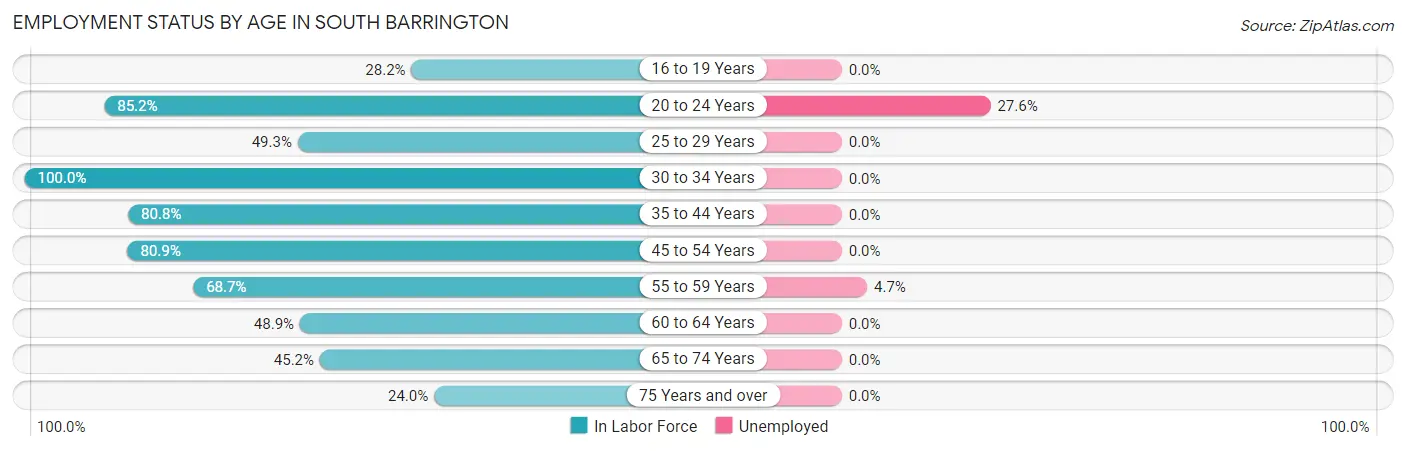
| Age Bracket | In Labor Force | Unemployed |
| 16 to 19 Years | 83 (28.2%) | 0 (0.0%) |
| 20 to 24 Years | 98 (85.2%) | 27 (27.6%) |
| 25 to 29 Years | 35 (49.3%) | 0 (0.0%) |
| 30 to 34 Years | 42 (100.0%) | 0 (0.0%) |
| 35 to 44 Years | 340 (80.8%) | 0 (0.0%) |
| 45 to 54 Years | 858 (80.9%) | 0 (0.0%) |
| 55 to 59 Years | 321 (68.7%) | 15 (4.7%) |
| 60 to 64 Years | 116 (48.9%) | 0 (0.0%) |
| 65 to 74 Years | 367 (45.2%) | 0 (0.0%) |
| 75 Years and over | 74 (24.0%) | 0 (0.0%) |
| Total | 2,334 (61.0%) | 42 (1.8%) |
Employment Status by Educational Attainment in South Barrington
According to labor force statistics for South Barrington, 74.5% of individuals (1,712) out of the total population between 25 and 64 years of age (2,298) are in the labor force, with 0.9% or 15 of them being unemployed. The group with the highest labor force participation rate are those with the educational attainment of high school diploma, with 93.3% or 180 individuals in the labor force. Within the labor force, individuals with college / associate degree education have the highest percentage of unemployment, with 5.8% or 15 of them being unemployed.
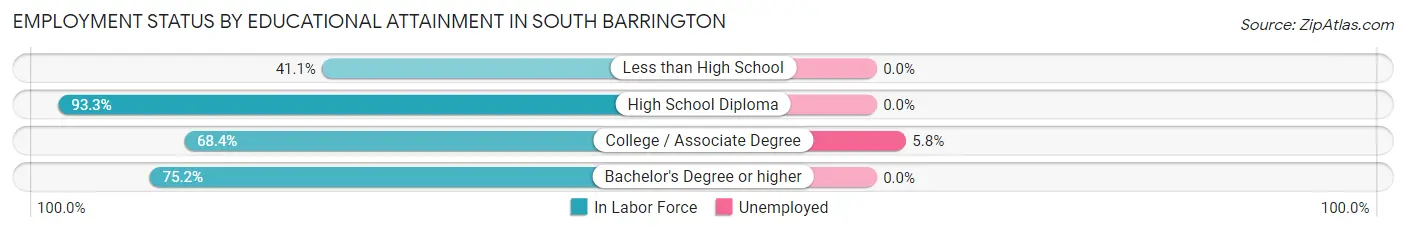
| Educational Attainment | In Labor Force | Unemployed |
| Less than High School | 30 (41.1%) | 0 (0.0%) |
| High School Diploma | 180 (93.3%) | 0 (0.0%) |
| College / Associate Degree | 258 (68.4%) | 22 (5.8%) |
| Bachelor's Degree or higher | 1,245 (75.2%) | 0 (0.0%) |
| Total | 1,712 (74.5%) | 21 (0.9%) |
Employment Occupations by Sex in South Barrington
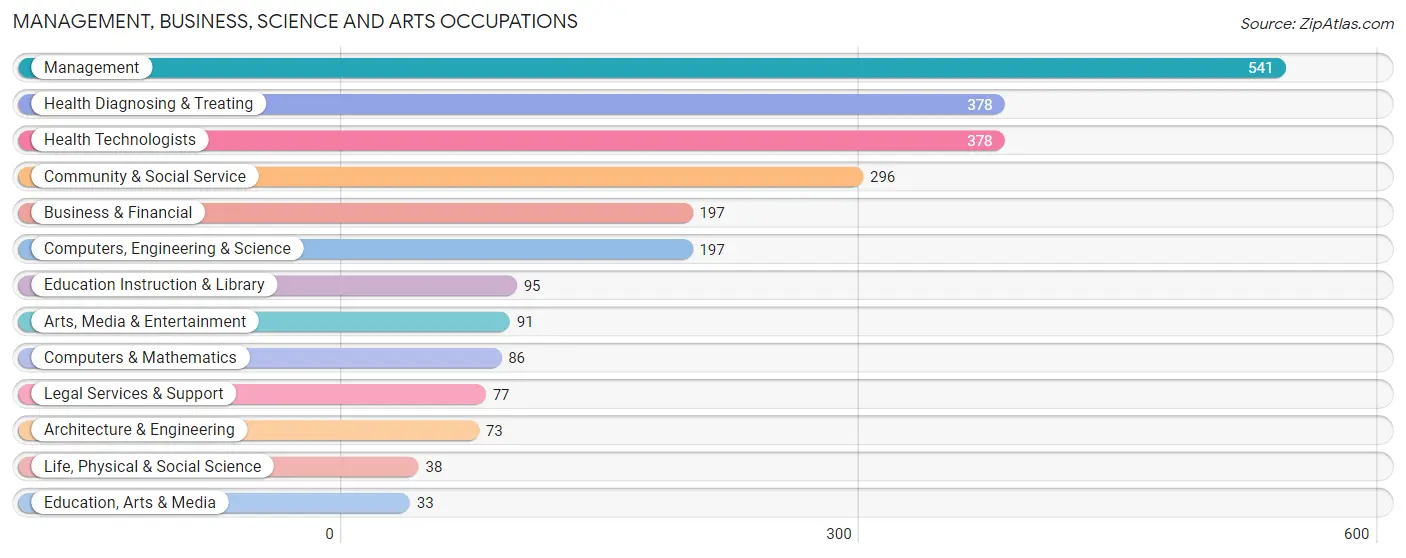
Management, Business, Science and Arts Occupations
The most common Management, Business, Science and Arts occupations in South Barrington are Management (541 | 23.6%), Health Diagnosing & Treating (378 | 16.5%), Health Technologists (378 | 16.5%), Community & Social Service (296 | 12.9%), and Business & Financial (197 | 8.6%).
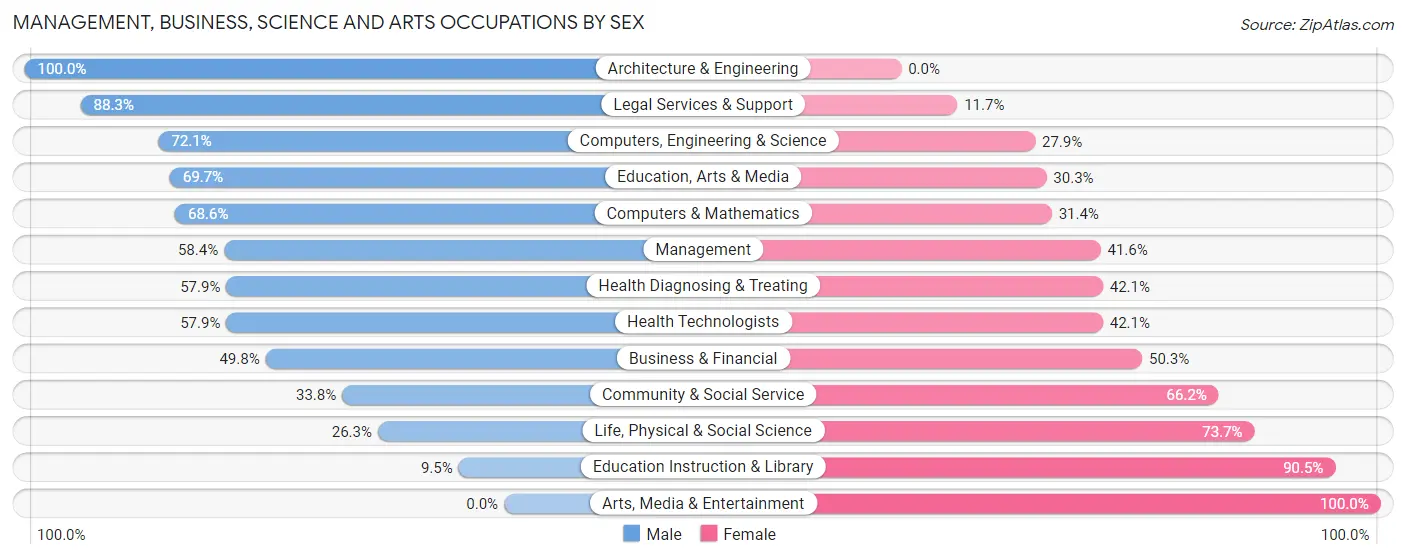
Management, Business, Science and Arts Occupations by Sex
Within the Management, Business, Science and Arts occupations in South Barrington, the most male-oriented occupations are Architecture & Engineering (100.0%), Legal Services & Support (88.3%), and Computers, Engineering & Science (72.1%), while the most female-oriented occupations are Arts, Media & Entertainment (100.0%), Education Instruction & Library (90.5%), and Life, Physical & Social Science (73.7%).
| Occupation | Male | Female |
| Management | 316 (58.4%) | 225 (41.6%) |
| Business & Financial | 98 (49.7%) | 99 (50.2%) |
| Computers, Engineering & Science | 142 (72.1%) | 55 (27.9%) |
| Computers & Mathematics | 59 (68.6%) | 27 (31.4%) |
| Architecture & Engineering | 73 (100.0%) | 0 (0.0%) |
| Life, Physical & Social Science | 10 (26.3%) | 28 (73.7%) |
| Community & Social Service | 100 (33.8%) | 196 (66.2%) |
| Education, Arts & Media | 23 (69.7%) | 10 (30.3%) |
| Legal Services & Support | 68 (88.3%) | 9 (11.7%) |
| Education Instruction & Library | 9 (9.5%) | 86 (90.5%) |
| Arts, Media & Entertainment | 0 (0.0%) | 91 (100.0%) |
| Health Diagnosing & Treating | 219 (57.9%) | 159 (42.1%) |
| Health Technologists | 219 (57.9%) | 159 (42.1%) |
| Total (Category) | 875 (54.4%) | 734 (45.6%) |
| Total (Overall) | 1,373 (59.9%) | 919 (40.1%) |
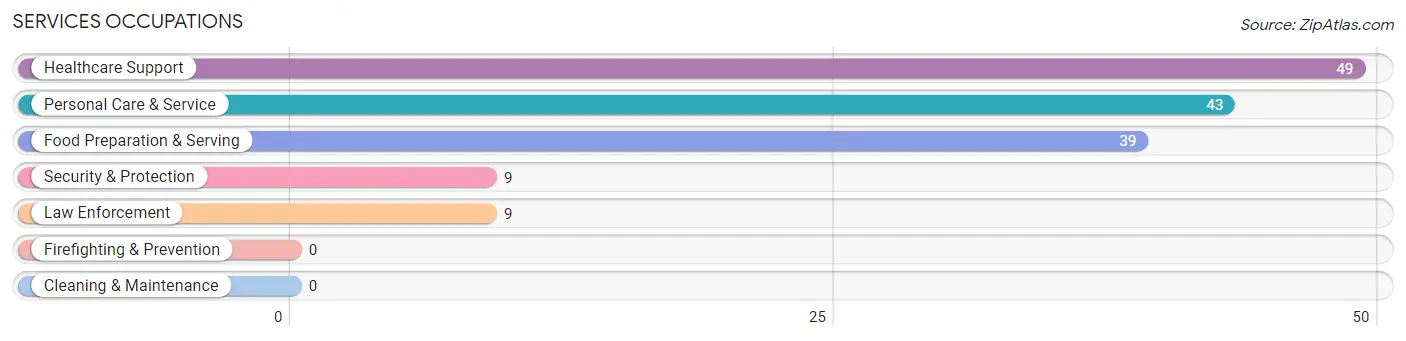
Services Occupations
The most common Services occupations in South Barrington are Healthcare Support (49 | 2.1%), Personal Care & Service (43 | 1.9%), Food Preparation & Serving (39 | 1.7%), Security & Protection (9 | 0.4%), and Law Enforcement (9 | 0.4%).
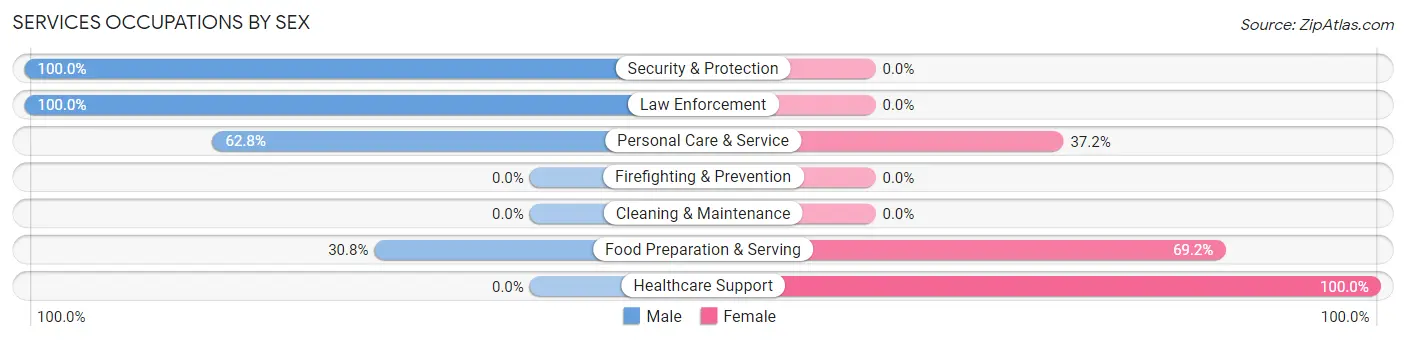
Services Occupations by Sex
Within the Services occupations in South Barrington, the most male-oriented occupations are Security & Protection (100.0%), Law Enforcement (100.0%), and Personal Care & Service (62.8%), while the most female-oriented occupations are Healthcare Support (100.0%), Food Preparation & Serving (69.2%), and Personal Care & Service (37.2%).
| Occupation | Male | Female |
| Healthcare Support | 0 (0.0%) | 49 (100.0%) |
| Security & Protection | 9 (100.0%) | 0 (0.0%) |
| Firefighting & Prevention | 0 (0.0%) | 0 (0.0%) |
| Law Enforcement | 9 (100.0%) | 0 (0.0%) |
| Food Preparation & Serving | 12 (30.8%) | 27 (69.2%) |
| Cleaning & Maintenance | 0 (0.0%) | 0 (0.0%) |
| Personal Care & Service | 27 (62.8%) | 16 (37.2%) |
| Total (Category) | 48 (34.3%) | 92 (65.7%) |
| Total (Overall) | 1,373 (59.9%) | 919 (40.1%) |
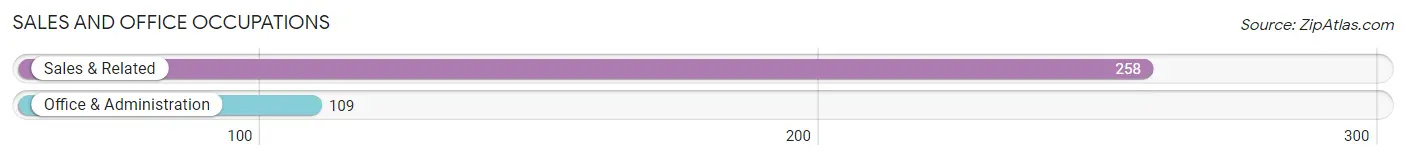
Sales and Office Occupations
The most common Sales and Office occupations in South Barrington are Sales & Related (258 | 11.3%), and Office & Administration (109 | 4.8%).
Sales and Office Occupations by Sex
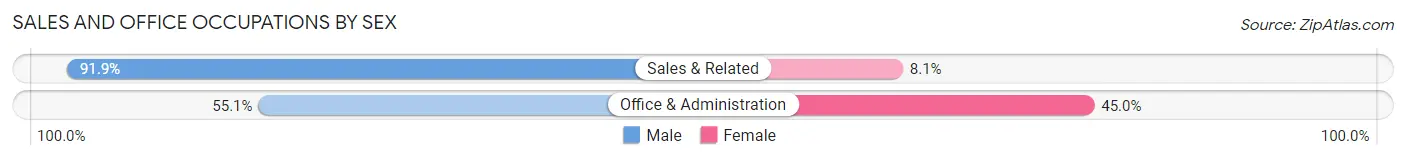
| Occupation | Male | Female |
| Sales & Related | 237 (91.9%) | 21 (8.1%) |
| Office & Administration | 60 (55.0%) | 49 (45.0%) |
| Total (Category) | 297 (80.9%) | 70 (19.1%) |
| Total (Overall) | 1,373 (59.9%) | 919 (40.1%) |
Natural Resources, Construction and Maintenance Occupations
Natural Resources, Construction and Maintenance Occupations by Sex
| Occupation | Male | Female |
| Farming, Fishing & Forestry | 0 (0.0%) | 0 (0.0%) |
| Construction & Extraction | 0 (0.0%) | 0 (0.0%) |
| Installation, Maintenance & Repair | 0 (0.0%) | 0 (0.0%) |
| Total (Category) | 0 (0.0%) | 0 (0.0%) |
| Total (Overall) | 1,373 (59.9%) | 919 (40.1%) |
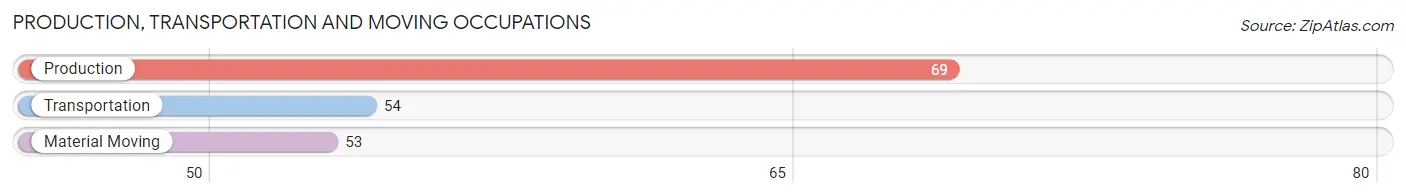
Production, Transportation and Moving Occupations
The most common Production, Transportation and Moving occupations in South Barrington are Production (69 | 3.0%), Transportation (54 | 2.4%), and Material Moving (53 | 2.3%).
Production, Transportation and Moving Occupations by Sex
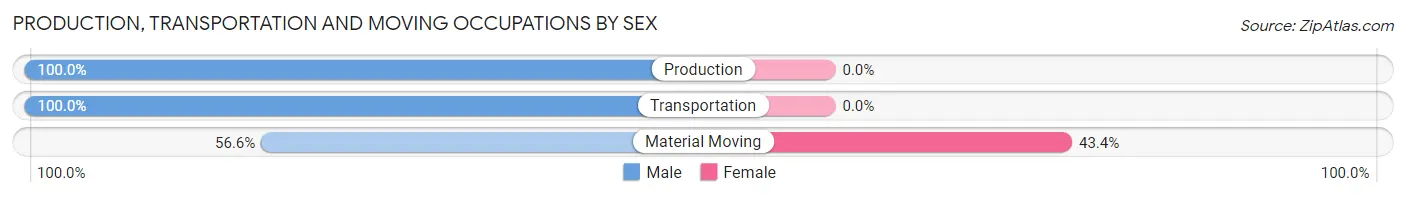
| Occupation | Male | Female |
| Production | 69 (100.0%) | 0 (0.0%) |
| Transportation | 54 (100.0%) | 0 (0.0%) |
| Material Moving | 30 (56.6%) | 23 (43.4%) |
| Total (Category) | 153 (86.9%) | 23 (13.1%) |
| Total (Overall) | 1,373 (59.9%) | 919 (40.1%) |
Employment Industries by Sex in South Barrington
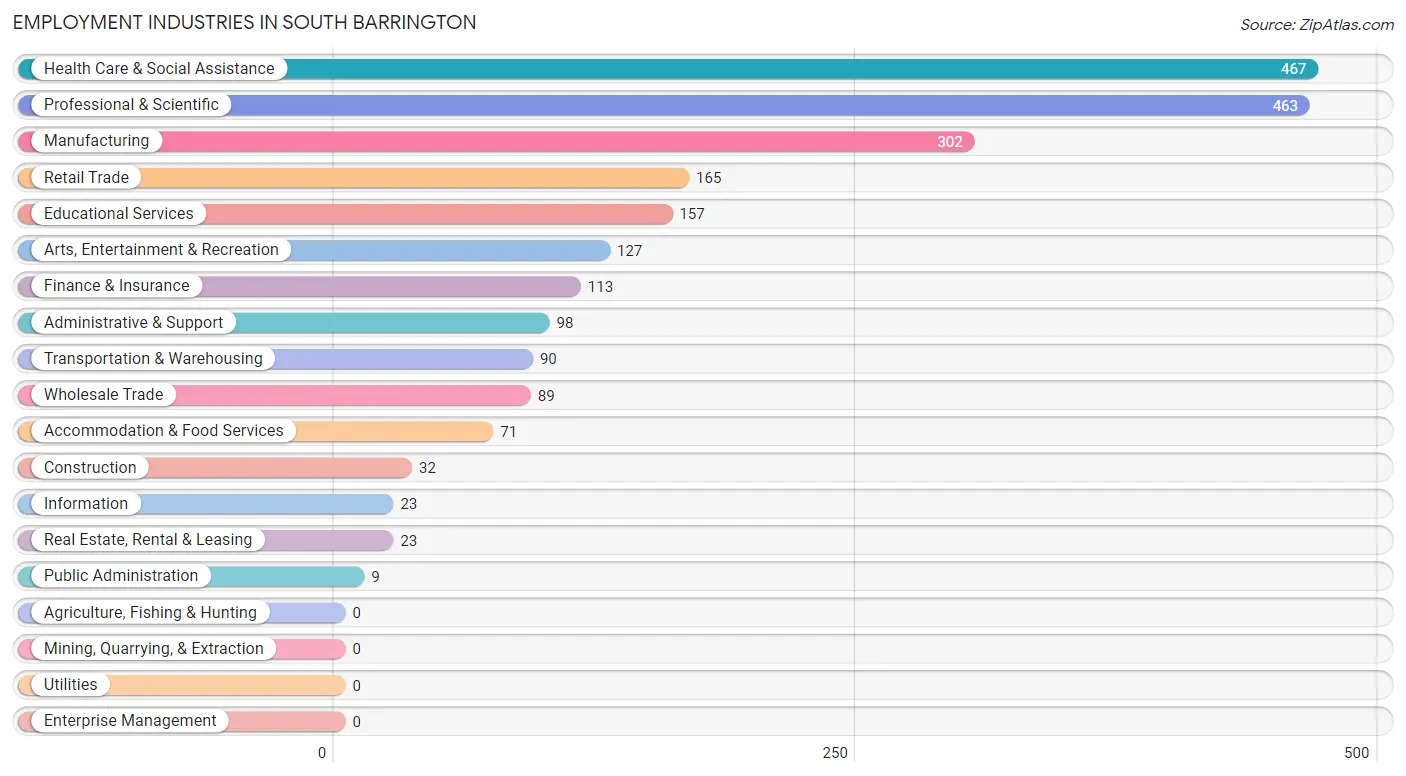
Employment Industries in South Barrington
The major employment industries in South Barrington include Health Care & Social Assistance (467 | 20.4%), Professional & Scientific (463 | 20.2%), Manufacturing (302 | 13.2%), Retail Trade (165 | 7.2%), and Educational Services (157 | 6.9%).
Employment Industries by Sex in South Barrington
The South Barrington industries that see more men than women are Construction (100.0%), Accommodation & Food Services (100.0%), and Public Administration (100.0%), whereas the industries that tend to have a higher number of women are Educational Services (86.6%), Arts, Entertainment & Recreation (76.4%), and Finance & Insurance (56.6%).
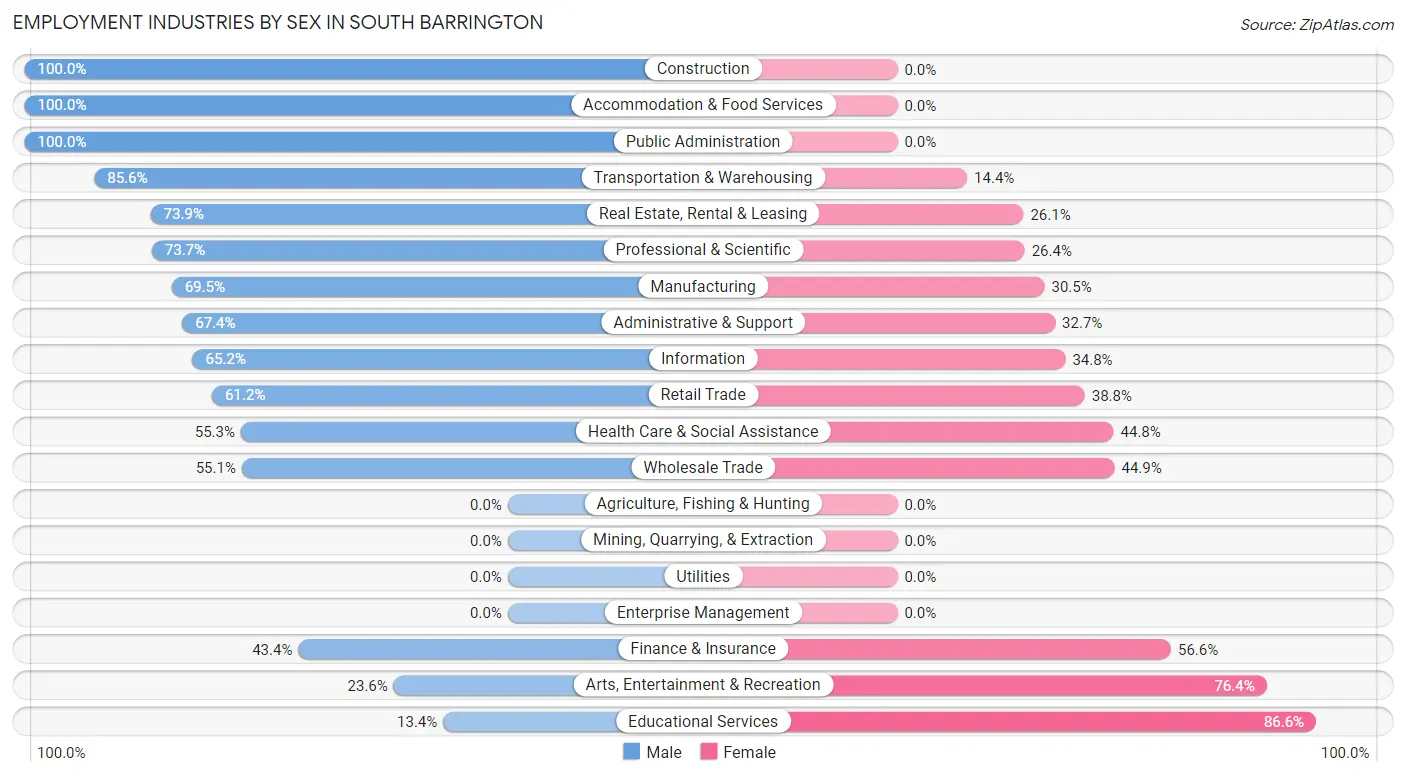
| Industry | Male | Female |
| Agriculture, Fishing & Hunting | 0 (0.0%) | 0 (0.0%) |
| Mining, Quarrying, & Extraction | 0 (0.0%) | 0 (0.0%) |
| Construction | 32 (100.0%) | 0 (0.0%) |
| Manufacturing | 210 (69.5%) | 92 (30.5%) |
| Wholesale Trade | 49 (55.1%) | 40 (44.9%) |
| Retail Trade | 101 (61.2%) | 64 (38.8%) |
| Transportation & Warehousing | 77 (85.6%) | 13 (14.4%) |
| Utilities | 0 (0.0%) | 0 (0.0%) |
| Information | 15 (65.2%) | 8 (34.8%) |
| Finance & Insurance | 49 (43.4%) | 64 (56.6%) |
| Real Estate, Rental & Leasing | 17 (73.9%) | 6 (26.1%) |
| Professional & Scientific | 341 (73.7%) | 122 (26.4%) |
| Enterprise Management | 0 (0.0%) | 0 (0.0%) |
| Administrative & Support | 66 (67.3%) | 32 (32.7%) |
| Educational Services | 21 (13.4%) | 136 (86.6%) |
| Health Care & Social Assistance | 258 (55.2%) | 209 (44.8%) |
| Arts, Entertainment & Recreation | 30 (23.6%) | 97 (76.4%) |
| Accommodation & Food Services | 71 (100.0%) | 0 (0.0%) |
| Public Administration | 9 (100.0%) | 0 (0.0%) |
| Total | 1,373 (59.9%) | 919 (40.1%) |
Education in South Barrington
School Enrollment in South Barrington
The most common levels of schooling among the 1,494 students in South Barrington are high school (448 | 30.0%), middle school (392 | 26.2%), and elementary school (346 | 23.2%).
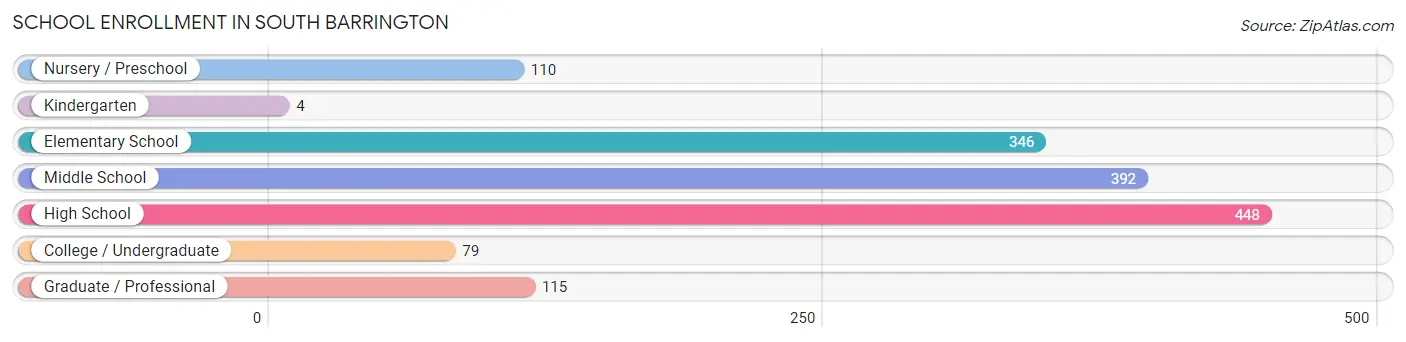
| School Level | # Students | % Students |
| Nursery / Preschool | 110 | 7.4% |
| Kindergarten | 4 | 0.3% |
| Elementary School | 346 | 23.2% |
| Middle School | 392 | 26.2% |
| High School | 448 | 30.0% |
| College / Undergraduate | 79 | 5.3% |
| Graduate / Professional | 115 | 7.7% |
| Total | 1,494 | 100.0% |
School Enrollment by Age by Funding Source in South Barrington
Out of a total of 1,494 students who are enrolled in schools in South Barrington, 288 (19.3%) attend a private institution, while the remaining 1,206 (80.7%) are enrolled in public schools. The age group of 20 to 24 year olds has the highest likelihood of being enrolled in private schools, with 25 (100.0% in the age bracket) enrolled. Conversely, the age group of 3 to 4 year olds has the lowest likelihood of being enrolled in a private school, with 49 (100.0% in the age bracket) attending a public institution.
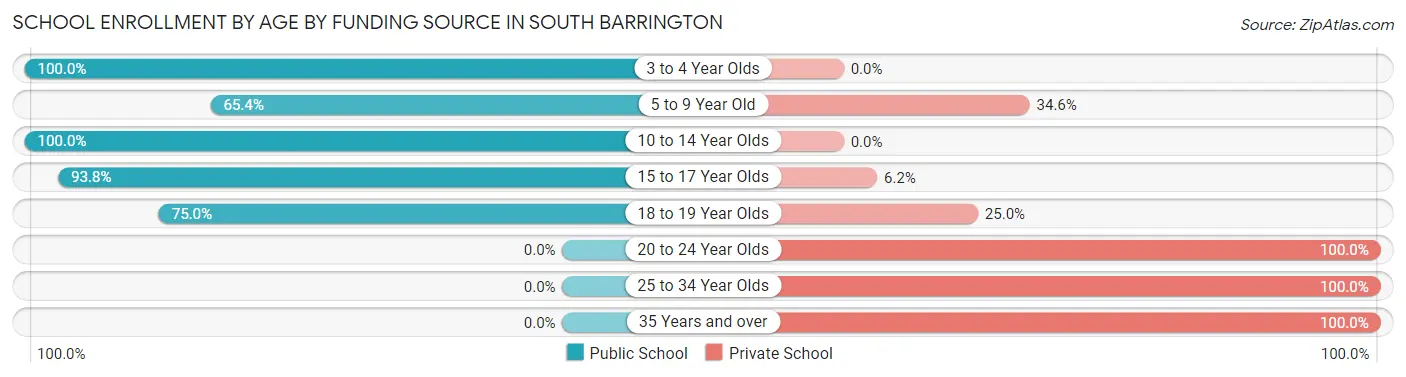
| Age Bracket | Public School | Private School |
| 3 to 4 Year Olds | 49 (100.0%) | 0 (0.0%) |
| 5 to 9 Year Old | 185 (65.4%) | 98 (34.6%) |
| 10 to 14 Year Olds | 616 (100.0%) | 0 (0.0%) |
| 15 to 17 Year Olds | 286 (93.8%) | 19 (6.2%) |
| 18 to 19 Year Olds | 69 (75.0%) | 23 (25.0%) |
| 20 to 24 Year Olds | 0 (0.0%) | 25 (100.0%) |
| 25 to 34 Year Olds | 0 (0.0%) | 27 (100.0%) |
| 35 Years and over | 0 (0.0%) | 97 (100.0%) |
| Total | 1,206 (80.7%) | 288 (19.3%) |
Educational Attainment by Field of Study in South Barrington
Business (498 | 20.6%), engineering (311 | 12.8%), physical & health sciences (254 | 10.5%), science & technology (251 | 10.4%), and education (216 | 8.9%) are the most common fields of study among 2,422 individuals in South Barrington who have obtained a bachelor's degree or higher.
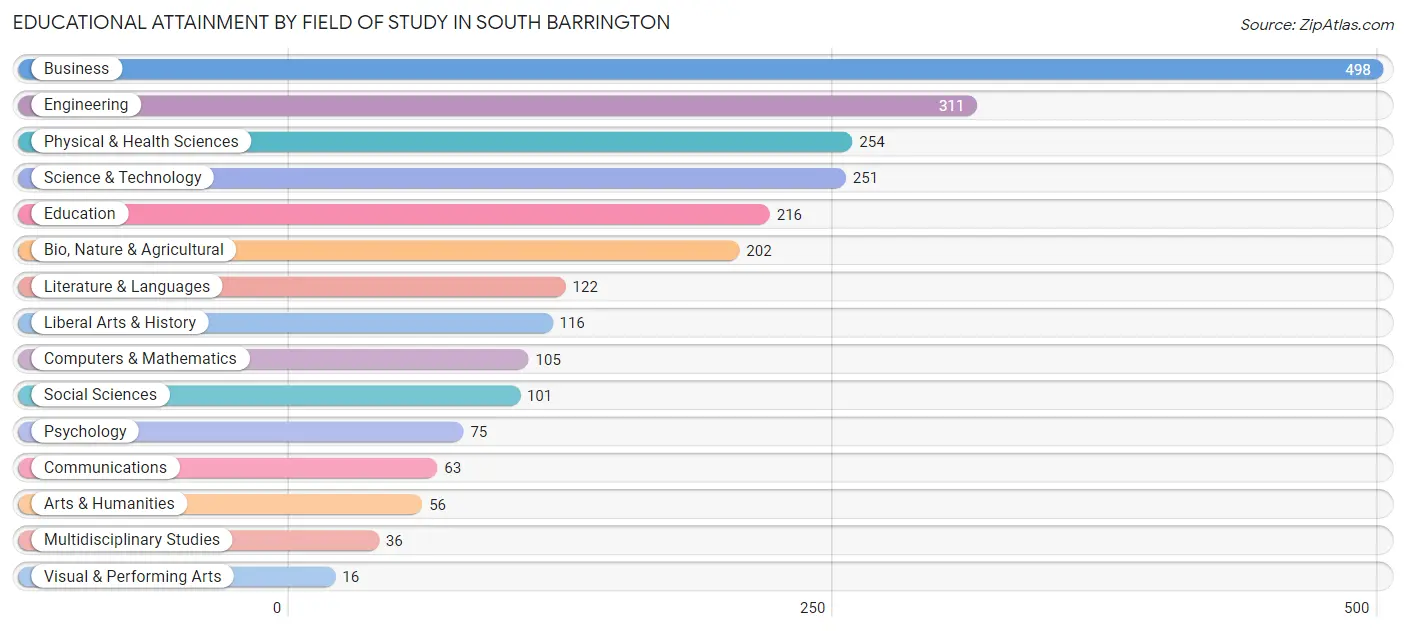
| Field of Study | # Graduates | % Graduates |
| Computers & Mathematics | 105 | 4.3% |
| Bio, Nature & Agricultural | 202 | 8.3% |
| Physical & Health Sciences | 254 | 10.5% |
| Psychology | 75 | 3.1% |
| Social Sciences | 101 | 4.2% |
| Engineering | 311 | 12.8% |
| Multidisciplinary Studies | 36 | 1.5% |
| Science & Technology | 251 | 10.4% |
| Business | 498 | 20.6% |
| Education | 216 | 8.9% |
| Literature & Languages | 122 | 5.0% |
| Liberal Arts & History | 116 | 4.8% |
| Visual & Performing Arts | 16 | 0.7% |
| Communications | 63 | 2.6% |
| Arts & Humanities | 56 | 2.3% |
| Total | 2,422 | 100.0% |
Transportation & Commute in South Barrington
Vehicle Availability by Sex in South Barrington
The most prevalent vehicle ownership categories in South Barrington are males with 2 vehicles (507, accounting for 38.0%) and females with 2 vehicles (432, making up 55.2%).
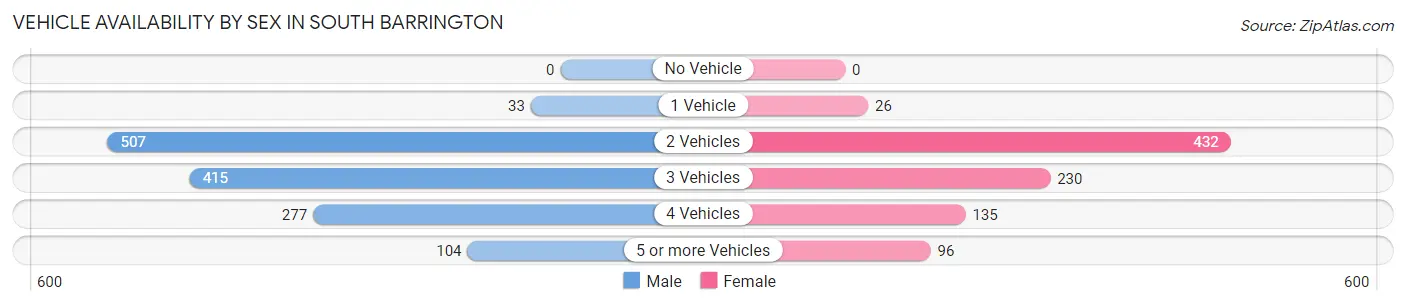
| Vehicles Available | Male | Female |
| No Vehicle | 0 (0.0%) | 0 (0.0%) |
| 1 Vehicle | 33 (2.5%) | 26 (2.8%) |
| 2 Vehicles | 507 (38.0%) | 432 (47.0%) |
| 3 Vehicles | 415 (31.1%) | 230 (25.0%) |
| 4 Vehicles | 277 (20.7%) | 135 (14.7%) |
| 5 or more Vehicles | 104 (7.8%) | 96 (10.4%) |
| Total | 1,336 (100.0%) | 919 (100.0%) |
Commute Time in South Barrington
The most frequently occuring commute durations in South Barrington are 30 to 34 minutes (415 commuters, 22.8%), 15 to 19 minutes (318 commuters, 17.4%), and 40 to 44 minutes (240 commuters, 13.2%).
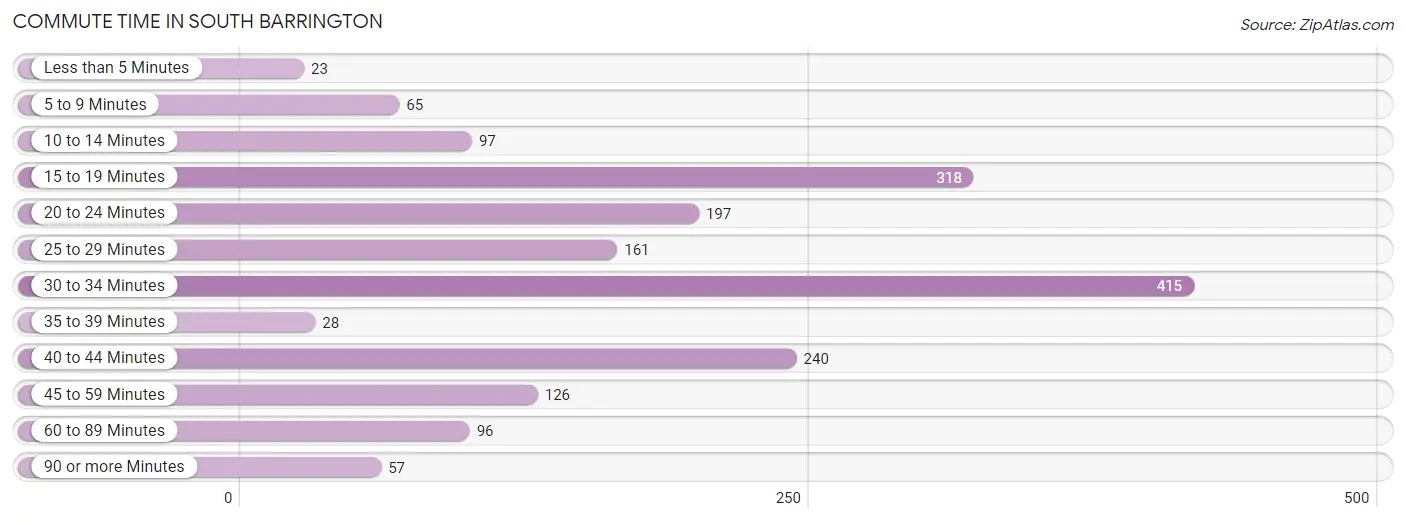
| Commute Time | # Commuters | % Commuters |
| Less than 5 Minutes | 23 | 1.3% |
| 5 to 9 Minutes | 65 | 3.6% |
| 10 to 14 Minutes | 97 | 5.3% |
| 15 to 19 Minutes | 318 | 17.4% |
| 20 to 24 Minutes | 197 | 10.8% |
| 25 to 29 Minutes | 161 | 8.8% |
| 30 to 34 Minutes | 415 | 22.8% |
| 35 to 39 Minutes | 28 | 1.5% |
| 40 to 44 Minutes | 240 | 13.2% |
| 45 to 59 Minutes | 126 | 6.9% |
| 60 to 89 Minutes | 96 | 5.3% |
| 90 or more Minutes | 57 | 3.1% |
Commute Time by Sex in South Barrington
The most common commute times in South Barrington are 15 to 19 minutes (250 commuters, 21.6%) for males and 30 to 34 minutes (196 commuters, 29.4%) for females.
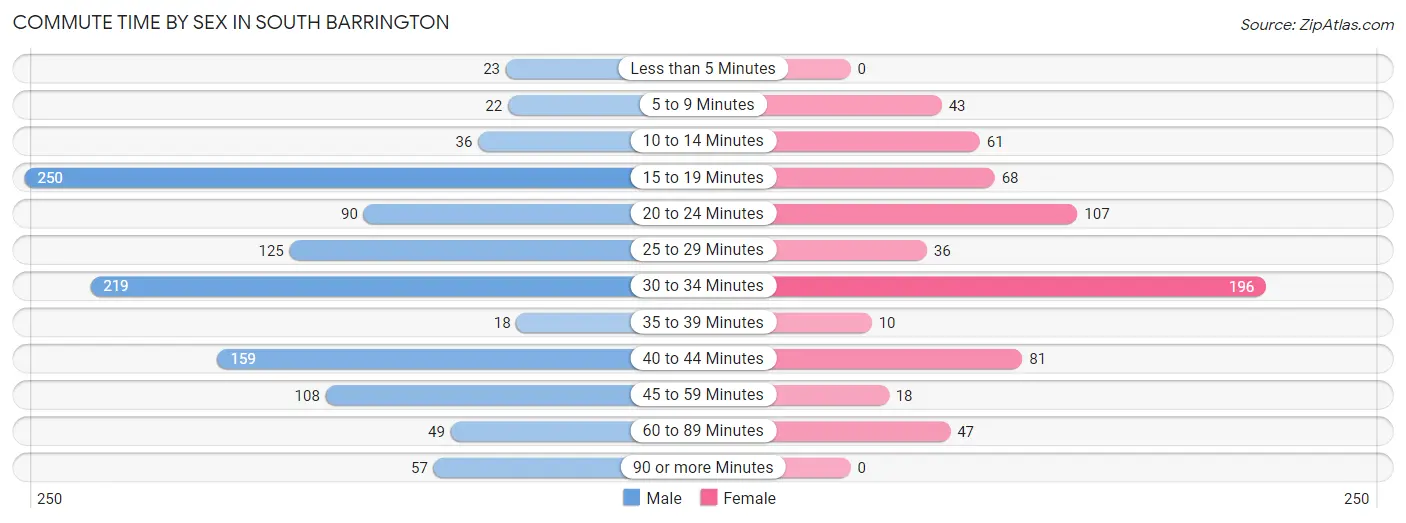
| Commute Time | Male | Female |
| Less than 5 Minutes | 23 (2.0%) | 0 (0.0%) |
| 5 to 9 Minutes | 22 (1.9%) | 43 (6.5%) |
| 10 to 14 Minutes | 36 (3.1%) | 61 (9.1%) |
| 15 to 19 Minutes | 250 (21.6%) | 68 (10.2%) |
| 20 to 24 Minutes | 90 (7.8%) | 107 (16.0%) |
| 25 to 29 Minutes | 125 (10.8%) | 36 (5.4%) |
| 30 to 34 Minutes | 219 (18.9%) | 196 (29.4%) |
| 35 to 39 Minutes | 18 (1.6%) | 10 (1.5%) |
| 40 to 44 Minutes | 159 (13.8%) | 81 (12.1%) |
| 45 to 59 Minutes | 108 (9.3%) | 18 (2.7%) |
| 60 to 89 Minutes | 49 (4.2%) | 47 (7.0%) |
| 90 or more Minutes | 57 (4.9%) | 0 (0.0%) |
Time of Departure to Work by Sex in South Barrington
The most frequent times of departure to work in South Barrington are 8:00 AM to 8:29 AM (231, 20.0%) for males and 7:30 AM to 7:59 AM (165, 24.7%) for females.
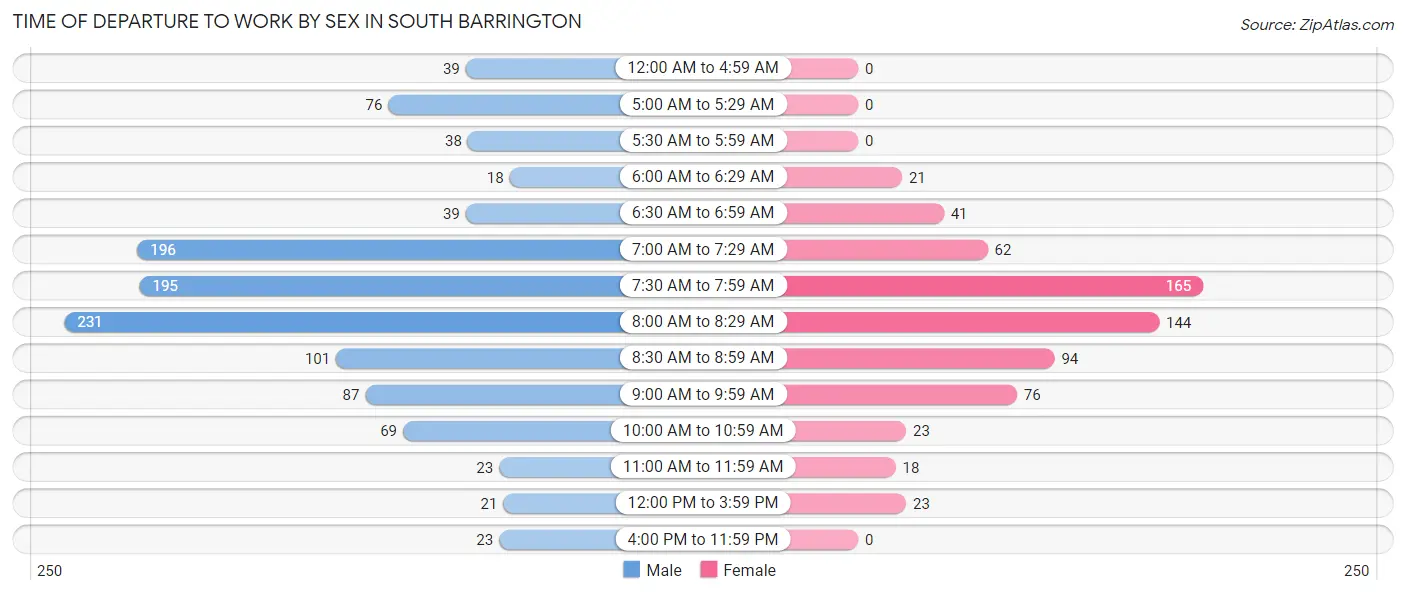
| Time of Departure | Male | Female |
| 12:00 AM to 4:59 AM | 39 (3.4%) | 0 (0.0%) |
| 5:00 AM to 5:29 AM | 76 (6.6%) | 0 (0.0%) |
| 5:30 AM to 5:59 AM | 38 (3.3%) | 0 (0.0%) |
| 6:00 AM to 6:29 AM | 18 (1.6%) | 21 (3.2%) |
| 6:30 AM to 6:59 AM | 39 (3.4%) | 41 (6.1%) |
| 7:00 AM to 7:29 AM | 196 (17.0%) | 62 (9.3%) |
| 7:30 AM to 7:59 AM | 195 (16.9%) | 165 (24.7%) |
| 8:00 AM to 8:29 AM | 231 (20.0%) | 144 (21.6%) |
| 8:30 AM to 8:59 AM | 101 (8.7%) | 94 (14.1%) |
| 9:00 AM to 9:59 AM | 87 (7.5%) | 76 (11.4%) |
| 10:00 AM to 10:59 AM | 69 (6.0%) | 23 (3.5%) |
| 11:00 AM to 11:59 AM | 23 (2.0%) | 18 (2.7%) |
| 12:00 PM to 3:59 PM | 21 (1.8%) | 23 (3.5%) |
| 4:00 PM to 11:59 PM | 23 (2.0%) | 0 (0.0%) |
| Total | 1,156 (100.0%) | 667 (100.0%) |
Housing Occupancy in South Barrington
Occupancy by Ownership in South Barrington
Of the total 1,613 dwellings in South Barrington, owner-occupied units account for 1,604 (99.4%), while renter-occupied units make up 9 (0.6%).
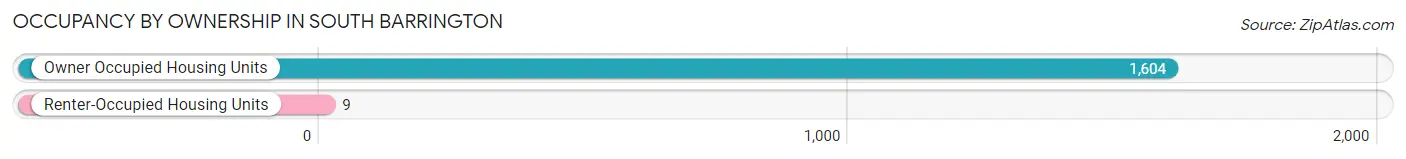
| Occupancy | # Housing Units | % Housing Units |
| Owner Occupied Housing Units | 1,604 | 99.4% |
| Renter-Occupied Housing Units | 9 | 0.6% |
| Total Occupied Housing Units | 1,613 | 100.0% |
Occupancy by Household Size in South Barrington
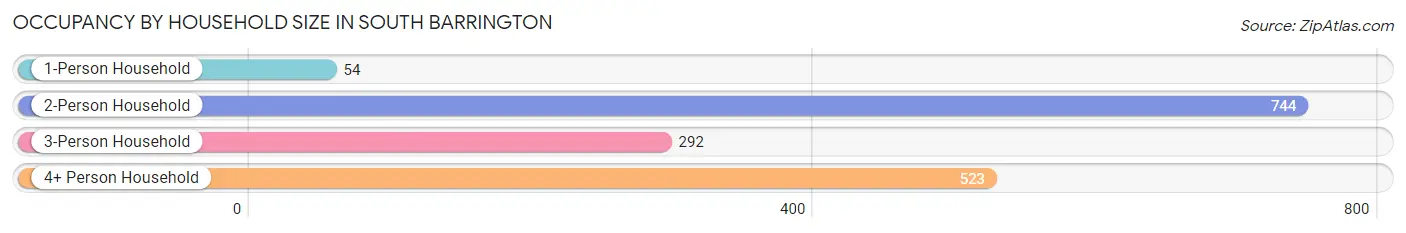
| Household Size | # Housing Units | % Housing Units |
| 1-Person Household | 54 | 3.4% |
| 2-Person Household | 744 | 46.1% |
| 3-Person Household | 292 | 18.1% |
| 4+ Person Household | 523 | 32.4% |
| Total Housing Units | 1,613 | 100.0% |
Occupancy by Ownership by Household Size in South Barrington
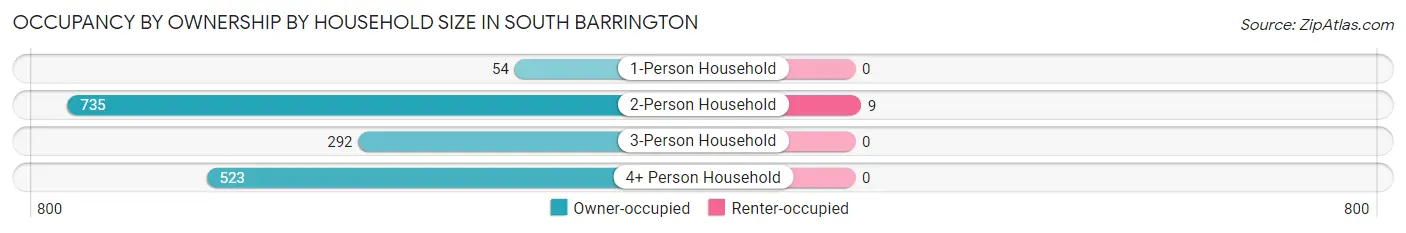
| Household Size | Owner-occupied | Renter-occupied |
| 1-Person Household | 54 (100.0%) | 0 (0.0%) |
| 2-Person Household | 735 (98.8%) | 9 (1.2%) |
| 3-Person Household | 292 (100.0%) | 0 (0.0%) |
| 4+ Person Household | 523 (100.0%) | 0 (0.0%) |
| Total Housing Units | 1,604 (99.4%) | 9 (0.6%) |
Occupancy by Educational Attainment in South Barrington
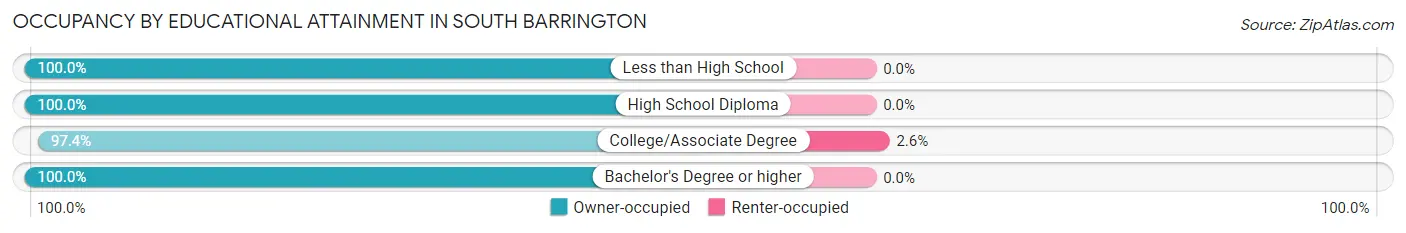
| Household Size | Owner-occupied | Renter-occupied |
| Less than High School | 13 (100.0%) | 0 (0.0%) |
| High School Diploma | 56 (100.0%) | 0 (0.0%) |
| College/Associate Degree | 332 (97.4%) | 9 (2.6%) |
| Bachelor's Degree or higher | 1,203 (100.0%) | 0 (0.0%) |
Occupancy by Age of Householder in South Barrington
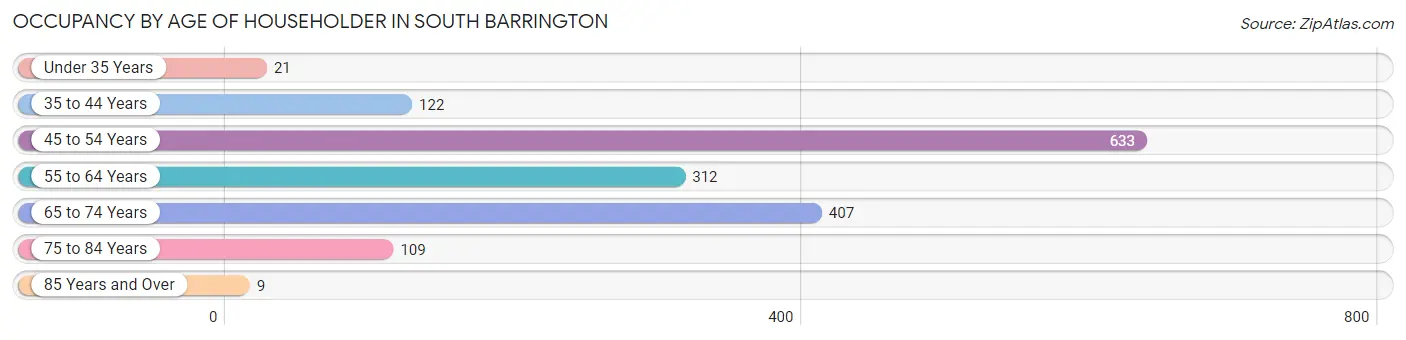
| Age Bracket | # Households | % Households |
| Under 35 Years | 21 | 1.3% |
| 35 to 44 Years | 122 | 7.6% |
| 45 to 54 Years | 633 | 39.2% |
| 55 to 64 Years | 312 | 19.3% |
| 65 to 74 Years | 407 | 25.2% |
| 75 to 84 Years | 109 | 6.8% |
| 85 Years and Over | 9 | 0.6% |
| Total | 1,613 | 100.0% |
Housing Finances in South Barrington
Median Income by Occupancy in South Barrington
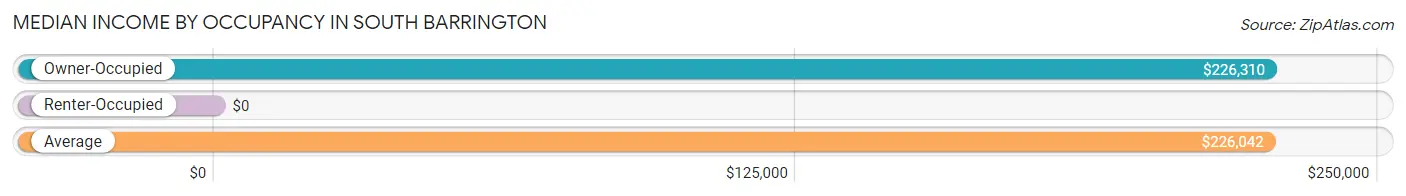
| Occupancy Type | # Households | Median Income |
| Owner-Occupied | 1,604 (99.4%) | $226,310 |
| Renter-Occupied | 9 (0.6%) | $0 |
| Average | 1,613 (100.0%) | $226,042 |
Occupancy by Householder Income Bracket in South Barrington
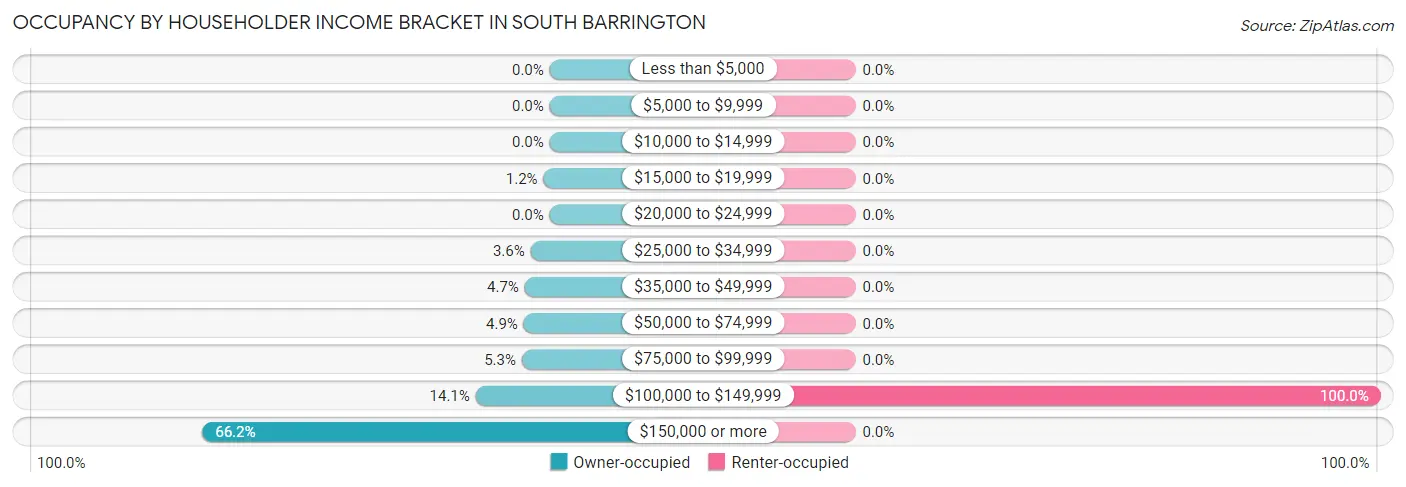
| Income Bracket | Owner-occupied | Renter-occupied |
| Less than $5,000 | 0 (0.0%) | 0 (0.0%) |
| $5,000 to $9,999 | 0 (0.0%) | 0 (0.0%) |
| $10,000 to $14,999 | 0 (0.0%) | 0 (0.0%) |
| $15,000 to $19,999 | 19 (1.2%) | 0 (0.0%) |
| $20,000 to $24,999 | 0 (0.0%) | 0 (0.0%) |
| $25,000 to $34,999 | 58 (3.6%) | 0 (0.0%) |
| $35,000 to $49,999 | 76 (4.7%) | 0 (0.0%) |
| $50,000 to $74,999 | 79 (4.9%) | 0 (0.0%) |
| $75,000 to $99,999 | 85 (5.3%) | 0 (0.0%) |
| $100,000 to $149,999 | 226 (14.1%) | 9 (100.0%) |
| $150,000 or more | 1,061 (66.1%) | 0 (0.0%) |
| Total | 1,604 (100.0%) | 9 (100.0%) |
Monthly Housing Cost Tiers in South Barrington
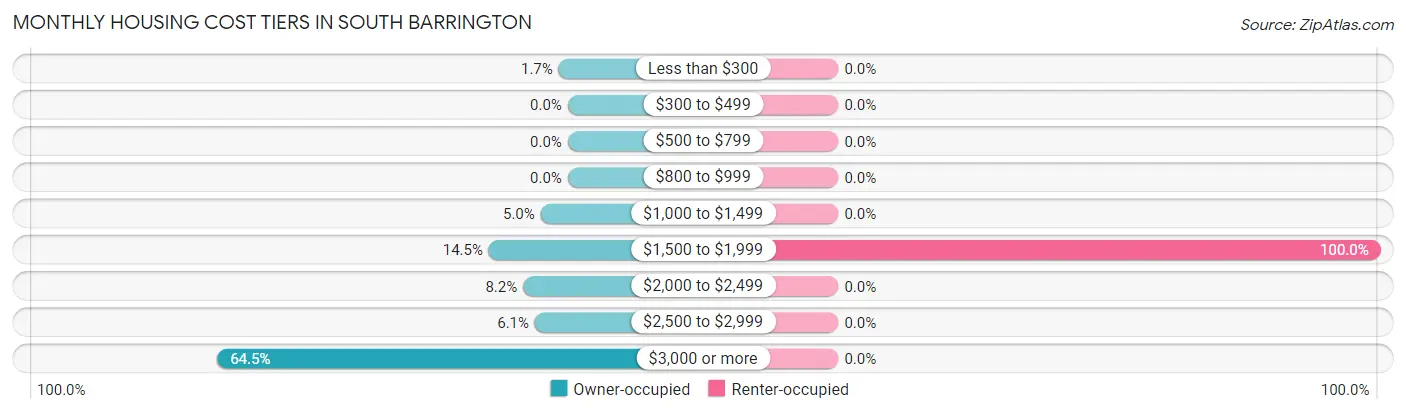
| Monthly Cost | Owner-occupied | Renter-occupied |
| Less than $300 | 27 (1.7%) | 0 (0.0%) |
| $300 to $499 | 0 (0.0%) | 0 (0.0%) |
| $500 to $799 | 0 (0.0%) | 0 (0.0%) |
| $800 to $999 | 0 (0.0%) | 0 (0.0%) |
| $1,000 to $1,499 | 80 (5.0%) | 0 (0.0%) |
| $1,500 to $1,999 | 233 (14.5%) | 9 (100.0%) |
| $2,000 to $2,499 | 132 (8.2%) | 0 (0.0%) |
| $2,500 to $2,999 | 97 (6.0%) | 0 (0.0%) |
| $3,000 or more | 1,035 (64.5%) | 0 (0.0%) |
| Total | 1,604 (100.0%) | 9 (100.0%) |
Physical Housing Characteristics in South Barrington
Housing Structures in South Barrington
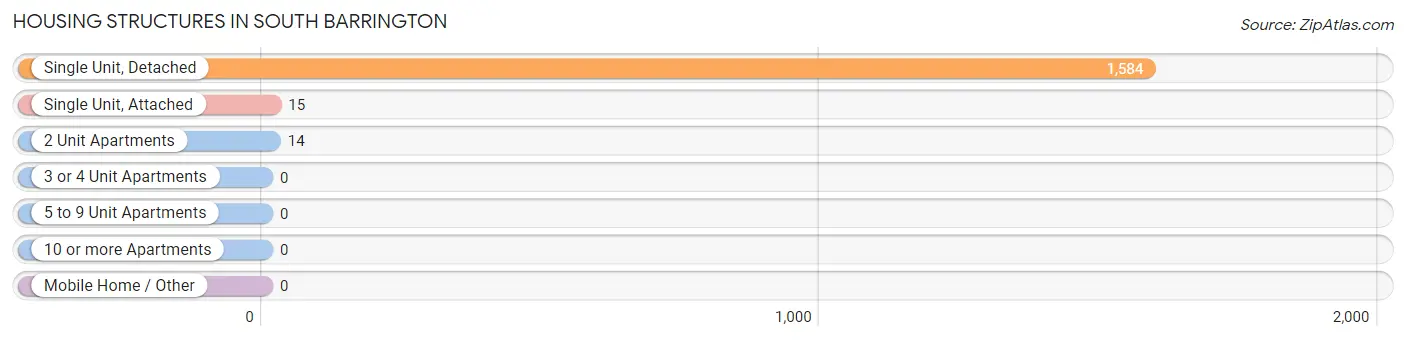
| Structure Type | # Housing Units | % Housing Units |
| Single Unit, Detached | 1,584 | 98.2% |
| Single Unit, Attached | 15 | 0.9% |
| 2 Unit Apartments | 14 | 0.9% |
| 3 or 4 Unit Apartments | 0 | 0.0% |
| 5 to 9 Unit Apartments | 0 | 0.0% |
| 10 or more Apartments | 0 | 0.0% |
| Mobile Home / Other | 0 | 0.0% |
| Total | 1,613 | 100.0% |
Housing Structures by Occupancy in South Barrington
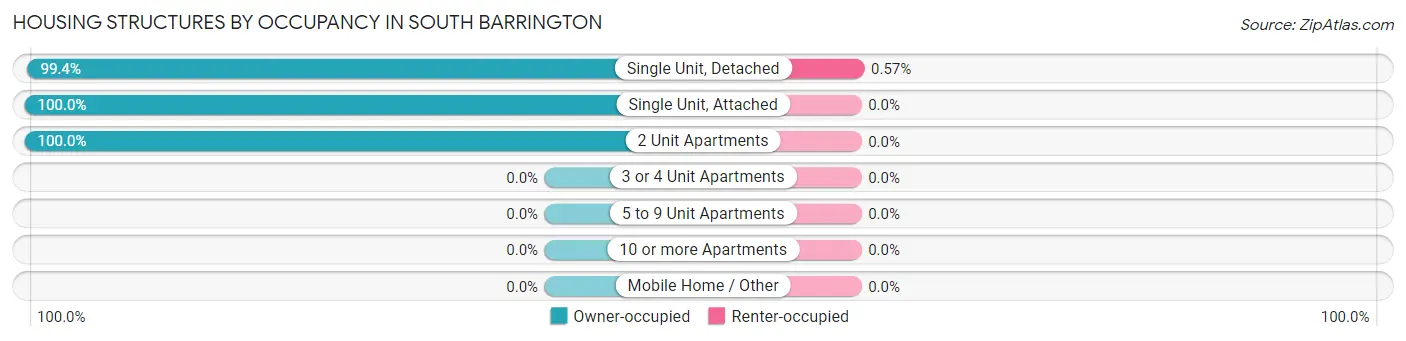
| Structure Type | Owner-occupied | Renter-occupied |
| Single Unit, Detached | 1,575 (99.4%) | 9 (0.6%) |
| Single Unit, Attached | 15 (100.0%) | 0 (0.0%) |
| 2 Unit Apartments | 14 (100.0%) | 0 (0.0%) |
| 3 or 4 Unit Apartments | 0 (0.0%) | 0 (0.0%) |
| 5 to 9 Unit Apartments | 0 (0.0%) | 0 (0.0%) |
| 10 or more Apartments | 0 (0.0%) | 0 (0.0%) |
| Mobile Home / Other | 0 (0.0%) | 0 (0.0%) |
| Total | 1,604 (99.4%) | 9 (0.6%) |
Housing Structures by Number of Rooms in South Barrington
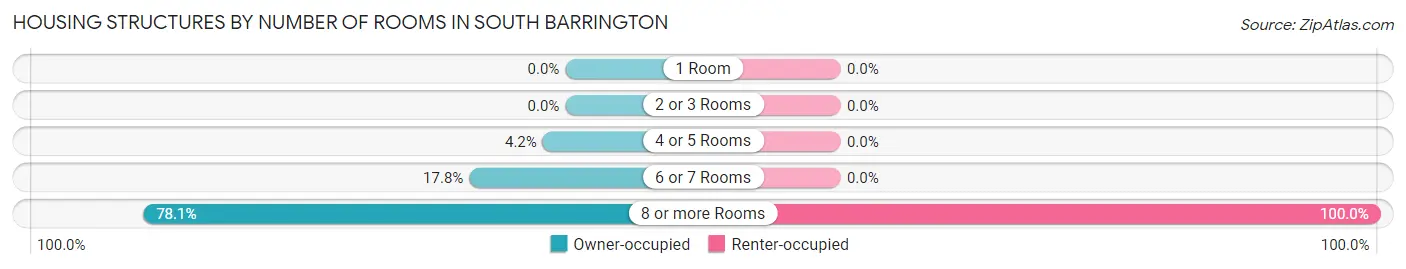
| Number of Rooms | Owner-occupied | Renter-occupied |
| 1 Room | 0 (0.0%) | 0 (0.0%) |
| 2 or 3 Rooms | 0 (0.0%) | 0 (0.0%) |
| 4 or 5 Rooms | 67 (4.2%) | 0 (0.0%) |
| 6 or 7 Rooms | 285 (17.8%) | 0 (0.0%) |
| 8 or more Rooms | 1,252 (78.0%) | 9 (100.0%) |
| Total | 1,604 (100.0%) | 9 (100.0%) |
Housing Structure by Heating Type in South Barrington
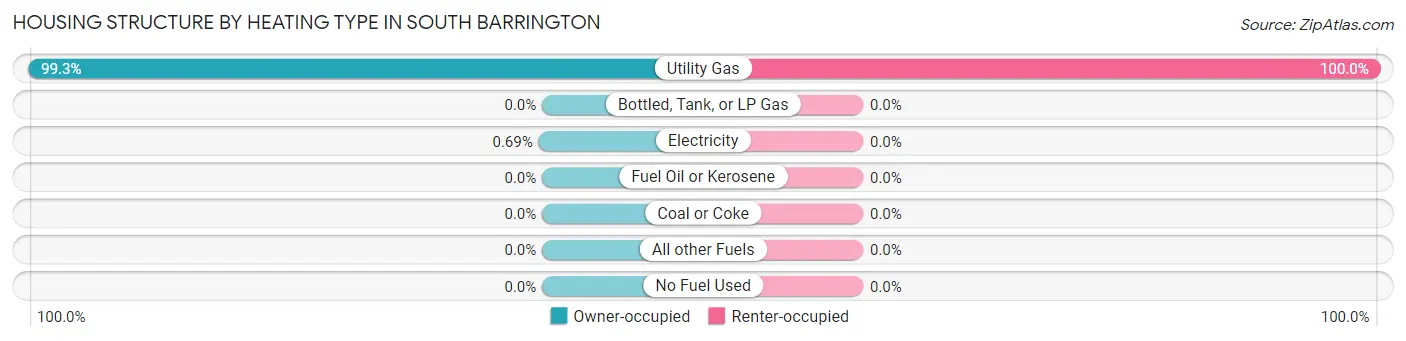
| Heating Type | Owner-occupied | Renter-occupied |
| Utility Gas | 1,593 (99.3%) | 9 (100.0%) |
| Bottled, Tank, or LP Gas | 0 (0.0%) | 0 (0.0%) |
| Electricity | 11 (0.7%) | 0 (0.0%) |
| Fuel Oil or Kerosene | 0 (0.0%) | 0 (0.0%) |
| Coal or Coke | 0 (0.0%) | 0 (0.0%) |
| All other Fuels | 0 (0.0%) | 0 (0.0%) |
| No Fuel Used | 0 (0.0%) | 0 (0.0%) |
| Total | 1,604 (100.0%) | 9 (100.0%) |
Household Vehicle Usage in South Barrington
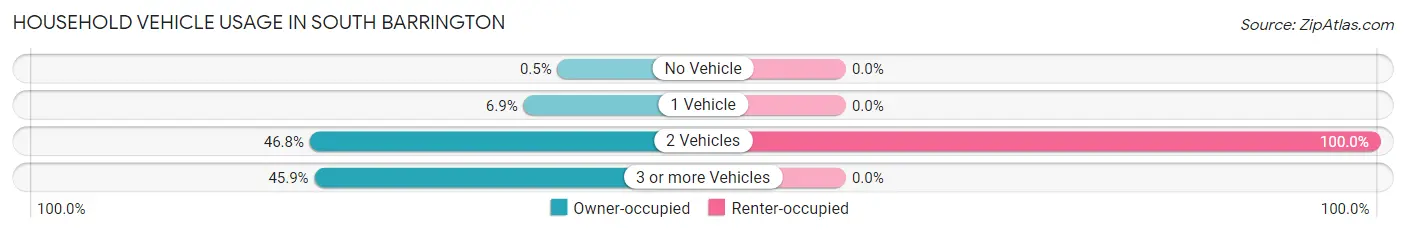
| Vehicles per Household | Owner-occupied | Renter-occupied |
| No Vehicle | 8 (0.5%) | 0 (0.0%) |
| 1 Vehicle | 110 (6.9%) | 0 (0.0%) |
| 2 Vehicles | 750 (46.8%) | 9 (100.0%) |
| 3 or more Vehicles | 736 (45.9%) | 0 (0.0%) |
| Total | 1,604 (100.0%) | 9 (100.0%) |
Real Estate & Mortgages in South Barrington
Real Estate and Mortgage Overview in South Barrington
| Characteristic | Without Mortgage | With Mortgage |
| Housing Units | 530 | 1,074 |
| Median Property Value | $790,500 | $925,700 |
| Median Household Income | $134,276 | $829 |
| Monthly Housing Costs | $1,501 | $962 |
| Real Estate Taxes | $10,001 | $0 |
Property Value by Mortgage Status in South Barrington
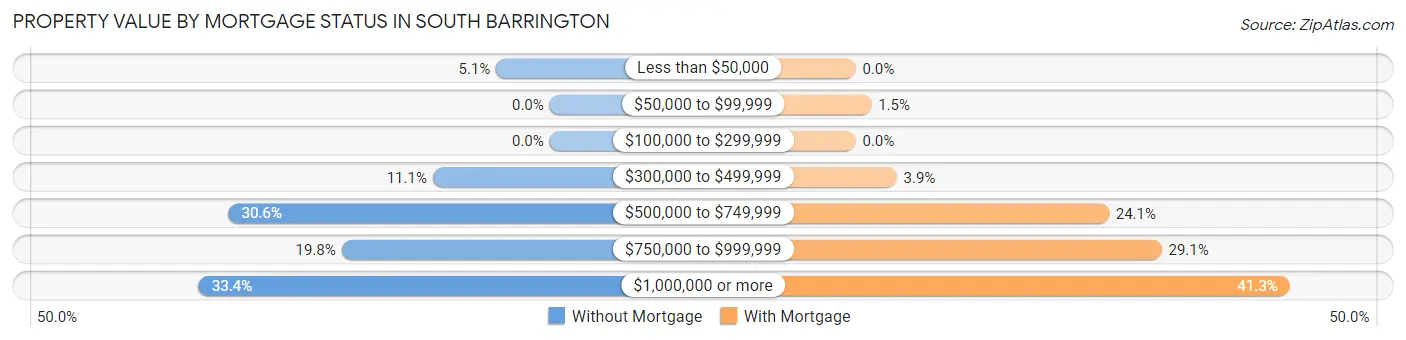
| Property Value | Without Mortgage | With Mortgage |
| Less than $50,000 | 27 (5.1%) | 0 (0.0%) |
| $50,000 to $99,999 | 0 (0.0%) | 16 (1.5%) |
| $100,000 to $299,999 | 0 (0.0%) | 0 (0.0%) |
| $300,000 to $499,999 | 59 (11.1%) | 42 (3.9%) |
| $500,000 to $749,999 | 162 (30.6%) | 259 (24.1%) |
| $750,000 to $999,999 | 105 (19.8%) | 313 (29.1%) |
| $1,000,000 or more | 177 (33.4%) | 444 (41.3%) |
| Total | 530 (100.0%) | 1,074 (100.0%) |
Household Income by Mortgage Status in South Barrington
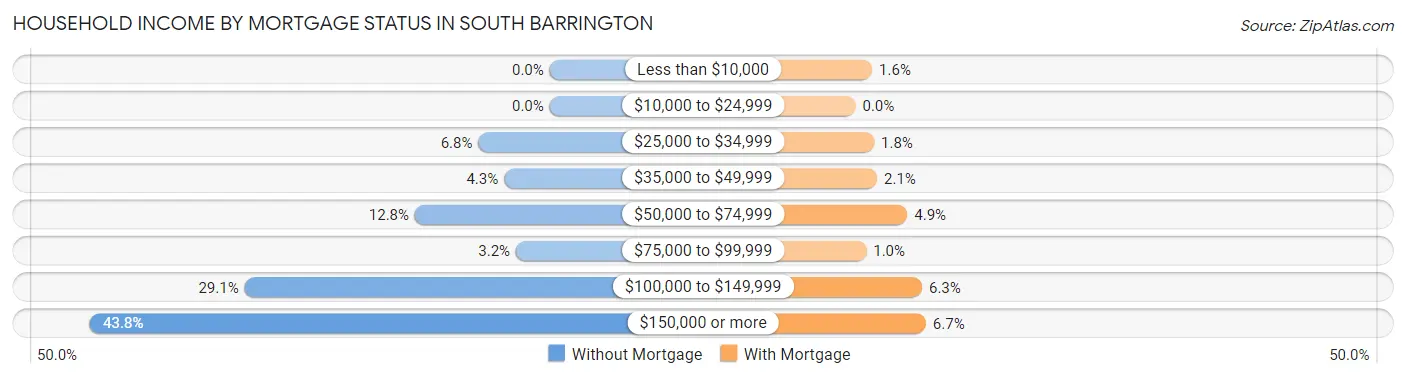
| Household Income | Without Mortgage | With Mortgage |
| Less than $10,000 | 0 (0.0%) | 17 (1.6%) |
| $10,000 to $24,999 | 0 (0.0%) | 0 (0.0%) |
| $25,000 to $34,999 | 36 (6.8%) | 19 (1.8%) |
| $35,000 to $49,999 | 23 (4.3%) | 22 (2.1%) |
| $50,000 to $74,999 | 68 (12.8%) | 53 (4.9%) |
| $75,000 to $99,999 | 17 (3.2%) | 11 (1.0%) |
| $100,000 to $149,999 | 154 (29.1%) | 68 (6.3%) |
| $150,000 or more | 232 (43.8%) | 72 (6.7%) |
| Total | 530 (100.0%) | 1,074 (100.0%) |
Property Value to Household Income Ratio in South Barrington
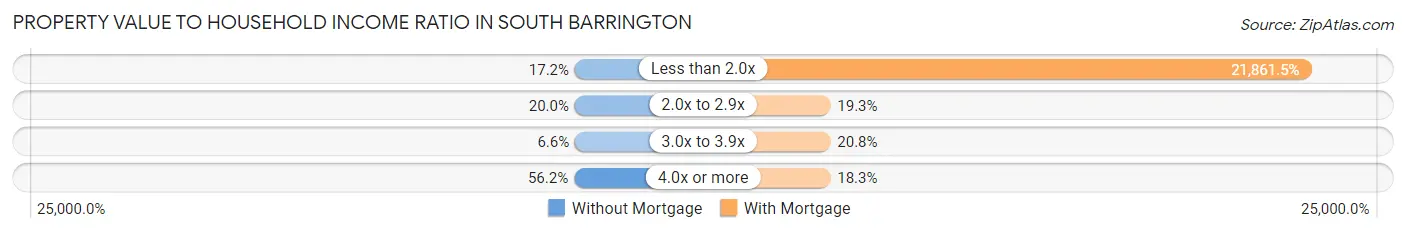
| Value-to-Income Ratio | Without Mortgage | With Mortgage |
| Less than 2.0x | 91 (17.2%) | 234,792 (21,861.4%) |
| 2.0x to 2.9x | 106 (20.0%) | 207 (19.3%) |
| 3.0x to 3.9x | 35 (6.6%) | 223 (20.8%) |
| 4.0x or more | 298 (56.2%) | 196 (18.2%) |
| Total | 530 (100.0%) | 1,074 (100.0%) |
Real Estate Taxes by Mortgage Status in South Barrington
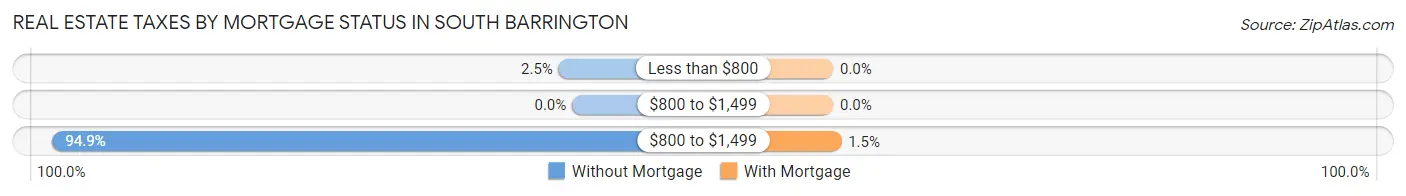
| Property Taxes | Without Mortgage | With Mortgage |
| Less than $800 | 13 (2.5%) | 0 (0.0%) |
| $800 to $1,499 | 0 (0.0%) | 0 (0.0%) |
| $800 to $1,499 | 503 (94.9%) | 16 (1.5%) |
| Total | 530 (100.0%) | 1,074 (100.0%) |
Health & Disability in South Barrington
Health Insurance Coverage by Age in South Barrington
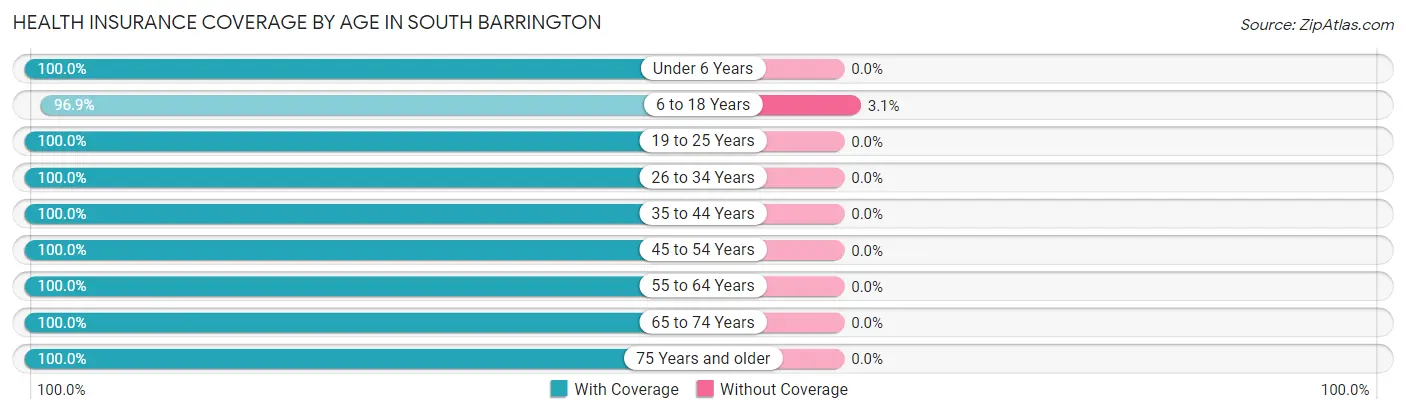
| Age Bracket | With Coverage | Without Coverage |
| Under 6 Years | 233 (100.0%) | 0 (0.0%) |
| 6 to 18 Years | 1,197 (96.9%) | 38 (3.1%) |
| 19 to 25 Years | 124 (100.0%) | 0 (0.0%) |
| 26 to 34 Years | 104 (100.0%) | 0 (0.0%) |
| 35 to 44 Years | 421 (100.0%) | 0 (0.0%) |
| 45 to 54 Years | 1,060 (100.0%) | 0 (0.0%) |
| 55 to 64 Years | 704 (100.0%) | 0 (0.0%) |
| 65 to 74 Years | 812 (100.0%) | 0 (0.0%) |
| 75 Years and older | 308 (100.0%) | 0 (0.0%) |
| Total | 4,963 (99.2%) | 38 (0.8%) |
Health Insurance Coverage by Citizenship Status in South Barrington
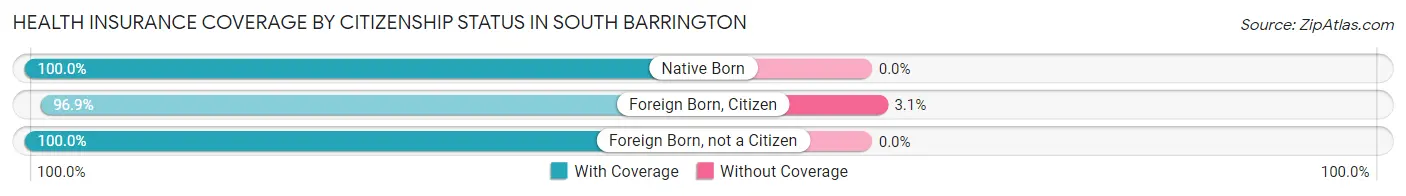
| Citizenship Status | With Coverage | Without Coverage |
| Native Born | 233 (100.0%) | 0 (0.0%) |
| Foreign Born, Citizen | 1,197 (96.9%) | 38 (3.1%) |
| Foreign Born, not a Citizen | 124 (100.0%) | 0 (0.0%) |
Health Insurance Coverage by Household Income in South Barrington
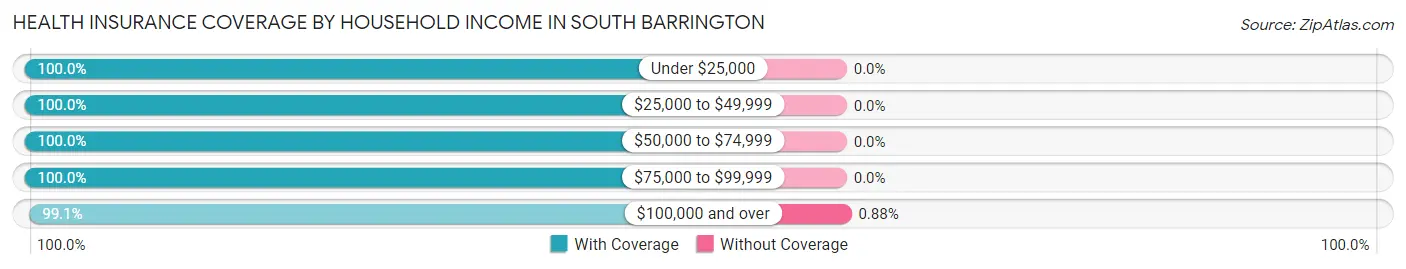
| Household Income | With Coverage | Without Coverage |
| Under $25,000 | 38 (100.0%) | 0 (0.0%) |
| $25,000 to $49,999 | 300 (100.0%) | 0 (0.0%) |
| $50,000 to $74,999 | 170 (100.0%) | 0 (0.0%) |
| $75,000 to $99,999 | 169 (100.0%) | 0 (0.0%) |
| $100,000 and over | 4,286 (99.1%) | 38 (0.9%) |
Public vs Private Health Insurance Coverage by Age in South Barrington
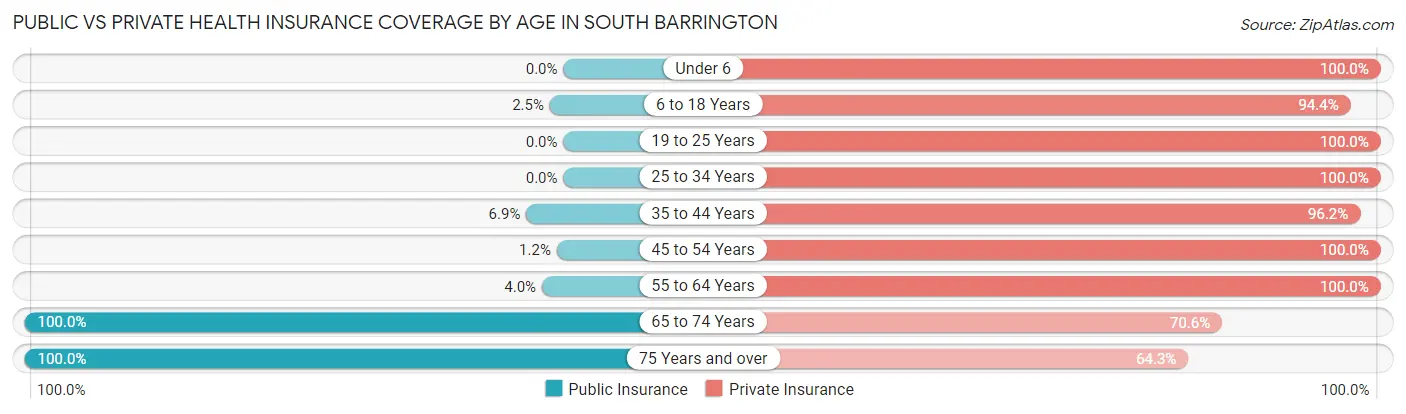
| Age Bracket | Public Insurance | Private Insurance |
| Under 6 | 0 (0.0%) | 233 (100.0%) |
| 6 to 18 Years | 31 (2.5%) | 1,166 (94.4%) |
| 19 to 25 Years | 0 (0.0%) | 124 (100.0%) |
| 25 to 34 Years | 0 (0.0%) | 104 (100.0%) |
| 35 to 44 Years | 29 (6.9%) | 405 (96.2%) |
| 45 to 54 Years | 13 (1.2%) | 1,060 (100.0%) |
| 55 to 64 Years | 28 (4.0%) | 704 (100.0%) |
| 65 to 74 Years | 812 (100.0%) | 573 (70.6%) |
| 75 Years and over | 308 (100.0%) | 198 (64.3%) |
| Total | 1,221 (24.4%) | 4,567 (91.3%) |
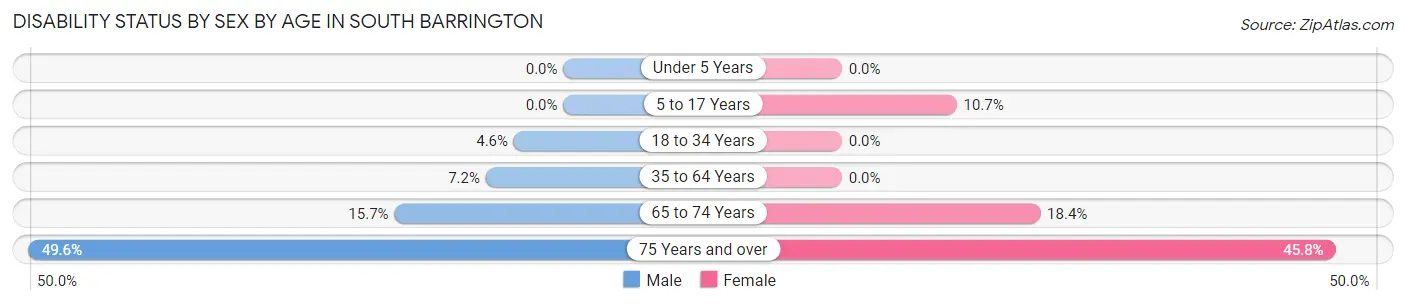
Disability Status by Sex by Age in South Barrington
| Age Bracket | Male | Female |
| Under 5 Years | 0 (0.0%) | 0 (0.0%) |
| 5 to 17 Years | 0 (0.0%) | 54 (10.6%) |
| 18 to 34 Years | 9 (4.6%) | 0 (0.0%) |
| 35 to 64 Years | 77 (7.2%) | 0 (0.0%) |
| 65 to 74 Years | 66 (15.7%) | 72 (18.4%) |
| 75 Years and over | 64 (49.6%) | 82 (45.8%) |
Disability Class by Sex by Age in South Barrington
Disability Class: Hearing Difficulty
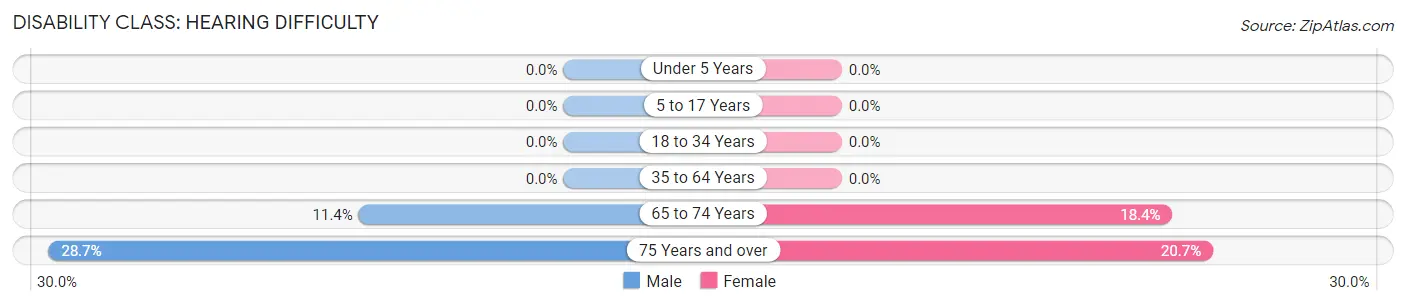
| Age Bracket | Male | Female |
| Under 5 Years | 0 (0.0%) | 0 (0.0%) |
| 5 to 17 Years | 0 (0.0%) | 0 (0.0%) |
| 18 to 34 Years | 0 (0.0%) | 0 (0.0%) |
| 35 to 64 Years | 0 (0.0%) | 0 (0.0%) |
| 65 to 74 Years | 48 (11.4%) | 72 (18.4%) |
| 75 Years and over | 37 (28.7%) | 37 (20.7%) |
Disability Class: Vision Difficulty
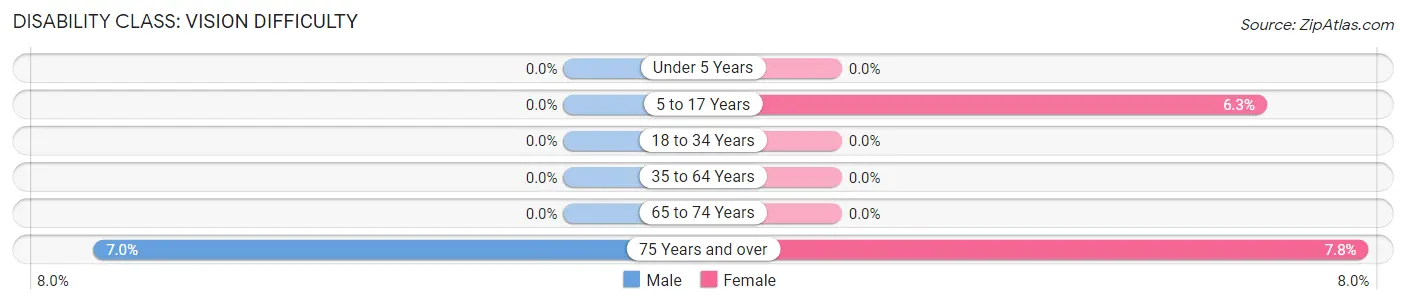
| Age Bracket | Male | Female |
| Under 5 Years | 0 (0.0%) | 0 (0.0%) |
| 5 to 17 Years | 0 (0.0%) | 32 (6.3%) |
| 18 to 34 Years | 0 (0.0%) | 0 (0.0%) |
| 35 to 64 Years | 0 (0.0%) | 0 (0.0%) |
| 65 to 74 Years | 0 (0.0%) | 0 (0.0%) |
| 75 Years and over | 9 (7.0%) | 14 (7.8%) |
Disability Class: Cognitive Difficulty
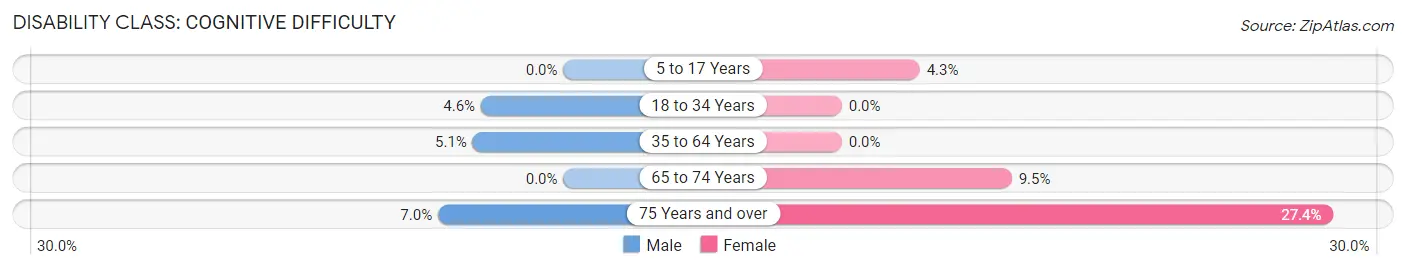
| Age Bracket | Male | Female |
| 5 to 17 Years | 0 (0.0%) | 22 (4.3%) |
| 18 to 34 Years | 9 (4.6%) | 0 (0.0%) |
| 35 to 64 Years | 54 (5.1%) | 0 (0.0%) |
| 65 to 74 Years | 0 (0.0%) | 37 (9.5%) |
| 75 Years and over | 9 (7.0%) | 49 (27.4%) |
Disability Class: Ambulatory Difficulty
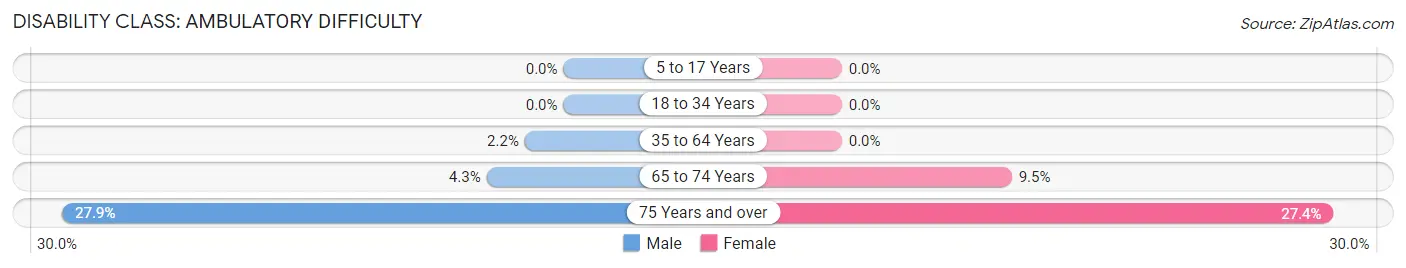
| Age Bracket | Male | Female |
| 5 to 17 Years | 0 (0.0%) | 0 (0.0%) |
| 18 to 34 Years | 0 (0.0%) | 0 (0.0%) |
| 35 to 64 Years | 23 (2.1%) | 0 (0.0%) |
| 65 to 74 Years | 18 (4.3%) | 37 (9.5%) |
| 75 Years and over | 36 (27.9%) | 49 (27.4%) |
Disability Class: Self-Care Difficulty
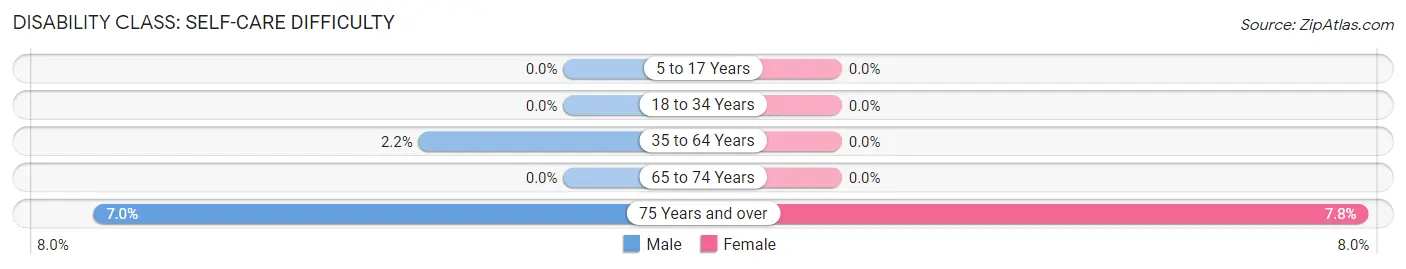
| Age Bracket | Male | Female |
| 5 to 17 Years | 0 (0.0%) | 0 (0.0%) |
| 18 to 34 Years | 0 (0.0%) | 0 (0.0%) |
| 35 to 64 Years | 23 (2.1%) | 0 (0.0%) |
| 65 to 74 Years | 0 (0.0%) | 0 (0.0%) |
| 75 Years and over | 9 (7.0%) | 14 (7.8%) |
Technology Access in South Barrington
Computing Device Access in South Barrington
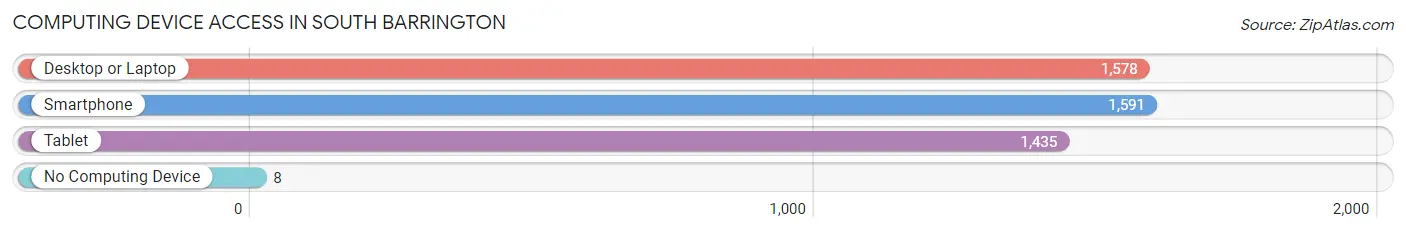
| Device Type | # Households | % Households |
| Desktop or Laptop | 1,578 | 97.8% |
| Smartphone | 1,591 | 98.6% |
| Tablet | 1,435 | 89.0% |
| No Computing Device | 8 | 0.5% |
| Total | 1,613 | 100.0% |
Internet Access in South Barrington
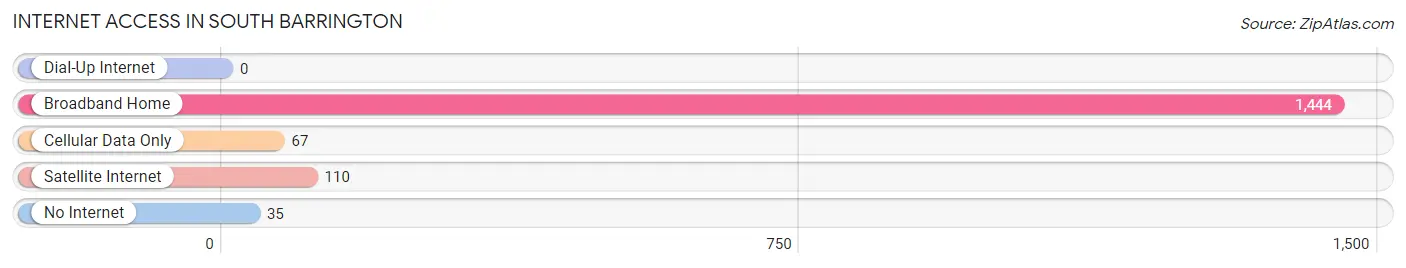
| Internet Type | # Households | % Households |
| Dial-Up Internet | 0 | 0.0% |
| Broadband Home | 1,444 | 89.5% |
| Cellular Data Only | 67 | 4.2% |
| Satellite Internet | 110 | 6.8% |
| No Internet | 35 | 2.2% |
| Total | 1,613 | 100.0% |
South Barrington Summary
Barrington, Illinois is a village located in Cook and Lake Counties, approximately 40 miles northwest of Chicago. It is part of the Chicago metropolitan area and is part of the Barrington Community Unit School District 220. The village is known for its affluent population and high quality of life.
History
Barrington was first settled in 1834 by settlers from New England. The village was originally known as Miller Grove, after the Miller family who were among the first settlers. The village was renamed Barrington in 1854 after the Barrington family, who had moved to the area from Rhode Island.
The village was incorporated in 1865 and grew steadily throughout the 19th century. The village was known for its dairy farms and was a popular destination for Chicagoans looking to escape the city. The village was also home to several resorts, including the Barrington Hotel, which opened in 1876.
Geography
Barrington is located in Cook and Lake Counties, approximately 40 miles northwest of Chicago. The village is bordered by Lake Zurich to the north, South Barrington to the east, Hoffman Estates to the south, and Inverness to the west. The village covers an area of 8.3 square miles and has a population of 10,327 as of the 2010 census.
The village is located in the Fox River Valley and is surrounded by rolling hills and wooded areas. The village is home to several parks, including the Barrington Park District, which offers a variety of recreational activities.
Economy
Barrington is a wealthy village with a median household income of $118,890 as of the 2010 census. The village is home to several corporate headquarters, including the headquarters of the Wm. Wrigley Jr. Company, which is located in the village. The village is also home to several retail stores, restaurants, and other businesses.
Demographics
As of the 2010 census, Barrington had a population of 10,327. The racial makeup of the village was 90.2% White, 2.2% African American, 0.2% Native American, 5.2% Asian, 0.1% Pacific Islander, 0.7% from other races, and 1.5% from two or more races. Hispanic or Latino of any race were 3.2% of the population.
The median age in Barrington was 44.2 years. About 24.2% of residents were under the age of 18, and 8.2% were 65 years of age or older. The gender makeup of the village was 48.7% male and 51.3% female.
Barrington is a wealthy village with a median household income of $118,890 as of the 2010 census. The per capita income for the village was $63,945. About 2.2% of families and 3.2% of the population were below the poverty line, including 3.2% of those under age 18 and 4.2% of those age 65 or over.
Common Questions
What is Per Capita Income in South Barrington?
Per Capita income in South Barrington is $91,197.
What is the Median Family Income in South Barrington?
Median Family Income in South Barrington is $226,815.
What is the Median Household income in South Barrington?
Median Household Income in South Barrington is $226,042.
What is Income or Wage Gap in South Barrington?
Income or Wage Gap in South Barrington is 42.0%.
Women in South Barrington earn 58.0 cents for every dollar earned by a man.
What is Inequality or Gini Index in South Barrington?
Inequality or Gini Index in South Barrington is 0.43.
What is the Total Population of South Barrington?
Total Population of South Barrington is 5,001.
What is the Total Male Population of South Barrington?
Total Male Population of South Barrington is 2,595.
What is the Total Female Population of South Barrington?
Total Female Population of South Barrington is 2,406.
What is the Ratio of Males per 100 Females in South Barrington?
There are 107.86 Males per 100 Females in South Barrington.
What is the Ratio of Females per 100 Males in South Barrington?
There are 92.72 Females per 100 Males in South Barrington.
What is the Median Population Age in South Barrington?
Median Population Age in South Barrington is 48.3 Years.
What is the Average Family Size in South Barrington
Average Family Size in South Barrington is 3.1 People.
What is the Average Household Size in South Barrington
Average Household Size in South Barrington is 3.1 People.
How Large is the Labor Force in South Barrington?
There are 2,334 People in the Labor Forcein in South Barrington.
What is the Percentage of People in the Labor Force in South Barrington?
61.0% of People are in the Labor Force in South Barrington.
What is the Unemployment Rate in South Barrington?
Unemployment Rate in South Barrington is 1.8%.