Palos Heights, IL Map & Demographics
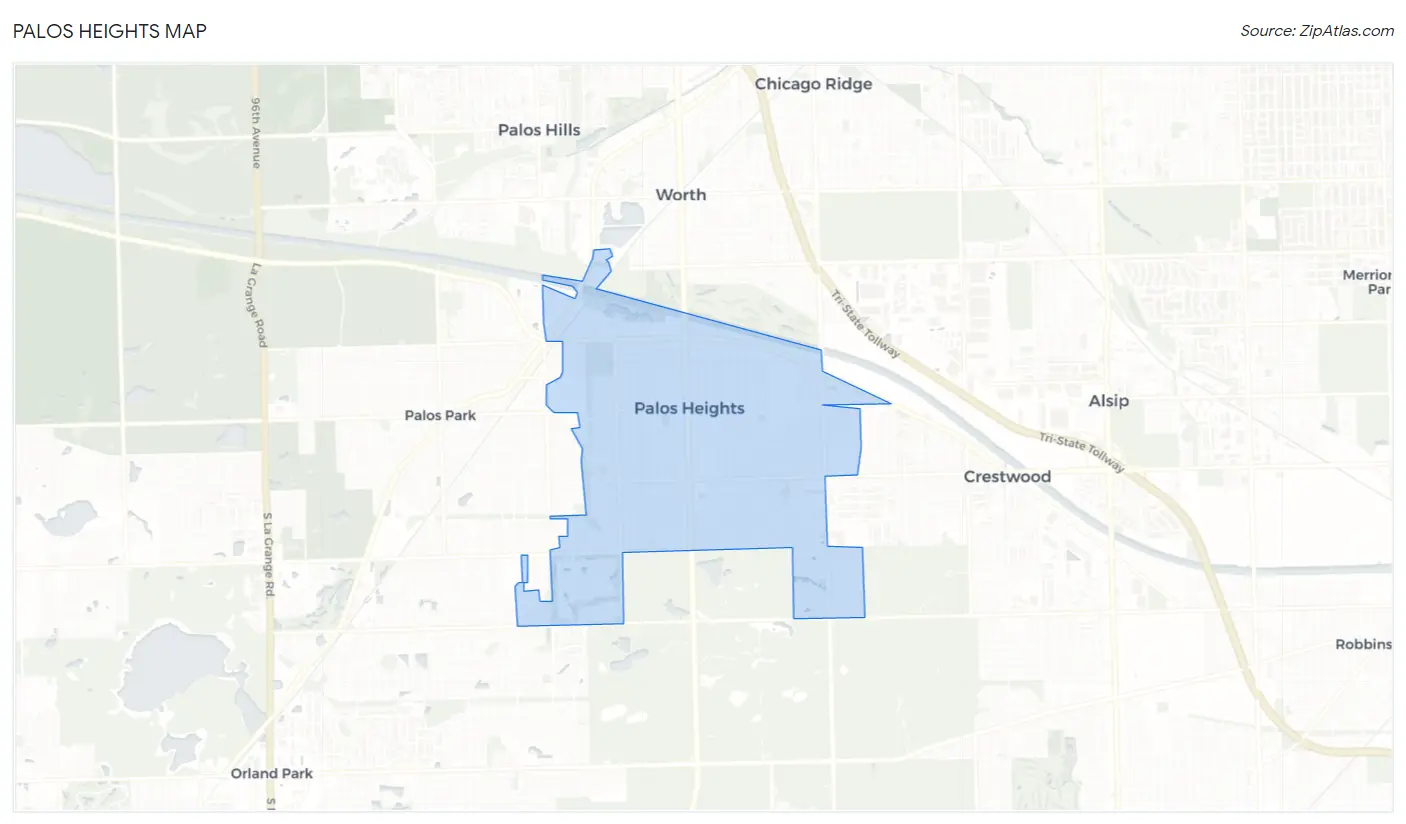
Palos Heights Map
Palos Heights Overview
$53,296
PER CAPITA INCOME
$127,589
AVG FAMILY INCOME
$105,366
AVG HOUSEHOLD INCOME
38.3%
WAGE / INCOME GAP [ % ]
61.7¢/ $1
WAGE / INCOME GAP [ $ ]
$9,195
FAMILY INCOME DEFICIT
0.41
INEQUALITY / GINI INDEX
11,965
TOTAL POPULATION
5,883
MALE POPULATION
6,082
FEMALE POPULATION
96.73
MALES / 100 FEMALES
103.38
FEMALES / 100 MALES
51.5
MEDIAN AGE
3.0
AVG FAMILY SIZE
2.5
AVG HOUSEHOLD SIZE
5,528
LABOR FORCE [ PEOPLE ]
54.5%
PERCENT IN LABOR FORCE
3.6%
UNEMPLOYMENT RATE
Palos Heights Zip Codes
Income in Palos Heights
Income Overview in Palos Heights
Per Capita Income in Palos Heights is $53,296, while median incomes of families and households are $127,589 and $105,366 respectively.
| Characteristic | Number | Measure |
| Per Capita Income | 11,965 | $53,296 |
| Median Family Income | 3,263 | $127,589 |
| Mean Family Income | 3,263 | $153,415 |
| Median Household Income | 4,553 | $105,366 |
| Mean Household Income | 4,553 | $137,024 |
| Income Deficit | 3,263 | $9,195 |
| Wage / Income Gap (%) | 11,965 | 38.34% |
| Wage / Income Gap ($) | 11,965 | 61.66¢ per $1 |
| Gini / Inequality Index | 11,965 | 0.41 |
Earnings by Sex in Palos Heights
Average Earnings in Palos Heights are $60,379, $70,625 for men and $43,548 for women, a difference of 38.3%.
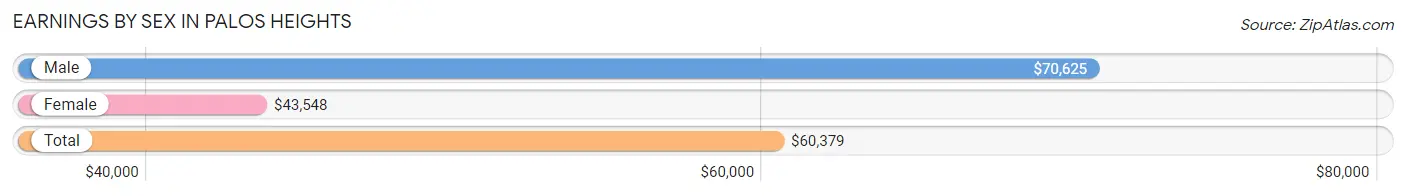
| Sex | Number | Average Earnings |
| Male | 3,129 (53.4%) | $70,625 |
| Female | 2,726 (46.6%) | $43,548 |
| Total | 5,855 (100.0%) | $60,379 |
Earnings by Sex by Income Bracket in Palos Heights
The most common earnings brackets in Palos Heights are $100,000+ for men (1,038 | 33.2%) and $100,000+ for women (480 | 17.6%).
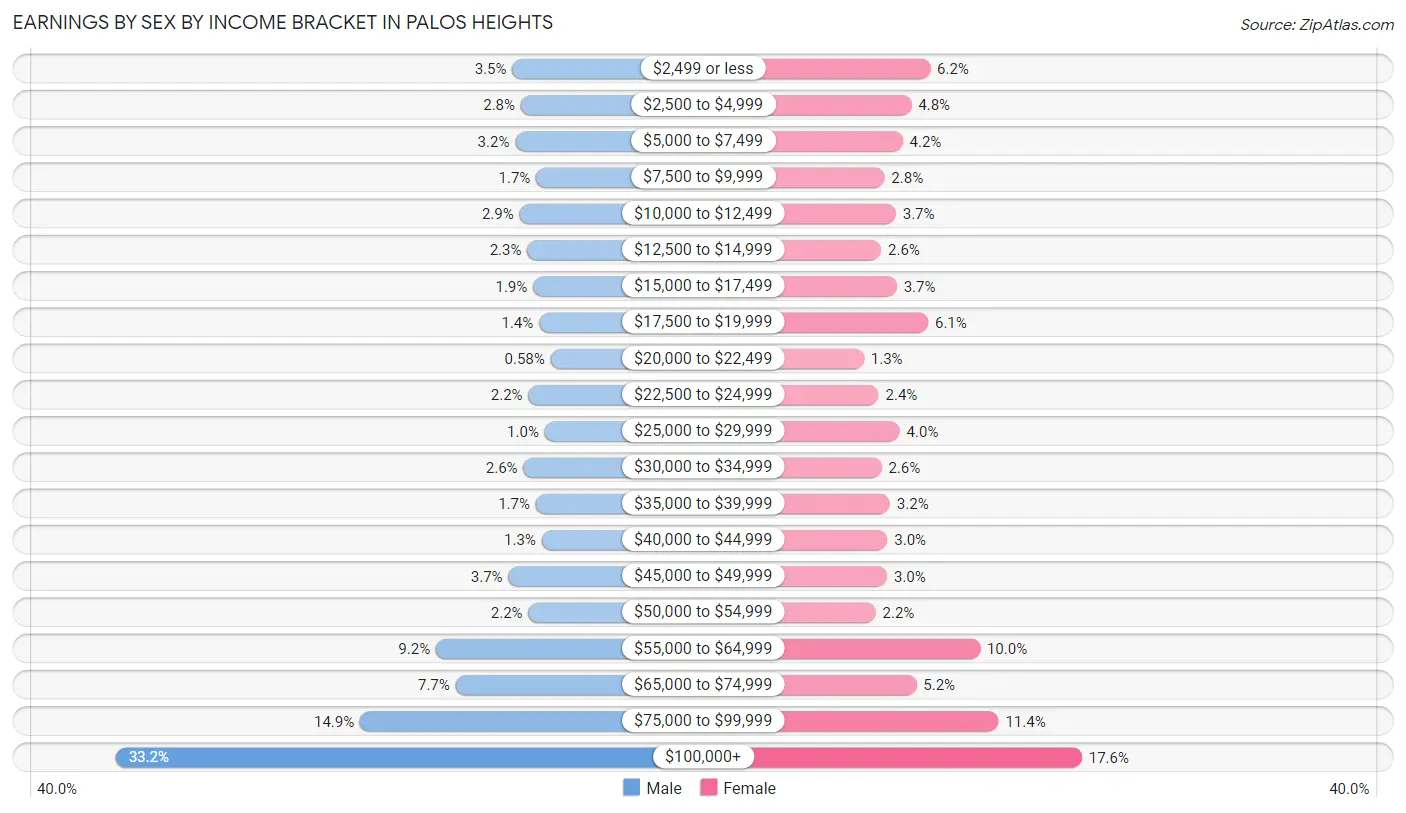
| Income | Male | Female |
| $2,499 or less | 108 (3.5%) | 170 (6.2%) |
| $2,500 to $4,999 | 88 (2.8%) | 132 (4.8%) |
| $5,000 to $7,499 | 101 (3.2%) | 114 (4.2%) |
| $7,500 to $9,999 | 52 (1.7%) | 77 (2.8%) |
| $10,000 to $12,499 | 91 (2.9%) | 100 (3.7%) |
| $12,500 to $14,999 | 73 (2.3%) | 70 (2.6%) |
| $15,000 to $17,499 | 59 (1.9%) | 102 (3.7%) |
| $17,500 to $19,999 | 45 (1.4%) | 166 (6.1%) |
| $20,000 to $22,499 | 18 (0.6%) | 35 (1.3%) |
| $22,500 to $24,999 | 70 (2.2%) | 65 (2.4%) |
| $25,000 to $29,999 | 32 (1.0%) | 108 (4.0%) |
| $30,000 to $34,999 | 82 (2.6%) | 71 (2.6%) |
| $35,000 to $39,999 | 53 (1.7%) | 88 (3.2%) |
| $40,000 to $44,999 | 39 (1.3%) | 83 (3.0%) |
| $45,000 to $49,999 | 117 (3.7%) | 82 (3.0%) |
| $50,000 to $54,999 | 70 (2.2%) | 59 (2.2%) |
| $55,000 to $64,999 | 287 (9.2%) | 272 (10.0%) |
| $65,000 to $74,999 | 241 (7.7%) | 142 (5.2%) |
| $75,000 to $99,999 | 465 (14.9%) | 310 (11.4%) |
| $100,000+ | 1,038 (33.2%) | 480 (17.6%) |
| Total | 3,129 (100.0%) | 2,726 (100.0%) |
Earnings by Sex by Educational Attainment in Palos Heights
Average earnings in Palos Heights are $79,632 for men and $54,484 for women, a difference of 31.6%. Men with an educational attainment of graduate degree enjoy the highest average annual earnings of $103,125, while those with high school diploma education earn the least with $64,226. Women with an educational attainment of graduate degree earn the most with the average annual earnings of $84,030, while those with high school diploma education have the smallest earnings of $26,406.
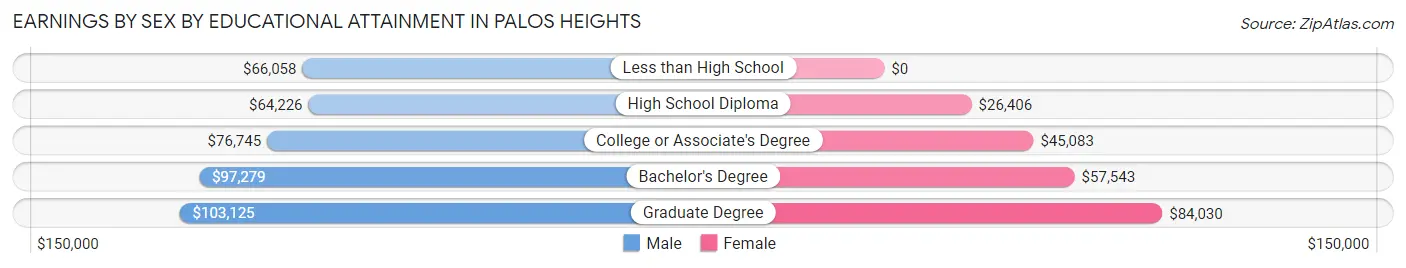
| Educational Attainment | Male Income | Female Income |
| Less than High School | $66,058 | $0 |
| High School Diploma | $64,226 | $26,406 |
| College or Associate's Degree | $76,745 | $45,083 |
| Bachelor's Degree | $97,279 | $57,543 |
| Graduate Degree | $103,125 | $84,030 |
| Total | $79,632 | $54,484 |
Family Income in Palos Heights
Family Income Brackets in Palos Heights
According to the Palos Heights family income data, there are 819 families falling into the $200,000+ income range, which is the most common income bracket and makes up 25.1% of all families. Conversely, the $10,000 to $14,999 income bracket is the least frequent group with only 16 families (0.5%) belonging to this category.
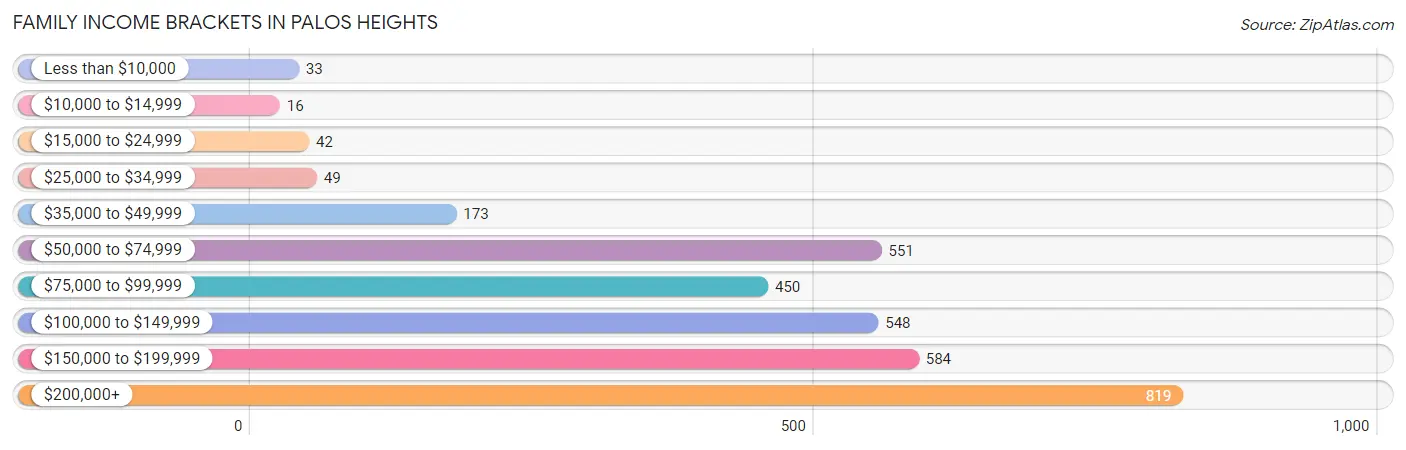
| Income Bracket | # Families | % Families |
| Less than $10,000 | 33 | 1.0% |
| $10,000 to $14,999 | 16 | 0.5% |
| $15,000 to $24,999 | 42 | 1.3% |
| $25,000 to $34,999 | 49 | 1.5% |
| $35,000 to $49,999 | 173 | 5.3% |
| $50,000 to $74,999 | 551 | 16.9% |
| $75,000 to $99,999 | 450 | 13.8% |
| $100,000 to $149,999 | 548 | 16.8% |
| $150,000 to $199,999 | 584 | 17.9% |
| $200,000+ | 819 | 25.1% |
Family Income by Famaliy Size in Palos Heights
6-person families (85 | 2.6%) account for the highest median family income in Palos Heights with $240,208 per family, while 3-person families (667 | 20.4%) have the highest median income of $52,852 per family member.
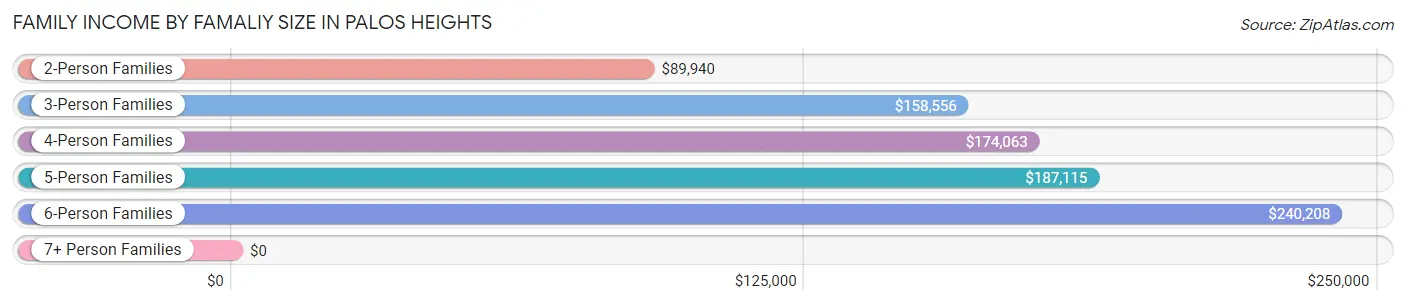
| Income Bracket | # Families | Median Income |
| 2-Person Families | 1,697 (52.0%) | $89,940 |
| 3-Person Families | 667 (20.4%) | $158,556 |
| 4-Person Families | 517 (15.8%) | $174,063 |
| 5-Person Families | 290 (8.9%) | $187,115 |
| 6-Person Families | 85 (2.6%) | $240,208 |
| 7+ Person Families | 7 (0.2%) | $0 |
| Total | 3,263 (100.0%) | $127,589 |
Family Income by Number of Earners in Palos Heights
The median family income in Palos Heights is $127,589, with families comprising 3+ earners (424) having the highest median family income of $183,750, while families with no earners (774) have the lowest median family income of $57,885, accounting for 13.0% and 23.7% of families, respectively.
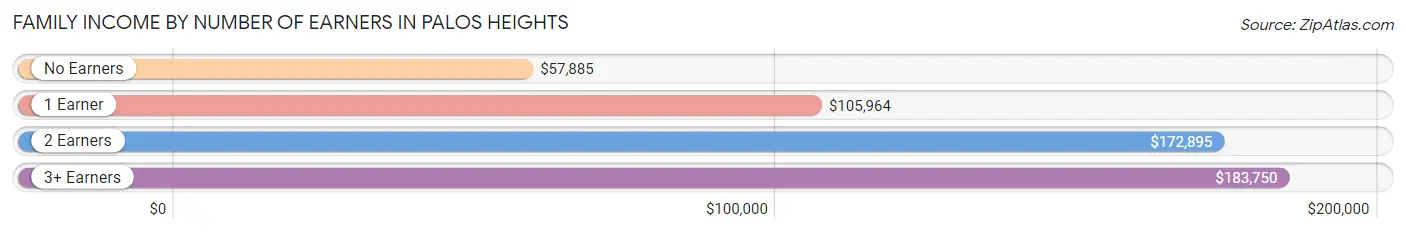
| Number of Earners | # Families | Median Income |
| No Earners | 774 (23.7%) | $57,885 |
| 1 Earner | 791 (24.2%) | $105,964 |
| 2 Earners | 1,274 (39.0%) | $172,895 |
| 3+ Earners | 424 (13.0%) | $183,750 |
| Total | 3,263 (100.0%) | $127,589 |
Household Income in Palos Heights
Household Income Brackets in Palos Heights
With 956 households falling in the category, the $200,000+ income range is the most frequent in Palos Heights, accounting for 21.0% of all households. In contrast, only 68 households (1.5%) fall into the $10,000 to $14,999 income bracket, making it the least populous group.
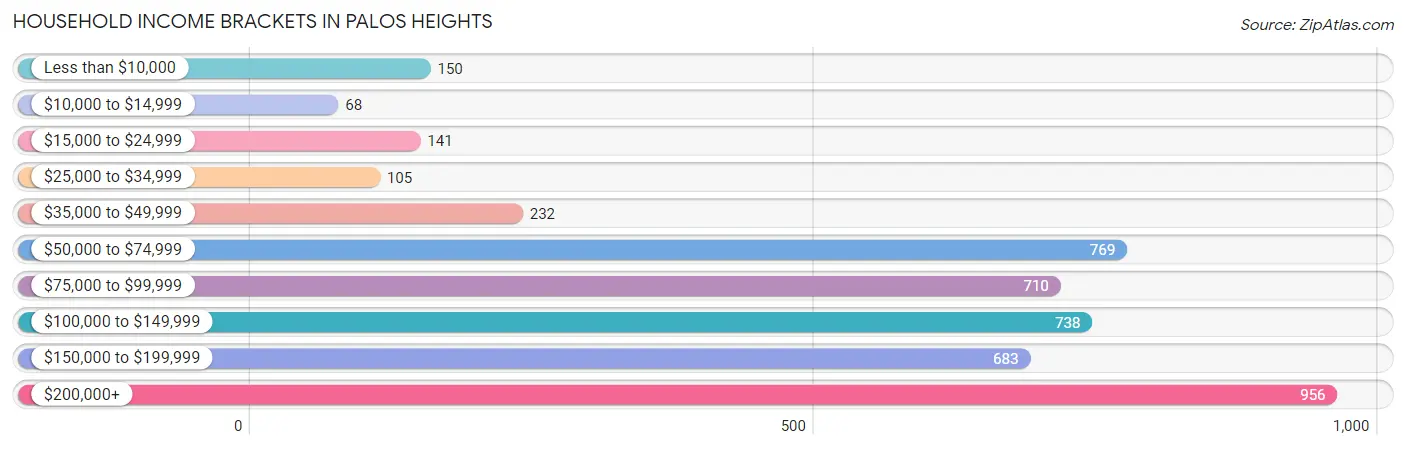
| Income Bracket | # Households | % Households |
| Less than $10,000 | 150 | 3.3% |
| $10,000 to $14,999 | 68 | 1.5% |
| $15,000 to $24,999 | 141 | 3.1% |
| $25,000 to $34,999 | 105 | 2.3% |
| $35,000 to $49,999 | 232 | 5.1% |
| $50,000 to $74,999 | 769 | 16.9% |
| $75,000 to $99,999 | 710 | 15.6% |
| $100,000 to $149,999 | 738 | 16.2% |
| $150,000 to $199,999 | 683 | 15.0% |
| $200,000+ | 956 | 21.0% |
Household Income by Householder Age in Palos Heights
The median household income in Palos Heights is $105,366, with the highest median household income of $153,125 found in the 45 to 64 years age bracket for the primary householder. A total of 1,516 households (33.3%) fall into this category.
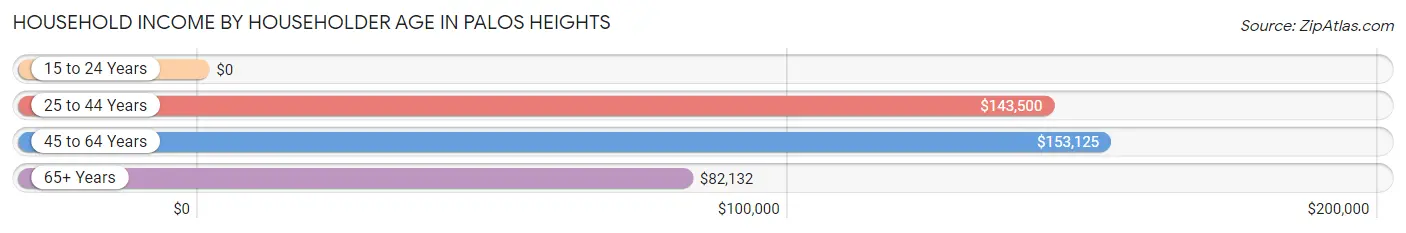
| Income Bracket | # Households | Median Income |
| 15 to 24 Years | 0 (0.0%) | $0 |
| 25 to 44 Years | 912 (20.0%) | $143,500 |
| 45 to 64 Years | 1,516 (33.3%) | $153,125 |
| 65+ Years | 2,125 (46.7%) | $82,132 |
| Total | 4,553 (100.0%) | $105,366 |
Poverty in Palos Heights
Income Below Poverty by Sex and Age in Palos Heights
With 4.0% poverty level for males and 5.7% for females among the residents of Palos Heights, 5 year old males and 75 year old and over females are the most vulnerable to poverty, with 13 males (16.3%) and 94 females (11.9%) in their respective age groups living below the poverty level.
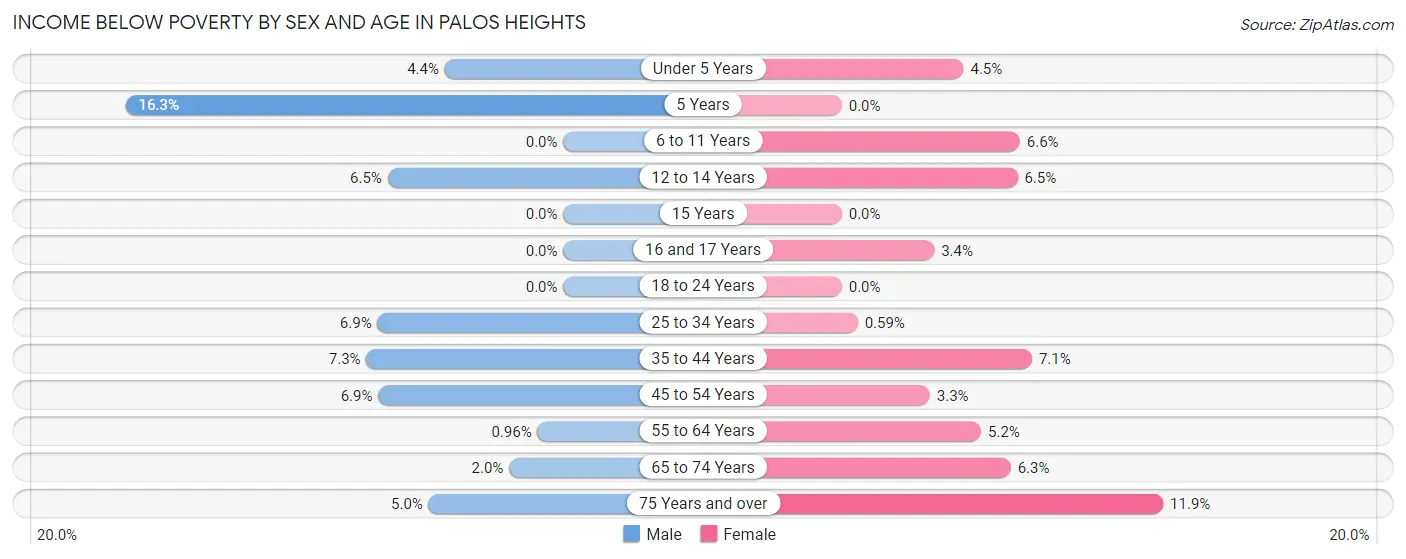
| Age Bracket | Male | Female |
| Under 5 Years | 15 (4.4%) | 10 (4.5%) |
| 5 Years | 13 (16.3%) | 0 (0.0%) |
| 6 to 11 Years | 0 (0.0%) | 22 (6.6%) |
| 12 to 14 Years | 18 (6.5%) | 12 (6.5%) |
| 15 Years | 0 (0.0%) | 0 (0.0%) |
| 16 and 17 Years | 0 (0.0%) | 8 (3.4%) |
| 18 to 24 Years | 0 (0.0%) | 0 (0.0%) |
| 25 to 34 Years | 45 (6.9%) | 3 (0.6%) |
| 35 to 44 Years | 41 (7.3%) | 43 (7.1%) |
| 45 to 54 Years | 36 (6.9%) | 16 (3.3%) |
| 55 to 64 Years | 8 (1.0%) | 51 (5.2%) |
| 65 to 74 Years | 18 (2.0%) | 69 (6.3%) |
| 75 Years and over | 31 (5.0%) | 94 (11.9%) |
| Total | 225 (4.0%) | 328 (5.7%) |
Income Above Poverty by Sex and Age in Palos Heights
According to the poverty statistics in Palos Heights, males aged 6 to 11 years and females aged 5 years are the age groups that are most secure financially, with 100.0% of males and 100.0% of females in these age groups living above the poverty line.
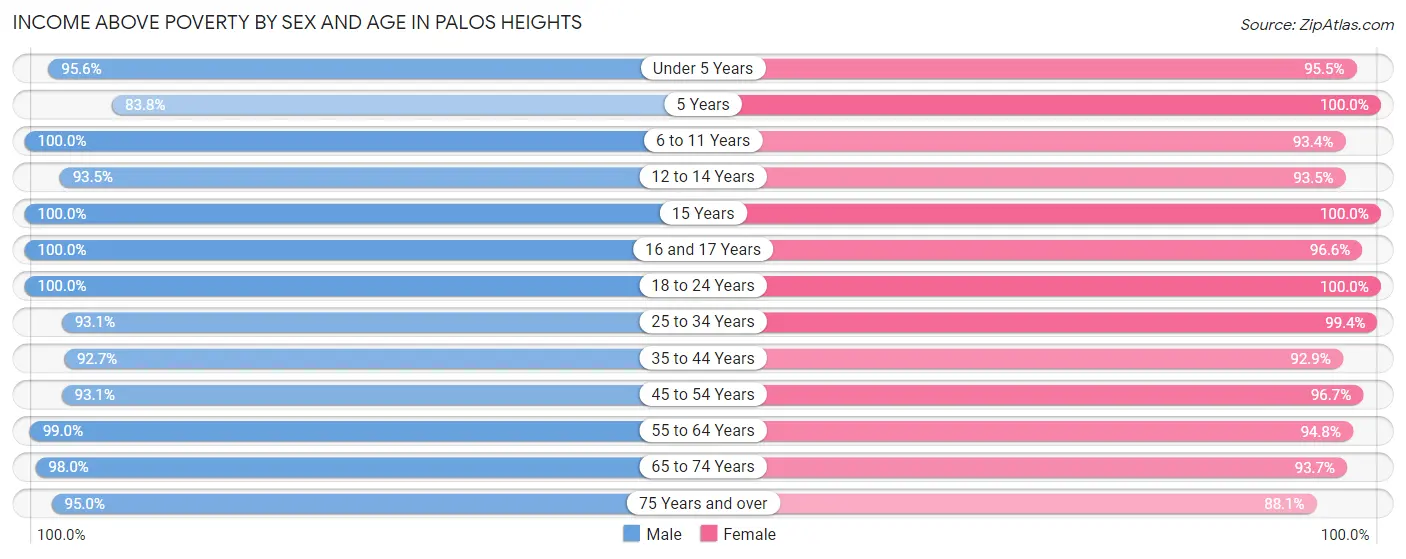
| Age Bracket | Male | Female |
| Under 5 Years | 326 (95.6%) | 211 (95.5%) |
| 5 Years | 67 (83.8%) | 10 (100.0%) |
| 6 to 11 Years | 313 (100.0%) | 311 (93.4%) |
| 12 to 14 Years | 258 (93.5%) | 172 (93.5%) |
| 15 Years | 24 (100.0%) | 30 (100.0%) |
| 16 and 17 Years | 113 (100.0%) | 225 (96.6%) |
| 18 to 24 Years | 335 (100.0%) | 313 (100.0%) |
| 25 to 34 Years | 607 (93.1%) | 508 (99.4%) |
| 35 to 44 Years | 520 (92.7%) | 566 (92.9%) |
| 45 to 54 Years | 488 (93.1%) | 474 (96.7%) |
| 55 to 64 Years | 827 (99.0%) | 936 (94.8%) |
| 65 to 74 Years | 879 (98.0%) | 1,031 (93.7%) |
| 75 Years and over | 589 (95.0%) | 694 (88.1%) |
| Total | 5,346 (96.0%) | 5,481 (94.4%) |
Income Below Poverty Among Married-Couple Families in Palos Heights
The poverty statistics for married-couple families in Palos Heights show that 2.1% or 57 of the total 2,699 families live below the poverty line. Families with 3 or 4 children have the highest poverty rate of 8.3%, comprising of 21 families. On the other hand, families with 1 or 2 children have the lowest poverty rate of 0.0%, which includes 0 families.
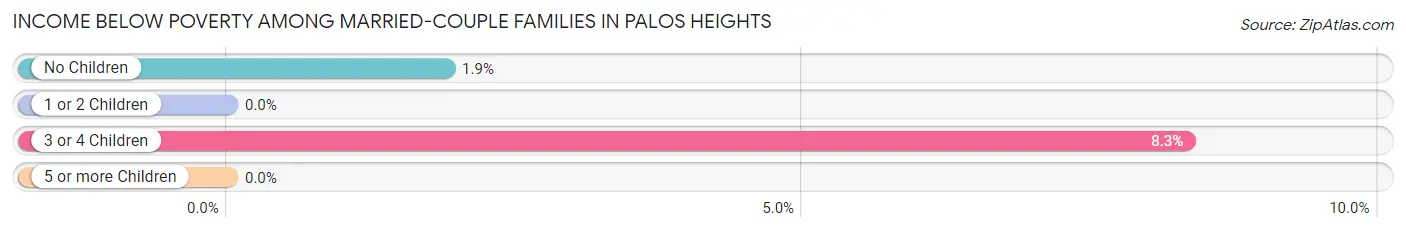
| Children | Above Poverty | Below Poverty |
| No Children | 1,864 (98.1%) | 36 (1.9%) |
| 1 or 2 Children | 547 (100.0%) | 0 (0.0%) |
| 3 or 4 Children | 231 (91.7%) | 21 (8.3%) |
| 5 or more Children | 0 (0.0%) | 0 (0.0%) |
| Total | 2,642 (97.9%) | 57 (2.1%) |
Income Below Poverty Among Single-Parent Households in Palos Heights
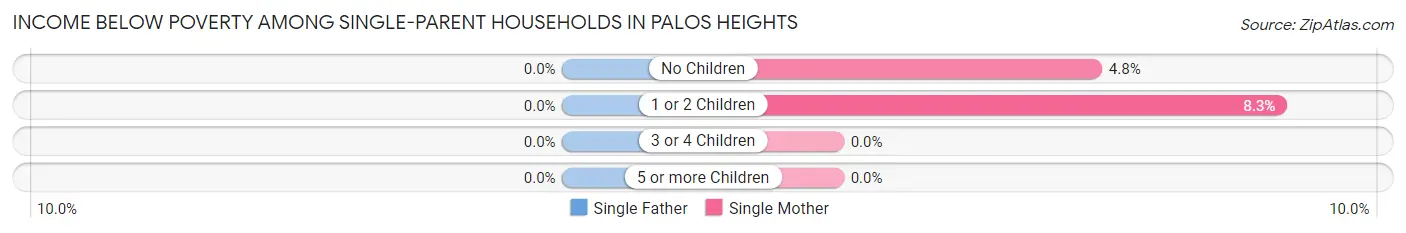
| Children | Single Father | Single Mother |
| No Children | 0 (0.0%) | 15 (4.8%) |
| 1 or 2 Children | 0 (0.0%) | 10 (8.3%) |
| 3 or 4 Children | 0 (0.0%) | 0 (0.0%) |
| 5 or more Children | 0 (0.0%) | 0 (0.0%) |
| Total | 0 (0.0%) | 25 (5.6%) |
Income Below Poverty Among Married-Couple vs Single-Parent Households in Palos Heights
The poverty data for Palos Heights shows that 57 of the married-couple family households (2.1%) and 25 of the single-parent households (4.4%) are living below the poverty level. Within the married-couple family households, those with 3 or 4 children have the highest poverty rate, with 21 households (8.3%) falling below the poverty line. Among the single-parent households, those with 1 or 2 children have the highest poverty rate, with 10 household (6.3%) living below poverty.
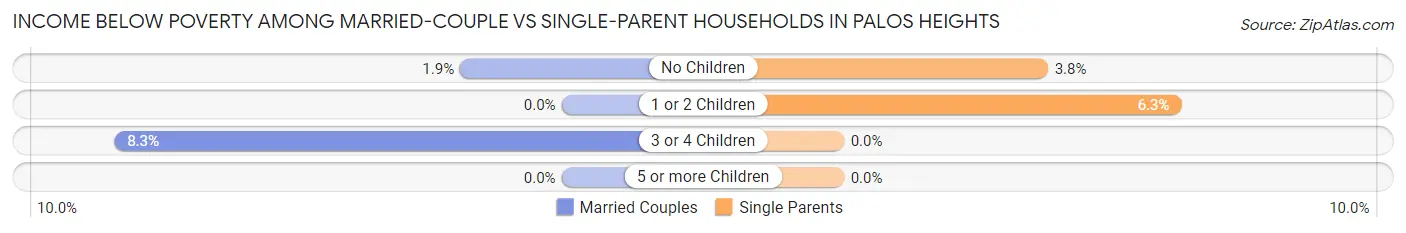
| Children | Married-Couple Families | Single-Parent Households |
| No Children | 36 (1.9%) | 15 (3.8%) |
| 1 or 2 Children | 0 (0.0%) | 10 (6.3%) |
| 3 or 4 Children | 21 (8.3%) | 0 (0.0%) |
| 5 or more Children | 0 (0.0%) | 0 (0.0%) |
| Total | 57 (2.1%) | 25 (4.4%) |
Race in Palos Heights
The most populous races in Palos Heights are White / Caucasian (10,719 | 89.6%), Hispanic or Latino (1,059 | 8.8%), and Two or more Races (634 | 5.3%).
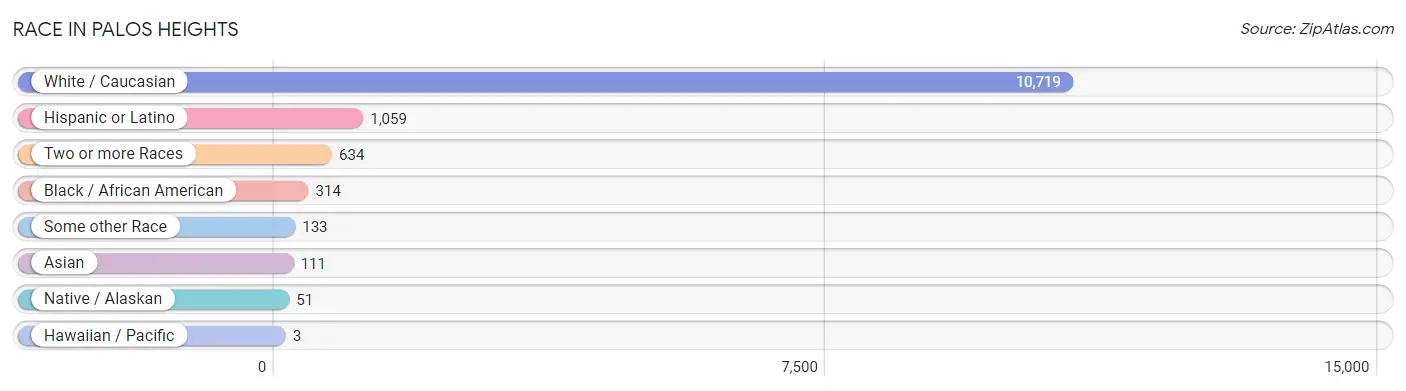
| Race | # Population | % Population |
| Asian | 111 | 0.9% |
| Black / African American | 314 | 2.6% |
| Hawaiian / Pacific | 3 | 0.0% |
| Hispanic or Latino | 1,059 | 8.8% |
| Native / Alaskan | 51 | 0.4% |
| White / Caucasian | 10,719 | 89.6% |
| Two or more Races | 634 | 5.3% |
| Some other Race | 133 | 1.1% |
| Total | 11,965 | 100.0% |
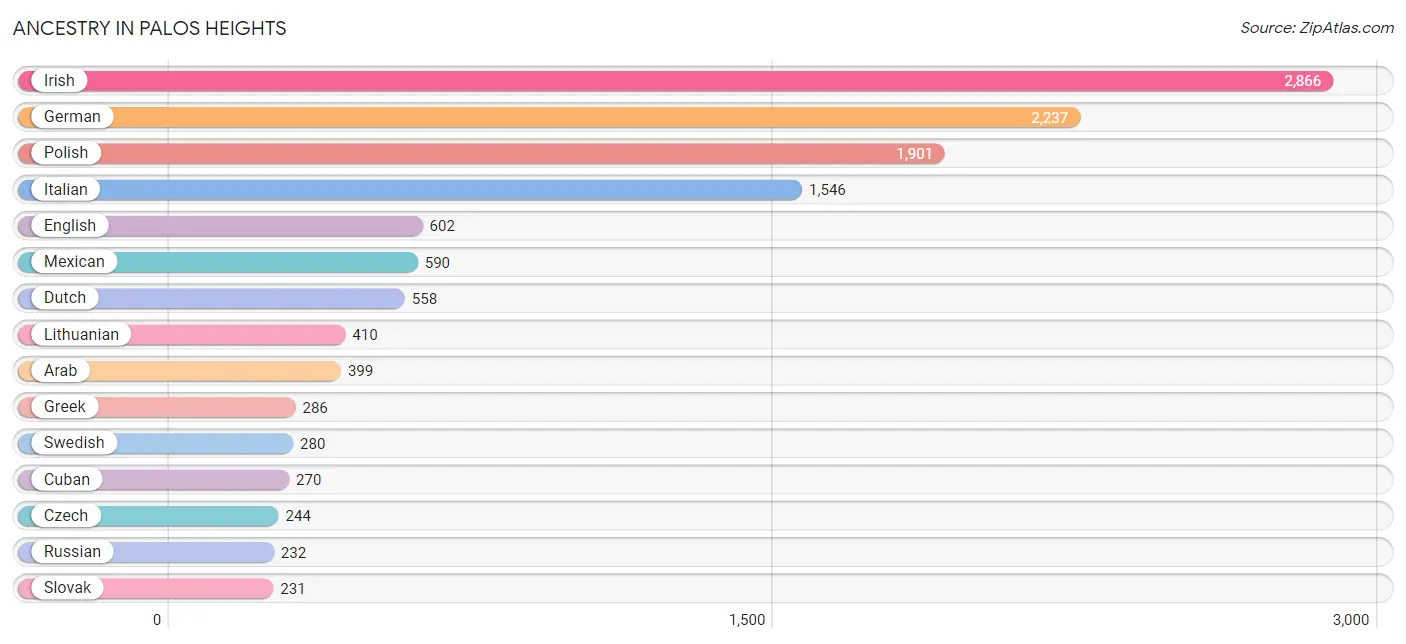
Ancestry in Palos Heights
The most populous ancestries reported in Palos Heights are Irish (2,866 | 23.9%), German (2,237 | 18.7%), Polish (1,901 | 15.9%), Italian (1,546 | 12.9%), and English (602 | 5.0%), together accounting for 76.5% of all Palos Heights residents.
| Ancestry | # Population | % Population |
| African | 5 | 0.0% |
| American | 82 | 0.7% |
| Arab | 399 | 3.3% |
| Austrian | 142 | 1.2% |
| Belgian | 18 | 0.2% |
| Bhutanese | 10 | 0.1% |
| British | 21 | 0.2% |
| Canadian | 13 | 0.1% |
| Central American | 40 | 0.3% |
| Central American Indian | 28 | 0.2% |
| Cherokee | 39 | 0.3% |
| Croatian | 87 | 0.7% |
| Cuban | 270 | 2.3% |
| Czech | 244 | 2.0% |
| Czechoslovakian | 23 | 0.2% |
| Danish | 46 | 0.4% |
| Dominican | 3 | 0.0% |
| Dutch | 558 | 4.7% |
| Eastern European | 17 | 0.1% |
| English | 602 | 5.0% |
| Ethiopian | 2 | 0.0% |
| European | 139 | 1.2% |
| Filipino | 21 | 0.2% |
| French | 115 | 1.0% |
| French Canadian | 92 | 0.8% |
| German | 2,237 | 18.7% |
| Greek | 286 | 2.4% |
| Hungarian | 117 | 1.0% |
| Indian (Asian) | 25 | 0.2% |
| Irish | 2,866 | 23.9% |
| Italian | 1,546 | 12.9% |
| Jordanian | 122 | 1.0% |
| Kenyan | 3 | 0.0% |
| Korean | 47 | 0.4% |
| Latvian | 7 | 0.1% |
| Lithuanian | 410 | 3.4% |
| Luxembourger | 11 | 0.1% |
| Mexican | 590 | 4.9% |
| Mexican American Indian | 12 | 0.1% |
| Native Hawaiian | 3 | 0.0% |
| Nicaraguan | 2 | 0.0% |
| Northern European | 6 | 0.1% |
| Norwegian | 93 | 0.8% |
| Pakistani | 17 | 0.1% |
| Palestinian | 107 | 0.9% |
| Polish | 1,901 | 15.9% |
| Puerto Rican | 122 | 1.0% |
| Romanian | 118 | 1.0% |
| Russian | 232 | 1.9% |
| Salvadoran | 38 | 0.3% |
| Scandinavian | 46 | 0.4% |
| Scotch-Irish | 27 | 0.2% |
| Scottish | 67 | 0.6% |
| Serbian | 28 | 0.2% |
| Slavic | 13 | 0.1% |
| Slovak | 231 | 1.9% |
| Slovene | 25 | 0.2% |
| Spaniard | 11 | 0.1% |
| Spanish | 11 | 0.1% |
| Subsaharan African | 10 | 0.1% |
| Swedish | 280 | 2.3% |
| Swiss | 29 | 0.2% |
| Ukrainian | 44 | 0.4% |
| Welsh | 99 | 0.8% | View All 64 Rows |
Immigrants in Palos Heights
The most numerous immigrant groups reported in Palos Heights came from Europe (608 | 5.1%), Eastern Europe (378 | 3.2%), Asia (268 | 2.2%), Western Asia (163 | 1.4%), and Poland (152 | 1.3%), together accounting for 13.1% of all Palos Heights residents.
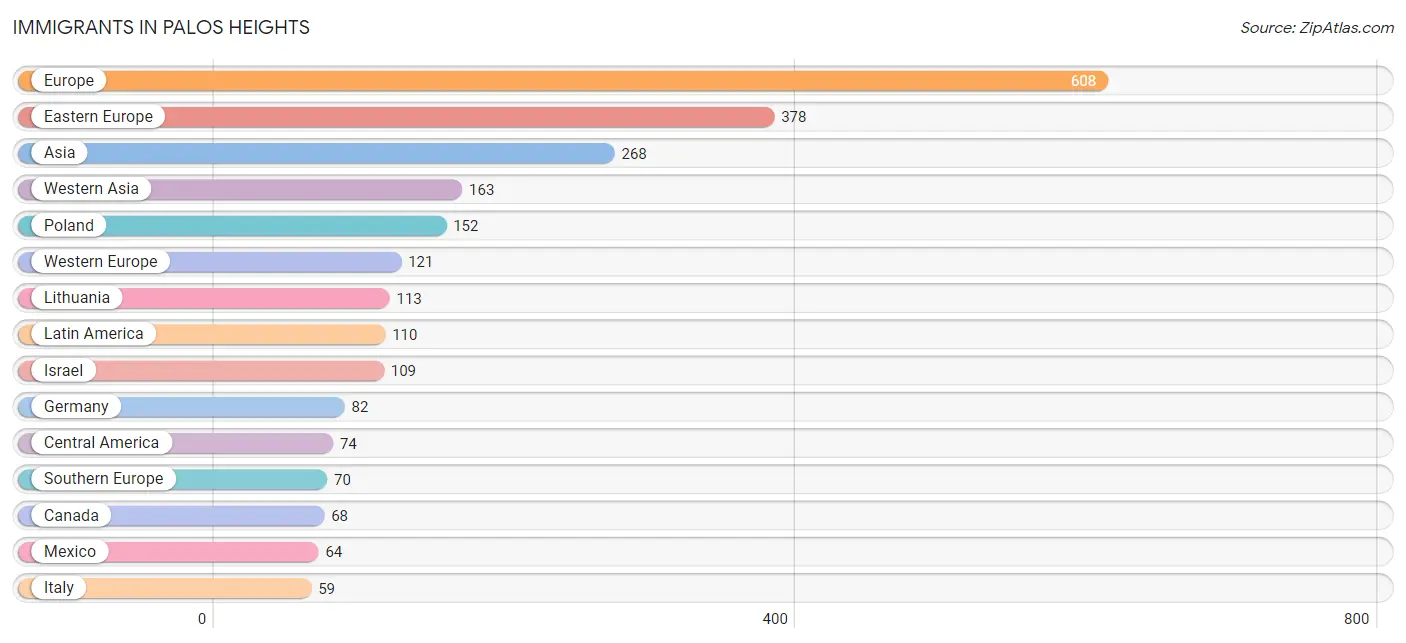
| Immigration Origin | # Population | % Population |
| Africa | 5 | 0.0% |
| Asia | 268 | 2.2% |
| Austria | 39 | 0.3% |
| Belarus | 32 | 0.3% |
| Canada | 68 | 0.6% |
| Caribbean | 36 | 0.3% |
| Central America | 74 | 0.6% |
| China | 37 | 0.3% |
| Cuba | 36 | 0.3% |
| Eastern Africa | 5 | 0.0% |
| Eastern Asia | 52 | 0.4% |
| Eastern Europe | 378 | 3.2% |
| El Salvador | 10 | 0.1% |
| England | 8 | 0.1% |
| Ethiopia | 2 | 0.0% |
| Europe | 608 | 5.1% |
| Germany | 82 | 0.7% |
| India | 9 | 0.1% |
| Ireland | 31 | 0.3% |
| Israel | 109 | 0.9% |
| Italy | 59 | 0.5% |
| Japan | 15 | 0.1% |
| Jordan | 36 | 0.3% |
| Latin America | 110 | 0.9% |
| Lithuania | 113 | 0.9% |
| Mexico | 64 | 0.5% |
| Northern Europe | 39 | 0.3% |
| Philippines | 35 | 0.3% |
| Poland | 152 | 1.3% |
| Romania | 48 | 0.4% |
| Serbia | 21 | 0.2% |
| South Central Asia | 9 | 0.1% |
| South Eastern Asia | 35 | 0.3% |
| Southern Europe | 70 | 0.6% |
| Spain | 11 | 0.1% |
| Syria | 10 | 0.1% |
| Taiwan | 29 | 0.2% |
| Western Asia | 163 | 1.4% |
| Western Europe | 121 | 1.0% |
| Yemen | 8 | 0.1% |
| Zimbabwe | 3 | 0.0% | View All 41 Rows |
Sex and Age in Palos Heights
Sex and Age in Palos Heights
The most populous age groups in Palos Heights are 70 to 74 Years (536 | 9.1%) for men and 65 to 69 Years (629 | 10.3%) for women.
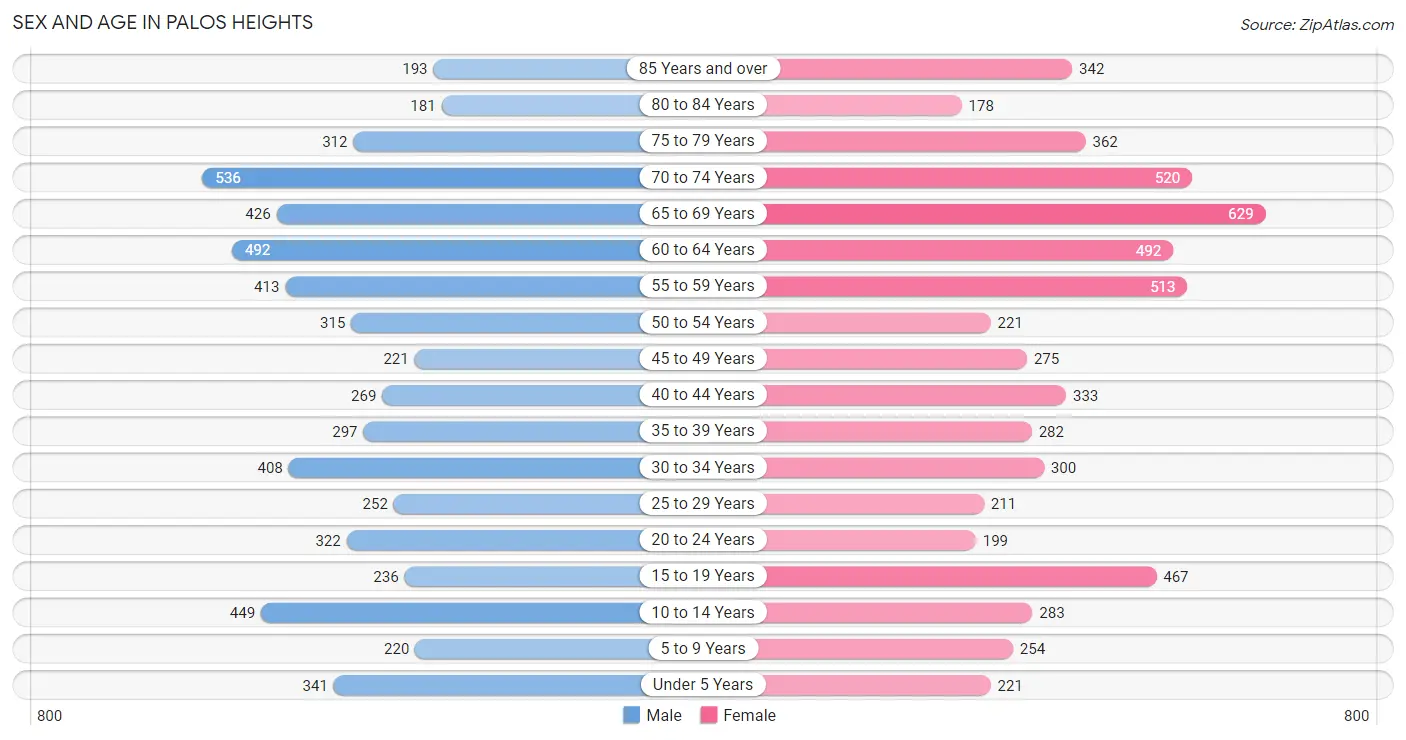
| Age Bracket | Male | Female |
| Under 5 Years | 341 (5.8%) | 221 (3.6%) |
| 5 to 9 Years | 220 (3.7%) | 254 (4.2%) |
| 10 to 14 Years | 449 (7.6%) | 283 (4.6%) |
| 15 to 19 Years | 236 (4.0%) | 467 (7.7%) |
| 20 to 24 Years | 322 (5.5%) | 199 (3.3%) |
| 25 to 29 Years | 252 (4.3%) | 211 (3.5%) |
| 30 to 34 Years | 408 (6.9%) | 300 (4.9%) |
| 35 to 39 Years | 297 (5.1%) | 282 (4.6%) |
| 40 to 44 Years | 269 (4.6%) | 333 (5.5%) |
| 45 to 49 Years | 221 (3.8%) | 275 (4.5%) |
| 50 to 54 Years | 315 (5.3%) | 221 (3.6%) |
| 55 to 59 Years | 413 (7.0%) | 513 (8.4%) |
| 60 to 64 Years | 492 (8.4%) | 492 (8.1%) |
| 65 to 69 Years | 426 (7.2%) | 629 (10.3%) |
| 70 to 74 Years | 536 (9.1%) | 520 (8.6%) |
| 75 to 79 Years | 312 (5.3%) | 362 (5.9%) |
| 80 to 84 Years | 181 (3.1%) | 178 (2.9%) |
| 85 Years and over | 193 (3.3%) | 342 (5.6%) |
| Total | 5,883 (100.0%) | 6,082 (100.0%) |
Families and Households in Palos Heights
Median Family Size in Palos Heights
The median family size in Palos Heights is 2.98 persons per family, with married-couple families (2,699 | 82.7%) accounting for the largest median family size of 3.05 persons per family. On the other hand, single male/father families (121 | 3.7%) represent the smallest median family size with 2.60 persons per family.
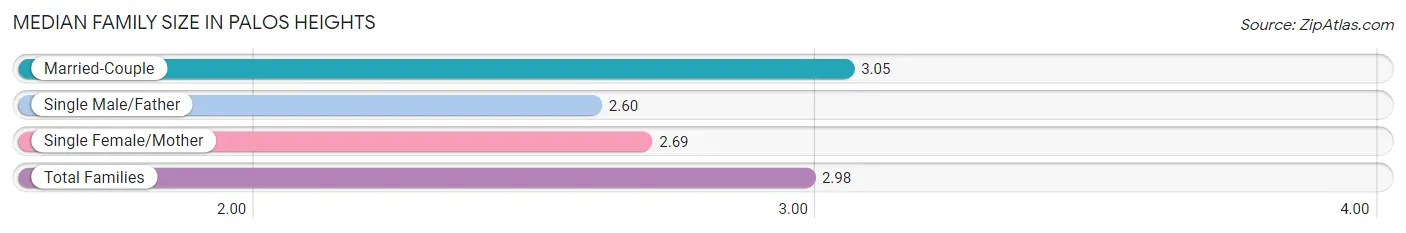
| Family Type | # Families | Family Size |
| Married-Couple | 2,699 (82.7%) | 3.05 |
| Single Male/Father | 121 (3.7%) | 2.60 |
| Single Female/Mother | 443 (13.6%) | 2.69 |
| Total Families | 3,263 (100.0%) | 2.98 |
Median Household Size in Palos Heights
The median household size in Palos Heights is 2.50 persons per household, with married-couple households (2,699 | 59.3%) accounting for the largest median household size of 3.05 persons per household. non-family households (1,290 | 28.3%) represent the smallest median household size with 1.18 persons per household.
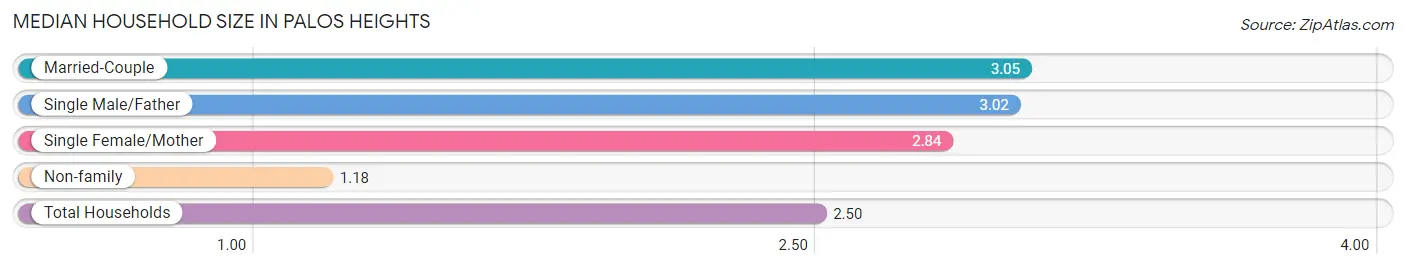
| Household Type | # Households | Household Size |
| Married-Couple | 2,699 (59.3%) | 3.05 |
| Single Male/Father | 121 (2.7%) | 3.02 |
| Single Female/Mother | 443 (9.7%) | 2.84 |
| Non-family | 1,290 (28.3%) | 1.18 |
| Total Households | 4,553 (100.0%) | 2.50 |
Household Size by Marriage Status in Palos Heights
Out of a total of 4,553 households in Palos Heights, 3,263 (71.7%) are family households, while 1,290 (28.3%) are nonfamily households. The most numerous type of family households are 2-person households, comprising 1,659, and the most common type of nonfamily households are 1-person households, comprising 1,093.
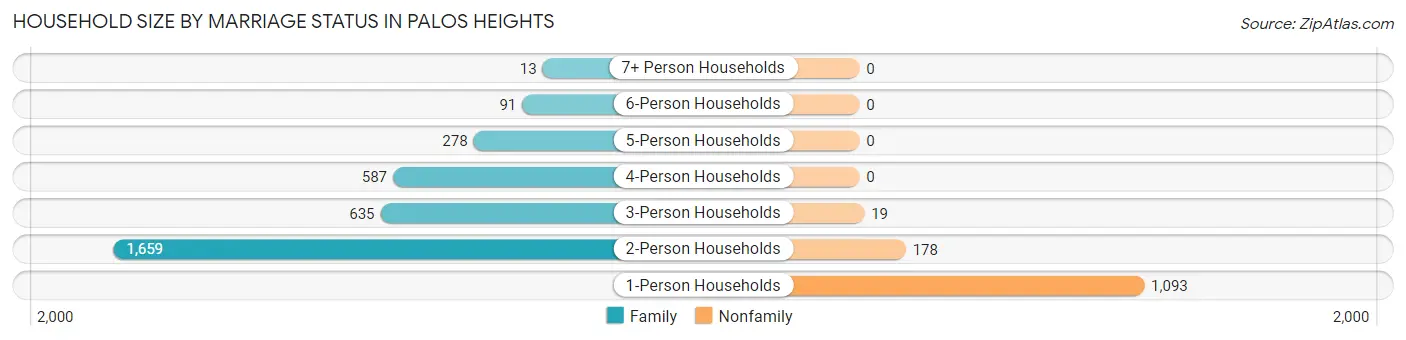
| Household Size | Family Households | Nonfamily Households |
| 1-Person Households | - | 1,093 (24.0%) |
| 2-Person Households | 1,659 (36.4%) | 178 (3.9%) |
| 3-Person Households | 635 (14.0%) | 19 (0.4%) |
| 4-Person Households | 587 (12.9%) | 0 (0.0%) |
| 5-Person Households | 278 (6.1%) | 0 (0.0%) |
| 6-Person Households | 91 (2.0%) | 0 (0.0%) |
| 7+ Person Households | 13 (0.3%) | 0 (0.0%) |
| Total | 3,263 (71.7%) | 1,290 (28.3%) |
Female Fertility in Palos Heights
Fertility by Age in Palos Heights
Average fertility rate in Palos Heights is 69.0 births per 1,000 women. Women in the age bracket of 20 to 34 years have the highest fertility rate with 203.0 births per 1,000 women. Women in the age bracket of 20 to 34 years acount for 100.0% of all women with births.
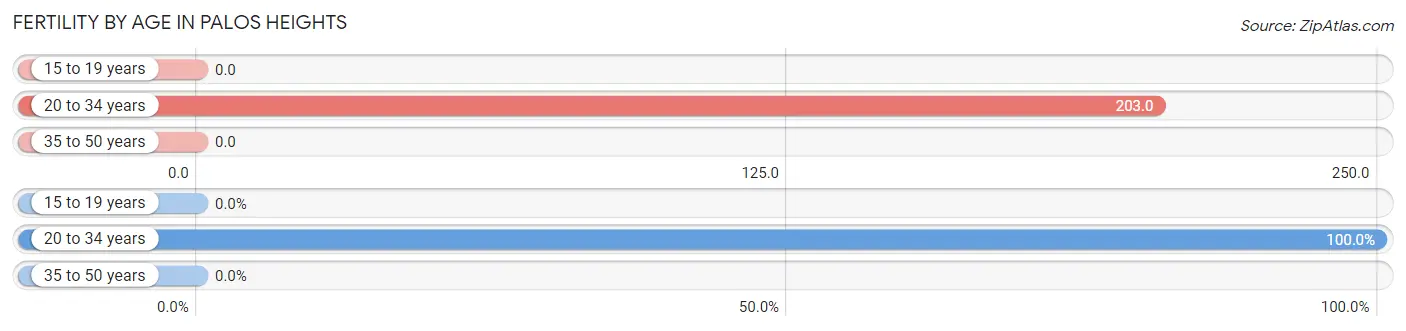
| Age Bracket | Women with Births | Births / 1,000 Women |
| 15 to 19 years | 0 (0.0%) | 0.0 |
| 20 to 34 years | 144 (100.0%) | 203.0 |
| 35 to 50 years | 0 (0.0%) | 0.0 |
| Total | 144 (100.0%) | 69.0 |
Fertility by Age by Marriage Status in Palos Heights
96.5% of women with births (144) in Palos Heights are married. The highest percentage of unmarried women with births falls into 20 to 34 years age bracket with 3.5% of them unmarried at the time of birth, while the lowest percentage of unmarried women with births belong to 20 to 34 years age bracket with 3.5% of them unmarried.
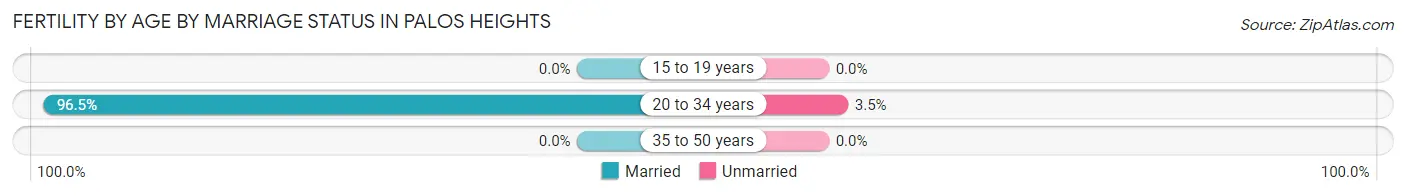
| Age Bracket | Married | Unmarried |
| 15 to 19 years | 0 (0.0%) | 0 (0.0%) |
| 20 to 34 years | 139 (96.5%) | 5 (3.5%) |
| 35 to 50 years | 0 (0.0%) | 0 (0.0%) |
| Total | 139 (96.5%) | 5 (3.5%) |
Fertility by Education in Palos Heights
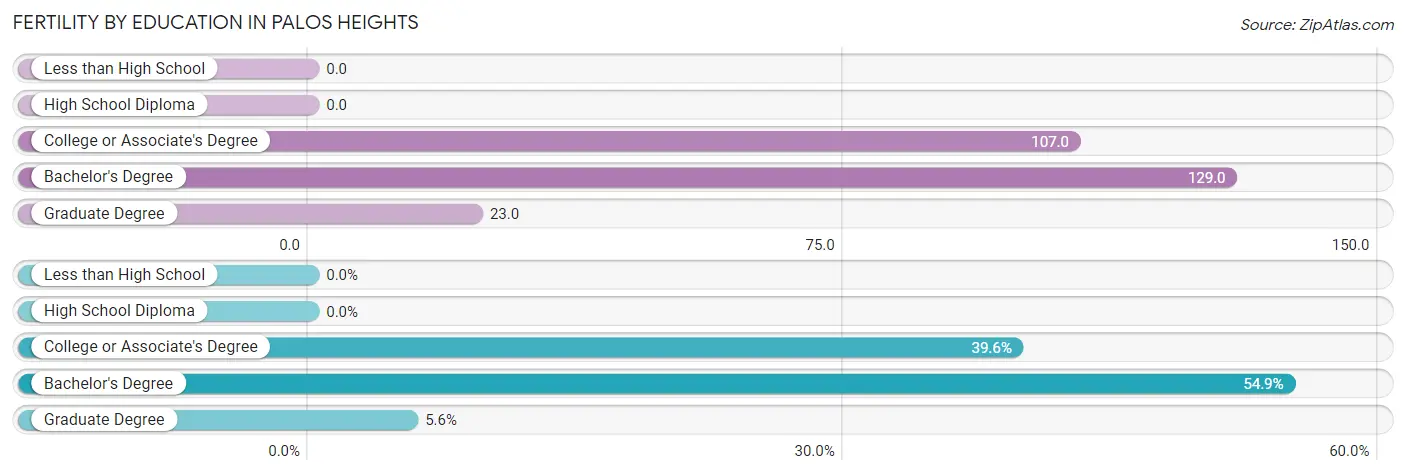
| Educational Attainment | Women with Births | Births / 1,000 Women |
| Less than High School | 0 (0.0%) | 0.0 |
| High School Diploma | 0 (0.0%) | 0.0 |
| College or Associate's Degree | 57 (39.6%) | 107.0 |
| Bachelor's Degree | 79 (54.9%) | 129.0 |
| Graduate Degree | 8 (5.6%) | 23.0 |
| Total | 144 (100.0%) | 69.0 |
Fertility by Education by Marriage Status in Palos Heights
3.5% of women with births in Palos Heights are unmarried. Women with the educational attainment of college or associate's degree are most likely to be married with 100.0% of them married at childbirth, while women with the educational attainment of bachelor's degree are least likely to be married with 6.3% of them unmarried at childbirth.
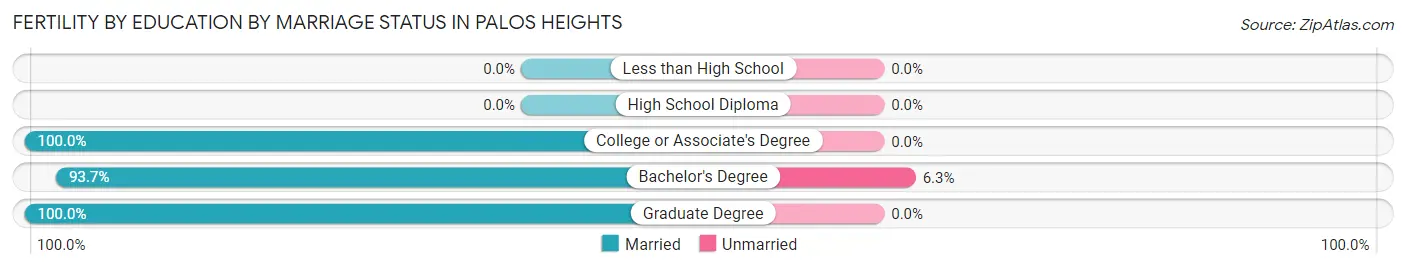
| Educational Attainment | Married | Unmarried |
| Less than High School | 0 (0.0%) | 0 (0.0%) |
| High School Diploma | 0 (0.0%) | 0 (0.0%) |
| College or Associate's Degree | 57 (100.0%) | 0 (0.0%) |
| Bachelor's Degree | 74 (93.7%) | 5 (6.3%) |
| Graduate Degree | 8 (100.0%) | 0 (0.0%) |
| Total | 139 (96.5%) | 5 (3.5%) |
Employment Characteristics in Palos Heights
Employment by Class of Employer in Palos Heights
Among the 5,142 employed individuals in Palos Heights, private company employees (3,714 | 72.2%), not-for-profit organizations (394 | 7.7%), and local government employees (369 | 7.2%) make up the most common classes of employment.
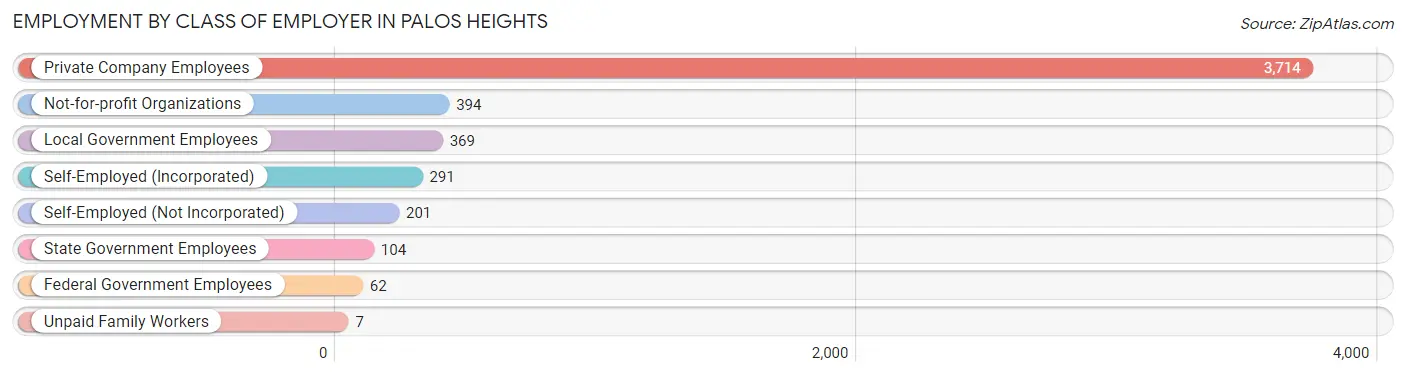
| Employer Class | # Employees | % Employees |
| Private Company Employees | 3,714 | 72.2% |
| Self-Employed (Incorporated) | 291 | 5.7% |
| Self-Employed (Not Incorporated) | 201 | 3.9% |
| Not-for-profit Organizations | 394 | 7.7% |
| Local Government Employees | 369 | 7.2% |
| State Government Employees | 104 | 2.0% |
| Federal Government Employees | 62 | 1.2% |
| Unpaid Family Workers | 7 | 0.1% |
| Total | 5,142 | 100.0% |
Employment Status by Age in Palos Heights
According to the labor force statistics for Palos Heights, out of the total population over 16 years of age (10,143), 54.5% or 5,528 individuals are in the labor force, with 3.6% or 199 of them unemployed. The age group with the highest labor force participation rate is 30 to 34 years, with 92.4% or 654 individuals in the labor force. Within the labor force, the 55 to 59 years age range has the highest percentage of unemployed individuals, with 7.1% or 47 of them being unemployed.
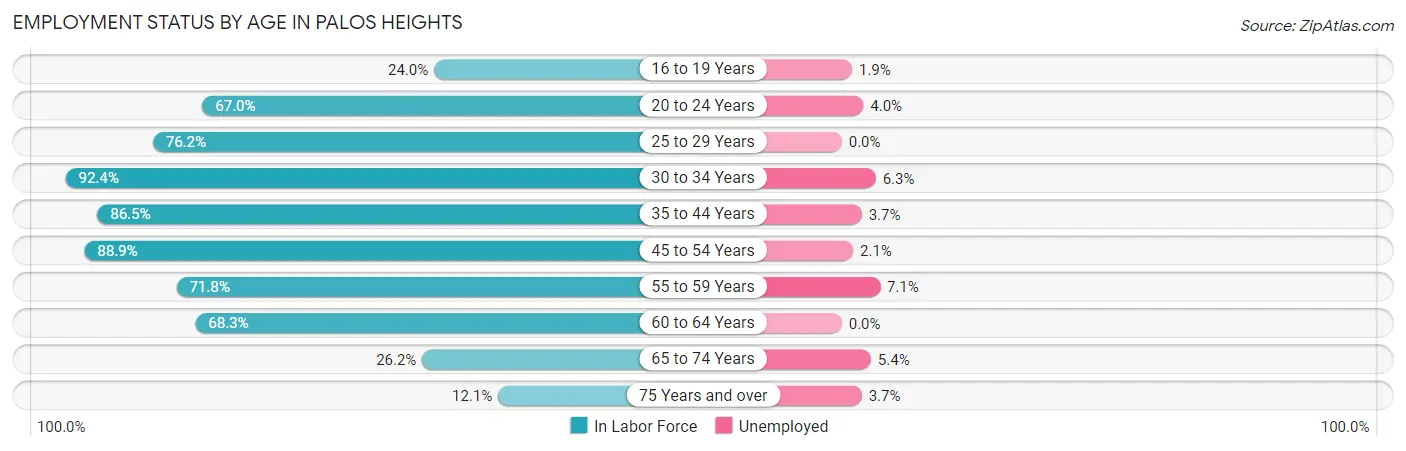
| Age Bracket | In Labor Force | Unemployed |
| 16 to 19 Years | 156 (24.0%) | 3 (1.9%) |
| 20 to 24 Years | 349 (67.0%) | 14 (4.0%) |
| 25 to 29 Years | 353 (76.2%) | 0 (0.0%) |
| 30 to 34 Years | 654 (92.4%) | 41 (6.3%) |
| 35 to 44 Years | 1,022 (86.5%) | 38 (3.7%) |
| 45 to 54 Years | 917 (88.9%) | 19 (2.1%) |
| 55 to 59 Years | 665 (71.8%) | 47 (7.1%) |
| 60 to 64 Years | 672 (68.3%) | 0 (0.0%) |
| 65 to 74 Years | 553 (26.2%) | 30 (5.4%) |
| 75 Years and over | 190 (12.1%) | 7 (3.7%) |
| Total | 5,528 (54.5%) | 199 (3.6%) |
Employment Status by Educational Attainment in Palos Heights
According to labor force statistics for Palos Heights, 80.9% of individuals (4,283) out of the total population between 25 and 64 years of age (5,294) are in the labor force, with 3.4% or 146 of them being unemployed. The group with the highest labor force participation rate are those with the educational attainment of bachelor's degree or higher, with 89.2% or 2,405 individuals in the labor force. Within the labor force, individuals with high school diploma education have the highest percentage of unemployment, with 6.7% or 48 of them being unemployed.
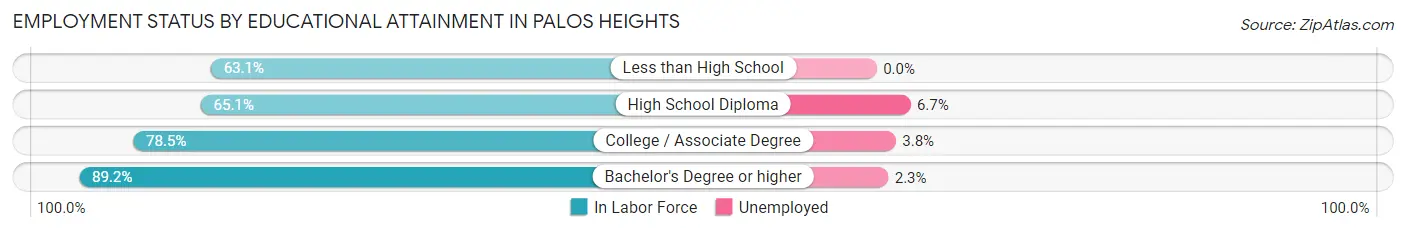
| Educational Attainment | In Labor Force | Unemployed |
| Less than High School | 53 (63.1%) | 0 (0.0%) |
| High School Diploma | 712 (65.1%) | 73 (6.7%) |
| College / Associate Degree | 1,115 (78.5%) | 54 (3.8%) |
| Bachelor's Degree or higher | 2,405 (89.2%) | 62 (2.3%) |
| Total | 4,283 (80.9%) | 180 (3.4%) |
Employment Occupations by Sex in Palos Heights
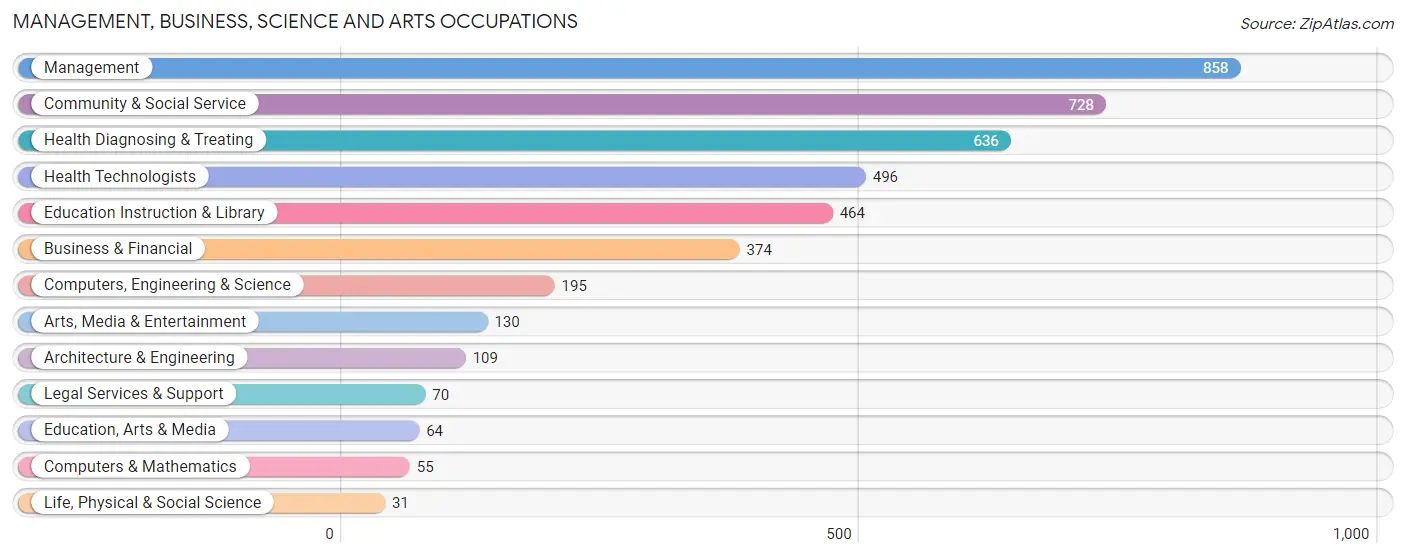
Management, Business, Science and Arts Occupations
The most common Management, Business, Science and Arts occupations in Palos Heights are Management (858 | 16.1%), Community & Social Service (728 | 13.7%), Health Diagnosing & Treating (636 | 11.9%), Health Technologists (496 | 9.3%), and Education Instruction & Library (464 | 8.7%).
Management, Business, Science and Arts Occupations by Sex
Within the Management, Business, Science and Arts occupations in Palos Heights, the most male-oriented occupations are Architecture & Engineering (100.0%), Computers, Engineering & Science (78.5%), and Management (71.9%), while the most female-oriented occupations are Education, Arts & Media (87.5%), Health Diagnosing & Treating (81.8%), and Health Technologists (76.6%).
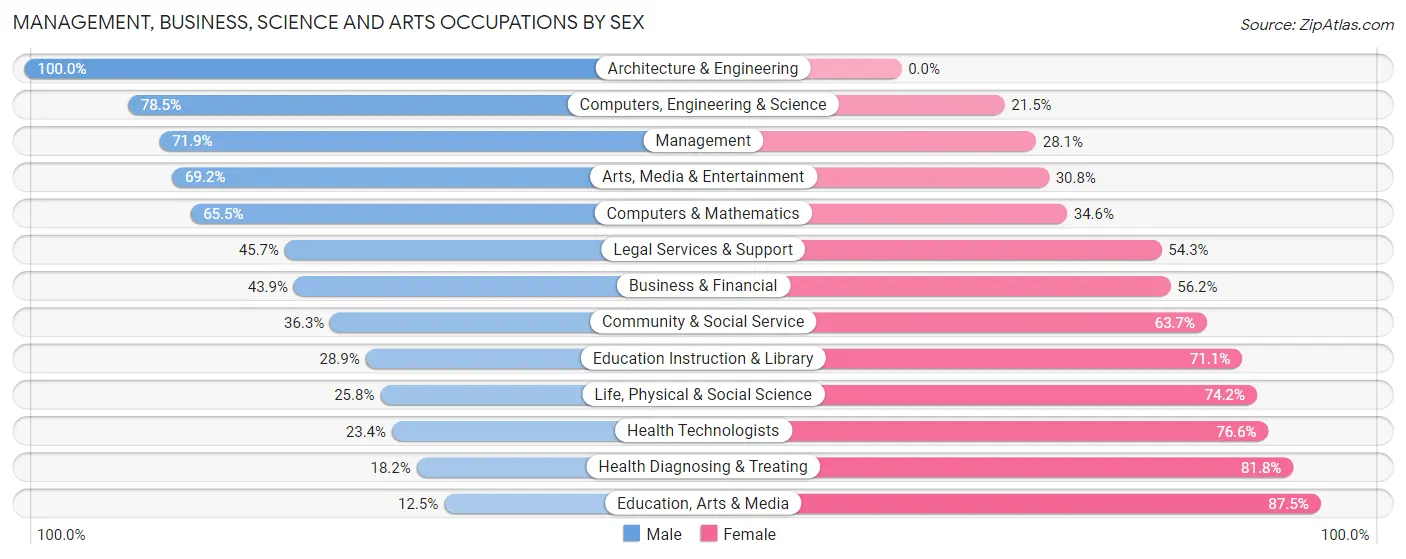
| Occupation | Male | Female |
| Management | 617 (71.9%) | 241 (28.1%) |
| Business & Financial | 164 (43.9%) | 210 (56.1%) |
| Computers, Engineering & Science | 153 (78.5%) | 42 (21.5%) |
| Computers & Mathematics | 36 (65.4%) | 19 (34.5%) |
| Architecture & Engineering | 109 (100.0%) | 0 (0.0%) |
| Life, Physical & Social Science | 8 (25.8%) | 23 (74.2%) |
| Community & Social Service | 264 (36.3%) | 464 (63.7%) |
| Education, Arts & Media | 8 (12.5%) | 56 (87.5%) |
| Legal Services & Support | 32 (45.7%) | 38 (54.3%) |
| Education Instruction & Library | 134 (28.9%) | 330 (71.1%) |
| Arts, Media & Entertainment | 90 (69.2%) | 40 (30.8%) |
| Health Diagnosing & Treating | 116 (18.2%) | 520 (81.8%) |
| Health Technologists | 116 (23.4%) | 380 (76.6%) |
| Total (Category) | 1,314 (47.1%) | 1,477 (52.9%) |
| Total (Overall) | 2,894 (54.3%) | 2,437 (45.7%) |
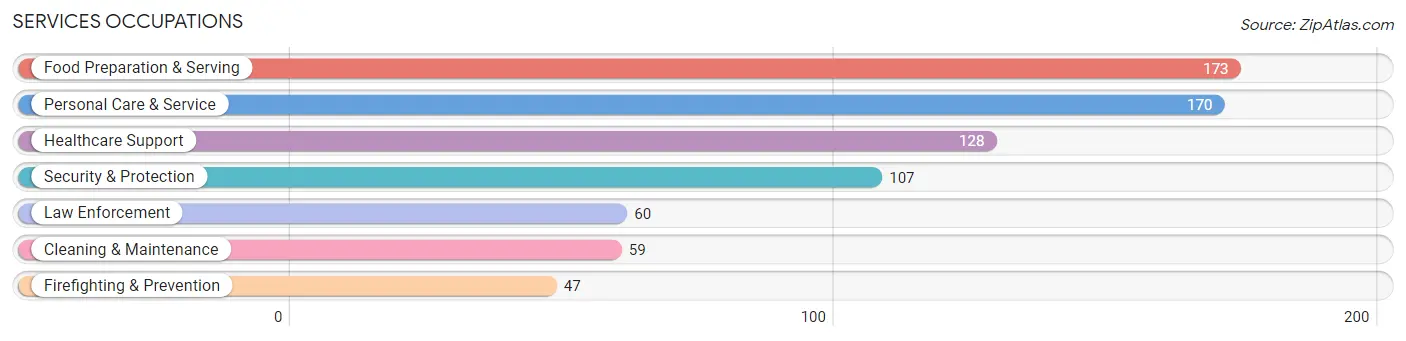
Services Occupations
The most common Services occupations in Palos Heights are Food Preparation & Serving (173 | 3.3%), Personal Care & Service (170 | 3.2%), Healthcare Support (128 | 2.4%), Security & Protection (107 | 2.0%), and Law Enforcement (60 | 1.1%).
Services Occupations by Sex
Within the Services occupations in Palos Heights, the most male-oriented occupations are Law Enforcement (100.0%), Cleaning & Maintenance (88.1%), and Security & Protection (87.8%), while the most female-oriented occupations are Healthcare Support (77.3%), Food Preparation & Serving (59.0%), and Personal Care & Service (50.6%).
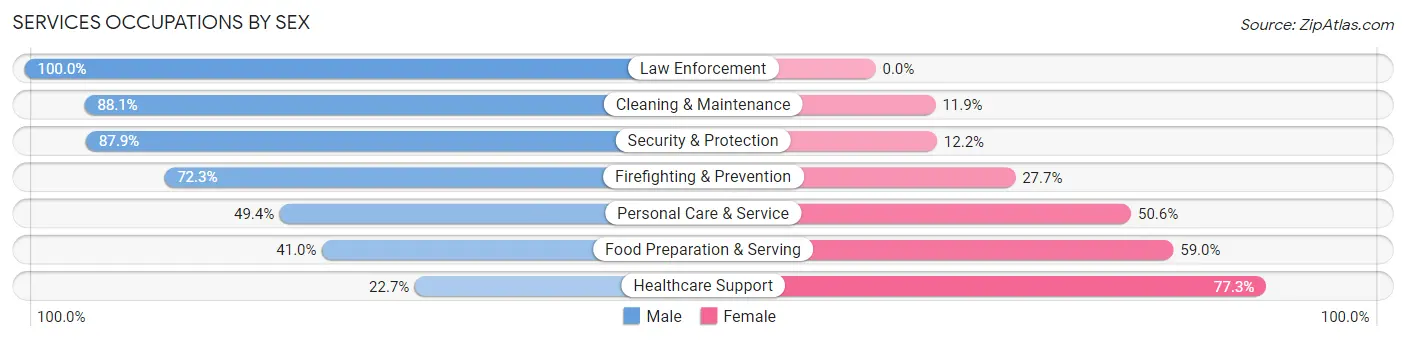
| Occupation | Male | Female |
| Healthcare Support | 29 (22.7%) | 99 (77.3%) |
| Security & Protection | 94 (87.8%) | 13 (12.1%) |
| Firefighting & Prevention | 34 (72.3%) | 13 (27.7%) |
| Law Enforcement | 60 (100.0%) | 0 (0.0%) |
| Food Preparation & Serving | 71 (41.0%) | 102 (59.0%) |
| Cleaning & Maintenance | 52 (88.1%) | 7 (11.9%) |
| Personal Care & Service | 84 (49.4%) | 86 (50.6%) |
| Total (Category) | 330 (51.8%) | 307 (48.2%) |
| Total (Overall) | 2,894 (54.3%) | 2,437 (45.7%) |
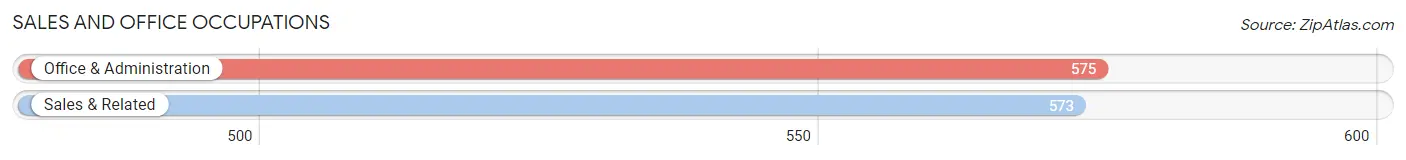
Sales and Office Occupations
The most common Sales and Office occupations in Palos Heights are Office & Administration (575 | 10.8%), and Sales & Related (573 | 10.7%).
Sales and Office Occupations by Sex
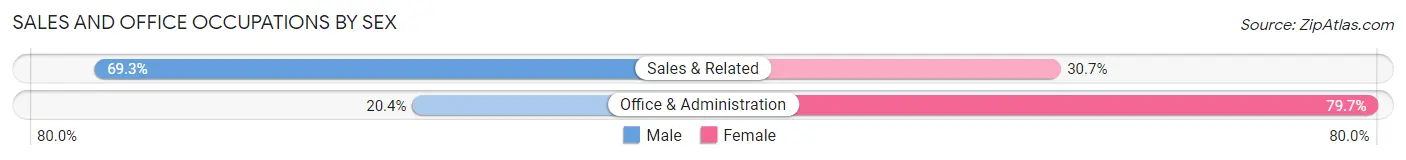
| Occupation | Male | Female |
| Sales & Related | 397 (69.3%) | 176 (30.7%) |
| Office & Administration | 117 (20.3%) | 458 (79.6%) |
| Total (Category) | 514 (44.8%) | 634 (55.2%) |
| Total (Overall) | 2,894 (54.3%) | 2,437 (45.7%) |
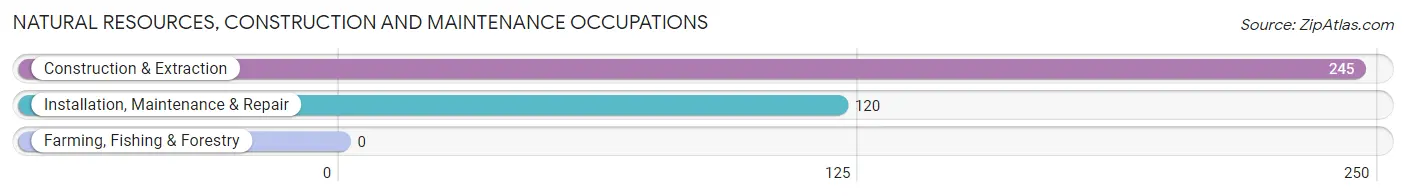
Natural Resources, Construction and Maintenance Occupations
The most common Natural Resources, Construction and Maintenance occupations in Palos Heights are Construction & Extraction (245 | 4.6%), and Installation, Maintenance & Repair (120 | 2.2%).
Natural Resources, Construction and Maintenance Occupations by Sex
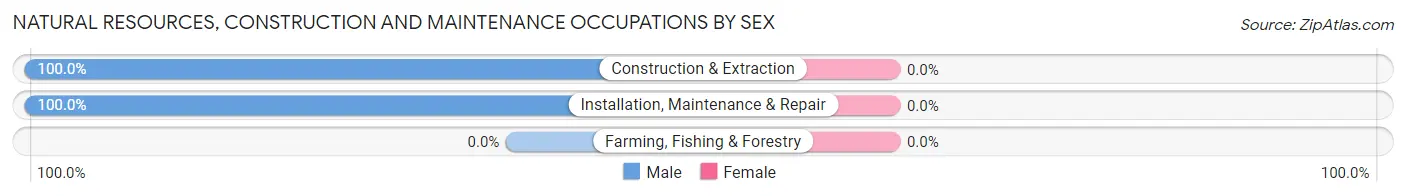
| Occupation | Male | Female |
| Farming, Fishing & Forestry | 0 (0.0%) | 0 (0.0%) |
| Construction & Extraction | 245 (100.0%) | 0 (0.0%) |
| Installation, Maintenance & Repair | 120 (100.0%) | 0 (0.0%) |
| Total (Category) | 365 (100.0%) | 0 (0.0%) |
| Total (Overall) | 2,894 (54.3%) | 2,437 (45.7%) |
Production, Transportation and Moving Occupations
The most common Production, Transportation and Moving occupations in Palos Heights are Transportation (151 | 2.8%), Production (136 | 2.5%), and Material Moving (103 | 1.9%).
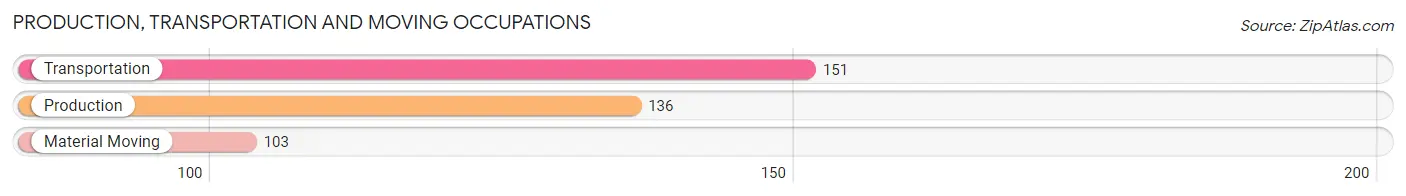
Production, Transportation and Moving Occupations by Sex
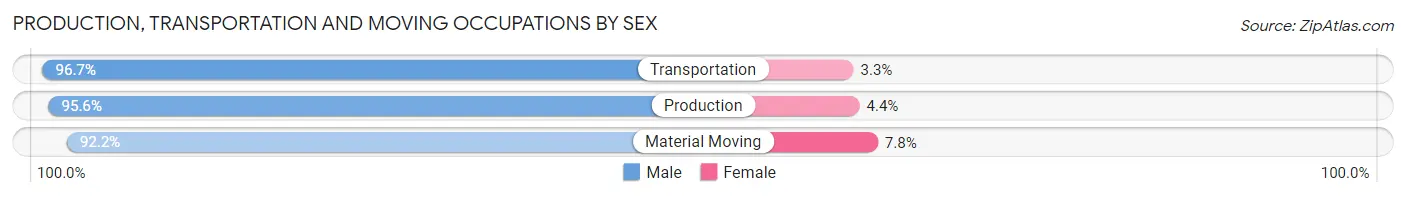
| Occupation | Male | Female |
| Production | 130 (95.6%) | 6 (4.4%) |
| Transportation | 146 (96.7%) | 5 (3.3%) |
| Material Moving | 95 (92.2%) | 8 (7.8%) |
| Total (Category) | 371 (95.1%) | 19 (4.9%) |
| Total (Overall) | 2,894 (54.3%) | 2,437 (45.7%) |
Employment Industries by Sex in Palos Heights
Employment Industries in Palos Heights
The major employment industries in Palos Heights include Health Care & Social Assistance (963 | 18.1%), Educational Services (670 | 12.6%), Manufacturing (492 | 9.2%), Retail Trade (446 | 8.4%), and Professional & Scientific (403 | 7.6%).
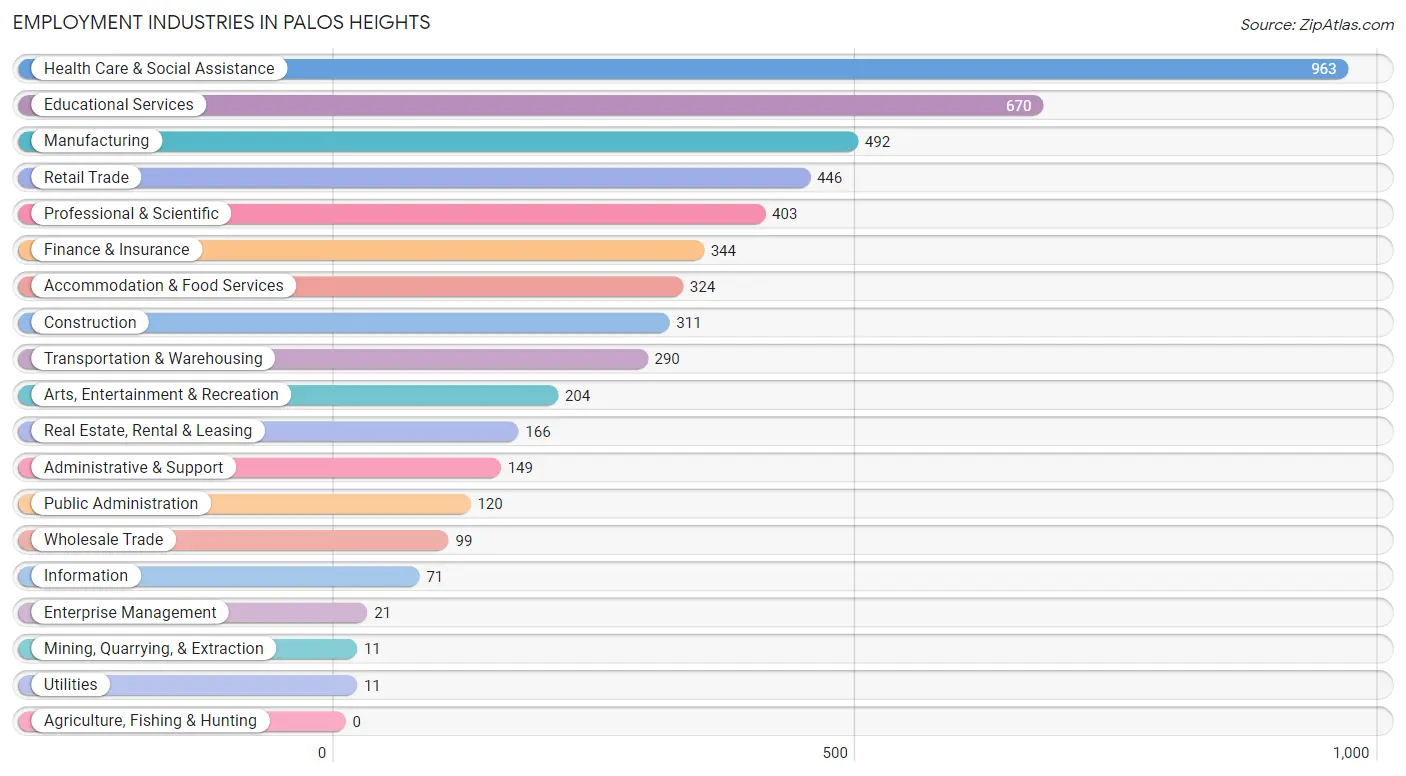
Employment Industries by Sex in Palos Heights
The Palos Heights industries that see more men than women are Mining, Quarrying, & Extraction (100.0%), Wholesale Trade (100.0%), and Utilities (100.0%), whereas the industries that tend to have a higher number of women are Health Care & Social Assistance (77.1%), Educational Services (67.2%), and Administrative & Support (65.1%).
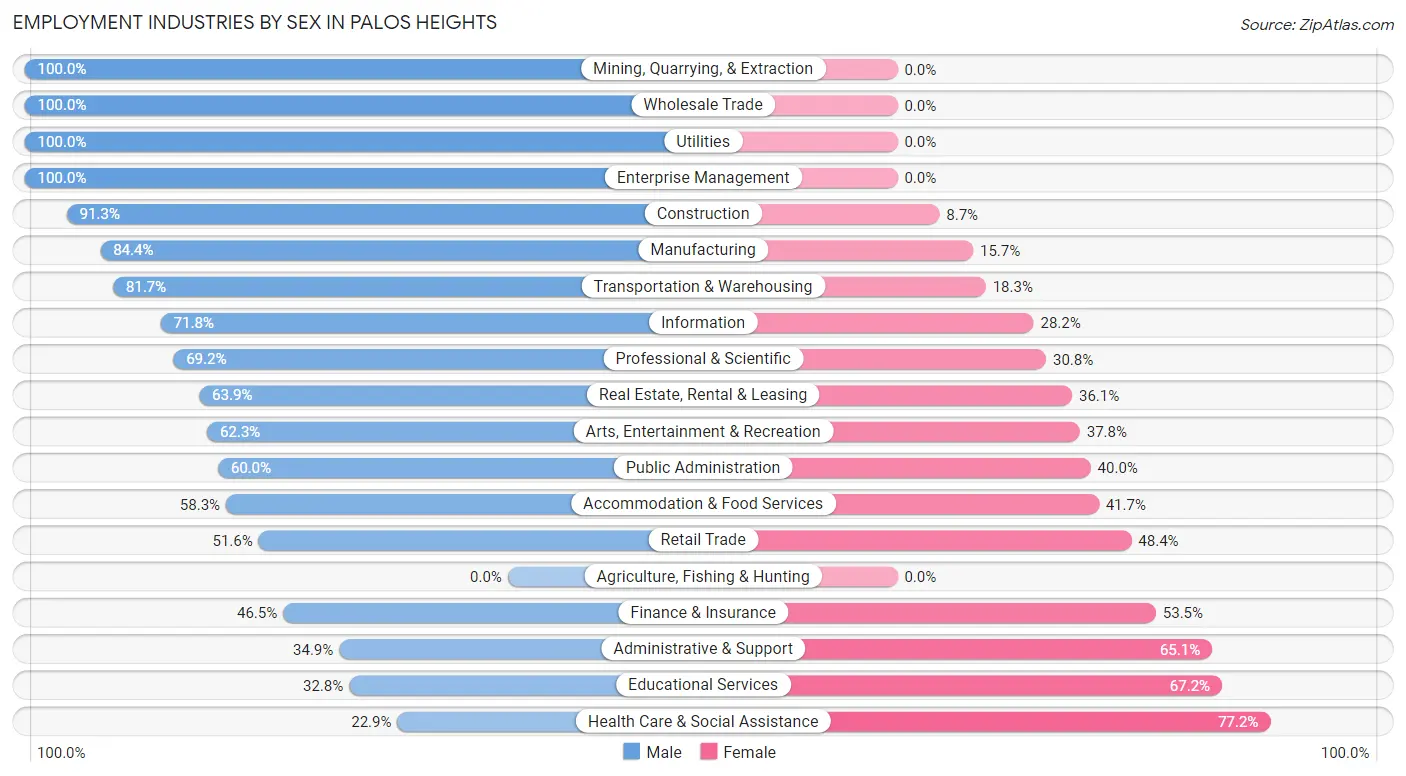
| Industry | Male | Female |
| Agriculture, Fishing & Hunting | 0 (0.0%) | 0 (0.0%) |
| Mining, Quarrying, & Extraction | 11 (100.0%) | 0 (0.0%) |
| Construction | 284 (91.3%) | 27 (8.7%) |
| Manufacturing | 415 (84.4%) | 77 (15.7%) |
| Wholesale Trade | 99 (100.0%) | 0 (0.0%) |
| Retail Trade | 230 (51.6%) | 216 (48.4%) |
| Transportation & Warehousing | 237 (81.7%) | 53 (18.3%) |
| Utilities | 11 (100.0%) | 0 (0.0%) |
| Information | 51 (71.8%) | 20 (28.2%) |
| Finance & Insurance | 160 (46.5%) | 184 (53.5%) |
| Real Estate, Rental & Leasing | 106 (63.9%) | 60 (36.1%) |
| Professional & Scientific | 279 (69.2%) | 124 (30.8%) |
| Enterprise Management | 21 (100.0%) | 0 (0.0%) |
| Administrative & Support | 52 (34.9%) | 97 (65.1%) |
| Educational Services | 220 (32.8%) | 450 (67.2%) |
| Health Care & Social Assistance | 220 (22.9%) | 743 (77.1%) |
| Arts, Entertainment & Recreation | 127 (62.3%) | 77 (37.8%) |
| Accommodation & Food Services | 189 (58.3%) | 135 (41.7%) |
| Public Administration | 72 (60.0%) | 48 (40.0%) |
| Total | 2,894 (54.3%) | 2,437 (45.7%) |
Education in Palos Heights
School Enrollment in Palos Heights
The most common levels of schooling among the 2,490 students in Palos Heights are high school (620 | 24.9%), college / undergraduate (613 | 24.6%), and middle school (481 | 19.3%).
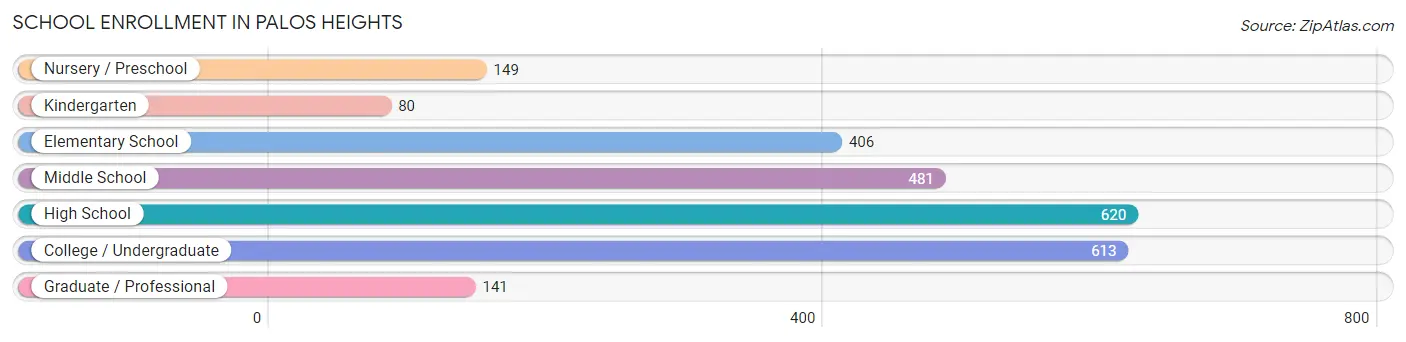
| School Level | # Students | % Students |
| Nursery / Preschool | 149 | 6.0% |
| Kindergarten | 80 | 3.2% |
| Elementary School | 406 | 16.3% |
| Middle School | 481 | 19.3% |
| High School | 620 | 24.9% |
| College / Undergraduate | 613 | 24.6% |
| Graduate / Professional | 141 | 5.7% |
| Total | 2,490 | 100.0% |
School Enrollment by Age by Funding Source in Palos Heights
Out of a total of 2,490 students who are enrolled in schools in Palos Heights, 829 (33.3%) attend a private institution, while the remaining 1,661 (66.7%) are enrolled in public schools. The age group of 35 years and over has the highest likelihood of being enrolled in private schools, with 60 (82.2% in the age bracket) enrolled. Conversely, the age group of 10 to 14 year olds has the lowest likelihood of being enrolled in a private school, with 551 (78.5% in the age bracket) attending a public institution.
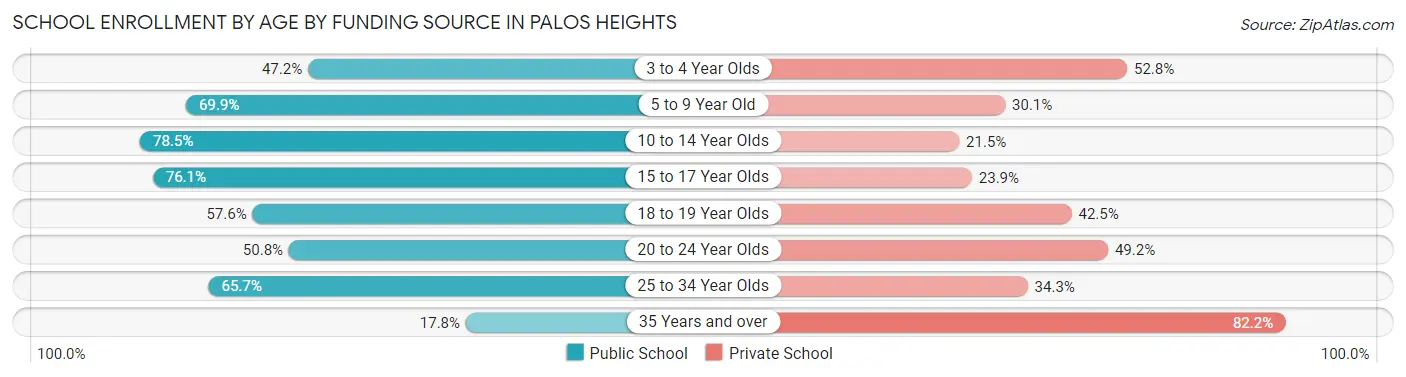
| Age Bracket | Public School | Private School |
| 3 to 4 Year Olds | 51 (47.2%) | 57 (52.8%) |
| 5 to 9 Year Old | 321 (69.9%) | 138 (30.1%) |
| 10 to 14 Year Olds | 551 (78.5%) | 151 (21.5%) |
| 15 to 17 Year Olds | 306 (76.1%) | 96 (23.9%) |
| 18 to 19 Year Olds | 160 (57.6%) | 118 (42.4%) |
| 20 to 24 Year Olds | 165 (50.8%) | 160 (49.2%) |
| 25 to 34 Year Olds | 94 (65.7%) | 49 (34.3%) |
| 35 Years and over | 13 (17.8%) | 60 (82.2%) |
| Total | 1,661 (66.7%) | 829 (33.3%) |
Educational Attainment by Field of Study in Palos Heights
Business (800 | 18.7%), education (800 | 18.7%), science & technology (662 | 15.5%), social sciences (270 | 6.3%), and liberal arts & history (256 | 6.0%) are the most common fields of study among 4,282 individuals in Palos Heights who have obtained a bachelor's degree or higher.
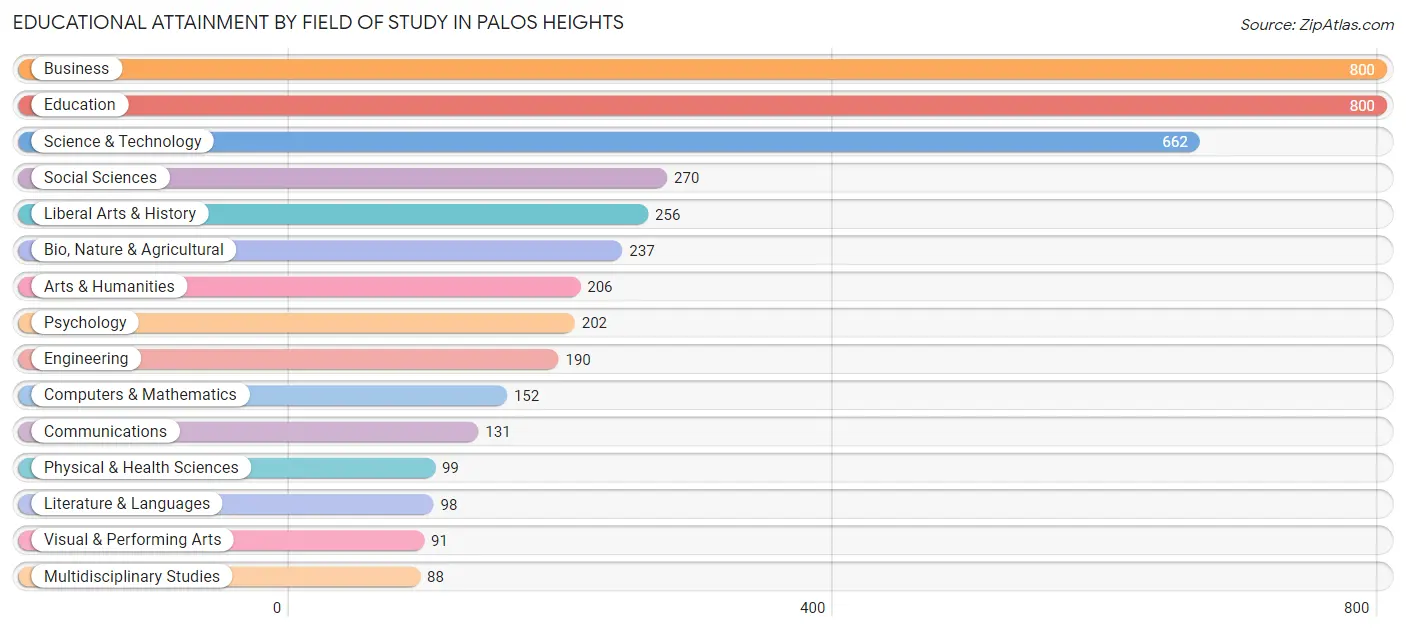
| Field of Study | # Graduates | % Graduates |
| Computers & Mathematics | 152 | 3.5% |
| Bio, Nature & Agricultural | 237 | 5.5% |
| Physical & Health Sciences | 99 | 2.3% |
| Psychology | 202 | 4.7% |
| Social Sciences | 270 | 6.3% |
| Engineering | 190 | 4.4% |
| Multidisciplinary Studies | 88 | 2.1% |
| Science & Technology | 662 | 15.5% |
| Business | 800 | 18.7% |
| Education | 800 | 18.7% |
| Literature & Languages | 98 | 2.3% |
| Liberal Arts & History | 256 | 6.0% |
| Visual & Performing Arts | 91 | 2.1% |
| Communications | 131 | 3.1% |
| Arts & Humanities | 206 | 4.8% |
| Total | 4,282 | 100.0% |
Transportation & Commute in Palos Heights
Vehicle Availability by Sex in Palos Heights
The most prevalent vehicle ownership categories in Palos Heights are males with 2 vehicles (1,486, accounting for 53.5%) and females with 2 vehicles (963, making up 64.0%).
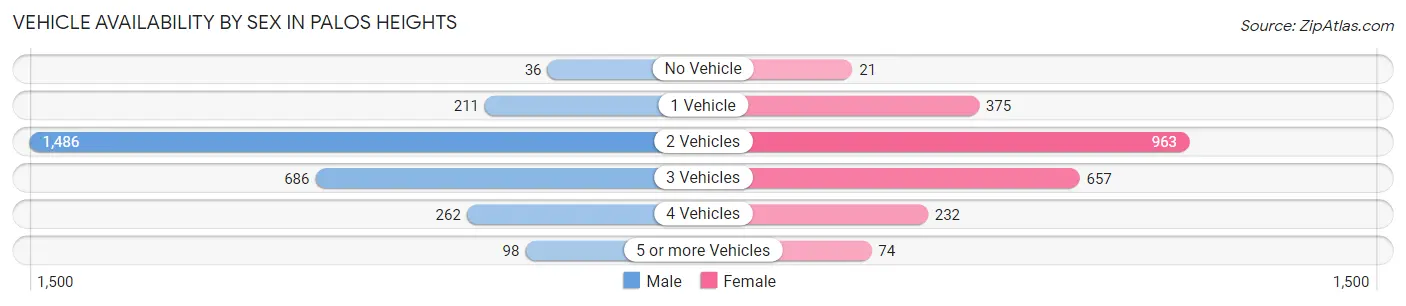
| Vehicles Available | Male | Female |
| No Vehicle | 36 (1.3%) | 21 (0.9%) |
| 1 Vehicle | 211 (7.6%) | 375 (16.2%) |
| 2 Vehicles | 1,486 (53.5%) | 963 (41.5%) |
| 3 Vehicles | 686 (24.7%) | 657 (28.3%) |
| 4 Vehicles | 262 (9.4%) | 232 (10.0%) |
| 5 or more Vehicles | 98 (3.5%) | 74 (3.2%) |
| Total | 2,779 (100.0%) | 2,322 (100.0%) |
Commute Time in Palos Heights
The most frequently occuring commute durations in Palos Heights are 15 to 19 minutes (796 commuters, 17.5%), 30 to 34 minutes (676 commuters, 14.8%), and 10 to 14 minutes (634 commuters, 13.9%).
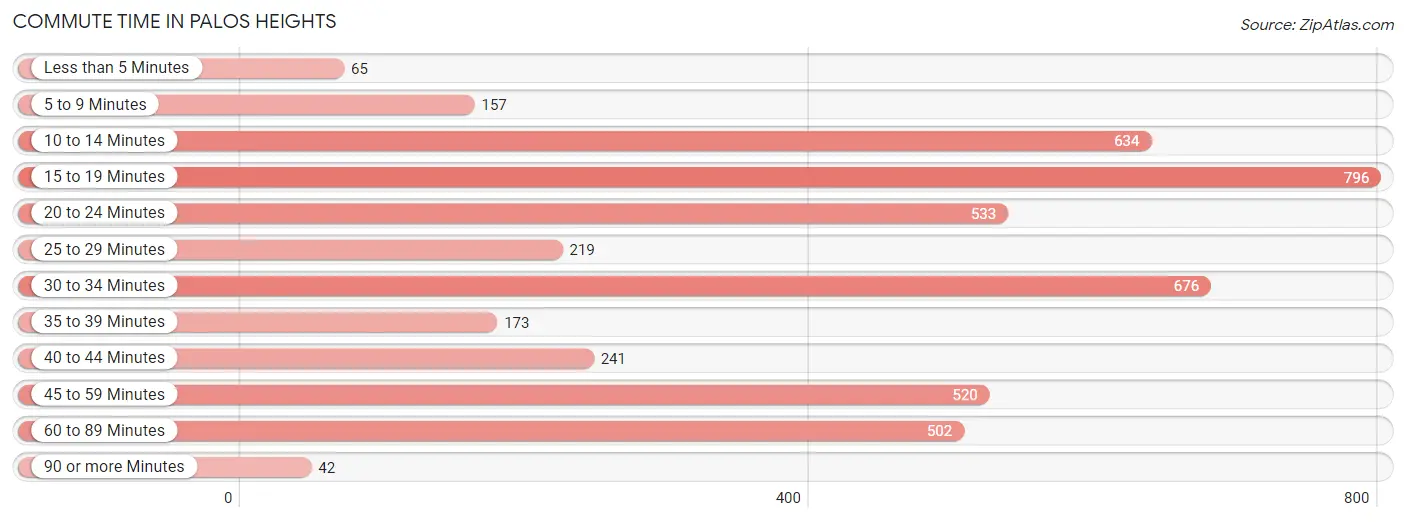
| Commute Time | # Commuters | % Commuters |
| Less than 5 Minutes | 65 | 1.4% |
| 5 to 9 Minutes | 157 | 3.4% |
| 10 to 14 Minutes | 634 | 13.9% |
| 15 to 19 Minutes | 796 | 17.5% |
| 20 to 24 Minutes | 533 | 11.7% |
| 25 to 29 Minutes | 219 | 4.8% |
| 30 to 34 Minutes | 676 | 14.8% |
| 35 to 39 Minutes | 173 | 3.8% |
| 40 to 44 Minutes | 241 | 5.3% |
| 45 to 59 Minutes | 520 | 11.4% |
| 60 to 89 Minutes | 502 | 11.0% |
| 90 or more Minutes | 42 | 0.9% |
Commute Time by Sex in Palos Heights
The most common commute times in Palos Heights are 45 to 59 minutes (358 commuters, 14.3%) for males and 15 to 19 minutes (500 commuters, 24.4%) for females.
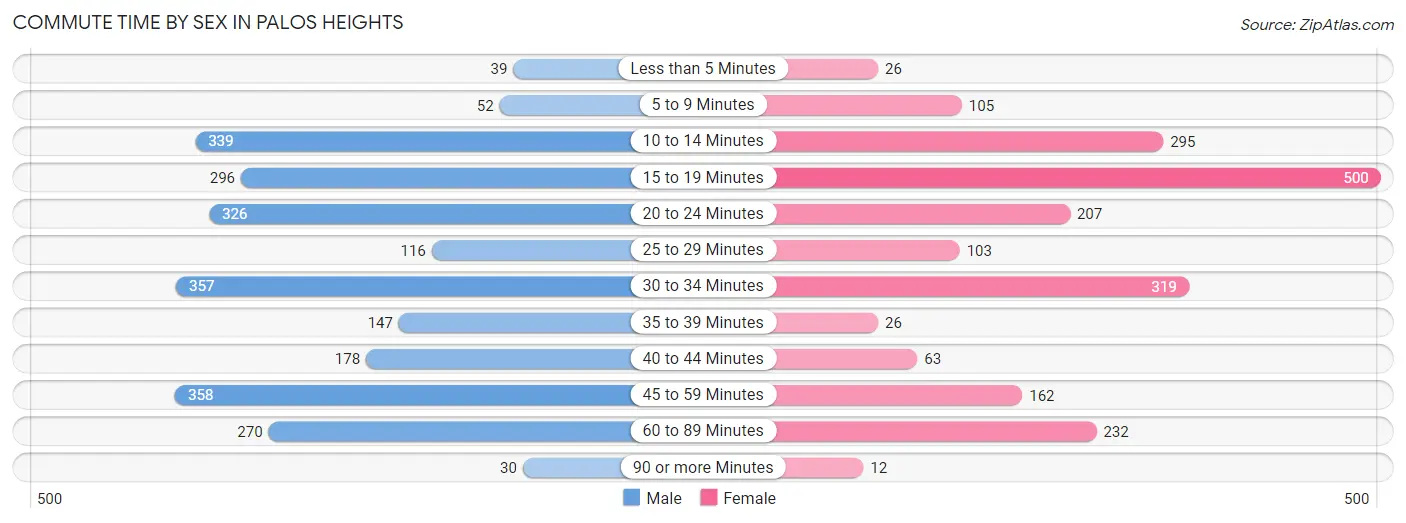
| Commute Time | Male | Female |
| Less than 5 Minutes | 39 (1.6%) | 26 (1.3%) |
| 5 to 9 Minutes | 52 (2.1%) | 105 (5.1%) |
| 10 to 14 Minutes | 339 (13.5%) | 295 (14.4%) |
| 15 to 19 Minutes | 296 (11.8%) | 500 (24.4%) |
| 20 to 24 Minutes | 326 (13.0%) | 207 (10.1%) |
| 25 to 29 Minutes | 116 (4.6%) | 103 (5.0%) |
| 30 to 34 Minutes | 357 (14.2%) | 319 (15.6%) |
| 35 to 39 Minutes | 147 (5.9%) | 26 (1.3%) |
| 40 to 44 Minutes | 178 (7.1%) | 63 (3.1%) |
| 45 to 59 Minutes | 358 (14.3%) | 162 (7.9%) |
| 60 to 89 Minutes | 270 (10.8%) | 232 (11.3%) |
| 90 or more Minutes | 30 (1.2%) | 12 (0.6%) |
Time of Departure to Work by Sex in Palos Heights
The most frequent times of departure to work in Palos Heights are 6:30 AM to 6:59 AM (371, 14.8%) for males and 8:00 AM to 8:29 AM (348, 17.0%) for females.
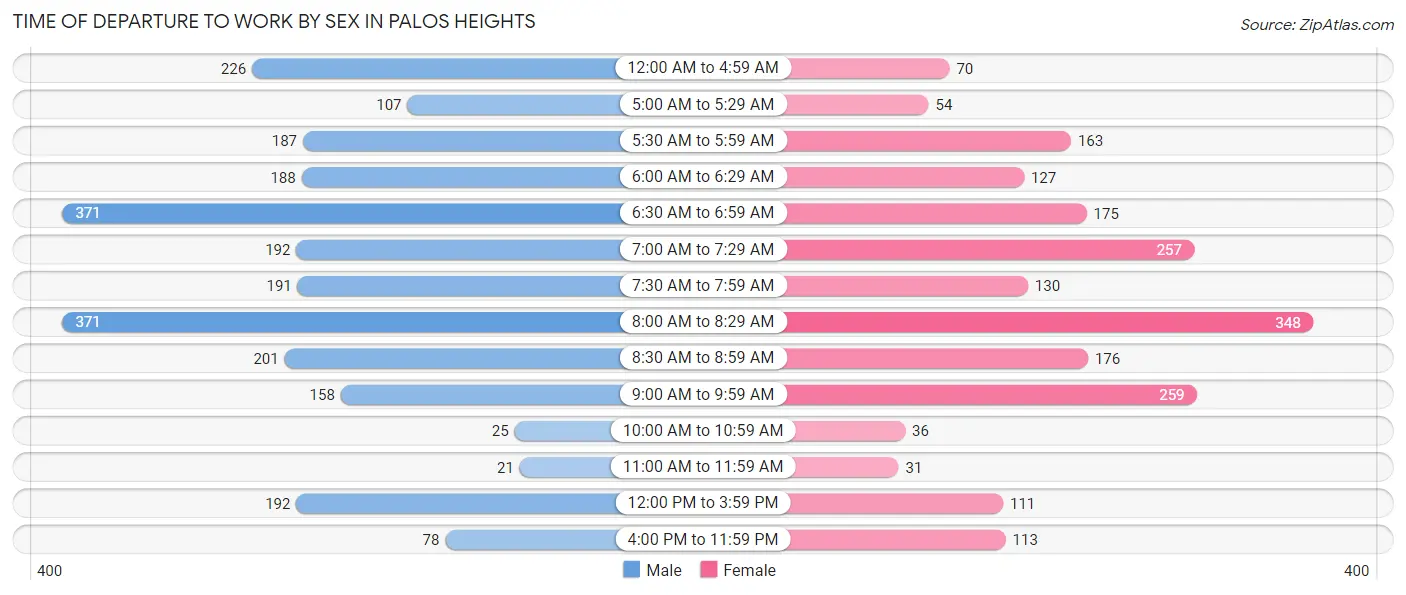
| Time of Departure | Male | Female |
| 12:00 AM to 4:59 AM | 226 (9.0%) | 70 (3.4%) |
| 5:00 AM to 5:29 AM | 107 (4.3%) | 54 (2.6%) |
| 5:30 AM to 5:59 AM | 187 (7.5%) | 163 (8.0%) |
| 6:00 AM to 6:29 AM | 188 (7.5%) | 127 (6.2%) |
| 6:30 AM to 6:59 AM | 371 (14.8%) | 175 (8.5%) |
| 7:00 AM to 7:29 AM | 192 (7.7%) | 257 (12.5%) |
| 7:30 AM to 7:59 AM | 191 (7.6%) | 130 (6.3%) |
| 8:00 AM to 8:29 AM | 371 (14.8%) | 348 (17.0%) |
| 8:30 AM to 8:59 AM | 201 (8.0%) | 176 (8.6%) |
| 9:00 AM to 9:59 AM | 158 (6.3%) | 259 (12.6%) |
| 10:00 AM to 10:59 AM | 25 (1.0%) | 36 (1.8%) |
| 11:00 AM to 11:59 AM | 21 (0.8%) | 31 (1.5%) |
| 12:00 PM to 3:59 PM | 192 (7.7%) | 111 (5.4%) |
| 4:00 PM to 11:59 PM | 78 (3.1%) | 113 (5.5%) |
| Total | 2,508 (100.0%) | 2,050 (100.0%) |
Housing Occupancy in Palos Heights
Occupancy by Ownership in Palos Heights
Of the total 4,553 dwellings in Palos Heights, owner-occupied units account for 4,328 (95.1%), while renter-occupied units make up 225 (4.9%).
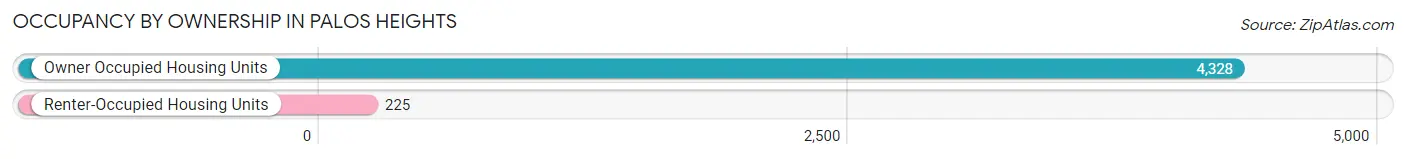
| Occupancy | # Housing Units | % Housing Units |
| Owner Occupied Housing Units | 4,328 | 95.1% |
| Renter-Occupied Housing Units | 225 | 4.9% |
| Total Occupied Housing Units | 4,553 | 100.0% |
Occupancy by Household Size in Palos Heights
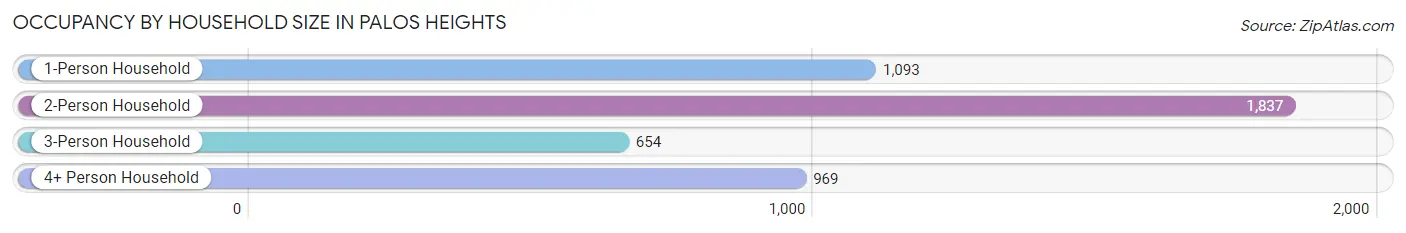
| Household Size | # Housing Units | % Housing Units |
| 1-Person Household | 1,093 | 24.0% |
| 2-Person Household | 1,837 | 40.4% |
| 3-Person Household | 654 | 14.4% |
| 4+ Person Household | 969 | 21.3% |
| Total Housing Units | 4,553 | 100.0% |
Occupancy by Ownership by Household Size in Palos Heights
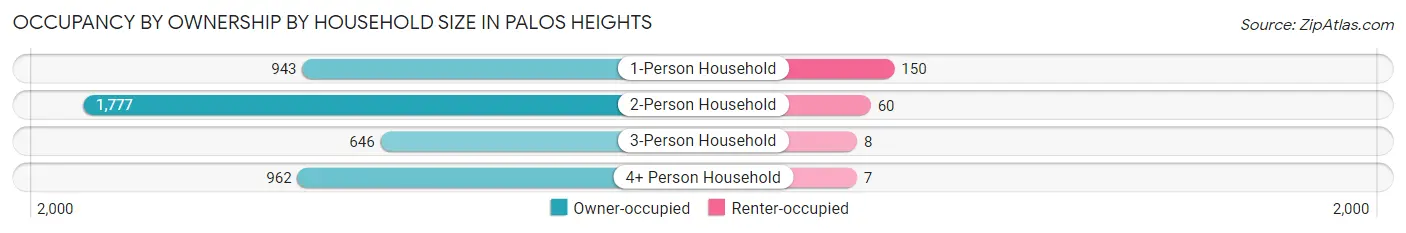
| Household Size | Owner-occupied | Renter-occupied |
| 1-Person Household | 943 (86.3%) | 150 (13.7%) |
| 2-Person Household | 1,777 (96.7%) | 60 (3.3%) |
| 3-Person Household | 646 (98.8%) | 8 (1.2%) |
| 4+ Person Household | 962 (99.3%) | 7 (0.7%) |
| Total Housing Units | 4,328 (95.1%) | 225 (4.9%) |
Occupancy by Educational Attainment in Palos Heights
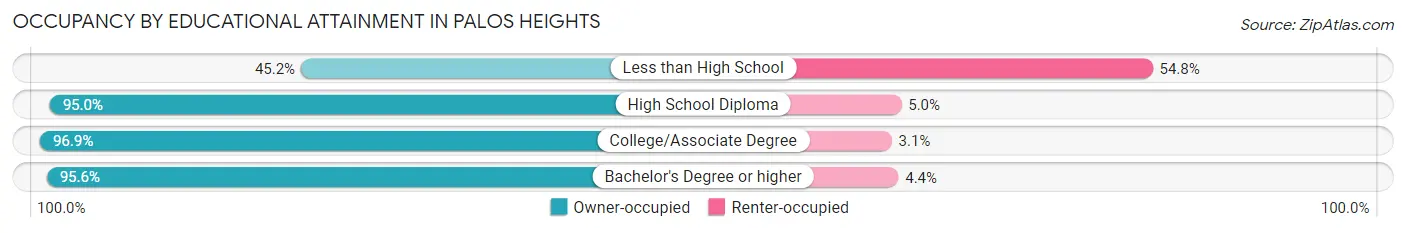
| Household Size | Owner-occupied | Renter-occupied |
| Less than High School | 33 (45.2%) | 40 (54.8%) |
| High School Diploma | 915 (95.0%) | 48 (5.0%) |
| College/Associate Degree | 1,267 (96.9%) | 40 (3.1%) |
| Bachelor's Degree or higher | 2,113 (95.6%) | 97 (4.4%) |
Occupancy by Age of Householder in Palos Heights
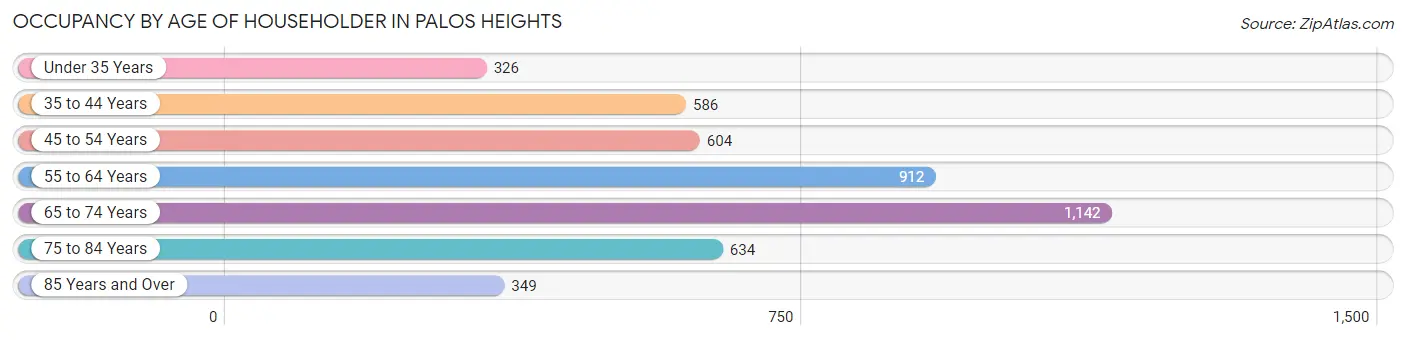
| Age Bracket | # Households | % Households |
| Under 35 Years | 326 | 7.2% |
| 35 to 44 Years | 586 | 12.9% |
| 45 to 54 Years | 604 | 13.3% |
| 55 to 64 Years | 912 | 20.0% |
| 65 to 74 Years | 1,142 | 25.1% |
| 75 to 84 Years | 634 | 13.9% |
| 85 Years and Over | 349 | 7.7% |
| Total | 4,553 | 100.0% |
Housing Finances in Palos Heights
Median Income by Occupancy in Palos Heights
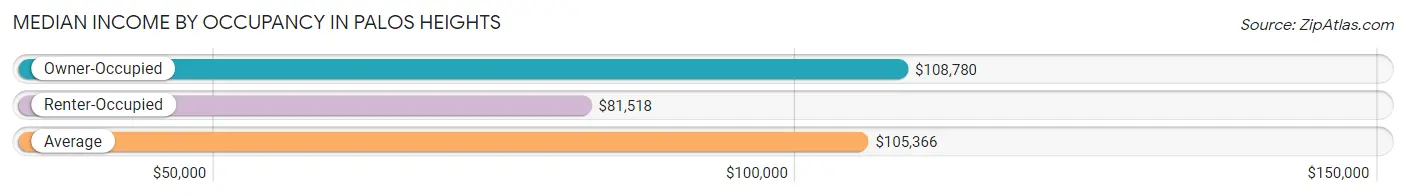
| Occupancy Type | # Households | Median Income |
| Owner-Occupied | 4,328 (95.1%) | $108,780 |
| Renter-Occupied | 225 (4.9%) | $81,518 |
| Average | 4,553 (100.0%) | $105,366 |
Occupancy by Householder Income Bracket in Palos Heights
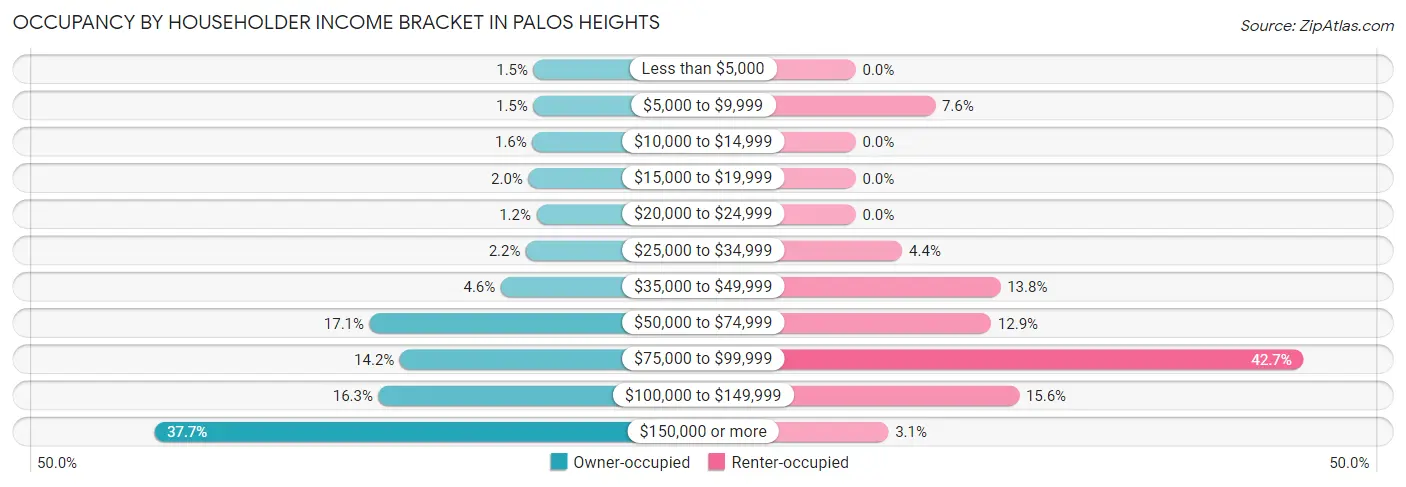
| Income Bracket | Owner-occupied | Renter-occupied |
| Less than $5,000 | 65 (1.5%) | 0 (0.0%) |
| $5,000 to $9,999 | 66 (1.5%) | 17 (7.6%) |
| $10,000 to $14,999 | 70 (1.6%) | 0 (0.0%) |
| $15,000 to $19,999 | 86 (2.0%) | 0 (0.0%) |
| $20,000 to $24,999 | 53 (1.2%) | 0 (0.0%) |
| $25,000 to $34,999 | 96 (2.2%) | 10 (4.4%) |
| $35,000 to $49,999 | 200 (4.6%) | 31 (13.8%) |
| $50,000 to $74,999 | 741 (17.1%) | 29 (12.9%) |
| $75,000 to $99,999 | 616 (14.2%) | 96 (42.7%) |
| $100,000 to $149,999 | 704 (16.3%) | 35 (15.6%) |
| $150,000 or more | 1,631 (37.7%) | 7 (3.1%) |
| Total | 4,328 (100.0%) | 225 (100.0%) |
Monthly Housing Cost Tiers in Palos Heights
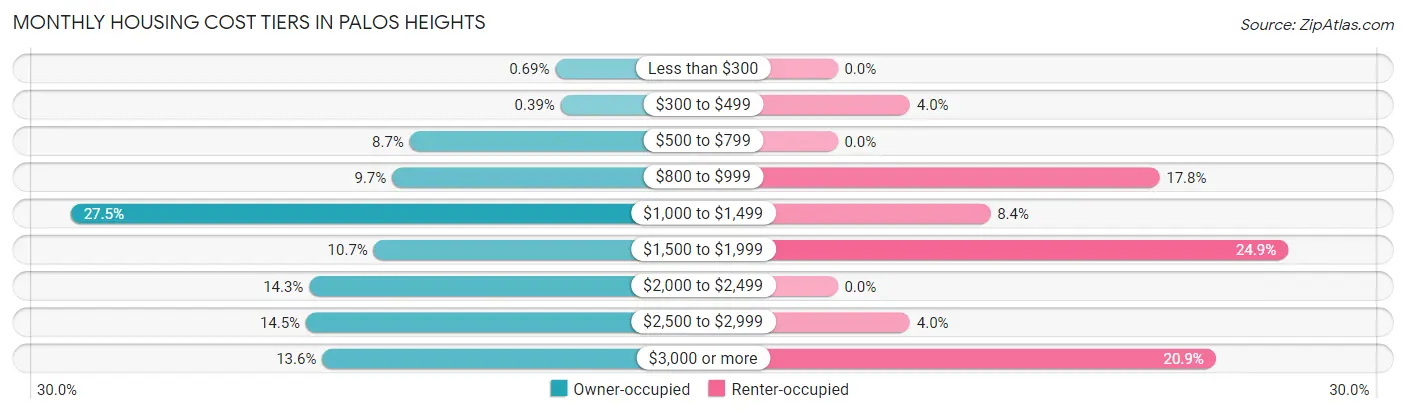
| Monthly Cost | Owner-occupied | Renter-occupied |
| Less than $300 | 30 (0.7%) | 0 (0.0%) |
| $300 to $499 | 17 (0.4%) | 9 (4.0%) |
| $500 to $799 | 378 (8.7%) | 0 (0.0%) |
| $800 to $999 | 420 (9.7%) | 40 (17.8%) |
| $1,000 to $1,499 | 1,188 (27.5%) | 19 (8.4%) |
| $1,500 to $1,999 | 464 (10.7%) | 56 (24.9%) |
| $2,000 to $2,499 | 618 (14.3%) | 0 (0.0%) |
| $2,500 to $2,999 | 626 (14.5%) | 9 (4.0%) |
| $3,000 or more | 587 (13.6%) | 47 (20.9%) |
| Total | 4,328 (100.0%) | 225 (100.0%) |
Physical Housing Characteristics in Palos Heights
Housing Structures in Palos Heights
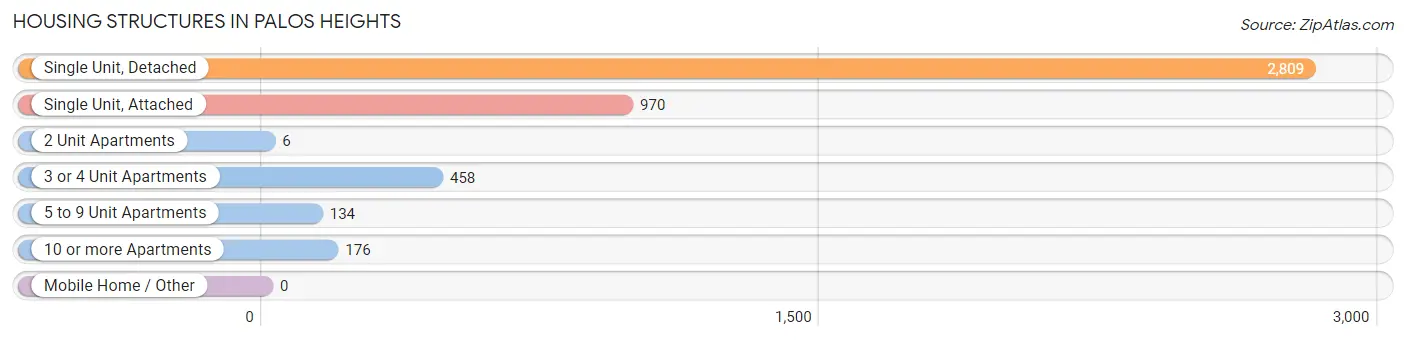
| Structure Type | # Housing Units | % Housing Units |
| Single Unit, Detached | 2,809 | 61.7% |
| Single Unit, Attached | 970 | 21.3% |
| 2 Unit Apartments | 6 | 0.1% |
| 3 or 4 Unit Apartments | 458 | 10.1% |
| 5 to 9 Unit Apartments | 134 | 2.9% |
| 10 or more Apartments | 176 | 3.9% |
| Mobile Home / Other | 0 | 0.0% |
| Total | 4,553 | 100.0% |
Housing Structures by Occupancy in Palos Heights
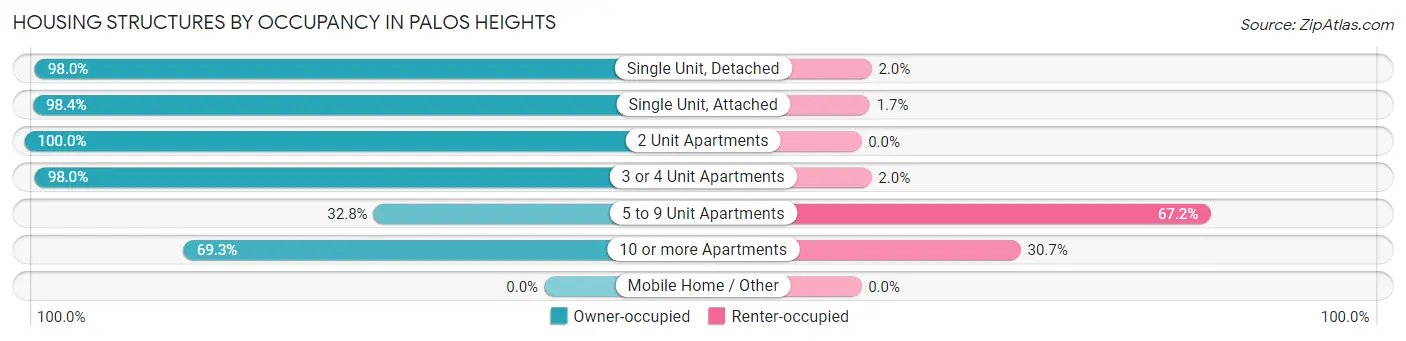
| Structure Type | Owner-occupied | Renter-occupied |
| Single Unit, Detached | 2,753 (98.0%) | 56 (2.0%) |
| Single Unit, Attached | 954 (98.4%) | 16 (1.7%) |
| 2 Unit Apartments | 6 (100.0%) | 0 (0.0%) |
| 3 or 4 Unit Apartments | 449 (98.0%) | 9 (2.0%) |
| 5 to 9 Unit Apartments | 44 (32.8%) | 90 (67.2%) |
| 10 or more Apartments | 122 (69.3%) | 54 (30.7%) |
| Mobile Home / Other | 0 (0.0%) | 0 (0.0%) |
| Total | 4,328 (95.1%) | 225 (4.9%) |
Housing Structures by Number of Rooms in Palos Heights
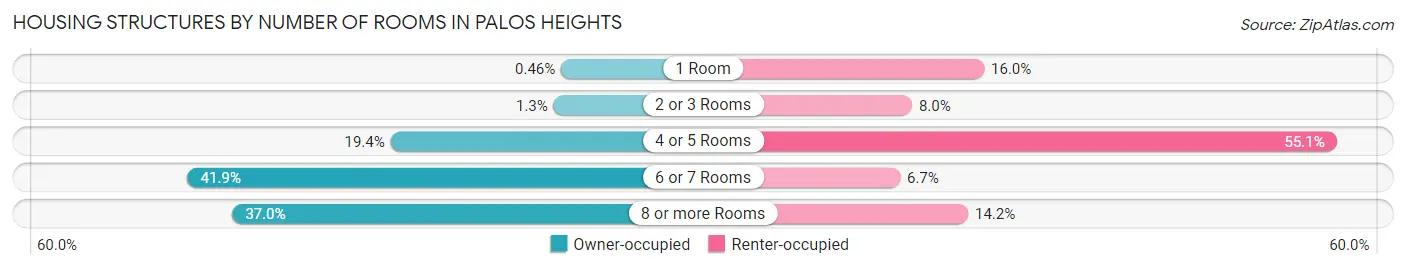
| Number of Rooms | Owner-occupied | Renter-occupied |
| 1 Room | 20 (0.5%) | 36 (16.0%) |
| 2 or 3 Rooms | 56 (1.3%) | 18 (8.0%) |
| 4 or 5 Rooms | 839 (19.4%) | 124 (55.1%) |
| 6 or 7 Rooms | 1,814 (41.9%) | 15 (6.7%) |
| 8 or more Rooms | 1,599 (36.9%) | 32 (14.2%) |
| Total | 4,328 (100.0%) | 225 (100.0%) |
Housing Structure by Heating Type in Palos Heights
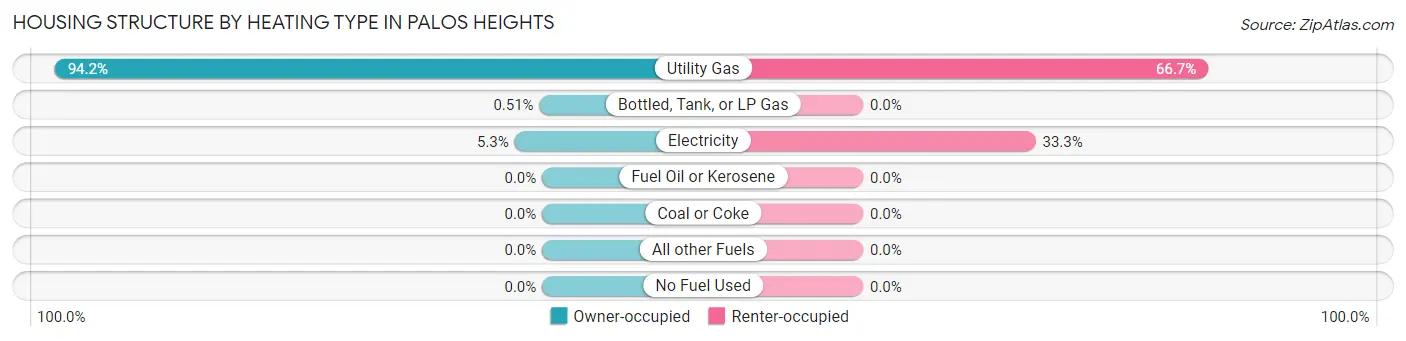
| Heating Type | Owner-occupied | Renter-occupied |
| Utility Gas | 4,076 (94.2%) | 150 (66.7%) |
| Bottled, Tank, or LP Gas | 22 (0.5%) | 0 (0.0%) |
| Electricity | 230 (5.3%) | 75 (33.3%) |
| Fuel Oil or Kerosene | 0 (0.0%) | 0 (0.0%) |
| Coal or Coke | 0 (0.0%) | 0 (0.0%) |
| All other Fuels | 0 (0.0%) | 0 (0.0%) |
| No Fuel Used | 0 (0.0%) | 0 (0.0%) |
| Total | 4,328 (100.0%) | 225 (100.0%) |
Household Vehicle Usage in Palos Heights
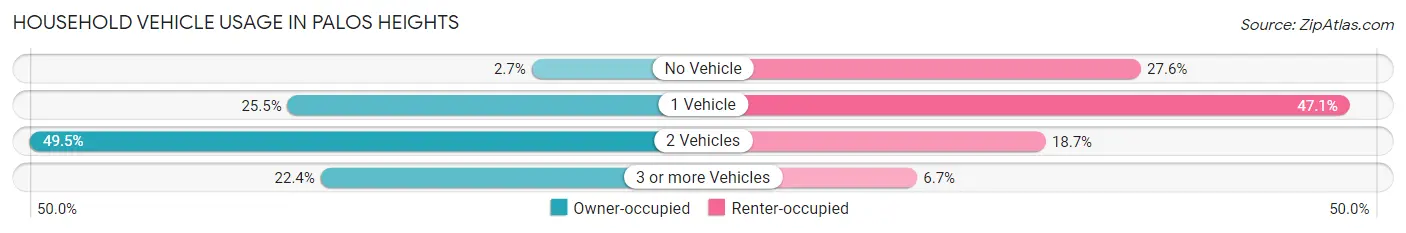
| Vehicles per Household | Owner-occupied | Renter-occupied |
| No Vehicle | 116 (2.7%) | 62 (27.6%) |
| 1 Vehicle | 1,102 (25.5%) | 106 (47.1%) |
| 2 Vehicles | 2,142 (49.5%) | 42 (18.7%) |
| 3 or more Vehicles | 968 (22.4%) | 15 (6.7%) |
| Total | 4,328 (100.0%) | 225 (100.0%) |
Real Estate & Mortgages in Palos Heights
Real Estate and Mortgage Overview in Palos Heights
| Characteristic | Without Mortgage | With Mortgage |
| Housing Units | 1,920 | 2,408 |
| Median Property Value | $320,900 | $343,200 |
| Median Household Income | $87,750 | $1,154 |
| Monthly Housing Costs | $1,053 | $587 |
| Real Estate Taxes | $7,301 | $7 |
Property Value by Mortgage Status in Palos Heights
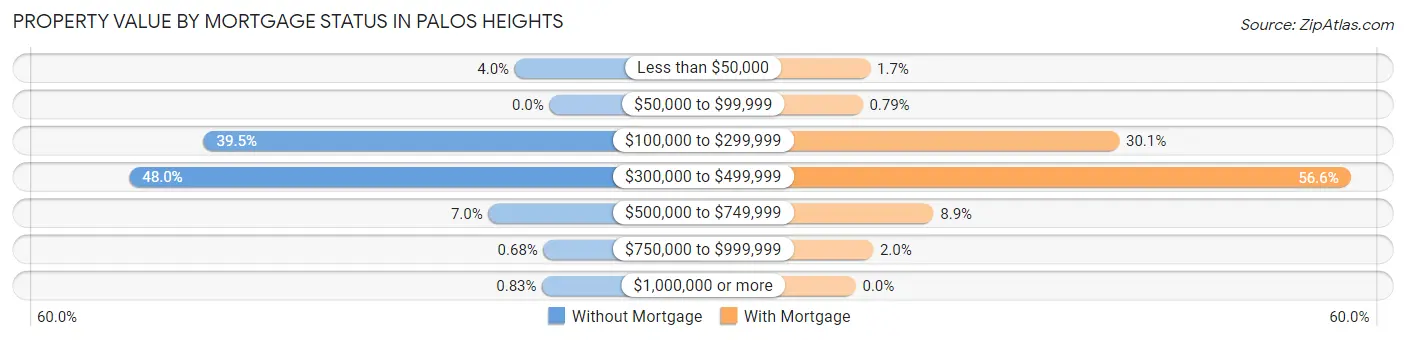
| Property Value | Without Mortgage | With Mortgage |
| Less than $50,000 | 76 (4.0%) | 40 (1.7%) |
| $50,000 to $99,999 | 0 (0.0%) | 19 (0.8%) |
| $100,000 to $299,999 | 759 (39.5%) | 725 (30.1%) |
| $300,000 to $499,999 | 922 (48.0%) | 1,362 (56.6%) |
| $500,000 to $749,999 | 134 (7.0%) | 214 (8.9%) |
| $750,000 to $999,999 | 13 (0.7%) | 48 (2.0%) |
| $1,000,000 or more | 16 (0.8%) | 0 (0.0%) |
| Total | 1,920 (100.0%) | 2,408 (100.0%) |
Household Income by Mortgage Status in Palos Heights
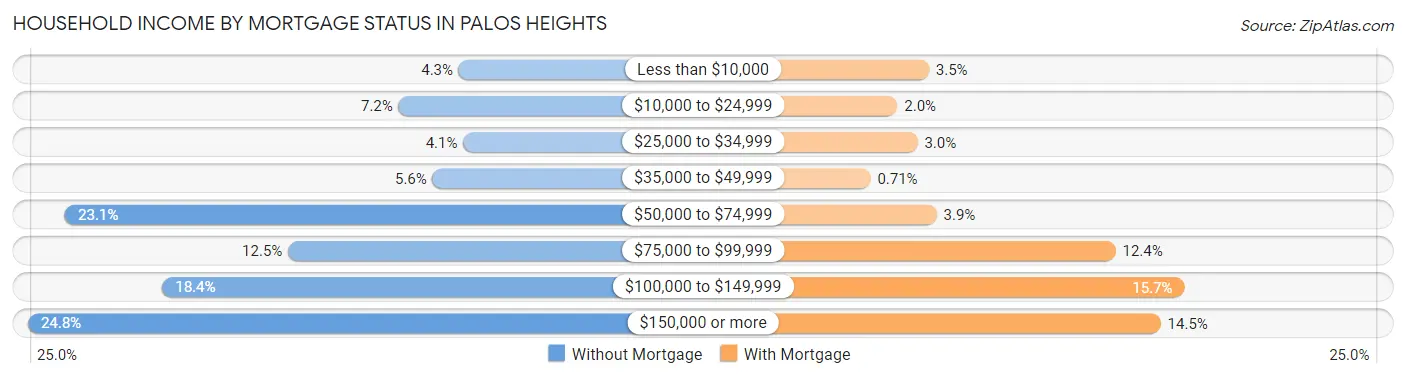
| Household Income | Without Mortgage | With Mortgage |
| Less than $10,000 | 83 (4.3%) | 84 (3.5%) |
| $10,000 to $24,999 | 138 (7.2%) | 48 (2.0%) |
| $25,000 to $34,999 | 79 (4.1%) | 71 (2.9%) |
| $35,000 to $49,999 | 107 (5.6%) | 17 (0.7%) |
| $50,000 to $74,999 | 443 (23.1%) | 93 (3.9%) |
| $75,000 to $99,999 | 239 (12.4%) | 298 (12.4%) |
| $100,000 to $149,999 | 354 (18.4%) | 377 (15.7%) |
| $150,000 or more | 477 (24.8%) | 350 (14.5%) |
| Total | 1,920 (100.0%) | 2,408 (100.0%) |
Property Value to Household Income Ratio in Palos Heights
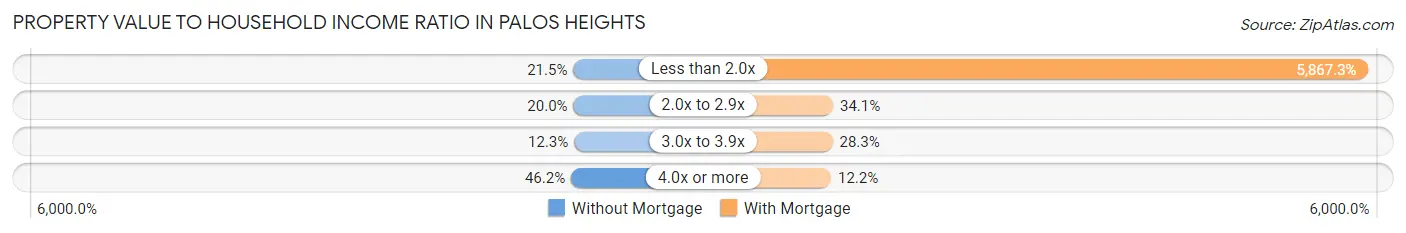
| Value-to-Income Ratio | Without Mortgage | With Mortgage |
| Less than 2.0x | 413 (21.5%) | 141,284 (5,867.3%) |
| 2.0x to 2.9x | 384 (20.0%) | 821 (34.1%) |
| 3.0x to 3.9x | 237 (12.3%) | 682 (28.3%) |
| 4.0x or more | 886 (46.2%) | 293 (12.2%) |
| Total | 1,920 (100.0%) | 2,408 (100.0%) |
Real Estate Taxes by Mortgage Status in Palos Heights
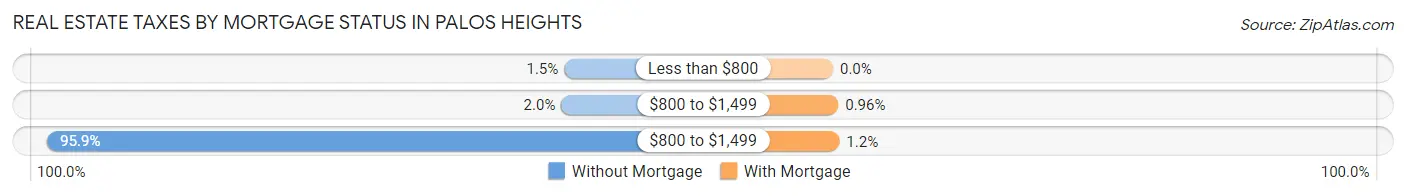
| Property Taxes | Without Mortgage | With Mortgage |
| Less than $800 | 28 (1.5%) | 0 (0.0%) |
| $800 to $1,499 | 38 (2.0%) | 23 (1.0%) |
| $800 to $1,499 | 1,841 (95.9%) | 28 (1.2%) |
| Total | 1,920 (100.0%) | 2,408 (100.0%) |
Health & Disability in Palos Heights
Health Insurance Coverage by Age in Palos Heights
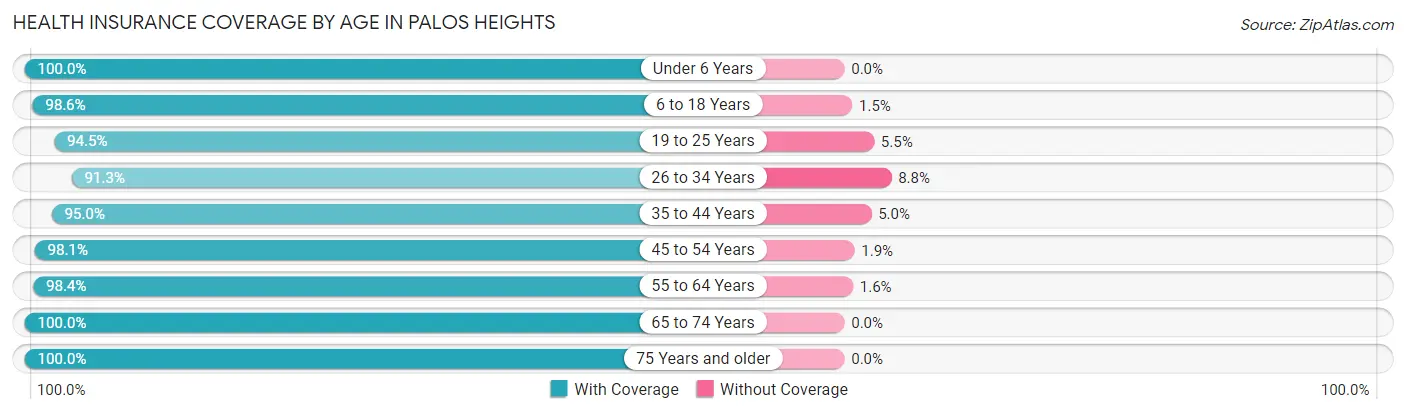
| Age Bracket | With Coverage | Without Coverage |
| Under 6 Years | 652 (100.0%) | 0 (0.0%) |
| 6 to 18 Years | 1,696 (98.6%) | 25 (1.5%) |
| 19 to 25 Years | 719 (94.5%) | 42 (5.5%) |
| 26 to 34 Years | 939 (91.2%) | 90 (8.7%) |
| 35 to 44 Years | 1,116 (95.0%) | 59 (5.0%) |
| 45 to 54 Years | 995 (98.1%) | 19 (1.9%) |
| 55 to 64 Years | 1,793 (98.4%) | 29 (1.6%) |
| 65 to 74 Years | 1,997 (100.0%) | 0 (0.0%) |
| 75 Years and older | 1,408 (100.0%) | 0 (0.0%) |
| Total | 11,315 (97.7%) | 264 (2.3%) |
Health Insurance Coverage by Citizenship Status in Palos Heights
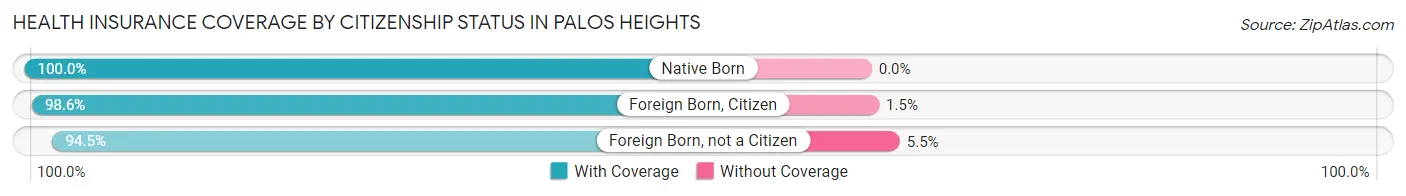
| Citizenship Status | With Coverage | Without Coverage |
| Native Born | 652 (100.0%) | 0 (0.0%) |
| Foreign Born, Citizen | 1,696 (98.6%) | 25 (1.5%) |
| Foreign Born, not a Citizen | 719 (94.5%) | 42 (5.5%) |
Health Insurance Coverage by Household Income in Palos Heights
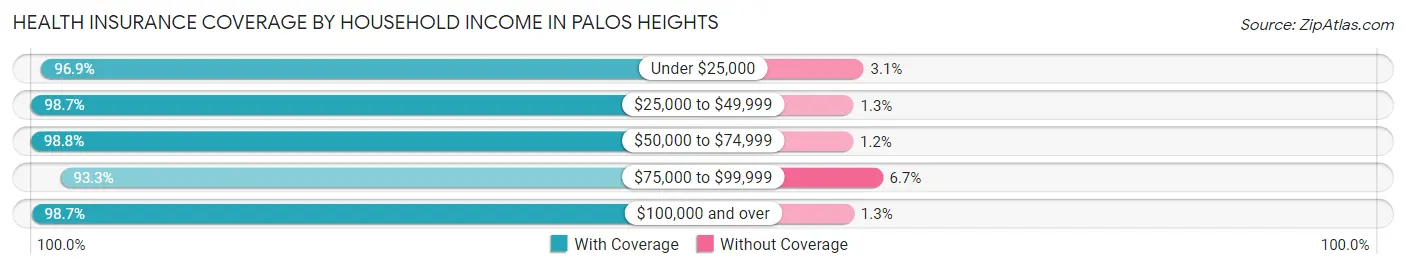
| Household Income | With Coverage | Without Coverage |
| Under $25,000 | 462 (96.9%) | 15 (3.1%) |
| $25,000 to $49,999 | 618 (98.7%) | 8 (1.3%) |
| $50,000 to $74,999 | 1,590 (98.8%) | 19 (1.2%) |
| $75,000 to $99,999 | 1,423 (93.3%) | 102 (6.7%) |
| $100,000 and over | 7,049 (98.7%) | 95 (1.3%) |
Public vs Private Health Insurance Coverage by Age in Palos Heights
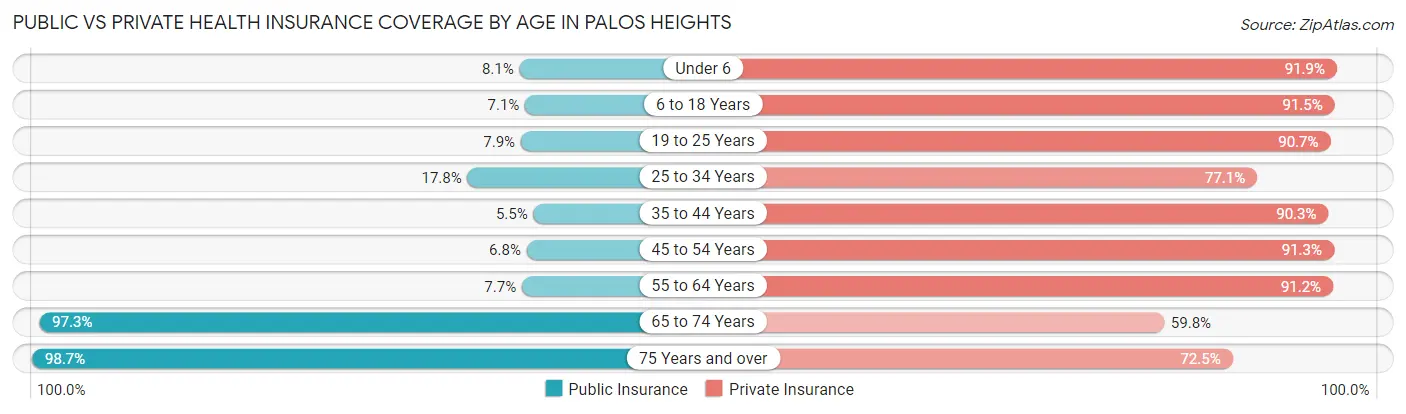
| Age Bracket | Public Insurance | Private Insurance |
| Under 6 | 53 (8.1%) | 599 (91.9%) |
| 6 to 18 Years | 122 (7.1%) | 1,574 (91.5%) |
| 19 to 25 Years | 60 (7.9%) | 690 (90.7%) |
| 25 to 34 Years | 183 (17.8%) | 793 (77.1%) |
| 35 to 44 Years | 65 (5.5%) | 1,061 (90.3%) |
| 45 to 54 Years | 69 (6.8%) | 926 (91.3%) |
| 55 to 64 Years | 140 (7.7%) | 1,661 (91.2%) |
| 65 to 74 Years | 1,943 (97.3%) | 1,194 (59.8%) |
| 75 Years and over | 1,389 (98.7%) | 1,021 (72.5%) |
| Total | 4,024 (34.7%) | 9,519 (82.2%) |
Disability Status by Sex by Age in Palos Heights
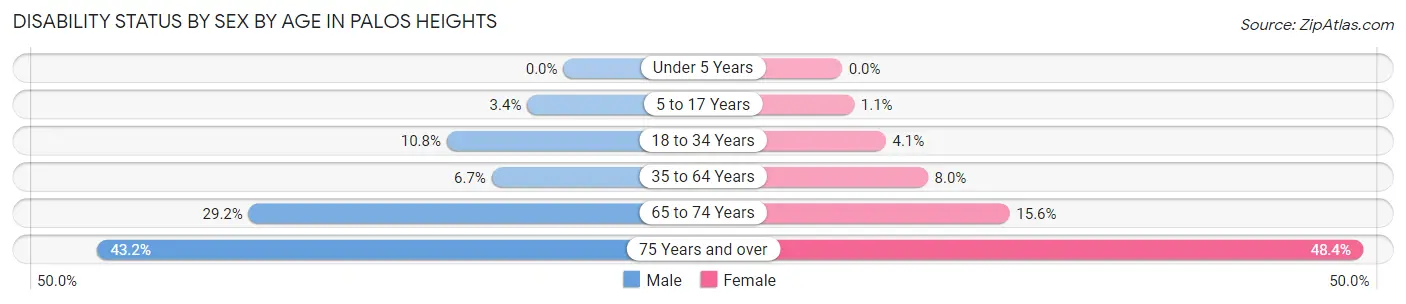
| Age Bracket | Male | Female |
| Under 5 Years | 0 (0.0%) | 0 (0.0%) |
| 5 to 17 Years | 27 (3.4%) | 9 (1.1%) |
| 18 to 34 Years | 117 (10.8%) | 37 (4.1%) |
| 35 to 64 Years | 128 (6.7%) | 166 (8.0%) |
| 65 to 74 Years | 262 (29.2%) | 171 (15.5%) |
| 75 Years and over | 268 (43.2%) | 381 (48.3%) |
Disability Class by Sex by Age in Palos Heights
Disability Class: Hearing Difficulty
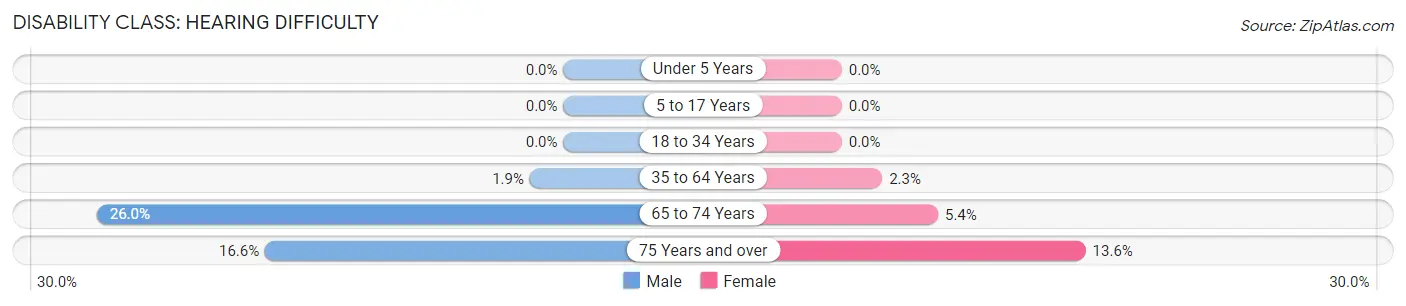
| Age Bracket | Male | Female |
| Under 5 Years | 0 (0.0%) | 0 (0.0%) |
| 5 to 17 Years | 0 (0.0%) | 0 (0.0%) |
| 18 to 34 Years | 0 (0.0%) | 0 (0.0%) |
| 35 to 64 Years | 36 (1.9%) | 47 (2.2%) |
| 65 to 74 Years | 233 (26.0%) | 59 (5.4%) |
| 75 Years and over | 103 (16.6%) | 107 (13.6%) |
Disability Class: Vision Difficulty
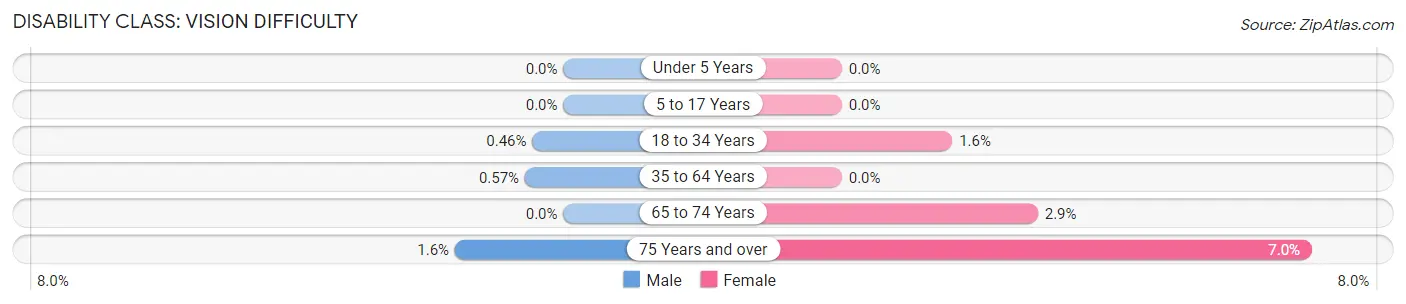
| Age Bracket | Male | Female |
| Under 5 Years | 0 (0.0%) | 0 (0.0%) |
| 5 to 17 Years | 0 (0.0%) | 0 (0.0%) |
| 18 to 34 Years | 5 (0.5%) | 15 (1.6%) |
| 35 to 64 Years | 11 (0.6%) | 0 (0.0%) |
| 65 to 74 Years | 0 (0.0%) | 32 (2.9%) |
| 75 Years and over | 10 (1.6%) | 55 (7.0%) |
Disability Class: Cognitive Difficulty
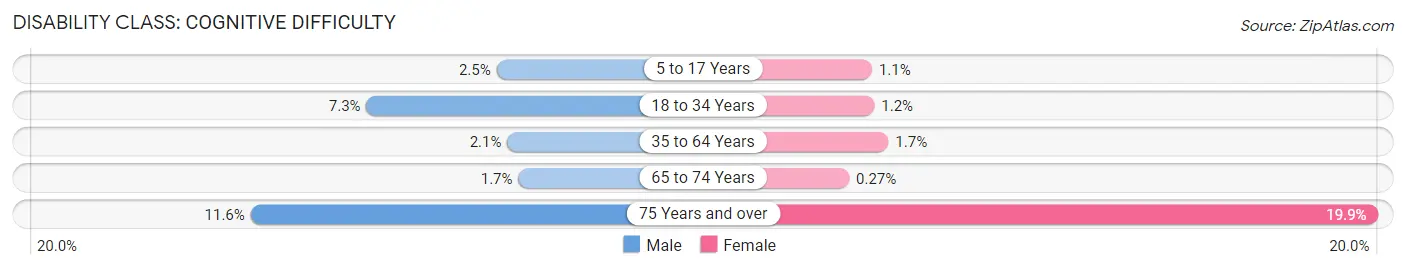
| Age Bracket | Male | Female |
| 5 to 17 Years | 20 (2.5%) | 9 (1.1%) |
| 18 to 34 Years | 79 (7.3%) | 11 (1.2%) |
| 35 to 64 Years | 40 (2.1%) | 36 (1.7%) |
| 65 to 74 Years | 15 (1.7%) | 3 (0.3%) |
| 75 Years and over | 72 (11.6%) | 157 (19.9%) |
Disability Class: Ambulatory Difficulty
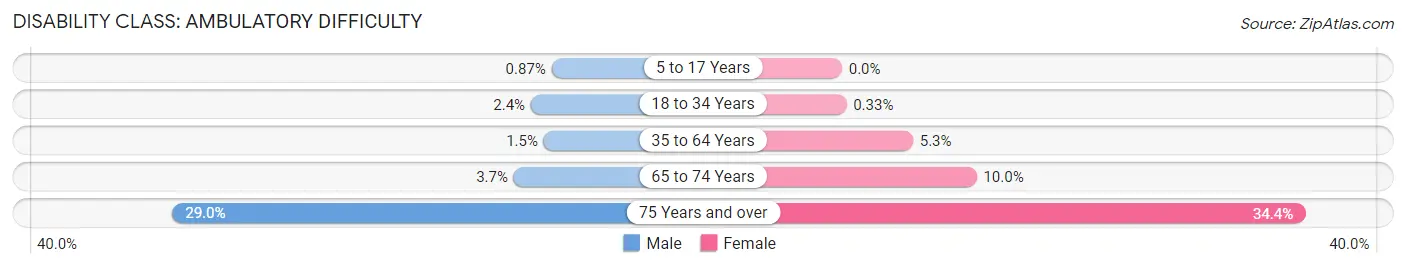
| Age Bracket | Male | Female |
| 5 to 17 Years | 7 (0.9%) | 0 (0.0%) |
| 18 to 34 Years | 26 (2.4%) | 3 (0.3%) |
| 35 to 64 Years | 28 (1.5%) | 110 (5.3%) |
| 65 to 74 Years | 33 (3.7%) | 110 (10.0%) |
| 75 Years and over | 180 (29.0%) | 271 (34.4%) |
Disability Class: Self-Care Difficulty
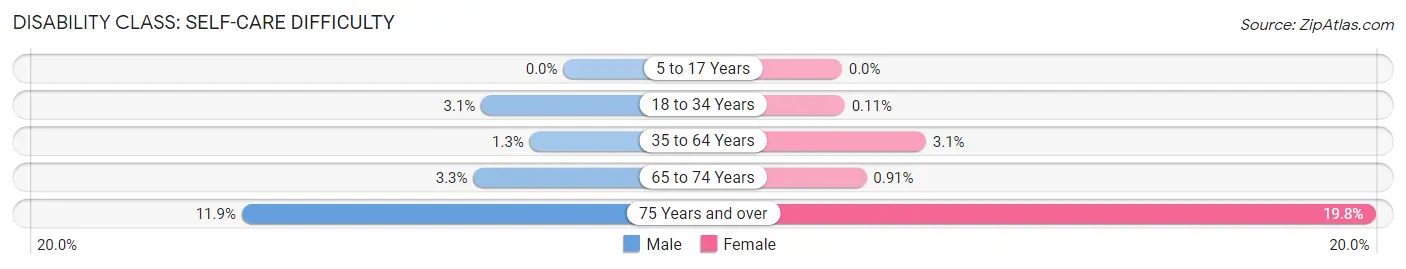
| Age Bracket | Male | Female |
| 5 to 17 Years | 0 (0.0%) | 0 (0.0%) |
| 18 to 34 Years | 33 (3.0%) | 1 (0.1%) |
| 35 to 64 Years | 24 (1.3%) | 65 (3.1%) |
| 65 to 74 Years | 30 (3.3%) | 10 (0.9%) |
| 75 Years and over | 74 (11.9%) | 156 (19.8%) |
Technology Access in Palos Heights
Computing Device Access in Palos Heights
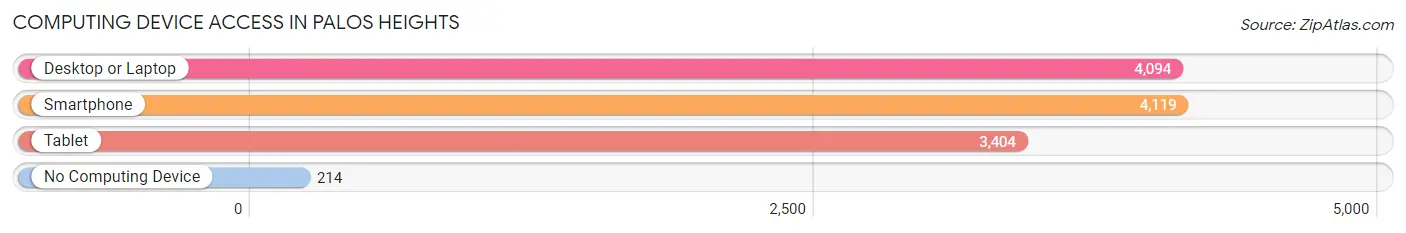
| Device Type | # Households | % Households |
| Desktop or Laptop | 4,094 | 89.9% |
| Smartphone | 4,119 | 90.5% |
| Tablet | 3,404 | 74.8% |
| No Computing Device | 214 | 4.7% |
| Total | 4,553 | 100.0% |
Internet Access in Palos Heights
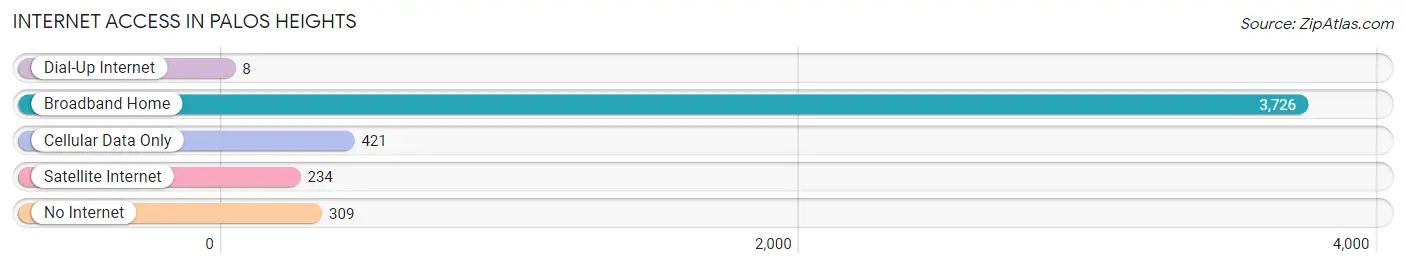
| Internet Type | # Households | % Households |
| Dial-Up Internet | 8 | 0.2% |
| Broadband Home | 3,726 | 81.8% |
| Cellular Data Only | 421 | 9.2% |
| Satellite Internet | 234 | 5.1% |
| No Internet | 309 | 6.8% |
| Total | 4,553 | 100.0% |
Palos Heights Summary
Palos Heights, Illinois is a city located in Cook County, Illinois, United States. It is a suburb of Chicago, located approximately 15 miles southwest of the city. As of the 2010 census, the city had a population of 12,515.
History
The area that is now Palos Heights was first settled in the 1830s by German and Irish immigrants. The area was originally known as the “Hickory Creek Settlement” and was part of the larger Palos Township. In the late 19th century, the area was known as “Palos Park” and was a popular summer resort for wealthy Chicagoans.
In the early 20th century, the area began to be developed as a residential suburb of Chicago. The city of Palos Heights was officially incorporated in 1959. The city was named after the nearby Palos Hills, which were named after the Palos Verdes hills in California.
Geography
Palos Heights is located in northeastern Illinois at 41°41'17" North, 87°48'45" West (41.6879, -87.8125). The city is located in the southwestern corner of Cook County, approximately 15 miles southwest of downtown Chicago.
The city has a total area of 4.7 square miles, of which 4.6 square miles is land and 0.1 square miles is water. The city is bordered by Palos Park to the north, Palos Hills to the east, Orland Park to the south, and Worth to the west.
Economy
The economy of Palos Heights is largely based on retail and services. The city is home to a variety of retail stores, restaurants, and other businesses. The city is also home to several medical centers and hospitals, including Palos Community Hospital and Advocate Christ Medical Center.
The city is also home to several corporate headquarters, including the headquarters of the American Academy of Pediatrics and the American College of Surgeons.
Demographics
As of the 2010 census, there were 12,515 people, 4,845 households, and 3,541 families residing in the city. The population density was 2,711.3 people per square mile. The racial makeup of the city was 87.2% White, 4.2% African American, 0.2% Native American, 4.7% Asian, 0.1% Pacific Islander, 1.7% from other races, and 2.1% from two or more races. Hispanic or Latino of any race were 6.3% of the population.
The median income for a household in the city was $68,945, and the median income for a family was $81,945. The per capita income for the city was $33,945. About 3.2% of families and 4.3% of the population were below the poverty line, including 5.2% of those under age 18 and 4.2% of those age 65 or over.
Common Questions
What is Per Capita Income in Palos Heights?
Per Capita income in Palos Heights is $53,296.
What is the Median Family Income in Palos Heights?
Median Family Income in Palos Heights is $127,589.
What is the Median Household income in Palos Heights?
Median Household Income in Palos Heights is $105,366.
What is Income or Wage Gap in Palos Heights?
Income or Wage Gap in Palos Heights is 38.3%.
Women in Palos Heights earn 61.7 cents for every dollar earned by a man.
What is Family Income Deficit in Palos Heights?
Family Income Deficit in Palos Heights is $9,195.
Families that are below poverty line in Palos Heights earn $9,195 less on average than the poverty threshold level.
What is Inequality or Gini Index in Palos Heights?
Inequality or Gini Index in Palos Heights is 0.41.
What is the Total Population of Palos Heights?
Total Population of Palos Heights is 11,965.
What is the Total Male Population of Palos Heights?
Total Male Population of Palos Heights is 5,883.
What is the Total Female Population of Palos Heights?
Total Female Population of Palos Heights is 6,082.
What is the Ratio of Males per 100 Females in Palos Heights?
There are 96.73 Males per 100 Females in Palos Heights.
What is the Ratio of Females per 100 Males in Palos Heights?
There are 103.38 Females per 100 Males in Palos Heights.
What is the Median Population Age in Palos Heights?
Median Population Age in Palos Heights is 51.5 Years.
What is the Average Family Size in Palos Heights
Average Family Size in Palos Heights is 3.0 People.
What is the Average Household Size in Palos Heights
Average Household Size in Palos Heights is 2.5 People.
How Large is the Labor Force in Palos Heights?
There are 5,528 People in the Labor Forcein in Palos Heights.
What is the Percentage of People in the Labor Force in Palos Heights?
54.5% of People are in the Labor Force in Palos Heights.
What is the Unemployment Rate in Palos Heights?
Unemployment Rate in Palos Heights is 3.6%.