Grand Blanc, MI Map & Demographics
Grand Blanc Map
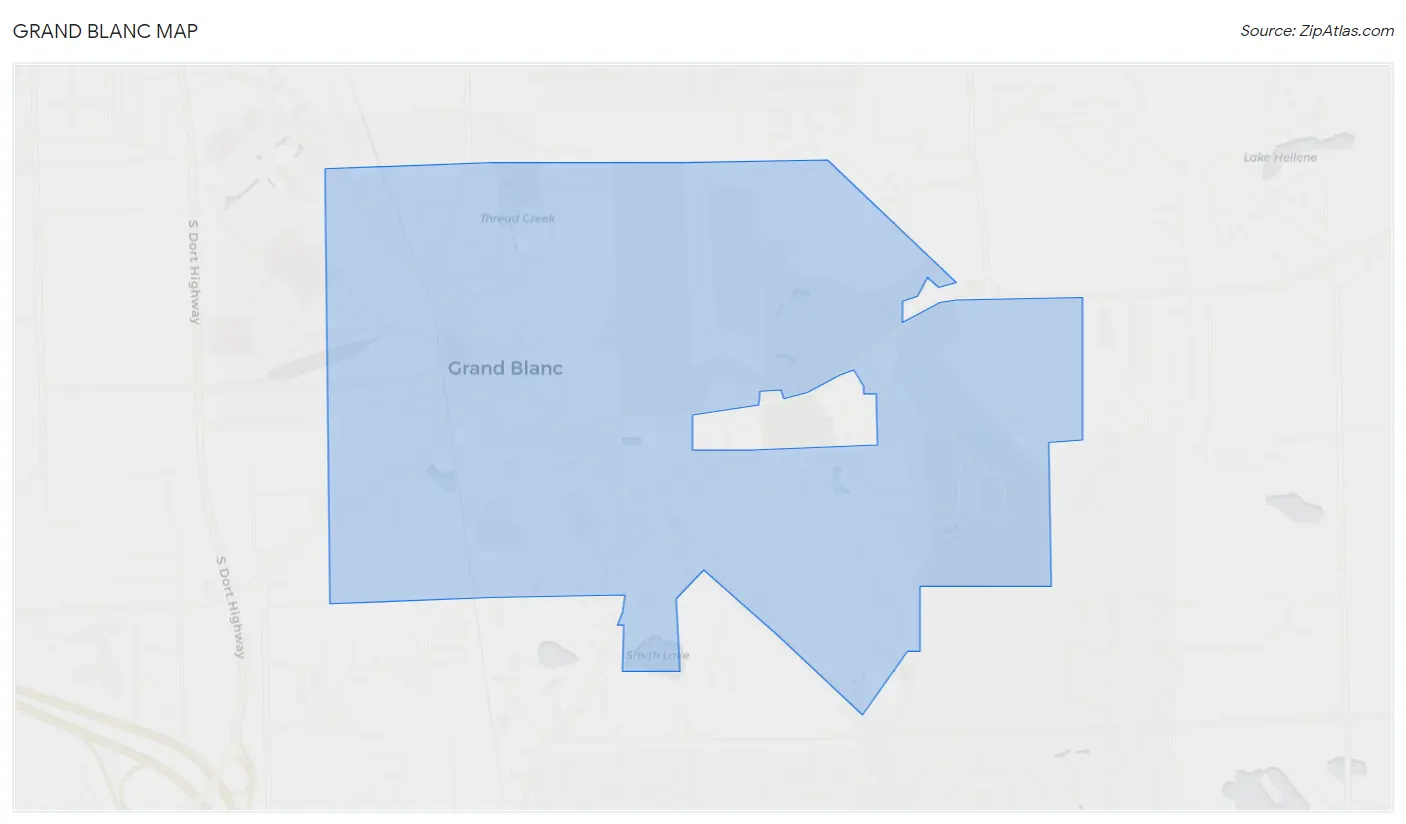
Grand Blanc Overview
$44,504
PER CAPITA INCOME
$105,395
AVG FAMILY INCOME
$70,518
AVG HOUSEHOLD INCOME
15.5%
WAGE / INCOME GAP [ % ]
84.5¢/ $1
WAGE / INCOME GAP [ $ ]
0.48
INEQUALITY / GINI INDEX
8,034
TOTAL POPULATION
4,194
MALE POPULATION
3,840
FEMALE POPULATION
109.22
MALES / 100 FEMALES
91.56
FEMALES / 100 MALES
38.3
MEDIAN AGE
3.1
AVG FAMILY SIZE
2.3
AVG HOUSEHOLD SIZE
3,911
LABOR FORCE [ PEOPLE ]
60.3%
PERCENT IN LABOR FORCE
5.8%
UNEMPLOYMENT RATE
Grand Blanc Zip Codes
Grand Blanc Area Codes
Income in Grand Blanc
Income Overview in Grand Blanc
Per Capita Income in Grand Blanc is $44,504, while median incomes of families and households are $105,395 and $70,518 respectively.
| Characteristic | Number | Measure |
| Per Capita Income | 8,034 | $44,504 |
| Median Family Income | 1,958 | $105,395 |
| Mean Family Income | 1,958 | $129,819 |
| Median Household Income | 3,494 | $70,518 |
| Mean Household Income | 3,494 | $100,414 |
| Income Deficit | 1,958 | $0 |
| Wage / Income Gap (%) | 8,034 | 15.49% |
| Wage / Income Gap ($) | 8,034 | 84.51¢ per $1 |
| Gini / Inequality Index | 8,034 | 0.48 |
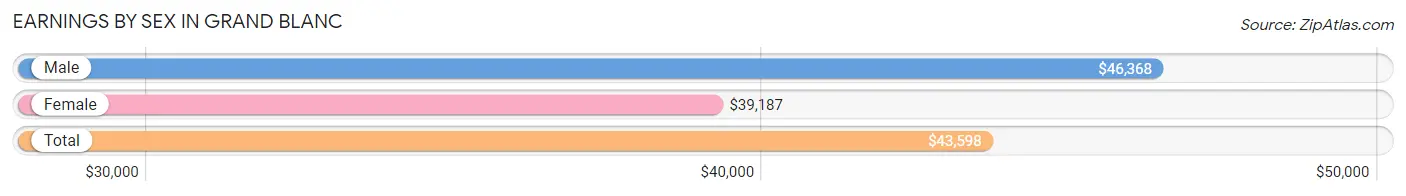
Earnings by Sex in Grand Blanc
Average Earnings in Grand Blanc are $43,598, $46,368 for men and $39,187 for women, a difference of 15.5%.
| Sex | Number | Average Earnings |
| Male | 2,223 (56.9%) | $46,368 |
| Female | 1,681 (43.1%) | $39,187 |
| Total | 3,904 (100.0%) | $43,598 |
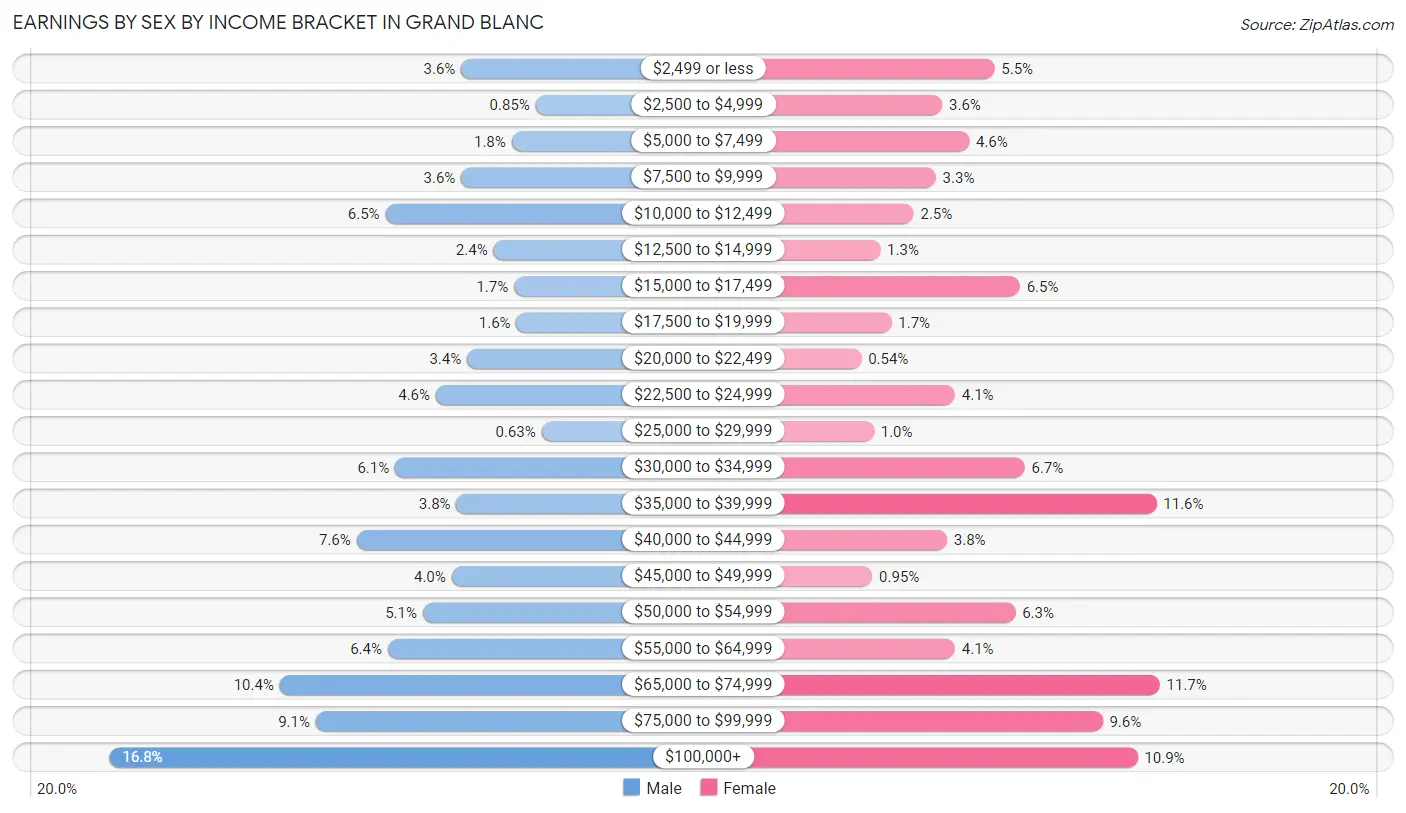
Earnings by Sex by Income Bracket in Grand Blanc
The most common earnings brackets in Grand Blanc are $100,000+ for men (374 | 16.8%) and $65,000 to $74,999 for women (197 | 11.7%).
| Income | Male | Female |
| $2,499 or less | 81 (3.6%) | 93 (5.5%) |
| $2,500 to $4,999 | 19 (0.9%) | 60 (3.6%) |
| $5,000 to $7,499 | 39 (1.8%) | 77 (4.6%) |
| $7,500 to $9,999 | 81 (3.6%) | 56 (3.3%) |
| $10,000 to $12,499 | 144 (6.5%) | 42 (2.5%) |
| $12,500 to $14,999 | 54 (2.4%) | 21 (1.3%) |
| $15,000 to $17,499 | 37 (1.7%) | 109 (6.5%) |
| $17,500 to $19,999 | 35 (1.6%) | 28 (1.7%) |
| $20,000 to $22,499 | 76 (3.4%) | 9 (0.5%) |
| $22,500 to $24,999 | 102 (4.6%) | 68 (4.1%) |
| $25,000 to $29,999 | 14 (0.6%) | 17 (1.0%) |
| $30,000 to $34,999 | 136 (6.1%) | 112 (6.7%) |
| $35,000 to $39,999 | 85 (3.8%) | 195 (11.6%) |
| $40,000 to $44,999 | 168 (7.6%) | 63 (3.7%) |
| $45,000 to $49,999 | 89 (4.0%) | 16 (0.9%) |
| $50,000 to $54,999 | 113 (5.1%) | 106 (6.3%) |
| $55,000 to $64,999 | 142 (6.4%) | 68 (4.1%) |
| $65,000 to $74,999 | 232 (10.4%) | 197 (11.7%) |
| $75,000 to $99,999 | 202 (9.1%) | 161 (9.6%) |
| $100,000+ | 374 (16.8%) | 183 (10.9%) |
| Total | 2,223 (100.0%) | 1,681 (100.0%) |
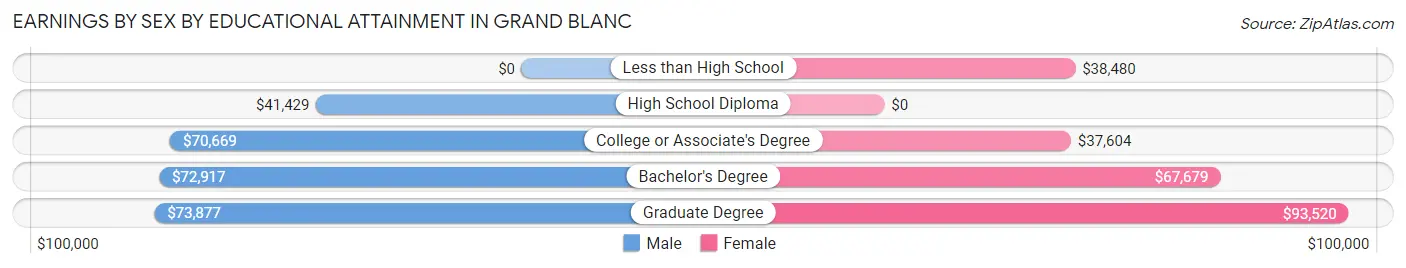
Earnings by Sex by Educational Attainment in Grand Blanc
Average earnings in Grand Blanc are $60,194 for men and $50,000 for women, a difference of 16.9%. Men with an educational attainment of graduate degree enjoy the highest average annual earnings of $73,877, while those with high school diploma education earn the least with $41,429. Women with an educational attainment of graduate degree earn the most with the average annual earnings of $93,520, while those with college or associate's degree education have the smallest earnings of $37,604.
| Educational Attainment | Male Income | Female Income |
| Less than High School | - | - |
| High School Diploma | $41,429 | $0 |
| College or Associate's Degree | $70,669 | $37,604 |
| Bachelor's Degree | $72,917 | $67,679 |
| Graduate Degree | $73,877 | $93,520 |
| Total | $60,194 | $50,000 |
Family Income in Grand Blanc
Family Income Brackets in Grand Blanc
According to the Grand Blanc family income data, there are 511 families falling into the $100,000 to $149,999 income range, which is the most common income bracket and makes up 26.1% of all families. Conversely, the $10,000 to $14,999 income bracket is the least frequent group with only 27 families (1.4%) belonging to this category.
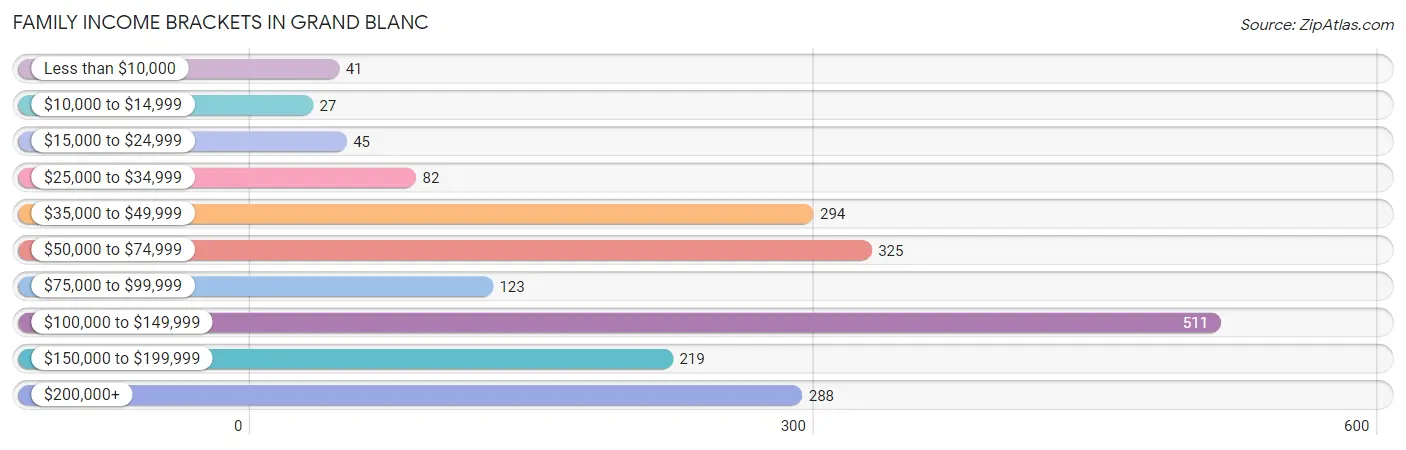
| Income Bracket | # Families | % Families |
| Less than $10,000 | 41 | 2.1% |
| $10,000 to $14,999 | 27 | 1.4% |
| $15,000 to $24,999 | 45 | 2.3% |
| $25,000 to $34,999 | 82 | 4.2% |
| $35,000 to $49,999 | 294 | 15.0% |
| $50,000 to $74,999 | 325 | 16.6% |
| $75,000 to $99,999 | 123 | 6.3% |
| $100,000 to $149,999 | 511 | 26.1% |
| $150,000 to $199,999 | 219 | 11.2% |
| $200,000+ | 288 | 14.7% |
Family Income by Famaliy Size in Grand Blanc
4-person families (369 | 18.9%) account for the highest median family income in Grand Blanc with $162,404 per family, while 2-person families (835 | 42.6%) have the highest median income of $41,625 per family member.
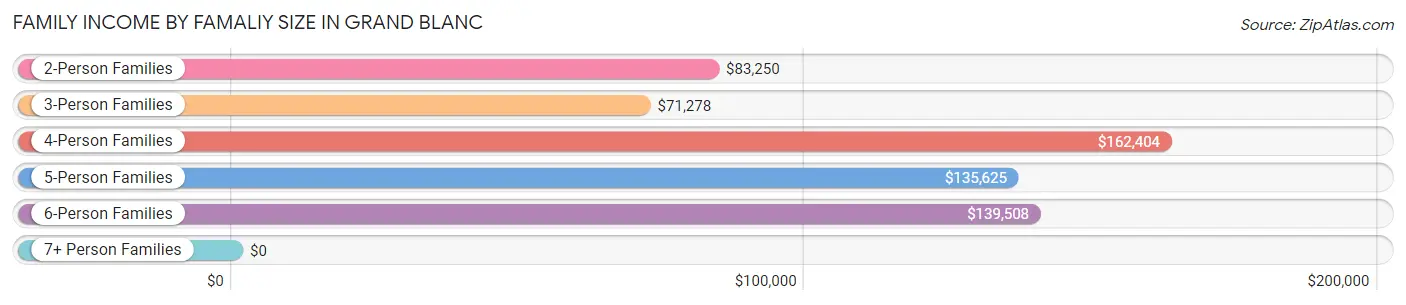
| Income Bracket | # Families | Median Income |
| 2-Person Families | 835 (42.6%) | $83,250 |
| 3-Person Families | 536 (27.4%) | $71,278 |
| 4-Person Families | 369 (18.9%) | $162,404 |
| 5-Person Families | 129 (6.6%) | $135,625 |
| 6-Person Families | 53 (2.7%) | $139,508 |
| 7+ Person Families | 36 (1.8%) | $0 |
| Total | 1,958 (100.0%) | $105,395 |
Family Income by Number of Earners in Grand Blanc
The median family income in Grand Blanc is $105,395, with families comprising 3+ earners (294) having the highest median family income of $171,667, while families with no earners (425) have the lowest median family income of $36,684, accounting for 15.0% and 21.7% of families, respectively.
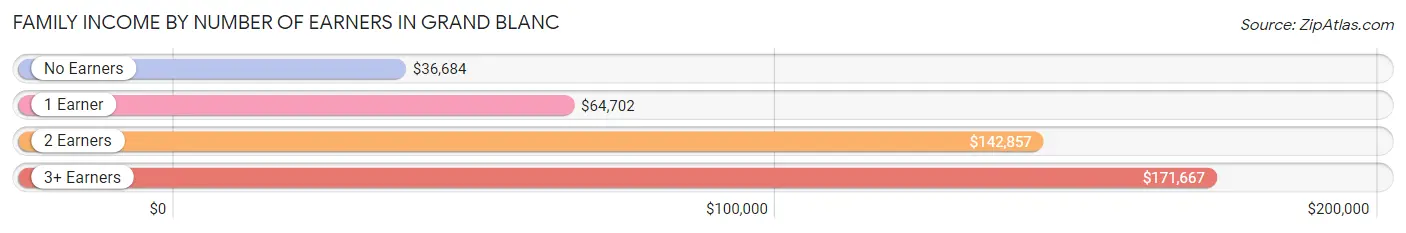
| Number of Earners | # Families | Median Income |
| No Earners | 425 (21.7%) | $36,684 |
| 1 Earner | 593 (30.3%) | $64,702 |
| 2 Earners | 646 (33.0%) | $142,857 |
| 3+ Earners | 294 (15.0%) | $171,667 |
| Total | 1,958 (100.0%) | $105,395 |
Household Income in Grand Blanc
Household Income Brackets in Grand Blanc
With 681 households falling in the category, the $100,000 to $149,999 income range is the most frequent in Grand Blanc, accounting for 19.5% of all households. In contrast, only 91 households (2.6%) fall into the $10,000 to $14,999 income bracket, making it the least populous group.
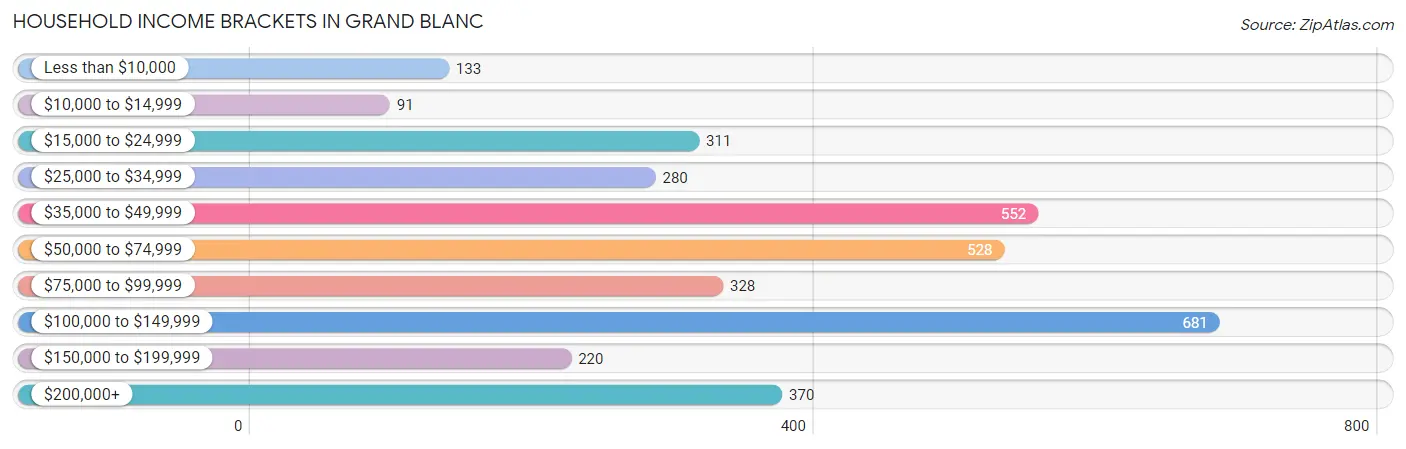
| Income Bracket | # Households | % Households |
| Less than $10,000 | 133 | 3.8% |
| $10,000 to $14,999 | 91 | 2.6% |
| $15,000 to $24,999 | 311 | 8.9% |
| $25,000 to $34,999 | 280 | 8.0% |
| $35,000 to $49,999 | 552 | 15.8% |
| $50,000 to $74,999 | 528 | 15.1% |
| $75,000 to $99,999 | 328 | 9.4% |
| $100,000 to $149,999 | 681 | 19.5% |
| $150,000 to $199,999 | 220 | 6.3% |
| $200,000+ | 370 | 10.6% |
Household Income by Householder Age in Grand Blanc
The median household income in Grand Blanc is $70,518, with the highest median household income of $95,289 found in the 25 to 44 years age bracket for the primary householder. A total of 948 households (27.1%) fall into this category. Meanwhile, the 15 to 24 years age bracket for the primary householder has the lowest median household income of $34,421, with 207 households (5.9%) in this group.
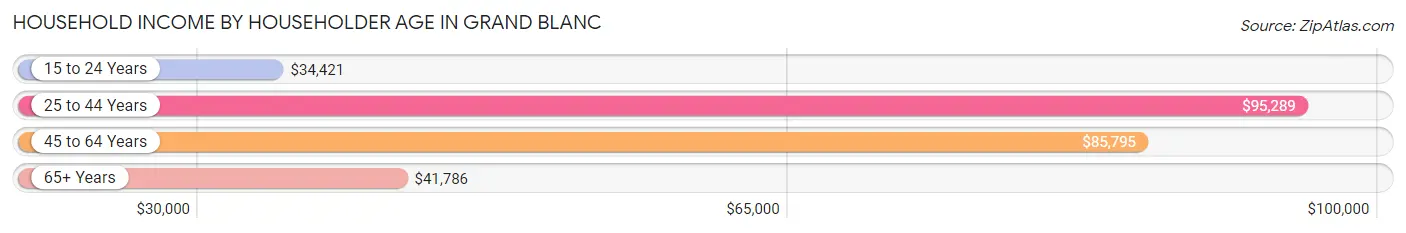
| Income Bracket | # Households | Median Income |
| 15 to 24 Years | 207 (5.9%) | $34,421 |
| 25 to 44 Years | 948 (27.1%) | $95,289 |
| 45 to 64 Years | 1,363 (39.0%) | $85,795 |
| 65+ Years | 976 (27.9%) | $41,786 |
| Total | 3,494 (100.0%) | $70,518 |
Poverty in Grand Blanc
Income Below Poverty by Sex and Age in Grand Blanc
With 7.1% poverty level for males and 9.4% for females among the residents of Grand Blanc, under 5 year old males and 15 year old females are the most vulnerable to poverty, with 48 males (17.4%) and 32 females (30.5%) in their respective age groups living below the poverty level.
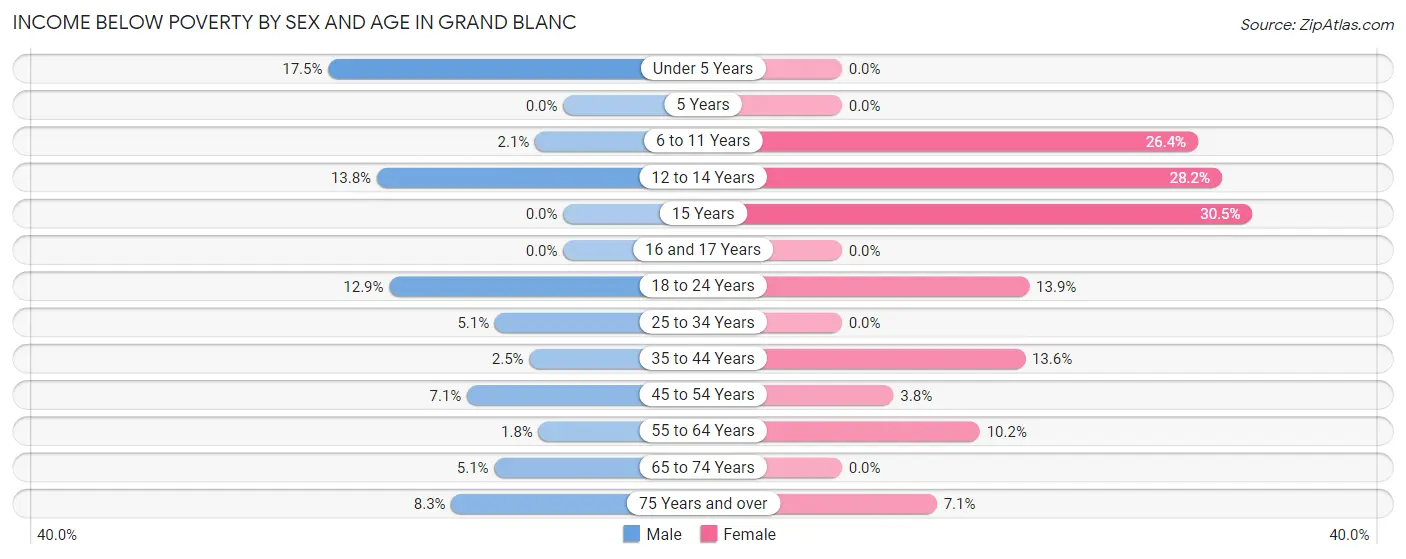
| Age Bracket | Male | Female |
| Under 5 Years | 48 (17.4%) | 0 (0.0%) |
| 5 Years | 0 (0.0%) | 0 (0.0%) |
| 6 to 11 Years | 6 (2.1%) | 69 (26.4%) |
| 12 to 14 Years | 22 (13.8%) | 55 (28.2%) |
| 15 Years | 0 (0.0%) | 32 (30.5%) |
| 16 and 17 Years | 0 (0.0%) | 0 (0.0%) |
| 18 to 24 Years | 97 (12.9%) | 42 (13.9%) |
| 25 to 34 Years | 25 (5.1%) | 0 (0.0%) |
| 35 to 44 Years | 6 (2.5%) | 54 (13.6%) |
| 45 to 54 Years | 38 (7.1%) | 24 (3.8%) |
| 55 to 64 Years | 9 (1.8%) | 52 (10.2%) |
| 65 to 74 Years | 15 (5.1%) | 0 (0.0%) |
| 75 Years and over | 29 (8.3%) | 26 (7.0%) |
| Total | 295 (7.1%) | 354 (9.4%) |
Income Above Poverty by Sex and Age in Grand Blanc
According to the poverty statistics in Grand Blanc, males aged 5 years and females aged under 5 years are the age groups that are most secure financially, with 100.0% of males and 100.0% of females in these age groups living above the poverty line.
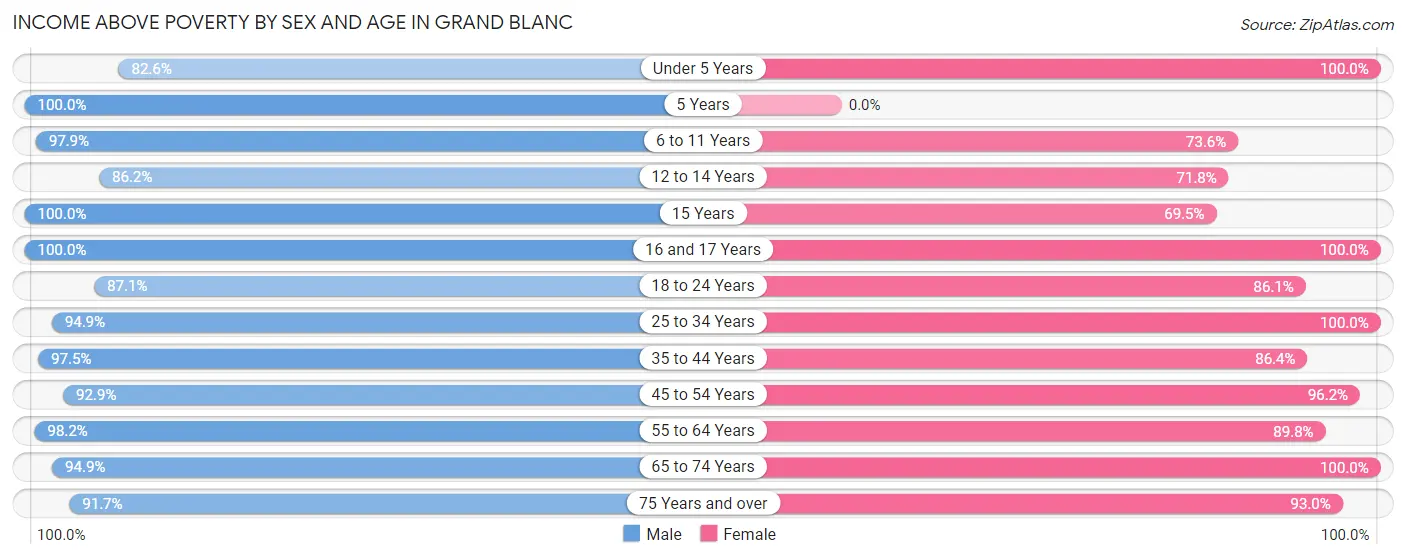
| Age Bracket | Male | Female |
| Under 5 Years | 227 (82.6%) | 141 (100.0%) |
| 5 Years | 12 (100.0%) | 0 (0.0%) |
| 6 to 11 Years | 281 (97.9%) | 192 (73.6%) |
| 12 to 14 Years | 137 (86.2%) | 140 (71.8%) |
| 15 Years | 113 (100.0%) | 73 (69.5%) |
| 16 and 17 Years | 157 (100.0%) | 100 (100.0%) |
| 18 to 24 Years | 654 (87.1%) | 260 (86.1%) |
| 25 to 34 Years | 468 (94.9%) | 471 (100.0%) |
| 35 to 44 Years | 232 (97.5%) | 343 (86.4%) |
| 45 to 54 Years | 494 (92.9%) | 602 (96.2%) |
| 55 to 64 Years | 482 (98.2%) | 456 (89.8%) |
| 65 to 74 Years | 278 (94.9%) | 294 (100.0%) |
| 75 Years and over | 320 (91.7%) | 343 (92.9%) |
| Total | 3,855 (92.9%) | 3,415 (90.6%) |
Income Below Poverty Among Married-Couple Families in Grand Blanc
The poverty statistics for married-couple families in Grand Blanc show that 2.0% or 26 of the total 1,318 families live below the poverty line. Families with 3 or 4 children have the highest poverty rate of 13.5%, comprising of 26 families. On the other hand, families with no children have the lowest poverty rate of 0.0%, which includes 0 families.
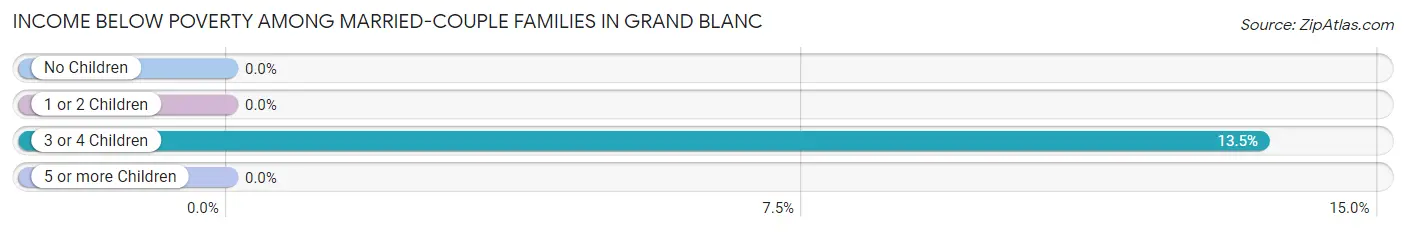
| Children | Above Poverty | Below Poverty |
| No Children | 730 (100.0%) | 0 (0.0%) |
| 1 or 2 Children | 395 (100.0%) | 0 (0.0%) |
| 3 or 4 Children | 167 (86.5%) | 26 (13.5%) |
| 5 or more Children | 0 (0.0%) | 0 (0.0%) |
| Total | 1,292 (98.0%) | 26 (2.0%) |
Income Below Poverty Among Single-Parent Households in Grand Blanc
According to the poverty data in Grand Blanc, 10.0% or 12 single-father households and 9.2% or 48 single-mother households are living below the poverty line. Among single-father households, those with no children have the highest poverty rate, with 12 households (11.9%) experiencing poverty. Likewise, among single-mother households, those with 3 or 4 children have the highest poverty rate, with 18 households (85.7%) falling below the poverty line.
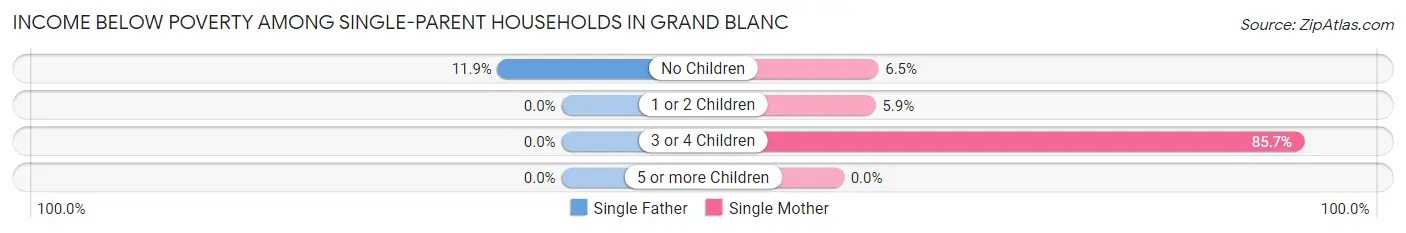
| Children | Single Father | Single Mother |
| No Children | 12 (11.9%) | 6 (6.5%) |
| 1 or 2 Children | 0 (0.0%) | 24 (5.9%) |
| 3 or 4 Children | 0 (0.0%) | 18 (85.7%) |
| 5 or more Children | 0 (0.0%) | 0 (0.0%) |
| Total | 12 (10.0%) | 48 (9.2%) |
Income Below Poverty Among Married-Couple vs Single-Parent Households in Grand Blanc
The poverty data for Grand Blanc shows that 26 of the married-couple family households (2.0%) and 60 of the single-parent households (9.4%) are living below the poverty level. Within the married-couple family households, those with 3 or 4 children have the highest poverty rate, with 26 households (13.5%) falling below the poverty line. Among the single-parent households, those with 3 or 4 children have the highest poverty rate, with 18 household (85.7%) living below poverty.
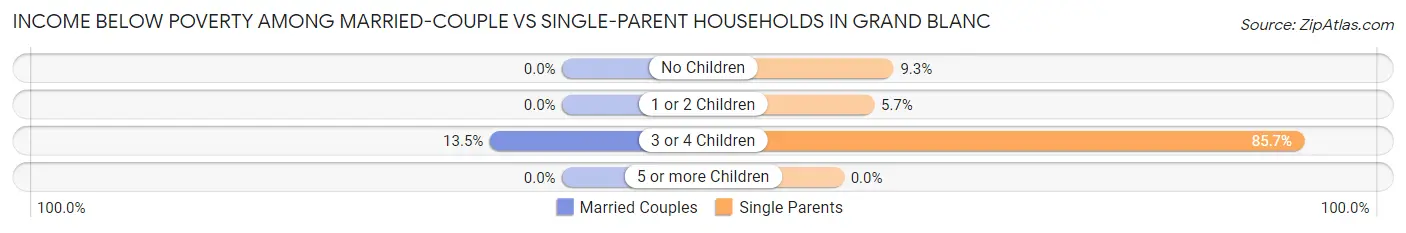
| Children | Married-Couple Families | Single-Parent Households |
| No Children | 0 (0.0%) | 18 (9.3%) |
| 1 or 2 Children | 0 (0.0%) | 24 (5.7%) |
| 3 or 4 Children | 26 (13.5%) | 18 (85.7%) |
| 5 or more Children | 0 (0.0%) | 0 (0.0%) |
| Total | 26 (2.0%) | 60 (9.4%) |
Race in Grand Blanc
The most populous races in Grand Blanc are White / Caucasian (6,195 | 77.1%), Black / African American (1,269 | 15.8%), and Two or more Races (406 | 5.1%).
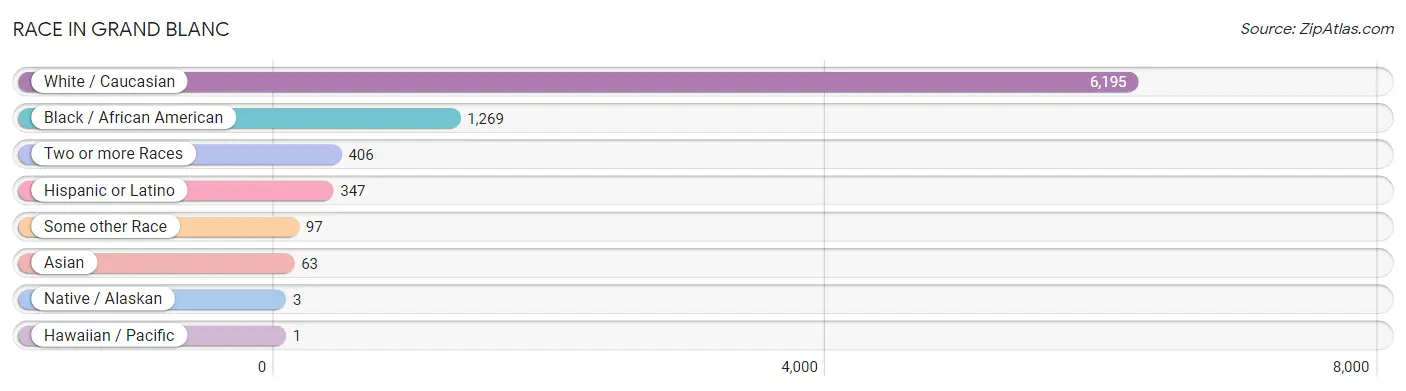
| Race | # Population | % Population |
| Asian | 63 | 0.8% |
| Black / African American | 1,269 | 15.8% |
| Hawaiian / Pacific | 1 | 0.0% |
| Hispanic or Latino | 347 | 4.3% |
| Native / Alaskan | 3 | 0.0% |
| White / Caucasian | 6,195 | 77.1% |
| Two or more Races | 406 | 5.1% |
| Some other Race | 97 | 1.2% |
| Total | 8,034 | 100.0% |
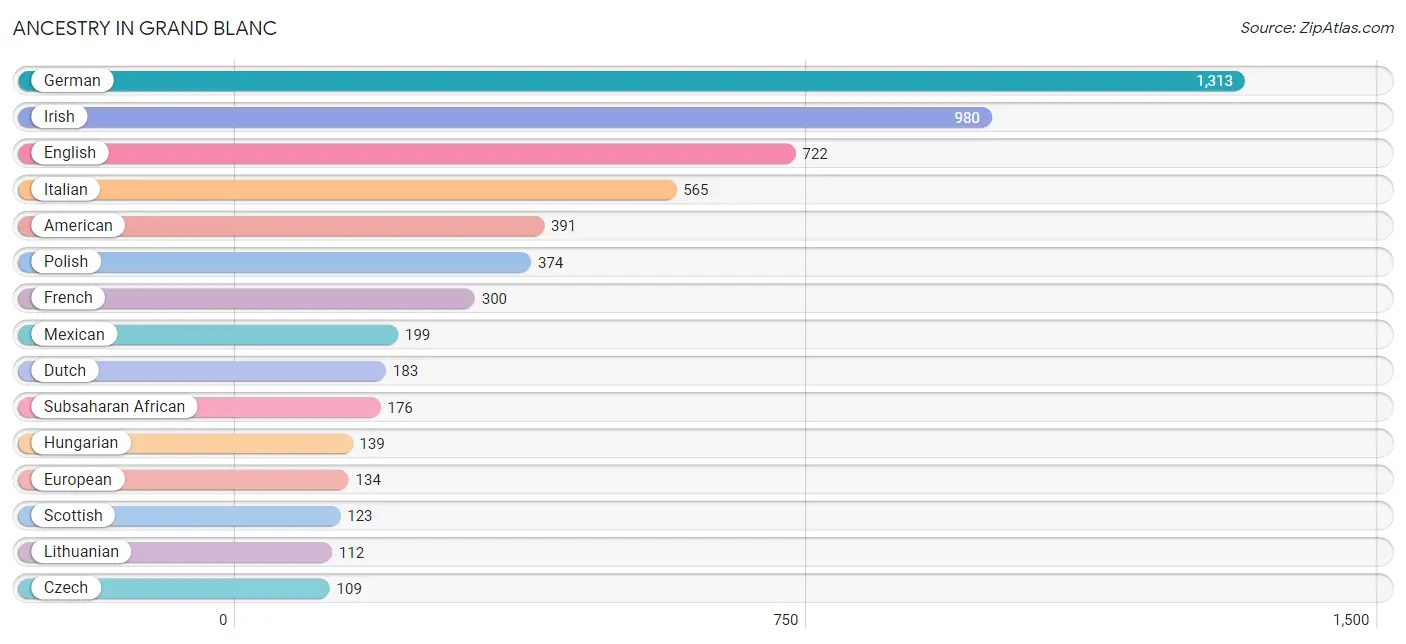
Ancestry in Grand Blanc
The most populous ancestries reported in Grand Blanc are German (1,313 | 16.3%), Irish (980 | 12.2%), English (722 | 9.0%), Italian (565 | 7.0%), and American (391 | 4.9%), together accounting for 49.4% of all Grand Blanc residents.
| Ancestry | # Population | % Population |
| American | 391 | 4.9% |
| Apache | 94 | 1.2% |
| Arab | 54 | 0.7% |
| Assyrian / Chaldean / Syriac | 20 | 0.3% |
| Austrian | 25 | 0.3% |
| Belgian | 5 | 0.1% |
| British | 40 | 0.5% |
| Bulgarian | 5 | 0.1% |
| Celtic | 6 | 0.1% |
| Cherokee | 3 | 0.0% |
| Croatian | 75 | 0.9% |
| Czech | 109 | 1.4% |
| Czechoslovakian | 5 | 0.1% |
| Danish | 39 | 0.5% |
| Dutch | 183 | 2.3% |
| Eastern European | 32 | 0.4% |
| Egyptian | 29 | 0.4% |
| English | 722 | 9.0% |
| European | 134 | 1.7% |
| Finnish | 26 | 0.3% |
| French | 300 | 3.7% |
| French American Indian | 2 | 0.0% |
| French Canadian | 103 | 1.3% |
| German | 1,313 | 16.3% |
| Greek | 36 | 0.4% |
| Hungarian | 139 | 1.7% |
| Indian (Asian) | 63 | 0.8% |
| Irish | 980 | 12.2% |
| Italian | 565 | 7.0% |
| Korean | 6 | 0.1% |
| Lithuanian | 112 | 1.4% |
| Macedonian | 5 | 0.1% |
| Mexican | 199 | 2.5% |
| Nigerian | 79 | 1.0% |
| Norwegian | 41 | 0.5% |
| Polish | 374 | 4.7% |
| Puerto Rican | 69 | 0.9% |
| Russian | 5 | 0.1% |
| Samoan | 1 | 0.0% |
| Scotch-Irish | 84 | 1.1% |
| Scottish | 123 | 1.5% |
| Slovak | 15 | 0.2% |
| Slovene | 10 | 0.1% |
| Spaniard | 79 | 1.0% |
| Subsaharan African | 176 | 2.2% |
| Sudanese | 97 | 1.2% |
| Swedish | 59 | 0.7% |
| Swiss | 14 | 0.2% |
| Trinidadian and Tobagonian | 9 | 0.1% |
| Welsh | 82 | 1.0% |
| Yugoslavian | 9 | 0.1% | View All 51 Rows |
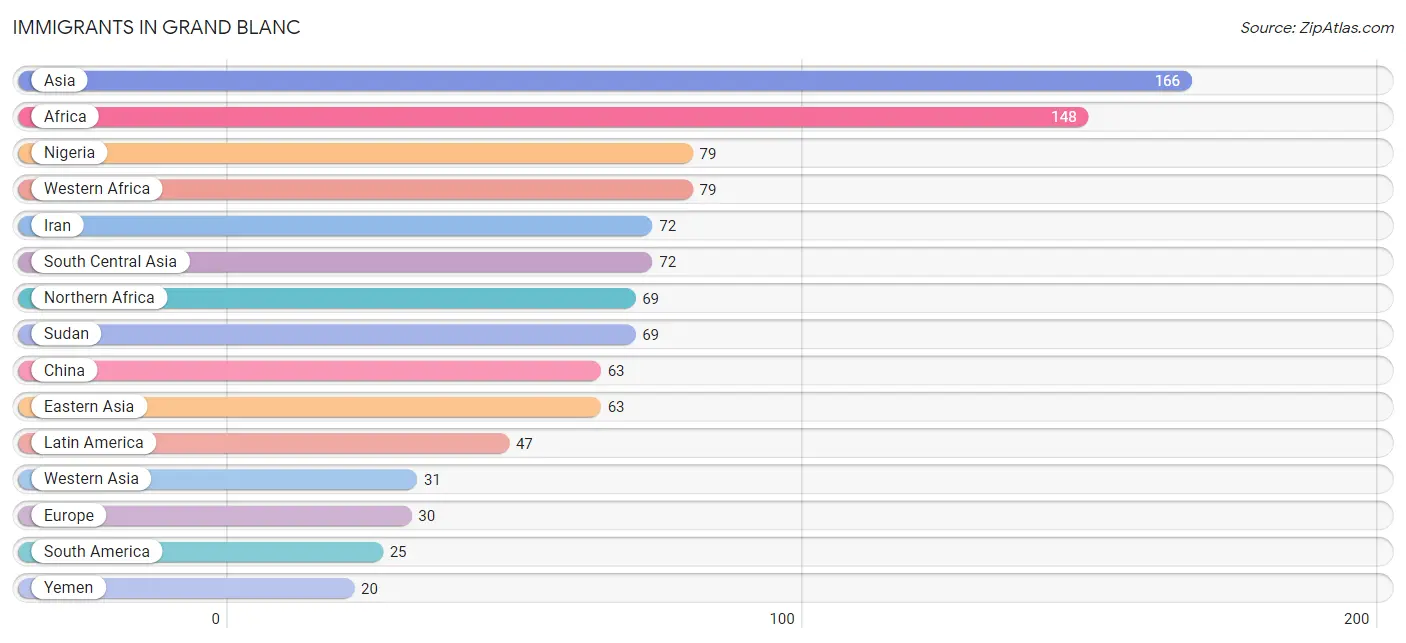
Immigrants in Grand Blanc
The most numerous immigrant groups reported in Grand Blanc came from Asia (166 | 2.1%), Africa (148 | 1.8%), Nigeria (79 | 1.0%), Western Africa (79 | 1.0%), and Iran (72 | 0.9%), together accounting for 6.8% of all Grand Blanc residents.
| Immigration Origin | # Population | % Population |
| Africa | 148 | 1.8% |
| Asia | 166 | 2.1% |
| Brazil | 12 | 0.2% |
| Caribbean | 18 | 0.2% |
| Central America | 4 | 0.1% |
| China | 63 | 0.8% |
| Colombia | 13 | 0.2% |
| Eastern Asia | 63 | 0.8% |
| Eastern Europe | 18 | 0.2% |
| Europe | 30 | 0.4% |
| Hong Kong | 11 | 0.1% |
| Iran | 72 | 0.9% |
| Latin America | 47 | 0.6% |
| Mexico | 4 | 0.1% |
| Moldova | 18 | 0.2% |
| Nigeria | 79 | 1.0% |
| Northern Africa | 69 | 0.9% |
| Northern Europe | 12 | 0.2% |
| Saudi Arabia | 11 | 0.1% |
| South America | 25 | 0.3% |
| South Central Asia | 72 | 0.9% |
| Sudan | 69 | 0.9% |
| Trinidad and Tobago | 18 | 0.2% |
| Western Africa | 79 | 1.0% |
| Western Asia | 31 | 0.4% |
| Yemen | 20 | 0.3% | View All 26 Rows |
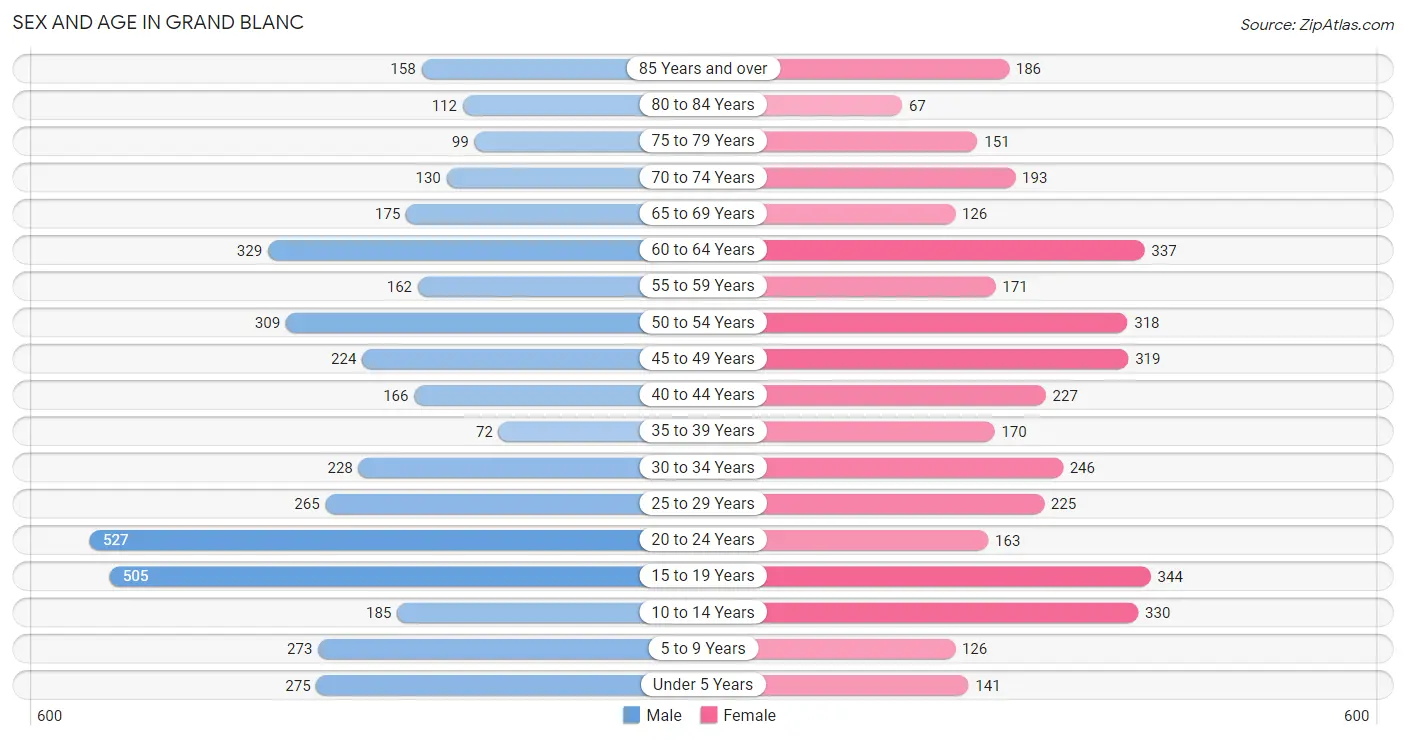
Sex and Age in Grand Blanc
Sex and Age in Grand Blanc
The most populous age groups in Grand Blanc are 20 to 24 Years (527 | 12.6%) for men and 15 to 19 Years (344 | 9.0%) for women.
| Age Bracket | Male | Female |
| Under 5 Years | 275 (6.6%) | 141 (3.7%) |
| 5 to 9 Years | 273 (6.5%) | 126 (3.3%) |
| 10 to 14 Years | 185 (4.4%) | 330 (8.6%) |
| 15 to 19 Years | 505 (12.0%) | 344 (9.0%) |
| 20 to 24 Years | 527 (12.6%) | 163 (4.2%) |
| 25 to 29 Years | 265 (6.3%) | 225 (5.9%) |
| 30 to 34 Years | 228 (5.4%) | 246 (6.4%) |
| 35 to 39 Years | 72 (1.7%) | 170 (4.4%) |
| 40 to 44 Years | 166 (4.0%) | 227 (5.9%) |
| 45 to 49 Years | 224 (5.3%) | 319 (8.3%) |
| 50 to 54 Years | 309 (7.4%) | 318 (8.3%) |
| 55 to 59 Years | 162 (3.9%) | 171 (4.4%) |
| 60 to 64 Years | 329 (7.8%) | 337 (8.8%) |
| 65 to 69 Years | 175 (4.2%) | 126 (3.3%) |
| 70 to 74 Years | 130 (3.1%) | 193 (5.0%) |
| 75 to 79 Years | 99 (2.4%) | 151 (3.9%) |
| 80 to 84 Years | 112 (2.7%) | 67 (1.7%) |
| 85 Years and over | 158 (3.8%) | 186 (4.8%) |
| Total | 4,194 (100.0%) | 3,840 (100.0%) |
Families and Households in Grand Blanc
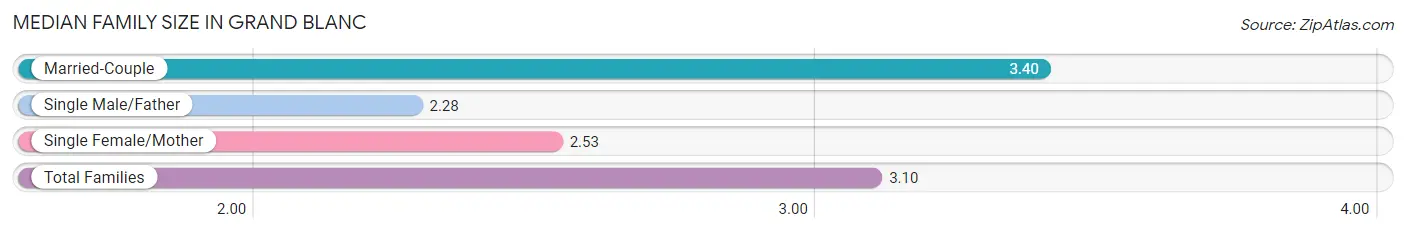
Median Family Size in Grand Blanc
The median family size in Grand Blanc is 3.10 persons per family, with married-couple families (1,318 | 67.3%) accounting for the largest median family size of 3.4 persons per family. On the other hand, single male/father families (120 | 6.1%) represent the smallest median family size with 2.28 persons per family.
| Family Type | # Families | Family Size |
| Married-Couple | 1,318 (67.3%) | 3.40 |
| Single Male/Father | 120 (6.1%) | 2.28 |
| Single Female/Mother | 520 (26.6%) | 2.53 |
| Total Families | 1,958 (100.0%) | 3.10 |
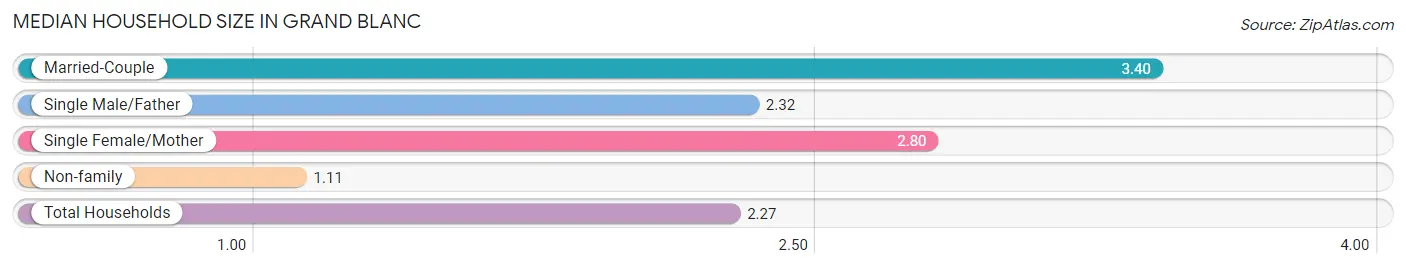
Median Household Size in Grand Blanc
The median household size in Grand Blanc is 2.27 persons per household, with married-couple households (1,318 | 37.7%) accounting for the largest median household size of 3.4 persons per household. non-family households (1,536 | 44.0%) represent the smallest median household size with 1.11 persons per household.
| Household Type | # Households | Household Size |
| Married-Couple | 1,318 (37.7%) | 3.40 |
| Single Male/Father | 120 (3.4%) | 2.32 |
| Single Female/Mother | 520 (14.9%) | 2.80 |
| Non-family | 1,536 (44.0%) | 1.11 |
| Total Households | 3,494 (100.0%) | 2.27 |
Household Size by Marriage Status in Grand Blanc
Out of a total of 3,494 households in Grand Blanc, 1,958 (56.0%) are family households, while 1,536 (44.0%) are nonfamily households. The most numerous type of family households are 2-person households, comprising 710, and the most common type of nonfamily households are 1-person households, comprising 1,393.
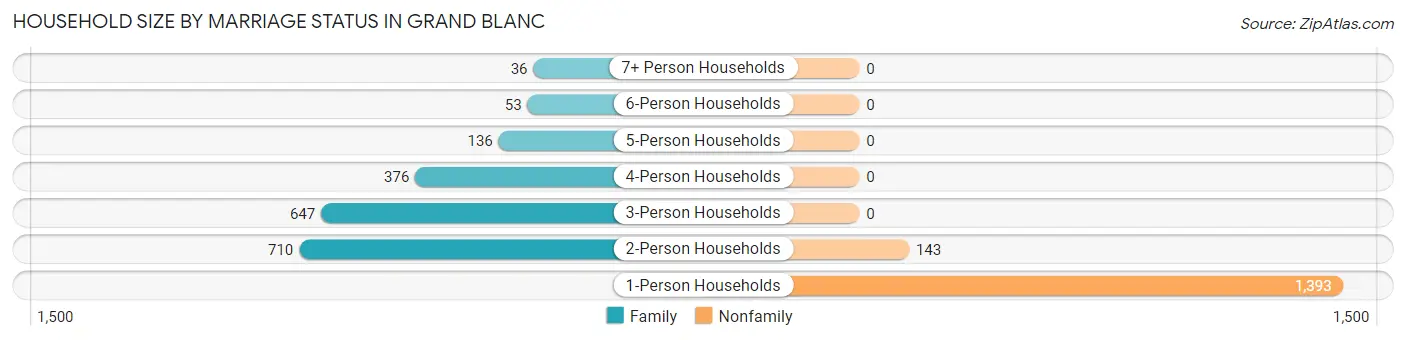
| Household Size | Family Households | Nonfamily Households |
| 1-Person Households | - | 1,393 (39.9%) |
| 2-Person Households | 710 (20.3%) | 143 (4.1%) |
| 3-Person Households | 647 (18.5%) | 0 (0.0%) |
| 4-Person Households | 376 (10.8%) | 0 (0.0%) |
| 5-Person Households | 136 (3.9%) | 0 (0.0%) |
| 6-Person Households | 53 (1.5%) | 0 (0.0%) |
| 7+ Person Households | 36 (1.0%) | 0 (0.0%) |
| Total | 1,958 (56.0%) | 1,536 (44.0%) |
Female Fertility in Grand Blanc
Fertility by Age in Grand Blanc
Average fertility rate in Grand Blanc is 52.0 births per 1,000 women. Women in the age bracket of 20 to 34 years have the highest fertility rate with 107.0 births per 1,000 women. Women in the age bracket of 20 to 34 years acount for 73.1% of all women with births.
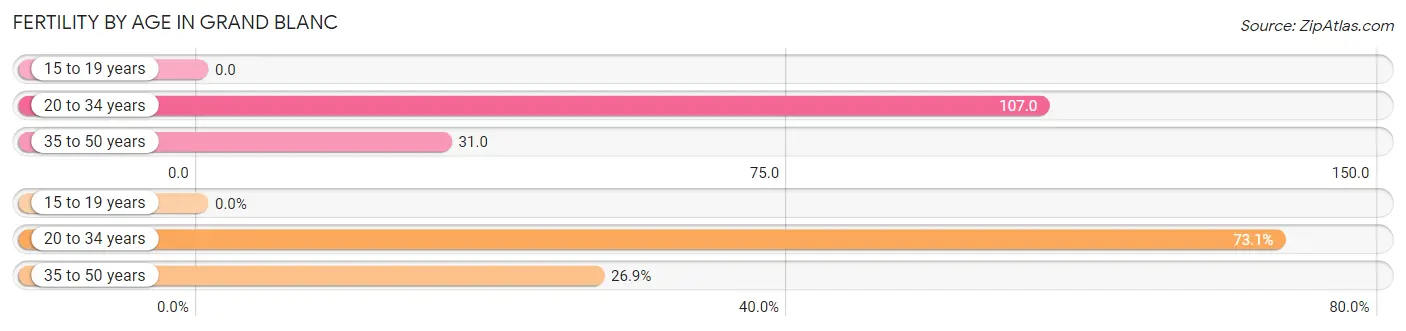
| Age Bracket | Women with Births | Births / 1,000 Women |
| 15 to 19 years | 0 (0.0%) | 0.0 |
| 20 to 34 years | 68 (73.1%) | 107.0 |
| 35 to 50 years | 25 (26.9%) | 31.0 |
| Total | 93 (100.0%) | 52.0 |
Fertility by Age by Marriage Status in Grand Blanc
96.8% of women with births (93) in Grand Blanc are married. The highest percentage of unmarried women with births falls into 35 to 50 years age bracket with 12.0% of them unmarried at the time of birth, while the lowest percentage of unmarried women with births belong to 20 to 34 years age bracket with 0.0% of them unmarried.
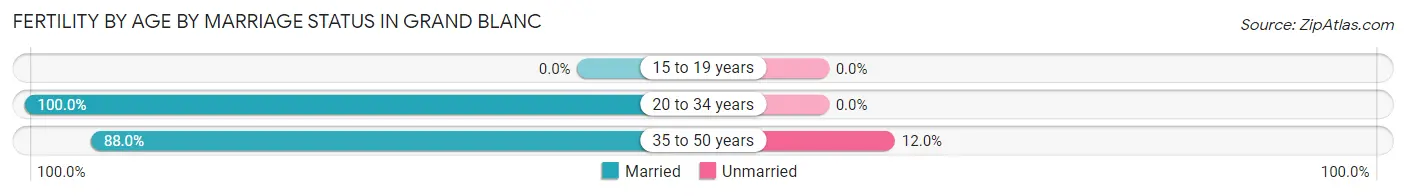
| Age Bracket | Married | Unmarried |
| 15 to 19 years | 0 (0.0%) | 0 (0.0%) |
| 20 to 34 years | 68 (100.0%) | 0 (0.0%) |
| 35 to 50 years | 22 (88.0%) | 3 (12.0%) |
| Total | 90 (96.8%) | 3 (3.2%) |
Fertility by Education in Grand Blanc
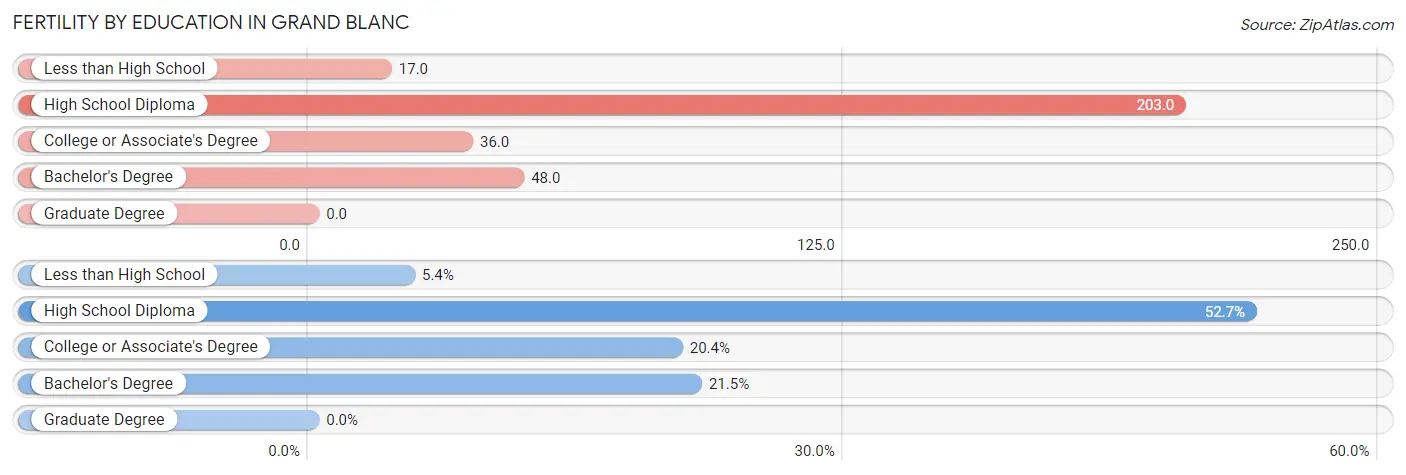
| Educational Attainment | Women with Births | Births / 1,000 Women |
| Less than High School | 5 (5.4%) | 17.0 |
| High School Diploma | 49 (52.7%) | 203.0 |
| College or Associate's Degree | 19 (20.4%) | 36.0 |
| Bachelor's Degree | 20 (21.5%) | 48.0 |
| Graduate Degree | 0 (0.0%) | 0.0 |
| Total | 93 (100.0%) | 52.0 |
Fertility by Education by Marriage Status in Grand Blanc
3.2% of women with births in Grand Blanc are unmarried. Women with the educational attainment of less than high school are most likely to be married with 100.0% of them married at childbirth, while women with the educational attainment of bachelor's degree are least likely to be married with 15.0% of them unmarried at childbirth.
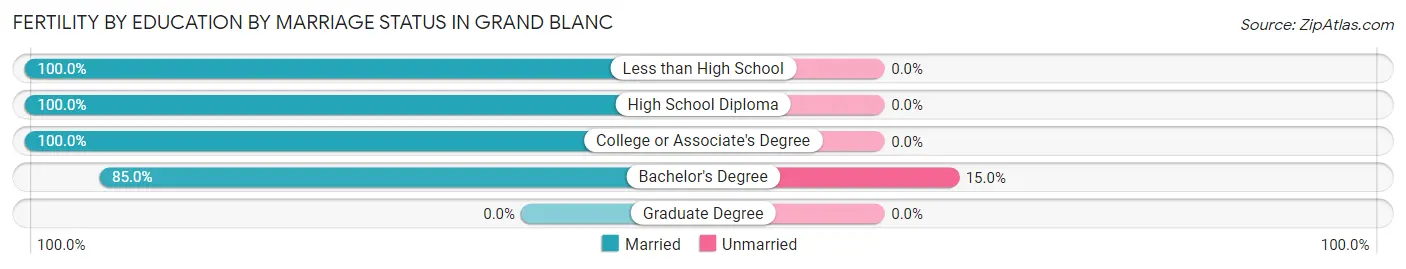
| Educational Attainment | Married | Unmarried |
| Less than High School | 5 (100.0%) | 0 (0.0%) |
| High School Diploma | 49 (100.0%) | 0 (0.0%) |
| College or Associate's Degree | 19 (100.0%) | 0 (0.0%) |
| Bachelor's Degree | 17 (85.0%) | 3 (15.0%) |
| Graduate Degree | 0 (0.0%) | 0 (0.0%) |
| Total | 90 (96.8%) | 3 (3.2%) |
Employment Characteristics in Grand Blanc
Employment by Class of Employer in Grand Blanc
Among the 3,606 employed individuals in Grand Blanc, private company employees (2,568 | 71.2%), local government employees (323 | 9.0%), and self-employed (not incorporated) (226 | 6.3%) make up the most common classes of employment.
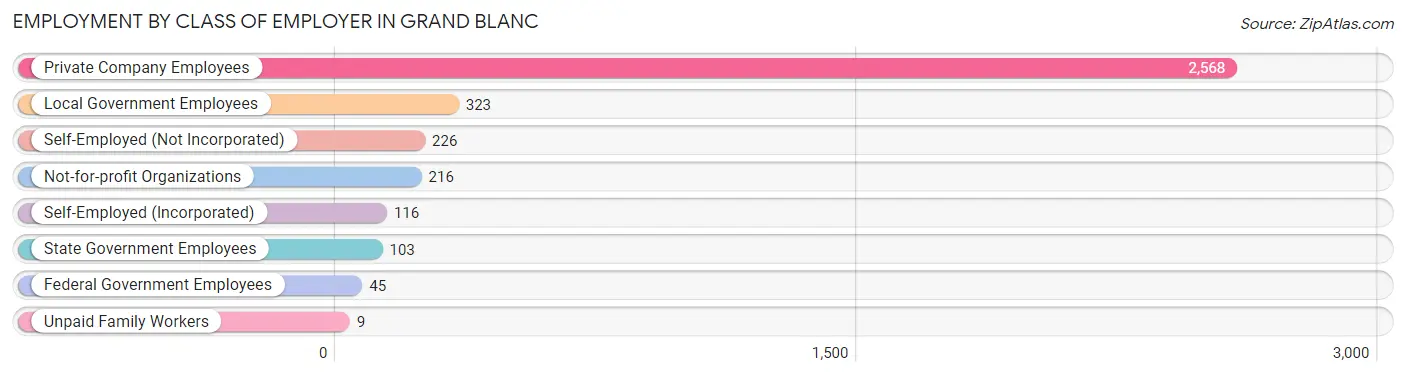
| Employer Class | # Employees | % Employees |
| Private Company Employees | 2,568 | 71.2% |
| Self-Employed (Incorporated) | 116 | 3.2% |
| Self-Employed (Not Incorporated) | 226 | 6.3% |
| Not-for-profit Organizations | 216 | 6.0% |
| Local Government Employees | 323 | 9.0% |
| State Government Employees | 103 | 2.9% |
| Federal Government Employees | 45 | 1.3% |
| Unpaid Family Workers | 9 | 0.3% |
| Total | 3,606 | 100.0% |
Employment Status by Age in Grand Blanc
According to the labor force statistics for Grand Blanc, out of the total population over 16 years of age (6,486), 60.3% or 3,911 individuals are in the labor force, with 5.8% or 227 of them unemployed. The age group with the highest labor force participation rate is 30 to 34 years, with 98.3% or 466 individuals in the labor force. Within the labor force, the 16 to 19 years age range has the highest percentage of unemployed individuals, with 27.0% or 51 of them being unemployed.
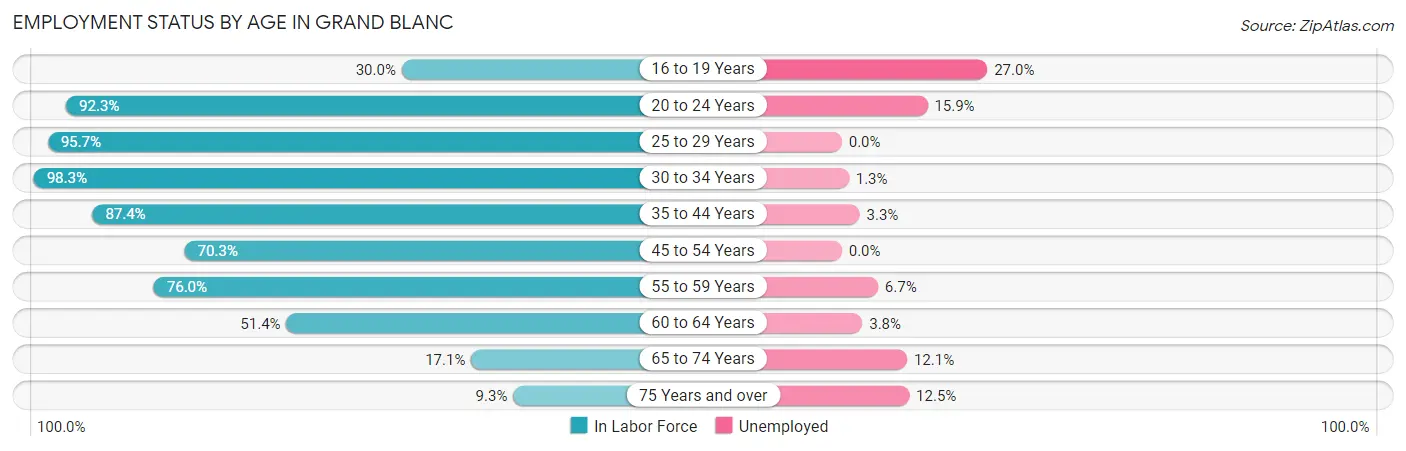
| Age Bracket | In Labor Force | Unemployed |
| 16 to 19 Years | 189 (30.0%) | 51 (27.0%) |
| 20 to 24 Years | 637 (92.3%) | 101 (15.9%) |
| 25 to 29 Years | 469 (95.7%) | 0 (0.0%) |
| 30 to 34 Years | 466 (98.3%) | 6 (1.3%) |
| 35 to 44 Years | 555 (87.4%) | 18 (3.3%) |
| 45 to 54 Years | 823 (70.3%) | 0 (0.0%) |
| 55 to 59 Years | 253 (76.0%) | 17 (6.7%) |
| 60 to 64 Years | 342 (51.4%) | 13 (3.8%) |
| 65 to 74 Years | 107 (17.1%) | 13 (12.1%) |
| 75 Years and over | 72 (9.3%) | 9 (12.5%) |
| Total | 3,911 (60.3%) | 227 (5.8%) |
Employment Status by Educational Attainment in Grand Blanc
According to labor force statistics for Grand Blanc, 77.2% of individuals (2,909) out of the total population between 25 and 64 years of age (3,768) are in the labor force, with 1.9% or 55 of them being unemployed. The group with the highest labor force participation rate are those with the educational attainment of college / associate degree, with 87.7% or 1,109 individuals in the labor force. Within the labor force, individuals with college / associate degree education have the highest percentage of unemployment, with 2.6% or 29 of them being unemployed.
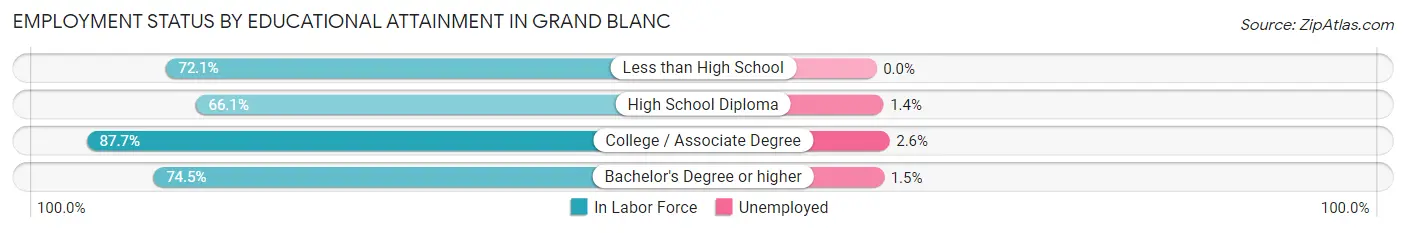
| Educational Attainment | In Labor Force | Unemployed |
| Less than High School | 124 (72.1%) | 0 (0.0%) |
| High School Diploma | 491 (66.1%) | 10 (1.4%) |
| College / Associate Degree | 1,109 (87.7%) | 33 (2.6%) |
| Bachelor's Degree or higher | 1,184 (74.5%) | 24 (1.5%) |
| Total | 2,909 (77.2%) | 72 (1.9%) |
Employment Occupations by Sex in Grand Blanc
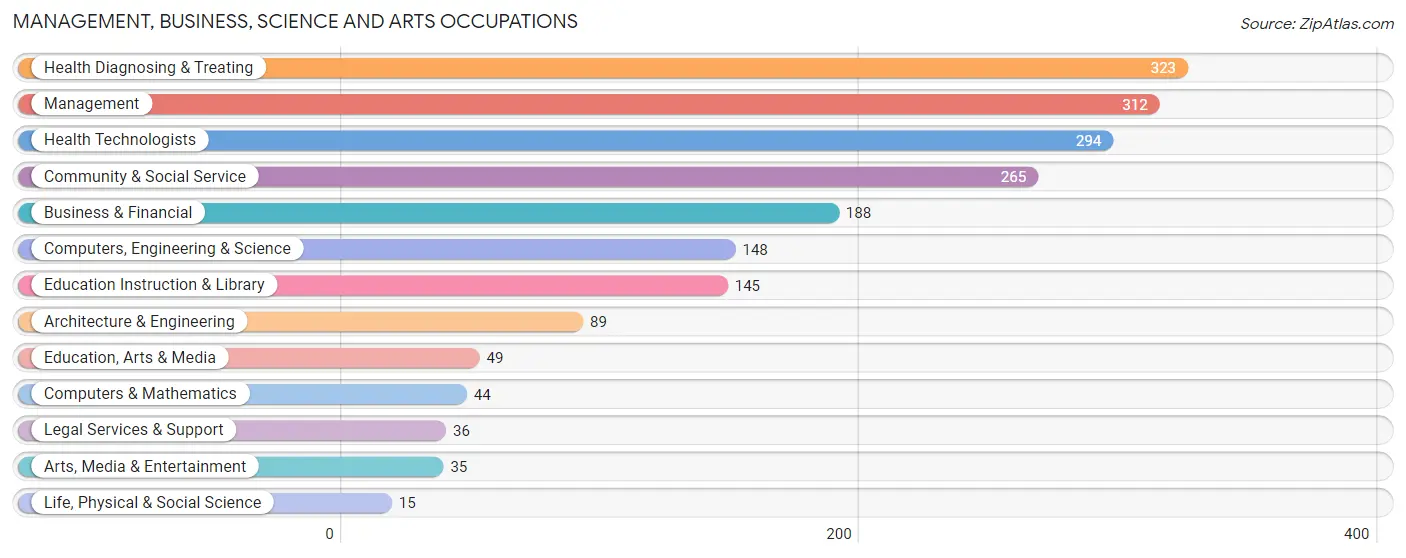
Management, Business, Science and Arts Occupations
The most common Management, Business, Science and Arts occupations in Grand Blanc are Health Diagnosing & Treating (323 | 8.8%), Management (312 | 8.5%), Health Technologists (294 | 8.0%), Community & Social Service (265 | 7.2%), and Business & Financial (188 | 5.1%).
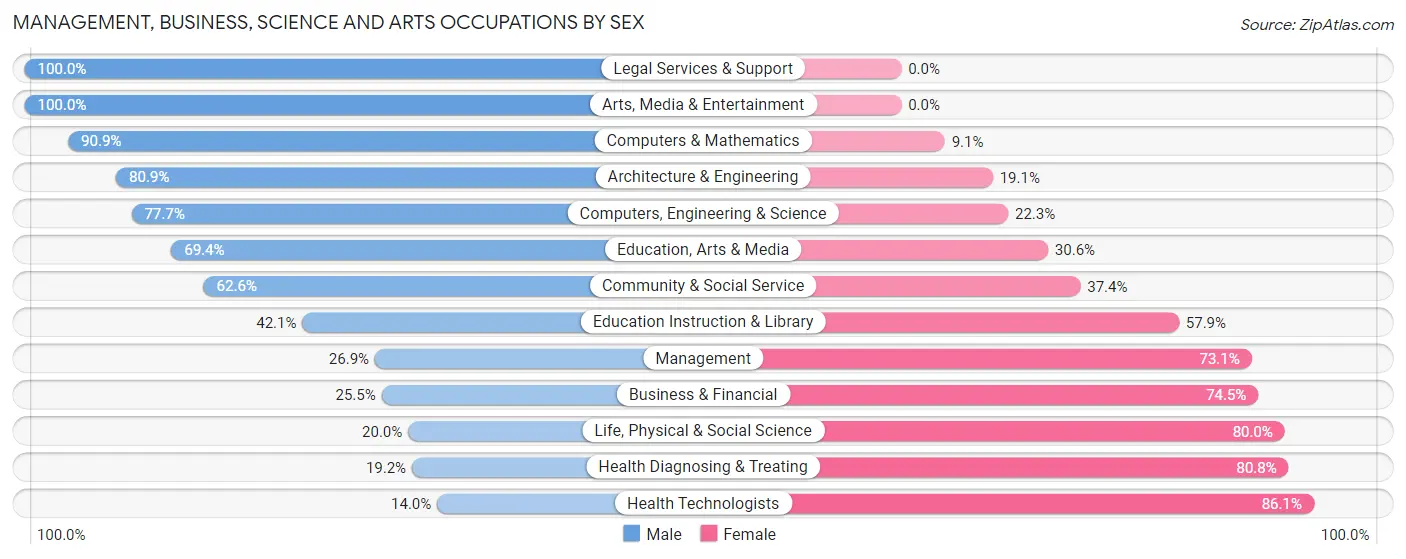
Management, Business, Science and Arts Occupations by Sex
Within the Management, Business, Science and Arts occupations in Grand Blanc, the most male-oriented occupations are Legal Services & Support (100.0%), Arts, Media & Entertainment (100.0%), and Computers & Mathematics (90.9%), while the most female-oriented occupations are Health Technologists (86.1%), Health Diagnosing & Treating (80.8%), and Life, Physical & Social Science (80.0%).
| Occupation | Male | Female |
| Management | 84 (26.9%) | 228 (73.1%) |
| Business & Financial | 48 (25.5%) | 140 (74.5%) |
| Computers, Engineering & Science | 115 (77.7%) | 33 (22.3%) |
| Computers & Mathematics | 40 (90.9%) | 4 (9.1%) |
| Architecture & Engineering | 72 (80.9%) | 17 (19.1%) |
| Life, Physical & Social Science | 3 (20.0%) | 12 (80.0%) |
| Community & Social Service | 166 (62.6%) | 99 (37.4%) |
| Education, Arts & Media | 34 (69.4%) | 15 (30.6%) |
| Legal Services & Support | 36 (100.0%) | 0 (0.0%) |
| Education Instruction & Library | 61 (42.1%) | 84 (57.9%) |
| Arts, Media & Entertainment | 35 (100.0%) | 0 (0.0%) |
| Health Diagnosing & Treating | 62 (19.2%) | 261 (80.8%) |
| Health Technologists | 41 (14.0%) | 253 (86.1%) |
| Total (Category) | 475 (38.4%) | 761 (61.6%) |
| Total (Overall) | 2,106 (57.2%) | 1,575 (42.8%) |
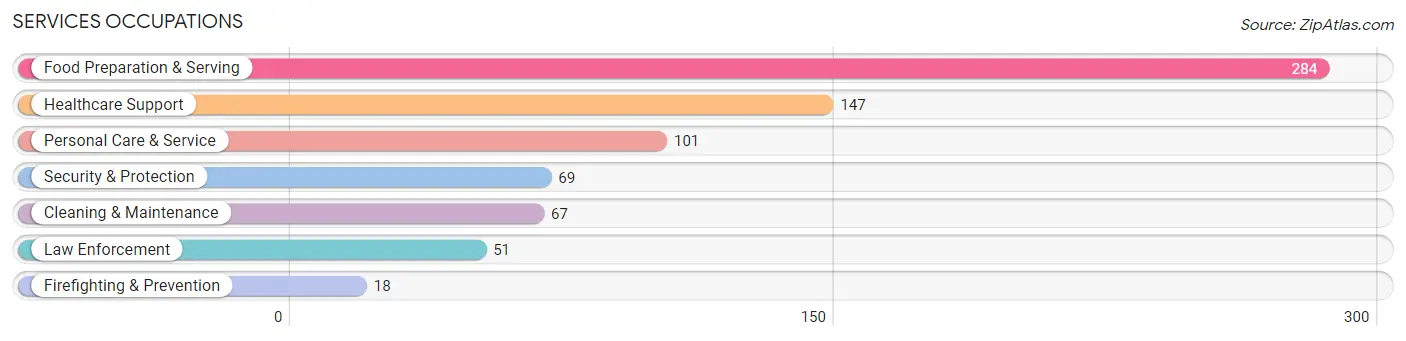
Services Occupations
The most common Services occupations in Grand Blanc are Food Preparation & Serving (284 | 7.7%), Healthcare Support (147 | 4.0%), Personal Care & Service (101 | 2.7%), Security & Protection (69 | 1.9%), and Cleaning & Maintenance (67 | 1.8%).
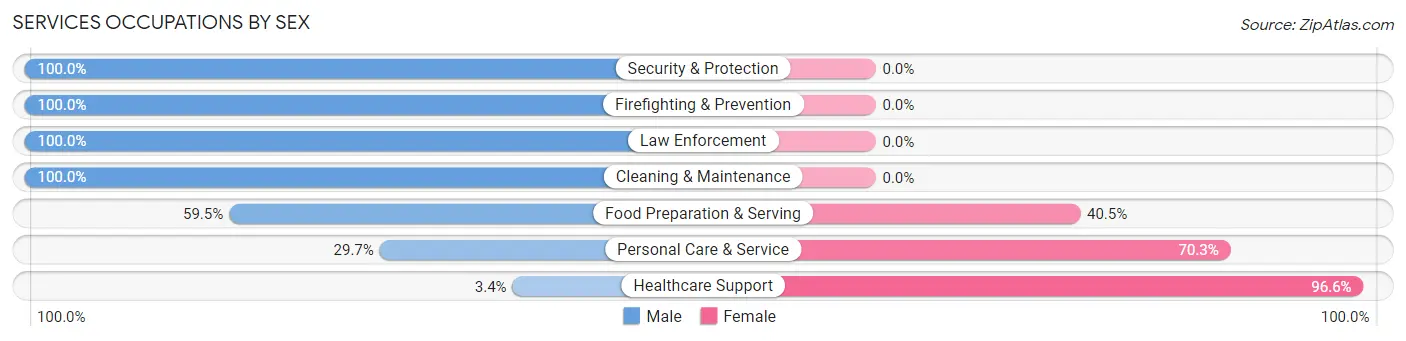
Services Occupations by Sex
Within the Services occupations in Grand Blanc, the most male-oriented occupations are Security & Protection (100.0%), Firefighting & Prevention (100.0%), and Law Enforcement (100.0%), while the most female-oriented occupations are Healthcare Support (96.6%), Personal Care & Service (70.3%), and Food Preparation & Serving (40.5%).
| Occupation | Male | Female |
| Healthcare Support | 5 (3.4%) | 142 (96.6%) |
| Security & Protection | 69 (100.0%) | 0 (0.0%) |
| Firefighting & Prevention | 18 (100.0%) | 0 (0.0%) |
| Law Enforcement | 51 (100.0%) | 0 (0.0%) |
| Food Preparation & Serving | 169 (59.5%) | 115 (40.5%) |
| Cleaning & Maintenance | 67 (100.0%) | 0 (0.0%) |
| Personal Care & Service | 30 (29.7%) | 71 (70.3%) |
| Total (Category) | 340 (50.9%) | 328 (49.1%) |
| Total (Overall) | 2,106 (57.2%) | 1,575 (42.8%) |
Sales and Office Occupations
The most common Sales and Office occupations in Grand Blanc are Sales & Related (352 | 9.6%), and Office & Administration (344 | 9.3%).
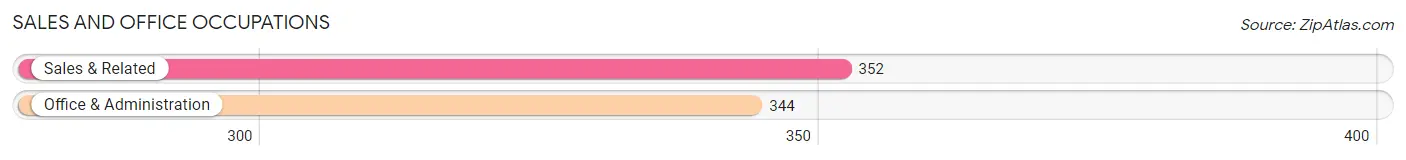
Sales and Office Occupations by Sex
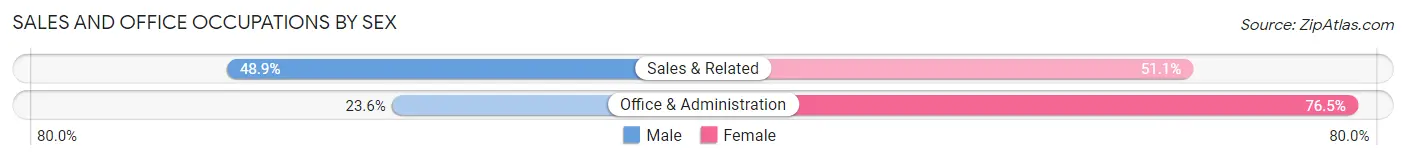
| Occupation | Male | Female |
| Sales & Related | 172 (48.9%) | 180 (51.1%) |
| Office & Administration | 81 (23.5%) | 263 (76.4%) |
| Total (Category) | 253 (36.3%) | 443 (63.6%) |
| Total (Overall) | 2,106 (57.2%) | 1,575 (42.8%) |
Natural Resources, Construction and Maintenance Occupations
The most common Natural Resources, Construction and Maintenance occupations in Grand Blanc are Construction & Extraction (208 | 5.7%), and Installation, Maintenance & Repair (167 | 4.5%).
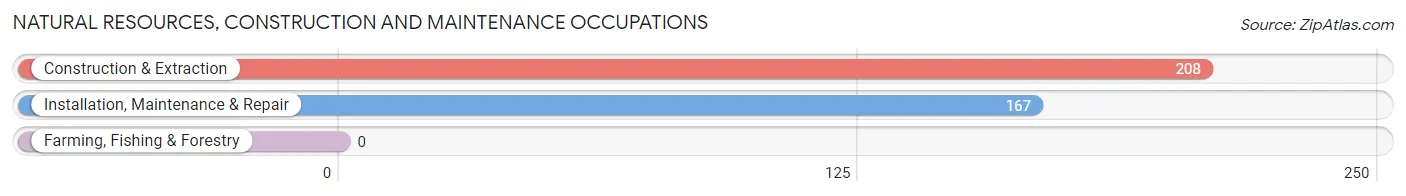
Natural Resources, Construction and Maintenance Occupations by Sex
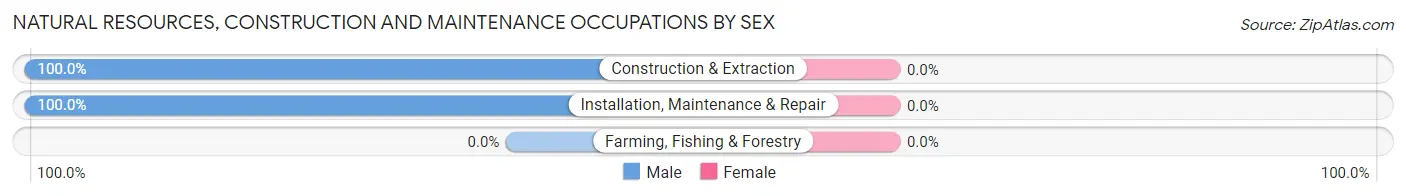
| Occupation | Male | Female |
| Farming, Fishing & Forestry | 0 (0.0%) | 0 (0.0%) |
| Construction & Extraction | 208 (100.0%) | 0 (0.0%) |
| Installation, Maintenance & Repair | 167 (100.0%) | 0 (0.0%) |
| Total (Category) | 375 (100.0%) | 0 (0.0%) |
| Total (Overall) | 2,106 (57.2%) | 1,575 (42.8%) |
Production, Transportation and Moving Occupations
The most common Production, Transportation and Moving occupations in Grand Blanc are Production (494 | 13.4%), Material Moving (155 | 4.2%), and Transportation (57 | 1.5%).
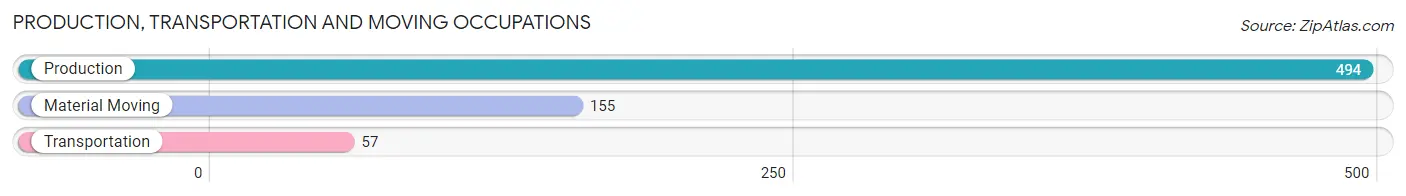
Production, Transportation and Moving Occupations by Sex
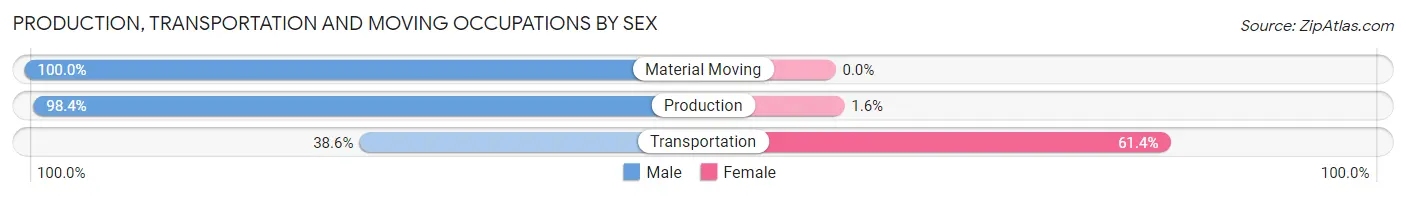
| Occupation | Male | Female |
| Production | 486 (98.4%) | 8 (1.6%) |
| Transportation | 22 (38.6%) | 35 (61.4%) |
| Material Moving | 155 (100.0%) | 0 (0.0%) |
| Total (Category) | 663 (93.9%) | 43 (6.1%) |
| Total (Overall) | 2,106 (57.2%) | 1,575 (42.8%) |
Employment Industries by Sex in Grand Blanc
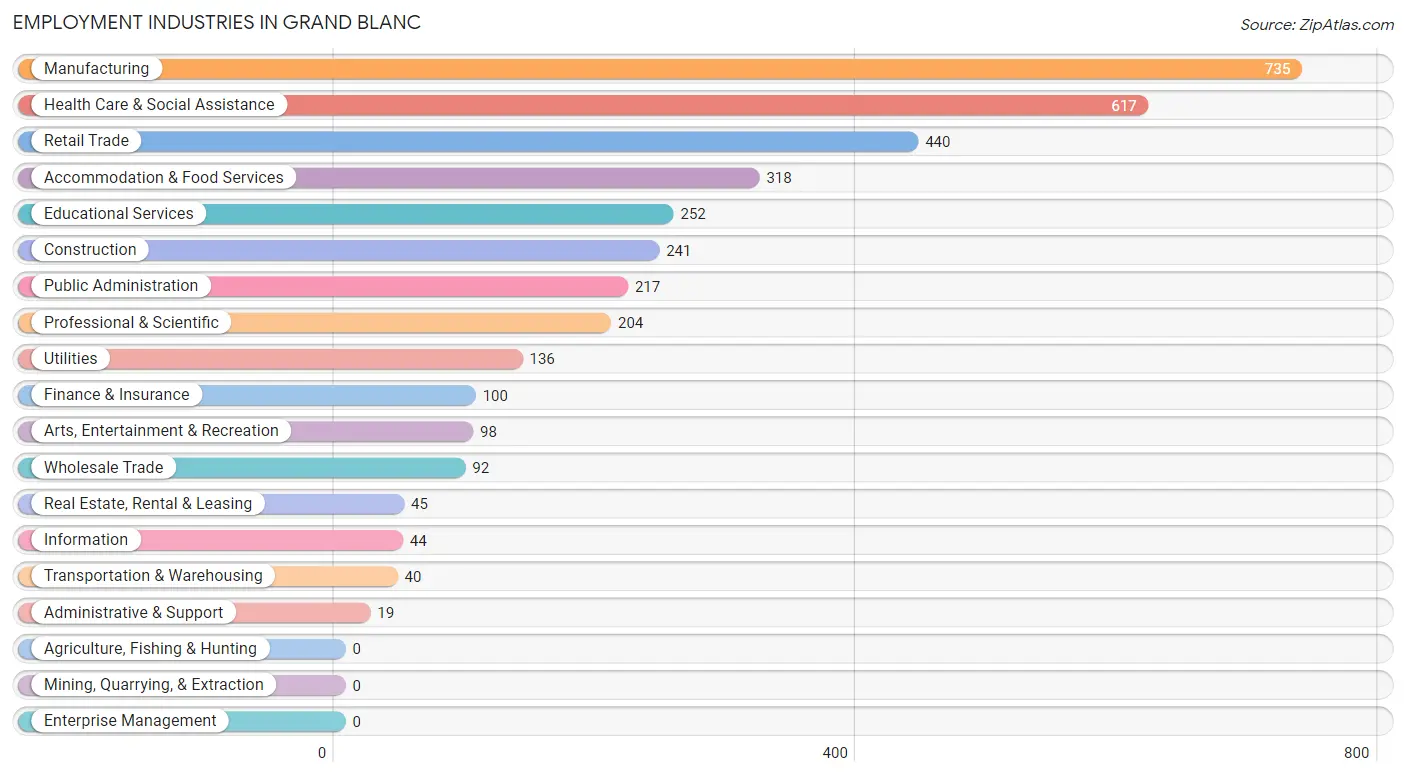
Employment Industries in Grand Blanc
The major employment industries in Grand Blanc include Manufacturing (735 | 20.0%), Health Care & Social Assistance (617 | 16.8%), Retail Trade (440 | 11.9%), Accommodation & Food Services (318 | 8.6%), and Educational Services (252 | 6.9%).
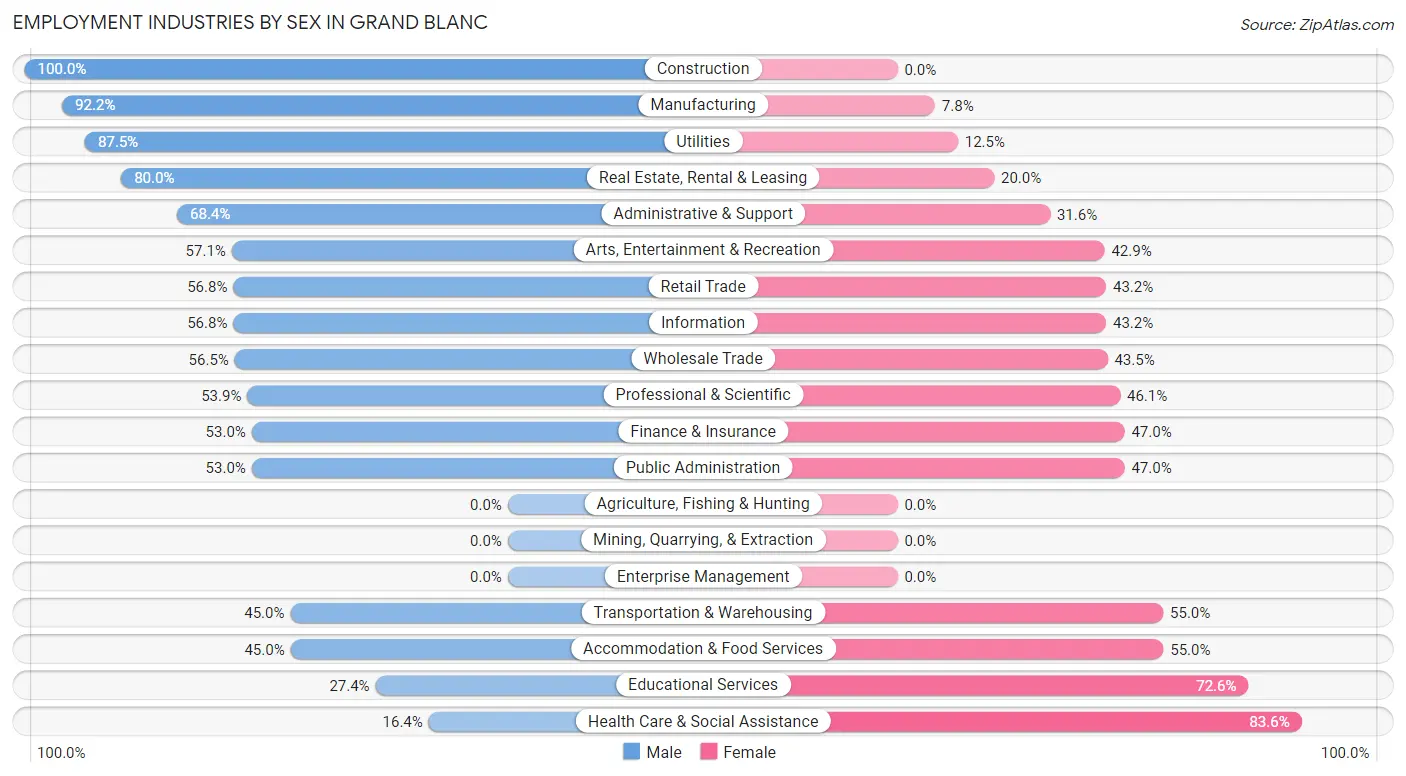
Employment Industries by Sex in Grand Blanc
The Grand Blanc industries that see more men than women are Construction (100.0%), Manufacturing (92.2%), and Utilities (87.5%), whereas the industries that tend to have a higher number of women are Health Care & Social Assistance (83.6%), Educational Services (72.6%), and Accommodation & Food Services (55.0%).
| Industry | Male | Female |
| Agriculture, Fishing & Hunting | 0 (0.0%) | 0 (0.0%) |
| Mining, Quarrying, & Extraction | 0 (0.0%) | 0 (0.0%) |
| Construction | 241 (100.0%) | 0 (0.0%) |
| Manufacturing | 678 (92.2%) | 57 (7.8%) |
| Wholesale Trade | 52 (56.5%) | 40 (43.5%) |
| Retail Trade | 250 (56.8%) | 190 (43.2%) |
| Transportation & Warehousing | 18 (45.0%) | 22 (55.0%) |
| Utilities | 119 (87.5%) | 17 (12.5%) |
| Information | 25 (56.8%) | 19 (43.2%) |
| Finance & Insurance | 53 (53.0%) | 47 (47.0%) |
| Real Estate, Rental & Leasing | 36 (80.0%) | 9 (20.0%) |
| Professional & Scientific | 110 (53.9%) | 94 (46.1%) |
| Enterprise Management | 0 (0.0%) | 0 (0.0%) |
| Administrative & Support | 13 (68.4%) | 6 (31.6%) |
| Educational Services | 69 (27.4%) | 183 (72.6%) |
| Health Care & Social Assistance | 101 (16.4%) | 516 (83.6%) |
| Arts, Entertainment & Recreation | 56 (57.1%) | 42 (42.9%) |
| Accommodation & Food Services | 143 (45.0%) | 175 (55.0%) |
| Public Administration | 115 (53.0%) | 102 (47.0%) |
| Total | 2,106 (57.2%) | 1,575 (42.8%) |
Education in Grand Blanc
School Enrollment in Grand Blanc
The most common levels of schooling among the 2,387 students in Grand Blanc are high school (744 | 31.2%), college / undergraduate (538 | 22.5%), and elementary school (371 | 15.5%).
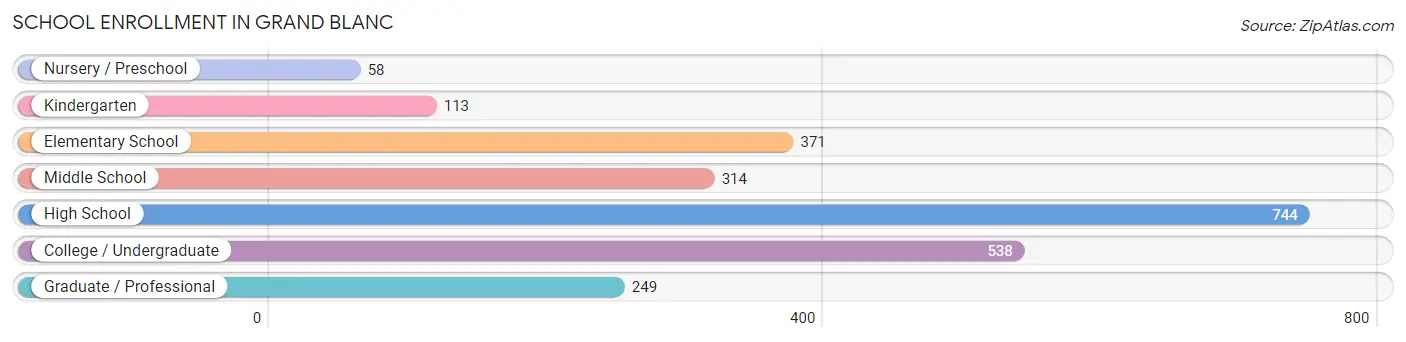
| School Level | # Students | % Students |
| Nursery / Preschool | 58 | 2.4% |
| Kindergarten | 113 | 4.7% |
| Elementary School | 371 | 15.5% |
| Middle School | 314 | 13.2% |
| High School | 744 | 31.2% |
| College / Undergraduate | 538 | 22.5% |
| Graduate / Professional | 249 | 10.4% |
| Total | 2,387 | 100.0% |
School Enrollment by Age by Funding Source in Grand Blanc
Out of a total of 2,387 students who are enrolled in schools in Grand Blanc, 695 (29.1%) attend a private institution, while the remaining 1,692 (70.9%) are enrolled in public schools. The age group of 3 to 4 year olds has the highest likelihood of being enrolled in private schools, with 58 (100.0% in the age bracket) enrolled. Conversely, the age group of 20 to 24 year olds has the lowest likelihood of being enrolled in a private school, with 208 (100.0% in the age bracket) attending a public institution.
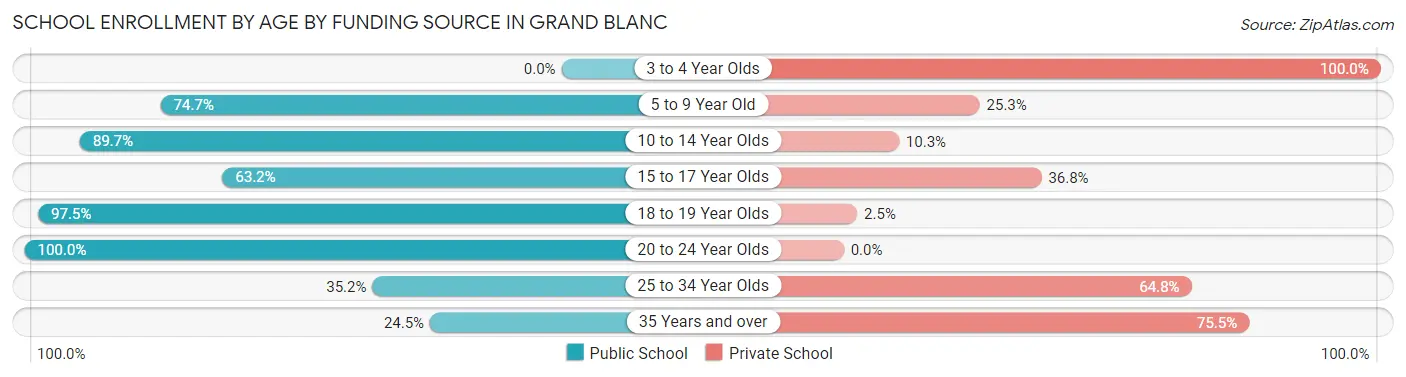
| Age Bracket | Public School | Private School |
| 3 to 4 Year Olds | 0 (0.0%) | 58 (100.0%) |
| 5 to 9 Year Old | 289 (74.7%) | 98 (25.3%) |
| 10 to 14 Year Olds | 462 (89.7%) | 53 (10.3%) |
| 15 to 17 Year Olds | 300 (63.2%) | 175 (36.8%) |
| 18 to 19 Year Olds | 311 (97.5%) | 8 (2.5%) |
| 20 to 24 Year Olds | 208 (100.0%) | 0 (0.0%) |
| 25 to 34 Year Olds | 62 (35.2%) | 114 (64.8%) |
| 35 Years and over | 61 (24.5%) | 188 (75.5%) |
| Total | 1,692 (70.9%) | 695 (29.1%) |
Educational Attainment by Field of Study in Grand Blanc
Business (525 | 23.0%), science & technology (294 | 12.9%), bio, nature & agricultural (177 | 7.8%), engineering (167 | 7.3%), and physical & health sciences (158 | 6.9%) are the most common fields of study among 2,279 individuals in Grand Blanc who have obtained a bachelor's degree or higher.
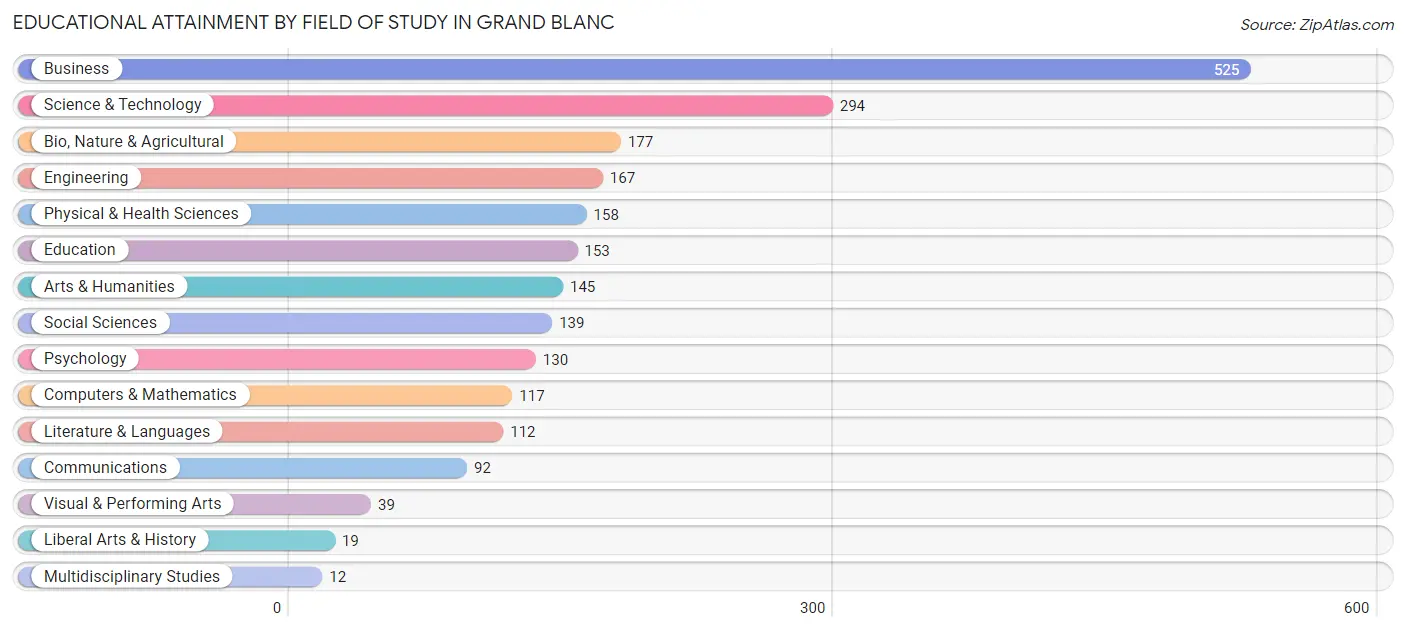
| Field of Study | # Graduates | % Graduates |
| Computers & Mathematics | 117 | 5.1% |
| Bio, Nature & Agricultural | 177 | 7.8% |
| Physical & Health Sciences | 158 | 6.9% |
| Psychology | 130 | 5.7% |
| Social Sciences | 139 | 6.1% |
| Engineering | 167 | 7.3% |
| Multidisciplinary Studies | 12 | 0.5% |
| Science & Technology | 294 | 12.9% |
| Business | 525 | 23.0% |
| Education | 153 | 6.7% |
| Literature & Languages | 112 | 4.9% |
| Liberal Arts & History | 19 | 0.8% |
| Visual & Performing Arts | 39 | 1.7% |
| Communications | 92 | 4.0% |
| Arts & Humanities | 145 | 6.4% |
| Total | 2,279 | 100.0% |
Transportation & Commute in Grand Blanc
Vehicle Availability by Sex in Grand Blanc
The most prevalent vehicle ownership categories in Grand Blanc are males with 2 vehicles (828, accounting for 40.2%) and females with 2 vehicles (745, making up 53.6%).
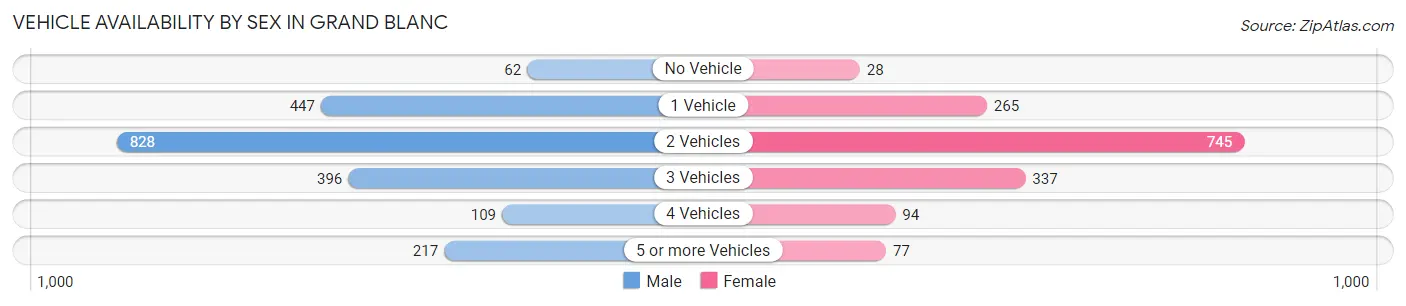
| Vehicles Available | Male | Female |
| No Vehicle | 62 (3.0%) | 28 (1.8%) |
| 1 Vehicle | 447 (21.7%) | 265 (17.1%) |
| 2 Vehicles | 828 (40.2%) | 745 (48.2%) |
| 3 Vehicles | 396 (19.2%) | 337 (21.8%) |
| 4 Vehicles | 109 (5.3%) | 94 (6.1%) |
| 5 or more Vehicles | 217 (10.5%) | 77 (5.0%) |
| Total | 2,059 (100.0%) | 1,546 (100.0%) |
Commute Time in Grand Blanc
The most frequently occuring commute durations in Grand Blanc are 15 to 19 minutes (453 commuters, 14.1%), 5 to 9 minutes (430 commuters, 13.4%), and 20 to 24 minutes (413 commuters, 12.9%).
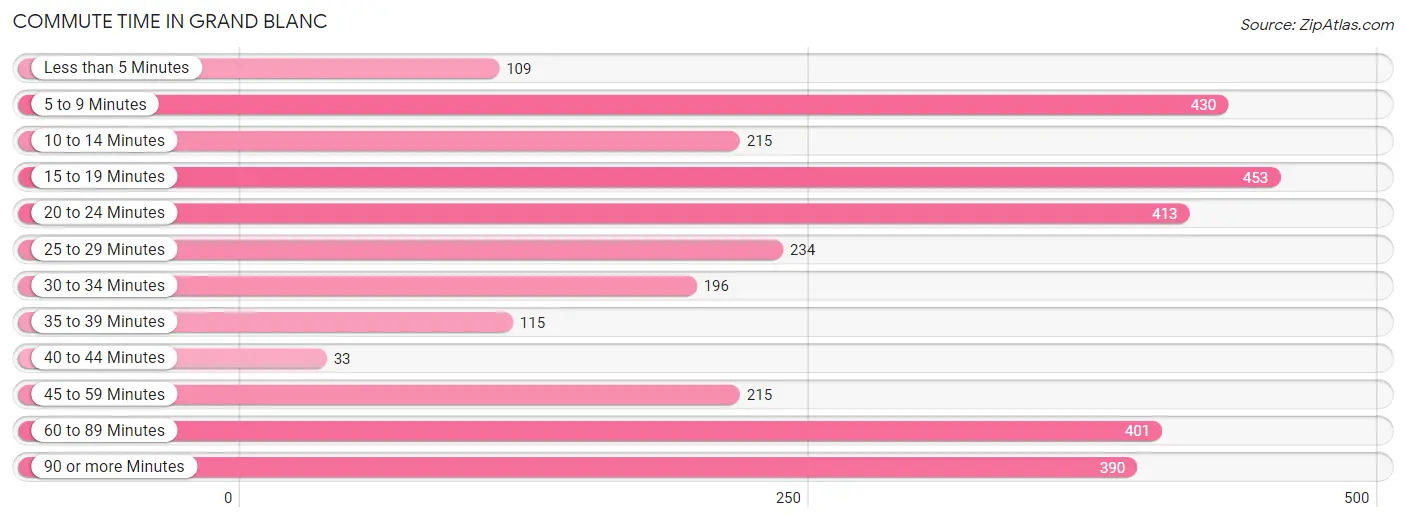
| Commute Time | # Commuters | % Commuters |
| Less than 5 Minutes | 109 | 3.4% |
| 5 to 9 Minutes | 430 | 13.4% |
| 10 to 14 Minutes | 215 | 6.7% |
| 15 to 19 Minutes | 453 | 14.1% |
| 20 to 24 Minutes | 413 | 12.9% |
| 25 to 29 Minutes | 234 | 7.3% |
| 30 to 34 Minutes | 196 | 6.1% |
| 35 to 39 Minutes | 115 | 3.6% |
| 40 to 44 Minutes | 33 | 1.0% |
| 45 to 59 Minutes | 215 | 6.7% |
| 60 to 89 Minutes | 401 | 12.5% |
| 90 or more Minutes | 390 | 12.2% |
Commute Time by Sex in Grand Blanc
The most common commute times in Grand Blanc are 15 to 19 minutes (359 commuters, 18.7%) for males and 5 to 9 minutes (251 commuters, 19.5%) for females.
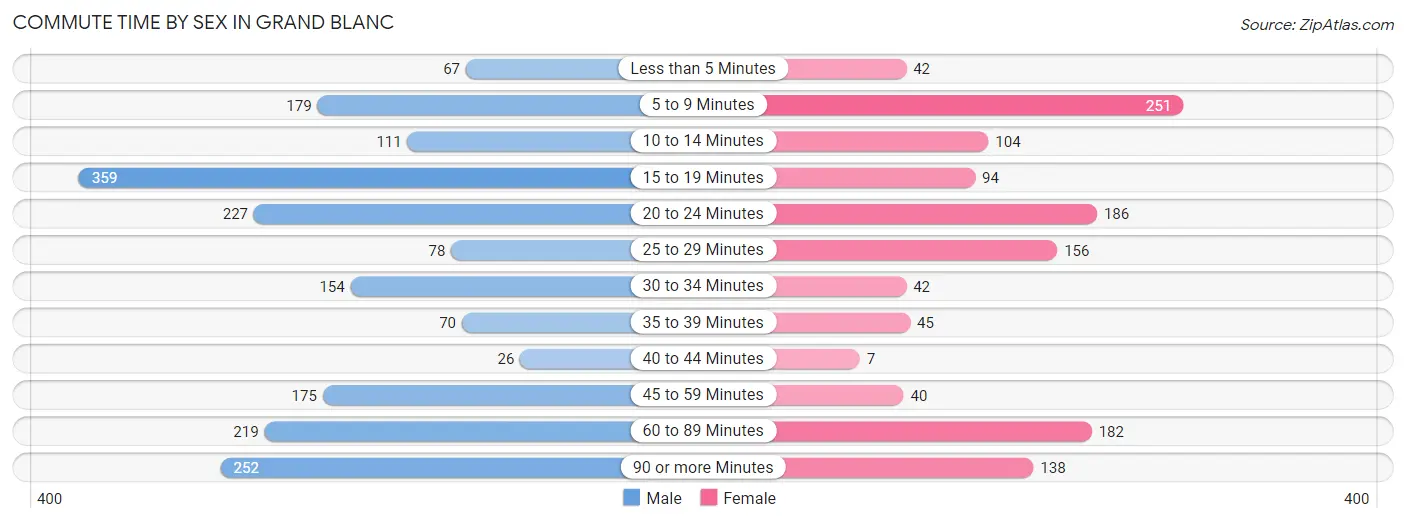
| Commute Time | Male | Female |
| Less than 5 Minutes | 67 (3.5%) | 42 (3.3%) |
| 5 to 9 Minutes | 179 (9.3%) | 251 (19.5%) |
| 10 to 14 Minutes | 111 (5.8%) | 104 (8.1%) |
| 15 to 19 Minutes | 359 (18.7%) | 94 (7.3%) |
| 20 to 24 Minutes | 227 (11.8%) | 186 (14.4%) |
| 25 to 29 Minutes | 78 (4.1%) | 156 (12.1%) |
| 30 to 34 Minutes | 154 (8.0%) | 42 (3.3%) |
| 35 to 39 Minutes | 70 (3.6%) | 45 (3.5%) |
| 40 to 44 Minutes | 26 (1.4%) | 7 (0.5%) |
| 45 to 59 Minutes | 175 (9.1%) | 40 (3.1%) |
| 60 to 89 Minutes | 219 (11.4%) | 182 (14.1%) |
| 90 or more Minutes | 252 (13.2%) | 138 (10.7%) |
Time of Departure to Work by Sex in Grand Blanc
The most frequent times of departure to work in Grand Blanc are 6:00 AM to 6:29 AM (374, 19.5%) for males and 6:30 AM to 6:59 AM (264, 20.5%) for females.
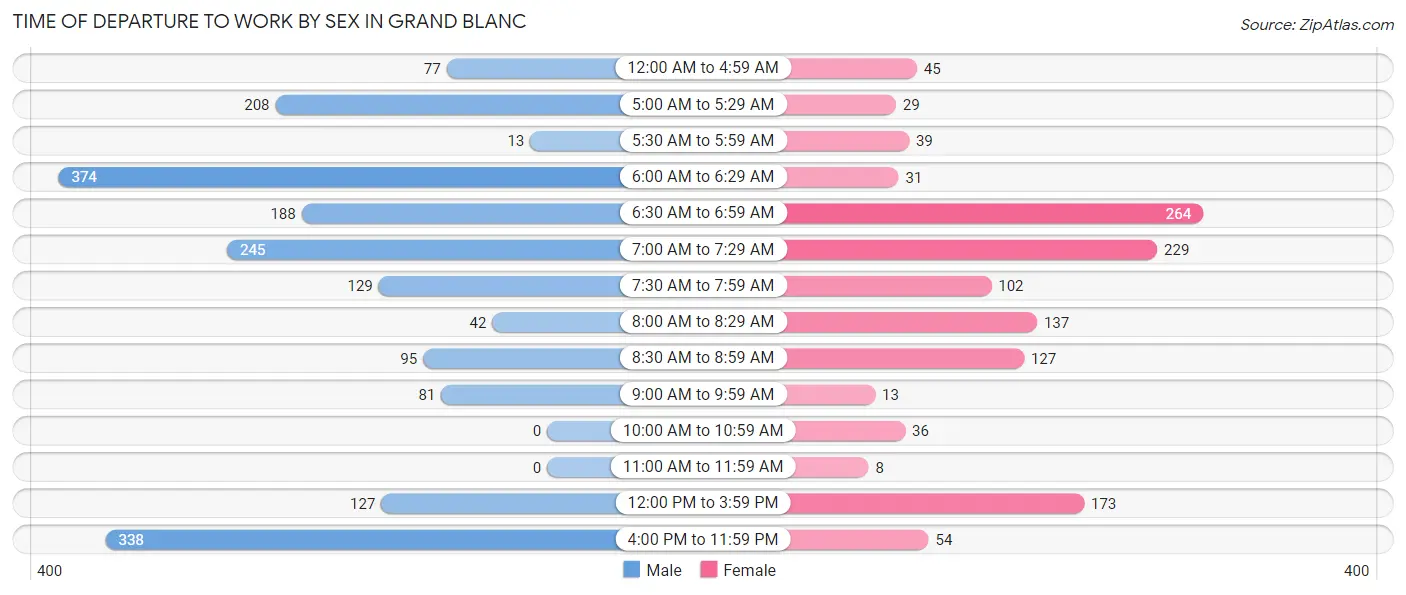
| Time of Departure | Male | Female |
| 12:00 AM to 4:59 AM | 77 (4.0%) | 45 (3.5%) |
| 5:00 AM to 5:29 AM | 208 (10.8%) | 29 (2.2%) |
| 5:30 AM to 5:59 AM | 13 (0.7%) | 39 (3.0%) |
| 6:00 AM to 6:29 AM | 374 (19.5%) | 31 (2.4%) |
| 6:30 AM to 6:59 AM | 188 (9.8%) | 264 (20.5%) |
| 7:00 AM to 7:29 AM | 245 (12.8%) | 229 (17.8%) |
| 7:30 AM to 7:59 AM | 129 (6.7%) | 102 (7.9%) |
| 8:00 AM to 8:29 AM | 42 (2.2%) | 137 (10.6%) |
| 8:30 AM to 8:59 AM | 95 (5.0%) | 127 (9.9%) |
| 9:00 AM to 9:59 AM | 81 (4.2%) | 13 (1.0%) |
| 10:00 AM to 10:59 AM | 0 (0.0%) | 36 (2.8%) |
| 11:00 AM to 11:59 AM | 0 (0.0%) | 8 (0.6%) |
| 12:00 PM to 3:59 PM | 127 (6.6%) | 173 (13.4%) |
| 4:00 PM to 11:59 PM | 338 (17.6%) | 54 (4.2%) |
| Total | 1,917 (100.0%) | 1,287 (100.0%) |
Housing Occupancy in Grand Blanc
Occupancy by Ownership in Grand Blanc
Of the total 3,494 dwellings in Grand Blanc, owner-occupied units account for 1,918 (54.9%), while renter-occupied units make up 1,576 (45.1%).
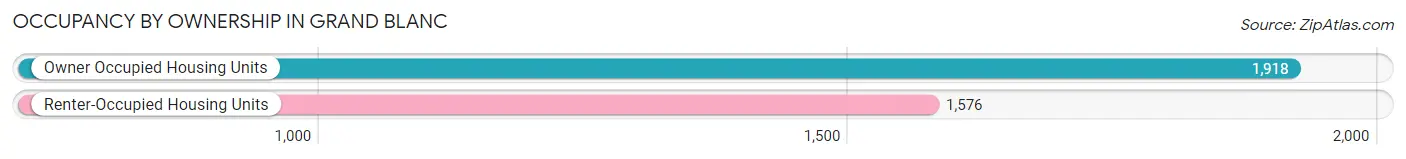
| Occupancy | # Housing Units | % Housing Units |
| Owner Occupied Housing Units | 1,918 | 54.9% |
| Renter-Occupied Housing Units | 1,576 | 45.1% |
| Total Occupied Housing Units | 3,494 | 100.0% |
Occupancy by Household Size in Grand Blanc
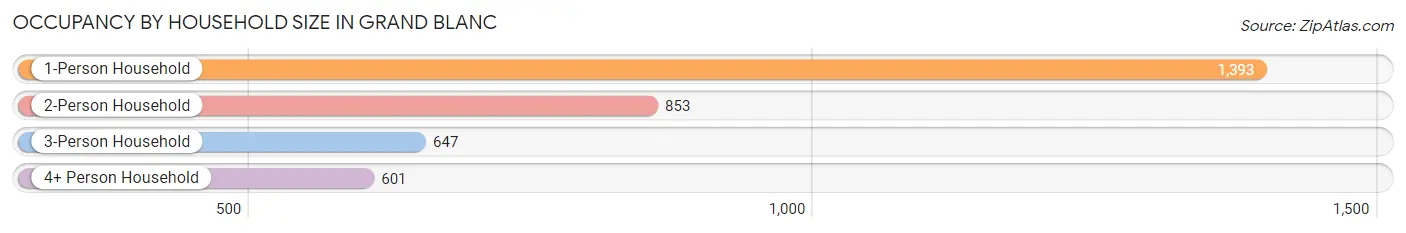
| Household Size | # Housing Units | % Housing Units |
| 1-Person Household | 1,393 | 39.9% |
| 2-Person Household | 853 | 24.4% |
| 3-Person Household | 647 | 18.5% |
| 4+ Person Household | 601 | 17.2% |
| Total Housing Units | 3,494 | 100.0% |
Occupancy by Ownership by Household Size in Grand Blanc
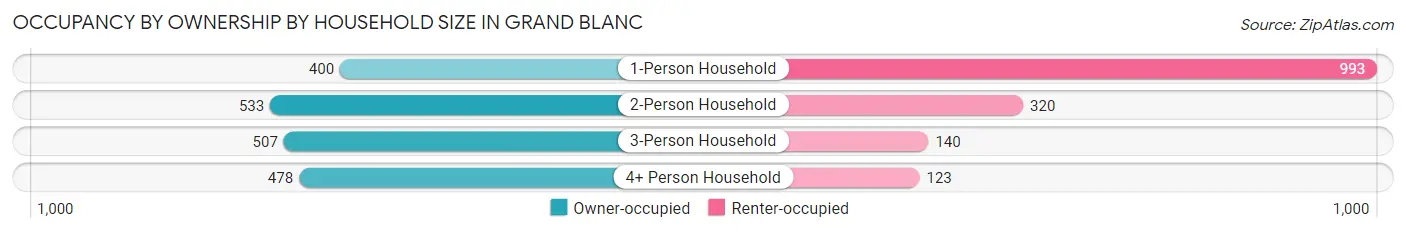
| Household Size | Owner-occupied | Renter-occupied |
| 1-Person Household | 400 (28.7%) | 993 (71.3%) |
| 2-Person Household | 533 (62.5%) | 320 (37.5%) |
| 3-Person Household | 507 (78.4%) | 140 (21.6%) |
| 4+ Person Household | 478 (79.5%) | 123 (20.5%) |
| Total Housing Units | 1,918 (54.9%) | 1,576 (45.1%) |
Occupancy by Educational Attainment in Grand Blanc
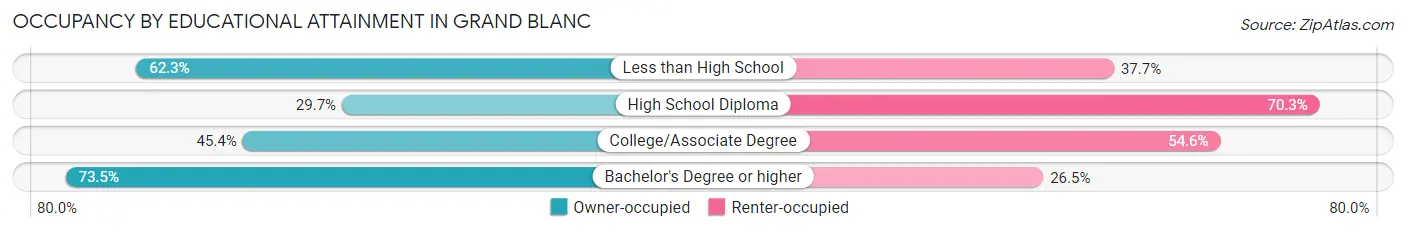
| Household Size | Owner-occupied | Renter-occupied |
| Less than High School | 71 (62.3%) | 43 (37.7%) |
| High School Diploma | 205 (29.7%) | 486 (70.3%) |
| College/Associate Degree | 541 (45.4%) | 650 (54.6%) |
| Bachelor's Degree or higher | 1,101 (73.5%) | 397 (26.5%) |
Occupancy by Age of Householder in Grand Blanc
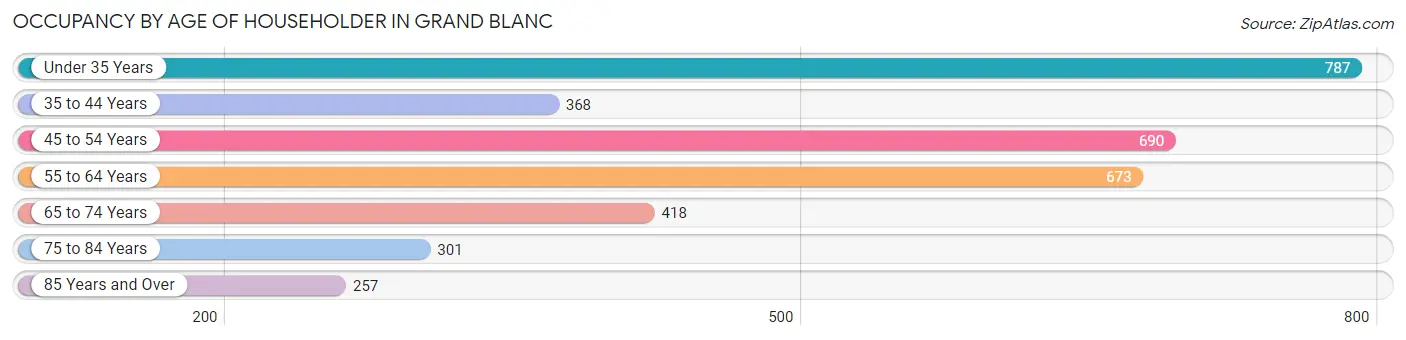
| Age Bracket | # Households | % Households |
| Under 35 Years | 787 | 22.5% |
| 35 to 44 Years | 368 | 10.5% |
| 45 to 54 Years | 690 | 19.8% |
| 55 to 64 Years | 673 | 19.3% |
| 65 to 74 Years | 418 | 12.0% |
| 75 to 84 Years | 301 | 8.6% |
| 85 Years and Over | 257 | 7.4% |
| Total | 3,494 | 100.0% |
Housing Finances in Grand Blanc
Median Income by Occupancy in Grand Blanc
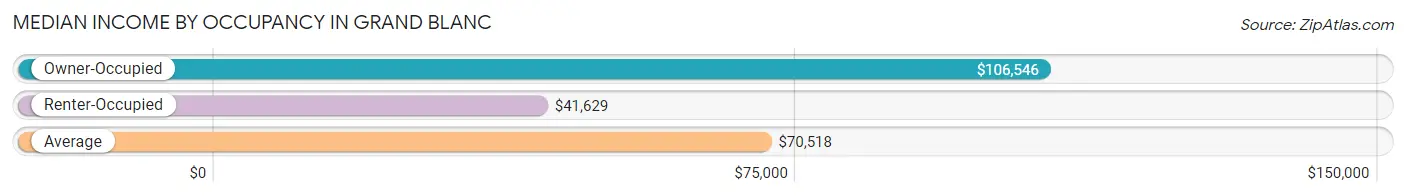
| Occupancy Type | # Households | Median Income |
| Owner-Occupied | 1,918 (54.9%) | $106,546 |
| Renter-Occupied | 1,576 (45.1%) | $41,629 |
| Average | 3,494 (100.0%) | $70,518 |
Occupancy by Householder Income Bracket in Grand Blanc
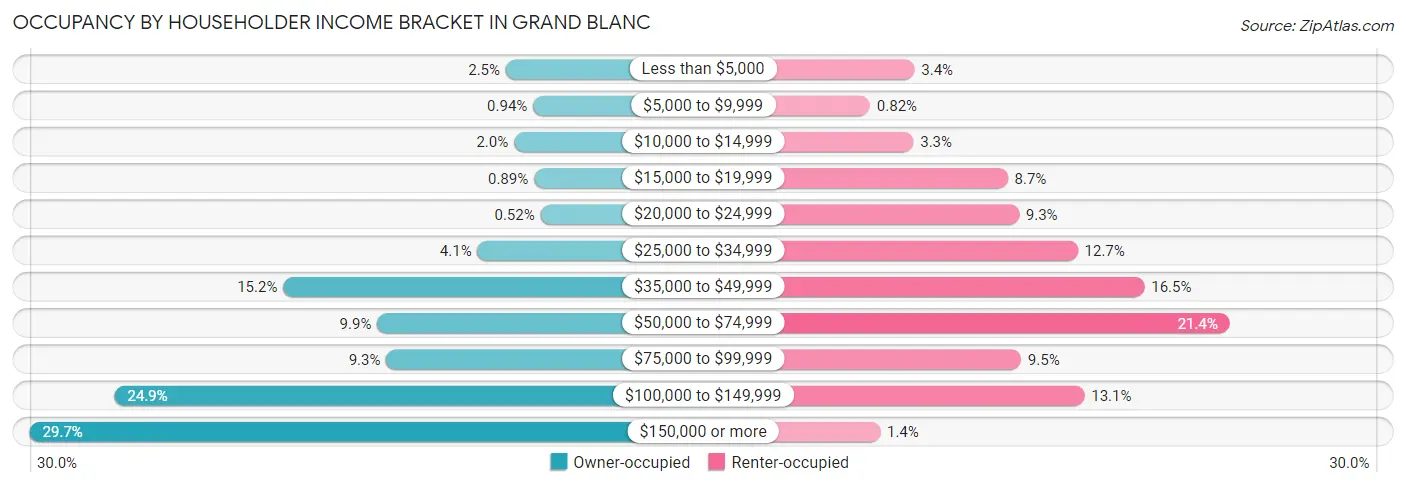
| Income Bracket | Owner-occupied | Renter-occupied |
| Less than $5,000 | 48 (2.5%) | 53 (3.4%) |
| $5,000 to $9,999 | 18 (0.9%) | 13 (0.8%) |
| $10,000 to $14,999 | 39 (2.0%) | 52 (3.3%) |
| $15,000 to $19,999 | 17 (0.9%) | 137 (8.7%) |
| $20,000 to $24,999 | 10 (0.5%) | 147 (9.3%) |
| $25,000 to $34,999 | 79 (4.1%) | 200 (12.7%) |
| $35,000 to $49,999 | 292 (15.2%) | 260 (16.5%) |
| $50,000 to $74,999 | 189 (9.9%) | 337 (21.4%) |
| $75,000 to $99,999 | 179 (9.3%) | 149 (9.5%) |
| $100,000 to $149,999 | 477 (24.9%) | 206 (13.1%) |
| $150,000 or more | 570 (29.7%) | 22 (1.4%) |
| Total | 1,918 (100.0%) | 1,576 (100.0%) |
Monthly Housing Cost Tiers in Grand Blanc
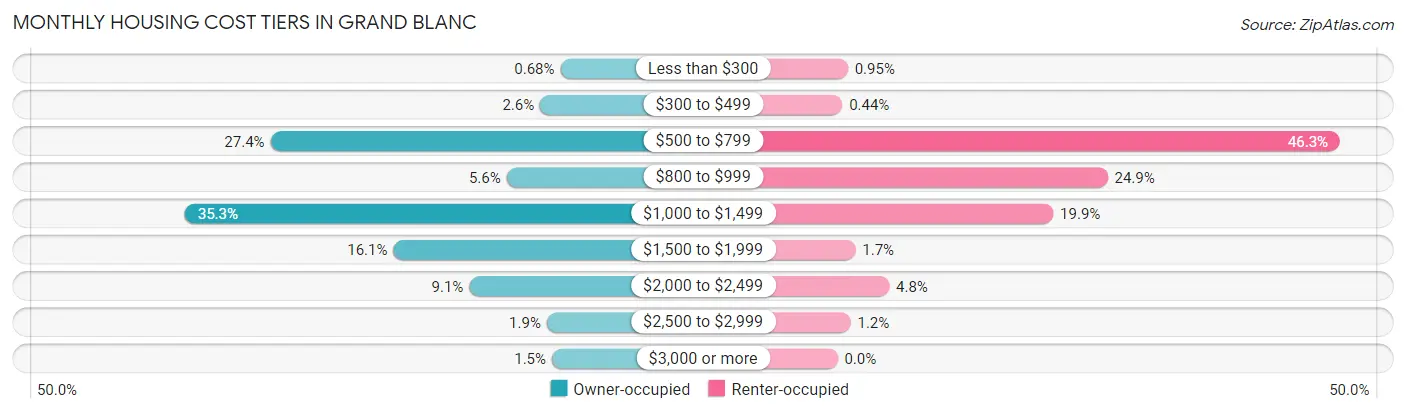
| Monthly Cost | Owner-occupied | Renter-occupied |
| Less than $300 | 13 (0.7%) | 15 (0.9%) |
| $300 to $499 | 49 (2.5%) | 7 (0.4%) |
| $500 to $799 | 525 (27.4%) | 729 (46.3%) |
| $800 to $999 | 108 (5.6%) | 392 (24.9%) |
| $1,000 to $1,499 | 676 (35.2%) | 313 (19.9%) |
| $1,500 to $1,999 | 308 (16.1%) | 26 (1.7%) |
| $2,000 to $2,499 | 174 (9.1%) | 75 (4.8%) |
| $2,500 to $2,999 | 37 (1.9%) | 19 (1.2%) |
| $3,000 or more | 28 (1.5%) | 0 (0.0%) |
| Total | 1,918 (100.0%) | 1,576 (100.0%) |
Physical Housing Characteristics in Grand Blanc
Housing Structures in Grand Blanc
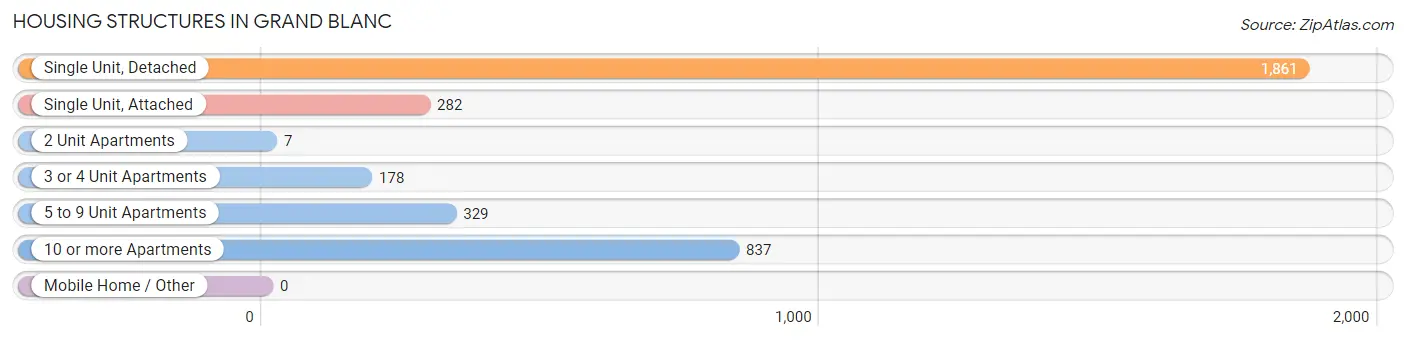
| Structure Type | # Housing Units | % Housing Units |
| Single Unit, Detached | 1,861 | 53.3% |
| Single Unit, Attached | 282 | 8.1% |
| 2 Unit Apartments | 7 | 0.2% |
| 3 or 4 Unit Apartments | 178 | 5.1% |
| 5 to 9 Unit Apartments | 329 | 9.4% |
| 10 or more Apartments | 837 | 24.0% |
| Mobile Home / Other | 0 | 0.0% |
| Total | 3,494 | 100.0% |
Housing Structures by Occupancy in Grand Blanc
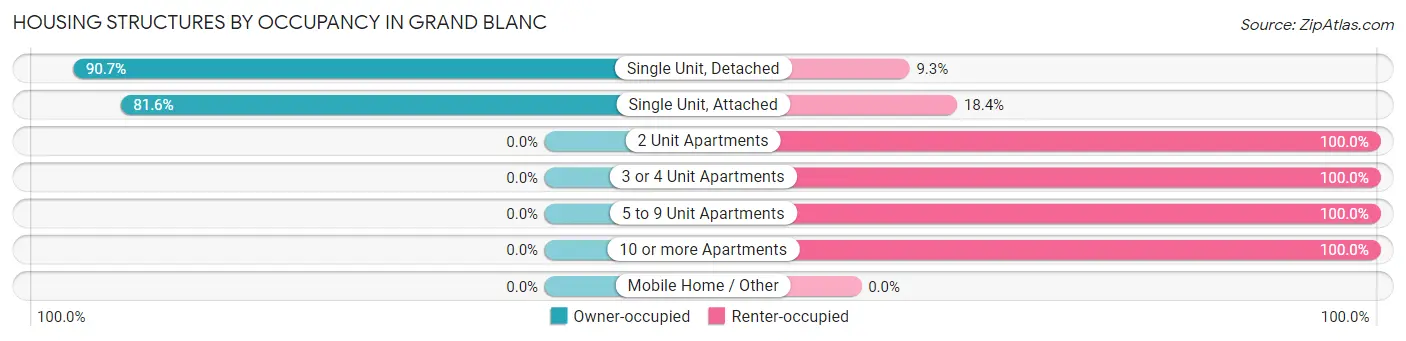
| Structure Type | Owner-occupied | Renter-occupied |
| Single Unit, Detached | 1,688 (90.7%) | 173 (9.3%) |
| Single Unit, Attached | 230 (81.6%) | 52 (18.4%) |
| 2 Unit Apartments | 0 (0.0%) | 7 (100.0%) |
| 3 or 4 Unit Apartments | 0 (0.0%) | 178 (100.0%) |
| 5 to 9 Unit Apartments | 0 (0.0%) | 329 (100.0%) |
| 10 or more Apartments | 0 (0.0%) | 837 (100.0%) |
| Mobile Home / Other | 0 (0.0%) | 0 (0.0%) |
| Total | 1,918 (54.9%) | 1,576 (45.1%) |
Housing Structures by Number of Rooms in Grand Blanc
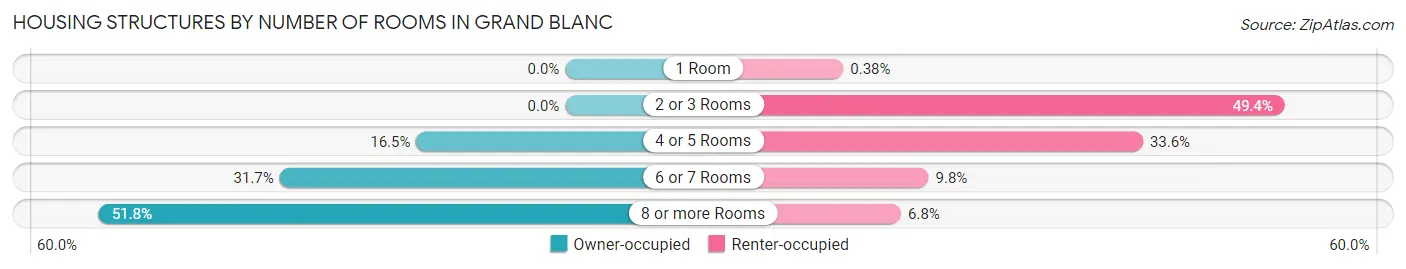
| Number of Rooms | Owner-occupied | Renter-occupied |
| 1 Room | 0 (0.0%) | 6 (0.4%) |
| 2 or 3 Rooms | 0 (0.0%) | 778 (49.4%) |
| 4 or 5 Rooms | 317 (16.5%) | 530 (33.6%) |
| 6 or 7 Rooms | 608 (31.7%) | 155 (9.8%) |
| 8 or more Rooms | 993 (51.8%) | 107 (6.8%) |
| Total | 1,918 (100.0%) | 1,576 (100.0%) |
Housing Structure by Heating Type in Grand Blanc
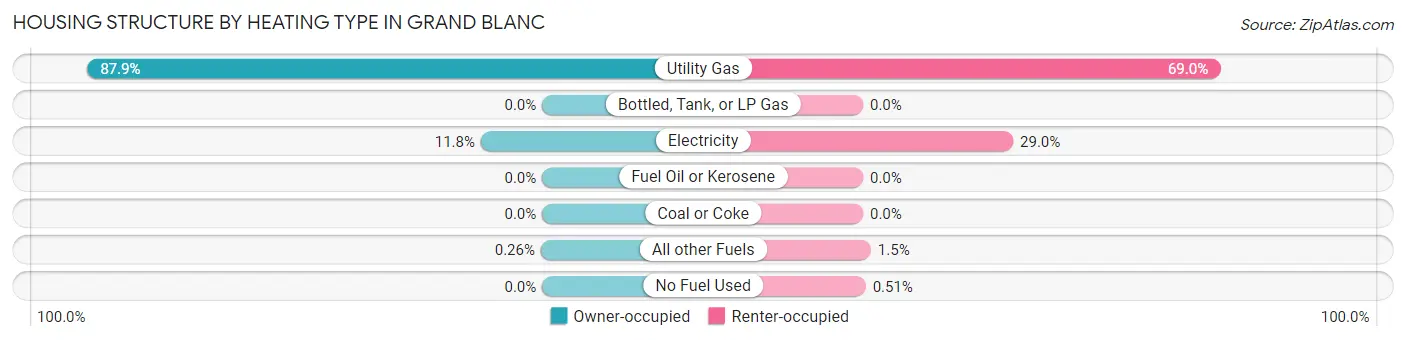
| Heating Type | Owner-occupied | Renter-occupied |
| Utility Gas | 1,686 (87.9%) | 1,087 (69.0%) |
| Bottled, Tank, or LP Gas | 0 (0.0%) | 0 (0.0%) |
| Electricity | 227 (11.8%) | 457 (29.0%) |
| Fuel Oil or Kerosene | 0 (0.0%) | 0 (0.0%) |
| Coal or Coke | 0 (0.0%) | 0 (0.0%) |
| All other Fuels | 5 (0.3%) | 24 (1.5%) |
| No Fuel Used | 0 (0.0%) | 8 (0.5%) |
| Total | 1,918 (100.0%) | 1,576 (100.0%) |
Household Vehicle Usage in Grand Blanc
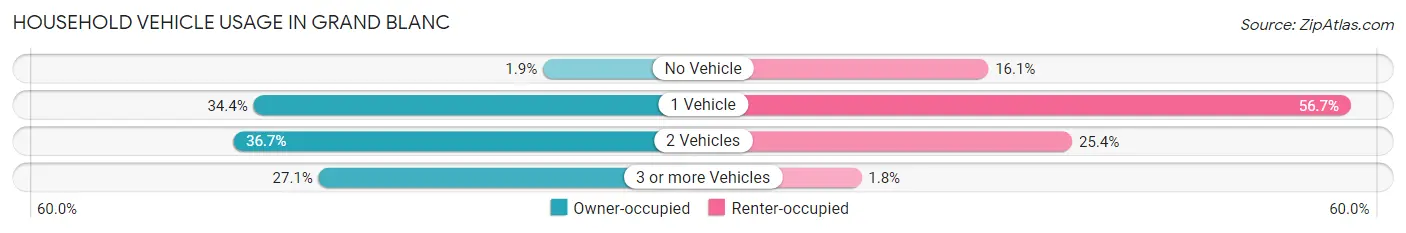
| Vehicles per Household | Owner-occupied | Renter-occupied |
| No Vehicle | 37 (1.9%) | 253 (16.1%) |
| 1 Vehicle | 659 (34.4%) | 893 (56.7%) |
| 2 Vehicles | 703 (36.6%) | 401 (25.4%) |
| 3 or more Vehicles | 519 (27.1%) | 29 (1.8%) |
| Total | 1,918 (100.0%) | 1,576 (100.0%) |
Real Estate & Mortgages in Grand Blanc
Real Estate and Mortgage Overview in Grand Blanc
| Characteristic | Without Mortgage | With Mortgage |
| Housing Units | 758 | 1,160 |
| Median Property Value | $216,000 | $241,600 |
| Median Household Income | $88,810 | $354 |
| Monthly Housing Costs | $686 | $28 |
| Real Estate Taxes | $3,433 | $22 |
Property Value by Mortgage Status in Grand Blanc
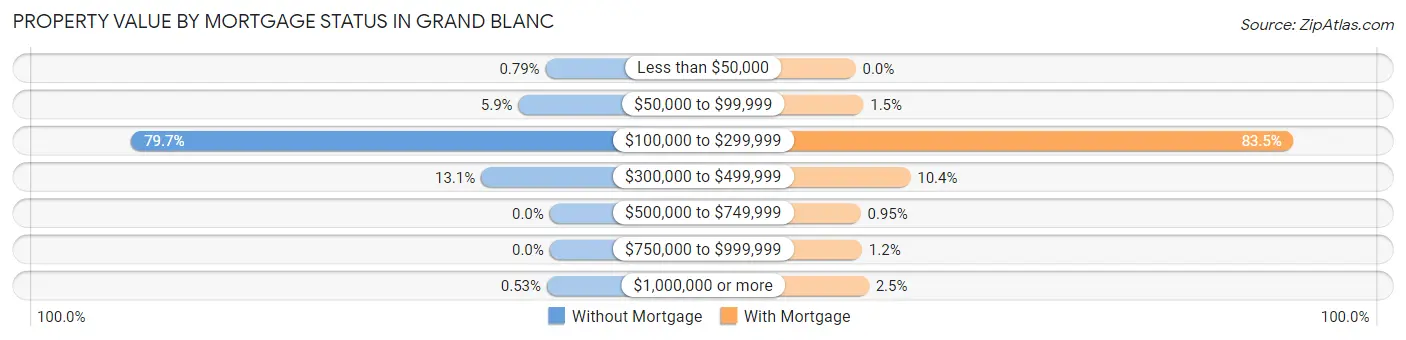
| Property Value | Without Mortgage | With Mortgage |
| Less than $50,000 | 6 (0.8%) | 0 (0.0%) |
| $50,000 to $99,999 | 45 (5.9%) | 17 (1.5%) |
| $100,000 to $299,999 | 604 (79.7%) | 968 (83.5%) |
| $300,000 to $499,999 | 99 (13.1%) | 121 (10.4%) |
| $500,000 to $749,999 | 0 (0.0%) | 11 (0.9%) |
| $750,000 to $999,999 | 0 (0.0%) | 14 (1.2%) |
| $1,000,000 or more | 4 (0.5%) | 29 (2.5%) |
| Total | 758 (100.0%) | 1,160 (100.0%) |
Household Income by Mortgage Status in Grand Blanc
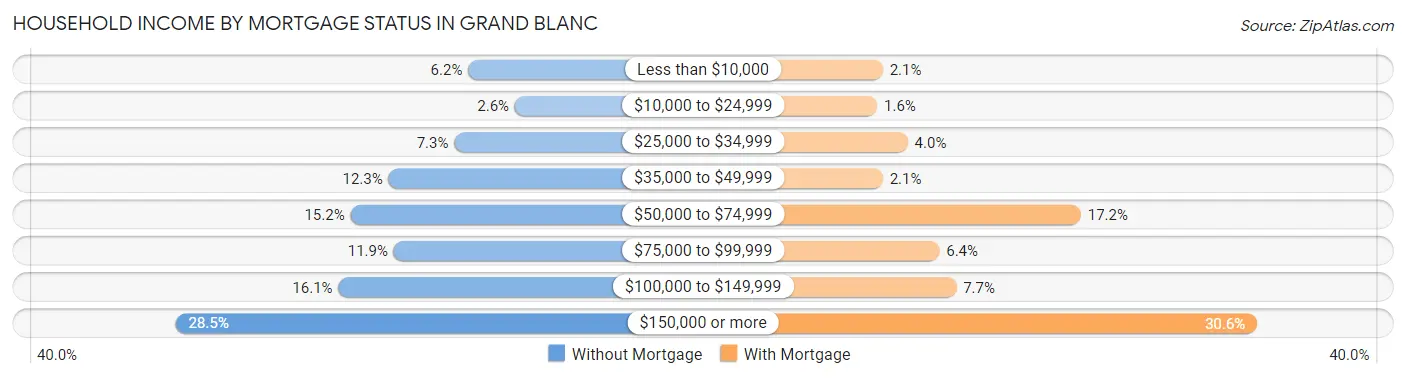
| Household Income | Without Mortgage | With Mortgage |
| Less than $10,000 | 47 (6.2%) | 24 (2.1%) |
| $10,000 to $24,999 | 20 (2.6%) | 19 (1.6%) |
| $25,000 to $34,999 | 55 (7.3%) | 46 (4.0%) |
| $35,000 to $49,999 | 93 (12.3%) | 24 (2.1%) |
| $50,000 to $74,999 | 115 (15.2%) | 199 (17.2%) |
| $75,000 to $99,999 | 90 (11.9%) | 74 (6.4%) |
| $100,000 to $149,999 | 122 (16.1%) | 89 (7.7%) |
| $150,000 or more | 216 (28.5%) | 355 (30.6%) |
| Total | 758 (100.0%) | 1,160 (100.0%) |
Property Value to Household Income Ratio in Grand Blanc
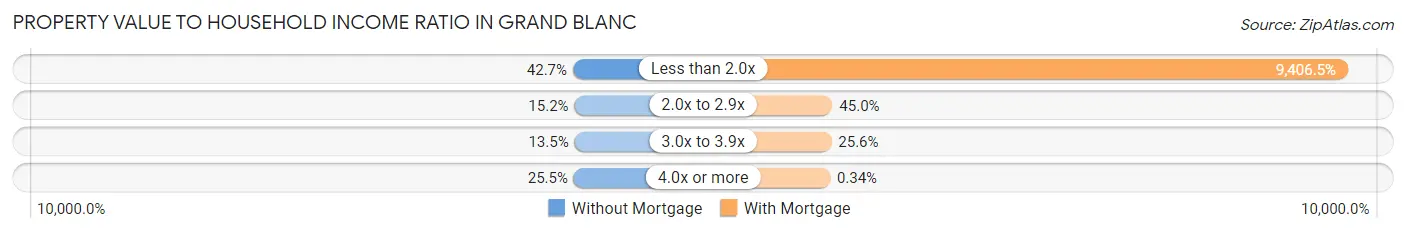
| Value-to-Income Ratio | Without Mortgage | With Mortgage |
| Less than 2.0x | 324 (42.7%) | 109,115 (9,406.5%) |
| 2.0x to 2.9x | 115 (15.2%) | 522 (45.0%) |
| 3.0x to 3.9x | 102 (13.5%) | 297 (25.6%) |
| 4.0x or more | 193 (25.5%) | 4 (0.3%) |
| Total | 758 (100.0%) | 1,160 (100.0%) |
Real Estate Taxes by Mortgage Status in Grand Blanc
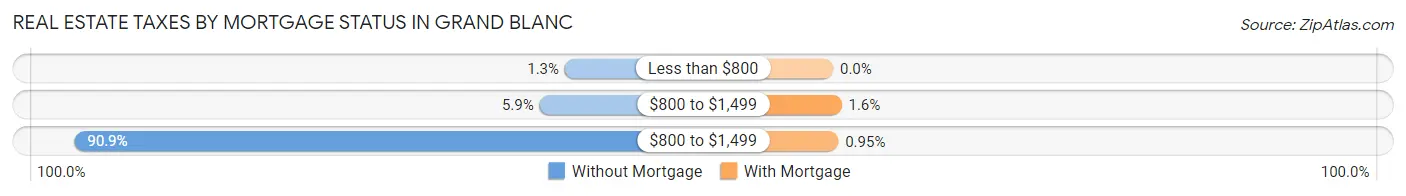
| Property Taxes | Without Mortgage | With Mortgage |
| Less than $800 | 10 (1.3%) | 0 (0.0%) |
| $800 to $1,499 | 45 (5.9%) | 18 (1.5%) |
| $800 to $1,499 | 689 (90.9%) | 11 (0.9%) |
| Total | 758 (100.0%) | 1,160 (100.0%) |
Health & Disability in Grand Blanc
Health Insurance Coverage by Age in Grand Blanc
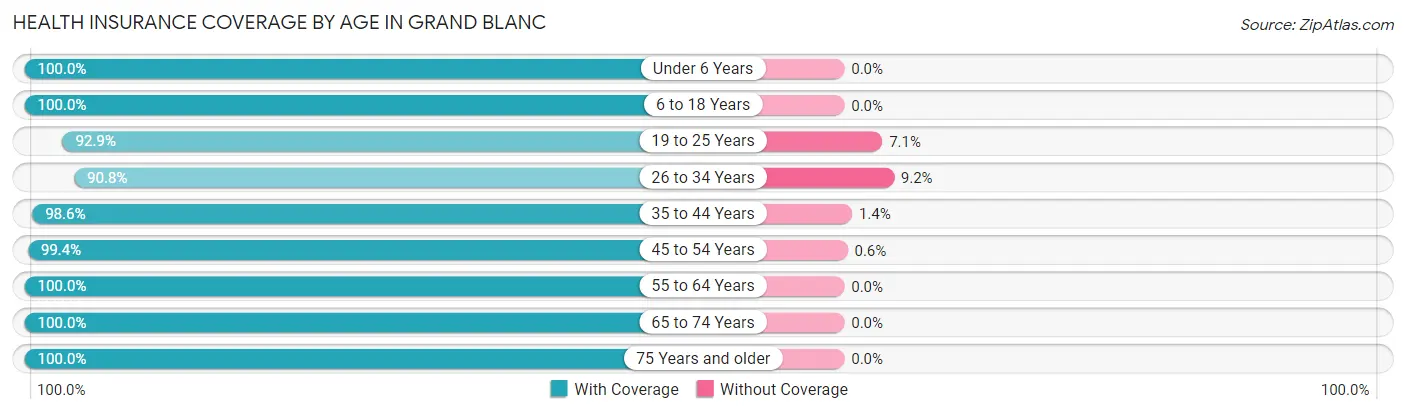
| Age Bracket | With Coverage | Without Coverage |
| Under 6 Years | 428 (100.0%) | 0 (0.0%) |
| 6 to 18 Years | 1,557 (100.0%) | 0 (0.0%) |
| 19 to 25 Years | 973 (92.9%) | 74 (7.1%) |
| 26 to 34 Years | 717 (90.8%) | 73 (9.2%) |
| 35 to 44 Years | 622 (98.6%) | 9 (1.4%) |
| 45 to 54 Years | 1,151 (99.4%) | 7 (0.6%) |
| 55 to 64 Years | 999 (100.0%) | 0 (0.0%) |
| 65 to 74 Years | 587 (100.0%) | 0 (0.0%) |
| 75 Years and older | 718 (100.0%) | 0 (0.0%) |
| Total | 7,752 (97.9%) | 163 (2.1%) |
Health Insurance Coverage by Citizenship Status in Grand Blanc
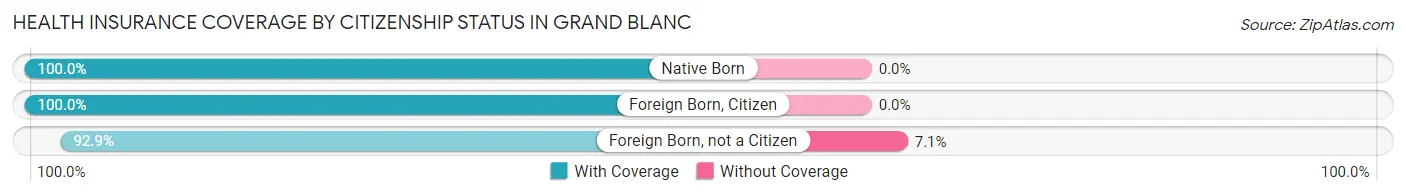
| Citizenship Status | With Coverage | Without Coverage |
| Native Born | 428 (100.0%) | 0 (0.0%) |
| Foreign Born, Citizen | 1,557 (100.0%) | 0 (0.0%) |
| Foreign Born, not a Citizen | 973 (92.9%) | 74 (7.1%) |
Health Insurance Coverage by Household Income in Grand Blanc
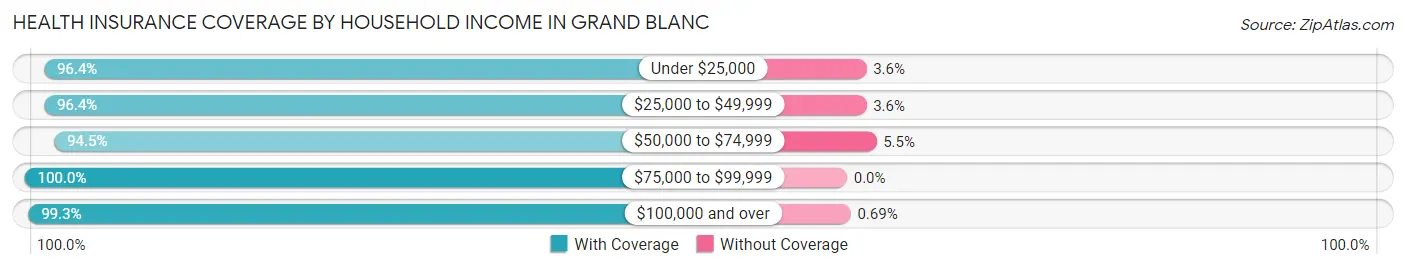
| Household Income | With Coverage | Without Coverage |
| Under $25,000 | 822 (96.4%) | 31 (3.6%) |
| $25,000 to $49,999 | 1,326 (96.4%) | 50 (3.6%) |
| $50,000 to $74,999 | 944 (94.5%) | 55 (5.5%) |
| $75,000 to $99,999 | 781 (100.0%) | 0 (0.0%) |
| $100,000 and over | 3,874 (99.3%) | 27 (0.7%) |
Public vs Private Health Insurance Coverage by Age in Grand Blanc
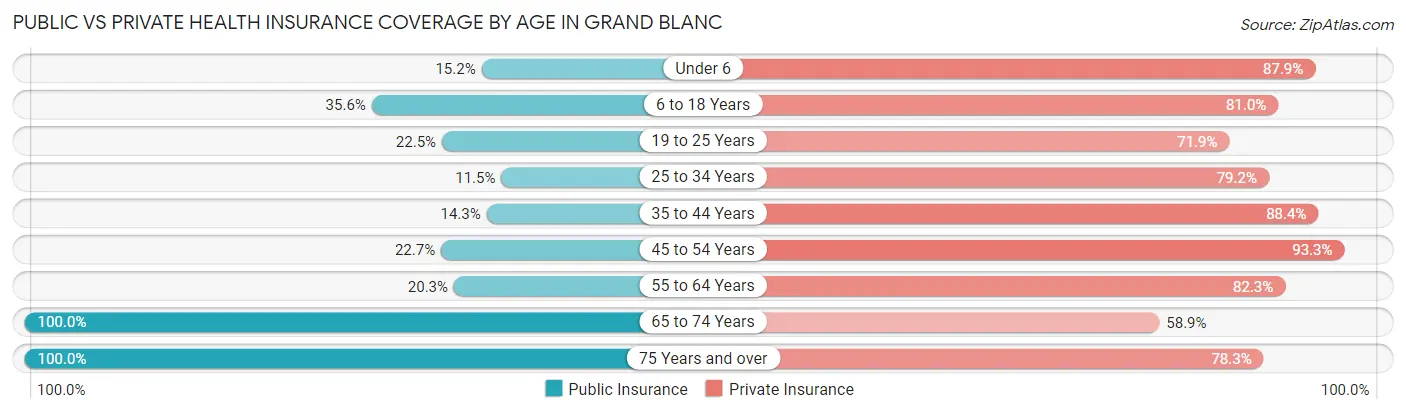
| Age Bracket | Public Insurance | Private Insurance |
| Under 6 | 65 (15.2%) | 376 (87.8%) |
| 6 to 18 Years | 554 (35.6%) | 1,261 (81.0%) |
| 19 to 25 Years | 236 (22.5%) | 753 (71.9%) |
| 25 to 34 Years | 91 (11.5%) | 626 (79.2%) |
| 35 to 44 Years | 90 (14.3%) | 558 (88.4%) |
| 45 to 54 Years | 263 (22.7%) | 1,080 (93.3%) |
| 55 to 64 Years | 203 (20.3%) | 822 (82.3%) |
| 65 to 74 Years | 587 (100.0%) | 346 (58.9%) |
| 75 Years and over | 718 (100.0%) | 562 (78.3%) |
| Total | 2,807 (35.5%) | 6,384 (80.7%) |
Disability Status by Sex by Age in Grand Blanc
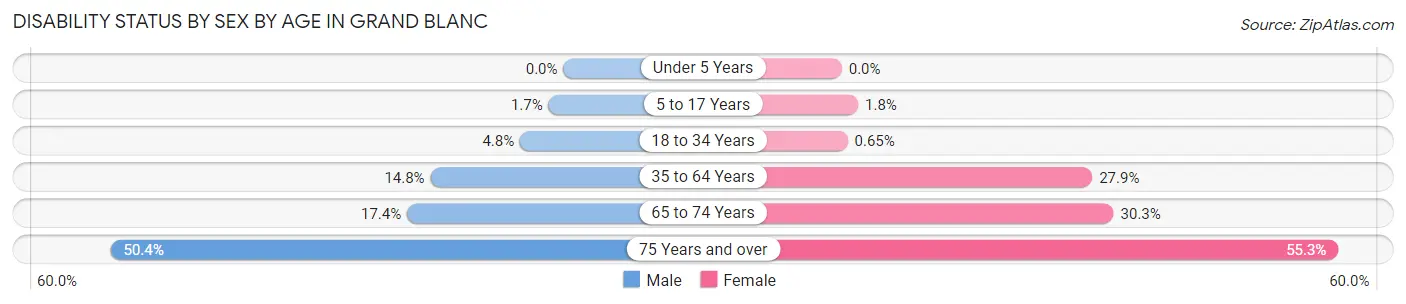
| Age Bracket | Male | Female |
| Under 5 Years | 0 (0.0%) | 0 (0.0%) |
| 5 to 17 Years | 12 (1.7%) | 12 (1.8%) |
| 18 to 34 Years | 60 (4.8%) | 5 (0.6%) |
| 35 to 64 Years | 186 (14.8%) | 427 (27.9%) |
| 65 to 74 Years | 51 (17.4%) | 89 (30.3%) |
| 75 Years and over | 176 (50.4%) | 204 (55.3%) |
Disability Class by Sex by Age in Grand Blanc
Disability Class: Hearing Difficulty
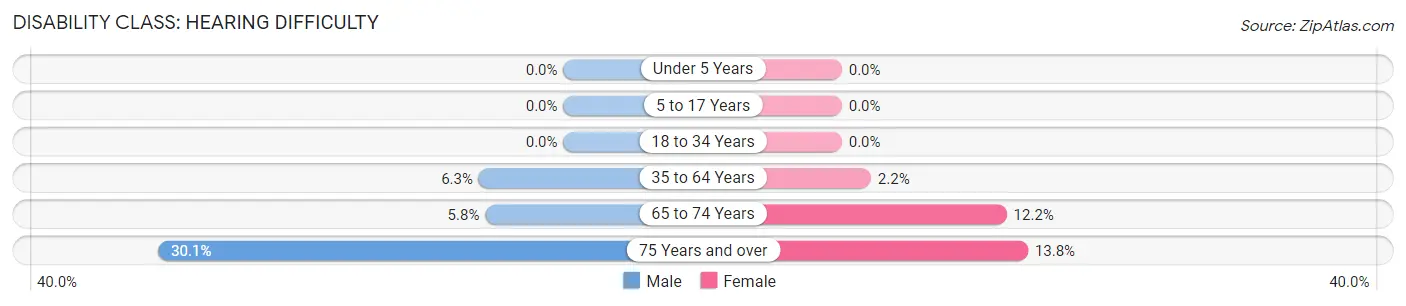
| Age Bracket | Male | Female |
| Under 5 Years | 0 (0.0%) | 0 (0.0%) |
| 5 to 17 Years | 0 (0.0%) | 0 (0.0%) |
| 18 to 34 Years | 0 (0.0%) | 0 (0.0%) |
| 35 to 64 Years | 79 (6.3%) | 33 (2.2%) |
| 65 to 74 Years | 17 (5.8%) | 36 (12.2%) |
| 75 Years and over | 105 (30.1%) | 51 (13.8%) |
Disability Class: Vision Difficulty
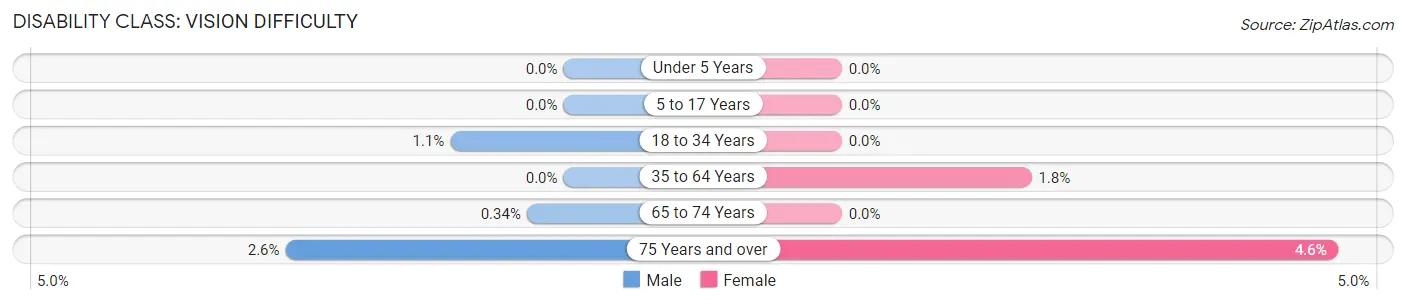
| Age Bracket | Male | Female |
| Under 5 Years | 0 (0.0%) | 0 (0.0%) |
| 5 to 17 Years | 0 (0.0%) | 0 (0.0%) |
| 18 to 34 Years | 13 (1.1%) | 0 (0.0%) |
| 35 to 64 Years | 0 (0.0%) | 27 (1.8%) |
| 65 to 74 Years | 1 (0.3%) | 0 (0.0%) |
| 75 Years and over | 9 (2.6%) | 17 (4.6%) |
Disability Class: Cognitive Difficulty
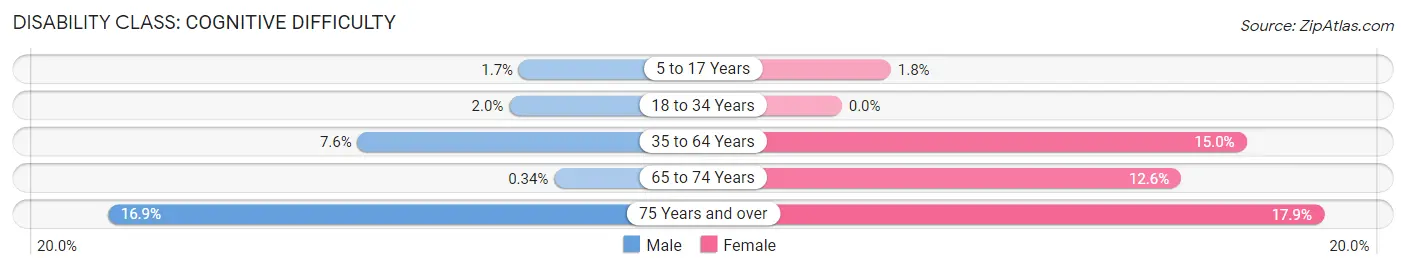
| Age Bracket | Male | Female |
| 5 to 17 Years | 12 (1.7%) | 12 (1.8%) |
| 18 to 34 Years | 25 (2.0%) | 0 (0.0%) |
| 35 to 64 Years | 96 (7.6%) | 230 (15.0%) |
| 65 to 74 Years | 1 (0.3%) | 37 (12.6%) |
| 75 Years and over | 59 (16.9%) | 66 (17.9%) |
Disability Class: Ambulatory Difficulty
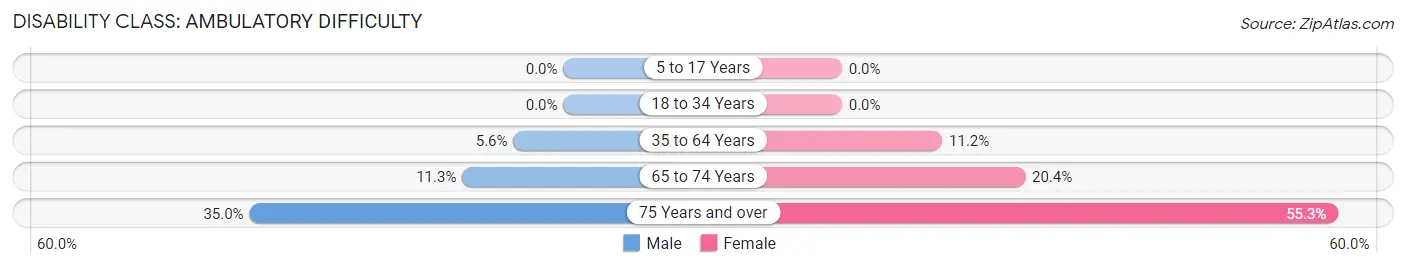
| Age Bracket | Male | Female |
| 5 to 17 Years | 0 (0.0%) | 0 (0.0%) |
| 18 to 34 Years | 0 (0.0%) | 0 (0.0%) |
| 35 to 64 Years | 70 (5.6%) | 171 (11.2%) |
| 65 to 74 Years | 33 (11.3%) | 60 (20.4%) |
| 75 Years and over | 122 (35.0%) | 204 (55.3%) |
Disability Class: Self-Care Difficulty
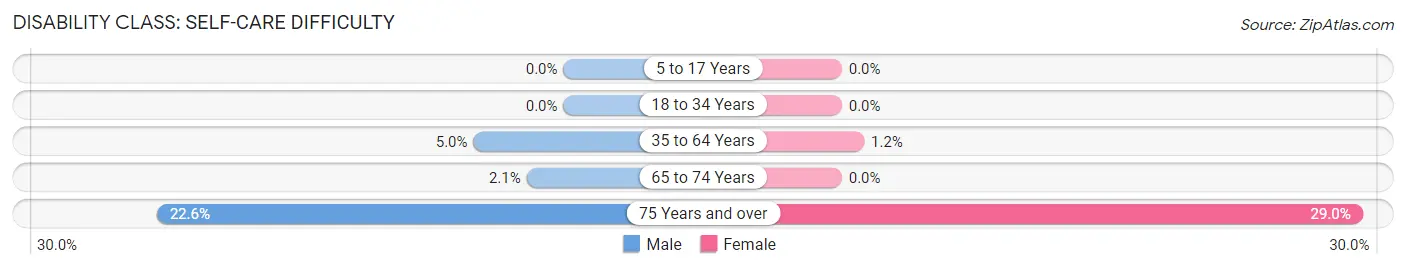
| Age Bracket | Male | Female |
| 5 to 17 Years | 0 (0.0%) | 0 (0.0%) |
| 18 to 34 Years | 0 (0.0%) | 0 (0.0%) |
| 35 to 64 Years | 63 (5.0%) | 19 (1.2%) |
| 65 to 74 Years | 6 (2.1%) | 0 (0.0%) |
| 75 Years and over | 79 (22.6%) | 107 (29.0%) |
Technology Access in Grand Blanc
Computing Device Access in Grand Blanc
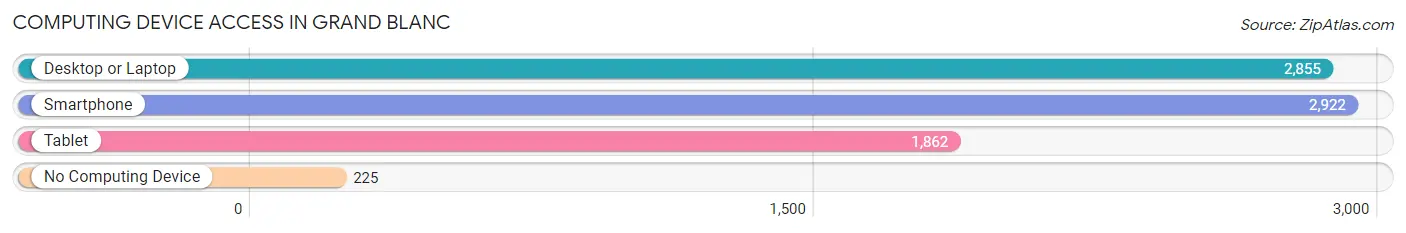
| Device Type | # Households | % Households |
| Desktop or Laptop | 2,855 | 81.7% |
| Smartphone | 2,922 | 83.6% |
| Tablet | 1,862 | 53.3% |
| No Computing Device | 225 | 6.4% |
| Total | 3,494 | 100.0% |
Internet Access in Grand Blanc
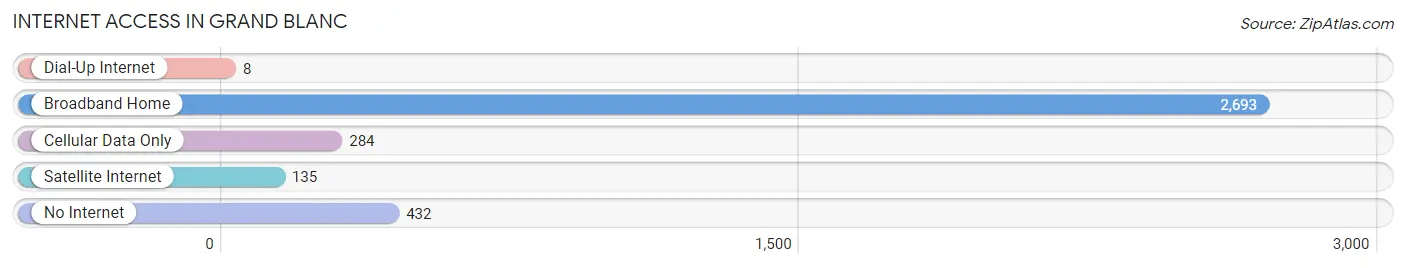
| Internet Type | # Households | % Households |
| Dial-Up Internet | 8 | 0.2% |
| Broadband Home | 2,693 | 77.1% |
| Cellular Data Only | 284 | 8.1% |
| Satellite Internet | 135 | 3.9% |
| No Internet | 432 | 12.4% |
| Total | 3,494 | 100.0% |
Grand Blanc Summary
History
The area now known as Grand Blanc, Michigan was first inhabited by the Ojibwa people, who were part of the Anishinaabe nation. The Ojibwa were a nomadic people who moved around the area, hunting and fishing. They were eventually displaced by European settlers in the early 19th century.
The first permanent settlers in the area were French-Canadian fur traders, who established a trading post in the area in 1819. The trading post was located near the present-day intersection of Grand Blanc Road and Saginaw Street. The settlement was named Grand Blanc, after the French phrase for “great white”, in reference to the white sand of the nearby Flint River.
The settlement grew slowly, but steadily, over the next few decades. In 1836, the first post office was established in the area. In 1845, the first school was built. In 1855, the first church was built.
In 1871, the village of Grand Blanc was officially incorporated. The village was located on the Flint River, and was a popular stop for steamboats traveling between Flint and Saginaw.
In the late 19th century, the village of Grand Blanc began to grow rapidly. The population increased from just over 500 in 1880 to over 2,000 in 1900. This growth was due in part to the arrival of the railroad in 1883, which connected Grand Blanc to other towns in the area.
The village of Grand Blanc was officially incorporated as a city in 1908. The city continued to grow throughout the 20th century, and by 2000, the population had grown to over 8,000.
Geography
Grand Blanc is located in Genesee County, Michigan. It is situated on the Flint River, about 25 miles north of Flint and about 50 miles northwest of Detroit. The city covers an area of 8.2 square miles, and has an elevation of 845 feet.
The city is located in a region of rolling hills and wooded areas. The terrain is mostly flat, with some areas of higher elevation. The climate is humid continental, with cold winters and hot, humid summers.
Economy
The economy of Grand Blanc is largely based on manufacturing and retail. The city is home to several large manufacturing companies, including General Motors, Delphi, and Lear Corporation. The city is also home to several retail stores, including Walmart, Target, and Meijer.
The city is also home to several educational institutions, including the University of Michigan-Flint, Mott Community College, and Baker College.
Demographics
As of the 2010 census, the population of Grand Blanc was 8,345. The racial makeup of the city was 79.2% White, 14.2% African American, 0.5% Native American, 1.7% Asian, 0.1% Pacific Islander, and 3.3% from other races. Hispanic or Latino of any race were 5.2% of the population.
The median household income in Grand Blanc was $50,945, and the median family income was $60,945. The per capita income was $25,945. About 8.2% of families and 10.2% of the population were below the poverty line.
Common Questions
What is Per Capita Income in Grand Blanc?
Per Capita income in Grand Blanc is $44,504.
What is the Median Family Income in Grand Blanc?
Median Family Income in Grand Blanc is $105,395.
What is the Median Household income in Grand Blanc?
Median Household Income in Grand Blanc is $70,518.
What is Income or Wage Gap in Grand Blanc?
Income or Wage Gap in Grand Blanc is 15.5%.
Women in Grand Blanc earn 84.5 cents for every dollar earned by a man.
What is Inequality or Gini Index in Grand Blanc?
Inequality or Gini Index in Grand Blanc is 0.48.
What is the Total Population of Grand Blanc?
Total Population of Grand Blanc is 8,034.
What is the Total Male Population of Grand Blanc?
Total Male Population of Grand Blanc is 4,194.
What is the Total Female Population of Grand Blanc?
Total Female Population of Grand Blanc is 3,840.
What is the Ratio of Males per 100 Females in Grand Blanc?
There are 109.22 Males per 100 Females in Grand Blanc.
What is the Ratio of Females per 100 Males in Grand Blanc?
There are 91.56 Females per 100 Males in Grand Blanc.
What is the Median Population Age in Grand Blanc?
Median Population Age in Grand Blanc is 38.3 Years.
What is the Average Family Size in Grand Blanc
Average Family Size in Grand Blanc is 3.1 People.
What is the Average Household Size in Grand Blanc
Average Household Size in Grand Blanc is 2.3 People.
How Large is the Labor Force in Grand Blanc?
There are 3,911 People in the Labor Forcein in Grand Blanc.
What is the Percentage of People in the Labor Force in Grand Blanc?
60.3% of People are in the Labor Force in Grand Blanc.
What is the Unemployment Rate in Grand Blanc?
Unemployment Rate in Grand Blanc is 5.8%.