Le Mars, IA Map & Demographics
Le Mars Map
Le Mars Overview
$37,266
PER CAPITA INCOME
$85,802
AVG FAMILY INCOME
$73,734
AVG HOUSEHOLD INCOME
21.7%
WAGE / INCOME GAP [ % ]
78.3¢/ $1
WAGE / INCOME GAP [ $ ]
$6,415
FAMILY INCOME DEFICIT
0.40
INEQUALITY / GINI INDEX
10,549
TOTAL POPULATION
5,241
MALE POPULATION
5,308
FEMALE POPULATION
98.74
MALES / 100 FEMALES
101.28
FEMALES / 100 MALES
39.3
MEDIAN AGE
3.0
AVG FAMILY SIZE
2.4
AVG HOUSEHOLD SIZE
5,673
LABOR FORCE [ PEOPLE ]
69.8%
PERCENT IN LABOR FORCE
2.7%
UNEMPLOYMENT RATE
Le Mars Zip Codes
Le Mars Area Codes
Income in Le Mars
Income Overview in Le Mars
Per Capita Income in Le Mars is $37,266, while median incomes of families and households are $85,802 and $73,734 respectively.
| Characteristic | Number | Measure |
| Per Capita Income | 10,549 | $37,266 |
| Median Family Income | 2,884 | $85,802 |
| Mean Family Income | 2,884 | $101,931 |
| Median Household Income | 4,296 | $73,734 |
| Mean Household Income | 4,296 | $89,587 |
| Income Deficit | 2,884 | $6,415 |
| Wage / Income Gap (%) | 10,549 | 21.71% |
| Wage / Income Gap ($) | 10,549 | 78.29¢ per $1 |
| Gini / Inequality Index | 10,549 | 0.40 |
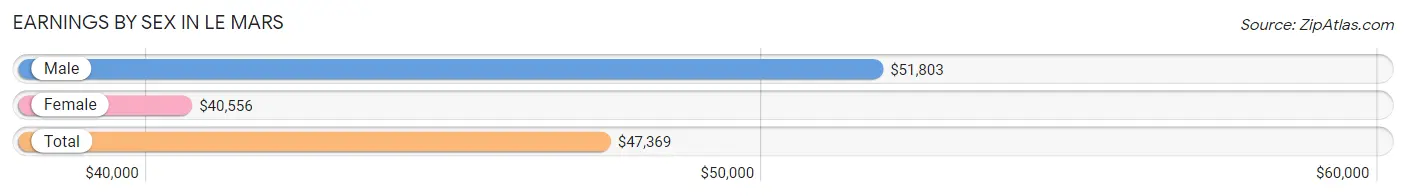
Earnings by Sex in Le Mars
Average Earnings in Le Mars are $47,369, $51,803 for men and $40,556 for women, a difference of 21.7%.
| Sex | Number | Average Earnings |
| Male | 3,092 (53.0%) | $51,803 |
| Female | 2,746 (47.0%) | $40,556 |
| Total | 5,838 (100.0%) | $47,369 |
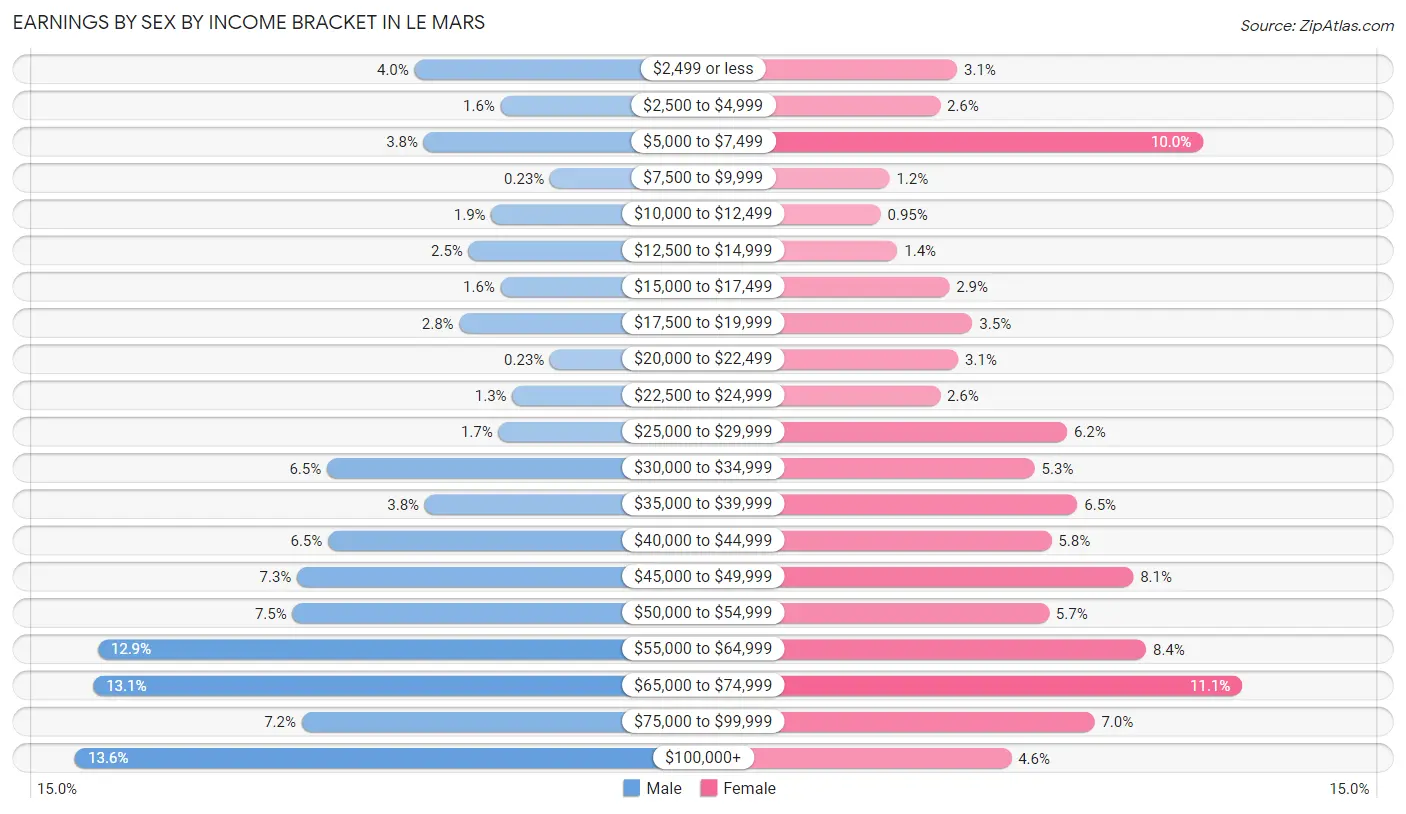
Earnings by Sex by Income Bracket in Le Mars
The most common earnings brackets in Le Mars are $100,000+ for men (420 | 13.6%) and $65,000 to $74,999 for women (305 | 11.1%).
| Income | Male | Female |
| $2,499 or less | 125 (4.0%) | 85 (3.1%) |
| $2,500 to $4,999 | 50 (1.6%) | 72 (2.6%) |
| $5,000 to $7,499 | 117 (3.8%) | 275 (10.0%) |
| $7,500 to $9,999 | 7 (0.2%) | 33 (1.2%) |
| $10,000 to $12,499 | 58 (1.9%) | 26 (0.9%) |
| $12,500 to $14,999 | 78 (2.5%) | 39 (1.4%) |
| $15,000 to $17,499 | 50 (1.6%) | 79 (2.9%) |
| $17,500 to $19,999 | 86 (2.8%) | 97 (3.5%) |
| $20,000 to $22,499 | 7 (0.2%) | 86 (3.1%) |
| $22,500 to $24,999 | 40 (1.3%) | 72 (2.6%) |
| $25,000 to $29,999 | 52 (1.7%) | 170 (6.2%) |
| $30,000 to $34,999 | 201 (6.5%) | 145 (5.3%) |
| $35,000 to $39,999 | 116 (3.7%) | 178 (6.5%) |
| $40,000 to $44,999 | 200 (6.5%) | 158 (5.8%) |
| $45,000 to $49,999 | 227 (7.3%) | 221 (8.1%) |
| $50,000 to $54,999 | 231 (7.5%) | 156 (5.7%) |
| $55,000 to $64,999 | 400 (12.9%) | 231 (8.4%) |
| $65,000 to $74,999 | 404 (13.1%) | 305 (11.1%) |
| $75,000 to $99,999 | 223 (7.2%) | 191 (7.0%) |
| $100,000+ | 420 (13.6%) | 127 (4.6%) |
| Total | 3,092 (100.0%) | 2,746 (100.0%) |
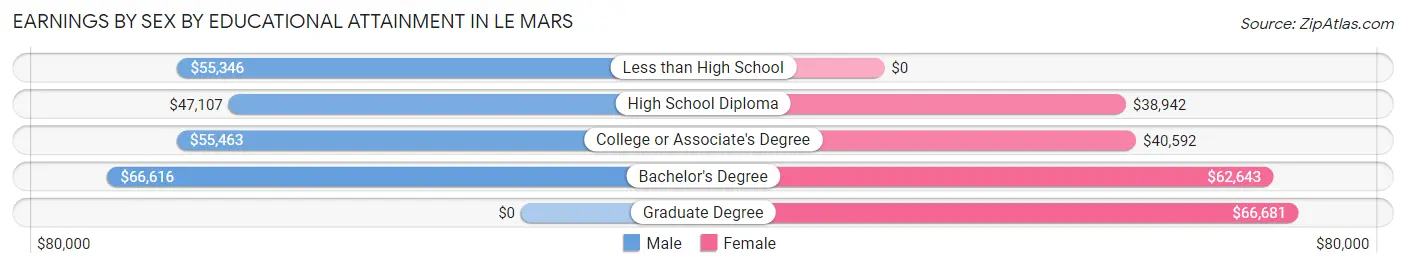
Earnings by Sex by Educational Attainment in Le Mars
Average earnings in Le Mars are $57,044 for men and $46,221 for women, a difference of 19.0%. Men with an educational attainment of bachelor's degree enjoy the highest average annual earnings of $66,616, while those with high school diploma education earn the least with $47,107. Women with an educational attainment of graduate degree earn the most with the average annual earnings of $66,681, while those with high school diploma education have the smallest earnings of $38,942.
| Educational Attainment | Male Income | Female Income |
| Less than High School | $55,346 | $0 |
| High School Diploma | $47,107 | $38,942 |
| College or Associate's Degree | $55,463 | $40,592 |
| Bachelor's Degree | $66,616 | $62,643 |
| Graduate Degree | - | - |
| Total | $57,044 | $46,221 |
Family Income in Le Mars
Family Income Brackets in Le Mars
According to the Le Mars family income data, there are 715 families falling into the $50,000 to $74,999 income range, which is the most common income bracket and makes up 24.8% of all families. Conversely, the less than $10,000 income bracket is the least frequent group with only 6 families (0.2%) belonging to this category.
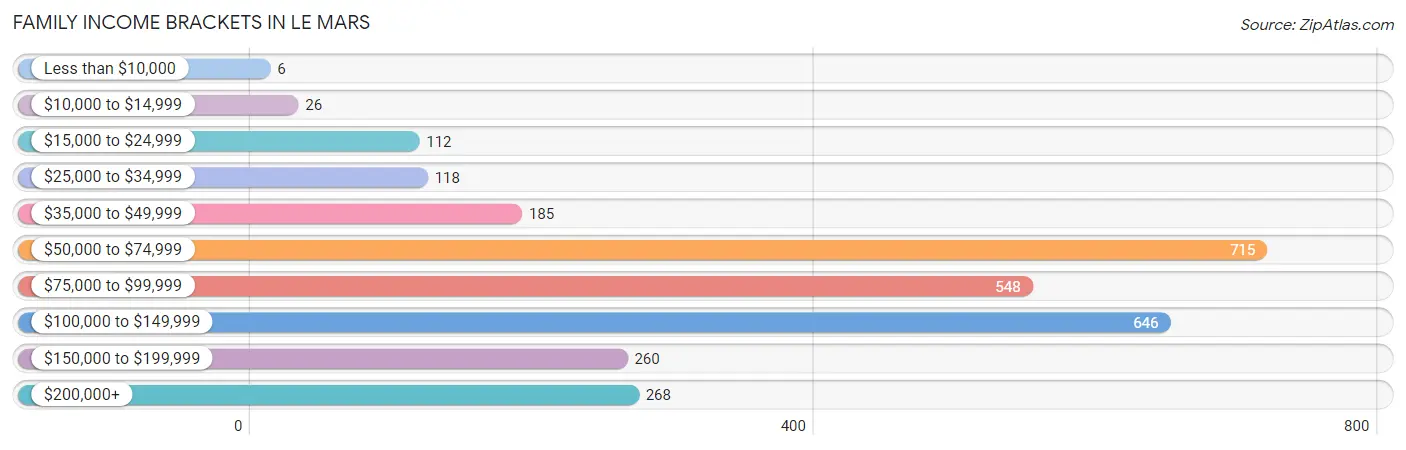
| Income Bracket | # Families | % Families |
| Less than $10,000 | 6 | 0.2% |
| $10,000 to $14,999 | 26 | 0.9% |
| $15,000 to $24,999 | 112 | 3.9% |
| $25,000 to $34,999 | 118 | 4.1% |
| $35,000 to $49,999 | 185 | 6.4% |
| $50,000 to $74,999 | 715 | 24.8% |
| $75,000 to $99,999 | 548 | 19.0% |
| $100,000 to $149,999 | 646 | 22.4% |
| $150,000 to $199,999 | 260 | 9.0% |
| $200,000+ | 268 | 9.3% |
Family Income by Famaliy Size in Le Mars
5-person families (375 | 13.0%) account for the highest median family income in Le Mars with $150,245 per family, while 2-person families (1,345 | 46.6%) have the highest median income of $37,580 per family member.
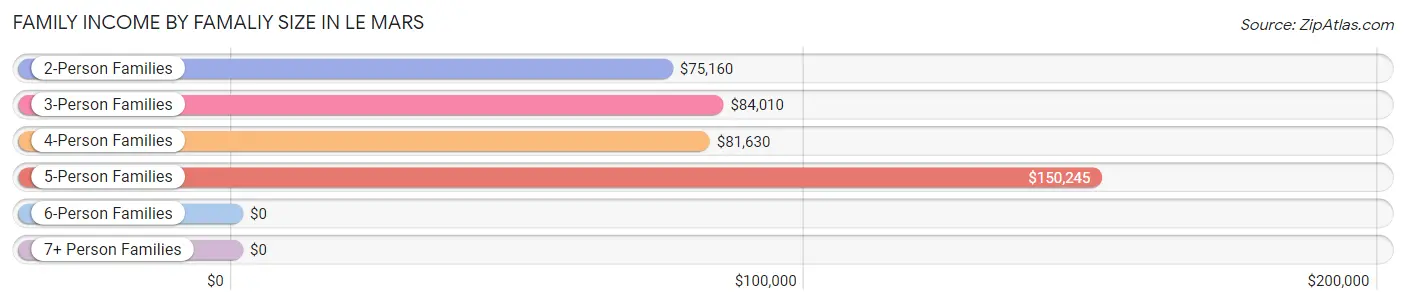
| Income Bracket | # Families | Median Income |
| 2-Person Families | 1,345 (46.6%) | $75,160 |
| 3-Person Families | 518 (18.0%) | $84,010 |
| 4-Person Families | 574 (19.9%) | $81,630 |
| 5-Person Families | 375 (13.0%) | $150,245 |
| 6-Person Families | 47 (1.6%) | $0 |
| 7+ Person Families | 25 (0.9%) | $0 |
| Total | 2,884 (100.0%) | $85,802 |
Family Income by Number of Earners in Le Mars
The median family income in Le Mars is $85,802, with families comprising 3+ earners (363) having the highest median family income of $123,550, while families with no earners (361) have the lowest median family income of $46,792, accounting for 12.6% and 12.5% of families, respectively.
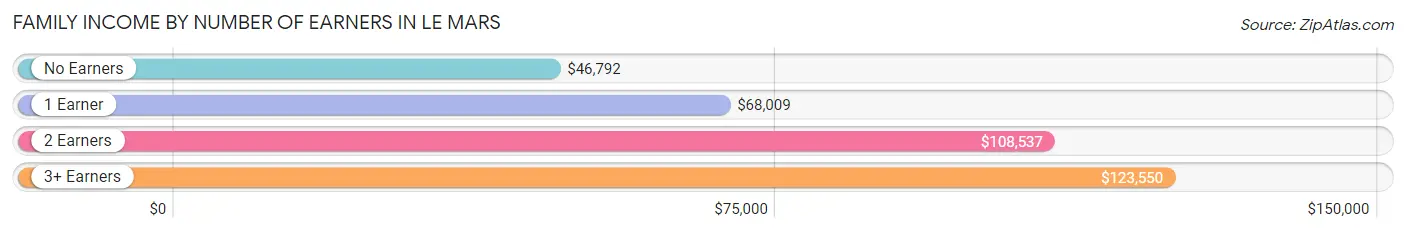
| Number of Earners | # Families | Median Income |
| No Earners | 361 (12.5%) | $46,792 |
| 1 Earner | 717 (24.9%) | $68,009 |
| 2 Earners | 1,443 (50.0%) | $108,537 |
| 3+ Earners | 363 (12.6%) | $123,550 |
| Total | 2,884 (100.0%) | $85,802 |
Household Income in Le Mars
Household Income Brackets in Le Mars
With 967 households falling in the category, the $50,000 to $74,999 income range is the most frequent in Le Mars, accounting for 22.5% of all households. In contrast, only 125 households (2.9%) fall into the $10,000 to $14,999 income bracket, making it the least populous group.
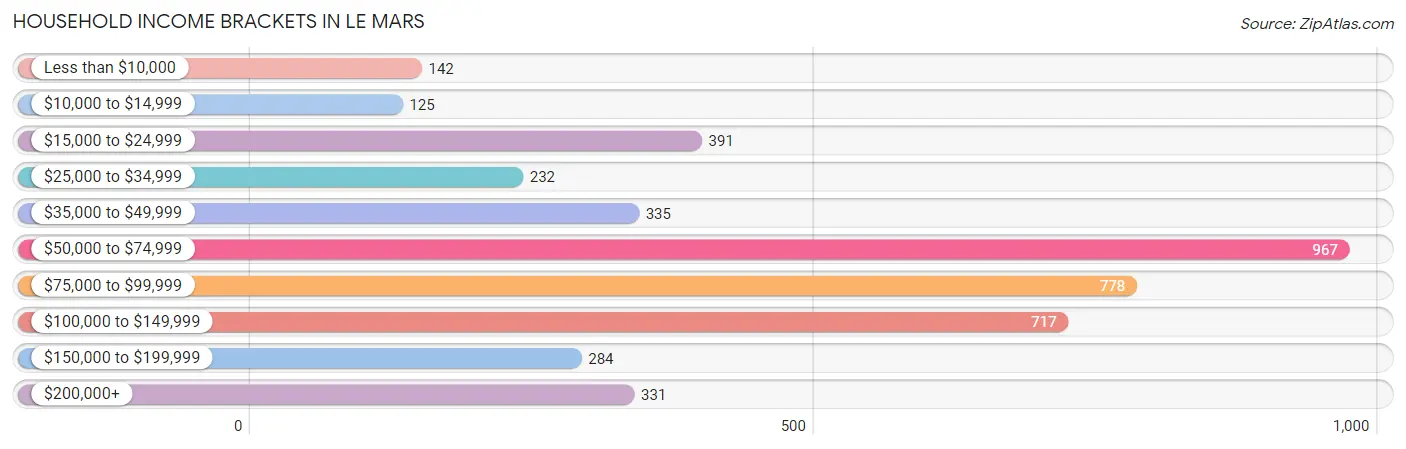
| Income Bracket | # Households | % Households |
| Less than $10,000 | 142 | 3.3% |
| $10,000 to $14,999 | 125 | 2.9% |
| $15,000 to $24,999 | 391 | 9.1% |
| $25,000 to $34,999 | 232 | 5.4% |
| $35,000 to $49,999 | 335 | 7.8% |
| $50,000 to $74,999 | 967 | 22.5% |
| $75,000 to $99,999 | 778 | 18.1% |
| $100,000 to $149,999 | 717 | 16.7% |
| $150,000 to $199,999 | 284 | 6.6% |
| $200,000+ | 331 | 7.7% |
Household Income by Householder Age in Le Mars
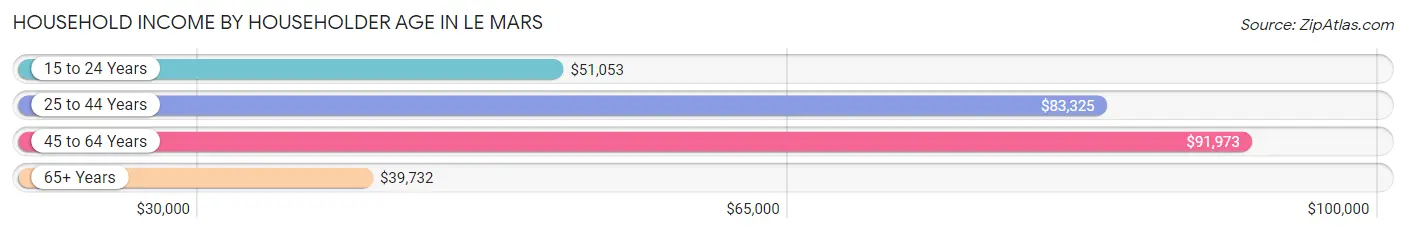
The median household income in Le Mars is $73,734, with the highest median household income of $91,973 found in the 45 to 64 years age bracket for the primary householder. A total of 1,523 households (35.4%) fall into this category. Meanwhile, the 65+ years age bracket for the primary householder has the lowest median household income of $39,732, with 1,249 households (29.1%) in this group.
| Income Bracket | # Households | Median Income |
| 15 to 24 Years | 194 (4.5%) | $51,053 |
| 25 to 44 Years | 1,330 (31.0%) | $83,325 |
| 45 to 64 Years | 1,523 (35.4%) | $91,973 |
| 65+ Years | 1,249 (29.1%) | $39,732 |
| Total | 4,296 (100.0%) | $73,734 |
Poverty in Le Mars
Income Below Poverty by Sex and Age in Le Mars
With 6.7% poverty level for males and 7.0% for females among the residents of Le Mars, 15 year old males and 65 to 74 year old females are the most vulnerable to poverty, with 53 males (37.9%) and 91 females (17.9%) in their respective age groups living below the poverty level.
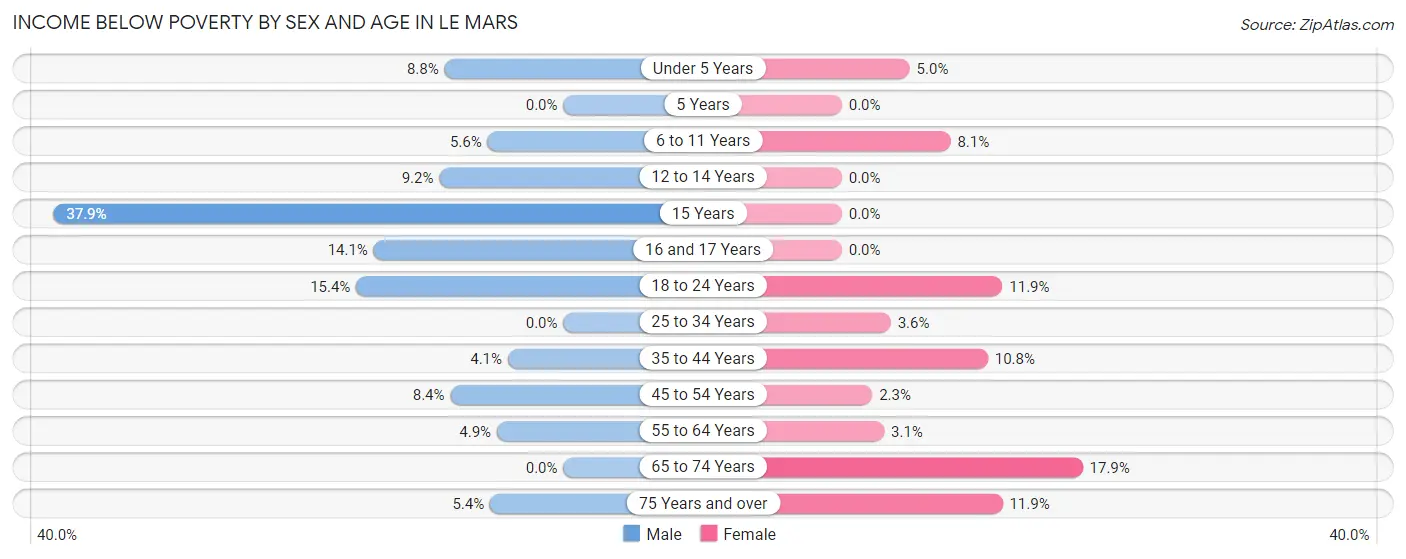
| Age Bracket | Male | Female |
| Under 5 Years | 27 (8.8%) | 18 (5.0%) |
| 5 Years | 0 (0.0%) | 0 (0.0%) |
| 6 to 11 Years | 22 (5.6%) | 23 (8.1%) |
| 12 to 14 Years | 21 (9.2%) | 0 (0.0%) |
| 15 Years | 53 (37.9%) | 0 (0.0%) |
| 16 and 17 Years | 29 (14.1%) | 0 (0.0%) |
| 18 to 24 Years | 66 (15.4%) | 49 (11.9%) |
| 25 to 34 Years | 0 (0.0%) | 22 (3.6%) |
| 35 to 44 Years | 22 (4.1%) | 70 (10.8%) |
| 45 to 54 Years | 64 (8.4%) | 14 (2.3%) |
| 55 to 64 Years | 30 (4.9%) | 19 (3.1%) |
| 65 to 74 Years | 0 (0.0%) | 91 (17.9%) |
| 75 Years and over | 16 (5.4%) | 60 (11.9%) |
| Total | 350 (6.7%) | 366 (7.0%) |
Income Above Poverty by Sex and Age in Le Mars
According to the poverty statistics in Le Mars, males aged 5 years and females aged 5 years are the age groups that are most secure financially, with 100.0% of males and 100.0% of females in these age groups living above the poverty line.
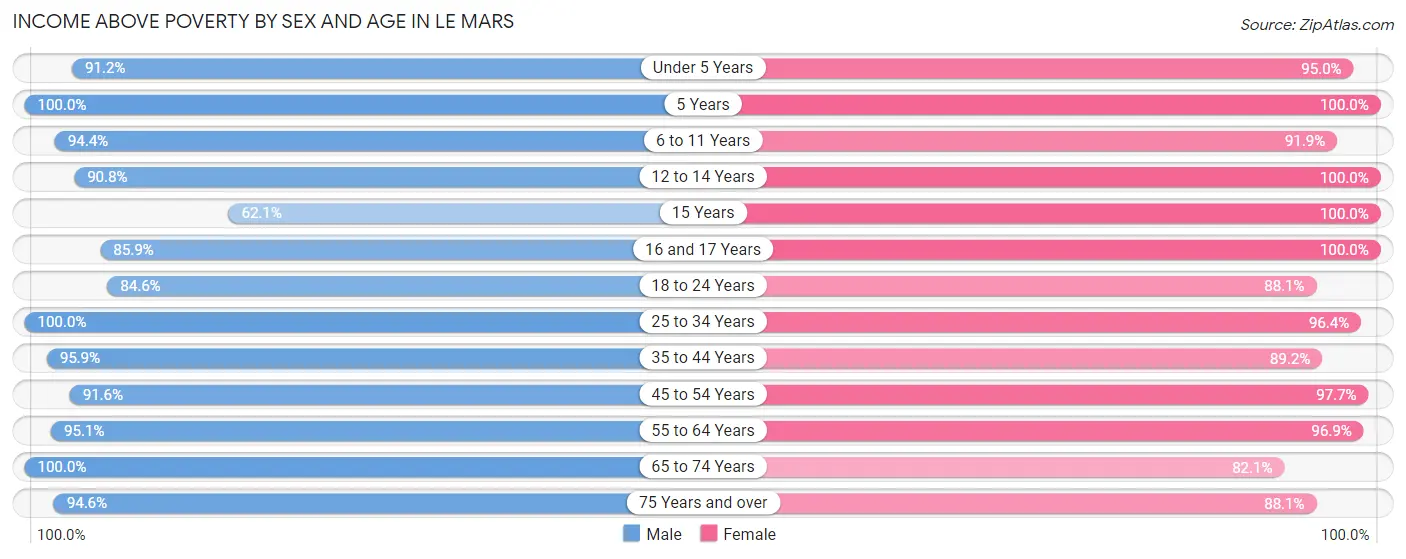
| Age Bracket | Male | Female |
| Under 5 Years | 279 (91.2%) | 339 (95.0%) |
| 5 Years | 173 (100.0%) | 178 (100.0%) |
| 6 to 11 Years | 369 (94.4%) | 262 (91.9%) |
| 12 to 14 Years | 207 (90.8%) | 309 (100.0%) |
| 15 Years | 87 (62.1%) | 55 (100.0%) |
| 16 and 17 Years | 177 (85.9%) | 111 (100.0%) |
| 18 to 24 Years | 363 (84.6%) | 362 (88.1%) |
| 25 to 34 Years | 631 (100.0%) | 584 (96.4%) |
| 35 to 44 Years | 512 (95.9%) | 576 (89.2%) |
| 45 to 54 Years | 699 (91.6%) | 606 (97.7%) |
| 55 to 64 Years | 578 (95.1%) | 586 (96.9%) |
| 65 to 74 Years | 507 (100.0%) | 418 (82.1%) |
| 75 Years and over | 278 (94.6%) | 443 (88.1%) |
| Total | 4,860 (93.3%) | 4,829 (92.9%) |
Income Below Poverty Among Married-Couple Families in Le Mars
The poverty statistics for married-couple families in Le Mars show that 2.0% or 48 of the total 2,353 families live below the poverty line. Families with 1 or 2 children have the highest poverty rate of 2.7%, comprising of 21 families. On the other hand, families with 3 or 4 children have the lowest poverty rate of 0.0%, which includes 0 families.
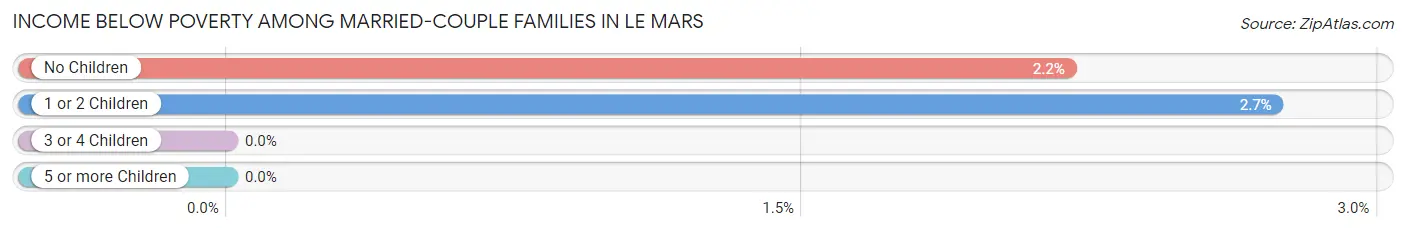
| Children | Above Poverty | Below Poverty |
| No Children | 1,208 (97.8%) | 27 (2.2%) |
| 1 or 2 Children | 747 (97.3%) | 21 (2.7%) |
| 3 or 4 Children | 334 (100.0%) | 0 (0.0%) |
| 5 or more Children | 16 (100.0%) | 0 (0.0%) |
| Total | 2,305 (98.0%) | 48 (2.0%) |
Income Below Poverty Among Single-Parent Households in Le Mars
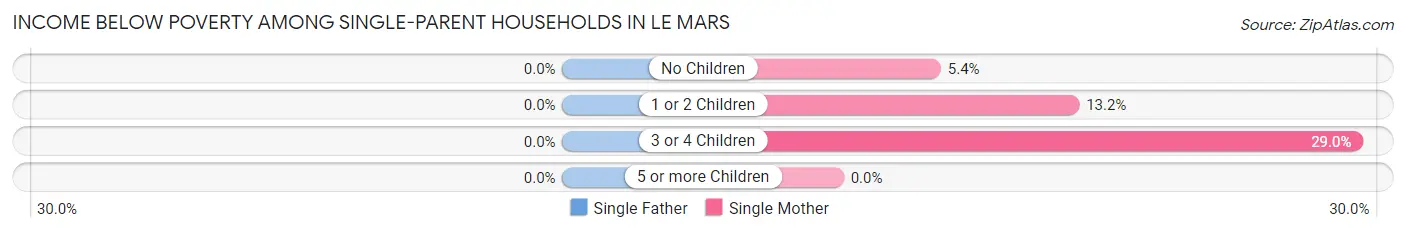
| Children | Single Father | Single Mother |
| No Children | 0 (0.0%) | 7 (5.4%) |
| 1 or 2 Children | 0 (0.0%) | 20 (13.2%) |
| 3 or 4 Children | 0 (0.0%) | 27 (29.0%) |
| 5 or more Children | 0 (0.0%) | 0 (0.0%) |
| Total | 0 (0.0%) | 54 (14.4%) |
Income Below Poverty Among Married-Couple vs Single-Parent Households in Le Mars
The poverty data for Le Mars shows that 48 of the married-couple family households (2.0%) and 54 of the single-parent households (10.2%) are living below the poverty level. Within the married-couple family households, those with 1 or 2 children have the highest poverty rate, with 21 households (2.7%) falling below the poverty line. Among the single-parent households, those with 3 or 4 children have the highest poverty rate, with 27 household (26.7%) living below poverty.
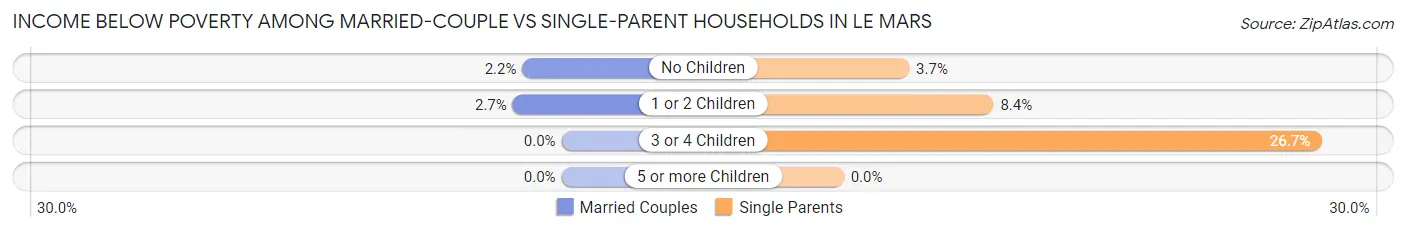
| Children | Married-Couple Families | Single-Parent Households |
| No Children | 27 (2.2%) | 7 (3.7%) |
| 1 or 2 Children | 21 (2.7%) | 20 (8.4%) |
| 3 or 4 Children | 0 (0.0%) | 27 (26.7%) |
| 5 or more Children | 0 (0.0%) | 0 (0.0%) |
| Total | 48 (2.0%) | 54 (10.2%) |
Race in Le Mars
The most populous races in Le Mars are White / Caucasian (9,465 | 89.7%), Hispanic or Latino (823 | 7.8%), and Black / African American (388 | 3.7%).
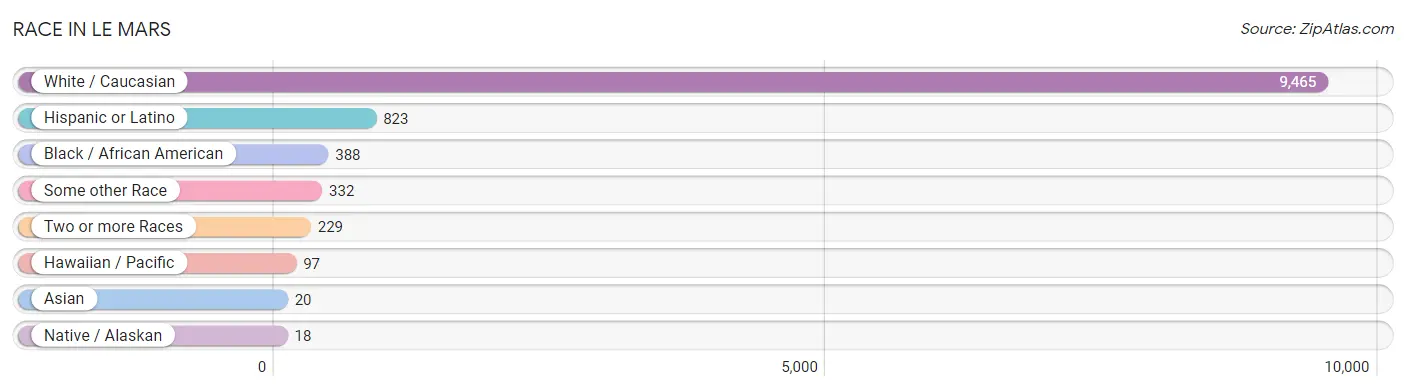
| Race | # Population | % Population |
| Asian | 20 | 0.2% |
| Black / African American | 388 | 3.7% |
| Hawaiian / Pacific | 97 | 0.9% |
| Hispanic or Latino | 823 | 7.8% |
| Native / Alaskan | 18 | 0.2% |
| White / Caucasian | 9,465 | 89.7% |
| Two or more Races | 229 | 2.2% |
| Some other Race | 332 | 3.2% |
| Total | 10,549 | 100.0% |
Ancestry in Le Mars
The most populous ancestries reported in Le Mars are German (4,382 | 41.5%), Irish (1,341 | 12.7%), Dutch (848 | 8.0%), English (523 | 5.0%), and Mexican (508 | 4.8%), together accounting for 72.1% of all Le Mars residents.
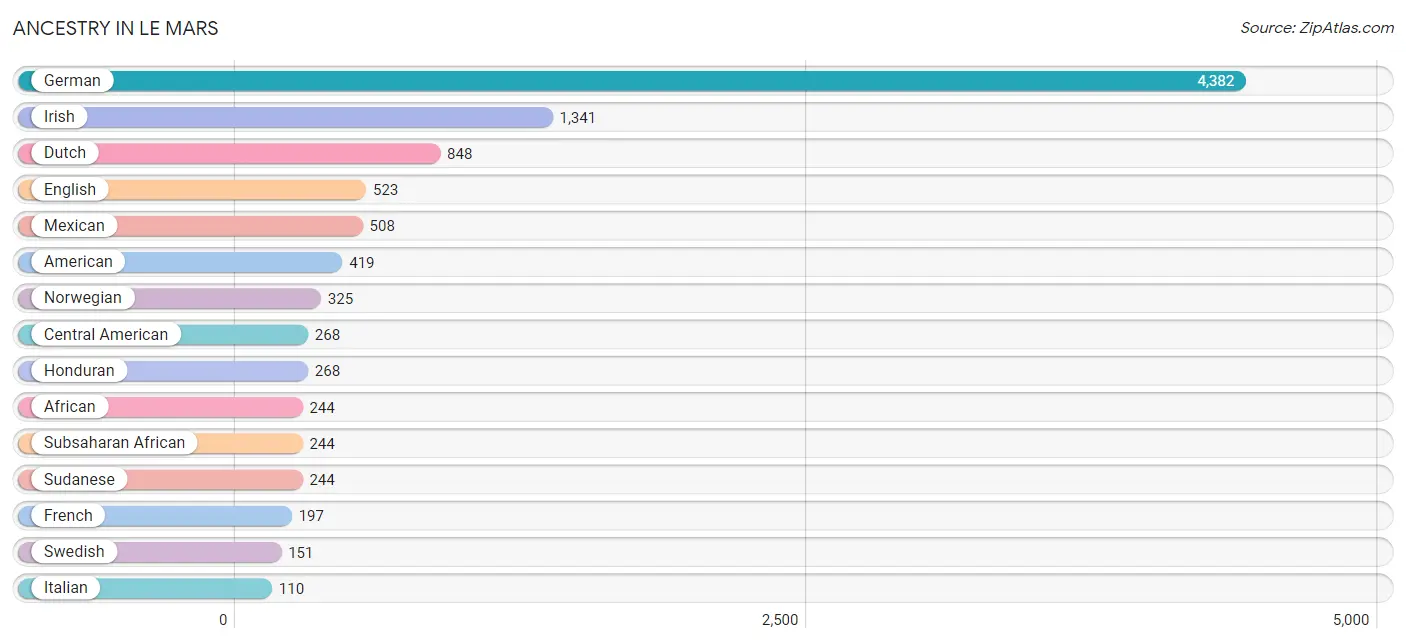
| Ancestry | # Population | % Population |
| African | 244 | 2.3% |
| American | 419 | 4.0% |
| Australian | 7 | 0.1% |
| Austrian | 3 | 0.0% |
| Belgian | 29 | 0.3% |
| British | 44 | 0.4% |
| Central American | 268 | 2.5% |
| Czech | 77 | 0.7% |
| Danish | 48 | 0.5% |
| Dominican | 36 | 0.3% |
| Dutch | 848 | 8.0% |
| Eastern European | 36 | 0.3% |
| English | 523 | 5.0% |
| European | 18 | 0.2% |
| French | 197 | 1.9% |
| German | 4,382 | 41.5% |
| Honduran | 268 | 2.5% |
| Irish | 1,341 | 12.7% |
| Italian | 110 | 1.0% |
| Korean | 37 | 0.4% |
| Luxembourger | 59 | 0.6% |
| Mexican | 508 | 4.8% |
| Northern European | 10 | 0.1% |
| Norwegian | 325 | 3.1% |
| Polish | 84 | 0.8% |
| Russian | 8 | 0.1% |
| Scandinavian | 71 | 0.7% |
| Scotch-Irish | 76 | 0.7% |
| Scottish | 57 | 0.5% |
| Sioux | 21 | 0.2% |
| Subsaharan African | 244 | 2.3% |
| Sudanese | 244 | 2.3% |
| Swedish | 151 | 1.4% |
| Welsh | 13 | 0.1% | View All 34 Rows |
Immigrants in Le Mars
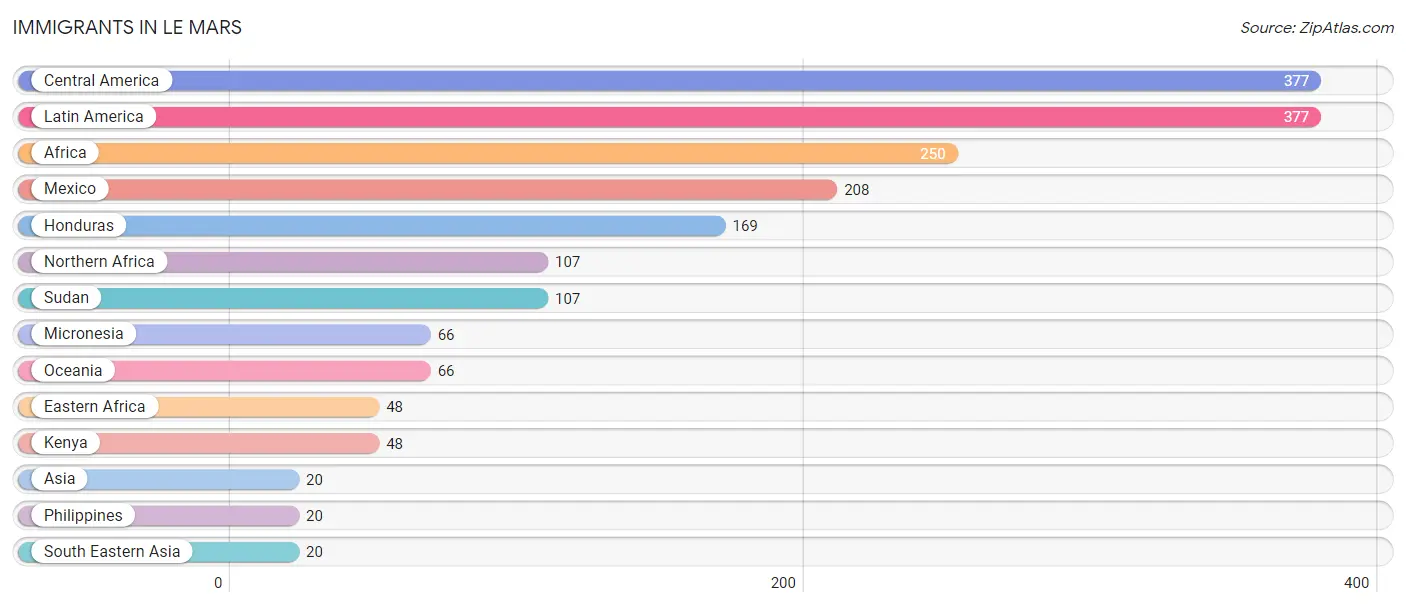
The most numerous immigrant groups reported in Le Mars came from Central America (377 | 3.6%), Latin America (377 | 3.6%), Africa (250 | 2.4%), Mexico (208 | 2.0%), and Honduras (169 | 1.6%), together accounting for 13.1% of all Le Mars residents.
| Immigration Origin | # Population | % Population |
| Africa | 250 | 2.4% |
| Asia | 20 | 0.2% |
| Central America | 377 | 3.6% |
| Eastern Africa | 48 | 0.5% |
| Honduras | 169 | 1.6% |
| Kenya | 48 | 0.5% |
| Latin America | 377 | 3.6% |
| Mexico | 208 | 2.0% |
| Micronesia | 66 | 0.6% |
| Northern Africa | 107 | 1.0% |
| Oceania | 66 | 0.6% |
| Philippines | 20 | 0.2% |
| South Eastern Asia | 20 | 0.2% |
| Sudan | 107 | 1.0% | View All 14 Rows |
Sex and Age in Le Mars
Sex and Age in Le Mars
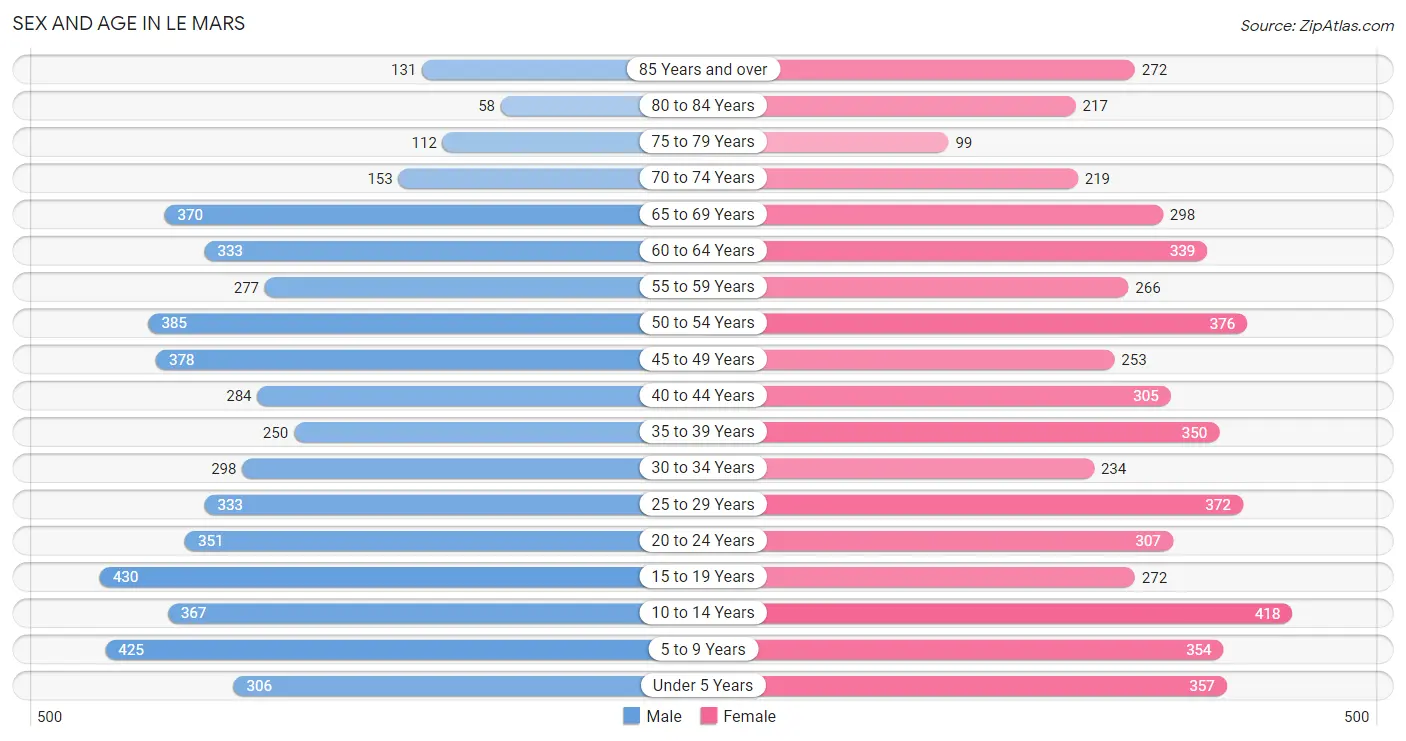
The most populous age groups in Le Mars are 15 to 19 Years (430 | 8.2%) for men and 10 to 14 Years (418 | 7.9%) for women.
| Age Bracket | Male | Female |
| Under 5 Years | 306 (5.8%) | 357 (6.7%) |
| 5 to 9 Years | 425 (8.1%) | 354 (6.7%) |
| 10 to 14 Years | 367 (7.0%) | 418 (7.9%) |
| 15 to 19 Years | 430 (8.2%) | 272 (5.1%) |
| 20 to 24 Years | 351 (6.7%) | 307 (5.8%) |
| 25 to 29 Years | 333 (6.4%) | 372 (7.0%) |
| 30 to 34 Years | 298 (5.7%) | 234 (4.4%) |
| 35 to 39 Years | 250 (4.8%) | 350 (6.6%) |
| 40 to 44 Years | 284 (5.4%) | 305 (5.8%) |
| 45 to 49 Years | 378 (7.2%) | 253 (4.8%) |
| 50 to 54 Years | 385 (7.3%) | 376 (7.1%) |
| 55 to 59 Years | 277 (5.3%) | 266 (5.0%) |
| 60 to 64 Years | 333 (6.4%) | 339 (6.4%) |
| 65 to 69 Years | 370 (7.1%) | 298 (5.6%) |
| 70 to 74 Years | 153 (2.9%) | 219 (4.1%) |
| 75 to 79 Years | 112 (2.1%) | 99 (1.9%) |
| 80 to 84 Years | 58 (1.1%) | 217 (4.1%) |
| 85 Years and over | 131 (2.5%) | 272 (5.1%) |
| Total | 5,241 (100.0%) | 5,308 (100.0%) |
Families and Households in Le Mars
Median Family Size in Le Mars
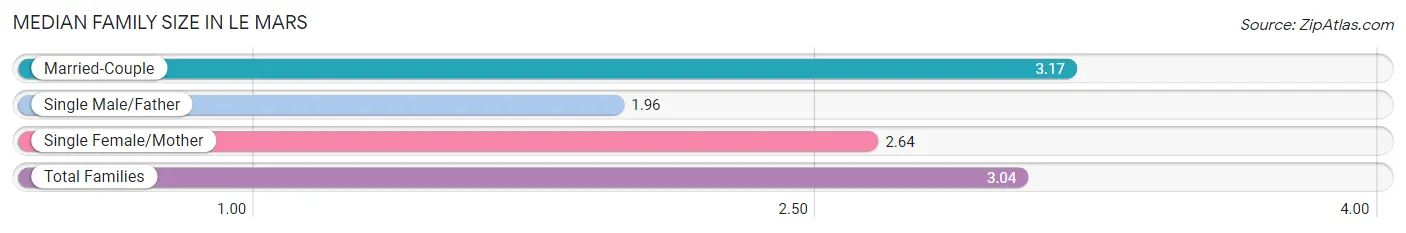
The median family size in Le Mars is 3.04 persons per family, with married-couple families (2,353 | 81.6%) accounting for the largest median family size of 3.17 persons per family. On the other hand, single male/father families (157 | 5.4%) represent the smallest median family size with 1.96 persons per family.
| Family Type | # Families | Family Size |
| Married-Couple | 2,353 (81.6%) | 3.17 |
| Single Male/Father | 157 (5.4%) | 1.96 |
| Single Female/Mother | 374 (13.0%) | 2.64 |
| Total Families | 2,884 (100.0%) | 3.04 |
Median Household Size in Le Mars
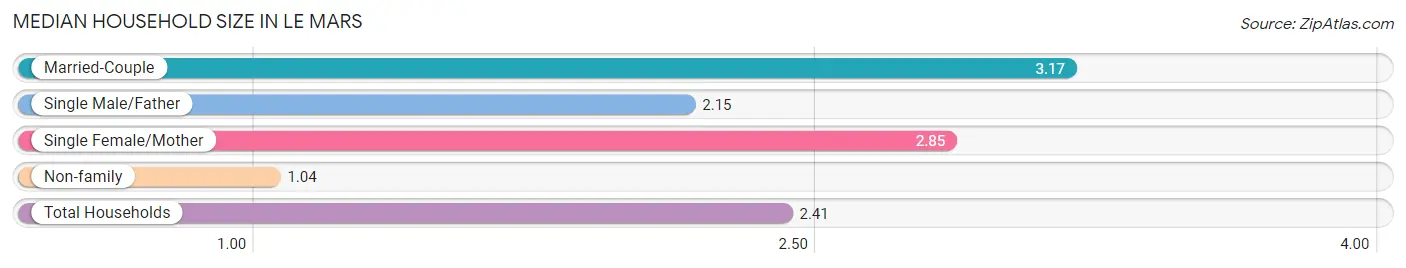
The median household size in Le Mars is 2.41 persons per household, with married-couple households (2,353 | 54.8%) accounting for the largest median household size of 3.17 persons per household. non-family households (1,412 | 32.9%) represent the smallest median household size with 1.04 persons per household.
| Household Type | # Households | Household Size |
| Married-Couple | 2,353 (54.8%) | 3.17 |
| Single Male/Father | 157 (3.6%) | 2.15 |
| Single Female/Mother | 374 (8.7%) | 2.85 |
| Non-family | 1,412 (32.9%) | 1.04 |
| Total Households | 4,296 (100.0%) | 2.41 |
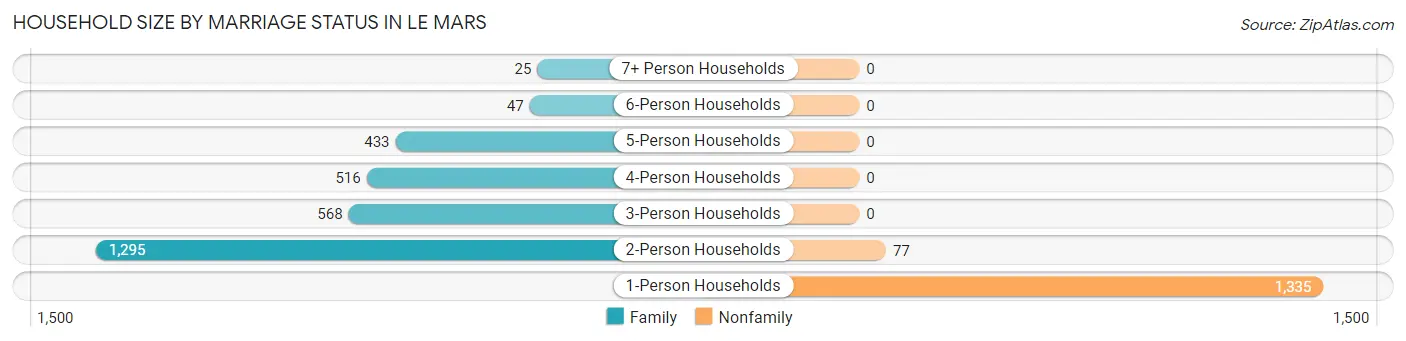
Household Size by Marriage Status in Le Mars
Out of a total of 4,296 households in Le Mars, 2,884 (67.1%) are family households, while 1,412 (32.9%) are nonfamily households. The most numerous type of family households are 2-person households, comprising 1,295, and the most common type of nonfamily households are 1-person households, comprising 1,335.
| Household Size | Family Households | Nonfamily Households |
| 1-Person Households | - | 1,335 (31.1%) |
| 2-Person Households | 1,295 (30.1%) | 77 (1.8%) |
| 3-Person Households | 568 (13.2%) | 0 (0.0%) |
| 4-Person Households | 516 (12.0%) | 0 (0.0%) |
| 5-Person Households | 433 (10.1%) | 0 (0.0%) |
| 6-Person Households | 47 (1.1%) | 0 (0.0%) |
| 7+ Person Households | 25 (0.6%) | 0 (0.0%) |
| Total | 2,884 (67.1%) | 1,412 (32.9%) |
Female Fertility in Le Mars
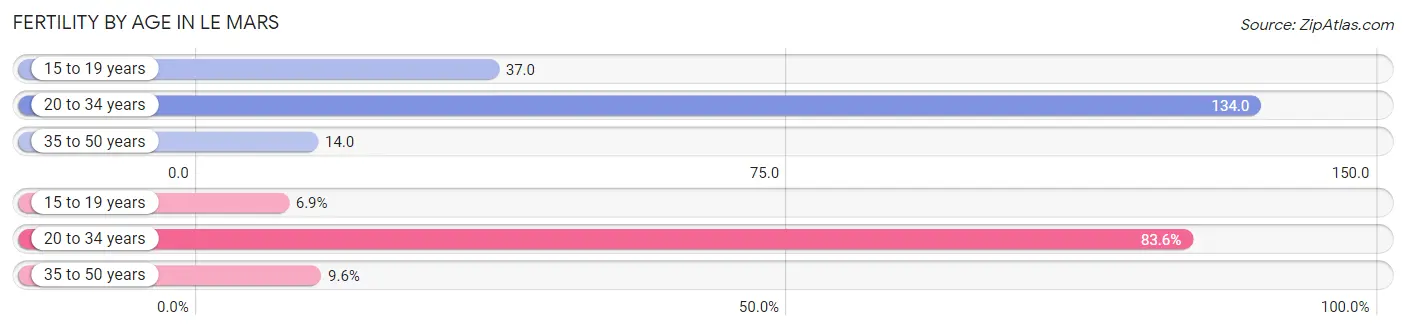
Fertility by Age in Le Mars
Average fertility rate in Le Mars is 67.0 births per 1,000 women. Women in the age bracket of 20 to 34 years have the highest fertility rate with 134.0 births per 1,000 women. Women in the age bracket of 20 to 34 years acount for 83.6% of all women with births.
| Age Bracket | Women with Births | Births / 1,000 Women |
| 15 to 19 years | 10 (6.9%) | 37.0 |
| 20 to 34 years | 122 (83.6%) | 134.0 |
| 35 to 50 years | 14 (9.6%) | 14.0 |
| Total | 146 (100.0%) | 67.0 |
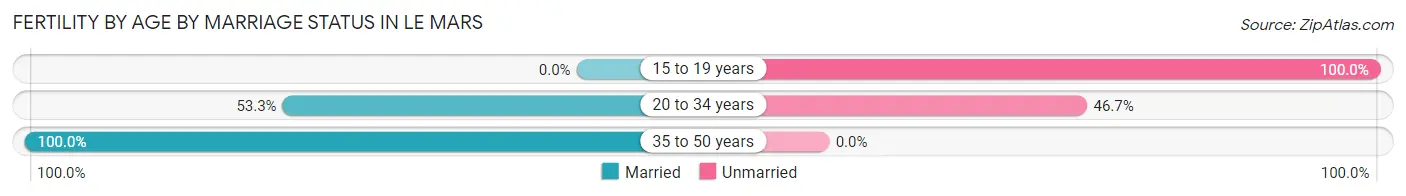
Fertility by Age by Marriage Status in Le Mars
54.1% of women with births (146) in Le Mars are married. The highest percentage of unmarried women with births falls into 15 to 19 years age bracket with 100.0% of them unmarried at the time of birth, while the lowest percentage of unmarried women with births belong to 35 to 50 years age bracket with 0.0% of them unmarried.
| Age Bracket | Married | Unmarried |
| 15 to 19 years | 0 (0.0%) | 10 (100.0%) |
| 20 to 34 years | 65 (53.3%) | 57 (46.7%) |
| 35 to 50 years | 14 (100.0%) | 0 (0.0%) |
| Total | 79 (54.1%) | 67 (45.9%) |
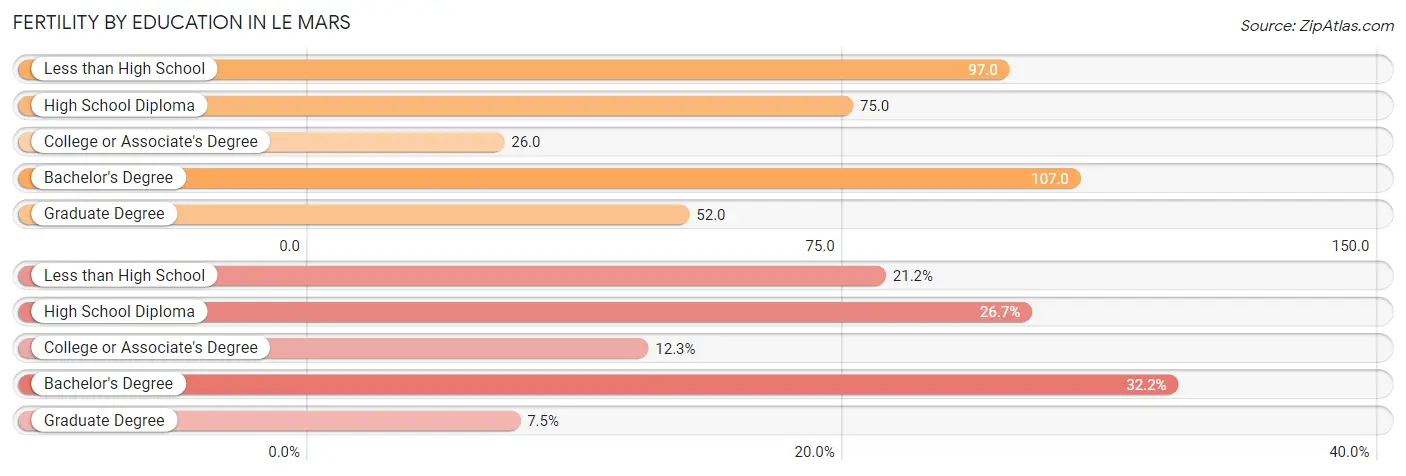
Fertility by Education in Le Mars
Average fertility rate in Le Mars is 67.0 births per 1,000 women. Women with the education attainment of bachelor's degree have the highest fertility rate of 107.0 births per 1,000 women, while women with the education attainment of college or associate's degree have the lowest fertility at 26.0 births per 1,000 women. Women with the education attainment of bachelor's degree represent 32.2% of all women with births.
| Educational Attainment | Women with Births | Births / 1,000 Women |
| Less than High School | 31 (21.2%) | 97.0 |
| High School Diploma | 39 (26.7%) | 75.0 |
| College or Associate's Degree | 18 (12.3%) | 26.0 |
| Bachelor's Degree | 47 (32.2%) | 107.0 |
| Graduate Degree | 11 (7.5%) | 52.0 |
| Total | 146 (100.0%) | 67.0 |
Fertility by Education by Marriage Status in Le Mars
45.9% of women with births in Le Mars are unmarried. Women with the educational attainment of college or associate's degree are most likely to be married with 100.0% of them married at childbirth, while women with the educational attainment of less than high school are least likely to be married with 100.0% of them unmarried at childbirth.
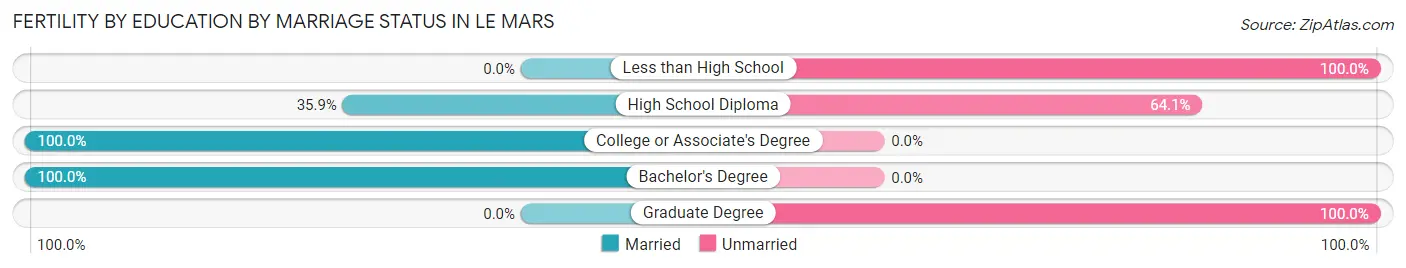
| Educational Attainment | Married | Unmarried |
| Less than High School | 0 (0.0%) | 31 (100.0%) |
| High School Diploma | 14 (35.9%) | 25 (64.1%) |
| College or Associate's Degree | 18 (100.0%) | 0 (0.0%) |
| Bachelor's Degree | 47 (100.0%) | 0 (0.0%) |
| Graduate Degree | 0 (0.0%) | 11 (100.0%) |
| Total | 79 (54.1%) | 67 (45.9%) |
Employment Characteristics in Le Mars
Employment by Class of Employer in Le Mars
Among the 5,471 employed individuals in Le Mars, private company employees (3,798 | 69.4%), not-for-profit organizations (648 | 11.8%), and local government employees (373 | 6.8%) make up the most common classes of employment.
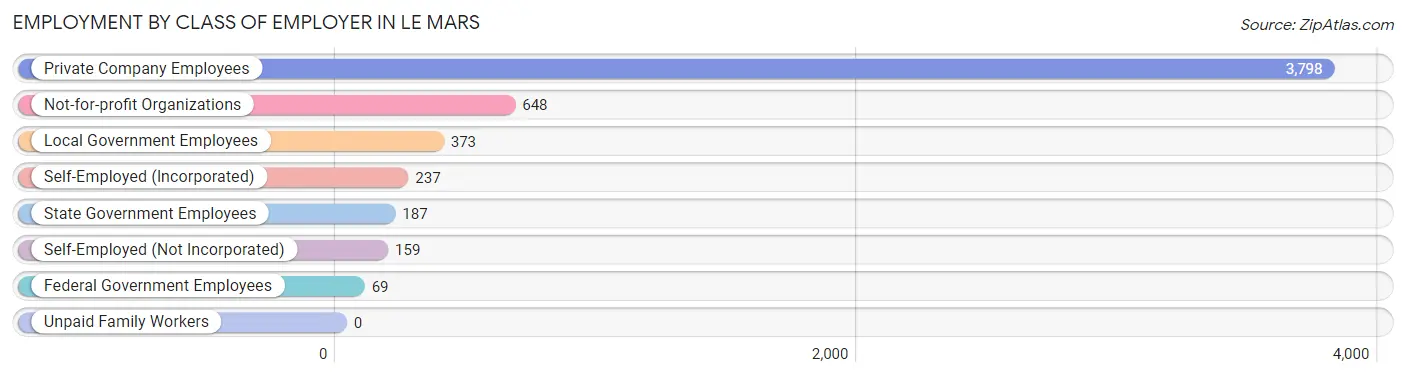
| Employer Class | # Employees | % Employees |
| Private Company Employees | 3,798 | 69.4% |
| Self-Employed (Incorporated) | 237 | 4.3% |
| Self-Employed (Not Incorporated) | 159 | 2.9% |
| Not-for-profit Organizations | 648 | 11.8% |
| Local Government Employees | 373 | 6.8% |
| State Government Employees | 187 | 3.4% |
| Federal Government Employees | 69 | 1.3% |
| Unpaid Family Workers | 0 | 0.0% |
| Total | 5,471 | 100.0% |
Employment Status by Age in Le Mars
According to the labor force statistics for Le Mars, out of the total population over 16 years of age (8,127), 69.8% or 5,673 individuals are in the labor force, with 2.7% or 153 of them unemployed. The age group with the highest labor force participation rate is 35 to 44 years, with 95.8% or 1,139 individuals in the labor force. Within the labor force, the 75 years and over age range has the highest percentage of unemployed individuals, with 34.0% or 16 of them being unemployed.
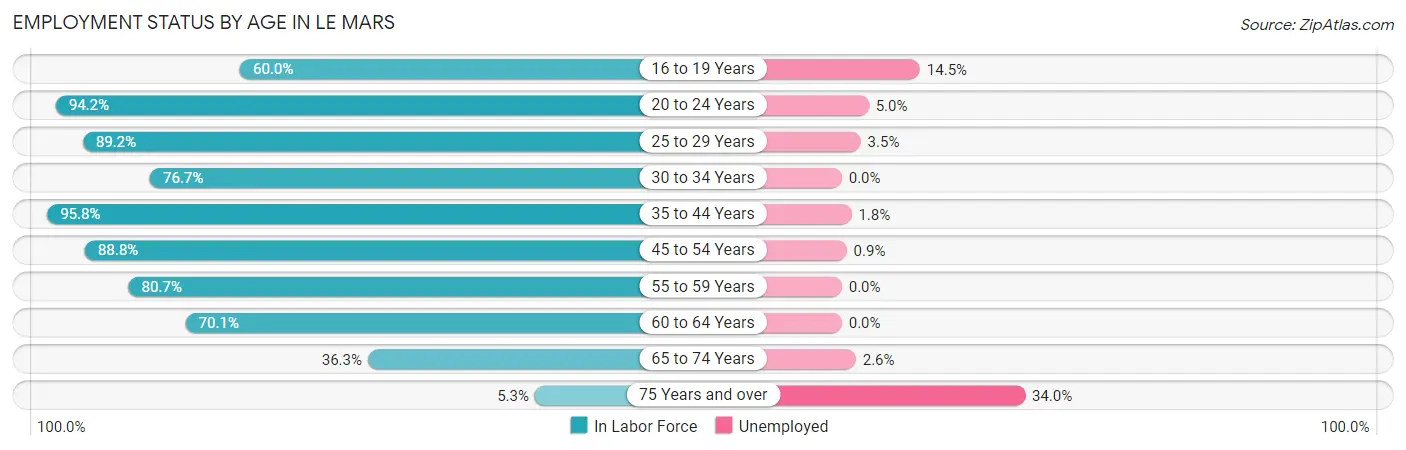
| Age Bracket | In Labor Force | Unemployed |
| 16 to 19 Years | 304 (60.0%) | 44 (14.5%) |
| 20 to 24 Years | 620 (94.2%) | 31 (5.0%) |
| 25 to 29 Years | 629 (89.2%) | 22 (3.5%) |
| 30 to 34 Years | 408 (76.7%) | 0 (0.0%) |
| 35 to 44 Years | 1,139 (95.8%) | 21 (1.8%) |
| 45 to 54 Years | 1,236 (88.8%) | 11 (0.9%) |
| 55 to 59 Years | 438 (80.7%) | 0 (0.0%) |
| 60 to 64 Years | 471 (70.1%) | 0 (0.0%) |
| 65 to 74 Years | 378 (36.3%) | 10 (2.6%) |
| 75 Years and over | 47 (5.3%) | 16 (34.0%) |
| Total | 5,673 (69.8%) | 153 (2.7%) |
Employment Status by Educational Attainment in Le Mars
According to labor force statistics for Le Mars, 85.9% of individuals (4,323) out of the total population between 25 and 64 years of age (5,033) are in the labor force, with 1.2% or 52 of them being unemployed. The group with the highest labor force participation rate are those with the educational attainment of bachelor's degree or higher, with 97.7% or 1,405 individuals in the labor force. Within the labor force, individuals with high school diploma education have the highest percentage of unemployment, with 1.9% or 22 of them being unemployed.
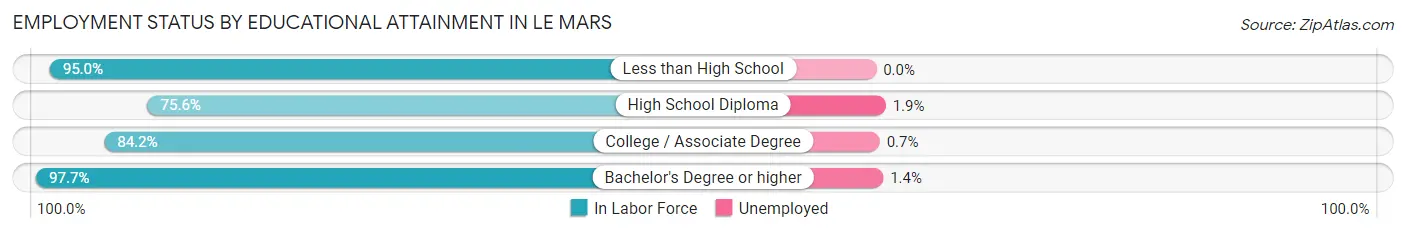
| Educational Attainment | In Labor Force | Unemployed |
| Less than High School | 190 (95.0%) | 0 (0.0%) |
| High School Diploma | 1,163 (75.6%) | 29 (1.9%) |
| College / Associate Degree | 1,564 (84.2%) | 13 (0.7%) |
| Bachelor's Degree or higher | 1,405 (97.7%) | 20 (1.4%) |
| Total | 4,323 (85.9%) | 60 (1.2%) |
Employment Occupations by Sex in Le Mars
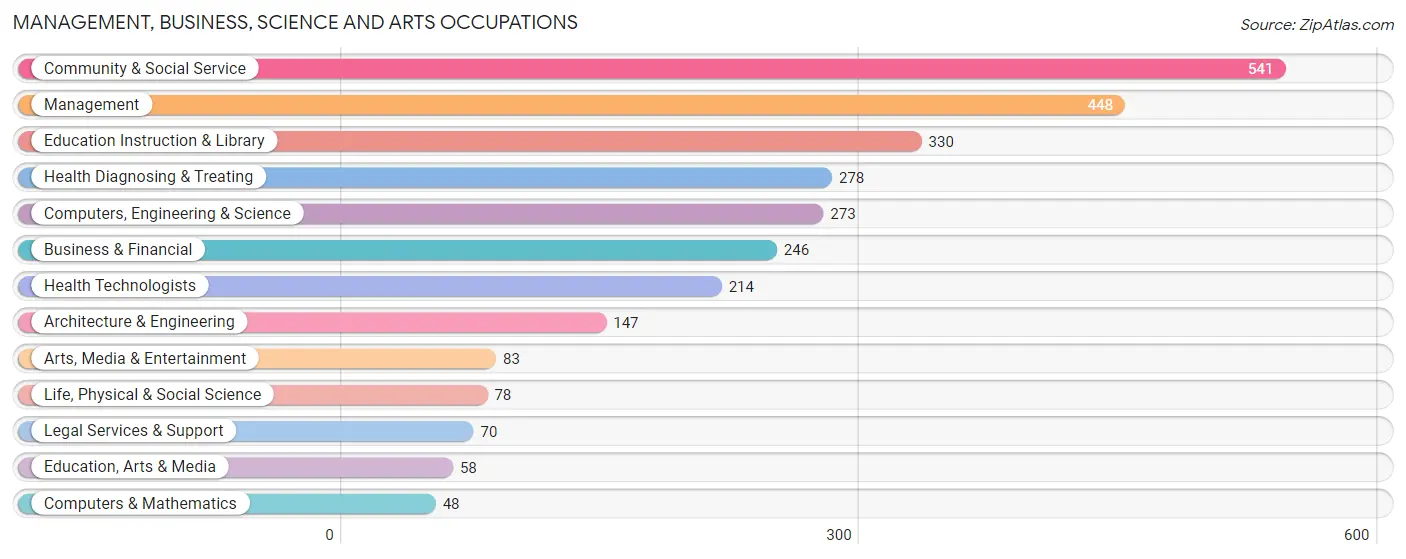
Management, Business, Science and Arts Occupations
The most common Management, Business, Science and Arts occupations in Le Mars are Community & Social Service (541 | 9.8%), Management (448 | 8.1%), Education Instruction & Library (330 | 6.0%), Health Diagnosing & Treating (278 | 5.0%), and Computers, Engineering & Science (273 | 5.0%).
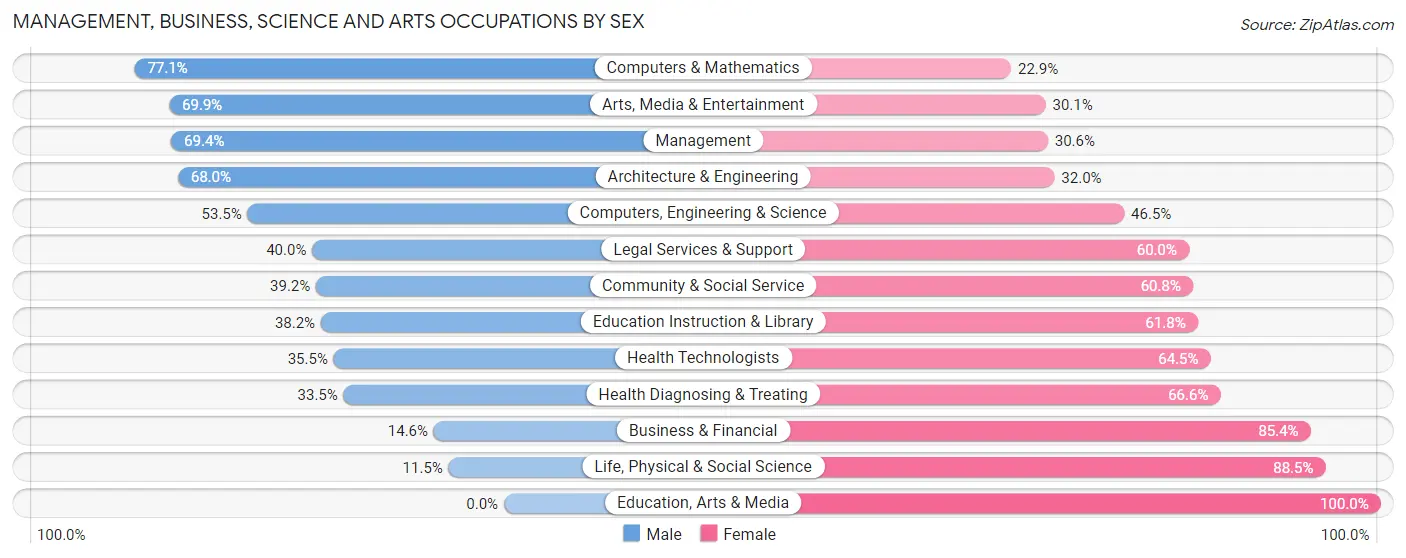
Management, Business, Science and Arts Occupations by Sex
Within the Management, Business, Science and Arts occupations in Le Mars, the most male-oriented occupations are Computers & Mathematics (77.1%), Arts, Media & Entertainment (69.9%), and Management (69.4%), while the most female-oriented occupations are Education, Arts & Media (100.0%), Life, Physical & Social Science (88.5%), and Business & Financial (85.4%).
| Occupation | Male | Female |
| Management | 311 (69.4%) | 137 (30.6%) |
| Business & Financial | 36 (14.6%) | 210 (85.4%) |
| Computers, Engineering & Science | 146 (53.5%) | 127 (46.5%) |
| Computers & Mathematics | 37 (77.1%) | 11 (22.9%) |
| Architecture & Engineering | 100 (68.0%) | 47 (32.0%) |
| Life, Physical & Social Science | 9 (11.5%) | 69 (88.5%) |
| Community & Social Service | 212 (39.2%) | 329 (60.8%) |
| Education, Arts & Media | 0 (0.0%) | 58 (100.0%) |
| Legal Services & Support | 28 (40.0%) | 42 (60.0%) |
| Education Instruction & Library | 126 (38.2%) | 204 (61.8%) |
| Arts, Media & Entertainment | 58 (69.9%) | 25 (30.1%) |
| Health Diagnosing & Treating | 93 (33.5%) | 185 (66.5%) |
| Health Technologists | 76 (35.5%) | 138 (64.5%) |
| Total (Category) | 798 (44.7%) | 988 (55.3%) |
| Total (Overall) | 2,998 (54.3%) | 2,518 (45.7%) |
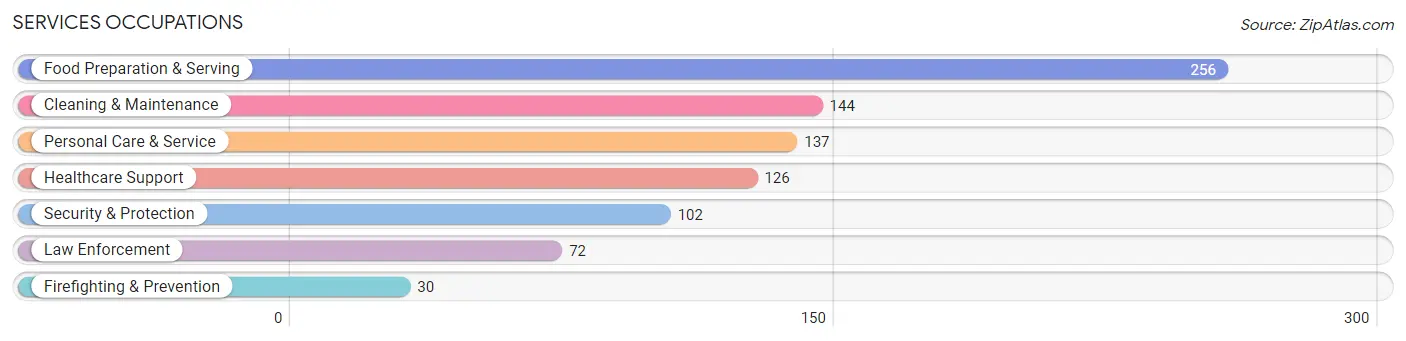
Services Occupations
The most common Services occupations in Le Mars are Food Preparation & Serving (256 | 4.6%), Cleaning & Maintenance (144 | 2.6%), Personal Care & Service (137 | 2.5%), Healthcare Support (126 | 2.3%), and Security & Protection (102 | 1.8%).
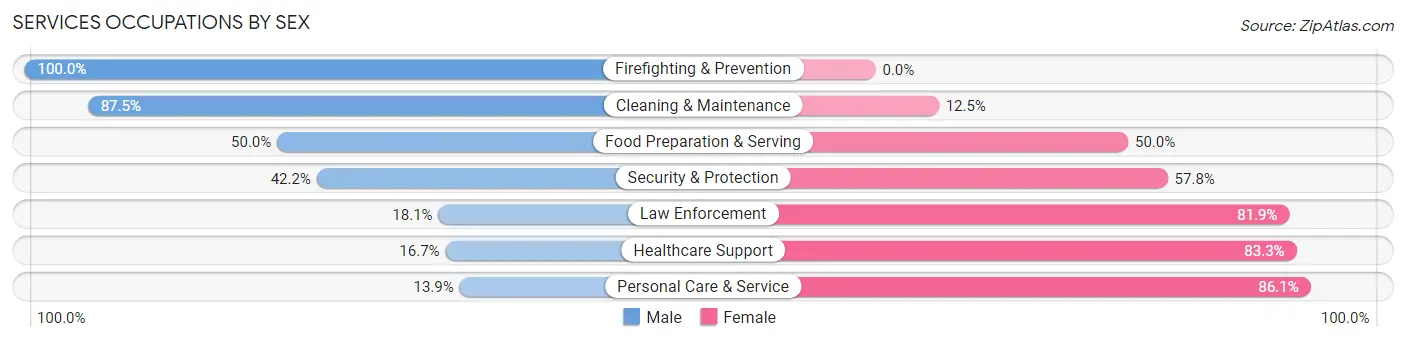
Services Occupations by Sex
Within the Services occupations in Le Mars, the most male-oriented occupations are Firefighting & Prevention (100.0%), Cleaning & Maintenance (87.5%), and Food Preparation & Serving (50.0%), while the most female-oriented occupations are Personal Care & Service (86.1%), Healthcare Support (83.3%), and Law Enforcement (81.9%).
| Occupation | Male | Female |
| Healthcare Support | 21 (16.7%) | 105 (83.3%) |
| Security & Protection | 43 (42.2%) | 59 (57.8%) |
| Firefighting & Prevention | 30 (100.0%) | 0 (0.0%) |
| Law Enforcement | 13 (18.1%) | 59 (81.9%) |
| Food Preparation & Serving | 128 (50.0%) | 128 (50.0%) |
| Cleaning & Maintenance | 126 (87.5%) | 18 (12.5%) |
| Personal Care & Service | 19 (13.9%) | 118 (86.1%) |
| Total (Category) | 337 (44.1%) | 428 (55.9%) |
| Total (Overall) | 2,998 (54.3%) | 2,518 (45.7%) |
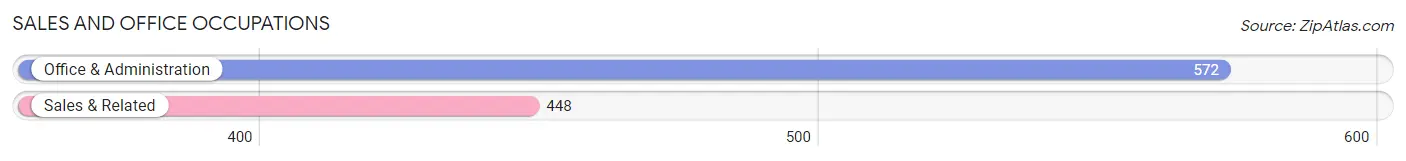
Sales and Office Occupations
The most common Sales and Office occupations in Le Mars are Office & Administration (572 | 10.4%), and Sales & Related (448 | 8.1%).
Sales and Office Occupations by Sex
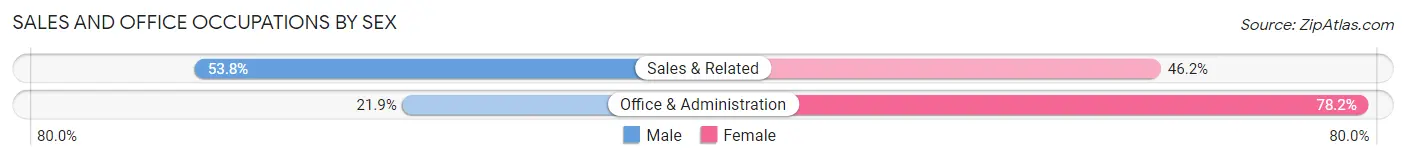
| Occupation | Male | Female |
| Sales & Related | 241 (53.8%) | 207 (46.2%) |
| Office & Administration | 125 (21.8%) | 447 (78.1%) |
| Total (Category) | 366 (35.9%) | 654 (64.1%) |
| Total (Overall) | 2,998 (54.3%) | 2,518 (45.7%) |
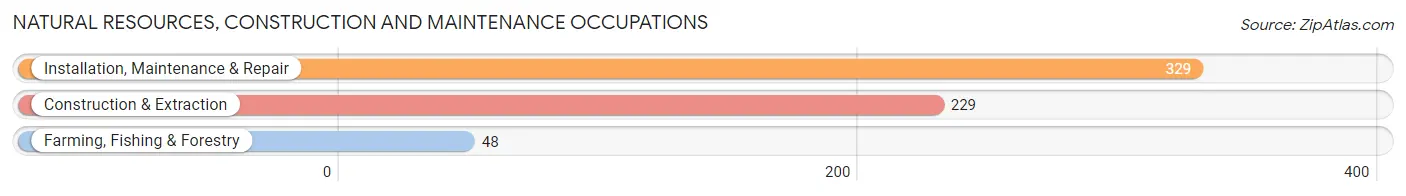
Natural Resources, Construction and Maintenance Occupations
The most common Natural Resources, Construction and Maintenance occupations in Le Mars are Installation, Maintenance & Repair (329 | 6.0%), Construction & Extraction (229 | 4.2%), and Farming, Fishing & Forestry (48 | 0.9%).
Natural Resources, Construction and Maintenance Occupations by Sex
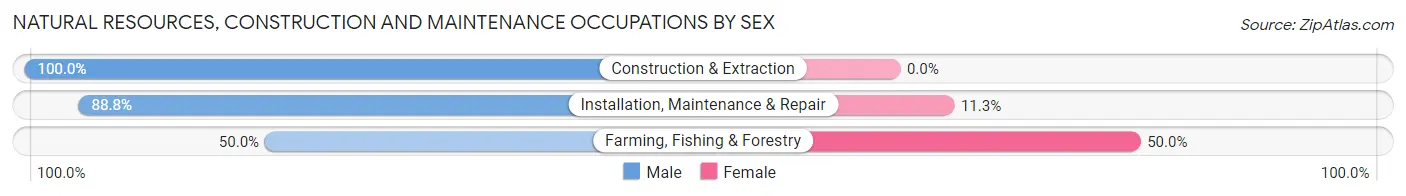
| Occupation | Male | Female |
| Farming, Fishing & Forestry | 24 (50.0%) | 24 (50.0%) |
| Construction & Extraction | 229 (100.0%) | 0 (0.0%) |
| Installation, Maintenance & Repair | 292 (88.7%) | 37 (11.3%) |
| Total (Category) | 545 (89.9%) | 61 (10.1%) |
| Total (Overall) | 2,998 (54.3%) | 2,518 (45.7%) |
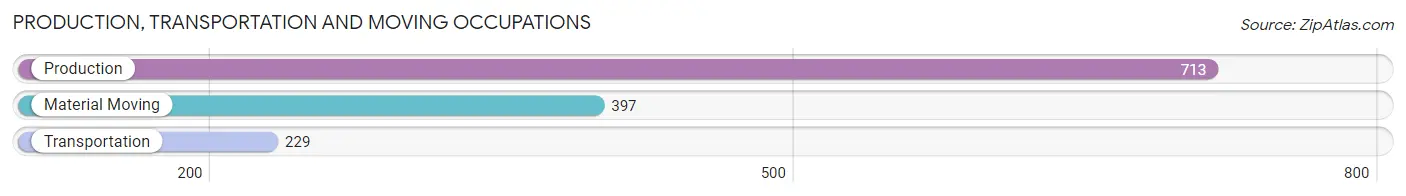
Production, Transportation and Moving Occupations
The most common Production, Transportation and Moving occupations in Le Mars are Production (713 | 12.9%), Material Moving (397 | 7.2%), and Transportation (229 | 4.2%).
Production, Transportation and Moving Occupations by Sex
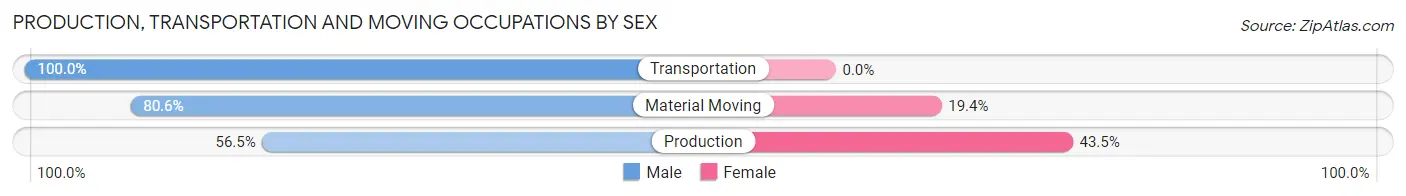
| Occupation | Male | Female |
| Production | 403 (56.5%) | 310 (43.5%) |
| Transportation | 229 (100.0%) | 0 (0.0%) |
| Material Moving | 320 (80.6%) | 77 (19.4%) |
| Total (Category) | 952 (71.1%) | 387 (28.9%) |
| Total (Overall) | 2,998 (54.3%) | 2,518 (45.7%) |
Employment Industries by Sex in Le Mars
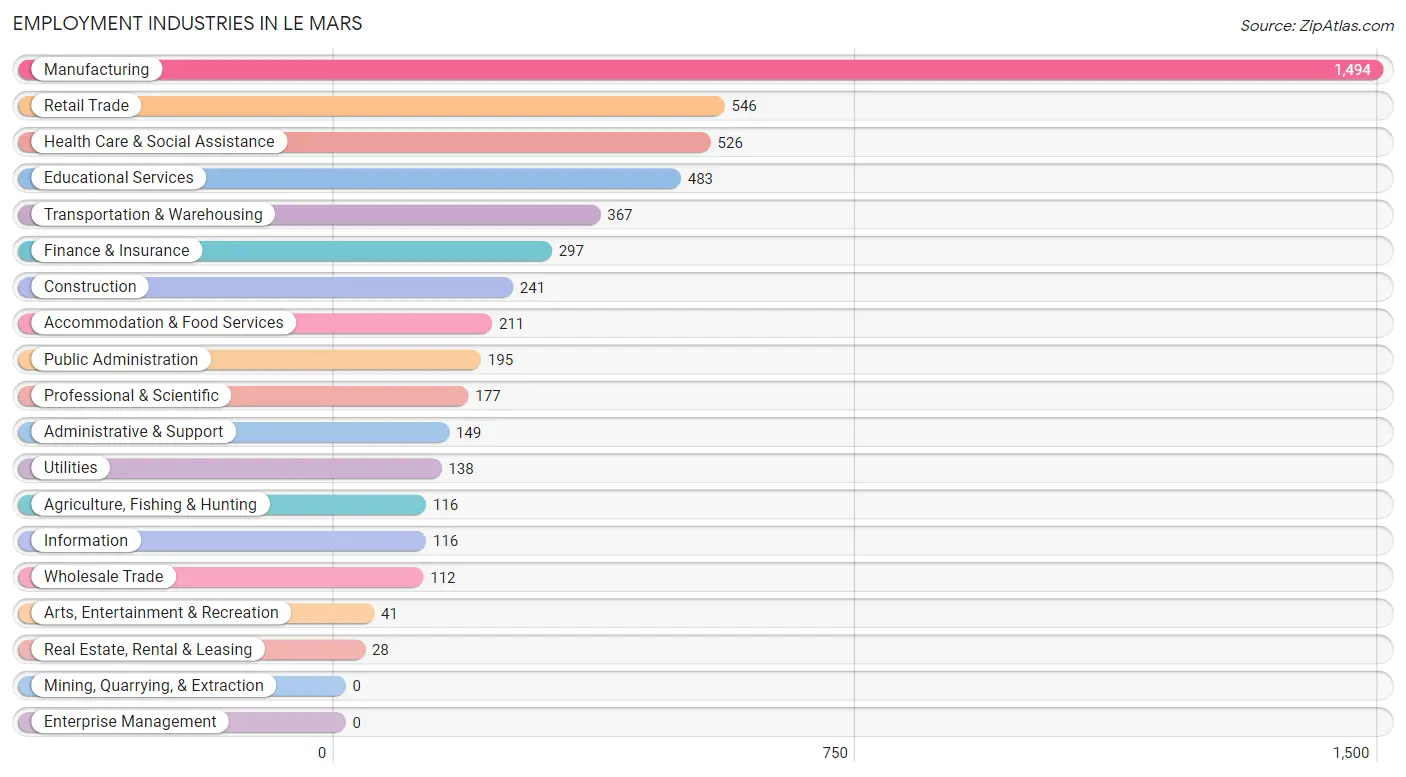
Employment Industries in Le Mars
The major employment industries in Le Mars include Manufacturing (1,494 | 27.1%), Retail Trade (546 | 9.9%), Health Care & Social Assistance (526 | 9.5%), Educational Services (483 | 8.8%), and Transportation & Warehousing (367 | 6.7%).
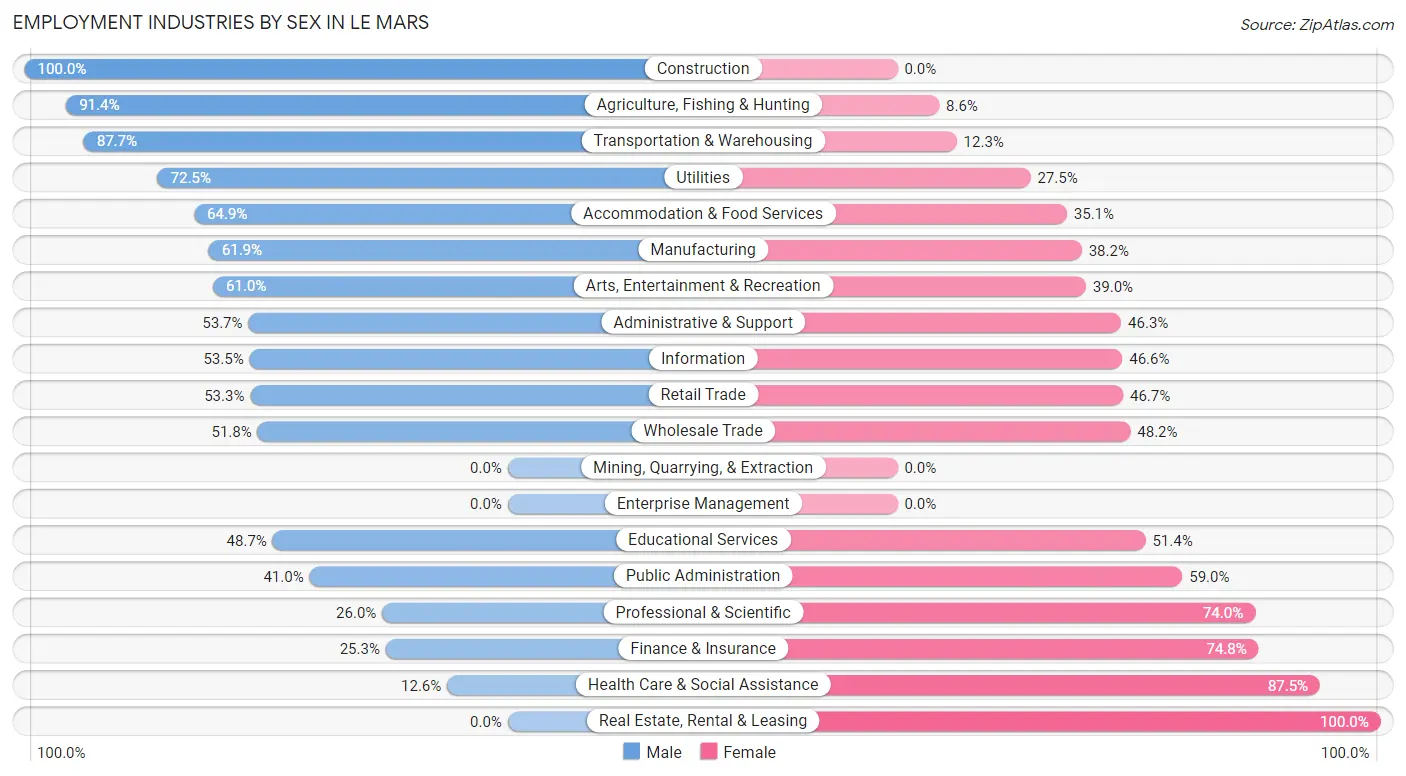
Employment Industries by Sex in Le Mars
The Le Mars industries that see more men than women are Construction (100.0%), Agriculture, Fishing & Hunting (91.4%), and Transportation & Warehousing (87.7%), whereas the industries that tend to have a higher number of women are Real Estate, Rental & Leasing (100.0%), Health Care & Social Assistance (87.5%), and Finance & Insurance (74.8%).
| Industry | Male | Female |
| Agriculture, Fishing & Hunting | 106 (91.4%) | 10 (8.6%) |
| Mining, Quarrying, & Extraction | 0 (0.0%) | 0 (0.0%) |
| Construction | 241 (100.0%) | 0 (0.0%) |
| Manufacturing | 924 (61.9%) | 570 (38.2%) |
| Wholesale Trade | 58 (51.8%) | 54 (48.2%) |
| Retail Trade | 291 (53.3%) | 255 (46.7%) |
| Transportation & Warehousing | 322 (87.7%) | 45 (12.3%) |
| Utilities | 100 (72.5%) | 38 (27.5%) |
| Information | 62 (53.4%) | 54 (46.6%) |
| Finance & Insurance | 75 (25.3%) | 222 (74.8%) |
| Real Estate, Rental & Leasing | 0 (0.0%) | 28 (100.0%) |
| Professional & Scientific | 46 (26.0%) | 131 (74.0%) |
| Enterprise Management | 0 (0.0%) | 0 (0.0%) |
| Administrative & Support | 80 (53.7%) | 69 (46.3%) |
| Educational Services | 235 (48.6%) | 248 (51.3%) |
| Health Care & Social Assistance | 66 (12.6%) | 460 (87.5%) |
| Arts, Entertainment & Recreation | 25 (61.0%) | 16 (39.0%) |
| Accommodation & Food Services | 137 (64.9%) | 74 (35.1%) |
| Public Administration | 80 (41.0%) | 115 (59.0%) |
| Total | 2,998 (54.3%) | 2,518 (45.7%) |
Education in Le Mars
School Enrollment in Le Mars
The most common levels of schooling among the 2,589 students in Le Mars are high school (655 | 25.3%), middle school (612 | 23.6%), and elementary school (342 | 13.2%).
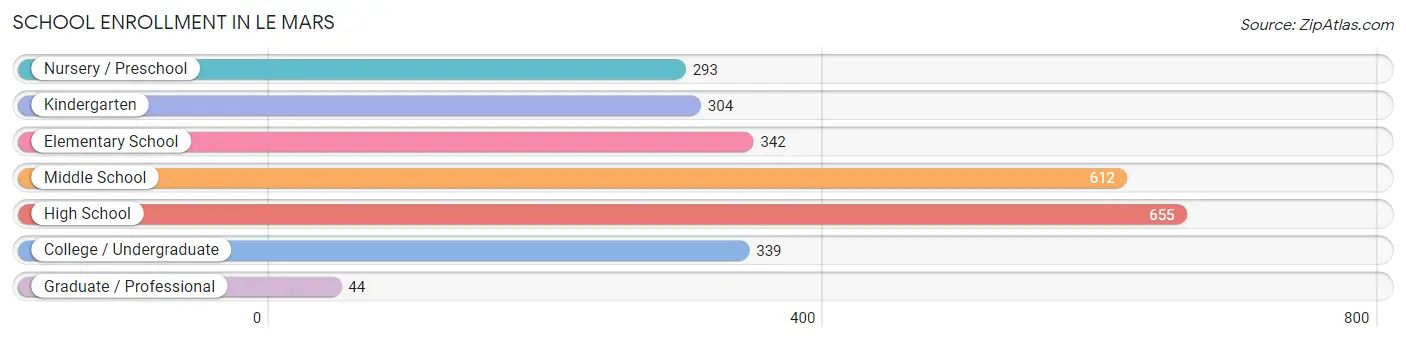
| School Level | # Students | % Students |
| Nursery / Preschool | 293 | 11.3% |
| Kindergarten | 304 | 11.7% |
| Elementary School | 342 | 13.2% |
| Middle School | 612 | 23.6% |
| High School | 655 | 25.3% |
| College / Undergraduate | 339 | 13.1% |
| Graduate / Professional | 44 | 1.7% |
| Total | 2,589 | 100.0% |
School Enrollment by Age by Funding Source in Le Mars
Out of a total of 2,589 students who are enrolled in schools in Le Mars, 386 (14.9%) attend a private institution, while the remaining 2,203 (85.1%) are enrolled in public schools. The age group of 5 to 9 year old has the highest likelihood of being enrolled in private schools, with 208 (27.4% in the age bracket) enrolled. Conversely, the age group of 35 years and over has the lowest likelihood of being enrolled in a private school, with 45 (100.0% in the age bracket) attending a public institution.
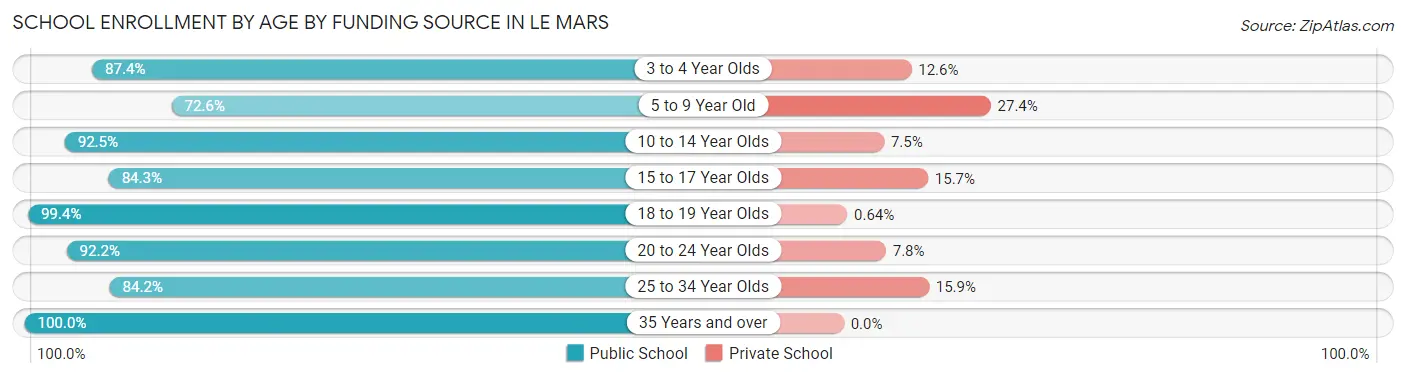
| Age Bracket | Public School | Private School |
| 3 to 4 Year Olds | 125 (87.4%) | 18 (12.6%) |
| 5 to 9 Year Old | 552 (72.6%) | 208 (27.4%) |
| 10 to 14 Year Olds | 654 (92.5%) | 53 (7.5%) |
| 15 to 17 Year Olds | 414 (84.3%) | 77 (15.7%) |
| 18 to 19 Year Olds | 156 (99.4%) | 1 (0.6%) |
| 20 to 24 Year Olds | 188 (92.2%) | 16 (7.8%) |
| 25 to 34 Year Olds | 69 (84.2%) | 13 (15.9%) |
| 35 Years and over | 45 (100.0%) | 0 (0.0%) |
| Total | 2,203 (85.1%) | 386 (14.9%) |
Educational Attainment by Field of Study in Le Mars
Business (374 | 19.1%), education (371 | 19.0%), science & technology (283 | 14.5%), engineering (166 | 8.5%), and arts & humanities (165 | 8.4%) are the most common fields of study among 1,957 individuals in Le Mars who have obtained a bachelor's degree or higher.
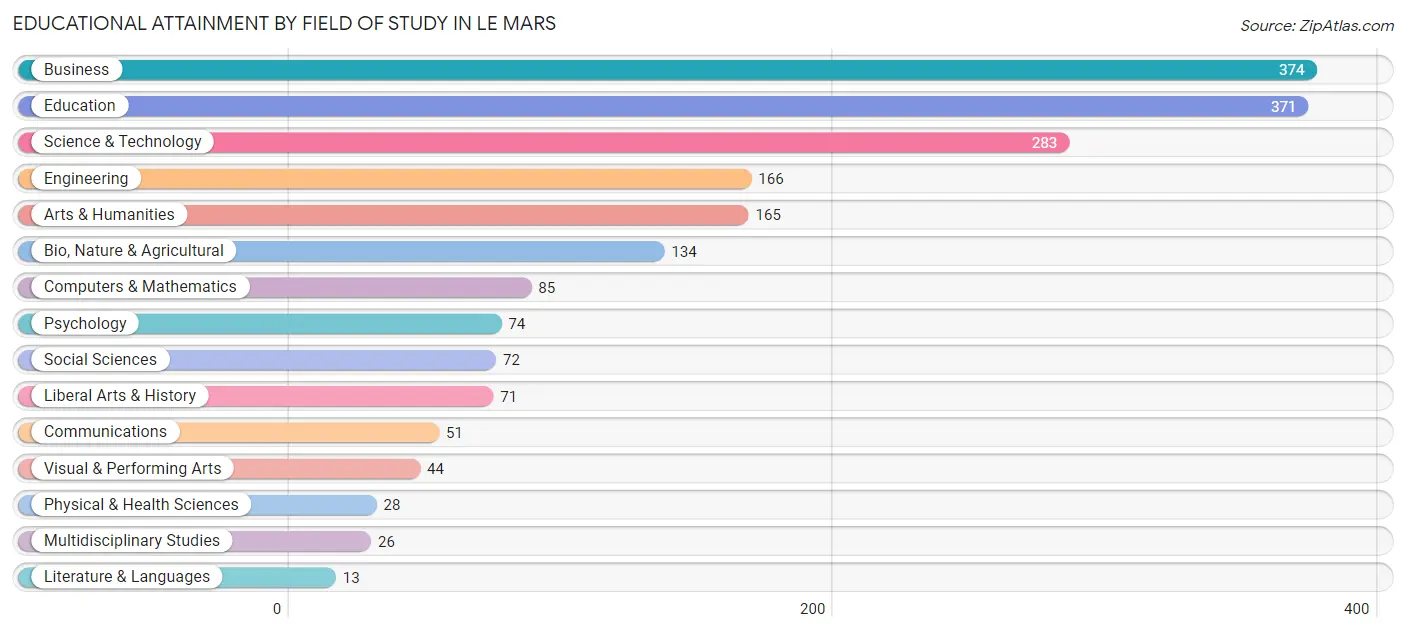
| Field of Study | # Graduates | % Graduates |
| Computers & Mathematics | 85 | 4.3% |
| Bio, Nature & Agricultural | 134 | 6.9% |
| Physical & Health Sciences | 28 | 1.4% |
| Psychology | 74 | 3.8% |
| Social Sciences | 72 | 3.7% |
| Engineering | 166 | 8.5% |
| Multidisciplinary Studies | 26 | 1.3% |
| Science & Technology | 283 | 14.5% |
| Business | 374 | 19.1% |
| Education | 371 | 19.0% |
| Literature & Languages | 13 | 0.7% |
| Liberal Arts & History | 71 | 3.6% |
| Visual & Performing Arts | 44 | 2.2% |
| Communications | 51 | 2.6% |
| Arts & Humanities | 165 | 8.4% |
| Total | 1,957 | 100.0% |
Transportation & Commute in Le Mars
Vehicle Availability by Sex in Le Mars
The most prevalent vehicle ownership categories in Le Mars are males with 2 vehicles (1,226, accounting for 41.0%) and females with 2 vehicles (1,212, making up 49.5%).
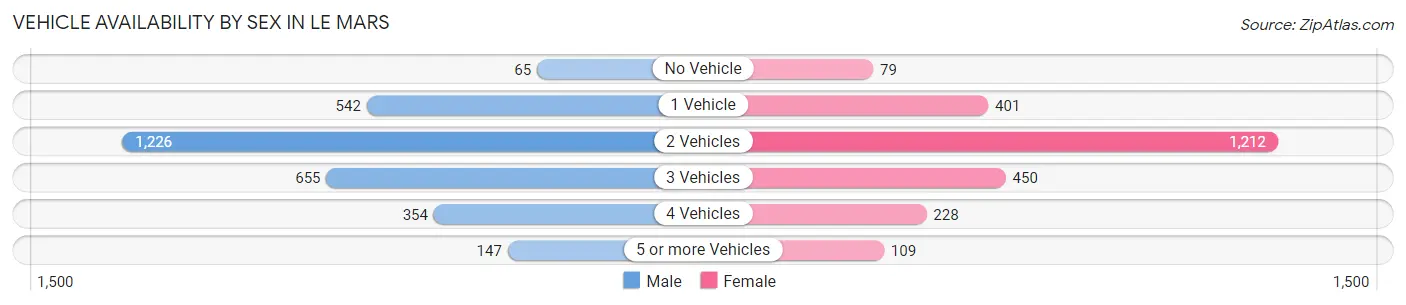
| Vehicles Available | Male | Female |
| No Vehicle | 65 (2.2%) | 79 (3.2%) |
| 1 Vehicle | 542 (18.1%) | 401 (16.2%) |
| 2 Vehicles | 1,226 (41.0%) | 1,212 (48.9%) |
| 3 Vehicles | 655 (21.9%) | 450 (18.1%) |
| 4 Vehicles | 354 (11.8%) | 228 (9.2%) |
| 5 or more Vehicles | 147 (4.9%) | 109 (4.4%) |
| Total | 2,989 (100.0%) | 2,479 (100.0%) |
Commute Time in Le Mars
The most frequently occuring commute durations in Le Mars are 5 to 9 minutes (1,920 commuters, 36.1%), 10 to 14 minutes (914 commuters, 17.2%), and less than 5 minutes (568 commuters, 10.7%).
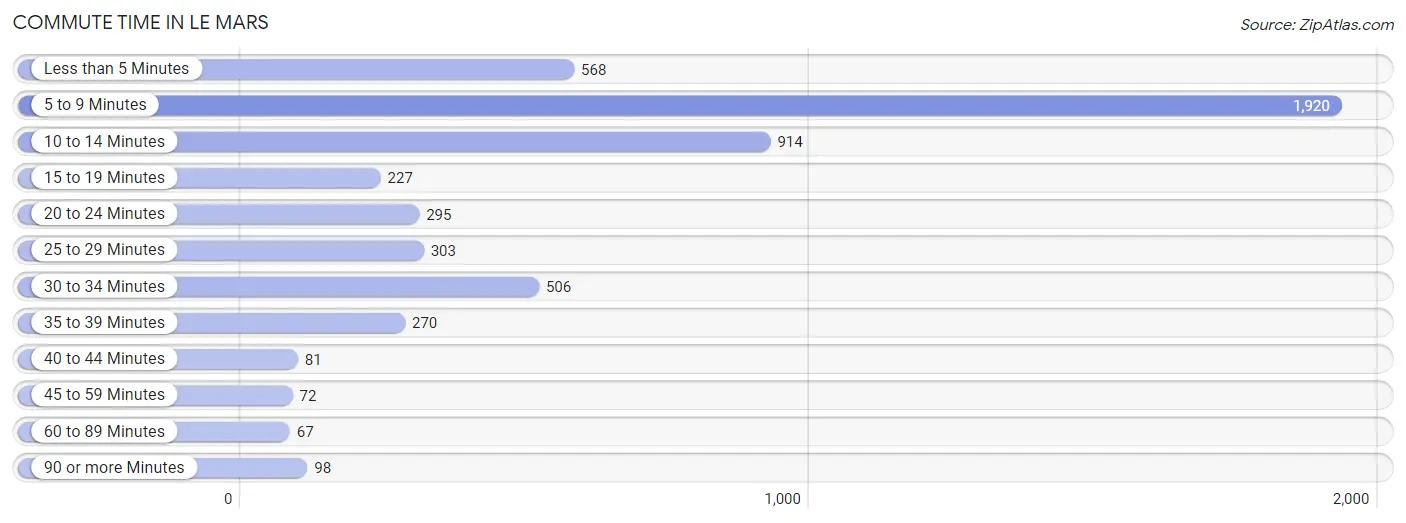
| Commute Time | # Commuters | % Commuters |
| Less than 5 Minutes | 568 | 10.7% |
| 5 to 9 Minutes | 1,920 | 36.1% |
| 10 to 14 Minutes | 914 | 17.2% |
| 15 to 19 Minutes | 227 | 4.3% |
| 20 to 24 Minutes | 295 | 5.5% |
| 25 to 29 Minutes | 303 | 5.7% |
| 30 to 34 Minutes | 506 | 9.5% |
| 35 to 39 Minutes | 270 | 5.1% |
| 40 to 44 Minutes | 81 | 1.5% |
| 45 to 59 Minutes | 72 | 1.3% |
| 60 to 89 Minutes | 67 | 1.3% |
| 90 or more Minutes | 98 | 1.8% |
Commute Time by Sex in Le Mars
The most common commute times in Le Mars are 5 to 9 minutes (1,121 commuters, 38.1%) for males and 5 to 9 minutes (799 commuters, 33.5%) for females.
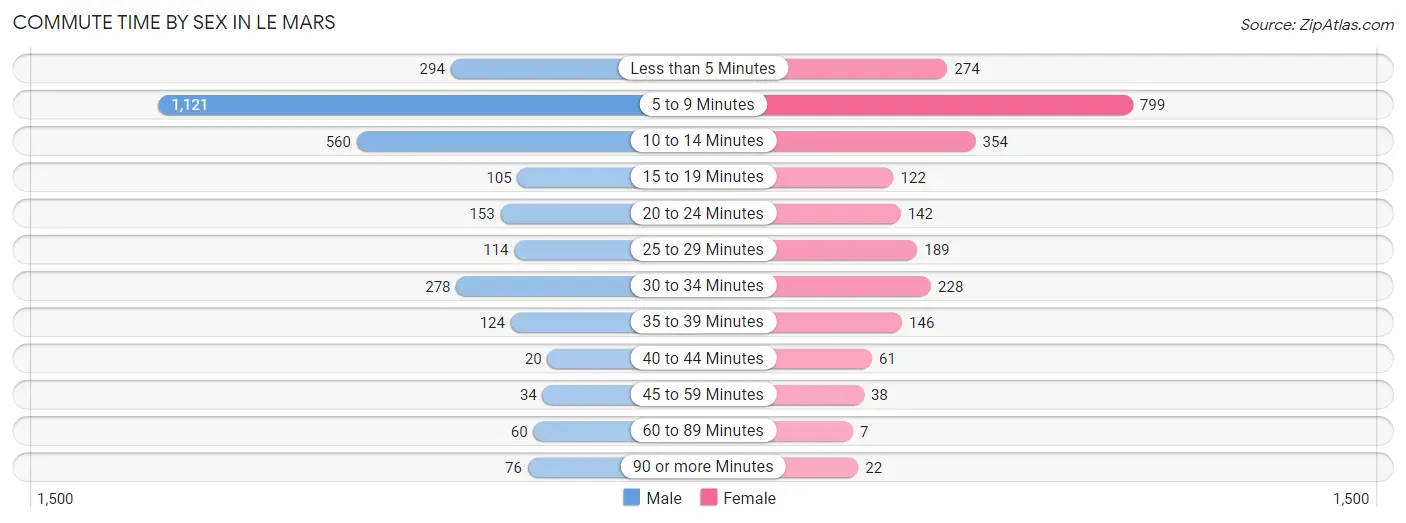
| Commute Time | Male | Female |
| Less than 5 Minutes | 294 (10.0%) | 274 (11.5%) |
| 5 to 9 Minutes | 1,121 (38.1%) | 799 (33.5%) |
| 10 to 14 Minutes | 560 (19.1%) | 354 (14.9%) |
| 15 to 19 Minutes | 105 (3.6%) | 122 (5.1%) |
| 20 to 24 Minutes | 153 (5.2%) | 142 (6.0%) |
| 25 to 29 Minutes | 114 (3.9%) | 189 (7.9%) |
| 30 to 34 Minutes | 278 (9.5%) | 228 (9.6%) |
| 35 to 39 Minutes | 124 (4.2%) | 146 (6.1%) |
| 40 to 44 Minutes | 20 (0.7%) | 61 (2.6%) |
| 45 to 59 Minutes | 34 (1.2%) | 38 (1.6%) |
| 60 to 89 Minutes | 60 (2.0%) | 7 (0.3%) |
| 90 or more Minutes | 76 (2.6%) | 22 (0.9%) |
Time of Departure to Work by Sex in Le Mars
The most frequent times of departure to work in Le Mars are 6:30 AM to 6:59 AM (511, 17.4%) for males and 7:00 AM to 7:29 AM (444, 18.6%) for females.
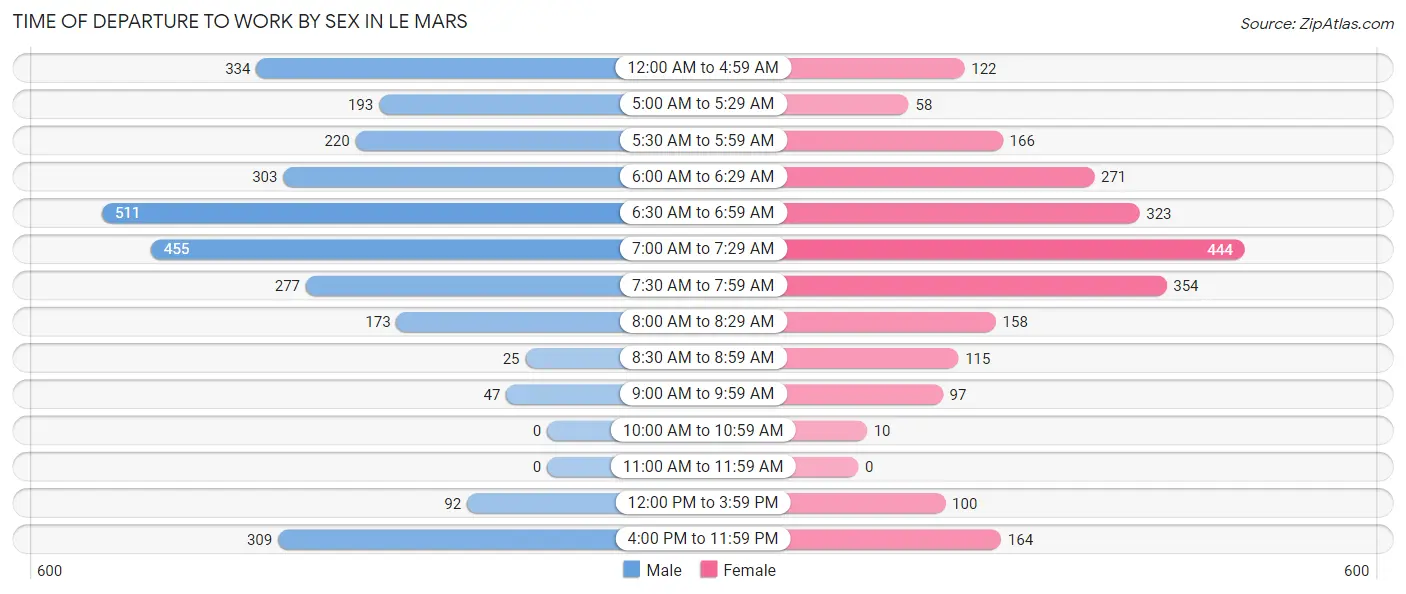
| Time of Departure | Male | Female |
| 12:00 AM to 4:59 AM | 334 (11.4%) | 122 (5.1%) |
| 5:00 AM to 5:29 AM | 193 (6.6%) | 58 (2.4%) |
| 5:30 AM to 5:59 AM | 220 (7.5%) | 166 (7.0%) |
| 6:00 AM to 6:29 AM | 303 (10.3%) | 271 (11.4%) |
| 6:30 AM to 6:59 AM | 511 (17.4%) | 323 (13.6%) |
| 7:00 AM to 7:29 AM | 455 (15.5%) | 444 (18.6%) |
| 7:30 AM to 7:59 AM | 277 (9.4%) | 354 (14.9%) |
| 8:00 AM to 8:29 AM | 173 (5.9%) | 158 (6.6%) |
| 8:30 AM to 8:59 AM | 25 (0.9%) | 115 (4.8%) |
| 9:00 AM to 9:59 AM | 47 (1.6%) | 97 (4.1%) |
| 10:00 AM to 10:59 AM | 0 (0.0%) | 10 (0.4%) |
| 11:00 AM to 11:59 AM | 0 (0.0%) | 0 (0.0%) |
| 12:00 PM to 3:59 PM | 92 (3.1%) | 100 (4.2%) |
| 4:00 PM to 11:59 PM | 309 (10.5%) | 164 (6.9%) |
| Total | 2,939 (100.0%) | 2,382 (100.0%) |
Housing Occupancy in Le Mars
Occupancy by Ownership in Le Mars
Of the total 4,296 dwellings in Le Mars, owner-occupied units account for 2,920 (68.0%), while renter-occupied units make up 1,376 (32.0%).
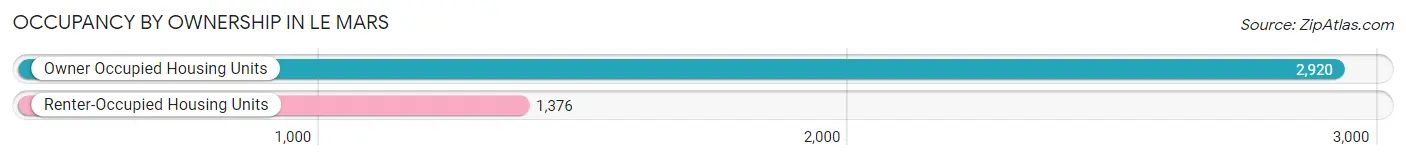
| Occupancy | # Housing Units | % Housing Units |
| Owner Occupied Housing Units | 2,920 | 68.0% |
| Renter-Occupied Housing Units | 1,376 | 32.0% |
| Total Occupied Housing Units | 4,296 | 100.0% |
Occupancy by Household Size in Le Mars
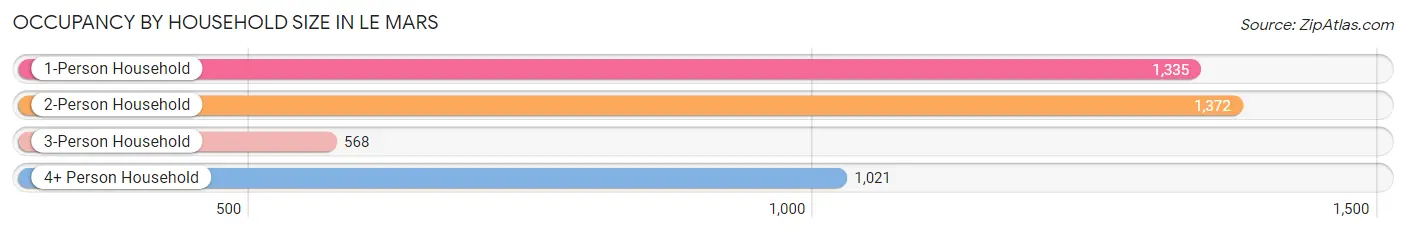
| Household Size | # Housing Units | % Housing Units |
| 1-Person Household | 1,335 | 31.1% |
| 2-Person Household | 1,372 | 31.9% |
| 3-Person Household | 568 | 13.2% |
| 4+ Person Household | 1,021 | 23.8% |
| Total Housing Units | 4,296 | 100.0% |
Occupancy by Ownership by Household Size in Le Mars
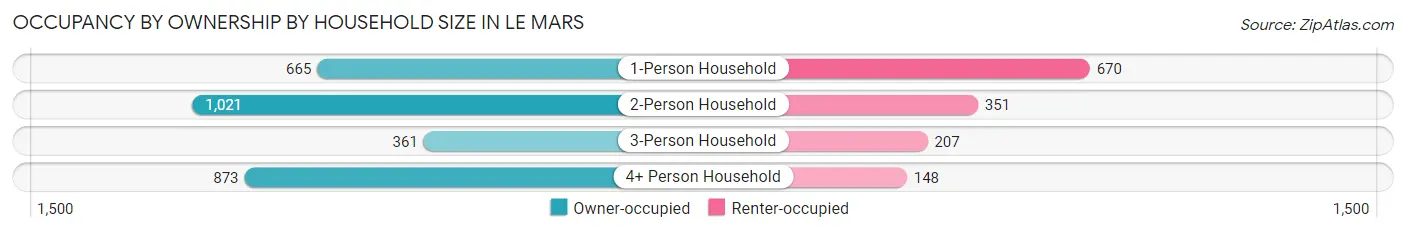
| Household Size | Owner-occupied | Renter-occupied |
| 1-Person Household | 665 (49.8%) | 670 (50.2%) |
| 2-Person Household | 1,021 (74.4%) | 351 (25.6%) |
| 3-Person Household | 361 (63.6%) | 207 (36.4%) |
| 4+ Person Household | 873 (85.5%) | 148 (14.5%) |
| Total Housing Units | 2,920 (68.0%) | 1,376 (32.0%) |
Occupancy by Educational Attainment in Le Mars
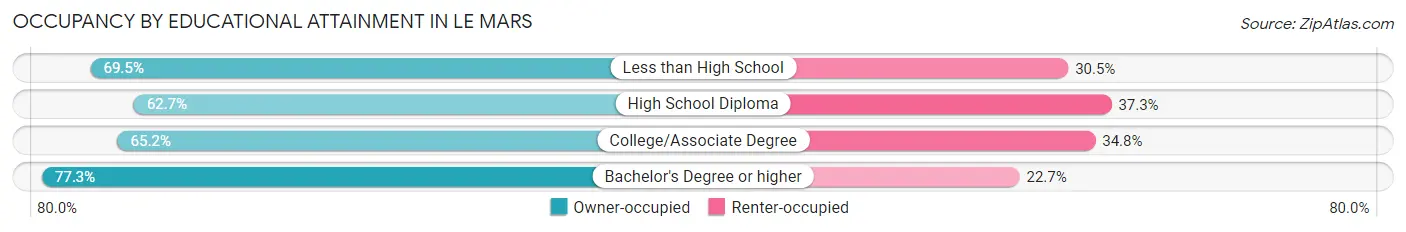
| Household Size | Owner-occupied | Renter-occupied |
| Less than High School | 105 (69.5%) | 46 (30.5%) |
| High School Diploma | 808 (62.7%) | 481 (37.3%) |
| College/Associate Degree | 1,083 (65.2%) | 577 (34.8%) |
| Bachelor's Degree or higher | 924 (77.3%) | 272 (22.7%) |
Occupancy by Age of Householder in Le Mars
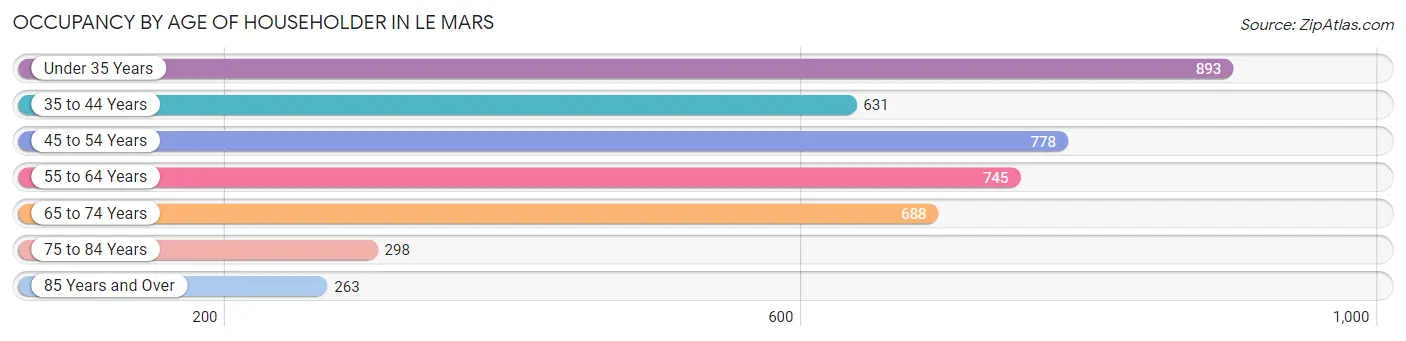
| Age Bracket | # Households | % Households |
| Under 35 Years | 893 | 20.8% |
| 35 to 44 Years | 631 | 14.7% |
| 45 to 54 Years | 778 | 18.1% |
| 55 to 64 Years | 745 | 17.3% |
| 65 to 74 Years | 688 | 16.0% |
| 75 to 84 Years | 298 | 6.9% |
| 85 Years and Over | 263 | 6.1% |
| Total | 4,296 | 100.0% |
Housing Finances in Le Mars
Median Income by Occupancy in Le Mars
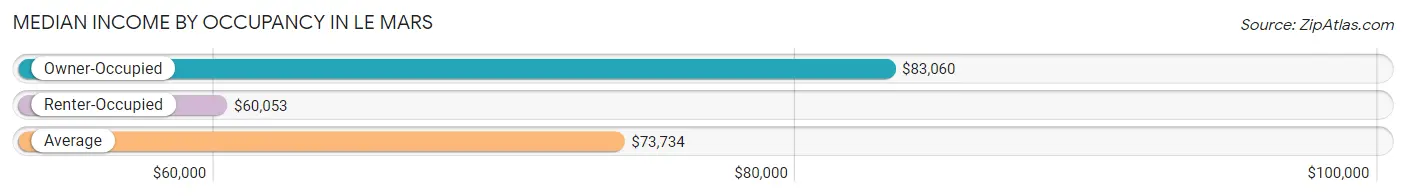
| Occupancy Type | # Households | Median Income |
| Owner-Occupied | 2,920 (68.0%) | $83,060 |
| Renter-Occupied | 1,376 (32.0%) | $60,053 |
| Average | 4,296 (100.0%) | $73,734 |
Occupancy by Householder Income Bracket in Le Mars
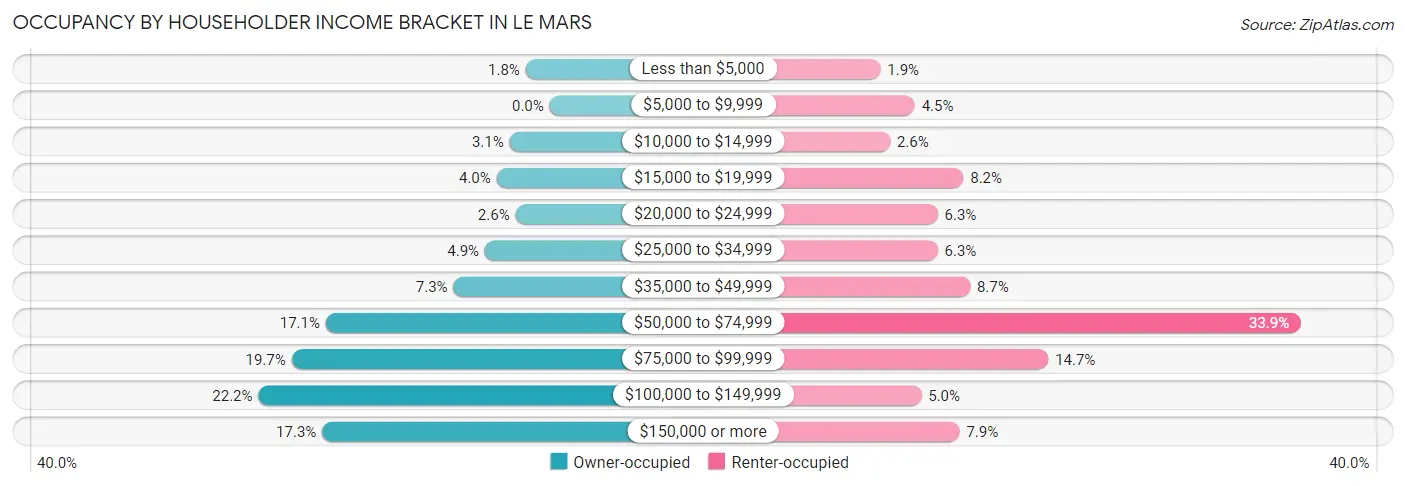
| Income Bracket | Owner-occupied | Renter-occupied |
| Less than $5,000 | 53 (1.8%) | 26 (1.9%) |
| $5,000 to $9,999 | 0 (0.0%) | 62 (4.5%) |
| $10,000 to $14,999 | 89 (3.0%) | 36 (2.6%) |
| $15,000 to $19,999 | 118 (4.0%) | 113 (8.2%) |
| $20,000 to $24,999 | 76 (2.6%) | 86 (6.2%) |
| $25,000 to $34,999 | 144 (4.9%) | 86 (6.2%) |
| $35,000 to $49,999 | 214 (7.3%) | 120 (8.7%) |
| $50,000 to $74,999 | 498 (17.1%) | 467 (33.9%) |
| $75,000 to $99,999 | 574 (19.7%) | 202 (14.7%) |
| $100,000 to $149,999 | 648 (22.2%) | 69 (5.0%) |
| $150,000 or more | 506 (17.3%) | 109 (7.9%) |
| Total | 2,920 (100.0%) | 1,376 (100.0%) |
Monthly Housing Cost Tiers in Le Mars
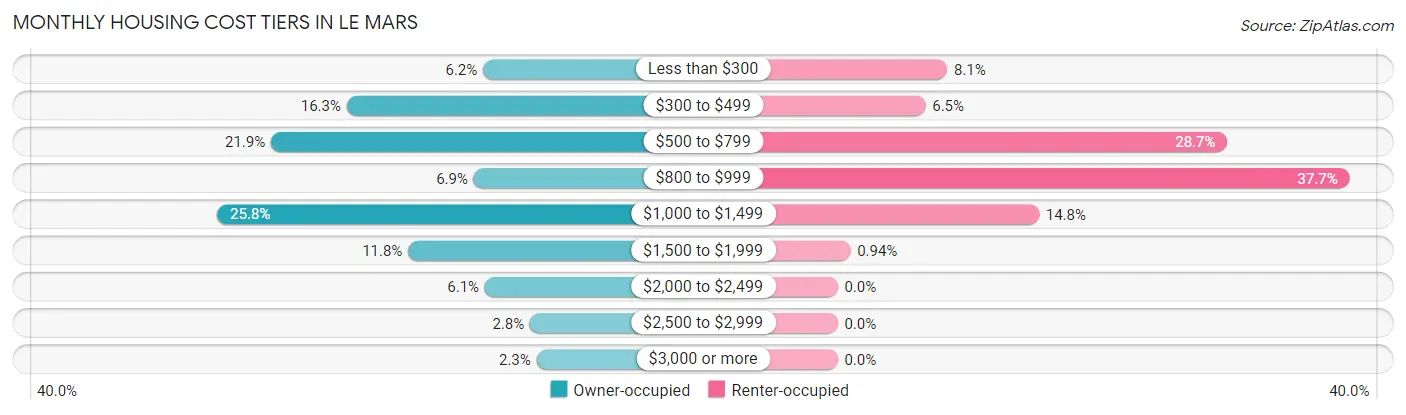
| Monthly Cost | Owner-occupied | Renter-occupied |
| Less than $300 | 182 (6.2%) | 111 (8.1%) |
| $300 to $499 | 475 (16.3%) | 89 (6.5%) |
| $500 to $799 | 638 (21.8%) | 395 (28.7%) |
| $800 to $999 | 202 (6.9%) | 519 (37.7%) |
| $1,000 to $1,499 | 754 (25.8%) | 204 (14.8%) |
| $1,500 to $1,999 | 343 (11.7%) | 13 (0.9%) |
| $2,000 to $2,499 | 178 (6.1%) | 0 (0.0%) |
| $2,500 to $2,999 | 81 (2.8%) | 0 (0.0%) |
| $3,000 or more | 67 (2.3%) | 0 (0.0%) |
| Total | 2,920 (100.0%) | 1,376 (100.0%) |
Physical Housing Characteristics in Le Mars
Housing Structures in Le Mars
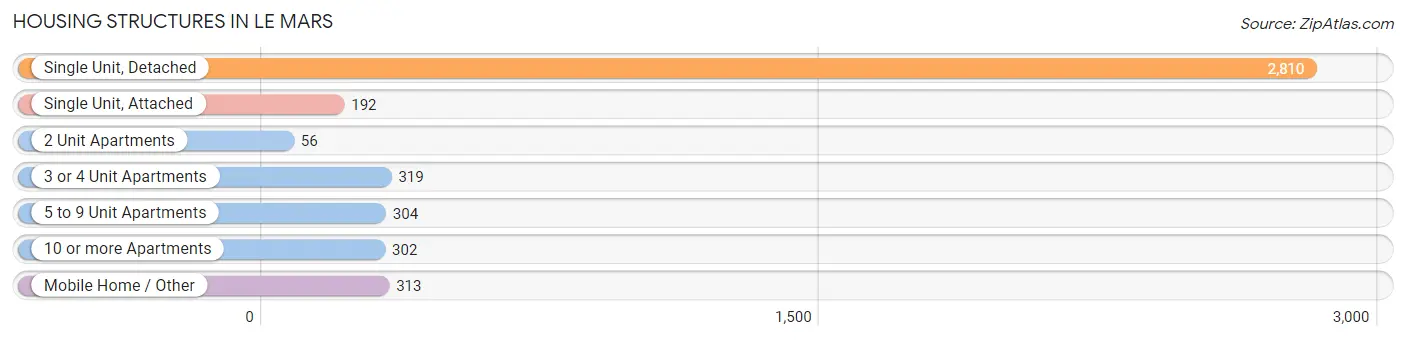
| Structure Type | # Housing Units | % Housing Units |
| Single Unit, Detached | 2,810 | 65.4% |
| Single Unit, Attached | 192 | 4.5% |
| 2 Unit Apartments | 56 | 1.3% |
| 3 or 4 Unit Apartments | 319 | 7.4% |
| 5 to 9 Unit Apartments | 304 | 7.1% |
| 10 or more Apartments | 302 | 7.0% |
| Mobile Home / Other | 313 | 7.3% |
| Total | 4,296 | 100.0% |
Housing Structures by Occupancy in Le Mars
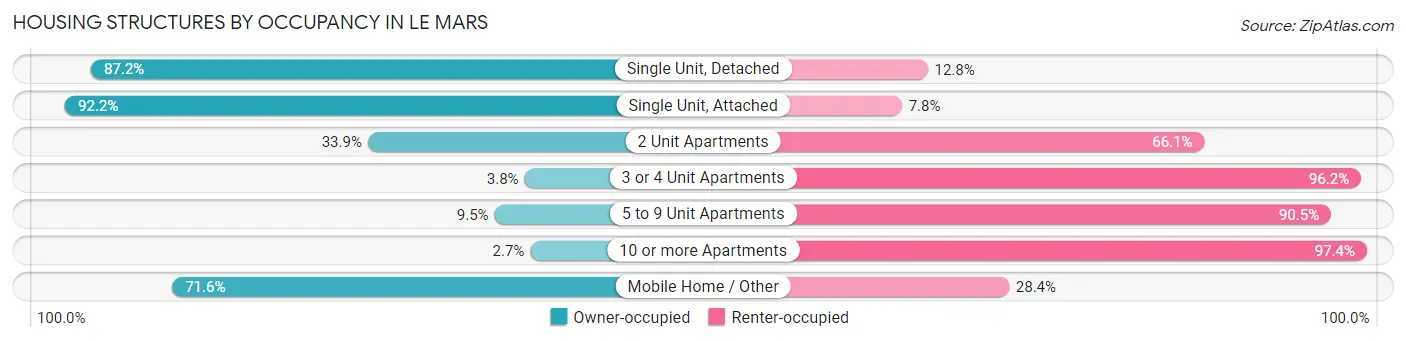
| Structure Type | Owner-occupied | Renter-occupied |
| Single Unit, Detached | 2,451 (87.2%) | 359 (12.8%) |
| Single Unit, Attached | 177 (92.2%) | 15 (7.8%) |
| 2 Unit Apartments | 19 (33.9%) | 37 (66.1%) |
| 3 or 4 Unit Apartments | 12 (3.8%) | 307 (96.2%) |
| 5 to 9 Unit Apartments | 29 (9.5%) | 275 (90.5%) |
| 10 or more Apartments | 8 (2.6%) | 294 (97.4%) |
| Mobile Home / Other | 224 (71.6%) | 89 (28.4%) |
| Total | 2,920 (68.0%) | 1,376 (32.0%) |
Housing Structures by Number of Rooms in Le Mars
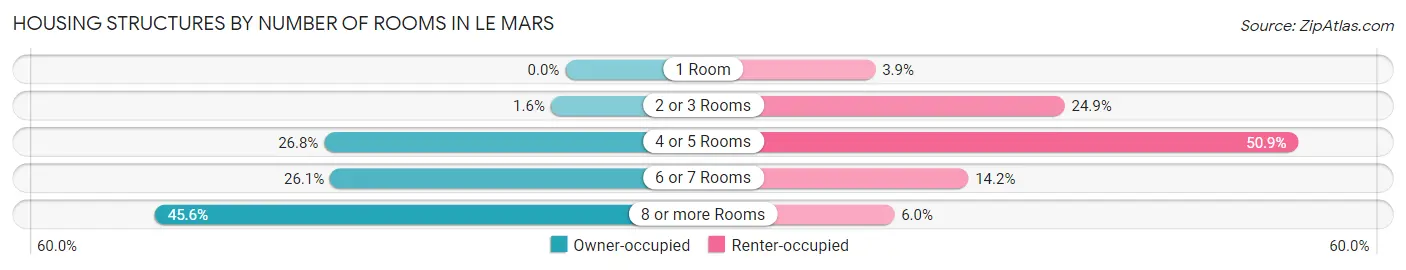
| Number of Rooms | Owner-occupied | Renter-occupied |
| 1 Room | 0 (0.0%) | 54 (3.9%) |
| 2 or 3 Rooms | 47 (1.6%) | 343 (24.9%) |
| 4 or 5 Rooms | 781 (26.8%) | 700 (50.9%) |
| 6 or 7 Rooms | 762 (26.1%) | 196 (14.2%) |
| 8 or more Rooms | 1,330 (45.6%) | 83 (6.0%) |
| Total | 2,920 (100.0%) | 1,376 (100.0%) |
Housing Structure by Heating Type in Le Mars
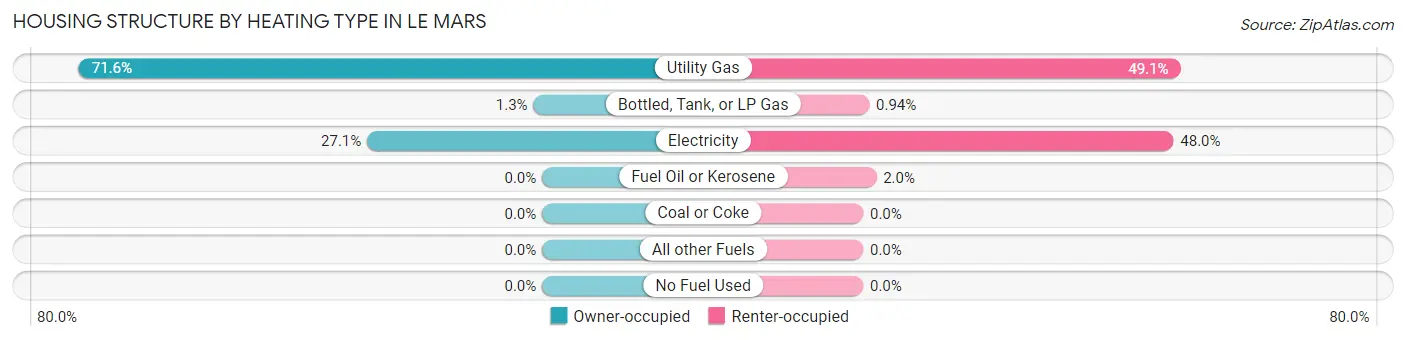
| Heating Type | Owner-occupied | Renter-occupied |
| Utility Gas | 2,091 (71.6%) | 675 (49.1%) |
| Bottled, Tank, or LP Gas | 39 (1.3%) | 13 (0.9%) |
| Electricity | 790 (27.1%) | 660 (48.0%) |
| Fuel Oil or Kerosene | 0 (0.0%) | 28 (2.0%) |
| Coal or Coke | 0 (0.0%) | 0 (0.0%) |
| All other Fuels | 0 (0.0%) | 0 (0.0%) |
| No Fuel Used | 0 (0.0%) | 0 (0.0%) |
| Total | 2,920 (100.0%) | 1,376 (100.0%) |
Household Vehicle Usage in Le Mars
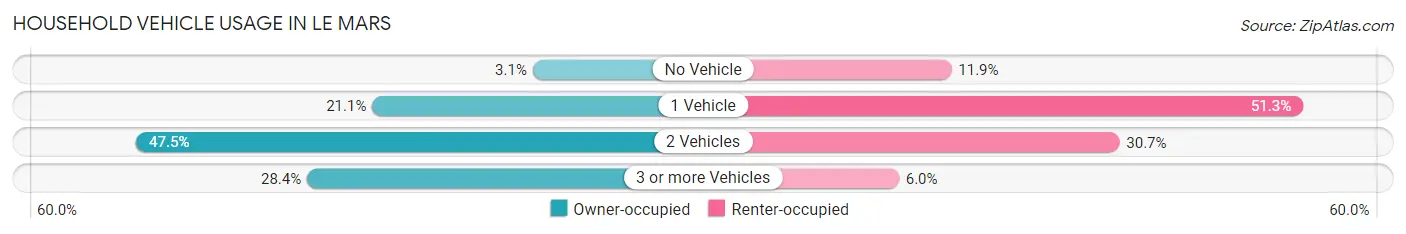
| Vehicles per Household | Owner-occupied | Renter-occupied |
| No Vehicle | 90 (3.1%) | 164 (11.9%) |
| 1 Vehicle | 615 (21.1%) | 706 (51.3%) |
| 2 Vehicles | 1,387 (47.5%) | 423 (30.7%) |
| 3 or more Vehicles | 828 (28.4%) | 83 (6.0%) |
| Total | 2,920 (100.0%) | 1,376 (100.0%) |
Real Estate & Mortgages in Le Mars
Real Estate and Mortgage Overview in Le Mars
| Characteristic | Without Mortgage | With Mortgage |
| Housing Units | 1,256 | 1,664 |
| Median Property Value | $163,100 | $201,100 |
| Median Household Income | $67,132 | $444 |
| Monthly Housing Costs | $495 | $53 |
| Real Estate Taxes | $1,965 | $0 |
Property Value by Mortgage Status in Le Mars
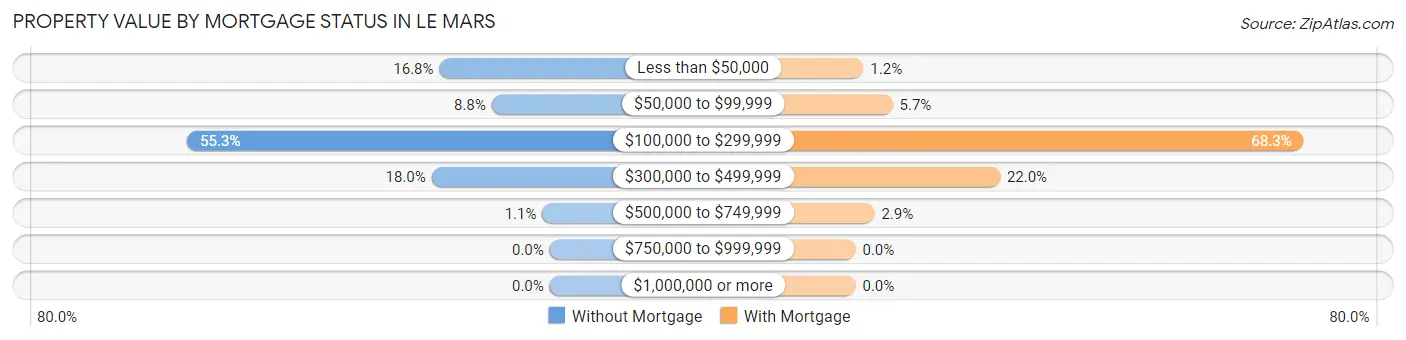
| Property Value | Without Mortgage | With Mortgage |
| Less than $50,000 | 211 (16.8%) | 20 (1.2%) |
| $50,000 to $99,999 | 111 (8.8%) | 94 (5.7%) |
| $100,000 to $299,999 | 694 (55.2%) | 1,136 (68.3%) |
| $300,000 to $499,999 | 226 (18.0%) | 366 (22.0%) |
| $500,000 to $749,999 | 14 (1.1%) | 48 (2.9%) |
| $750,000 to $999,999 | 0 (0.0%) | 0 (0.0%) |
| $1,000,000 or more | 0 (0.0%) | 0 (0.0%) |
| Total | 1,256 (100.0%) | 1,664 (100.0%) |
Household Income by Mortgage Status in Le Mars
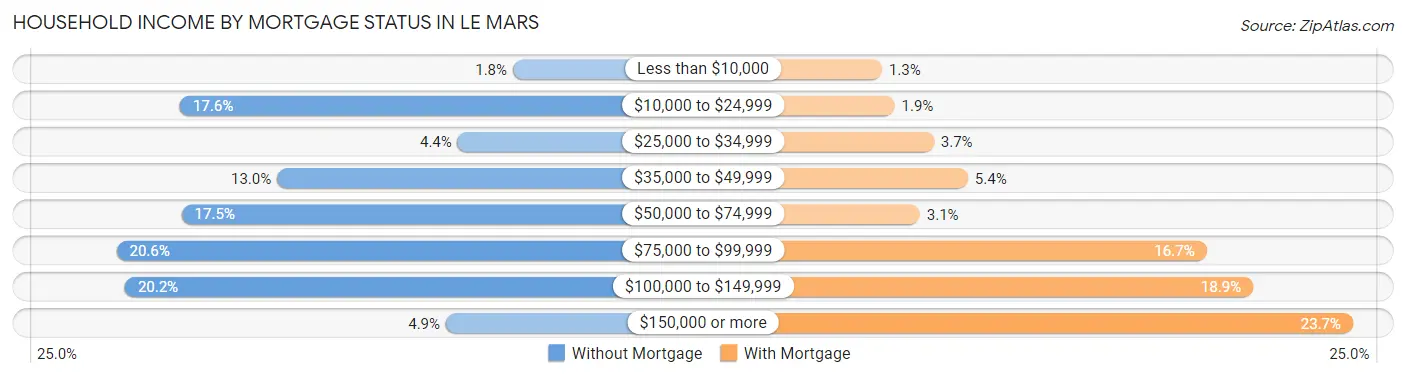
| Household Income | Without Mortgage | With Mortgage |
| Less than $10,000 | 22 (1.8%) | 21 (1.3%) |
| $10,000 to $24,999 | 221 (17.6%) | 31 (1.9%) |
| $25,000 to $34,999 | 55 (4.4%) | 62 (3.7%) |
| $35,000 to $49,999 | 163 (13.0%) | 89 (5.3%) |
| $50,000 to $74,999 | 220 (17.5%) | 51 (3.1%) |
| $75,000 to $99,999 | 259 (20.6%) | 278 (16.7%) |
| $100,000 to $149,999 | 254 (20.2%) | 315 (18.9%) |
| $150,000 or more | 62 (4.9%) | 394 (23.7%) |
| Total | 1,256 (100.0%) | 1,664 (100.0%) |
Property Value to Household Income Ratio in Le Mars
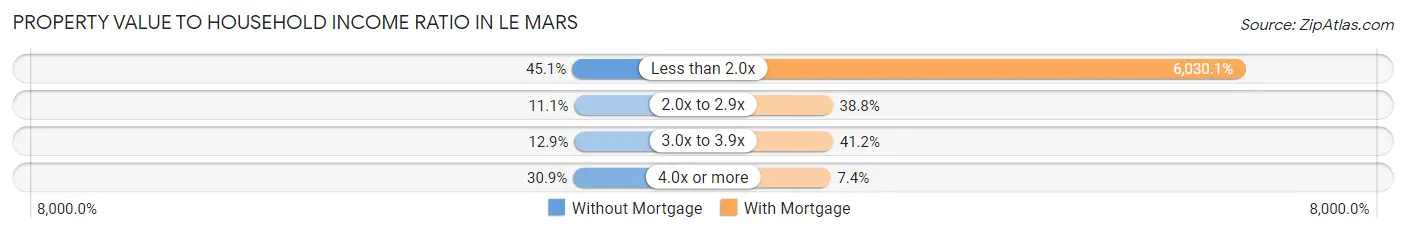
| Value-to-Income Ratio | Without Mortgage | With Mortgage |
| Less than 2.0x | 567 (45.1%) | 100,341 (6,030.1%) |
| 2.0x to 2.9x | 139 (11.1%) | 646 (38.8%) |
| 3.0x to 3.9x | 162 (12.9%) | 685 (41.2%) |
| 4.0x or more | 388 (30.9%) | 123 (7.4%) |
| Total | 1,256 (100.0%) | 1,664 (100.0%) |
Real Estate Taxes by Mortgage Status in Le Mars
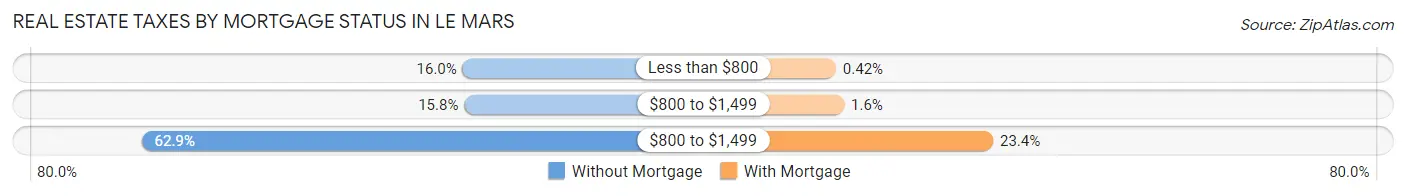
| Property Taxes | Without Mortgage | With Mortgage |
| Less than $800 | 201 (16.0%) | 7 (0.4%) |
| $800 to $1,499 | 198 (15.8%) | 27 (1.6%) |
| $800 to $1,499 | 790 (62.9%) | 389 (23.4%) |
| Total | 1,256 (100.0%) | 1,664 (100.0%) |
Health & Disability in Le Mars
Health Insurance Coverage by Age in Le Mars
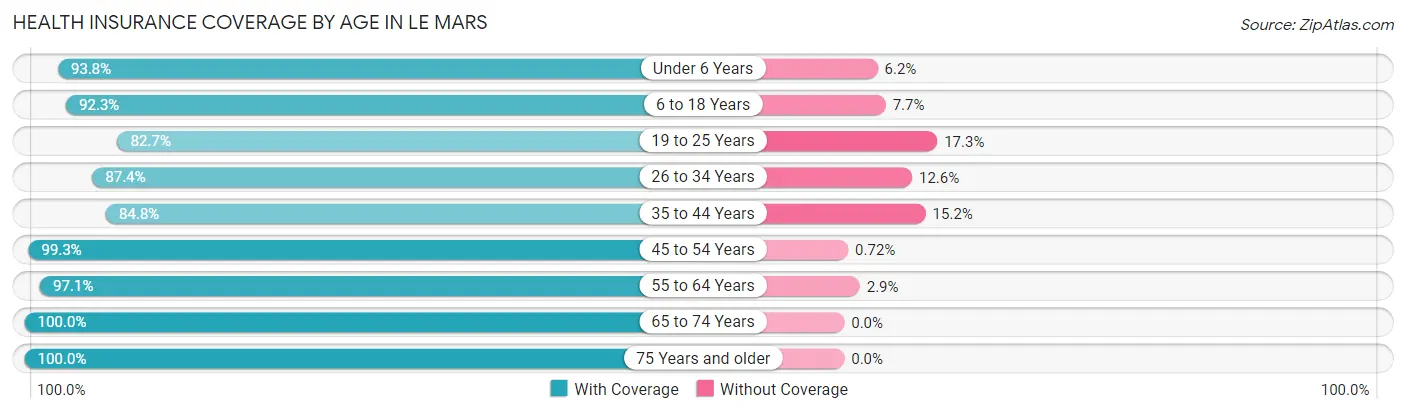
| Age Bracket | With Coverage | Without Coverage |
| Under 6 Years | 951 (93.8%) | 63 (6.2%) |
| 6 to 18 Years | 1,746 (92.3%) | 146 (7.7%) |
| 19 to 25 Years | 744 (82.7%) | 156 (17.3%) |
| 26 to 34 Years | 885 (87.4%) | 128 (12.6%) |
| 35 to 44 Years | 1,001 (84.8%) | 179 (15.2%) |
| 45 to 54 Years | 1,373 (99.3%) | 10 (0.7%) |
| 55 to 64 Years | 1,178 (97.1%) | 35 (2.9%) |
| 65 to 74 Years | 1,016 (100.0%) | 0 (0.0%) |
| 75 Years and older | 797 (100.0%) | 0 (0.0%) |
| Total | 9,691 (93.1%) | 717 (6.9%) |
Health Insurance Coverage by Citizenship Status in Le Mars
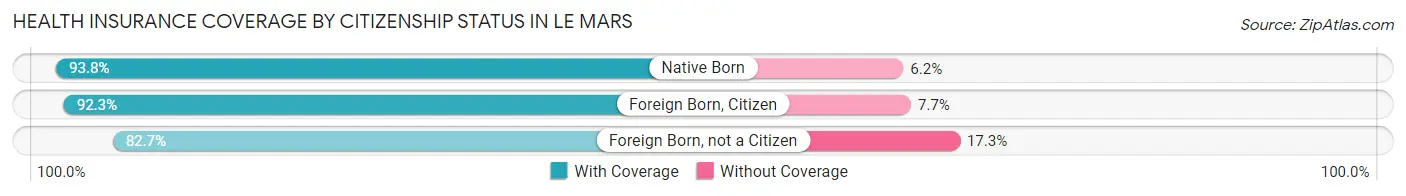
| Citizenship Status | With Coverage | Without Coverage |
| Native Born | 951 (93.8%) | 63 (6.2%) |
| Foreign Born, Citizen | 1,746 (92.3%) | 146 (7.7%) |
| Foreign Born, not a Citizen | 744 (82.7%) | 156 (17.3%) |
Health Insurance Coverage by Household Income in Le Mars
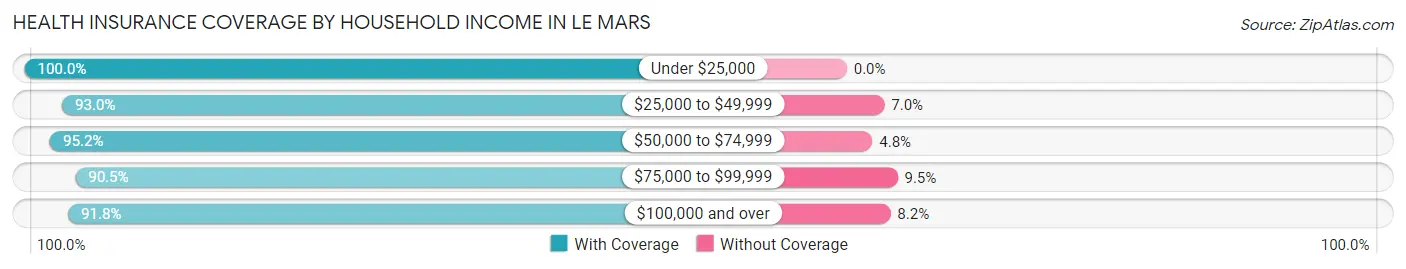
| Household Income | With Coverage | Without Coverage |
| Under $25,000 | 901 (100.0%) | 0 (0.0%) |
| $25,000 to $49,999 | 925 (93.0%) | 70 (7.0%) |
| $50,000 to $74,999 | 1,927 (95.2%) | 97 (4.8%) |
| $75,000 to $99,999 | 1,712 (90.5%) | 180 (9.5%) |
| $100,000 and over | 4,161 (91.8%) | 370 (8.2%) |
Public vs Private Health Insurance Coverage by Age in Le Mars
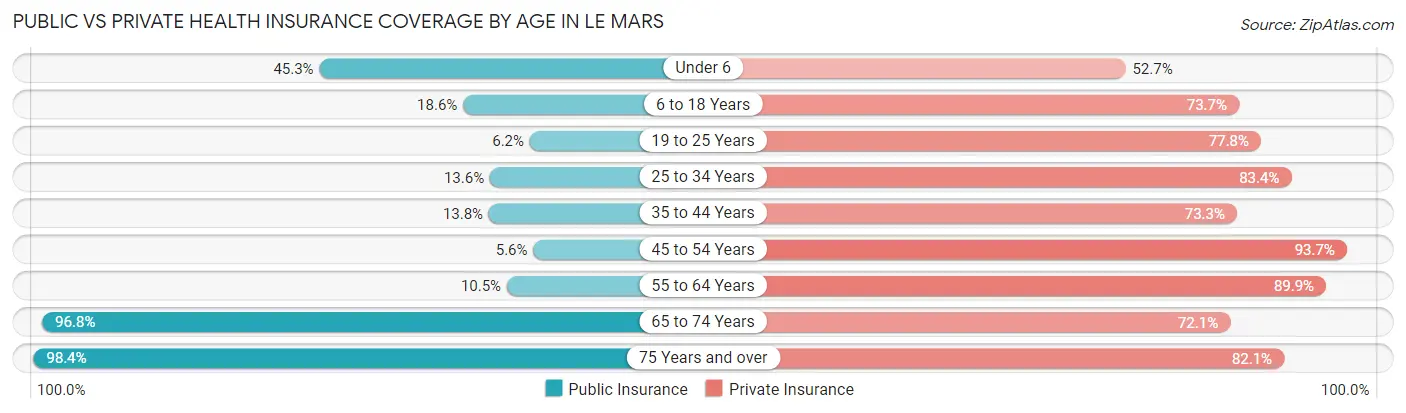
| Age Bracket | Public Insurance | Private Insurance |
| Under 6 | 459 (45.3%) | 534 (52.7%) |
| 6 to 18 Years | 352 (18.6%) | 1,394 (73.7%) |
| 19 to 25 Years | 56 (6.2%) | 700 (77.8%) |
| 25 to 34 Years | 138 (13.6%) | 845 (83.4%) |
| 35 to 44 Years | 163 (13.8%) | 865 (73.3%) |
| 45 to 54 Years | 77 (5.6%) | 1,296 (93.7%) |
| 55 to 64 Years | 127 (10.5%) | 1,090 (89.9%) |
| 65 to 74 Years | 983 (96.8%) | 732 (72.1%) |
| 75 Years and over | 784 (98.4%) | 654 (82.1%) |
| Total | 3,139 (30.2%) | 8,110 (77.9%) |
Disability Status by Sex by Age in Le Mars
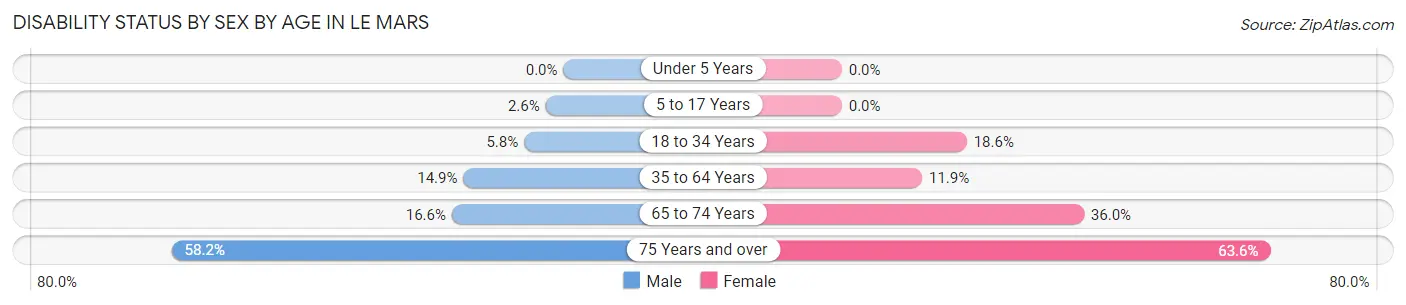
| Age Bracket | Male | Female |
| Under 5 Years | 0 (0.0%) | 0 (0.0%) |
| 5 to 17 Years | 30 (2.6%) | 0 (0.0%) |
| 18 to 34 Years | 62 (5.8%) | 189 (18.5%) |
| 35 to 64 Years | 283 (14.9%) | 223 (11.9%) |
| 65 to 74 Years | 84 (16.6%) | 183 (35.9%) |
| 75 Years and over | 171 (58.2%) | 320 (63.6%) |
Disability Class by Sex by Age in Le Mars
Disability Class: Hearing Difficulty
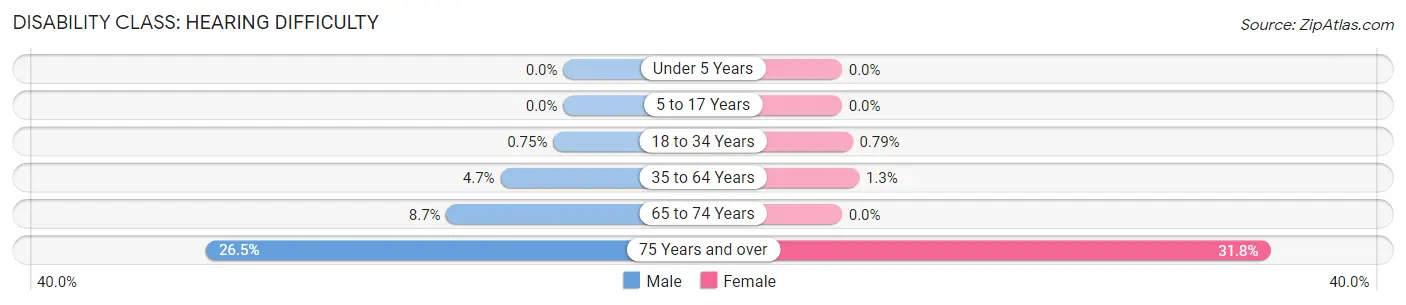
| Age Bracket | Male | Female |
| Under 5 Years | 0 (0.0%) | 0 (0.0%) |
| 5 to 17 Years | 0 (0.0%) | 0 (0.0%) |
| 18 to 34 Years | 8 (0.7%) | 8 (0.8%) |
| 35 to 64 Years | 89 (4.7%) | 24 (1.3%) |
| 65 to 74 Years | 44 (8.7%) | 0 (0.0%) |
| 75 Years and over | 78 (26.5%) | 160 (31.8%) |
Disability Class: Vision Difficulty
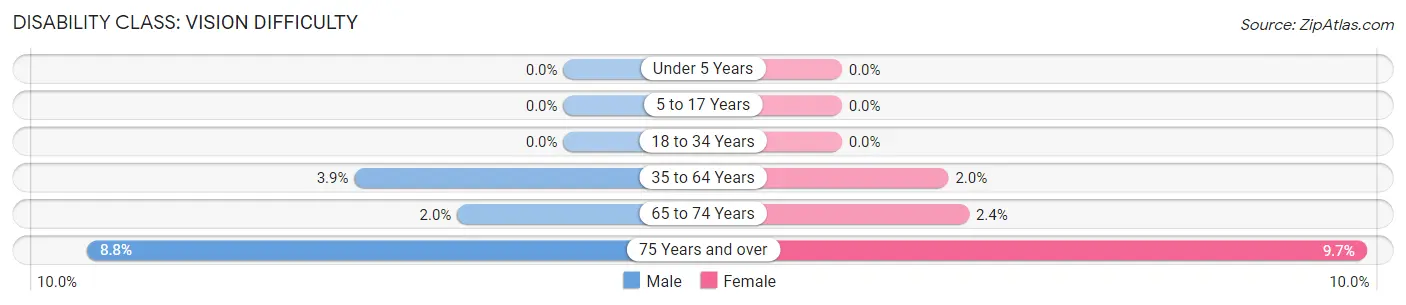
| Age Bracket | Male | Female |
| Under 5 Years | 0 (0.0%) | 0 (0.0%) |
| 5 to 17 Years | 0 (0.0%) | 0 (0.0%) |
| 18 to 34 Years | 0 (0.0%) | 0 (0.0%) |
| 35 to 64 Years | 74 (3.9%) | 37 (2.0%) |
| 65 to 74 Years | 10 (2.0%) | 12 (2.4%) |
| 75 Years and over | 26 (8.8%) | 49 (9.7%) |
Disability Class: Cognitive Difficulty
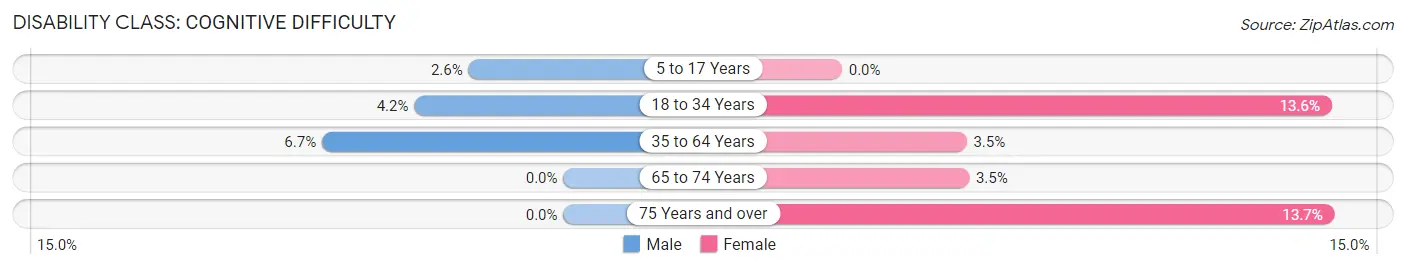
| Age Bracket | Male | Female |
| 5 to 17 Years | 30 (2.6%) | 0 (0.0%) |
| 18 to 34 Years | 44 (4.2%) | 139 (13.6%) |
| 35 to 64 Years | 128 (6.7%) | 65 (3.5%) |
| 65 to 74 Years | 0 (0.0%) | 18 (3.5%) |
| 75 Years and over | 0 (0.0%) | 69 (13.7%) |
Disability Class: Ambulatory Difficulty
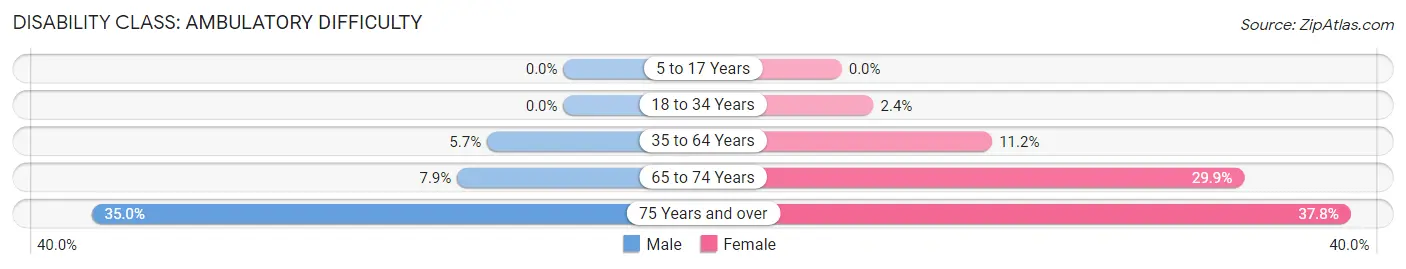
| Age Bracket | Male | Female |
| 5 to 17 Years | 0 (0.0%) | 0 (0.0%) |
| 18 to 34 Years | 0 (0.0%) | 24 (2.4%) |
| 35 to 64 Years | 108 (5.7%) | 209 (11.2%) |
| 65 to 74 Years | 40 (7.9%) | 152 (29.9%) |
| 75 Years and over | 103 (35.0%) | 190 (37.8%) |
Disability Class: Self-Care Difficulty
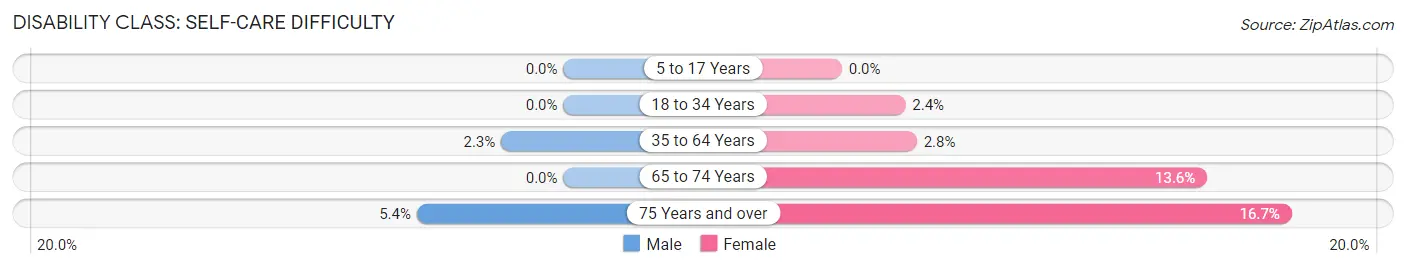
| Age Bracket | Male | Female |
| 5 to 17 Years | 0 (0.0%) | 0 (0.0%) |
| 18 to 34 Years | 0 (0.0%) | 24 (2.4%) |
| 35 to 64 Years | 44 (2.3%) | 52 (2.8%) |
| 65 to 74 Years | 0 (0.0%) | 69 (13.6%) |
| 75 Years and over | 16 (5.4%) | 84 (16.7%) |
Technology Access in Le Mars
Computing Device Access in Le Mars
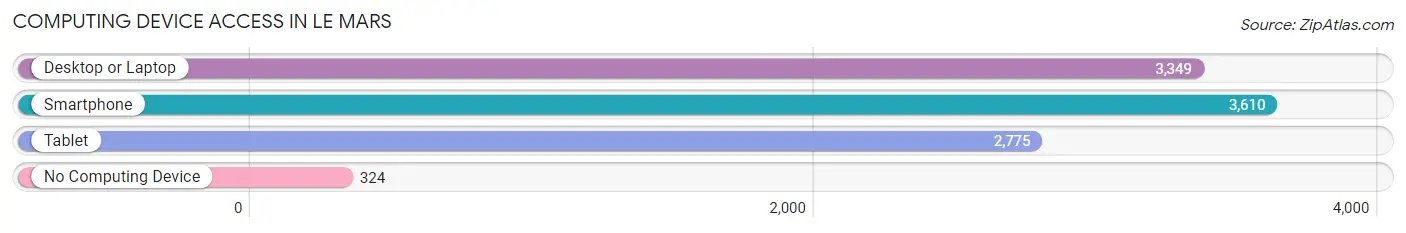
| Device Type | # Households | % Households |
| Desktop or Laptop | 3,349 | 78.0% |
| Smartphone | 3,610 | 84.0% |
| Tablet | 2,775 | 64.6% |
| No Computing Device | 324 | 7.5% |
| Total | 4,296 | 100.0% |
Internet Access in Le Mars
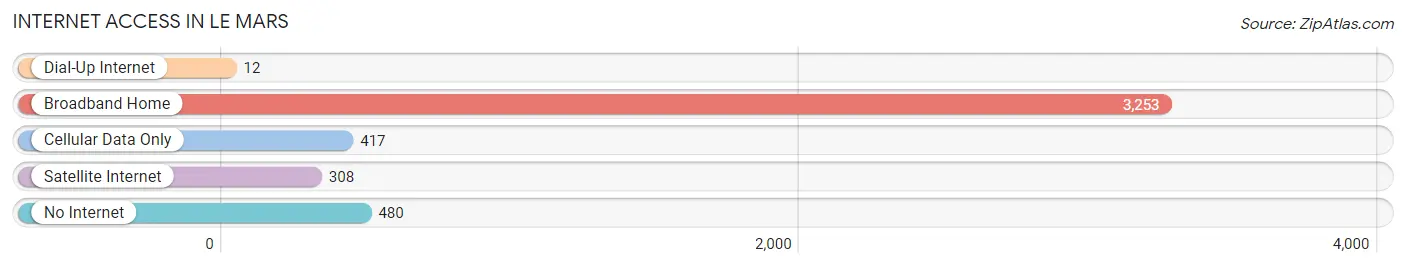
| Internet Type | # Households | % Households |
| Dial-Up Internet | 12 | 0.3% |
| Broadband Home | 3,253 | 75.7% |
| Cellular Data Only | 417 | 9.7% |
| Satellite Internet | 308 | 7.2% |
| No Internet | 480 | 11.2% |
| Total | 4,296 | 100.0% |
Le Mars Summary
Mars, Iowa is a city located in Plymouth County in the northwest corner of the state. It is the county seat and the largest city in the county. The city was founded in 1873 and incorporated in 1876. As of the 2010 census, the population was 10,047.
Geography
Mars is located at 42°45'45" North, 96°7'45" West (42.7625, -96.1292). According to the United States Census Bureau, the city has a total area of 5.2 square miles (13.4 km2), all of it land.
The city is located on the Floyd River, which is a tributary of the Big Sioux River. The city is located in the Loess Hills region of Iowa, which is characterized by rolling hills and deep ravines.
History
The area that is now Mars was first settled in the late 1860s. The city was founded in 1873 and incorporated in 1876. The city was named after the Roman god of war, Mars.
The city was an important stop on the Chicago and Northwestern Railroad, which connected the city to Sioux City and Omaha. The railroad was a major factor in the growth of the city.
The city was also an important center for the agricultural industry. The city was home to several grain elevators and a livestock market.
Economy
Mars is a small city with a diversified economy. The city is home to several manufacturing companies, including a plastics manufacturer, a metal fabrication company, and a food processing plant. The city is also home to several retail stores, restaurants, and other businesses.
The city is also home to several educational institutions, including a community college, a technical college, and a private college.
Demographics
As of the 2010 census, the population of Mars was 10,047. The racial makeup of the city was 95.2% White, 0.7% African American, 0.3% Native American, 0.7% Asian, 0.1% Pacific Islander, 1.7% from other races, and 1.2% from two or more races. Hispanic or Latino of any race were 3.3% of the population.
The median income for a household in the city was $45,945, and the median income for a family was $54,945. The per capita income for the city was $21,945. About 6.2% of families and 8.3% of the population were below the poverty line, including 10.2% of those under age 18 and 6.2% of those age 65 or over.
Conclusion
Mars, Iowa is a small city located in Plymouth County in the northwest corner of the state. The city was founded in 1873 and incorporated in 1876. As of the 2010 census, the population was 10,047. The city is located on the Floyd River and is home to several manufacturing companies, educational institutions, and other businesses. The median income for a household in the city was $45,945, and the median income for a family was $54,945. The per capita income for the city was $21,945. About 6.2% of families and 8.3% of the population were below the poverty line. Mars is a small city with a diversified economy and a rich history.
Common Questions
What is Per Capita Income in Le Mars?
Per Capita income in Le Mars is $37,266.
What is the Median Family Income in Le Mars?
Median Family Income in Le Mars is $85,802.
What is the Median Household income in Le Mars?
Median Household Income in Le Mars is $73,734.
What is Income or Wage Gap in Le Mars?
Income or Wage Gap in Le Mars is 21.7%.
Women in Le Mars earn 78.3 cents for every dollar earned by a man.
What is Family Income Deficit in Le Mars?
Family Income Deficit in Le Mars is $6,415.
Families that are below poverty line in Le Mars earn $6,415 less on average than the poverty threshold level.
What is Inequality or Gini Index in Le Mars?
Inequality or Gini Index in Le Mars is 0.40.
What is the Total Population of Le Mars?
Total Population of Le Mars is 10,549.
What is the Total Male Population of Le Mars?
Total Male Population of Le Mars is 5,241.
What is the Total Female Population of Le Mars?
Total Female Population of Le Mars is 5,308.
What is the Ratio of Males per 100 Females in Le Mars?
There are 98.74 Males per 100 Females in Le Mars.
What is the Ratio of Females per 100 Males in Le Mars?
There are 101.28 Females per 100 Males in Le Mars.
What is the Median Population Age in Le Mars?
Median Population Age in Le Mars is 39.3 Years.
What is the Average Family Size in Le Mars
Average Family Size in Le Mars is 3.0 People.
What is the Average Household Size in Le Mars
Average Household Size in Le Mars is 2.4 People.
How Large is the Labor Force in Le Mars?
There are 5,673 People in the Labor Forcein in Le Mars.
What is the Percentage of People in the Labor Force in Le Mars?
69.8% of People are in the Labor Force in Le Mars.
What is the Unemployment Rate in Le Mars?
Unemployment Rate in Le Mars is 2.7%.